vocational education in the united states: toward the year
TRANSCRIPT

NATIONAL CENTER FOR EDUCATION STATISTICS
February 2000
Vocational Education in the UnitedStates: Toward the Year 2000
Karen LevesqueDoug LauenPeter TeitelbaumMartha AltSally LibreraMPR Associates, Inc.
Dawn NelsonProject OfficerNational Center for Education Statistics
U.S. Department of EducationOffice of Educational Research and Improvement NCES 2000–029

U.S. Department of EducationRichard W. RileySecretary
Office of Educational Research and ImprovementC. Kent McGuireAssistant Secretary
National Center for Education StatisticsGary W. PhillipsActing Commissioner
The National Center for Education Statistics (NCES) is the primary federal entity for collecting, analyzing,and reporting data related to education in the United States and other nations. It fulfills a congressionalmandate to collect, collate, analyze, and report full and complete statistics on the condition of education inthe United States; conduct and publish reports and specialized analyses of the meaning and significanceof such statistics; assist state and local education agencies in improving their statistical systems; andreview and report on education activities in foreign countries.
NCES activities are designed to address high priority education data needs; provide consistent, reliable,complete, and accurate indicators of education status and trends; and report timely, useful, and highquality data to the U.S. Department of Education, the Congress, the states, other education policymakers,practitioners, data users, and the general public.
We strive to make our products available in a variety of formats and in language that is appropriate to avariety of audiences. You, as our customer, are the best judge of our success in communicatinginformation effectively. If you have any comments or suggestions about this or any other NCES product orreport, we would like to hear from you. Please direct your comments to:
National Center for Education StatisticsOffice of Educational Research and ImprovementU.S. Department of Education555 New Jersey Avenue, NWWashington, DC 20208–5574
February 2000
The NCES World Wide Web Home Page address ishttp://nces.ed.gov/pubsearch/index.asp
Suggested Citation
U.S. Department of Education. National Center for Education Statistics. Vocational Education in the UnitedStates: Toward the Year 2000, NCES 2000–029, by Karen Levesque, Doug Lauen, Peter Teitelbaum,Martha Alt, and Sally Librera. Project Officer: Dawn Nelson. Washington, D.C.: 2000.
For ordering information on this report, write:U.S. Department of EducationED PubsP.O. Box 1398Jessup, MD 20794–1398Or call toll free: 1-877-4ED-Pubs.
Content Contact:Dawn Nelson(202) 219–1740

iii
Executive Summary
I. INTRODUCTION
With the advent of the 21st century, vocational education in the United States is in transi-
tion. Historically, the purpose of vocational education has been to prepare students for entry-level
jobs in occupations requiring less than a baccalaureate degree. Over the last 15 years, however,
this purpose has shifted toward broader preparation that develops the academic, vocational, and
technical skills of students in vocational education programs. This preparation involves integrat-
ing academic and vocational education, emphasizing all aspects of an industry, and implementing
academic performance measures, among other reform efforts. Vocational education policy now
also encourages high school students to continue their studies at the postsecondary level, and 2-
year postsecondary students to pursue 4-year credentials through various articulation or “tech-
prep” arrangements. The traditional focus of vocational education is giving way to a broader pur-
pose—one that includes greater emphasis on academic preparation and provides a wider range of
career choices.
Vocational Education in the United States: Toward the Year 2000 attempts to capture this
evolving enterprise. In addition to describing trends in participation in secondary and postsecon-
dary vocational education, the report also presents findings about the academic preparation of
high school students who participate in vocational education, relevant school reform efforts, and
transitions after high school. However, the surveys available for assessing the status of vocational
education were generally designed to capture more traditional conceptions of the enterprise and
often do not provide information on the most current reform efforts. Nevertheless, the available
data do signal that change is occurring in the directions advocated by reform efforts, although
such change is often small and preliminary. The report also describes economic and labor market
trends and their implications for vocational programs, as well as changing workplace practices
and employer perspectives on worker skills and proficiency. The most important findings pre-
sented in the report are highlighted below.

Executive Summary
iv
II. THE CONTEXT
Economic Trends (page 15)
The United States is shifting from a manufacturing-based economy to one that over-
whelmingly provides services and information. These trends have two important implications for
vocational education programs. They signal an ongoing shift in the education and training fields
that are required of the U.S. work force as well as shifts in the levels of that education and train-
ing. Vocational programs that prepare students for manufacturing jobs include trade and industry
programs, such as construction, mechanics and repair, precision production, and transportation
and material moving. Vocational programs that prepare students for jobs in the services and in-
formation industries include health care and technology and communications, among others.
Changing Education and Skill Requirements (page 24)
Generally, the research literature describes a trend toward greater education and training re-
quirements and a greater need for critical thinking, personal responsibility, and social skills
among work force participants. For example, recent projections anticipate that average growth
will be greater for occupations requiring at least an associate’s degree than for occupations re-
quiring less education. However, these trends are not uniform across industries and occupations,
and some disagree about their magnitude. Some emerging occupations require high education
and training requirements (such as a bachelor’s degree or moderate- to long-term on-the-job
training), while many jobs still demand relatively low education and training levels. In 1996, 39
percent of all jobs required no more than short-term on-the-job training.
Understanding these economic and labor market trends provides a context for analyzing
trends in vocational education. For example, if participation in vocational programs parallels
changes in the economy, one would expect to see a decline in enrollments in trade and industry
programs in recent years and an increase in enrollments in service- and information-related pro-
grams. Similarly, if vocational education reflects the labor market trend toward greater education
and training requirements, one would expect to find that the academic preparation of students
participating in vocational education has increased in recent years and that more of these partici-
pants are seeking and obtaining higher education and training credentials. These issues are ad-
dressed in sections IV–VI below.

Executive Summary
v
III. EMPLOYER PERSPECTIVES1
Workplace Practices (page 34)
Changes in the economy and in education are altering workplace practices, which have im-
plications for the skills required of employees. Increased global competition has spurred some
U.S. businesses to create “high-performance workplaces,” relying on flexible and decentralized
work practices and multi-skilled workers. These firms, however, are still in the minority. For ex-
ample, 20 percent of surveyed employers reported engaging in performance benchmarking in
1997, and 25 percent had undergone reengineering. Larger firms were more likely than smaller
firms to report these practices, indicating that the percentage of employees affected by these
practices may be greater than the percentage of employers reporting them.
Also, the 1994 School-to-Work Opportunities Act advocated employer involvement in
school-to-work partnerships and wider implementation of work-based learning, including job
shadowing, mentoring, internships, and apprenticeships. Once again, however, a minority of
firms reported participating in these activities. One-quarter of surveyed employers reported par-
ticipating in a school-to-work partnership, and 42 percent reported providing at least one formal
work-based learning activity. As above, larger firms were more likely than smaller firms to report
these different practices.
Perspectives on Employees (page 38)
While the general labor market trend may be toward higher education and training require-
ments, employers have a unique perspective, which is particularly important in the short term.
When hiring front-line workers from an established applicant pool, surveyed employers did not
rate years of completed schooling or academic performance as highly as attitude and communi-
cation skills. However, it may be that years of completed schooling and academic performance
are more important during initial applicant screening. It may also be that employers have histori-
cally found that schooling measures are not reliable indicators of what students know and can do.
With the evolving economy and changes in education and skill requirements, attention over
the last two decades has focused on whether employees are adequately prepared for the demands
of the workplace. According to most surveyed employers, the proficiency of their production
1The findings in this section come from the 1994 and 1997 National Employer Surveys, which gathered data from a randomsample of private firms with 20 or more employees.

Executive Summary
vi
workers either stayed the same or increased in recent years.2 In addition, the majority of employ-
ers with new production employees who participated in work-based learning reported that these em-
ployees were superior to comparable new hires in terms of productivity and attitude. Virtually no
employers reported that employees with work-based learning experience were inferior in these
two respects to comparable new hires.3
IV. TRENDS IN SECONDARY VOCATIONAL EDUCATION4
Participation in High School Vocational Education (page 49)
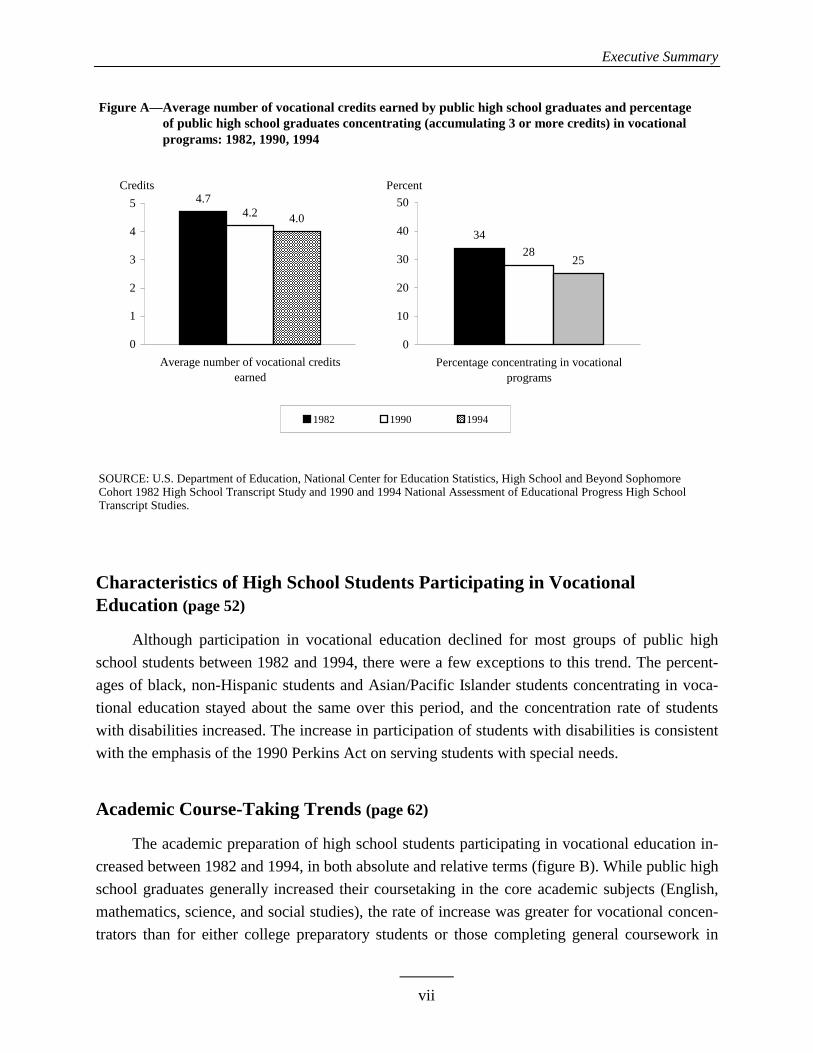
From 1982 to 1994, there was a general decline in the participation of high school students
in vocational education (figure A). The average number of vocational credits public high school
graduates earned decreased over the period studied, as did the percentage of graduates complet-
ing a sequence of related occupational courses.5
Trade and industry and business were the most popular occupational programs in 1994—
about 8 percent of public high school graduates concentrated in each of these areas. These were
also the most popular programs in earlier years. However, consistent with reported economic
trends, the percentage of graduates concentrating in trade and industry declined over the period
studied, as did the percentage of graduates concentrating in business. (In 1982, about 15 percent
of graduates had concentrated in trade and industry, and 12 percent in business.) Exhibiting an
opposite trend, the proportions of students concentrating in health care and in technology and
communications almost doubled between 1982 to 1994. Nevertheless, the percentages of high
school graduates concentrating in these program areas in 1994 were still quite small (about 1 per-
cent each).
2Employer-provided training, which also increased over this time period, may have contributed to proficiency gains. Alterna-tively, education reform efforts over the last decade may have contributed to the improvement in worker proficiency. In eithercase, it is impossible to establish a causal link from the available data.3However, in a rigorous evaluation of the benefits of work-based learning, it would be necessary to compare all work-basedlearning participants, not just those who were hired, with other comparable workers. It may be, for example, that those work-based learning participants who were hired had better recommendations or references than those who were not.4Unless otherwise noted, trends in this section come from an analysis of transcripts for public high school graduates in 1982,1990, and 1994. In addition to the topics described in this section, Chapter IV of the report also presents findings on academicachievement gains (page 62), work experience and work-based learning (page 87), technology literacy (page 90), and teacherprofessional development activities (page 101).5These decreases may be partly due to increases in high school graduation requirements implemented by many states after thepublication of A Nation at Risk in 1983. Because students have been required to take more academic coursework, they may haveelected to take fewer vocational courses. Alternatively, because of fiscal or economic pressures, or both, schools may have re-duced their vocational offerings in recent years.
Executive Summary
vii
Characteristics of High School Students Participating in VocationalEducation (page 52)
Although participation in vocational education declined for most groups of public high
school students between 1982 and 1994, there were a few exceptions to this trend. The percent-
ages of black, non-Hispanic students and Asian/Pacific Islander students concentrating in voca-
tional education stayed about the same over this period, and the concentration rate of students
with disabilities increased. The increase in participation of students with disabilities is consistent
with the emphasis of the 1990 Perkins Act on serving students with special needs.
Academic Course-Taking Trends (page 62)
The academic preparation of high school students participating in vocational education in-
creased between 1982 and 1994, in both absolute and relative terms (figure B). While public high
school graduates generally increased their coursetaking in the core academic subjects (English,
mathematics, science, and social studies), the rate of increase was greater for vocational concen-
trators than for either college preparatory students or those completing general coursework in
Figure A—Average number of vocational credits earned by public high school graduates and percentageFigure A—of public high school graduates concentrating (accumulating 3 or more credits) in vocational Figure A—programs: 1982, 1990, 1994
SOURCE: U.S. Department of Education, National Center for Education Statistics, High School and Beyond Sophomore Cohort 1982 High School Transcript Study and 1990 and 1994 National Assessment of Educational Progress High School Transcript Studies.
4.74.2 4.0
0
1
2
3
4
5
Average number of vocational creditsearned
1982 1990 1994
Credits
34
2825
0
10
20
30
40
50
Percentage concentrating in vocationalprograms
Percent

Executive Summary
viii
high school. Vocational concentrators also generally increased the rigor of their academic
coursework, particularly in mathematics, science, and social studies. However, in 1994, voca-
tional concentrators still completed fewer total credits in each of the core academic subjects than
did either college preparatory students or those completing general coursework in high school.
School Reform Efforts6 (page 81)
By 1997, some public comprehensive high schools had implemented vocational education-
related reforms, although the quality and specific forms of these efforts were not discernible from
the available survey data. About half of these schools reported integrating academic and voca-
tional education, and a similar proportion reported offering tech prep. Fewer schools reported
having block scheduling, career majors, school-based enterprises, skill standards, or skill or
6The findings in this section come from the National Longitudinal Study of Youth of 1997, which provides information on pub-lic schools with a 12th grade. Unfortunately, schools classified by their districts as primarily “vocational” were excluded from thesample. Consequently, the survey generally describes public comprehensive high schools and, therefore, may provide a conser-vative estimate of local reform efforts.
Figure B—Percentage of public high school graduates meeting the New Basics core academic standards,1
Figure B—by curriculum specialization in high school: 1982, 1990, and 1994
1The New Basics core academic standards include 4 years of English and 3 years each of mathematics, science, and socialstudies.2Includes students who completed both a vocational concentration and a college preparatory curriculum.
SOURCE: U.S. Department of Education, National Center for Education Statistics, High School and Beyond SophomoreCohort 1982 High School Transcript Study and 1990 and 1994 National Assessment of Educational Progress High School Transcript Studies.
65
510
84
1924
90
33 30
0
20
40
60
80
100
College preparatory only Vocational concentrators total Other/general
1982 1990 1994
Percent
2

Executive Summary
ix
occupational certificates. Generally, schools with career academies and larger schools were more
likely to report these reforms, while rural schools were less likely to do so.
Vocational Teacher Qualifications and Experience7 (page 93)
Vocational and academic high school teachers were similar in a number of ways: about the
same proportions held bachelor’s degrees, and similar percentages held either standard or ad-
vanced certification. However, about 8 percent of vocational teachers had less than a bachelor’s
degree, in comparison with less than 1 percent of academic teachers.8 Also, vocational teachers
were generally older than academic teachers, which may be due to the fact that vocational teach-
ers entered the teaching profession at an older age, possibly after obtaining industry experience.
There were some variations among vocational teachers who taught in different program areas and
school settings. For example, trade and industry and technical teachers and those teaching in
more than one vocational field were generally less likely than other vocational teachers to have a
bachelor’s or advanced degree.
V. TRANSITIONS AFTER HIGH SCHOOL9
The Transition to Postsecondary Education: 2 Years After High School(page 109)
The postsecondary enrollment rates of public high school graduates showed a marked in-
crease between 1982 and 1992. About half of those students graduating in 1982 enrolled in a
postsecondary institution within 2 years, while about three-fourths of the more recent graduating
class enrolled within 2 years. Between 1982 and 1992, postsecondary enrollment rates increased
for vocational concentrators and students completing general coursework in high school, but not
for college preparatory graduates (figure C). While the gap in enrollment rates among the three
groups of students appeared to be narrowing, 1992 vocational concentrators were still less likely
than their college preparatory peers and those completing general coursework in high school to
enroll in a postsecondary institution within 2 years. However, vocational concentrators who also
completed a college preparatory curriculum had enrollment outcomes that were more like those
of their college preparatory peers than did strictly vocational concentrators.
7The findings in this section come from the Schools and Staffing Surveys of 1991 and 1994.8Academic teachers were more likely than vocational teachers to have a master’s or doctorate/first-professional degree.9Two data sets were used for the analysis in this section: High School and Beyond, for 1982 public high school graduates, andthe National Education Longitudinal Study of 1988, for 1992 public high school graduates. In addition to the topics described inthis section, Chapter V of the report also presents findings on postsecondary remedial coursework (page 125).

Executive Summary
x
Vocational concentrators were more likely than students completing general coursework in
high school to obtain a degree or certificate within 2 years, despite the fact that the two groups
enrolled at similar rates in community colleges and that vocational concentrators were more
likely to be employed while in school.
The Transition to Postsecondary Education: 10 Years After High School(page 118)
Among 1982 graduates, vocational concentrators were less likely than either their college
preparatory peers or students completing general coursework in high school to enroll in post-
secondary education by 1992. However, vocational concentrators who also completed a college
preparatory curriculum were about as likely as college preparatory graduates to enroll during this
10-year period.
Figure C—Percentage of 1982 and 1992 public high school graduates enrolling in postsecondary Figure C—institutions by 1984 and 1994, respectively, by curriculum specialization in high school
*Includes students who completed both a vocational concentration and a college preparatory curriculum.
SOURCE: U.S. Department of Education, National Center for Education Statistics, High School and Beyond SophomoreCohort 1982 High School Transcript Study and Second Follow-up Survey, and National Education Longitudinal Studyof 1988, Third Follow-up and High School Transcript Study.
42
61
96
55
69
93
0
20
40
60
80
100
Vocational concentratorstotal*
Other/general College preparatory only
1982 graduates 1992 graduates
Percent

Executive Summary
xi
Postsecondary Completion 10 Years After High School (page 129)
More than half of 1982 public high school graduates who enrolled in postsecondary educa-
tion completed a degree or certificate by 1992. Vocational concentrators had lower overall rates
of postsecondary completion than their peers. However, vocational concentrators who also com-
pleted a college preparatory curriculum were as likely as college preparatory graduates to earn a
postsecondary degree or certificate during this period. Among graduates who enrolled in post-
secondary education by 1992, vocational concentrators were less likely than their peers to earn a
bachelor’s degree, but more likely to obtain a certificate or an associate’s degree.
Labor Market Outcomes 2 Years After High School (page 132)
Labor market outcomes 2 years after leaving high school were similar for the graduating
classes of 1982 and 1992. In both cases, about three out of four public high school graduates
were in the labor force. Vocational concentrators in both graduating classes were more likely
than their college preparatory peers to be in the labor force 2 years after graduation. While 1992
public high school graduates had similar labor market experiences regardless of their course of
study in high school, 1982 college preparatory graduates tended to have lower unemployment
rates than vocational concentrators and those completing general coursework in high school. This
difference between the two graduating classes may be due to shifts over the decade in economic
conditions, changes in the academic preparation of high school graduates, or other factors.
Labor Market Outcomes 10 Years After High School (page 135)
Vocational concentrators and students completing general coursework in high school had
similar labor market outcomes 10 years after graduation from high school. While the number of
months employed and unemployed was similar regardless of students’ course of study in high
school, college preparatory graduates tended to enjoy higher earnings in 1991 than their peers,
possibly because of their greater postsecondary attainment. Obtaining a bachelor’s degree was
generally associated with increased earnings and lower unemployment rates. At the other end of
the educational spectrum, students who earned a postsecondary certificate had similar annual
earnings and unemployment rates as their peers who did not complete a postsecondary degree or
certificate. Both those who held a postsecondary certificate and those who held a high school
diploma earned less and were more likely to be unemployed in 1991 than graduates who held
an associate's degree or higher.

Executive Summary
xii
VI. TRENDS IN POSTSECONDARY VOCATIONAL EDUCATION10
Trends in Educational Attainment (page 149)
The United States has experienced both greater educational participation and higher attain-
ment in recent years, continuing long-standing patterns. More people are attending postsecondary
institutions than ever before, and the average educational attainment of the adult population has
been steadily rising. While the total number of adults who earned vocational associate’s degrees
appeared to increase slightly between 1992 and 1996, this difference was not statistically signifi-
cant. However, the total number of adults who held academic associate’s degrees increased over
the 4 years by approximately an additional 1 million people.11
Although postsecondary enrollments overall have shown recent increases, there is no evi-
dence that bachelor’s degree holders are returning in large numbers for additional undergraduate
schooling, as some have speculated. In particular, small proportions of students who were pur-
suing associate’s degrees or certificates had already earned a bachelor’s or advanced degree. The
vast majority of students who enroll in postsecondary education are pursuing a higher level cre-
dential than the one they currently possess. However, this report focused on students who partici-
pate in for-credit postsecondary programs. It may be that a significant number of bachelor’s
degree holders are taking noncredit, adult, or continuing education courses.
Participation in Postsecondary Vocational Education (page 152)
Vocational coursework represents a substantial component of subbaccalaureate students’
education. Among all subbaccalaureate students, about one-half majored in a vocational program
area in 1996; the proportion decreased from 54 to 49 percent over the 6 years from 1990 to
1996.12 There was an increase between 1990 and 1996 in the proportion of postsecondary voca-
tional students being served by community colleges, with a corresponding decrease at private
proprietary institutions (figure D).
10Unless otherwise noted, the findings in this section come from the 1989–90 and 1995–96 National Postsecondary Student AidStudy (NPSAS). Because recent postsecondary transcript data were not available, the information on trends at the postsecondarylevel is generally less detailed than that at the secondary level. Specifically, it was not possible to examine actual course-takingpatterns in this section. Instead, the analysis relied primarily on self-reported degrees and majors. In addition to the topics de-scribed in this section, Chapter VI of the report also presents findings on work experience while enrolled (page 168), licensure(page 178), and labor market participation (page 179).11The findings presented in this paragraph come from the U.S. Census Bureau’s Current Population Surveys.12There were substantial amounts of missing data on student’s major field in both NPSAS surveys. About 24 percent of subbac-calaureate students in 1990 and 28 percent in 1996 did not report their major field.

Executive Summary
xiii
Subbaccalaureate Student Characteristics (page 157)
Subbaccalaureate students with vocational majors were more likely to be older, to have
family responsibilities, to receive financial aid, to have a previous postsecondary degree or cer-
tificate, and to report higher postsecondary grade-point averages (GPAs) than their academic
counterparts. These students with vocational majors also tended to have parents with lower edu-
cational attainment: as the education level of their parents increased, students’ likelihood of re-
porting a vocational major generally decreased. Differences by race–ethnicity among
subbaccalaureate students in their probability of having a vocational major were either minimal
or not statistically significant. Also, among subbaccalaureate students, there was no clear asso-
ciation between majoring in a vocational field and disability status.
Specific Occupational Preparation (page 164)
Business, health, and technical fields (the latter including engineering/science technologies,
computers/data processing, and protective services) accounted for large numbers of vocational
students’ majors. However, between 1990 and 1996, there were small decreases in the propor-
tions of subbaccalaureate students reporting majors in business, marketing, computers/data proc-
essing, and engineering/science technologies. Thus, the absolute level of participation in service-
Figure D—Percentage distribution of subbaccalaureate students reporting a vocational major according Figure D—to type of postsecondary institution: 1989–90 and 1995–96
*Other institution types include public 4-year; private, not-for-profit 4-year; private, not-for-profit less-than-4-year; and public vocational-technical institutions.
NOTE: Percentages may not add to 100 due to rounding.
SOURCE: U.S. Department of Education, National Center for Education Statistics, 1989–90 and 1995–96 NationalPostsecondary Student Aid Study.
1989–90
Communitycolleges
Privateproprietaryinstitutions
Other*
1995–96
20%
13%
67%
13%
9%
79%

Executive Summary
xiv
and information-related programs was relatively high in 1996, while the trend in these areas was
generally downward over the 6-year period.
Among subbaccalaureate students, gender gaps persisted in the fields of business, health,
and “other vocational” fields (where women predominated), as well as in trade and industry,
protective services, computers/data processing, and engineering/science technologies (where men
predominated). A particularly large gap between the participation of men and women occurred in
1996 in engineering/science technologies, a field in which 12 percent of male students and only 2
percent of female students declared a major.
Postsecondary Completion (page 172)
Among the group of students who first began their postsecondary studies in 1989–90, those
with academic majors were more likely than those with vocational majors to have completed at
least one postsecondary credential 4 years later. However, a majority of both academic and voca-
tional majors completed some type of degree or certificate within 4 years.
VII. CONCLUSION
This publication describes vocational education at the turn of the century as an enterprise in
transition. The available data signal that change is occurring in the directions advocated by recent
reform efforts, in particular, improved academic preparation and greater postsecondary participa-
tion. Evidence of change includes findings that the academic preparation of public high school
students participating in vocational education increased between 1982 and 1994; about half of
public comprehensive high schools reported integrating academic and vocational education in
1997, and a similar proportion reported offering tech prep; and from 1982 to 1992, postsecondary
enrollment rates within 2 years of public high school graduation increased significantly for voca-
tional concentrators.
There is mixed evidence that trends in participation in vocational programs reflect eco-
nomic shifts away from manufacturing toward services and information industries. For example,
at the high school level, the percentage of graduates who concentrated in trade and industry de-
clined between 1982 and 1994, and the proportions of students who concentrated in health care
and in technology and communications increased over the period. However, the percentages of
high school graduates who concentrated in health care and in technology and communications
were still quite small in 1994 (about 1 percent each). At the postsecondary level, for example,
health and engineering/science technologies were popular vocational majors in 1996. However,
there were small decreases between 1990 and 1996 in the proportions of subbaccalaureate

Executive Summary
xv
students reporting majors in computers/data processing and in engineering/science technologies.
Thus, data on trends in and levels of participation in health and technology programs provided
conflicting information about whether vocational program participation is paralleling the eco-
nomic shift toward services and information industries.

xvi
Foreword
In 1987, the National Center for Education Statistics (NCES) instituted a new approach to
collecting and reporting data on vocational education. Under the new approach, vocational edu-
cation data are collected primarily through general purpose surveys rather than separate voca-
tional education questionnaires. This arrangement allows NCES to situate vocational education
activities within the broader education context. In 1998, a Technical Review Panel was formed to
provide NCES with regular input on its Data on Vocational Education (DOVE) program.
This report is the third in a series published by NCES. The first two reports, Vocational
Education in the United States: 1969–1990 and Vocational Education in the United States: The
Early 1990s, were published in 1992 and 1995, respectively. Each describes vocational education
in America, updating key trends based on available data and focusing on selected issues relevant
to current policy discussions. The first publication had about one page of text dedicated sepa-
rately to each of 60 tables. The second provided a 25-page synthesis of data from over 100 tables
published as an appendix to the report. This third publication incorporates relevant tables and
figures into a more detailed analysis of vocational education trends toward the year 2000.
NCES intends to continue producing a report on the status of vocational education about
every 3 years. In the future, different analytic approaches may be tried and various related prod-
ucts produced. Your comments about the NCES vocational education publication series are wel-
come and may be sent to Lisa Hudson, NCES, 555 New Jersey Avenue, NW, Room 3106,
Washington, DC 20208.

xvii
Acknowledgments
The authors of this report would like to thank many individuals who contributed to the
preparation of Vocational Education in the United States: Toward the Year 2000. First, the report
was prepared under the thoughtful direction of Dawn Nelson of the Early Childhood, Interna-
tional, and Cross-cutting Studies Division of the National Center for Education Statistics
(NCES). In addition to her guidance and encouragement, other NCES staff—including Lisa Hud-
son, John Ralph, Martin Orland, Ellen Bradburn, and Mary Frase (now at the National Science
Foundation)—also contributed valued advice at various stages of report preparation, including
design, analysis, and writing.
Members of the NCES Vocational Education Technical Review Panel and its precursor
groups also provided useful insights and suggestions about methodology, scope, format, and em-
phasis of the report. These experts included John Bishop of Cornell University, Rosalind Bruno
of the Census Bureau, David Burkam of the University of Michigan, Steve Equall of the Ne-
braska Department of Education, David Goodwin of Planning and Evaluation Services, Kim
Green of the National Association of State Directors of Vocational Technical Education, J.D.
Hoye formerly of the National School-to-Work Office, Chris Lyons of the Maine Department of
Education, Russ McCampbell of the Missouri Department of Education, Jim McKenney and
Margaret Rivera of the American Association of Community Colleges, Robert Meyer of the Uni-
versities of Wisconsin and Chicago, Richard Miguel of the Illinois State Board of Education,
William Mockovak of the Bureau of Labor Statistics, Gail Schwartz of the National School-to-
Work Office, Nevzer Stacey of the Office of Educational Research and Improvement, and
Patricia McNeil, Doris Werwie, Mark Schwartz, Nancy Brooks, Mike Dean, and Dennis Berry of
the Office of Vocational and Adult Education.
A number of MPR Associates staff also contributed to the report. Technical assistance was
provided by Nicole Joyner, Jennifer Berktold, Robin Henke, Phillip Kaufman, Robert Fitzgerald,
Michael Clune, Lutz Berkner, and Shirley He. Additionally, Barbara Kridl, Andrea Livingston,
Karyn Madden, Francesca Tussing, Mary Mack, Leslie Retallick, Erika Collin, and Stacie Chun
provided invaluable production, editorial, graphics, and administrative assistance.

THIS PAGE INTENTIONALLY LEFT BLANK

xix
Table of Contents
PageExecutive Summary .................................................................................................................. iii
Foreword .................................................................................................................................... xvi
Acknowledgments...................................................................................................................... xvii
List of Tables ............................................................................................................................. xxi
List of Figures ............................................................................................................................ xxxi
I. Introduction ........................................................................................................................... 1Vocational Education Toward the Year 2000 ....................................................................... 1
II. The Context........................................................................................................................... 15Economic Trends................................................................................................................... 15Labor Market Trends............................................................................................................. 21Key Findings ......................................................................................................................... 29Implications for Data Analysis.............................................................................................. 30
III. Employer Perspectives ....................................................................................................... 33Overview ............................................................................................................................... 33Workplace Practices .............................................................................................................. 34Perspectives on Employees ................................................................................................... 38
IV. Trends in Secondary Vocational Education..................................................................... 47Overview ............................................................................................................................... 47Participation in Vocational Education................................................................................... 49Characteristics of Students Participating in Vocational Education....................................... 52Academic Coursetaking and Achievement ........................................................................... 62School Reform Efforts .......................................................................................................... 81Work Experience and Work-Based Learning........................................................................ 87Technology Literacy.............................................................................................................. 90Vocational Teachers .............................................................................................................. 93
V. Transitions After High School ............................................................................................ 107Overview ............................................................................................................................... 107

Table of Contents
xx
PagePostsecondary Outcomes....................................................................................................... 109Labor Market Outcomes........................................................................................................ 130
VI. Trends in Postsecondary Vocational Education .............................................................. 147Overview ............................................................................................................................... 147Trends in Educational Attainment......................................................................................... 149Trends in Postsecondary Enrollment..................................................................................... 152Student Characteristics.......................................................................................................... 157Specific Occupational Preparation ........................................................................................ 164Work Experience While Enrolled ......................................................................................... 168Postsecondary Completion and Other Outcomes.................................................................. 172
VII. Conclusion.......................................................................................................................... 183Key Questions and Relevant Findings .................................................................................. 183
Appendix A—Standard Error Tables ..................................................................................... 191
Appendix B—Data Sources and Technical Notes .................................................................. 365
Appendix C—Glossary ............................................................................................................. 375
Appendix D—Bibliography...................................................................................................... 387

xxi
List of Tables
Table Page
1 Percentage of public high school graduates completing one or more courses invocational education, by type of vocational education: 1982–94 ................................... 7
2a Column percentage distribution of U.S. workers employed in service-producing andgoods-producing occupations according to industry: 1997............................................. 17
2b Row percentage distribution of U.S. workers employed in service-producing andgoods-producing industries according to occupation: 1997............................................ 18
3 Employment by major occupational group: 1996 and projected 2006............................ 22
4a Employment in the 10 projected fastest-growing occupations: 1996 and projected2006................................................................................................................................. 22
4b Employment in the 10 occupations with largest projected job growth: 1996 andprojected 2006 ................................................................................................................. 23
5 Employment and median weekly earnings by education and training category: 1996.... 24
6 Percentage distribution of all adults aged 18 years or older and of those in the laborforce according to their employment status, by educational attainment: 1996 ............... 27
7 Ratio of median annual earnings of wage and salary workers aged 25–34 whosehighest education level was a bachelor’s degree or higher to those with a high schooldiploma, by sex: Selected years 1970–95........................................................................ 28
8 Percentage of employers reporting selected high-performance work characteristics, byfirm size: 1994 and 1997................................................................................................. 35
9 Percentage of employers reporting that they were involved in a school-to-workpartnership, by firm size: 1997........................................................................................ 36
10 Percentage of employers reporting that they participated in selected work-basedlearning activities, by firm size and type: 1997............................................................... 37
11 Percentage distribution of employers according to their estimations of the educationlevels of new front-line workers, by firm type: 1997 ...................................................... 40

List of Tables
xxii
Table Page
12 Percentage distribution of employers reporting that the proficiency of front-lineworkers has increased, decreased, or remained the same during the last 3 years, byfirm revenues: 1997......................................................................................................... 42
13 Among firms with employees with work-based learning (WBL) experience,percentage distribution of employers according to their evaluations of new front-lineworkers with WBL experience versus their non-WBL counterparts aged 18–25, byselected employee characteristics: 1997.......................................................................... 44
14 Average number of Carnegie units accumulated by public high school graduates, bytype of coursework: 1982, 1990, and 1994 ..................................................................... 50
15 Percentage of public high school graduates concentrating (accumulating 3 or morecredits) and specializing (accumulating 4 or more credits with 2 or more of thosecredits beyond the introductory level) in vocational programs: 1982, 1990, and 1994 .. 52
16 Percentage of public high school graduates concentrating (accumulating 3 or morecredits) in various vocational programs: 1982, 1990, and 1994 ..................................... 53
17 Average number of Carnegie units accumulated by public high school graduates, bytype of coursework and sex: 1982, 1990, and 1994 ........................................................ 55
18 Average number of Carnegie units accumulated by public high school graduates in thevocational and specific labor market preparation curricula, by race–ethnicity: 1982,1990, and 1994 ................................................................................................................ 55
19 Average number of Carnegie units accumulated by public high school graduates, bytype of coursework and disability status: 1982, 1990, and 1994..................................... 56
20 Average number of Carnegie units accumulated by public high school graduates, bygrade point average (GPA) and type of coursework: 1982, 1990, and 1994................... 58
21 Average number of Carnegie units accumulated by public high school graduates in thevocational and specific labor market preparation curricula, by school urbanicity: 1982,1990, and 1994 ................................................................................................................ 59
22 Percentage of public high school graduates concentrating (accumulating 3 or morecredits) and specializing (accumulating 4 or more credits with 2 or more of thosecredits beyond the introductory level) in vocational programs, by selected student andschool characteristics: 1982, 1990, and 1994.................................................................. 60
23 Percentage of public high school graduates meeting the New Basics core academicstandards, by curriculum specialization in high school: 1982, 1990, and 1994.............. 63

List of Tables
xxiii
Table Page
24 Percentage distribution of public high school graduates according to curriculumspecialization in high school: 1982, 1990, and 1994 ...................................................... 65
25 Average number of credits earned by public high school graduates in English, and thepercentage of total English coursework earned in low-level courses (language skills,functional, and basic English), by curriculum specialization in high school: 1982,1990, and 1994 ................................................................................................................ 66
26 Average number of Carnegie units accumulated by public high school graduates insocial studies, by curriculum specialization in high school and type of social studiescoursework: 1982, 1990, and 1994 ................................................................................. 67
27 Percentage of high school graduates completing coursework in mathematics, bycurriculum specialization in high school and type of mathematics coursework: 1982,1990, and 1994 ................................................................................................................ 68
28 Average number of credits earned by public high school graduates in mathematics,and the percentage of total mathematics coursework earned in below-algebra courses,by curriculum specialization in high school: 1982, 1990, and 1994............................... 69
29 Average number of credits earned by public high school graduates in science, and thepercentage of total science coursework earned at the basic level, by curriculumspecialization in high school: 1982, 1990, and 1994 ...................................................... 71
30 Percentage of public high school graduates completing coursework in chemistry andphysics, by curriculum specialization in high school: 1982, 1990, and 1994 ................. 72
31 Percentage distribution of 1988 8th graders according to subsequent specializationin vocational education in high school, by 8th-grade composite test score quartiles:1992................................................................................................................................. 73
32a Average number of credits earned by 1992 public high school graduates in variousEnglish courses and average number and percentage of credits earned in low-levelcourses, by curriculum specialization in high school...................................................... 74
32b Average number of credits earned by 1992 public high school graduates in variousmathematics courses and average number and percentage of credits earned in low-level courses, by curriculum specialization in high school ............................................. 74
32c Average number of credits earned by 1992 public high school graduates in scienceand physics courses, by curriculum specialization in high school .................................. 76
33 Average 8–10th, 10–12th, and 8–12th grade test score gains in reading, mathematics,and science for 1992 public high school graduates, by curriculum specialization inhigh school ...................................................................................................................... 76

List of Tables
xxiv
Table Page
34 Average 8–10th, 10–12th, and 8–12th grade test score gains in mathematics for 1992public high school graduates according to 8th-grade mathematics test score quartiles,by curriculum specialization in high school.................................................................... 77
35 Average 8–10th, 10–12th, and 8–12th grade test score gains in reading for 1992public high school graduates according to 8th-grade reading test score quartiles, bycurriculum specialization in high school......................................................................... 78
36 Average 8–10th, 10–12th, and 8–12th grade test score gains in science for 1992public high school graduates according to 8th-grade science test score quartiles, bycurriculum specialization in high school......................................................................... 78
37 Average number of credits earned by 1992 public high school graduates in variousmathematics and precalculus courses and average number and percentage of creditsearned in low-level mathematics courses according to 8th-grade mathematics testscore quartiles, by curriculum specialization in high school........................................... 80
38 Percentage of public schools reporting various efforts to integrate academic andvocational education, by selected school characteristics: 1997....................................... 82
39 Percentage of public schools offering tech-prep education, by selected characteristics:1997................................................................................................................................. 83
40 Percentage of public schools offering various school-based activities, by selectedcharacteristics: 1997........................................................................................................ 85
41 Percentage of public schools offering skill standards, skill certificates, andoccupational certificates, by selected school characteristics: 1997................................. 86
42 Percentage distribution of 1992 public high school graduates according to their workstatus during their senior year in high school, by curriculum specialization in highschool .............................................................................................................................. 87
43 Percentage of public high school graduates completing cooperative education or workexperience coursework in a specific occupational area, by curriculum specialization inhigh school: 1982, 1990, and 1994 ................................................................................. 89
44 Average percentage of specific labor market preparation (SLMP) credits earnedthrough cooperative education or work experience coursework in a specificoccupational area, by curriculum specialization in high school: 1982, 1990,and 1994 .......................................................................................................................... 89
45 Average number of Carnegie units accumulated by public high school graduates incooperative education and work experience coursework in a specific occupationalarea: 1982, 1990, and 1994 ............................................................................................. 91

List of Tables
xxv
Table Page
46 Percentage of graduates completing career preparation and general work experiencecourses not in a specific occupational area, by curriculum specialization in highschool: 1982, 1990, and 1994.......................................................................................... 92
47 Percentage of public high school graduates completing at least .5 credits of computereducation coursework: 1982, 1990, and 1994................................................................. 92
48 Percentage of public high school graduates completing introductory technologycoursework, by type of course: 1982, 1990, and 1994 .................................................... 94
49 Percentage distribution of public school teachers of grades 9 through 12 according tohighest educational degree, by teaching assignment and vocational program area:1990–91 and 1993–94 ..................................................................................................... 96
50 Percentage distribution of public school teachers of grades 9 through 12 according tomajor field of highest degree, by teaching assignment: 1990–91 and 1993–94.............. 97
51 Percentage distribution of public school teachers of grades 9 through 12 according toyears of teaching experience, by teaching assignment: 1990–91 and 1993–94 .............. 98
52 Percentage distribution of public school teachers of grades 9 through 12 according totype of credential in primary assignment field, by teaching assignment: 1990–91 and1993–94........................................................................................................................... 98
53 Percentage distribution of public school teachers of grades 9 through 12 according toage in current school year and age when began teaching, by teaching assignment:1990–91 and 1993–94 ..................................................................................................... 99
54 Percentage distribution of public school teachers of grades 9 through 12 according tosex, by teaching assignment: 1990–91 and 1993–94 ...................................................... 100
55 Percentage distribution of public school teachers of grades 9 through 12 according torace–ethnicity, by teaching assignment: 1990–91 and 1993–94 ..................................... 101
56 Percentage of public school teachers of grades 9 through 12 who reportedparticipating in various professional development activities, by teaching assignmentand vocational teachers by school type: 1993–94 ........................................................... 102
57 Percentage of public school teachers of grades 9 through 12 who reportedparticipating in inservice/professional development activities focusing on varioustopics, by teaching assignment and vocational teachers by school type: 1993–94 ......... 103
58 Percentage of public school teachers of grades 9 through 12 who agreed with variousstatements about the impact of professional development activities, by teachingassignment: 1993–94....................................................................................................... 104

List of Tables
xxvi
Table Page
59 Percentage of public school teachers of grades 9 through 12 who reported receivingvarious types of support for inservice/professional development activities, by teachingassignment: 1993–94....................................................................................................... 104
60 Percentage distribution of public school teachers of grades 9 through 12 according toage when began teaching and highest educational degree, by teaching assignment andvocational teachers by school type: 1993–94.................................................................. 106
61 Percentage distribution of 1982 public high school graduates according to theirenrollment status in postsecondary institutions by 1984, by curriculum specializationand hours worked per week in high school ..................................................................... 110
62 Percentage distribution of 1992 public high school graduates according to theirenrollment status in postsecondary institutions by 1994, and of those enrolled,percentage distribution according to type of first institution, by curriculumspecialization in high school ........................................................................................... 111
63 Percentage distribution of 1982 public high school graduates enrolled inpostsecondary institutions by 1984 according to type of institution, by curriculumspecialization and hours worked per week in high school .............................................. 113
64 Percentage distribution of 1992 public high school graduates enrolled inpostsecondary education in 1994 according to their employment status and workorientation, by curriculum specialization in high school ................................................ 114
65 Percentage distribution of 1992 public high school graduates according to theireducation and employment status in 1994, by curriculum specialization in highschool .............................................................................................................................. 115
66 Percentage distribution of 1992 public high school graduates according to theirpostsecondary enrollment and attainment status by 1994, by curriculum specializationin high school .................................................................................................................. 117
67 Percentage distribution of 1982 public high school graduates according to theirpostsecondary attainment by 1984, by curriculum specialization and hours worked perweek in high school......................................................................................................... 118
68 Percentage distribution of 1982 public high school graduates according to theirpostsecondary enrollment and attainment status by 1992, by curriculum specializationin high school .................................................................................................................. 120
69 Percentage distribution of 1982 public high school graduates who subsequentlyenrolled according to the timing of their first postsecondary enrollment, by curriculumspecialization in high school ........................................................................................... 121

List of Tables
xxvii
Table Page
70 Percentage distribution of 1982 public high school vocational concentrator graduatesaccording to their postsecondary enrollment and attainment status by 1992, byprogram area of high school vocational concentration.................................................... 123
71 Percentage distribution of 1982 public high school graduates according to theirpostsecondary enrollment and attainment status by 1992, by selected studentcharacteristics .................................................................................................................. 124
72 Average number of postsecondary remedial credits earned by 1982 public high schoolgraduates by 1992, and of those earning remedial credits, percentage distributionaccording to subject of remedial credits, by curriculum specialization in high school... 126
73 Average number of postsecondary remedial credits earned by 1982 public high schoolgraduates by 1992, and of those earning remedial credits, percentage distributionaccording to subject of remedial credits, by degree attainment by 1992......................... 128
74 Percentage distribution of 1982 public high school graduates who earned anassociate’s degree and/or a certificate by 1992 according to postsecondary program,by curriculum specialization in high school.................................................................... 131
75 Percentage distribution of 1992 public high school graduates according to theiremployment status in December 1993, by curriculum specialization and workexperience in high school ................................................................................................ 132
76 Percentage distribution of 1982 public high school graduates according to theiremployment status in February 1984, by curriculum specialization and hours workedper week in high school................................................................................................... 134
77 Percentage distribution of 1992 public high school graduates according to theiremployment status in December 1993, by program area of high school vocationalconcentration ................................................................................................................... 135
78 Average number and percentage distribution of months according to employmentstatus in 1991 for 1982 public high school graduates, by curriculum specialization inhigh school ...................................................................................................................... 137
79 Average number and percentage distribution of months according to employmentstatus in 1991 for 1982 public high school graduates, by hours worked in high schooland degree attainment by 1992........................................................................................ 138
80 Percentage distribution of 1982 public high school graduates according to theiremployment status in December 1991, by program area of high school vocationalconcentration ................................................................................................................... 140

List of Tables
xxviii
Table Page
81 Average annual and monthly earnings in 1991 for 1982 public high school graduates,by curriculum specialization in high school.................................................................... 141
82a Average number and percentage distribution of months according to employmentstatus in 1991 for 1982 public high school male graduates, by curriculumspecialization in high school and degree attainment by 1992 ......................................... 142
82b Average number and percentage distribution of months according to employmentstatus in 1991 for 1982 public high school female graduates, by curriculumspecialization in high school and degree attainment by 1992 ......................................... 143
83 Average annual and monthly earnings in 1991 for 1982 public high school graduates,by sex, curriculum specialization in high school, and degree attainment by 1992 ......... 144
84 Average annual and monthly earnings in 1991 for 1982 public high school graduates,by hours worked in high school and degree attainment by 1992 .................................... 145
85 Percentage distribution and number of adults aged 18 or older according to highesteducational attainment: 1992 and 1996........................................................................... 149
86 Percentage distribution of adults aged 18 or older according to highest educationalattainment, by sex and race–ethnicity: 1996 ................................................................... 151
87 Percentage distribution of adults aged 18 or older according to postsecondaryenrollment and degree-seeking status, by sex and race–ethnicity: 1991 and 1994 ......... 153
88 Percentage distribution of subbaccalaureate students majoring in an academic,vocational, or unreported field, by sex: 1989–90 and 1995–96 ...................................... 154
89 Percentage distribution of subbaccalaureate students who had previously earnedvarious degrees, by type of previous degree and selected student enrollmentcharacteristics: 1995–96.................................................................................................. 155
90 Percentage distribution of subbaccalaureate students according to type of institution,by major field category: 1989–90 and 1995–96.............................................................. 156
91 Percentage distribution of subbaccalaureate students according to sex, by major fieldcategory: 1995–96 ........................................................................................................... 157
92 Percentage distribution of subbaccalaureate students majoring in an academic,vocational, or unreported field, by race–ethnicity: 1989–90 and 1995–96 ..................... 159
93 Percentage distribution of subbaccalaureate students majoring in an academic,vocational, or unreported field, by disability status: 1989–90 and 1995–96................... 160

List of Tables
xxix
Table Page
94 Percentage distribution of subbaccalaureate students according to their postsecondarygrade point average (GPA), by major field category: 1989–90 and 1995–96................. 160
95 Percentage distribution of subbaccalaureate students majoring in an academic,vocational, or unreported field, by age: 1989–90 and 1995–96 ...................................... 161
96 Percentage distribution of subbaccalaureate students according to age, by major fieldcategory: 1989–90 and 1995–96 ..................................................................................... 161
97 Percentage distribution of subbaccalaureate students according to their financial aidstatus, by major field category: 1989–90 and 1995–96................................................... 162
98 Percentage distribution of subbaccalaureate students according to their dependencyand marital status, by major field category: 1989–90 and 1995–96................................ 163
99 Percentage distribution of subbaccalaureate students majoring in an academic,vocational, or unreported field, by parental education: 1995–96.................................... 164
100 Percentage distribution of subbaccalaureate students according to vocational majorsubcategory, by sex: 1989–90 and 1995–96.................................................................... 166
101 Percentage of subbaccalaureate students who worked while enrolled and, of thosewho worked, percentage distribution according to average hours worked per week, bymajor field category: 1989–90 and 1995–96................................................................... 168
102 Percentage of subbaccalaureate students participating in various school-related workexperience programs, by major field category: 1995–96 ................................................ 170
103 Percentage of 1989–90 beginning postsecondary students not enrolled in February1994 who reported various links between their postsecondary education and theirmost recent principal job, and who had at least one job related to their studies, bymajor field category and degrees attained: 1994 ............................................................. 170
104 Percentage distribution of 1989–90 beginning postsecondary students who wereenrolled in 1994 according to their February 1994 employment status and of thoseemployed, type of primary occupation in 1993, by selected student and institutionalcharacteristics .................................................................................................................. 171
105 Percentage distribution of 1989–90 beginning postsecondary students according totheir educational aspirations, by major field category and degree goal in 1989–90 ....... 173
106 Percentage distribution of 1989–90 beginning postsecondary students according totheir enrollment and attainment status in spring 1994, by selected studentcharacteristics .................................................................................................................. 174

List of Tables
xxx
Table Page
107 Percentage distribution of 1989–90 beginning postsecondary students according totheir attainment status in spring 1994 and, of those who attained a degree, type ofdegree, by selected student characteristics ...................................................................... 175
108 Percentage distribution of 1989–90 beginning postsecondary students according totheir transfer status in spring 1994 and, of those who transferred, type of destinationinstitution, by selected student and institutional characteristics...................................... 177
109 Percentage of 1989–90 beginning postsecondary students who took an occupationallicensing exam by 1994, and, of those who took at least one exam, percentage whotook an exam in various fields, by major field category and degree goal ....................... 178
110 Among 1989–90 beginning postsecondary students who took an occupationallicensing exam, percentage who passed at least one exam by 1994, and the pass rateby occupational field ....................................................................................................... 179
111 Percentage distribution of all adults aged 18 years or older and of those in the laborforce according to their employment status, by educational attainment: 1996 ............... 179
112 Percentage distribution of 1989–90 beginning postsecondary students who were notenrolled in 1994 according to their February 1994 employment status and of thoseemployed, type of primary occupation in 1993, by selected student and institutionalcharacteristics .................................................................................................................. 181

xxxi
List of Figures
Figure Page
A Average number of vocational credits earned by public high school graduates andpercentage of public high school graduates concentrating (accumulating 3 or morecredits) in vocational programs: 1982, 1990, 1994......................................................... vii
B Percentage of public high school graduates meeting the New Basics core academicstandards, by curriculum specialization in high school: 1982, 1990, and 1994.............. viii
C Percentage of 1982 and 1992 public high school graduates enrolling in postsecondaryinstitutions by 1984 and 1994, respectively, by curriculum specialization in highschool .............................................................................................................................. x
D Percentage distribution of subbaccalaureate students reporting a vocational majoraccording to type of postsecondary institution: 1989–90 and 1995–96 .......................... xiii
1 Secondary school taxonomy............................................................................................ 4
2 Classification of academic and vocational majors for subbaccalaureate postsecondaryprograms.......................................................................................................................... 10
3 Percentage distribution of total employment by sector and type of industry, andpercentage distribution of service-producing occupations by sector and type ofindustry: 1997.................................................................................................................. 16
4 Ratio of median annual earnings of wage and salary workers aged 25–34 with abachelor’s degree or higher to those with a high school diploma, by sex: Selectedyears 1970–95.................................................................................................................. 28
5 Percentage of employers reporting that they were involved in a school-to-workpartnership, by firm size: 1997........................................................................................ 36
6a Percentage of employers reporting that they participated in selected work-basedlearning activities: 1997 .................................................................................................. 37
6b Percentage of employers reporting that they offered internships, by firm size and firmtype: 1997........................................................................................................................ 38
7 Average employer rating of hiring factors for front-line workers in an establishedapplicant pool: 1997........................................................................................................ 39

List of Figures
xxxii
Figure Page
8 Average percentage of front-line workers reported by employers to have at least somepostsecondary education, by firm type: 1997.................................................................. 40
9 Percentage distribution of employers reporting that the skills required to doproduction or support jobs at an acceptable level increased, decreased, or remainedthe same during the last 3 years: 1997............................................................................. 41
10 Percentage of employers reporting that the proficiency of front-line workers hasincreased during the last 3 years, by firm revenues: 1997............................................... 42
11a Percentage distribution of employers reporting that the formal training provided toemployees has increased, decreased, or remained the same during the last 3 years:1994................................................................................................................................. 43
11b Percentage of employers reporting an increase in formal training during the last 3years, by reason for increase: 1994 ................................................................................. 43
12a Percentage distribution of firms with work-based learning (WBL) employeesaccording to their evaluations of the productivity of new front-line workers with WBLexperience versus their non-WBL counterparts aged 18–25: 1997................................. 45
12b Percentage distribution of firms with work-based learning (WBL) employeesaccording to their evaluations of the attitude of new front-line workers with WBLexperience versus their non-WBL counterparts aged 18–25: 1997................................. 45
13 Percentage of firms with work-based learning (WBL) employees reporting that noneof their new front-line workers with WBL experience needed remedial training orwere fired or quit within 1 year: 1997............................................................................. 46
14 Average number of Carnegie units accumulated by public high school graduates inacademic and vocational curricula: 1982, 1990, and 1994 ............................................. 50
15 Percentage distribution of public high school graduates according to their curriculumspecialization in high school: 1982, 1990, and 1994 ...................................................... 51
16 Percentage of public high school graduates meeting the New Basics core academicstandards, by curriculum specialization in high school: 1982, 1990, and 1994.............. 64
17 Average percentage of credits earned in low-level mathematics courses according to8th-grade mathematics test quartiles, by curriculum specialization in high school:1992................................................................................................................................. 75
18 Average 8–12th grade test score gains in reading and mathematics for 1992 publichigh school graduates who scored in the middle two quartiles on the 8th-grade readingand mathematics tests, by curriculum specialization in high school............................... 79

List of Figures
xxxiii
Figure Page
19 Percentage of public schools reporting various efforts to integrate academic andvocational education, by selected school characteristics: 1997....................................... 82
20 Percentage of public schools offering tech-prep education, by selected schoolcharacteristics: 1997........................................................................................................ 84
21 Percentage of public schools offering various school-based activities: 1997 ................. 85
22 Percentage of public schools offering various work-based activities: 1997 ................... 88
23 Percentage distribution of public school teachers of grades 9 through 12 according tohighest educational degree, by teaching assignment: 1993–94....................................... 96
24 Percentage distribution of public school teachers of grades 9 through 12 according toage when began teaching, by teaching assignment: 1993–94 ......................................... 100
25 Percentage of public school vocational teachers of grades 9 through 12 who reportedparticipating in various professional development activities: 1993–94 .......................... 102
26 Percentage of 1992 public high school graduates enrolled in postsecondary educationin 1994 who were also employed, by curriculum specialization in high school ............. 116
27 Percentage of 1982 public high school graduates who were enrolled in postsecondaryeducation by 1992, by curriculum specialization in high school .................................... 119
28 Average number of remedial credits earned by 1982 public high school graduates whoentered a postsecondary institution by 1992, by curriculum specialization in highschool .............................................................................................................................. 127
29 Percentage of 1982 public high school graduates who were enrolled in postsecondaryeducation according to their attainment status by 1992, by curriculum specializationin high school .................................................................................................................. 130
30 Average annual earnings in 1991 for 1982 public high school graduates, bycurriculum specialization in high school......................................................................... 139
31 Percentage distribution of adults aged 18 or older according to highest educationalattainment: 1992 and 1996 .............................................................................................. 150
32 Percentage distribution of subbaccalaureate students majoring in an academic,vocational, or unreported field: 1995–96 ........................................................................ 154
33 Percentage of vocational and academic subbaccalaureate students with selectedcharacteristics, by major: 1995–96.................................................................................. 158

List of Figures
xxxiv
Figure Page
34 Percentage of subbaccalaureate students in selected vocational major fields, by sex:1995–96........................................................................................................................... 167
35 Percentage distribution of employed subbaccalaureate students according to hoursworked per week, by major field category: 1995–96 ...................................................... 169
36 Percentage of 1989–90 beginning postsecondary students who attained any degree orcertificate by 1994, by degree working toward in 1989–90 ............................................ 176
37 Percentage of labor force participants aged 18 years or older who were unemployed,by educational attainment: 1996...................................................................................... 180

1
I. Introduction
VOCATIONAL EDUCATION TOWARD THE YEAR 2000
With the advent of the 21st century, vocational education in the United States is in transi-
tion. The traditional focus on preparing students for entry-level jobs after high school or 1 or 2
years of postsecondary training is giving way to a broader purpose—one that includes greater
emphasis on academic preparation and provides a wider range of career choices. Vocational Edu-
cation in the United States: Toward the Year 2000 attempts to capture this evolving enterprise.
However, the surveys available for assessing the status of vocational education were generally
designed to capture more traditional conceptions of the enterprise and often do not provide in-
formation on the most current reform efforts. Nevertheless, the available data do signal that
change is occurring in the directions advocated by reform efforts, although such change is often
small and preliminary. Because the Carl D. Perkins Vocational and Applied Technology Educa-
tion Act of 1998 (1998 Perkins Act) generally continues the reforms mandated by its 1990 prede-
cessor rather than changing the course of reform, future data collection may detect greater shifts
in the structure, content, and impact of vocational education.
This report is the third in a series published by the National Center for Education Statistics
(NCES). The first two reports, Vocational Education in the United States: 1969–1990 and Voca-
tional Education in the United States: The Early 1990s, were published in 1992 and 1995, re-
spectively. Each describes vocational education in America, updating key trends based on
available data and focusing on selected issues relevant to current policy discussions. This intro-
duction describes the direction reform has taken in recent years, as well as the current structure of
vocational education at both the high school and postsecondary levels.
The Direction of Reform
Historically, the purpose of vocational education has been to prepare students for entry-
level jobs in occupations requiring less than a baccalaureate degree. Over the last 15 years, how-
ever, this purpose has shifted toward broader preparation that develops the academic, vocational,
and technical skills of students in vocational education programs. This preparation involves the
integration of academic and vocational education, emphasis on all aspects of an industry, and
implementation of academic performance measures, among other reform efforts. Vocational

I. Introduction
2
education legislation and policy now also encourage high school students to continue their stud-
ies at the postsecondary level, and 2-year postsecondary students to pursue 4-year credentials
through various articulation or “tech-prep” arrangements. This shift in purpose began in the mid-
1980s, was first passed into law at the federal level in the 1990 Perkins Act, and was confirmed
by the recently passed 1998 Perkins Act.
In the mid-1980s, after publication of A Nation at Risk,1 some educators and school re-
formers began advocating for strengthening academic learning and better preparing students for
the world of work. They believed this could be accomplished by integrating academic and voca-
tional education and developing tech-prep programs.2 Integration was seen as a means to make
academic learning more meaningful for all students, to prepare all students more broadly for em-
ployment, to improve student engagement and learning, and to improve the academic content of
vocational courses, among other objectives. Tech-prep programs that articulate the last 2 years of
high school and the first 2 years of postsecondary vocational education programs were designed
to help students develop both strong academic and occupational skills and were seen as a way to
prepare them for a growing number of technical jobs and for greater flexibility and adaptability in
the workplace.
At the federal level, these reforms were first enacted in the 1990 Perkins Act, along with a
new requirement for states to develop performance measures and standards—including a meas-
ure of academic gains—for assessing local vocational programs. The 1994 School-to-Work Op-
portunities Act (the STWO Act) later reinforced the call for integration of academic and
vocational education and articulation of secondary and postsecondary education; however, the
STWO Act advocated these reforms for all students, not just those in vocational education pro-
grams. The STWO Act also advocated wider implementation of work-based learning—a com-
mon component of traditional vocational education programs—and called for multiple forms of
it, including job shadowing, mentoring, internships, and apprenticeships.
The 1998 Perkins Act, which will accompany vocational education into the 21st century,
continues the emphasis on integration, secondary–postsecondary articulation, and “all aspects of
the industry,” and once again requires a measure of academic performance. Furthermore, the new
Act strengthens the accountability mechanism of performance measures by linking monetary
disincentives to poor performance on them.
1National Commission on Excellence in Education, A Nation at Risk: The Imperative for Educational Reform (Washington,D.C.: 1983).2See C. Stasz, T. Kaganoff, and R.A. Eden, Integrating Academic and Vocational Education: A Review of the Literature, 1987–1992 (MDS–1034) (Berkeley: National Center for Research in Vocational Education, March 1995); and C. Dornsife, BeyondArticulation: The Development of Tech Prep Programs (MDS–311) (Berkeley: National Center for Research in Vocational Edu-cation, February 1992).

I. Introduction
3
Vocational education is evolving into a multipurpose enterprise that seeks to impart not
only occupational skills to students wishing to enter employment directly, but also academic
skills deemed to provide students with better preparation for both the world of work and post-
secondary education. Consequently, more students will likely have a greater set of options avail-
able to them as they choose and invent their careers. Where this evolution will eventually lead is
uncertain. That it is evolving is clear.
Vocational Education at the High School Level
When investigating trends in vocational education at the high school level, two questions
should be addressed: How has vocational education traditionally been organized and delivered?
and How does one measure participation in vocational education?
The Organization and Delivery of Vocational Education
Vocational education at the high school level has traditionally consisted of courses in spe-
cific labor market preparation (SLMP) (such as agriculture and renewable resources, business,
health care, and trade and industry); family and consumer sciences education (FCSE) (formerly
called “consumer and homemaking education”); and general labor market preparation (GLMP) (a
loose collection of general preparation coursework, including basic keyboarding and typewriting,
industrial arts and the newer technology education, and career preparation and general work ex-
perience). Figure 1 classifies high school courses according to the taxonomy used for this report,
including academic, vocational, enrichment/other, and special education courses. This taxonomy
was recently revised by NCES, and changes in the SLMP categories are noted for anyone com-
paring this report with the previous two Vocational Education in the United States publications.
Generally, only minor revisions in course classifications were made, although a few were nota-
ble.3 For example, the revised taxonomy now includes English as a Second Language courses
under English rather than under Non-English (previously Foreign) Languages. Additionally, all
computer-related courses are now included under the Vocational curriculum, whereas some were
previously included under Mathematics. Because of these and other shifts in the placement of
specific courses, there may be small differences between the percentages and average credits
published in this report and those published in previous Vocational Education in the United
3See D. Bradby and E.G. Hoachlander, 1998 Revision of the Secondary School Taxonomy (Working Paper No. 1999–06)(Washington, D.C.: U.S. Department of Education, National Center for Education Statistics, March 1999).

I. Introduction
4

I. Introduction
5
States publications or other NCES publications, such as the Digest of Education Statistics. How-
ever, differences should generally be small.4
The program areas listed under the “specific labor market preparation” heading represent
broad groupings of related occupational programs.5 For example, “agriculture and renewable re-
sources” encompasses programs in agricultural technology and horticulture, among others. The
“trade and industry” classification consists of the construction trades, mechanics and repair, pre-
cision production, and transportation and material moving; these groupings encompass even nar-
rower programs. Construction trades, for instance, includes specific programs in electricity,
carpentry, and plumbing, among others. The categories in figure 1 were constructed for a couple
of reasons. First, while some schools offer a sequence of courses in a single narrow occupational
area (such as Electricity 1 and Electricity 2), many programs of study involve taking coursework
in related occupational areas. For example, both electricity and carpentry programs may recom-
mend that their students take electrical fundamentals, blueprint reading, and customer relations
courses in addition to their core technical coursework. Although these courses may be associated
with a particular occupational program, they may be available to and form part of the program of
study for students in several different occupational programs. Moreover, individual schools may
attach specific courses to program areas in varying ways. For example, one school may consider
blueprint reading to be part of the electricity program, while another may offer it through its car-
pentry program. Grouping related courses and programs together avoids misclassifying some
courses. The second reason for establishing these broad groupings is that the number of students
included in a national educational survey who take courses in any one narrow occupational area
is often too small to be reported reliably.
Recent research suggests that schools are beginning to organize occupational education
around broader occupational clusters or specific industries. These new initiatives represent at-
tempts to provide students with broader academic and occupational preparation so they have a
greater choice of careers and postsecondary paths and can bring a wider array of skills into the
work world. Some practices include organizing entire schools around a broad occupational or
industry theme (such as aviation, fashion, or finance); these schools are sometimes called “mag-
net” or “theme schools.” Other practices include creating one or more schools-within-a-school
that have occupational or career-related themes (such as health science, business and finance,
natural resources, graphic arts, communications, or technology). These career academies or
“houses” may be designed for either at-risk or academically talented students, or for a 4Differences among published data may also be due to the application of different rules for determining which students should beincluded in an analysis. This report bases its analysis of high school coursetaking on the sample of public high school graduateswho earned 16 or more Carnegie units in high school and a positive number of Carnegie units in English.5For simplicity’s sake, the “specific labor market preparation” categories in figure 1 are often referred to in this report as “occu-pational program areas.”

I. Introduction
6
heterogeneous mix of students. Still other practices involve grouping occupational programs into
clusters, majors, or pathways. The current taxonomy of high school courses and the reliance of
NCES on transcript data for obtaining reliable information on students’ course-taking patterns
are generally not able to capture these school-level phenomena. Instead, a survey of school ad-
ministrators included in this report provides some information on the prevalence of these activi-
ties.6
These reforms aside, vocational education has usually been offered in three main public
high school settings.7 Comprehensive high schools—the traditional American high school—typi-
cally offer the full range of academic and vocational education, including FCSE, GLMP, and
SLMP coursework, although the latter offerings may be limited depending on the school. In ad-
dition to comprehensive high schools, some states have area vocational schools, usually offering
a wide range of occupational programs, that students attend for part of the day to take their occu-
pational coursework. Where area vocational schools exist, the comprehensive “sending” high
school may restrict its vocational offerings to FCSE and GLMP courses. Finally, a few states
have full-time vocational high schools that provide students with all of their academic prepara-
tion, as well as offer a variety of occupational programs. Such high schools may or may not be
organized around occupational or industry themes or function as magnet or theme schools; they
differ from comprehensive high schools in that students are generally required to select and com-
plete an occupational program or major. Some of the surveys used for this report are able to
identify comprehensive high schools and vocational schools but are unable to distinguish be-
tween area vocational schools and full-time vocational high schools.8
Measuring Participation in Vocational Education
Except in traditional full-time vocational high schools where graduates are typically re-
quired to complete a vocational program of study, most high school students are free to take as
much and as varied vocational coursework as they want. Some states have traditionally required
that students complete a small number of vocational courses (usually one or two semester-long
courses) to graduate. However, the vast majority of public high school graduates take more than
1.0 Carnegie unit of vocational education, and more than half take the equivalent of three or
6The National Longitudinal Survey of Youth–1997 was conducted by the Bureau of Labor Statistics with support from the Na-tional School-to-Work Office. It contains a school administrator component.7See U.S. Department of Education, Office of Educational Research and Improvement, National Assessment of Vocational Edu-cation Final Report to Congress, Vol. II (Washington, D.C.: July 1994).8For example, the 1991 and 1994 Schools and Staffing Surveys, which provide information on high school teachers, can identifycomprehensive high schools, vocational schools, and “other” schools (including special education schools). In contrast, the 1990and 1994 High School Transcript Studies do not identify vocational schools separately from other public high schools.

I. Introduction
7
more year-long courses.9 Moreover, students may take a sequence of related occupational
courses, may dabble in different occupational program areas, or may take no specific occupa-
tional coursework whatsoever. This report documents the different patterns of participation in
vocational education found in public high schools and the trends in such participation over time.
Almost all public high school students take vocational courses. In 1994, 97 percent of pub-
lic high school students took at least one vocational education course, and 91 percent completed
at least one specific occupational course (table 1). However, it can be useful to identify the subset
of high school students who complete a sequence of related occupational courses for several rea-
sons. Examining this pattern of participation helps determine whether schools are preparing stu-
dents adequately for the world of work. It also provides one indication of the size of the
vocational enterprise and whether it is growing or shrinking. Completing a sequence of related
occupational courses can be examined in conjunction with completing a college preparatory cur-
riculum. That is, to what extent do students complete both courses of study or neither, and what
are the trends over time? Additionally, identifying different curriculum pathways makes it possi-
ble to examine the outcomes associated with these pathways, such as achievement in high school
and subsequent postsecondary and labor market participation.
Table 1—Percentage of public high school graduates completing one or more courses in vocationalTable 1—education, by type of vocational education: 1982–94
Vocational education type 1982 1990 1994
Total 98.2 98.0 97.2
Family and consumer sciences education 50.2 48.1 45.1General labor market preparation 77.6 68.8 61.1Specific labor market preparation 88.7 90.6 90.8
SOURCE: U.S. Department of Education, National Center for Education Statistics, High School and Beyond Sophomore Cohort1982 High School Transcript Study and 1990 and 1994 National Assessment of Educational Progress High School TranscriptStudies.
Nonetheless, deciding on appropriate criteria for what constitutes completion of a sequence
of related occupational courses is somewhat arbitrary. States and individual high schools have
varying definitions of “vocational completion.” However, to facilitate our analysis, two defini-
tions were used in this study. The report defines “vocational concentrators” as those public high
9Among 1992 public high school graduates, about 91 percent earned 1.0 or more credits in vocational education, and about 58percent earned 3.0 or more such credits. See K. Levesque et al., Vocational Education in the United States: The Early 1990s(NCES 95–024) (Washington, D.C.: U.S. Department of Education, National Center for Education Statistics, 1995), table 10. Insecondary education, a Carnegie unit is awarded for the completion of a course that meets one period per day for one year, or theequivalent. For simplicity’s sake, the terms “Carnegie unit” and “credit” will be used interchangeably in this report.

I. Introduction
8
school graduates who completed 3.0 or more Carnegie units in a single occupational program
area, as indicated by the major headings under the “specific labor market preparation” classifica-
tion in figure 1. A more restrictive definition of “vocational specialization” was defined as com-
pleting 4.0 or more Carnegie units in one of these occupational areas, with 2.0 or more of the
units taken beyond the introductory level. Because a number of states count students as “voca-
tional completers” if they take 3.0 or more vocational credits, generally the focus here is on the
less restrictive definition.
Vocational Education at the Postsecondary Level
Some of the issues facing vocational education at the postsecondary level are similar to
those at the high school level, and others are unique.
The Organization and Delivery of Vocational Education
Federal legislation historically defines vocational education as leading to less than a
bachelor’s degree. Vocational education at the postsecondary level, therefore, covers associate’s
degree and subbaccalaureate certificate programs. Both 4-year and less-than-4-year postsecon-
dary institutions offer subbaccalaureate vocational programs. Unlike at the high school level,
postsecondary vocational education is commonly offered in both the public and private sectors.
In all, six main types of postsecondary institutions offer vocational education programs and are
included in this report:
• public 4-year institutions
• public 2-year institutions (sometimes referred to as “community colleges”)
• public less-than-2-year institutions (sometimes referred to as “vocational–technical in-
stitutes”)
• private, not-for-profit 4-year institutions
• private, not-for-profit 2-year institutions (which includes all private, not-for-profit less-
than-4-year institutions)
• private, for-profit institutions
The designation “4-year” means that the institution awards bachelor’s or graduate degrees
as its highest degree type. The designation “2-year” means the institution awards associate’s

I. Introduction
9
degrees or less-than-4-year, subbaccalaureate certificates as its highest award type. The designa-
tion “less-than-2-year” means that the institution does not award degrees but awards subbacca-
laureate certificates of less than 2 years in length. Private, for-profit institutions usually offer
certificates but may offer other degrees as well.
Figure 2 presents the taxonomy used in this report to classify subbaccalaureate postsecon-
dary majors as either academic or vocational.10 Some institutions that offer subbaccalaureate
programs explicitly identify their programs as either academic or vocational. In some cases, dif-
ferent degrees are awarded, for example, Associate of Arts (A.A.) degrees for completing aca-
demic programs and Associate of Science (A.S.) degrees for completing vocational programs.
Other institutions do not make this distinction. The taxonomy in figure 2 provides a uniform
standard for classifying majors as either academic or vocational that is independent of institu-
tional differences.11
Most of the reforms advocated for high school vocational education have also been advo-
cated for postsecondary vocational education. These include integration of academic and voca-
tional education, tech prep, work-based learning, and performance measures.
Measuring Participation in Vocational Education
As at the high school level, postsecondary students participate in vocational education to
varying degrees and with different intentions. Certain students enter postsecondary institutions
with a specific course of study in mind. In some cases, students must apply and be accepted to a
vocational program or otherwise formally enroll. For example, associate’s degree nursing pro-
grams are often in such great demand that they require formal admission. Some shorter-term vo-
cational certificate programs with a set course of study that students pursue as a cohort also
require formal enrollment. In many cases, however, postsecondary students are responsible for
their own course enrollment and select from a broad range of academic and vocational courses
each semester. Students who have clear degree intentions may follow the recommended course of
study for a program that is laid out in the institution’s course catalog. However, many students
may explore different types of coursework before settling on a “major.” Others may enroll for
credit but do not have clear intentions of completing a degree or certificate program. Still others
may have specific short-term goals for obtaining new skills that do not involve certificate or
10All for-credit vocational coursework at the postsecondary level is considered to be specific labor market preparation. For-creditpostsecondary vocational education does not have the equivalent of family and consumer sciences education and general labormarket preparation, which are found at the high school level, although not-for-credit courses may include some similar course-work. Information on not-for-credit “adult” or “continuing” education courses is generally not available from the surveys used inthis report and, therefore, is not covered in much depth in this publication.11Some small changes have been made to the taxonomy since it was used in the previous two reports.

I. Introduction
10

I. Introduction
11
degree completion. Most of the postsecondary data included in this report were derived from sur-
veys of students enrolled for credit in postsecondary institutions.
If postsecondary transcript data were available, it would be interesting to explore the differ-
ent paths and combinations of coursework that subbaccalaureate students take. However, no such
recent data are available.12 Instead, this publication relies on self-reported degree intentions and
major fields to identify subbaccalaureate students and classify them by their reported majors as
either academic or vocational (or not reported). For this reason, the postsecondary analysis in this
report is less extensive and detailed than the high school analysis, which had access to course en-
rollment data contained in high school transcripts. Additionally, comparable data were generally
available beginning in 1990, shortening the timeframe over which postsecondary trends could be
analyzed.13
Content and Structure of the Report
Policymakers and vocational educators need information about the status and direction of
vocational education in the United States. To respond to these information needs, this report ad-
dresses the following questions:
• What are the major national economic and labor market trends and their implications for
vocational education programs and policies?
• What skills do employers value, and how have skill requirements and worker proficiency
changed in recent years?
• How large is the vocational education enterprise at both the secondary and postsecondary
levels, and is it growing, shrinking, or holding constant over time?
• What types of vocational education do students take at each level, and how much do they
take?
• Who participates in vocational education, and is this changing?
12High School and Beyond collected postsecondary transcripts for 1982 high school graduates. The Fourth Follow-up of theNational Education Longitudinal Study of 1988 survey in 2002 may collect transcript data for 1992 high school graduates. TheBeginning Postsecondary Students survey does not plan to collect transcripts for the 1989–90 cohort.13The 1987 National Postsecondary Student Aid Survey (NPSAS) gathered data on students enrolled in postsecondary institu-tions only during the fall semester. Subsequent NPSAS surveys, usually administered about every 3 years, gathered data for stu-dents enrolled during the entire academic year. To maintain comparable student samples, the 1990 and 1996 NPSAS surveyswere selected for the trend analysis in this report.

I. Introduction
12
• Is the academic preparation of students who participate in vocational education improv-
ing over time?
• What is the role of work experience and work-based learning in students’ courses of
study?
• To what extent have recent vocational education reform efforts taken hold at the local
level?
• What are the postsecondary and labor market outcomes associated with participation in
vocational education?
• What are the trends in vocational teacher qualifications and experience over time?
• In what types of professional development do vocational teachers participate?
Sources of Information
To address the above questions, the authors analyzed data from nine separate national sur-
veys sponsored by one of three federal statistical agencies: NCES, the Bureau of Labor Statistics
(BLS), and the Census Bureau. The surveys were administered to representative samples of stu-
dents, teachers, adults in the general population, schools, and/or employers. The following is a
list of the databases analyzed for each section of the report:
Employer Perspectives
• First and Second National Employer Surveys14 (describing private, for-profit employers
with 20 or more employees in 1994 and 1997)
Trends in Secondary Vocational Education
• High School and Beyond Sophomore Cohort Surveys and High School Transcript Study
(describing 1982 high school graduates)
• High School Transcript Studies of 1990 and 1994 (describing 1990 and 1994 high school
graduates) 14These surveys were administered by the U.S. Bureau of the Census. They were designed by the National Center on the Educa-tional Quality of the Workforce at the University of Pennsylvania, which was funded by the Office for Educational Research andImprovement, U.S. Department of Education.

I. Introduction
13
• National Education Longitudinal Study of 1988 Surveys, Assessment File, and High
School Transcript Study (describing 1992 high school graduates)
• National Longitudinal Study of Youth–1997 (describing schools with a 12th grade)15
• Schools and Staffing Surveys of 1991 and 1994 (describing high school teachers)
Transitions After High School
• High School and Beyond Third and Fourth Follow-up Surveys (describing outcomes for
1982 high school graduates, 2 and 10 years after graduation)
• National Education Longitudinal Study of 1988 Third Follow-up Survey (describing
outcomes for 1992 high school graduates, 2 years after graduation)
Trends in Postsecondary Vocational Education
• Current Population Surveys of 1990, 1991, 1994, and 1996, October supplements (de-
scribing adults in the general U.S. population)
• National Postsecondary Student Aid Studies of 1990 and 1996 (describing students en-
rolled for credit in postsecondary institutions)
• Beginning Postsecondary Students Longitudinal Study of 1990, Base Year through Sec-
ond Follow-up (describing outcomes for students who began their postsecondary educa-
tion for the first time in 1989–90, 4 years later in 1994)
The data sets and the analytic methods used in this report are described in detail in appen-
dix B.
15Unfortunately, due to an error during the design stage, vocational schools were excluded from the sample. Consequently, thesurvey generally describes comprehensive high schools and, therefore, may provide a conservative estimate of local reform ef-forts.

THIS PAGE INTENTIONALLY LEFT BLANK

15
II. The Context
The trends toward a service- and information-based economy in recent decades have two
important implications for vocational education programs. These trends signal an ongoing shift
in the education and training fields that are required of the U.S. work force as well as the levels
of that education and training. In order to prepare students for the industries and occupations of
the 21st century, it is crucial for vocational educators and policymakers to understand the transi-
tions taking place. This chapter summarizes the current literature on economic and labor market
trends and provides a context for understanding the data in the following chapters.
ECONOMIC TRENDS
Defining Key Terms
A clear discussion of the trend toward a service-based economy demands that key terms be
defined. Confusion can arise because the terms “service-producing industries,” the “services in-
dustry,” “service-producing occupations,” and “service occupations” refer to four distinct but
overlapping phenomena. Figure 3 illustrates the relationships among several of these concepts.
At the most fundamental level, industrial classification systems typically divide employment into
two main sectors: service-producing and goods-producing industries. Service-producing indus-
tries encompass transportation, communications, and public utilities; wholesale and retail trade;
finance, insurance, and real estate; government; and “services.” Goods-producing industries en-
compass agriculture, mining, construction, and manufacturing.16 At times, economists compare
the service-producing industries and goods-producing industries. At other times, they compare
two major industry groups within these broad sectors: the services industry and the manufactur-
ing industry. In 1997, the broader “service-producing industries” classification covered 74.4 per-
cent of total employment in the U.S.; the narrower “services industry” classification covered 35.8
percent of total employment (figure 3 and table 2a).
The services industry includes a broad variety of activities, such as health care, advertising,
computer and data processing services, personnel supply, private education, social services, legal
16Sometimes discussion about the goods-producing sector excludes agricultural employment.

II. The Context
16
Figure 3—Percentage distribution of total employment, by sector and type of industry, and percentagedistribution of service-producing occupations by sector and type of industry: 1997
SOURCE: (Derived from tables 2a and 2b.) U.S. Department of Commerce, Bureau of the Census, Current Population Survey,1997, unpublished data.
services, management and public relations, engineering and architectural services, accounting,
and recreation. The services industry includes establishments as diverse as Microsoft™ and 24
Hour Fitness.™ The manufacturing industry encompasses both durable and nondurable goods
production.
To complicate matters further, “service-producing occupations” and “service occupations”
do not overlap neatly with either of the industrial classifications. Service-producing occupations
encompass managerial and professional specialty occupations, technicians and related support,
sales and administrative support (including clerical), and “service occupations.” The narrower

II. The Context
17
service occupations category covers, for example, janitors and cleaners, food preparation work-
ers, waiters and waitresses, nursing aides and orderlies, home health aides, correction officers,
and guards. Thus, service-producing occupations include managers in agribusiness companies
and computer technicians in high-technology firms, as well as service occupations such as
McDonalds’™ cooks and janitors at General Motors.™
In 1997, the broader “service-producing occupations” classification covered 72.2 percent
of total employment in the U.S.; the narrower “service occupations” classification covered 13.5
percent of total employment (table 2b). Although most service-producing occupations occur in
service-producing industries, 12.1 percent of these occupations occur in goods-producing indus-
tries (figure 3 and tables 2a). In contrast, the vast majority of service occupations (98.1 percent)
occur in service-producing industries, although just 56.2 percent occur in the services industry
(table 2a).
Table 2a—Column percentage distribution of U.S. workers employed in service-producing and goods-Table 2b—producing occupations according to industry: 1997
Industry Total
Manage- rial and profes- sional
specialty
Tech- nicians
and related support
Sales and admin- istrative support,
including clerical Service Total
Precison production, craft, repair, operators,
fabricators, and laborers
Farming, forestry,
and fishing
Total all industries 100.0 100.0 100.0 100.0 100.0 100.0 100.0 100.0 100.0
Goods-producing industries 25.6 12.1 17.5 19.2 10.5 1.9 60.7 58.2 84.0 Agriculture 2.6 0.5 0.5 1.1 0.5 0.1 8.2 0.4 80.6 Mining 0.5 0.3 0.4 0.6 0.2 0.0 1.1 1.2 0.0 Construction 6.4 2.1 3.8 1.1 1.5 0.2 17.5 19.3 0.6 Manufacturing 16.1 9.2 12.8 16.4 8.3 1.5 34.0 37.4 2.7
Service-producing industries 74.4 87.9 82.5 80.8 89.5 98.1 39.3 41.6 16.0 Transportation and public utilities 7.1 5.4 4.8 8.1 7.6 1.7 11.6 12.8 0.5 Wholesale and retail trade 20.7 23.3 8.0 4.8 39.5 29.1 13.9 15.1 2.9 Finance, insurance, and real estate 6.4 8.6 7.3 3.6 14.2 1.8 0.7 0.7 1.1 Services, except professional 11.9 13.0 11.7 9.0 8.6 25.2 9.2 9.3 8.3 Professional services 23.9 31.9 44.9 50.1 15.8 31.0 3.0 3.1 2.7 Public administration 4.4 5.8 5.9 5.2 3.9 9.4 0.9 0.9 0.7
NOTE: Percentages may not add to 100 due to rounding. Estimates appearing as 0.0 may be nonzero but less than 0.05.
SOURCE: U.S. Department of Commerce, Bureau of the Census, Current Population Survey, 1997, unpublished data.
1997 Occupational classification
Total all occupa-
tions
Service-producing occupations Goods-producing occupations

II. The Context
18
Ascendance of Services
At the beginning of the 20th century, the U.S. economy was in the midst of a massive tran-
sition, one that involved workers moving from agriculture into industry. At the end of the 20th
century, the economy is again in a state of flux, with more and more workers finding employ-
ment in the services industry as opposed to manufacturing. In 1945, the services industry ac-
counted for 10 percent of nonfarm employment, compared with 38 percent for manufacturing. By
1996, services accounted for 29 percent of nonfarm employment, while manufacturing declined
to 15 percent.17 These trends are expected to continue into the 21st century. The Bureau of Labor
17See J.R. Meisenheimer II, “The Services Industry in the ‘Good’ Versus ‘Bad’ Jobs Debate,” Monthly Labor Review (February1998): 22–47.
Table 2b—Row percentage distribution of U.S. workers employed in service-producing and goods-producingTable 2a—industries according to occupation: 1997
Industry Total
Manage- rial and profes- sional
specialty
Tech- nicians
and related support
Sales and admin- istrative support,
including clerical Service Total
Precision production, craft, repair, operators,
fabricators, and laborers
Farming, forestry,
and fishing
Total all industries 100.0 72.2 29.1 3.3 26.3 13.5 27.8 25.1 2.7
Goods-producing industries 100.0 34.1 19.9 2.4 10.8 1.0 65.9 57.0 8.9 Agriculture 100.0 13.5 6.1 1.4 5.3 0.7 86.6 3.6 83.0 Mining 100.0 39.1 22.6 3.9 12.0 0.6 60.9 60.7 0.2 Construction 100.0 24.2 17.2 0.5 6.0 0.4 75.8 75.5 0.3 Manufacturing 100.0 41.2 23.1 3.3 13.5 1.3 58.8 58.3 0.5
Service-producing industries 100.0 85.3 32.3 3.5 31.7 17.9 14.7 14.1 0.6 Transportation and public utilities 100.0 54.6 19.5 3.7 28.1 3.3 45.4 45.2 0.2 Wholesale and retail trade 100.0 81.3 11.3 0.8 50.2 19.1 18.7 18.3 0.4 Finance, insurance, and real estate 100.0 96.8 33.0 1.8 58.3 3.7 3.2 2.7 0.5 Services, except professional 100.0 78.5 28.6 2.5 18.9 28.6 21.5 19.6 1.9 Professional services 100.0 96.5 54.6 6.8 17.5 17.6 3.5 3.2 0.3 Public administration 100.0 94.4 38.7 3.9 23.3 28.7 5.6 5.2 0.4
NOTE: Percentages may not add to 100 due to rounding.
SOURCE: U.S. Department of Commerce, Bureau of the Census, Current Population Survey, 1997, unpublished data.
1997 Occupational classification
Total all occupa-
tions
Service-producing occupations Goods-producing occupations

II. The Context
19
Statistics projects that the service-producing sector will create virtually all of the new jobs be-
tween 1996 and 2006, with almost two-thirds of these jobs in the services industry.18
Some have argued that services industry jobs are not as good as manufacturing jobs and
that the trend toward services is therefore worrisome for the American worker.19 However, re-
search shows that the services industry is very diverse and that the shift from manufacturing to
services does not necessarily signal a deterioration in overall job quality.20 In 1996, average
hourly earnings for workers in the services industry was $11.79—about 92 percent of the $12.78
average for manufacturing workers. The wage differential between these two industries had nar-
rowed considerably since 1964, when average hourly earnings in services were 77 percent of the
manufacturing average.21 In 1996, the distribution, or spread, of earnings was similar for the two
industries, so that one could not simply be labeled “low wage” and the other “high wage.” A
comprehensive assessment of job quality that examined employee benefits, job security, occupa-
tional structure, and occupational safety, in addition to average wages, found that the services
industry was very diverse in terms of job quality and that many service jobs compared favorably
with those in manufacturing.22
The types of employment covered under service-related classifications is very broad. Serv-
ice-producing occupations cover anyone from filing clerks to chief executive officers, and serv-
ice-producing industries cover anything from fast-food restaurants to corporate banks.
Consequently, the shift to a service-based economy describes a complex process that encom-
passes both low- and high-wage jobs, requires varying skill levels, and presents a broad range of
employment opportunities.
The Emerging Information Economy
What accounts for the decline of manufacturing and the movement toward a service-based
economy? The decline of manufacturing is often referred to as “economic restructuring,” a term
that encompasses technological change and new competitive pressures on firms. Assessing the
impact of economic restructuring, though, is not a simple matter and is subject to much debate in
the economic literature and the popular press. The work of Paul Krugman, Jeffrey Sachs, Howard
18J.C. Franklin, “Industry Output and Employment Projections to 2006,” Monthly Labor Review (November 1997): 39–57.19See, for example, L. Mishel and J. Simon, “The State of Working America,” Challenge (November-December 1988): 50–51;and M. Mahar, “Blue Collar, White Collar: Good Jobs Are Vanishing Throughout the Economy,” Barron’s (May 11, 1992): 8–24.20See J.R. Meisenheimer II, “The Services Industry in the ‘Good’ Versus ‘Bad’ Jobs Debate” (February 1998).21The narrowing of the wage gap may be due in part to increases over the years in service-related employment associated withhigh technology, particularly in the computer, telecommunications, and health fields. Additionally, the narrowing wage gap maybe due in part to increasing demand for services employment and slackening demand for manufacturing employment.22See J.R. Meisenheimer II, “The Services Industry in the ‘Good’ Versus ‘Bad’ Jobs Debate” (February 1998).

II. The Context
20
Shatz, and Gary Burtless contradicts the prevalent assumption that international trade is the main
cause of widespread changes in the manufacturing sector during the past 30 years.23
There is more consensus about the role that technology has played in the growth of the
service sector. The U.S. economy is in the midst of what Alan Greenspan calls a “once-in-a-
century event,” a “structural technological advance” in information technology that is changing
the shape of the economy and the nature of work.24 He argues that development of the transistor
and integrated circuit and the resulting explosion of advancements in the computing and tele-
communications technologies have fundamentally changed the structure of the American econ-
omy. Much like the industrial revolution, which caused people to move from working in the
fields to working in factories, advances in information technology are causing employment to
shift from factories to service-producing firms.
As a result, major industrialized economies are becoming “knowledge-based,” where the
creation, distribution, and use of information and knowledge—including both technology and
human capital—are becoming increasingly important. According to some calculations, more than
half of the total gross domestic product in the major industrialized economies is now knowledge-
based, including industries such as telecommunications, computers, software, pharmaceuticals,
education, and television.25 High-technology industries have almost doubled their share of manu-
facturing output over the past two decades to around 25 percent, and knowledge-intensive serv-
ices are growing even faster.26 By one reckoning, “knowledge workers,” from brain surgeons to
journalists, account for 8 out of every 10 new jobs.27
23P. Krugman, Pop Internationalism (Cambridge and London: MIT Press, 1997); J. Sachs and H. Shatz, “Trade and Jobs in U.S.Manufacturing,” Brookings Papers on Economic Activity I (1994): 1–84; and G. Burtless, “International Trade and the Rise inEarnings Inequality,” Journal of Economic Literature 23 (June 1995): 800–816. For an alternate viewpoint, see G.J. Borjas andV.A. Ramey, “The Relationship Between Wage Inequality and International Trade,” in J.H. Bergstrand et al., eds., The ChangingDistribution of Income in an Open U.S. Economy (Amsterdam, North-Holland: 1994), 217–242; and A. Wood, North-SouthTrade, Employment, and Inequality: Changing Fortunes in a Skill-Driven World (Oxford: Clarendon Press, 1994).24A. Greenspan, “Job Insecurity and Technology,” address given at the Federal Reserve Bank of Boston’s Conference on Tech-nology and Growth, June 1996.25Organisation for Economic Co-operation and Development (OECD), Employment and Growth in the Knowledge-Based Econ-omy (Paris: 1996).26P. Woodall, “A Survey of the World Economy: A Hitchhiker’s Guide to Cybernomics,” The Economist 340 (7985) (Sept. 28,1996): S3–S5.27Ibid.

II. The Context
21
LABOR MARKET TRENDS
Against the backdrop of the shift toward a service- and information-based economy, this
section describes occupational trends and changing education and skill requirements.
Occupational Trends
In order to understand occupational trends clearly, it is important to draw the distinction
between “fast-growing occupations” and those with “large job growth.” A fast-growing occupa-
tion—one, for example, that doubles the number of jobs over a 10-year period—may add only a
small absolute number of jobs to the economy. In contrast, a slow-growing occupation, one that
increases only 10 or 20 percent over a 10-year period, may add a large absolute number of jobs,
because it began with a much larger employment base. Fast-growing occupations may receive a
lot of attention because they represent “emerging” occupations and, possibly, are the wave of the
future. However, it is important to consider the contribution of occupations with large job growth
as well as these fast-growing occupations, in order to have a complete employment picture.
The Department of Labor’s Bureau of Labor Statistics (BLS) periodically publishes em-
ployment outlooks that make projections about the fastest-growing occupations and those with
the largest job growth. A recent report, published in November 1997, makes projections for the
period from 1996 to 2006.28
Among the major occupational groups, employment in professional specialty occupations is
projected to increase the fastest and add the most jobs between 1996 and 2006 (table 3). The
group with the second fastest growth rate is projected to be technicians and related support occu-
pations, although this group is small and is not expected to add a large number of jobs. The next
fastest growing group is service occupations, which together with professional specialty occupa-
tions are projected to add nearly half of all new jobs from 1996 and 2006.
Among detailed occupations, the 10 occupations with the highest projected growth rates are
all service-producing occupations, and they can be classified in either the computer technology or
health fields (table 4a). Between 1996 and 2006, these occupations are projected to grow from 69
to 117 percent, while the average growth rate for all occupations is projected to be 14 percent
over the same period. However, these fastest growing occupations are projected to make up 3
percent of all jobs by the year 2006.
28See G. Silvestri, “Occupational Employment Projections to 2006,” Monthly Labor Review (November 1997): 58–83.

II. The Context
22
Table 3—Employment by major occupational group: 1996 and projected 2006
Change1996 2006 Number
(in thousands (in thousands (in thousandsOccupational group of jobs) of jobs) of jobs) Percent
All occupations 132,353 150,927 18,574 14.0
Executive, administrative, and managerial 13,542 15,866 2,324 17.2 Professional specialty 18,173 22,998 4,826 26.6 Technicians and related support 4,618 5,558 940 20.4 Marketing and sales 14,633 16,897 2,264 15.5 Administrative support, including clerical 24,019 25,825 1,806 7.5 Service 21,294 25,147 3,853 18.1 Agriculture, forestry, fishing, and related occupations 3,785 3,823 37 1.0 Precision production, craft, and repair 14,446 15,448 1,002 6.9 Operators, fabricators, and laborers 17,843 19,365 1,522 8.5
SOURCE: G. Silvestri, “Occupational Employment Projections to 2006,” Monthly Labor Review, Bureau of Labor Statistics,Office of Employment Projections, November 1997.
Employment
Table 4a—Employment in the 10 projected fastest-growing occupations: 1996 and projected 2006
Quartile rank1996 2006 Number by 1996(in (in (in median weekly
thousands thousands thousands earnings of full- Education and trainingOccupations of jobs) of jobs) of jobs) Percent time workers category
All occupations 132,353 150,927 18,574 14 — —
1. Database administrators, computer 212 461 249 117 1 Bachelor’s degree support specialists, and all other computer scientists
2. Computer engineers 216 451 235 109 1 Bachelor’s degree
3. Systems analysts 506 1,025 520 103 1 Bachelor’s degree
4. Personal and home care aides 202 374 171 85 4 Short-term on-the-job training
5. Physical and corrective therapy 84 151 66 79 4 Moderate-term on-the-job train
6. Home health aides 495 873 378 76 4 Short-term on-the-job training
7. Medical assistants 225 391 166 74 3 Moderate-term on-the-job train
8. Desktop publishing specialists 30 53 22 74 2 Long-term on-the-job training
9. Physical therapists 115 196 81 71 1 Bachelor’s degree
10. Occupational therapy assistants 16 26 11 69 3 Moderate-term on-the-job train and aides
Total 2,101 4,001 1,899 90 —
Share of all jobs (percent) 1.6 2.7 10.2 — —
—Not applicable.
SOURCE: G. Silvestri, “Occupational Employment Projections to 2006,” Monthly Labor Review, Bureau of Labor Statistics, Office ofEmployment Projections, November 1997.
Ten fastest-growing occupations: 1996–2006
Employment Change

II. The Context
23
The 10 detailed occupations with the largest projected increases in number of jobs are
somewhat more varied, although they also include several health occupations (table 4b). These
occupations are projected to make up 16 percent of total employment by 2006. Only systems
analysts and home health aides are included on both lists. Nine of the 10 occupations with the
largest projected numeric increases will grow at average or above-average rates. The retail sales
occupation, projected to grow at a 10 percent rate, is expected to add more jobs than all but one
of the fastest-growing occupations listed in table 4a.29
Quartile rank1996 2006 Number by 1996(in (in (in median weekly
thousands thousands thousands earnings of full- Education and trainingOccupations of jobs) of jobs) of jobs) Percent time workers category
All occupations 132,353 150,927 18,574 14 — —
1. Cashiers 3,146 3,677 530 17 4 Short-term on-the-job training
2. Systems analysts 506 1,025 520 103 1 Bachelor’s degree
3. General managers and top executives 3,210 3,677 467 15
1 Work experience plus bachelor’s or higher degree
4. Registered nurses 1,971 2,382 411 21 1 Associate’s degree
5. Salespersons, retail 4,072 4,481 408 10 3 Short-term on-the-job training
6. Truck drivers, light and heavy 2,719 3,123 404 15 2 Short-term on-the-job training
7. Home health aides 495 873 378 76 4 Short-term on-the-job training
8. Teacher aides and educational assistants 981 1,352 370 38 4 Short-term on-the-job training 9. Nursing aides, orderlies, and attendants 1,312 1,645 333 25 4 Short-term on-the-job training10. Receptionists and information clerks 1,074 1,392 318 30 4 Short-term on-the-job training
Total 19,486 23,627 4,139 21 —
Share of all jobs (percent) 14.7 15.7 22.3 — —
—Not applicable.
SOURCE: G. Silvestri, “Occupational Employment Projections to 2006,” Monthly Labor Review, Bureau of Labor Statistics, Office ofEmployment Projections, November 1997.
Ten occupations with largest job growth: 1996–2006
Table 4b—Employment in the 10 occupations with largest projected job growth: 1996 and projected 2006
Employment Change
29It should be remembered that BLS projections are based on past performance rather than anticipated developments or innova-tions, and may under- or over-predict the growth of some jobs.

II. The Context
24
Changing Education and Skill Requirements
Workforce 2000 estimated that more than half of new jobs between 1984 and 2000 would
require some education beyond high school, and one-third would require a bachelor’s degree or
more.30 More recent projections anticipate that average growth will be greater for occupations
requiring at least an associate’s degree than for occupations requiring less education.31 Indeed,
the 10 occupations with the highest projected growth rates in table 4a have relatively high educa-
tion and training requirements (8 require bachelor’s degrees or moderate- to long-term on-the-job
training). In contrast, however, the 10 occupations with the highest projected increases in number
of jobs have relatively low education and training requirements (7 require no more than short-
term on-the-job training) (table 4b). While some emerging occupations require high education
and training requirements, the majority of jobs still demand relatively low education and training
levels. In 1996, 39 percent of all jobs required no more than short-term on-the-job training (table
5).
Table 5—Employment and median weekly earnings by education and training category: 1996
Number Median(in thousands Percentage weekly earnings,
Education and training category of jobs) distribution full-time workers
All occupations 132,353 100.0 $483
First-professional degree 1,707 1.3 1,057 Doctoral degree 1,016 0.8 847 Master’s degree 1,371 1.0 682 Work experience plus bachelor’s or higher degree 8,971 6.8 786 Bachelor’s degree 15,821 12.0 686 Associate’s degree 4,122 3.1 639 Postsecondary vocational training 8,091 6.1 444 Work experience in a related occupation 9,966 7.5 534 Long-term on-the-job training 12,373 9.3 490 Moderate-term on-the-job training 16,792 12.7 434 Short-term on-the-job training 52,125 39.4 337
NOTE: Details may not add to totals due to rounding.
SOURCE: G. Silvestri, “Occupational Employment Projections to 2006,” Monthly Labor Review, Bureau of Labor Statistics,Office of Employment Projections, November 1997.
Employment
30W. Johnston and A. Packer, Workforce 2000: Work and Workers for the 21st Century (Indianapolis: Hudson Institute for theU.S. Department of Labor, 1987).31See G. Silvestri, “Occupational Employment Projections to 2006,” Monthly Labor Review (November 1997): 58–83.

II. The Context
25
Some changes in business practices are demanding greater skills of workers. Increased
global competition since World War II has spurred some U.S. businesses to create “high-
performance workplaces,” relying on flexible and decentralized work practices and multiskilled
workers. Although a growing number of firms are adopting high-performance characteristics,
some claim this trend will probably affect only a small number of firms clustered in a few indus-
trial sectors.32 To the extent that new business practices are adopted, there may be some increase
in the required skills of front-line workers. Some have argued that front-line production workers
will need to be proficient at using a range of machines and will need to demonstrate increased
flexibility, problem-solving, responsibility, teamwork, initiative, and care and attention, espe-
cially in monitoring automated equipment.33
Some have also argued that the shift to a service-based economy increases the need for
critical-thinking and social skills. For example, jobs that require direct contact with customers
and clients require problem solving, responsibility, and social skills.34 Additionally, while cus-
tomer service occupations (such as cooks, nursing aides, secretaries, clerical workers, and cash-
iers) may require only modest technical skill levels, workers in these occupations are expected to
possess social, communication, problem-solving, and basic academic skills.35
Generally, research has shown that obtaining workers with a good work ethic and appropri-
ate social behavior has been a priority for employers. Employers complain about the attitude and
character of workers—particularly about absenteeism, an inability to adapt, a lack of discipline,
and negative work behaviors.36 In response to criticisms about the general employability of the
work force, the Secretary’s Commission on Achieving Necessary Skills (SCANS) identified a
range of skills that all work force participants should have.37 These include the following:
Basic SkillsReadingWritingArithmeticMathematics
32S. Klein and R. Vergun, Workplace Skill Requirements: The Upskilling vs. Deskilling Debate (Washington, D.C.: U.S. De-partment of Education, National Assessment of Vocational Education, 1994).33H. Shaiken, S. Herzenberg, and S. Kuhn, “The Work Process Under More Flexible Production,” Industrial Relations 25 (2)(Spring 1986): 167–182.34P. Adler, “New Technologies, New Skills,” California Management Review 29 (1) (Fall 1986): 9–28.35P. Capelli, Are Skill Requirements Rising? Evidence from Production and Clerical Jobs (Philadelphia: National Center on theEducational Quality of the Workforce, 1991).36P. Capelli, Is the “Skills Gap” Really About Attitudes? (Philadelphia: National Center on the Educational Quality of theWorkforce, 1992).37U.S. Department of Labor, Skills and Tasks for Jobs: A SCANS Report for America 2000 (Washington, D.C.: 1990).

II. The Context
26
ListeningSpeaking
Thinking SkillsCreative ThinkingDecision MakingProblem SolvingSeeing Things in the Mind’s EyeKnowing How to LearnReasoning
Personal QualitiesResponsibilitySelf-EsteemSociabilitySelf-ManagementIntegrity/Honesty
In summary, the preponderance of the research evidence argues that there are trends toward
greater education and training requirements and a greater need for critical-thinking skills, per-
sonal responsibility, and social skills among work force participants. However, these trends are
not uniform across industries and occupations, and some disagree about their magnitude.
Returns to Education and Training
Research has consistently documented positive labor market returns to increasing educa-
tional attainment. For example, both rates of employment and labor force participation rise with
educational attainment. In 1996, 39 percent of adults who had not completed high school were
employed, while 70 percent of those with at least some college (including those with postsecon-
dary vocational certificates) were employed (table 6). Similarly, more than half (56 percent) of
people lacking a high school education were not in the labor force, compared with 27 percent of
those with at least some college education. The unemployment rate of those who had not com-
pleted high school was twice that of adults with some college education (10 percent versus 4 per-
cent, among labor force participants). Additionally, in 1996, median weekly earnings for full-
time workers generally increased as the education and training requirements of an occupation in-
creased (table 5). For example, while workers in jobs requiring no more than short-term on-the-
job training earned $337 per week, on average, those with an associate’s degree earned almost
twice as much ($639).

II. The Context
27
While there is a consistent and strong association between education and training and labor
market success, to some extent, these greater returns may be due to “selection bias.” That is, per-
sons attaining higher levels of education may be different from those with lower educational at-
tainment in ways—exclusive of education—that affect labor market success. If this is true, then
the impact of obtaining more education and training on success in the labor market, in itself, may
be overstated. However, recent increases in income disparities between those with more and less
education suggest that there are, in fact, direct returns to education and training.
The trend away from a manufacturing-based economy toward a services-based one has
been positive for many individuals and industries.38 This is not to say, however, that recent
changes have benefited everyone. Those without the appropriate education and skills to meet the
demands of an increasingly competitive and technical marketplace have watched their wages
stagnate and decline over the past 20 years. The rise of information technologies has contributed
to the widening inequality in income. Disparities between the more and less educated have in-
creased, and individuals whose work involves less conceptual activities have had either stagnant
or falling real income over the past two decades. Table 7 and figure 4 illustrate that income ine-
quality has widened over the period from 1970 to 1995 between holders of high school diplomas
and those who have earned bachelor’s degrees or higher.
38A. Greenspan, “Job Insecurity and Technology,” address given at the Federal Reserve Bank of Boston’s Conference on Tech-nology and Growth, June 1996.
Table 6—Percentage distribution of all adults aged 18 years or older and of those in the labor force Table 7—according to their employment status, by educational attainment: 1996
Of all adults Adults in labor forceNot in labor
Educational attainment Employed Unemployed force Employed Unemployed
Total 65.1 3.2 31.8 95.3 4.7
Less than high school completion 39.4 4.4 56.2 90.0 10.0 High school completion 63.7 3.7 32.6 94.5 5.5 Some college, no degree 69.7 3.0 27.3 95.9 4.2 Associate’s degree 77.5 2.6 20.0 96.8 3.2 Bachelor’s degree or higher 79.6 1.7 18.7 97.9 2.1
NOTE: Percentages may not add to 100 due to rounding.
SOURCE: U.S. Department of Commerce, Bureau of the Census, October Current Population Survey, 1996.

II. The Context
28
Table 7—Ratio* of median annual earnings of wage and salary workers aged 25–34 whose highest Table 7—education level was a bachelor’s degree or higher to those with a high school diploma, by sex:Table 6—Selected years 1970–95
Year Male Female
1970 1.24 1.681972 1.19 1.631974 1.14 1.741976 1.19 1.581978 1.18 1.551980 1.19 1.521982 1.34 1.631984 1.36 1.611986 1.50 1.781988 1.42 1.811990 1.48 1.921991 1.53 1.901992 1.60 2.001993 1.57 1.991994 1.52 1.861995 1.52 1.91
*This ratio is most useful when compared to 1.0. For example, the ratio of 1.52 in 1995 means that males whose highesteducation level was a bachelor’s degree or higher earned 52 percent more than males who had a high school diploma.
SOURCE: U.S. Department of Commerce, Bureau of the Census, March Current Population Surveys.
Figure 4—Ratio* of median annual earnings of wage and salary workers aged 25–34 with a bachelor’sFigure 4—degree or higher to those with a high school diploma, by sex: Selected years 1970–95
*This ratio is most useful when compared to 1.0. For example, the ratio of 1.52 in 1995 means that males whose highest education level was a bachelor’s degree or higher earned 52 percent more than males who had a high school diploma.
SOURCE: U.S. Department of Commerce, Bureau of the Census, March Current Population Surveys.
0.00.20.40.60.81.01.21.41.61.82.02.2
1970 1972 1974 1976 1978 1980 1982 1984 1986 1988 1990 1992 1994
Year
Ratio of earnings
Female
Male
1995

II. The Context
29
The reported benefits of higher educational attainment are consistent with recent vocational
education reforms emphasizing greater academic preparation and further education and training.
Research has also shown the following positive employment and earnings outcomes for partici-
pants in vocational education:39
1) High school students who concentrate their coursework in a vocational field of studyhave been shown to have better employment and earnings outcomes than those whotake fewer than 2.0 credits in a single vocational field;
2) Vocational completers who obtain a job in an occupation that matches their vocationalfield of study have been shown to outperform their peers who obtain employment in anunrelated field;
3) Female high school students who complete coursework in the business and healthfields have been shown to have better outcomes than those who train in other fields.Similarly, both male and female postsecondary students who complete coursework inthe health and technical fields have been shown to have better outcomes than thosewho train in other vocational fields;
4) Students who pursue their vocational studies at a community college have been shownto have better outcomes than students attending other types of postsecondary institu-tions; and
5) Postsecondary students who complete a vocational program and obtain a degree orcertificate have been shown to have better outcomes than those who do not completeor obtain certification.
Participating in vocational education has also been shown to have particular economic benefits
for women in general and students with disabilities.
KEY FINDINGS
The following presents a summary of key findings based on the discussion in this chapter:
• The United States is shifting from a manufacturing- to a service- and information-based
economy. These trends have two important implications for vocational education pro-
grams. They signal an ongoing shift in the education and training fields that are required
of the U.S. work force as well as the levels of that education and training.
39D. Boesel, L. Hudson, S. Deich, and C. Masten, “Employment Outcomes,” National Assessment of Vocational Education Fi-nal Report to Congress, Vol. II, Chapter Six (Washington, D.C.: U.S. Department of Education, Office of Educational Researchand Improvement, 1994).

II. The Context
30
• The occupations with the highest projected growth rates are generally in the computer
technology and health fields. Those with the highest projected increase in number of jobs
are somewhat more varied, although they also include several health occupations.
• While the occupations with the highest projected growth rates have relatively high edu-
cation and training requirements, those with the highest projected increase in number of
jobs have relatively low education and training requirements. Some emerging occupa-
tions require high education and training requirements, while the majority of jobs still
demand relatively low education and training levels.
• There is consensus in the research literature that there are trends toward greater educa-
tion and training requirements and a greater need for critical thinking, personal responsi-
bility, and social skills among work force participants. However, these trends are not
uniform across industries and occupations, and some disagree about their magnitude.
• Although researchers have long identified the association between increased educational
attainment and better labor market outcomes, the disparity in incomes between those
with more and less education has increased in recent years. Some argue that this means
that education and training are increasingly crucial for narrowing the income gap and for
preventing the creation of a society of haves and have nots.
• Research has shown that positive employment and earnings outcomes accrue to partici-
pants in vocational education who concentrate their coursework in a vocational field of
study in high school, who complete a postsecondary vocational program and obtain a
certificate or degree, and who obtain a job in a field related to their vocational education.
IMPLICATIONS FOR DATA ANALYSIS
How might the economic and labor market trends in this chapter be reflected in employer,
education, and labor market data? The following is a list of questions to guide readers as they
examine the data in the following chapters:
• What skills do employers value and how have skill requirements changed in recent
years? Are employers implementing high-performance workplaces?

II. The Context
31
• What are the trends in specific occupational preparation at the high school and post-
secondary levels? Specifically, is there a shift from participation in traditional manufac-
turing programs (such as trade and industrial programs) toward service-sector and
information-age programs (such as health and technology and communications pro-
grams)?
• Are high school students enrolling in courses that teach technological skills?
• Are students who participate in high school vocational education more academically
prepared than in the past, for either the world of work or postsecondary education?
• Are more students in secondary vocational education programs enrolling in and com-
pleting postsecondary education than in the past? Are more adults obtaining postsecon-
dary vocational education credentials than before?
• What are the labor market outcomes for persons concentrating in vocational education
programs? How do these outcomes compare with other kinds of preparation?

THIS PAGE INTENTIONALLY LEFT BLANK

33
III. Employer Perspectives
OVERVIEW
This chapter examines how workplaces are changing and how employers view current and
prospective employees. The analysis relies on the 1994 and 1997 National Employer Surveys,
which gathered data from a random sample of private firms with 20 or more employees. Public
and not-for-profit institutions, firms with fewer than 20 employees, and corporate headquarters
were not surveyed.40,41 Additional information on the surveys is provided in appendix B.
Key questions about workplace practices examined in this chapter include the following:
• To what extent are firms becoming “high-performance workplaces”?
• What percentage of firms are participating in school-to-work partnerships?
• What forms does this participation take?
The extent to which firms are becoming “high-performance workplaces” may affect the types of
skills demanded of employees. Because “high-performance workplaces” are typically decentral-
ized, they demand flexibility and multiple skills from workers. Additionally, employees need to
have good critical-thinking and problem-solving skills, and since they often work in teams, good
communication and social skills are also necessary. The National Employer Surveys also asked
about employer participation in school-to-work partnerships. These data provide one indication
of the extent to which the integration of school- and work-based learning is occurring at the local
level.
In this chapter, a number of key questions about employer perspectives on employees are
addressed, including the following:
40Because corporate headquarters were not included in the survey sample, and because several local establishments that fall un-der a single corporate headquarters might have been surveyed, the precise unit of analysis for these surveys is the “work estab-lishment.” To simplify the terminology used in this report, this chapter refers to the percentage of “firms” or “employers”—ratherthan “work establishments”—reporting specific characteristics.41Problems with large nonresponse on certain survey items meant that some of the items could not be used for this report.

III. Employer Perspectives
34
• What do employers look for in front-line workers? Is educational attainment important to
employers?
• What percentage of front-line workers have postsecondary education?
• Have skill requirements and worker proficiency changed in recent years?
• How do new hires with work experience (such as cooperative education, internships, or
apprenticeships) compare with other new hires?
These questions provide a counterpoint to what the research literature says about changing skill
requirements. While the general labor market trend may be toward higher education and training
requirements, employers have a unique perspective, which is particularly important in the short
term. The National Employer Surveys also allow one to examine from the employer point of
view whether previous work experience affects performance on the job, particularly for new
hires. These findings have important implications for the current emphasis on providing work-
based learning experiences to students.
WORKPLACE PRACTICES
High-Performance Workplaces
There is evidence that some employers are transforming their firms into high-performance
workplaces, with larger firms being more likely than smaller firms to undergo certain changes.
These firms, however, are still in the minority. Both good critical-thinking and social skills are
necessary in the decentralized and team-based environment of the high-performance workplace.
However, the extent to which these practices will be implemented and these skills be required in
the future is uncertain.
• Between 20 and 25 percent of surveyed employers reported some form of high-
performance work characteristic in 1997 (table 8). Twenty percent reported performance
benchmarking, and one-quarter had recently undergone reengineering. Larger firms were
more likely to participate in these activities. On average, about one in five nonsupervi-
sory employees participated in job rotation in 1997, and about 16 percent of nonsupervi-
sory employees worked in self-managed teams.

III. Employer Perspectives
35
• In 1994, 37 percent of surveyed employers had adopted Total Quality Management
(TQM) practices (table 8). Although larger firms were more likely to report adopting
TQM, one-third of firms in the smallest category also reported these practices.
Employer Participation in School-to-Work Activities
Some employers are also participating in school-to-work partnerships and different kinds of
work-based learning opportunities for students. Once again, however, these firms are in the mi-
nority.
Table 8—Percentage of employers reporting selected high-performance work characteristics, by firm Table 8—size: 1994 and 1997
Adopted total UnderwentFirm size quality reengineering Participated in(number of management within past performance Self-managedemployees) program 3 years benchmarking Job rotation teams
1994
Total 36.6 — 22.7 18.8 13.1
20–49 33.1 — 19.2 21.6 13.850–99 37.3 — 24.6 13.7 12.0100–249 42.6 — 26.2 16.7 12.1250 or more 59.9 — 47.1 12.1 11.6
—
Total — 24.9 20.4 21.7 15.5
20–49 — 20.4 15.6 24.6 16.350–99 — 29.2 24.7 16.7 13.9100–249 — 30.9 28.8 17.8 14.1250 or more — 44.9 39.3 18.4 16.5
—Not available.
SOURCE: 1994 National Employer Survey, Phase I, and 1997 National Employer Survey, Phase II. Administered by the U.S.Bureau of the Census; designed and funded by the National Center on the Educational Quality of the Workforce at theUniversity of Pennsylvania.
Average percentage of nonmanagerial and
nonsupervisory employees participating inPercentage of employers who
1997

III. Employer Perspectives
36
• In 1997, one-quarter of surveyed employers reported participating in a school-to-work
partnership (table 9; figure 5). Larger employers were more likely than smaller ones to
report such participation.
Table 9—Percentage of employers reporting that they were involved in a school-to-work partnership,Table 9—by firm size: 1997
School-to-workFirm size (number of employees) partnership
Total 25.4
20–49 22.950–99 23.8100–249 32.6250 or more 44.7
NOTE: The sample is made up of private, for-profit employers with 20 or more employees.
SOURCE: 1997 National Employer Survey, Phase II. Administered by the U.S. Bureau of the Census; designed and funded bythe National Center on the Educational Quality of the Workforce at the University of Pennsylvania.
Figure 5—Percentage of employers reporting that they were involved in a school-to-work partnership,Figure 5—by firm size: 1997
NOTE: The sample is made up of private, for-profit employers with 20 or more employees.
SOURCE: 1997 National Employer Survey, Phase II. Administered by the U.S. Bureau of the Census; designed and funded by the National Center on the Educational Quality of the Workforce at the University of Pennsylvania.
23 24
33
45
0
10
20
30
40
50
20–49 50–99 100–249 250 or more
Percent
Firm size (number of employees)

III. Employer Perspectives
37
• Forty-two percent of employers in 1997 reported providing at least one formal work-
based learning activity (table 10 and figure 6a). Twenty-one percent provided intern-
ships, 15 percent job shadowing, 14 percent cooperative education, and 10 percent
mentoring. Larger employers and services industry employers were more likely to pro-
vide internships and job shadowing than other employers (table 10 and figure 6b).
Figure 6a—Percentage of employers reporting that they participated in selected work-based learningFigure 6a—activities: 1997
NOTE: The sample is made up of private, for-profit employers with 20 or more employees.
SOURCE: 1997 National Employer Survey, Phase II. Administered by the U.S. Bureau of the Census; designed and funded by the National Center on the Educational Quality of the Workforce at the University of Pennsylvania.
1
42
2115 14
10 8 4
01020304050
All of theseactivities
At least one ofthese activities
Internship Job shadowing Cooperativeeducation
Mentoring Regularapprenticeship
Youthapprenticeship
Percent
Table 10—Percentage of employers reporting that they participated in selected work-based learningTable 10—activities, by firm size and type: 1997
All of At least one Job Co- Regular Youththese of these Intern- shadow- operative Mentor- apprentice- apprentice-
Firm size and type activities activities ship ing education ing ship ship
Total 0.8 41.9 20.6 14.8 14.4 9.5 7.8 3.9
Firm size (number of employees) 20–49 1.3 35.2 17.0 14.6 12.2 9.2 8.1 4.3 50–99 0.0 47.1 18.9 13.0 15.4 7.7 7.4 3.0 100–249 0.2 54.2 29.3 14.9 19.1 10.6 7.4 3.6 250 or more 0.4 68.5 48.6 24.6 24.0 19.4 7.4 3.7
Firm type Construction, manufacturing, and transportation 0.0 39.7 16.6 9.0 11.1 5.2 12.3 1.5 Wholesale/retail trade 1.7 38.3 17.1 13.9 18.0 11.4 7.7 6.2 Services 0.1 50.5 31.0 22.6 11.6 11.1 3.1 2.4
NOTE: The sample is made up of private, for-profit employers with 20 or more employees. Estimates appearing as 0.0 may be nonzero but less than 0.05.
SOURCE: 1997 National Employer Survey, Phase II. Administered by the U.S. Bureau of the Census; designed and funded bythe National Center on the Educational Quality of the Workforce at the University of Pennsylvania.

III. Employer Perspectives
38
PERSPECTIVES ON EMPLOYEES
Hiring Practices
Employers do not rate years of completed schooling or high academic performance as im-
portant as attitude and communication skills, when hiring front-line workers from among an es-
tablished applicant pool.42 However, it may be that years of completed schooling and high
academic performance are more important during initial applicant screening.43 It may also be that
employers have historically found that schooling measures are not reliable indicators of what
students know and are able to do.44 High academic performance may also not be as important as
satisfactory academic performance.
42For manufacturing establishments, the term “front-line workers” includes production workers; for other establishments, theterm refers to sales and customer service workers.43The surveys also did not ask whether education level or high academic performance were factors in retaining employees.44In recent years, there have been several efforts to reinforce the connection between school performance and workplace success.For example, in 1997 the Business Coalition for Education Reform, which includes the National Alliance of Business and otherorganizations, began a two-year nationwide effort to encourage the use of school records in the hiring process. See J. Hughes,“Business Group Encourages Employers to Seek Prospective Workers’ Academic Transcripts,” in Chronicle of Higher Educa-tion (Washington, D.C.: February 11, 1999).
Figure 6b—Percentage of employers reporting that they offered internships, by firm size and firm type:Figure 6b—1997
NOTE: The sample is made up of private, for-profit employers with 20 or more employees.
SOURCE: 1997 National Employer Survey, Phase II. Administered by the U.S. Bureau of the Census; designed and funded by the National Center on the Educational Quality of the Workforce at the University of Pennsylvania.
17 19
29
49
17 17
31
0
10
20
30
40
50
20–49Firm size
250 or more Wholesale/retail trade
Percent
20–49 50–99 100–249 Construction/manufacturing/transportation
Wholesale/retailtrade
Services250or
more
Firm typeFirm size

III. Employer Perspectives
39
• In 1997, employers rated attitude and communications skills as the most important fac-
tors in hiring front-line workers from an established applicant pool (4.6 and 4.1 on a 5-
point scale) (figure 7). In a list of six possible hiring factors, years of completed school-
ing ranked fourth in importance, and high academic performance fifth (2.9 and 2.5 on a
5-point scale).
Education Levels of Front-Line Workers
Firms in the services industry report higher education levels of front-line workers than
firms in the wholesale/retail trade industry and the construction, manufacturing, and transporta-
tion industries.45
• The education levels of front-line workers employed in service firms were higher than
those of their counterparts employed in other types of firms in 1997 (table 11; figure 8).
Fifty-six percent of front-line workers in service firms had at least some postsecondary
education, compared with 20 percent of front-line workers in construction, manufactur-
ing, and transportation firms and 39 percent of these workers in wholesale and retail
trade firms.
45For manufacturing establishments, the term “front-line workers” includes production workers; for other establishments, theterm refers to sales and customer service workers.
Figure 7—Average employer rating of hiring factors for front-line workers1 in an established applicant Figure 7—pool: 1997
1For manufacturing establishments, the term “front-line workers” includes production workers; for other establishments, theterm refers to sales and customer service workers.2On a 1–5 scale, a response of 1 indicates the hiring factor is not important and is not considered in hiring; a rating of 5 indicatesit is very important to employers in hiring.
NOTE: The sample is made up of private, for-profit employers with 20 or more employees.
SOURCE: 1997 National Employer Survey, Phase II. Administered by the U.S. Bureau of the Census; designed and funded by the National Center on the Educational Quality of the Workforce at the University of Pennsylvania.
4.64.1
3.2 2.9 2.52.0
12345
Attitude Communicationsskills
Industry-basedcredential
Years of completedschooling
High academicperformance
Reputation ofapplicant’s school
Rating 2

III. Employer Perspectives
40
Table 11—Percentage distribution of employers according to their estimations of the education levels of new Table 11—front-line workers,1 by firm type: 1997
Some postsecondary High schoolFirm type education2 diploma or less
Total 36.8 63.2
Construction, manufacturing, and transportation 20.4 79.6Wholesale/retail trade 38.7 61.3Services 56.1 43.91For manufacturing establishments, the term “front-line workers” includes production workers; for other establishments, theterm refers to sales and customer service workers.2Certification, some college, 2-year degree, or 4-year degree or higher.
NOTE: The sample is made up of private, for-profit employers with 20 or more employees. Percentages may not add to 100 dueto rounding.
SOURCE: 1997 National Employer Survey, Phase II. Administered by the U.S. Bureau of the Census; designed and funded bythe National Center on the Educational Quality of the Workforce at the University of Pennsylvania.
Figure 8—Average percentage of front-line workers1 reported by employers to have at least some Figure 8—postsecondary education,2 by firm type: 1997
1For manufacturing establishments, the term “front-line workers” includes production workers; for other establishments, theterm refers to sales and customer service workers.2Certification, some college, 2-year degree, or 4-year degree or higher.
NOTE: The sample is made up of private, for-profit employers with 20 or more employees.
SOURCE: 1997 National Employer Survey, Phase II. Administered by the U.S. Bureau of the Census; designed and funded by the National Center on the Educational Quality of the Workforce at the University of Pennsylvania.
20
39
56
0
20
40
60
80
100
Construction, manufacturing, andtransportation
Wholesale/retail trade Services
Percent

III. Employer Perspectives
41
Skill Requirements
Most employers report that front-line skill requirements are increasing.
• In 1997, 53 percent of employers reported that the skills required to do production or
support jobs at an acceptable level increased in the previous 3 years, while 41 percent re-
ported that required skills stayed the same and 6 percent reported that they decreased
(figure 9).
Figure 9—Percentage distribution of employers reporting that the skills required to do production or Figure 9—support jobs at an acceptable level increased, decreased, or remained the same during the lastFigure 9—3 years: 1997
NOTE: The sample is made up of private, for-profit employers with 20 or more employees.
SOURCE: 1997 National Employer Survey, Phase II. Administered by the U.S. Bureau of the Census; designed and funded by the National Center on the Educational Quality of the Workforce at the University of Pennsylvania.
Remained the same41%
Increased53%
Decreased6%
Worker Proficiency and Training
According to most employers, the proficiency of their front-line workers either stayed the
same or increased between 1994 and 1997. Employer-provided training, which also increased
over this 3-year period, may have contributed to proficiency gains. Alternatively, education re-
form efforts over the last decade may have contributed to the improvement in worker proficiency.
In either case, it is impossible to establish a causal link from the available data.

III. Employer Perspectives
42
• Fifty-five percent of employers surveyed in 1997 reported that the proficiency of front-
line workers remained the same over the last 3 years (1994–97) (table 12). About one-
third said the proficiency of these workers increased, while 14 percent said it decreased.
Firms in the lowest revenue category (less than $1 million per year) were generally less
likely to report that the proficiency of their front-line workers increased (figure 10).
Table 12—Percentage distribution of employers reporting that the proficiency of front-line workers* has Table 12—increased, decreased, or remained the same during the last 3 years, by firm revenues: 1997
1996 Firm revenues (in millions) Increased Decreased Remained the same
Total 31.9 13.7 54.5
Less than $1 15.2 22.1 62.8$1–10 33.5 10.1 56.4$10–100 35.7 14.4 49.8More than $100 38.6 6.7 54.7
*For manufacturing establishments, the term “front-line workers” includes production workers; for other establishments, the term refers to sales and customer service workers.
NOTE: The sample is made up of private, for-profit employers with 20 or more employees. Percentages may not add to 100 dueto rounding.
SOURCE: 1997 National Employer Survey, Phase II. Administered by the U.S. Bureau of the Census; designed and funded bythe National Center on the Educational Quality of the Workforce at the University of Pennsylvania.
Figure 10—Percentage of employers reporting that the proficiency of front-line workers* has increased Figure 10—during the last 3 years, by firm revenues: 1997
*For manufacturing establishments, the term “front-line workers” includes production workers; for other establishments, theterm refers to sales and customer service workers.
NOTE: The sample is made up of private, for-profit employers with 20 or more employees.
SOURCE: 1997 National Employer Survey, Phase II. Administered by the U.S. Bureau of the Census; designed and funded by the National Center on the Educational Quality of the Workforce at the University of Pennsylvania.
15
34 36 39
0
25
50
Less than $1 $1–10 $10–100 More than $100
Firm revenues (in millions)
Percent

III. Employer Perspectives
43
• Seventy-two percent of employers in 1997 reported increasing the amount of formal
training provided to workers in the previous 3 years (figure 11a). Economic reasons—to
remain competitive and improve the quality of output—were more likely to be given as
the cause of this increase in training than lack of skills among newly hired workers (fig-
ure 11b).
Figure 11a—Percentage distribution of employers reporting that the formal training provided to employeesFigure 11a—has increased, decreased, or remained the same during the last 3 years: 1994
NOTE: The sample is made up of private, for-profit employers with 20 or more employees. Percentages may not add to 100 dueto rounding.
SOURCE: 1994 National Employer Survey, Phase I. Administered by the U.S. Bureau of the Census; designed and funded by the National Center on the Educational Quality of the Workforce at the University of Pennsylvania.
Decreased2%
Increased72%
Remained the same27%
Figure 11b—Percentage of employers reporting an increase in formal training during the last 3 years,Figure 11b—by reason for increase: 1994
NOTE: The sample is made up of private, for-profit employers with 20 or more employees.
SOURCE: 1994 National Employer Survey, Phase I. Administered by the U.S. Bureau of the Census; designed and funded by the National Center on the Educational Quality of the Workforce at the University of Pennsylvania.
92 91 8781
75 71 71
0
20
40
60
80
100
To remaincompetitive
Need to improvequality of output
Need to improveproductivity
Changes intechnology
Changes inproducts or
services
New hires did nothave necessary
skills
Changes inorganization of
work
Percent
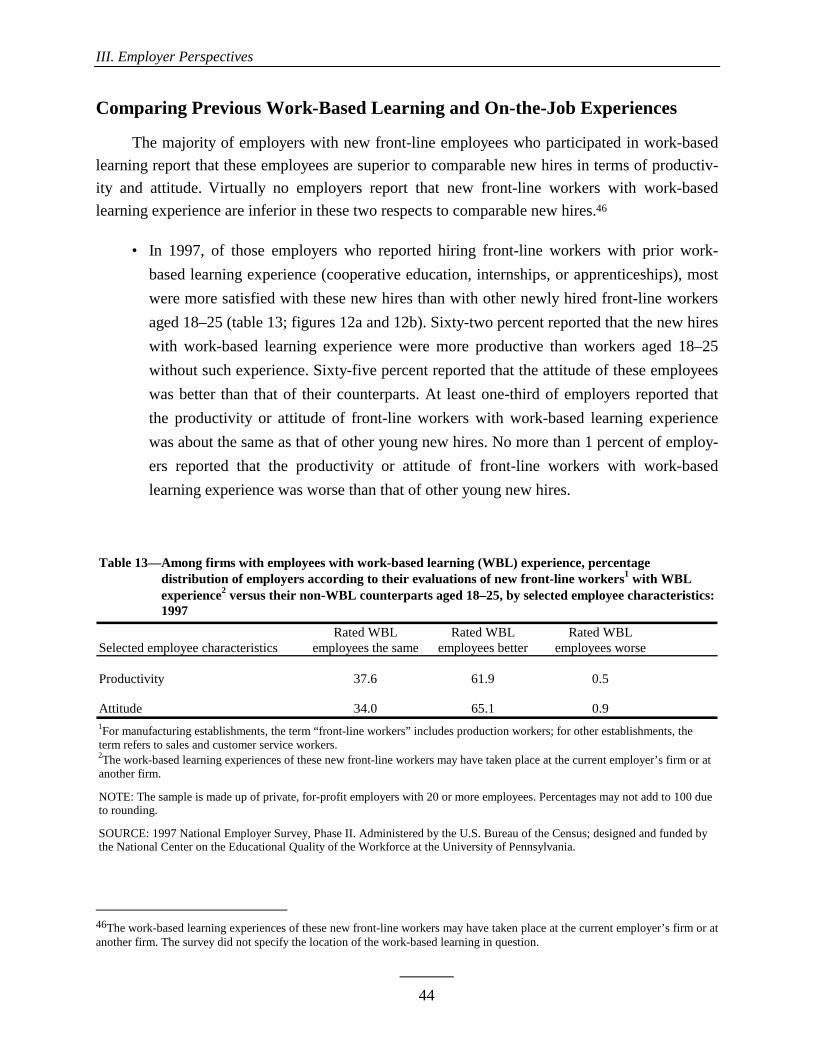
III. Employer Perspectives
44
Comparing Previous Work-Based Learning and On-the-Job Experiences
The majority of employers with new front-line employees who participated in work-based
learning report that these employees are superior to comparable new hires in terms of productiv-
ity and attitude. Virtually no employers report that new front-line workers with work-based
learning experience are inferior in these two respects to comparable new hires.46
• In 1997, of those employers who reported hiring front-line workers with prior work-
based learning experience (cooperative education, internships, or apprenticeships), most
were more satisfied with these new hires than with other newly hired front-line workers
aged 18–25 (table 13; figures 12a and 12b). Sixty-two percent reported that the new hires
with work-based learning experience were more productive than workers aged 18–25
without such experience. Sixty-five percent reported that the attitude of these employees
was better than that of their counterparts. At least one-third of employers reported that
the productivity or attitude of front-line workers with work-based learning experience
was about the same as that of other young new hires. No more than 1 percent of employ-
ers reported that the productivity or attitude of front-line workers with work-based
learning experience was worse than that of other young new hires.
46The work-based learning experiences of these new front-line workers may have taken place at the current employer’s firm or atanother firm. The survey did not specify the location of the work-based learning in question.
Table 13—Among firms with employees with work-based learning (WBL) experience, percentageTable 13—distribution of employers according to their evaluations of new front-line workers1 with WBL Table 13—experience2 versus their non-WBL counterparts aged 18–25, by selected employee characteristics: Table 13—1997
Rated WBL Rated WBL Rated WBLSelected employee characteristics employees the same employees better employees worse
Productivity 37.6 61.9 0.5
Attitude 34.0 65.1 0.91For manufacturing establishments, the term “front-line workers” includes production workers; for other establishments, theterm refers to sales and customer service workers.2The work-based learning experiences of these new front-line workers may have taken place at the current employer’s firm or atanother firm.
NOTE: The sample is made up of private, for-profit employers with 20 or more employees. Percentages may not add to 100 dueto rounding.
SOURCE: 1997 National Employer Survey, Phase II. Administered by the U.S. Bureau of the Census; designed and funded bythe National Center on the Educational Quality of the Workforce at the University of Pennsylvania.

III. Employer Perspectives
45
Figure 12a—Percentage distribution of firms with work-based learning (WBL) employees according to theirFigure 12a—evaluations of the productivity of new front-line workers1 with WBL experience2 versus their Figure 12a—non-WBL counterparts aged 18–25: 1997
1For manufacturing establishments, the term “front-line workers” includes production workers; for other establishments, theterm refers to sales and customer service workers.2The work-based learning experiences of these new front-line workers may have taken place at the current employer’s firm or atanother firm.
NOTE: The sample is made up of private, for-profit employers with 20 or more employees. Percentages may not add to 100 dueto rounding.
SOURCE: 1997 National Employer Survey, Phase II. Administered by the U.S. Bureau of the Census; designed and funded by the National Center on the Educational Quality of the Workforce at the University of Pennsylvania.
Rated WBL employees worse
1%
Rated WBLemployees the same
38%
Rated WBLemployees better
62%
Figure 12b—Percentage distribution of firms with work-based learning (WBL) employees according to theirFigure 12b—evaluations of the attitude of new front-line workers1 with WBL experience2 versus theirFigure 12b—non-WBL counterparts aged 18–25: 1997
1For manufacturing establishments, the term “front-line workers” includes production workers; for other establishments, theterm refers to sales and customer service workers.2The work-based learning experiences of these new front-line workers may have taken place at the current employer’s firm or atanother firm.
NOTE: The sample is made up of private, for-profit employers with 20 or more employees.
SOURCE: 1997 National Employer Survey, Phase II. Administered by the U.S. Bureau of the Census; designed and funded by the National Center on the Educational Quality of the Workforce at the University of Pennsylvania.
Rated WBL employees better65%
Rated WBL employees the same
34%
Rated WBL employees worse
1%

III. Employer Perspectives
46
• Eighty-one percent of firms in 1997 who reported hiring front-line workers with prior
work-based learning experience reported that none of these new hires needed remedial
training in reading or mathematics (figure 13). Fifty-six percent of these firms also re-
ported that none of their front-line workers with work-based learning experience were
fired within 1 year of being hired, and 35 percent reported that none of these employees
quit within a year of being hired. However, the survey did not ask for comparable infor-
mation about front-line workers who did not have prior work-based learning experience.
Figure 13—Percentage of firms with work-based learning (WBL) employees reporting that none of their Figure 13—new front-line workers* with WBL experience needed remedial training or were fired or quit Figure 13—within 1 year: 1997
*For manufacturing establishments, the term “front-line workers” includes production workers; for other establishments, the term refers to sales and customer service workers.
NOTE: The sample is made up of private, for-profit employers with 20 or more employees.
SOURCE: 1997 National Employer Survey, Phase II. Administered by the U.S. Bureau of the Census; designed and funded by the National Center on the Educational Quality of the Workforce at the University of Pennsylvania.
81
56
35
0
25
50
75
100
No WBL workers needed remedialtraining
No WBL workers were fired within 1year
No WBL workers quit within 1 year
Percent
47
IV. Trends in Secondary Vocational Education
OVERVIEW
This chapter provides information on trends in secondary vocational education during the
period 1982–1994. Because little vocational education has historically been provided by private
schools, the analysis focuses on public high schools (grades 9 through 12). The chapter also pro-
vides data on school reform efforts as of 1997 and teacher trends from 1991 to 1994. Specifi-
cally, this chapter provides information on these key topics:
• participation in vocational education
• characteristics of students participating in vocational education
• academic coursetaking and achievement
• school reform efforts
• work experience and work-based learning
• technology literacy
• vocational teachers
When making comparisons among different groups of high school graduates, three cur-
riculum-based definitions were used:
Vocational concentrators completed 3.0 or more credits in a single occupational program
area.47 These program areas include the following:
• agriculture and renewable resources
• business
• marketing and distribution
47A second definition was also sometimes used: vocational specialists completed 4.0 or more credits in a single occupationalprogram area, with 2.0 or more of these units taken beyond the introductory level. However, the report generally focuses on thefirst, less restrictive definition of vocational concentrators.

IV. Trends in Secondary Vocational Education
48
• health care
• public and protective services
• trade and industry
• technology and communications
• child care and education
• food service and hospitality
• personal and other services
College preparatory students completed a college preparatory course of study that was con-
sistent with the prevailing entrance requirements at public 4-year institutions.48 These included
4.0 credits in English; 3.0 credits in mathematics at the Algebra 1 level or higher; 2.0 credits in
biology, chemistry, and/or physics; 2.0 credits in social studies with at least 1.0 credit in U.S. or
World History; and 2.0 credits in a single foreign language.
Other/general students met neither of the above criteria.
Students who met both the vocational concentrator and college preparatory criteria were in-
cluded in the vocational concentrators total in the tables and figures. Students who met only the
vocational concentrator criteria, as well as the “both” group, were also reported separately. In
most instances, the chapter focuses on the vocational concentrators total, and refers to this group
simply as “vocational concentrators.” When the chapter describes students who met only the vo-
cational concentrator criteria or those who met both the vocational concentrator and college pre-
paratory criteria, the text makes it clear that these subgroups are being discussed.
As previewed in the Introduction, the data sets used in this chapter include the following:
• High School and Beyond (HS&B) Sophomore Cohort Surveys and High School Tran-
script Study (describing 1982 high school graduates)
• High School Transcript Studies (HSTS) of 1990 and 1994 (describing 1990 and 1994
high school graduates)
• National Education Longitudinal Study of 1988 (NELS:88) Surveys, Assessment File,
and High School Transcript Study (describing 1992 high school graduates)
48P. Flanagan, Raising Standards: State Policies to Improve Academic Preparation for College (Rockville, MD: Westat, 1992).

IV. Trends in Secondary Vocational Education
49
• National Longitudinal Study of Youth (NLSY) of 1997 (describing schools with a 12th
grade)
• Schools and Staffing Surveys (SASS) of 1991 and 1994 (describing teachers)
The first three data sets, HS&B, HSTS:90, and HSTS:94, form the foundation of the trend
analysis in this chapter. They contain transcript data, which provide a rich source of information
on course-taking patterns, as well as other survey information. NELS:88 was used primarily to
examine the relationship between vocational coursetaking and achievement test gains between
the 8th and 12th grades. NLSY provided information on the extent to which certain school re-
forms have been implemented in public schools with a 12th grade.49 SASS was used to provide
trend data (1991–94) on the qualifications, experience, and demographic characteristics of voca-
tional teachers, as well as to allow comparisons with other teachers. SASS:94 included questions
that provide baseline data on teachers’ professional development activities.
PARTICIPATION IN VOCATIONAL EDUCATION
From 1982 to 1994, there was a general decline in the participation of high school students
in vocational education. The percentage of public high school graduates taking at least one voca-
tional education course decreased slightly. However, the decline in the percentage of graduates
completing a sequence of related occupational courses was more dramatic. These decreases may
be partly due to increases in high school graduation requirements implemented by many states
after the publication of A Nation at Risk50 in 1983. As students have been required to take more
academic coursework, they may have elected to take fewer vocational courses. See figure 1 in the
Introduction for a summary of the high school curriculum categories referred to in this section
(that is, the academic, vocational (and its subcategories), and enrichment/other curricula).
• The total amount of coursework completed by public high school graduates increased,
on average, from 21.6 credits in 1982 to 24.2 credits in 1994, an increase of 12 percent
(table 14; figure 14). This change was driven by a 23 percent increase in completed aca-
demic credits. The average number of credits public high school graduates earned in the
enrichment/other curriculum remained steady over this time period at about 2.6, while
the average number of vocational credits earned fell from 4.7 to 4.0. In 1994, credits
49Unfortunately, due to an error during the sample design stage, schools classified by their districts as primarily “vocational”were excluded from the NLSY sample. Consequently, the survey generally describes comprehensive high schools and, therefore,may provide a conservative estimate of local reform efforts.50National Commission on Excellence in Education, A Nation at Risk (1983).

IV. Trends in Secondary Vocational Education
50
earned in the vocational education curriculum fell to 16 percent of total high school
credits, while the share in 1982 was about 22 percent.
• The percentage of public high school graduates taking at least one vocational education
course decreased slightly from 98.2 percent in 1982 to 97.2 percent in 1994 (table 1 in
Table 14—Average number of Carnegie units accumulated by public high school graduates, by type ofTable 14—coursework: 1982, 1990, and 1994
Type of coursework 1982 1990 1994
Total 21.60 23.53 24.17
Academic 14.28 16.66 17.58 Vocational total 4.68 4.19 3.96 Specific labor market preparation 3.03 2.89 2.79 General labor market preparation 0.95 0.73 0.64 Consumer and homemaking education 0.69 0.57 0.52 Enrichment/other 2.64 2.68 2.63
NOTE: Averages may not add to totals due to rounding.
SOURCE: U.S. Department of Education, National Center for Education Statistics, High School and Beyond Sophomore Cohort1982 High School Transcript Study and 1990 and 1994 National Assessment of Educational Progress High School TranscriptStudies.
Figure 14—Average number of Carnegie units accumulated by public high school graduates in academic and Figure 14—vocational curricula: 1982, 1990, and 1994
*Includes Carnegie units earned in enrichment/other courses.
SOURCE: U.S. Department of Education, National Center for Education Statistics, High School and Beyond SophomoreCohort 1982 High School Transcript Study and 1990 and 1994 National Assessment of Educational Progress High School Transcript Studies.
0
5
10
15
20
25
30
1982 1986 1990 1994
Total* Academic Vocational
Year
Average numberof units
21.623.5 24.2
14.316.7 17.6
4.7 4.2 4.0

IV. Trends in Secondary Vocational Education
51
the Introduction). Although the percentage of graduates taking at least one specific labor
market preparation course increased slightly from 88.7 percent in 1982 to 90.8 percent in
1994, the average amount of coursework completed in the specific labor market prepara-
tion curriculum declined from 3.0 credits to 2.8 credits over the same time period (tables
1 and 14).
• The percentage of graduates concentrating in the vocational curriculum (taking three or
more courses in a single occupational program area) decreased from 34 percent in 1982
to 25 percent in 1994, a decline of about 25 percent (figure 15; table 15). The percentage
of graduates specializing in the vocational curriculum (taking four or more courses in a
single occupational program area with at least two of those courses beyond the intro-
ductory level) declined more dramatically, from 13 percent in 1982 to 7 percent in 1994,
a decline of about 44 percent.
Figure 15—Percentage distribution of public high school graduates according to their curriculum Figure 15—specialization in high school: 1982, 1990, and 1994
*Includes students who completed both a vocational concentration and a college preparatory curriculum.
NOTE: Percentages may not add to 100 due to rounding.
SOURCE: U.S. Department of Education, National Center for Education Statistics, High School and Beyond SophomoreCohort 1982 High School Transcript Study and 1990 and 1994 National Assessment of Educational Progress High School Transcript Studies.
8
34
58
26 28
46
3225
42
0
20
40
60
80
100
College preparatory only Vocational concentrators total* Other/general
1982 1990 1994
Percent

IV. Trends in Secondary Vocational Education
52
Table 15—Percentage of public high school graduates concentrating (accumulating 3 or more credits)Table 15—and specializing (accumulating 4 or more credits with 2 or more of those credits beyond theTable 15—introductory level) in vocational programs: 1982, 1990, and 1994
Vocational completers 1982 1990 1994
Concentrators 33.7 27.8 25.4 Specialists 12.6 7.7 7.0
SOURCE: U.S. Department of Education, National Center for Education Statistics, High School and Beyond Sophomore Cohort1982 High School Transcript Study and 1990 and 1994 National Assessment of Educational Progress High School TranscriptStudies.
• Trade and industry and business were the most popular occupational programs in 1994—
about 8 percent of graduates concentrated in each of these areas (table 16). These were
also the most popular programs in earlier years; however, the percentage of graduates
concentrating in trade and industry, as well as the percentage concentrating in business,
declined over the period studied. In 1982, about 15 percent of graduates had concen-
trated in trade and industry and 12 percent in business.
• Fewer students concentrated in health care and in technology and communications than
in business and in trade and industry in all the surveyed years from 1982 to 1994 (table
16). However, contrary to business and trade and industry trends, the proportions of stu-
dents who concentrated in health care and in technology and communications increased
between 1982 and 1994.51
CHARACTERISTICS OF STUDENTS PARTICIPATING INVOCATIONAL EDUCATION
Although participation in the specific occupational curriculum declined for most groups of
students between 1982 and 1994, there were a few exceptions to this trend. The percentage of
black and Asian/Pacific Islander students concentrating in vocational education stayed about the
same over this period, and the concentration rate of students with disabilities increased.52 In ad-
dition, the average number of specific occupational credits earned by blacks stayed about the
same and increased for Asians/Pacific Islanders and students with disabilities. The increase in
participation of students with disabilities is consistent with the emphasis of the 1990 Perkins Act
on serving students with special needs.
51For the health program area, the increase occurred primarily between 1990 and 1994.52For simplicity’s sake, this report refers to “black, non-Hispanic” students as “black” and “white, non-Hispanic” students as“white.” However, it should be remembered that all Hispanic students, regardless of race, are included in the Hispanic group.

Table 16—Percentage of public high school graduates concentrating (accumulating 3 or more credits) in various vocational programs: 1982, 1990,Table 16—and 1994
Agriculture Technologyand Marketing Public and and Personal Food Child care
renewable and Health protective Trade and communi- and other service and andYear resources Business distribution care services industry cations Total services hospitality education
1982 2.8 11.6 1.8 0.6 0.0 14.8 0.5 1.7 1.3 0.2 0.21990 2.5 8.4 2.1 0.6 0.0 11.2 0.8 2.0 1.3 0.5 0.31994 3.2 7.7 2.2 1.0 0.0 8.5 0.9 2.0 1.1 0.4 0.6
NOTE: Estimates appearing as 0.0 may be nonzero but less than 0.05.
SOURCE: U.S. Department of Education, National Center for Education Statistics, High School and Beyond Sophomore Cohort 1982 High School Transcript Study and 1990and 1994 National Assessment of Educational Progress High School Transcript Studies.
Occupational home economics

IV. Trends in Secondary Vocational Education
54
In all the surveyed years from 1982 to 1994, male students, students in rural schools, and
students with lower grade-point averages (GPAs) completed more specific occupational course-
work and were more likely to be vocational concentrators than female students, students in urban
and suburban schools, and students with higher GPAs.
Participation in Vocational Education Overall
Although the decline in vocational coursetaking between 1982 and 1994 was apparent for
most groups, the decline was steeper for females than males and for Hispanics than other racial–
ethnic groups. In contrast, students with disabilities increased their vocational coursetaking over
this period.
• In 1994, both male and female public high school graduates earned approximately 24
credits in total coursework (table 17). Females averaged about 18 credits in academic
classes, whereas males averaged 17. Both females and males increased their academic
coursework from 1982 to 1994. However, the rate of increase was faster for female high
school graduates than for their male counterparts, resulting in a greater gender difference
in academic course completion in 1994 than in 1982. The number of vocational credits
completed by both male and female public high school graduates decreased between
1982 and 1994. Although males and females completed about the same amount of voca-
tional coursework in 1982, the number of vocational credits earned by females decreased
at a faster rate than that of male graduates from 1982 to 1994. Consequently, males
earned more vocational credits than females in 1994, completing 4.1 credits versus 3.8
for females.
• In all the surveyed years from 1982 to 1994, Asian/Pacific Islander students completed
fewer courses in the vocational curriculum than did students of other race–ethnicities
(table 18). Asians/Pacific Islanders earned about 3.0 vocational credits in 1994, while
other students completed between 3.9 and 4.3 credits, on average. Hispanic students
completed more vocational credits than white students in 1982; however, the two groups
completed similar amounts in 1990 and 1994.53 All students, despite their race–ethnicity,
decreased the amount of vocational coursework they completed between 1982 and 1994.
During this period, Hispanics had the sharpest decline in the amount of vocational
coursework completed.
53The data show no other significant differences among racial–ethnic groups pertaining to the completion of vocational credits in1982, 1990, and 1994.

IV. Trends in Secondary Vocational Education
55
Table 17—Average number of Carnegie units accumulated by public high school graduates, by type ofTable 17—coursework and sex: 1982, 1990, and 1994
Type of coursework and sex 1982 1990 1994
Total 21.60 23.53 24.17 Male 21.43 23.35 23.99 Female 21.76 23.69 24.34
Academic 14.28 16.66 17.58 Male 14.00 16.17 17.03 Female 14.55 17.10 18.11
Vocational total 4.68 4.19 3.96 Male 4.68 4.32 4.13 Female 4.68 4.08 3.80
Specific labor market preparation 3.03 2.89 2.79 Male 3.43 3.28 3.08 Female 2.66 2.53 2.52
General labor market preparation 0.95 0.73 0.64 Male 0.94 0.70 0.70 Female 0.97 0.76 0.58
Consumer and homemaking education 0.69 0.57 0.52 Male 0.31 0.33 0.35 Female 1.05 0.79 0.70
Enrichment/other 2.64 2.68 2.63 Male 2.75 2.87 2.83 Female 2.53 2.51 2.44
NOTE: Averages may not add to totals due to rounding.
SOURCE: U.S. Department of Education, National Center for Education Statistics, High School and Beyond Sophomore Cohort1982 High School Transcript Study and 1990 and 1994 National Assessment of Educational Progress High School TranscriptStudies.
Table 18—Average number of Carnegie units accumulated by public high school graduates in the vocational Table 18—and specific labor market preparation curricula, by race–ethnicity: 1982, 1990, and 1994
Race–ethnicity 1982 1990 1994 1982 1990 1994
Total 4.68 4.19 3.96 3.03 2.89 2.79
American Indian/Alaskan Native 4.93 4.62 4.26 3.40 3.16 2.84Asian/Pacific Islander 3.31 3.07 3.01 2.01 2.07 2.13Black, non-Hispanic 4.81 4.41 4.29 2.90 2.79 2.94Hispanic 5.26 4.12 3.87 3.30 2.85 2.75White, non-Hispanic 4.59 4.22 3.96 3.02 2.97 2.81
SOURCE: U.S. Department of Education, National Center for Education Statistics, High School and Beyond Sophomore Cohort1982 High School Transcript Study and 1990 and 1994 National Assessment of Educational Progress High School TranscriptStudies.
Vocational total Specific labor market preparation

IV. Trends in Secondary Vocational Education
56
• Students with and without disabilities increased at similar rates the amount of total high
school coursework they completed between 1982 and 1994 (table 19).
However, trends differed by type of coursework.54 Students without disabilities com-
pleted 23 percent more academic credits in 1994 than they had completed in 1982, while
students with disabilities maintained a steady academic course load of about 14 credits.
In contrast, students without disabilities decreased their vocational coursetaking by 17
percent between 1982 and 1994, and students with disabilities increased their vocational
coursework by about 24 percent over the same period. Therefore, although students with
and without disabilities completed similar amounts of vocational coursework in 1982,
54Total coursework includes academic, vocational, and enrichment/other coursework.
Table 19—Average number of Carnegie units accumulated by public high school graduates, by type ofTable 19—coursework and disability status: 1982, 1990, and 1994
Type of coursework and disability status 1982 1990 1994
Total 21.60 23.53 24.17 Has disability 21.32 22.81 24.00 No disability 21.63 23.54 24.18
Academic 14.28 16.66 17.58 Has disability 13.82 13.30 14.43 No disability 14.34 16.74 17.70
Vocational total 4.68 4.19 3.96 Has disability 4.82 6.01 5.99 No disability 4.66 4.14 3.88
Specific labor market preparation 3.03 2.89 2.79 Has disability 3.00 3.88 3.74 No disability 3.03 2.86 2.76
General labor market preparation 0.95 0.73 0.64 Has disability 1.05 1.28 1.45 No disability 0.95 0.72 0.61
Consumer and homemaking education 0.69 0.57 0.52 Has disability 0.77 0.86 0.79 No disability 0.69 0.56 0.51
Enrichment/other 2.64 2.68 2.63 Has disability 2.68 3.50 3.58 No disability 2.63 2.66 2.60
NOTE: Averages may not add to totals due to rounding.
SOURCE: U.S. Department of Education, National Center for Education Statistics, High School and Beyond Sophomore Cohort 1982High School Transcript Study and 1990 and 1994 National Assessment of Educational Progress High School Transcript Studies.

IV. Trends in Secondary Vocational Education
57
students with disabilities completed significantly more vocational credits than students
without disabilities in 1990 and 1994. In fact, students with disabilities completed 54
percent more vocational credits in 1994 than students without disabilities. Students with
disabilities also completed increasing numbers of enrichment/other credits throughout
this period. In 1994, students with disabilities averaged 3.6 enrichment/other credits
upon graduation, and students without disabilities earned 2.6 credits.
• In all the years surveyed, there was a positive relationship between graduates’ GPAs and
the total amount of coursework they completed (table 20). That is, graduates with higher
GPAs completed more total coursework. Similarly, there was a positive association be-
tween GPA and academic coursetaking. Conversely, during this period, students with
lower GPAs generally completed more vocational credits.
• In all the years surveyed, students graduating from rural high schools completed more
vocational coursework than graduates of urban and suburban public high schools (table
21). These differences in vocational coursetaking remained relatively constant between
1982 and 1994.
Participation in Specific Occupational Programs
While specific occupational coursetaking declined for most groups between 1982 and 1994,
it stayed about the same for blacks and for rural high school graduates. In addition, the number of
specific occupational credits earned by Asians/Pacific Islanders and students with disabilities in-
creased over the period studied.
• In 1994, male public high school graduates earned 22 percent more specific occupational
credits than their female peers (table 17). This gender gap remained relatively constant
between 1982 and 1994.
• Asian/Pacific Islander graduates increased their specific occupational coursetaking be-
tween 1982 and 1994 (table 18). Despite this increase, Asian/Pacific Islander graduates
completed fewer specific occupational credits than students of other race–ethnicities in
all the years studied. American Indian/Alaskan Native, Hispanic, and white graduates all
completed fewer specific occupational credits in 1994 than they had in 1982, with the
number of specific occupational credits earned by Hispanics decreasing at a faster rate
than that of whites. Black students earned about the same number of specific occupa-
tional credits in all 3 years.

IV. Trends in Secondary Vocational Education
58
Table 20—Average number of Carnegie units accumulated by public high school graduates, by grade pointTable 20—average (GPA) and type of coursework: 1982, 1990, and 1994
GPA and type of coursework 1982 1990 1994
Total 21.60 23.53 24.17 GPA 3.3 or more 22.93 24.66 25.35 2.6–3.29 22.05 23.99 24.62 1.6–2.59 21.08 22.99 23.39 Less than 1.6 19.60 21.35 21.58
Academic GPA 3.3 or more 16.90 19.25 20.09 2.6–3.29 14.88 17.48 18.13 1.6–2.59 13.21 15.39 16.08 Less than 1.6 12.30 13.85 14.22
Vocational total GPA 3.3 or more 3.44 2.79 2.77 2.6–3.29 4.46 3.82 3.84 1.6–2.59 5.25 4.89 4.62 Less than 1.6 4.88 4.97 4.78
Specific labor market preparation GPA 3.3 or more 2.11 1.90 1.95 2.6–3.29 2.89 2.61 2.70 1.6–2.59 3.44 3.40 3.28 Less than 1.6 3.15 3.40 3.33
General labor market preparation GPA 3.3 or more 0.80 0.57 0.49 2.6–3.29 0.90 0.71 0.64 1.6–2.59 1.05 0.81 0.71 Less than 1.6 0.93 0.73 0.76
Consumer and homemaking education GPA 3.3 or more 0.53 0.32 0.33 2.6–3.29 0.66 0.51 0.51 1.6–2.59 0.76 0.68 0.62 Less than 1.6 0.80 0.85 0.69
Enrichment/other GPA 3.3 or more 2.58 2.62 2.50 2.6–3.29 2.72 2.69 2.65 1.6–2.59 2.63 2.71 2.69 Less than 1.6 2.42 2.53 2.58
NOTE: Averages may not add to totals due to rounding.
SOURCE: U.S. Department of Education, National Center for Education Statistics, High School and Beyond Sophomore Cohort1982 High School Transcript Study and 1990 and 1994 National Assessment of Educational Progress High School TranscriptStudies.

IV. Trends in Secondary Vocational Education
59
• Graduates with disabilities increased the number of specific occupational credits they
earned by 25 percent between 1982 and 1994 (table 19). Over the same period, graduates
without disabilities completed 9 percent fewer of these credits. These contrasting trends
led to a gap in specific occupational credits earned in 1994, with students who had dis-
abilities earning 36 percent more credits than students without disabilities.
• In all the years surveyed from 1982 to 1994, graduates who earned higher GPAs com-
pleted fewer specific occupational credits than graduates with lower GPAs (table 20).
• Students graduating from rural public high schools in 1982, 1990, and 1994 completed
more specific occupational courses than students graduating from either urban or subur-
ban schools (table 21). The amount of specific occupational coursework students gradu-
ating from urban and suburban schools completed decreased between 1982 and 1994,
with a steeper decline for urban graduates than for suburban ones. Students graduating
from rural schools, however, did not significantly change their specific occupational
course-taking patterns over the years studied.
Concentration in Vocational Education
While rates of concentration in vocational education declined for most groups between
1982 and 1994, they stayed about the same for blacks and Asians/Pacific Islanders and increased
for students with disabilities.
• The percentage of graduates concentrating in the vocational curriculum (taking three or
more courses in a single occupational program area) decreased over time for both male
and female students (table 22). Rates of vocational concentration decreased uniformly
Table 21—Average number of Carnegie units accumulated by public high school graduates in the vocational Table 21—and specific labor market preparation curricula, by school urbanicity: 1982, 1990, and 1994
School urbanicity 1982 1990 1994 1982 1990 1994
Total 4.68 4.19 3.96 3.03 2.89 2.79
Rural 5.23 4.66 4.68 3.32 3.22 3.25Urban 4.28 3.66 3.34 2.83 2.52 2.39Suburban 4.46 3.98 3.47 2.91 2.69 2.52
SOURCE: U.S. Department of Education, National Center for Education Statistics, High School and Beyond Sophomore Cohort1982 High School Transcript Study and 1990 and 1994 National Assessment of Educational Progress High School TranscriptStudies.
Specific labor market preparationVocational total

IV. Trends in Secondary Vocational Education
60
across rural, suburban, and urban schools. The percentage of graduates specializing in
the vocational curriculum (completing four or more courses in a single occupational pro-
gram area, with at least two of those courses beyond the introductory level) decreased for
all categories of gender, GPA, and school urbanicity.
• In 1994, 29 percent of male public high school graduates were vocational concentrators,
compared with 22 percent of female graduates (table 22). About 9 percent of males were
vocational specialists, compared with about 6 percent of females. These 1994 gender
disparities in vocational concentration and specialization are similar to the gender gaps
in 1982 and 1990.
Table 22—Percentage of public high school graduates concentrating (accumulating 3 or more credits)Table 23—and specializing (accumulating 4 or more credits with 2 or more of those credits beyond theTable 23—introductory level) in vocational programs, by selected student and school characteristics:Table 23—1982, 1990, and 1994
Selected student and Vocational concentrators Vocational specialistsschool characteristics 1982 1990 1994 1982 1990 1994
Total 33.7 27.8 25.4 12.6 7.7 7.0
Sex Male 39.0 32.3 28.8 14.9 9.2 8.5 Female 28.7 23.6 22.2 10.5 6.4 5.6
Race–ethnicity American Indian/Alaskan Native 46.6 38.0 20.9 6.2 12.4 2.5 Asian/Pacific Islander 17.3 16.6 14.2 5.0 1.4 3.8 Black, non-Hispanic 32.7 27.3 29.0 11.7 7.8 8.2 Hispanic 37.7 27.9 24.9 13.2 7.2 6.5 White, non-Hispanic 33.2 28.5 25.3 12.9 8.1 7.1
Disability status Has disability 31.5 42.2 41.3 12.9 10.4 12.4 No disability 33.8 27.4 24.8 12.6 7.6 6.8
Grade point average 3.3 or more 19.8 13.6 14.6 7.4 3.0 2.8 2.6–3.29 30.9 23.8 23.9 12.3 6.4 6.6 1.6–2.59 40.3 35.1 31.8 14.5 10.2 9.5 Less than 1.6 36.1 34.7 31.8 13.9 9.6 7.8
School urbanicity Rural 38.3 32.1 31.9 13.7 8.5 9.1 Suburban 31.8 26.5 22.3 12.7 10.4 6.5 Urban 30.7 22.6 19.3 10.6 5.9 4.9
SOURCE: U.S. Department of Education, National Center for Education Statistics, High School and Beyond Sophomore Cohort1982 High School Transcript Study and 1990 and 1994 National Assessment of Educational Progress High School TranscriptStudies.

IV. Trends in Secondary Vocational Education
61
• Hispanics, American Indians/Alaskan Natives, and whites all decreased their rates of vo-
cational concentration in public high school during the time period studied (table 22).
Black graduates, as well as Asian/Pacific Islander graduates, did not significantly change
their concentration rates over the years. In 1994, 29 percent of black students concen-
trated in vocational education, compared with about 25 percent of white and Hispanic
students, 21 percent of American Indian/Alaskan Native students, and 14 percent of
Asian/Pacific Islander students.
• Rates of specializing in vocational education (taking four or more courses in a single oc-
cupational program area, with at least two of those courses beyond the introductory
level) declined among black, Hispanic, and white graduates between 1982 and 1994 (ta-
ble 22). On the other hand, there was no consistent trend in the specialization rate for
American Indians/Alaskan Natives during the 3 years studied, although their rate of spe-
cialization in vocational education declined significantly between 1990 and 1994. The
specialization rate for Asians/Pacific Islanders did not change significantly over the
1982–1994 period. In 1994, American Indian/Alaskan Native and Asian/Pacific Islander
graduates were generally less likely than graduates from all other racial–ethnic groups to
specialize in vocational education.55
• Students with disabilities increased their rates of concentration in the vocational cur-
riculum from 32 to 41 percent during the years studied (table 22). Conversely, rates of
vocational concentration declined steadily among students without disabilities, from 34
percent in 1982 to 25 percent in 1994. The rate at which students without disabilities
specialized in the vocational curriculum also decreased by almost one-half, from 13 per-
cent in 1982 to 7 percent in 1994. Rates of vocational specialization among students with
disabilities remained relatively similar over the years studied.
• Public high school graduates with GPAs of 1.6 or higher had decreasing rates of con-
centration in the vocational curriculum between 1982 and 1994 (table 22). Students with
GPAs of less than 1.6 were about equally likely to concentrate in vocational education
during all of the years studied, with approximately one-third concentrating in vocational
education in each year. In 1994, 15 percent of students with GPAs of 3.3 or higher con-
centrated in vocational education, and 3 percent of such students were vocational spe-
cialists. These rates of concentration and specialization were significantly lower than the
rates for students earning lower GPAs. For example, in 1994, 32 percent of students with 55The difference in specialization rates for Asians/Pacific Islanders and Hispanics was not statistically significant.

IV. Trends in Secondary Vocational Education
62
GPAs between 1.6 and 2.59 concentrated in vocational education, and 10 percent of such
students were vocational specialists.
• In all 3 years studied, students graduating from rural public high schools were more
likely to concentrate in vocational education than students graduating from suburban and
urban schools (table 22).56 In 1994, about 32 percent of rural graduates in comparison
with 22 percent of suburban and 19 percent of urban graduates concentrated in voca-
tional education.
ACADEMIC COURSETAKING AND ACHIEVEMENT
Academic Course-Taking Trends
The academic preparation of students participating in vocational education increased be-
tween 1982 and 1994, in both absolute and relative terms. While public high school graduates in
general increased their coursetaking in the core academic subjects (English, mathematics, sci-
ence, and social studies), the rate of increase over the period studied was greater for vocational
concentrators than for either college preparatory or other/general students. However, in 1994, vo-
cational concentrators still completed fewer total credits in each of the core academic subjects
than did either college preparatory or other/general students. Vocational concentrators also gen-
erally increased the rigor of their academic coursework, particularly in mathematics, science, and
social studies.
• The percentage of public high school graduates meeting the “New Basics”57 core aca-
demic standards increased from 13 percent in 1982 to 38 percent in 1990, and then to 50
percent in 1994 (table 23).58
56In 1990, however, the difference in concentration rates between students in rural and suburban schools was not statisticallysignificant.57In the 1983 publication A Nation at Risk, the National Commission on Excellence in Education recommended that high schoolgraduation requirements be strengthened, and that, at a minimum, all students take 4 years of English; 3 years each of mathemat-ics, science, and social studies; and one-half year of computer science. The “core academic standards” referred to in this reportinclude the recommendations for English, mathematics, science, and social studies.58Research on the integration of academic and vocational education indicates that academic knowledge and skills can also belearned via vocational programs—particularly through authentic, real-world applications—as well as via academic coursework.See C. Stasz, T. Kaganoff, and R.A. Eden, Integrating Academic and Vocational Education: A Review of the Literature, 1987–1992 (MDS-1034) (Berkeley: National Center for Research in Vocational Education, March 1995).

IV. Trends in Secondary Vocational Education
63
Table 23—Percentage of public high school graduates meeting the New Basics core academic standards,1
Table 24—by curriculum specialization in high school: 1982, 1990, and 1994
Curriculum specialization andNew Basics core academic standards 1982 1990 1994
All graduates New Basics core academics total 13.0 38.1 50.2 English - 4 years 62.7 83.6 88.6 Mathematics - 3 years 46.1 72.2 81.0 Science - 3 years 29.3 52.0 63.9 Social studies - 3 years 67.8 85.8 89.4
Vocational concentrators total2
New Basics core academics total 5.0 18.5 33.2 English - 4 years 57.7 78.7 88.7 Mathematics - 3 years 29.3 57.1 70.7 Science - 3 years 13.2 29.5 45.1 Social studies - 3 years 62.1 77.4 84.1
Vocational concentrators only New Basics core academics total 4.5 12.2 21.7 English - 4 years 56.9 76.3 86.3 Mathematics - 3 years 28.1 52.3 64.3 Science - 3 years 12.5 23.0 34.4 Social studies - 3 years 61.9 76.5 82.5
Both vocational concentration and college preparatory New Basics core academics total 38.3 74.3 86.0 English - 4 years 100.0 100.0 100.0 Mathematics - 3 years 100.0 100.0 100.0 Science - 3 years 54.1 86.7 94.4 Social studies - 3 years 76.0 84.8 91.4
College preparatory New Basics core academics total 65.4 84.1 90.2 English - 4 years 100.0 100.0 100.0 Mathematics - 3 years 100.0 100.0 100.0 Science - 3 years 86.0 91.5 95.1 Social studies - 3 years 76.8 91.0 94.8
Other/general New Basics core academics total 10.3 24.2 30.1 English - 4 years 60.4 77.3 79.9 Mathematics - 3 years 48.3 65.6 72.8 Science - 3 years 30.6 43.5 51.4 Social studies - 3 years 69.9 87.9 88.6 1The New Basics core academic standards include 4 years of English and 3 years each of mathematics, science, and socialstudies.2This category includes some vocational concentrators who also completed a college preparatory curriculum.
SOURCE: U.S. Department of Education, National Center for Education Statistics, High School and Beyond Sophomore Cohort 1982 High School Transcript Study and 1990 and 1994 National Assessment of Educational Progress High School Transcript Studies.

IV. Trends in Secondary Vocational Education
64
• In 1994, vocational concentrators were less likely than graduates completing a college
preparatory curriculum to meet the core academic standards (33 versus 90 percent), but
were just as likely as graduates completing general coursework to do so (33 versus 30
percent) (table 23; figure 16).59 The percentage of vocational concentrators meeting
these standards increased from 5 percent in 1982. The percentage of vocational concen-
trators meeting the core academic standards in 1994 was about six times the percentage
in 1982, compared with an increase of about three times for other/general students and of
about 38 percent for college preparatory students.
59It should be remembered that these three high school groups were classified based on their high school course-taking histories.While the “New Basics” academic standards and college preparatory criteria used in this publication were similar, the overlapbetween them was not complete (90 percent of college preparatory students fulfilled the New Basics standards). (See the collegepreparatory criteria described at the beginning of this chapter.) Since students who met both the vocational concentrator and col-lege preparatory criteria were included in the vocational group, all vocational concentrators could meet the New Basics stan-dards, at least theoretically. However, since the general group was the residual group that met neither the vocational nor collegepreparatory criteria, this group might be less likely to meet the New Basics academic standards.
Figure 16—Percentage of public high school graduates meeting the New Basics core academic standards,1
Figure 16—by curriculum specialization in high school: 1982, 1990, and 1994
1The New Basics core academic standards include 4 years of English and 3 years each of mathematics, science, and socialstudies.2Includes students who completed both a vocational concentration and a college preparatory curriculum.
SOURCE: U.S. Department of Education, National Center for Education Statistics, High School and Beyond SophomoreCohort 1982 High School Transcript Study and 1990 and 1994 National Assessment of Educational Progress High School Transcript Studies.
65
510
84
1924
90
33 30
0
20
40
60
80
100
College preparatory only Vocational concentrators total Other/general
1982 1990 1994
Percent
2

IV. Trends in Secondary Vocational Education
65
• The percentage of vocational concentrators completing the science standard increased
from 13 to 45 percent between 1982 and 1994 (table 23). However, vocational concen-
trators were least likely to meet the science standard than any other core academic stan-
dard in 1994. While 45 percent of vocational concentrators met the science standard in
1994, 71 percent met the mathematics standard, 84 percent the social studies standard,
and 89 percent the English standard. Students who completed general coursework in
high school were also least likely to meet the science standard versus other standards.
• The percentage of public high school graduates completing both a vocational concentra-
tion and a college preparatory curriculum increased seven and a half times, from 0.6 in
1982 to 4.5 percent in 1994 (table 24). The percentage of graduates completing neither a
vocational concentration nor a college preparatory curriculum decreased from about 58
percent in 1982 to 42 percent in 1994. In 1994, more students still completed general
coursework in high school than completed either a vocational concentration or a college
preparatory curriculum.
Table 24—Percentage distribution of public high school graduates according to curriculum specialization inTable 25—high school: 1982, 1990, and 1994
Curriculum specialization 1982 1990 1994
Total 100.0 100.0 100.0
College preparatory only 8.1 25.9 32.2 Vocational concentrators total* 33.7 27.8 25.4 Vocational concentration only 33.1 25.0 20.9 Both vocational concentration and college preparatory 0.6 2.8 4.5 Other/general 58.2 46.3 42.4
*Includes students who completed both a vocational concentration and a college preparatory curriculum.
NOTE: Percentages may not add to 100 due to rounding.
SOURCE: U.S. Department of Education, National Center for Education Statistics, High School and Beyond Sophomore Cohort1982 High School Transcript Study and 1990 and 1994 National Assessment of Educational Progress High School TranscriptStudies.

IV. Trends in Secondary Vocational Education
66
• The average number of credits vocational concentrators earned in English increased from
3.8 to 4.2 between 1982 and 1994, an increase of about 10 percent (table 25). However,
the share of all English credits vocational concentrators earned in low-level courses also
increased over this period.
Table 25—Average number of credits earned by public high school graduates in English, and the percentageTable 26—of total English coursework earned in low-level courses (language skills, functional, and basicTable 26—English), by curriculum specialization in high school: 1982, 1990, and 1994
Total Low-level Percent of total English Curriculum specialization English credits English credits credits that are low-level1
1982
All graduates 3.93 0.36 8.8
Vocational concentrators total2 3.79 0.40 10.5 Vocational concentrators only 3.79 0.41 10.6 Both vocational concentration and college preparatory 4.21 0.16 3.4 College preparatory 4.43 0.20 4.4 Other/general 3.95 0.35 8.5
1990
All graduates 4.19 0.40 9.2
Vocational concentrators total2 4.02 0.57 13.8 Vocational concentrators only 4.00 0.63 5.6 Both vocational concentration and college preparatory 4.21 0.07 0.8 College preparatory 4.37 0.06 1.4 Other/general 4.19 0.48 10.7
1994
All graduates 4.29 0.40 8.9
Vocational concentrators total2 4.16 0.51 11.9 Vocational concentrators only 4.13 0.60 13.9 Both vocational concentration and college preparatory 4.26 0.12 2.8 College preparatory 4.42 0.15 3.3 Other/general 4.26 0.52 11.4 1These percentages are the average rates calculated for each student in the population.2This category includes some vocational concentrators who also completed a college preparatory curriculum.
SOURCE: U.S. Department of Education, National Center for Education Statistics, High School and Beyond Sophomore Cohort1982 High School Transcript Study and 1990 and 1994 National Assessment of Educational Progress High School TranscriptStudies.

IV. Trends in Secondary Vocational Education
67
• The number of credits vocational concentrators earned in U.S. and World History in-
creased from 1.4 in 1982 to 1.7 in 1994, an increase of about 24 percent (table 26).
Table 26—Average number of Carnegie units accumulated by public high school graduates in social studies,Table 27—by curriculum specialization in high school and type of social studies coursework: 1982, 1990, andTable 27—1994
Curriculum specializationand type of coursework 1982 1990 1994
All graduates Total social studies 3.14 3.47 3.55 U.S./world history 1.41 1.68 1.74
Vocational concentrators total* Total social studies 3.00 3.19 3.30 U.S./world history 1.35 1.62 1.67
Vocational concentrators only Total social studies 3.00 3.18 3.26 U.S./world history 1.34 1.59 1.64
Both vocational concentration and college preparatory Total social studies 3.18 3.33 3.47 U.S./world history 1.59 1.89 1.79
College preparatory Total social studies 3.37 3.61 3.69 U.S./world history 1.73 1.87 1.86
Other/general Total social studies 3.19 3.57 3.60 U.S./world history 1.41 1.61 1.69
*This category includes some vocational concentrators who also completed a college preparatory curriculum.
SOURCE: U.S. Department of Education, National Center for Education Statistics, High School and Beyond Sophomore Cohort1982 High School Transcript Study and 1990 and 1994 National Assessment of Educational Progress High School TranscriptStudies.

IV. Trends in Secondary Vocational Education
68
• The percentage of all graduates taking Algebra 1 in high school increased from 59 per-
cent in 1982 to 69 percent in 1994, an increase of 17 percent (table 27). Over the same
period, the percentage of vocational concentrators taking this subject increased from 52
to 67 percent, an increase of 29 percent. The total number of credits vocational concen-
trators earned in mathematics increased steadily from 2.3 in 1982 to 3.0 in 1994 (table
28). The number of credits earned in courses below the Algebra 1 level increased from
.95 in 1982 to 1.2 in 1990, and then fell again to .95 in 1994. The share of total mathe-
matics credits that these below-algebra credits represented fell steadily from 47 percent
in 1982, to 44 percent in 1990, to 35 percent in 1994.
Table 27—Percentage of high school graduates completing coursework in mathematics, by curriculumTable 28—specialization in high school and type of mathematics coursework: 1982, 1990, and 1994
Curriculum specializationand type of coursework 1982 1990 1994
All graduates Total mathematics 99.7 100.0 100.0 Algebra I 58.5 66.0 69.0
Vocational concentrators total* Total mathematics 99.5 100.0 99.9 Algebra I 51.8 58.8 66.6
Vocational concentration only Total mathematics 99.5 100.0 99.9 Algebra I 51.3 56.6 64.6
Both vocational concentration and college preparatory Total mathematics 100.0 100.0 100.0 Algebra I 81.5 77.7 75.7
College preparatory Total mathematics 100.0 100.0 100.0 Algebra I 73.7 72.6 71.2
Other/general Total mathematics 99.7 100.0 100.0 Algebra I 60.2 66.6 68.8
*This category includes some vocational concentrators who also completed a college preparatory curriculum.
SOURCE: U.S. Department of Education, National Center for Education Statistics, High School and Beyond Sophomore Cohort1982 High School Transcript Study and 1990 and 1994 National Assessment of Educational Progress High School TranscriptStudies.

IV. Trends in Secondary Vocational Education
69
Table 28—Average number of credits earned by public high school graduates in mathematics, and theTable 29—percentage of total mathematics coursework earned in below-algebra courses, by curriculumTable 29—specialization in high school: 1982, 1990, and 1994
Percent of totalTotal Below- mathematics credits
Curriculum specialization mathematics credits algebra credits that are below-algebra1
1982
All graduates 2.62 0.83 37.3
Vocational concentrators total2 2.25 0.95 46.8 Vocational concentration only 2.23 0.97 47.6 Both vocational concentration and college preparatory 3.52 0.13 3.2 College preparatory 3.84 0.15 3.4 Other/general 2.66 0.85 36.6
1990
All graduates 3.15 0.81 29.5
Vocational concentrators total2 2.80 1.15 44.4 Vocational concentration only 2.70 1.26 49.0 Both vocational concentration and college preparatory 3.67 0.15 3.7 College preparatory 3.79 0.12 2.9 Other/general 3.00 0.99 35.3
1994
All graduates 3.33 0.68 23.4
Vocational concentrators total2 3.01 0.95 34.6 Vocational concentration only 2.87 1.14 41.6 Both vocational concentration and college preparatory 3.70 0.10 2.5 College preparatory 3.86 0.11 2.6 Other/general 3.12 0.96 32.5 1These percentages are the average rates calculated for each student in the population.2This category includes some vocational concentrators who also completed a college preparatory curriculum.
SOURCE: U.S. Department of Education, National Center for Education Statistics, High School and Beyond Sophomore Cohort1982 High School Transcript Study and 1990 and 1994 National Assessment of Educational Progress High School TranscriptStudies.

IV. Trends in Secondary Vocational Education
70
• During this same period, the number of credits vocational concentrators earned in biol-
ogy, chemistry, and physics rose from .96 to 1.6, an increase of 68 percent (table 29). In
1994, vocational concentrators completed, on average, one biology course. In addition,
about one in three vocational concentrators completed a chemistry course in 1994, and
one in eight, a physics course (table 30). The proportion of science credits vocational
concentrators earned that were at the basic level decreased steadily from 37 percent in
1982, to 24 percent in 1990, to 21 percent in 1994 (table 29).
Academic Achievement Gains
As discussed in the Introduction to this report, the purpose of vocational education has
broadened over the last 15 years to include increasing the academic achievement of students par-
ticipating in vocational programs. In addition to improving the rigor of the academic courses that
students in vocational programs take, education reformers advocate strengthening the academic
content of vocational coursework.60 This section of the report examines the academic achieve-
ment gains of 1992 public high school graduates. These gains were measured using mathematics,
reading, and science test scores in the 8th, 10th, and 12th grades. Composite test results combin-
ing scores for all three subjects were also examined.
Since the relationship between academic achievement and participation in the vocational
curriculum is complex, results must be interpreted cautiously. Descriptive analyses typically find
that increased vocational coursetaking is associated with lower academic achievement.61 How-
ever, attributing this lower achievement to participation in the vocational curriculum could be
misleading. An alternate explanation for the inverse association between achievement and voca-
tional program participation is that, at least historically, lower-achieving students have opted or
been encouraged to follow a vocational program of study in high school. Thus, the gap in aca-
demic achievement between vocational concentrators and other students may be attributed, at
least partly, to their initial differences in achievement. Moreover, these initially low-achieving
students are likely to complete less rigorous academic coursework during high school than their
60Education research has shown that applied learning can contribute to academic achievement. For example, in a regressionanalysis using HS&B data, Meyer found that courses incorporating applied mathematics content, including mathematically rele-vant vocational courses, contributed positively to students’ mathematics achievement gains between the 10th and 12th grades.Rasinski, on the other hand, did not find that vocational coursework contributed to academic gains, although he used differentequation specifications than Meyer. See R. Meyer, “Applied Versus Traditional Mathematics: New Econometric Models of theContribution of High School Courses to Mathematics Proficiency” (Discussion paper no. 966-92) (Madison: University of Wis-consin-Madison, 1992); K. Rasinski and S. Pedlow, “Using Transcripts to Study the Effectiveness of Vocational Education,”Journal of Vocational Education Research 19 (3) (1994): 23–44.61See, for example, A. McCormick, J. Tuma, and J. Houser, Vocational Course Taking and Achievement: An Analysis of HighSchool Transcripts and 1990 NAEP Assessment Scores (Washington, D.C.: U.S. Department of Education, National Center forEducation Statistics, 1995).

IV. Trends in Secondary Vocational Education
71
Table 29—Average number of credits earned by public high school graduates in science, and the percentageTable 30—of total science coursework earned at the basic level, by curriculum specialization in high school:Table 30—1982, 1990, and 1994
Biology, Percent ofTotal chemistry, Basic-level total science
Curriculum specialization science physics Biology science credits earnedand type of coursework credits credits credits credits at basic level1
1982
All graduates 2.17 1.42 0.93 0.62 32.0
Vocational concentrators total2 1.74 0.96 0.73 0.59 36.5 Vocational concentration only 1.72 0.93 0.73 0.59 36.8 Both vocational concentration and college preparatory 2.81 2.41 1.18 0.64 20.8 College preparatory 3.56 2.95 1.37 0.72 20.6 Other/general 2.23 1.48 0.98 0.62 31.1
1990
All graduates 2.75 1.90 1.14 0.45 18.7
Vocational concentrators total2 2.26 1.34 1.00 0.50 23.8 Vocational concentration only 2.15 1.19 0.97 0.51 25.1 Both vocational concentration and college preparatory 3.30 2.63 1.24 0.39 11.9 College preparatory 3.56 2.91 1.33 0.30 8.7 Other/general 2.60 1.67 1.12 0.50 21.2
1994
All graduates 3.04 2.15 1.26 0.46 16.9
Vocational concentrators total2 2.59 1.61 1.13 0.50 20.9 Vocational concentration only 2.39 1.38 1.09 0.54 23.3 Both vocational concentration and college preparatory 3.49 2.68 1.32 0.35 9.8 College preparatory 3.78 3.07 1.46 0.35 9.6 Other/general 2.76 1.78 1.18 0.51 20.0 1These percentages are the average rates calculated for each student in the population.2This category includes some vocational concentrators who also completed a college preparatory curriculum.
SOURCE: U.S. Department of Education, National Center for Education Statistics, High School and Beyond Sophomore Cohort1982 High School Transcript Study and 1990 and 1994 National Assessment of Educational Progress High School TranscriptStudies.

IV. Trends in Secondary Vocational Education
72
higher-achieving peers, thereby compounding their academic disadvantage and possibly widen-
ing the achievement gap.
Using the National Education Longitudinal Study of 1988 (NELS:88), it was possible to
examine the relationship between students’ achievement in the 8th grade and their subsequent
coursetaking in high school. The analysis found that lower-achieving 8th graders were more
likely to become vocational concentrators in high school than their higher-achieving counter-
parts. For example, 33 percent of 1992 public high school graduates who scored in the lowest
composite test quartile in the 8th grade became vocational concentrators only (not also complet-
ing the college preparatory criteria), in comparison with 8 percent of graduates who scored in the
highest 8th-grade composite test quartile—a difference of a factor of 4 (table 31). Thus, there is
Table 30—Percentage of public high school graduates completing coursework in chemistry and physics, byTable 31—curriculum specialization in high school: 1982, 1990, and 1994
Curriculum specializationand type of coursework 1982 1990 1994
All graduates Chemistry 31.5 49.7 57.4 Physics 16.7 23.1 27.4
Vocational concentrators total* Chemistry 15.0 24.6 34.6 Physics 7.8 9.7 13.0
Vocational concentrators only Chemistry 13.7 17.0 22.7 Physics 7.4 6.6 7.6
Both vocational concentration and college preparatory Chemistry 88.8 92.0 89.6 Physics 29.8 37.4 38.0
College preparatory Chemistry 89.2 94.9 94.1 Physics 53.7 50.4 52.3
Other/general Chemistry 32.9 39.5 43.1 Physics 16.8 16.0 17.1
*This category includes some vocational concentrators who also completed a college preparatory curriculum.
SOURCE: U.S. Department of Education, National Center for Education Statistics, High School and Beyond Sophomore Cohort1982 High School Transcript Study and 1990 and 1994 National Assessment of Educational Progress High School TranscriptStudies.

IV. Trends in Secondary Vocational Education
73
some evidence that lower-achieving students were, in fact, more likely than higher-achieving
students to concentrate in vocational education in high school, at least as of 1992.
There is also evidence that these initial 8th-grade differences in achievement may have
been compounded by differential course-taking patterns in high school. Variations exist in the
amount and rigor of academic courses taken by students completing different types of curricula.
These differences were reflected in the NELS:88 data for 1992 graduates. Vocational concentra-
tors had academic course-taking patterns that were more like those of graduates who completed
general coursework in high school than like those of college preparatory graduates.
For example, vocational concentrators and other/general students were more likely than
their college preparatory peers to take lower-level English courses (such as language skills and
functional and basic courses) (table 32a). Vocational concentrators also completed more mathe-
matics courses at a level lower than Algebra 1 than did both college preparatory and
other/general students (table 32b). Even when controlling for prior achievement—as measured by
8th-grade mathematics test score quartiles—lower-level mathematics coursetaking was generally
dissimilar for these groups of students (figure 17).62
62The difference between vocational concentrators and the general group in terms of the percentage of low-level mathematicscourses taken was not statistically significant for the highest 8th-grade test quartile.
Table 31—Percentage distribution of 1988 8th graders according to subsequent specialization in high school,Table 32—by 8th-grade composite test score quartiles: 1992
Vocational concentratorsCollege Vocational Vocational concen-
preparatory concentration tration and college Other/Test score quartile only Total* only preparatory general
Total 28.5 25.0 21.7 3.4 46.4
1st quartile (lowest) 5.3 33.7 33.2 0.5 61.02nd quartile 14.8 29.3 26.6 2.7 55.83rd quartile 32.6 26.1 21.9 4.3 41.34th quartile (highest) 55.7 12.3 7.6 4.7 32.0
*Includes students who completed both a vocational concentration and a college preparatory curriculum.
NOTE: Percentages may not add to 100 due to rounding.
SOURCE: U.S. Department of Education, National Center for Education Statistics, National Education Longitudinal Studyof 1988, Second Follow-up and High School Transcript Study.

IV. Trends in Secondary Vocational Education
74
Table 32a—Average number of credits earned by 1992 public high school graduates in various EnglishTable 33a—courses and average number and percentage of credits earned in low-level courses,1 by Table 33a—curriculum specialization in high school
Average Percent ofnumber Average Average total
of number of number of creditsCurriculum total advanced low-level that arespecialization credits credits credits low-level2
Total 4.23 0.52 0.37 8.5
College preparatory only 4.40 1.15 0.08 1.7 Vocational concentrators total3 4.10 0.24 0.60 14.5 Vocational concentration only 4.07 0.15 0.67 16.1 Both vocational concentration and college preparatory 4.35 0.88 0.19 4.0 Other/general 4.20 0.28 0.41 9.4 1These include language skills and functional and basic English courses.2These percentages are the average rates calculated for each student in the population.3Includes students who completed both a vocational concentration and a college preparatory curriculum.
SOURCE: U.S. Department of Education, National Center for Education Statistics, National Education Longitudinal Studyof 1988, Second Follow-up and High School Transcript Study.
Table 32b—Average number of credits earned by 1992 public high school graduates in various mathematicsTable 33b—courses and average number and percentage of credits earned in low-level courses,1 by Table 33b—curriculum specialization in high school
Average Average Average Percent ofnumber number number total
of of of creditsCurriculum total precalculus low-level that arespecialization credits credits credits low-level2
Total 3.22 0.82 0.71 25.2
College preparatory only 3.84 1.57 0.10 2.4 Vocational concentrators total3 2.86 0.49 1.02 39.4 Vocational concentration only 2.73 0.33 1.16 45.2 Both vocational concentration and college preparatory 3.71 1.53 0.10 2.4 Other/general 3.04 0.54 0.91 31.6 1These include general and consumer mathematics and pre-algebra courses.2These percentages are the averages rates calculated for each student in the population.3Includes students who completed both a vocational concentration and a college preparatory curriculum.
SOURCE: U.S. Department of Education, National Center for Education Statistics, National Education Longitudinal Studyof 1988, Second Follow-up and High School Transcript Study.

IV. Trends in Secondary Vocational Education
75
In contrast, college preparatory students were more likely to complete more and higher-
level courses in English, mathematics, and science than their vocational and other/general peers
(tables 32a–c). On average, college preparatory students took 3.8 credits in mathematics, 4.4
credits in English, and 3.7 credits in science, while their vocational peers completed 2.9 credits in
mathematics, 4.1 credits in English, and 2.5 credits in science. Furthermore, college preparatory
students earned, on average, 1.6 credits in precalculus, 0.5 credits in physics, and 1.2 credits in
advanced English, whereas vocational concentrators completed 0.5 credits in precalculus, 0.1
credits in physics, and 0.2 credits in advanced English.
Given these differences in initial achievement and academic coursework in high school, a
gap in academic gains would not be unexpected, particularly between the vocational concentrator
and college preparatory groups. In fact, 1992 vocational concentrators did exhibit lower test score
gains in reading, mathematics, and science than their college preparatory peers, but more similar
gains to graduates who completed general coursework in high school (table 33). This was gener-
ally true for 8th- to 10th-grade gains, 10th- to 12th-grade gains, and 8th- to 12th-grade gains.63
63The difference between vocational concentrators and the college preparatory group in terms of test score gains was not statisti-cally significant for reading gains between the 10th and 12th grades. Differences between vocational concentrators and theother/general group were statistically different for 8th- to 10th-grade and 8th- to 12th-grade gains in reading and 10th- to 12th-grade and 8th- to 12th-grade gains in mathematics. Vocational concentrator gains in science were statistically indistinguishablefrom gains in science for the other/general group for all gain years.
Figure 17—Average percentage of credits earned in low-level1 mathematics courses according toFigure 17—8th-grade mathematics test quartiles, by curriculum specialization in high school: 1992
1These include general and consumer mathematics and pre-algebra courses.2Includes students who completed both a vocational concentration and a college preparatory curriculum.
SOURCE: U.S. Department of Education, National Center for Education Statistics, National Education LongitudinalStudy of 1988, Second Follow-up and High School Transcript Study.
124 1
63
34
8
54
26
8
0
10
20
30
40
50
60
70
Lowest quartile Middle two quartiles Highest quartile
College prep Vocational concentrator General/other2Percent

IV. Trends in Secondary Vocational Education
76
Table 32c—Average number of credits earned by 1992 public high school graduates in science and physicsTable 33c—courses, by curriculum specialization in high school
Average Averagenumber number
of ofCurriculum science physicsspecialization credits credits
Total 2.89 0.26
College preparatory only 3.66 0.54Vocational concentrators total* 2.47 0.13 Vocational concentration only 2.30 0.08 Both vocational concentration and college preparatory 3.53 0.44Other/general 2.63 0.16
*Includes students who completed both a vocational concentration and a college preparatory curriculum.
SOURCE: U.S. Department of Education, National Center for Education Statistics, National Education Longitudinal Studyof 1988, Second Follow-up and High School Transcript Study.
Table 33—Average 8–10th, 10–12th, and 8–12th grade test score gains in reading, mathematics, andTable 34—science for 1992 public high school graduates, by curriculum specialization in high school
Curriculum specialization Reading Math Science Reading Math Science Reading Math Science
Total 8.5 14.2 0.2 11.5 11.4 9.3 20.0 25.6 9.4
College preparatory only 10.3 16.7 0.7 12.8 13.2 10.0 23.1 29.8 10.6 Vocational concentrators total* 7.3 12.8 -0.2 10.5 10.2 8.9 17.9 23.0 8.7 Vocational concentration only 6.9 12.3 -0.4 10.3 9.7 8.8 17.2 22.0 8.5 Both vocational concentration and college preparatory 9.8 15.9 0.7 11.6 12.8 9.3 21.6 28.5 10.1 Other/general 8.0 13.3 0.0 11.0 10.9 9.0 19.0 24.1 9.1
*Includes students who completed both a vocational concentration and a college preparatory curriculum.
NOTE: Estimates appearing as 0.0 may be nonzero but less than 0.05.
SOURCE: U.S. Department of Education, National Center for Education Statistics, National Education Longitudinal Studyof 1988, Second Follow-up and High School Transcript Study.
8–10th 10–12th 8–12th

IV. Trends in Secondary Vocational Education
77
The usual statistical method for attempting to control for and separate out the various fac-
tors contributing to academic achievement—multivariate regression analysis—was beyond the
scope of this study. However, this analysis attempted to reduce in two ways the bias that may be
due to vocational concentrators having lower initial academic achievement. First, by examining
gains at two or more points in time, rather than achievement at a single point in time, the analysis
effectively controlled for those characteristics that are consistent over time.64 Second, the analy-
sis used three-way tables to control for prior academic achievement as measured by the student’s
8th-grade test quartile. However, despite this partial control for prior achievement, many differ-
ences among the vocational concentrator, college preparatory, and other/general groups remained
statistically significant (tables 34–36). For example, among students who were in the middle two
test quartiles in the 8th grade, vocational concentrators gained 18 test score points in reading and
23 in mathematics by the 12th grade, in comparison with 19 and 24 points for other/general stu-
dents and 22 and 29 points for college preparatory students, in reading and mathematics, respec-
tively (figure 18).65
64For example, a gains analysis should control for initial academic achievement differences. However, it does not control foreffects that might accrue over time due to those initial differences—such as different high school course-taking patterns resultingfrom 8th-grade achievement differences.65The 18-point reading gain for vocational concentrators and the 19-point reading gain for other/general students were not sta-tistically different.
Table 34—Average 8–10th, 10–12th, and 8–12th grade test score gains in mathematics for 1992 publicTable 35—high school graduates according to 8th-grade mathematics test score quartiles, by curriculumTable 35—specialization in high school
Curriculum specialization 8–10th 10–12th 8–12th 8–10th 10–12th 8–12th 8–10th 10–12th 8–12th
Total 11.9 9.0 20.8 14.0 11.0 25.1 15.9 13.5 29.2
College preparatory only 16.0 11.6 27.6 17.0 11.9 29.2 16.4 14.2 30.5Vocational concentrators total* 10.7 8.6 19.3 12.9 10.2 22.9 14.9 12.4 27.6 Vocational concentration only 10.6 8.5 19.0 12.5 9.9 22.3 14.4 11.6 26.4 Both vocational concentration and college preparatory — — — 15.9 12.0 27.4 16.0 13.7 29.8Other/general 12.0 8.9 20.7 13.2 11.0 24.3 15.3 12.9 27.5
—Too few sample observations for a reliable estimate.*Includes students who completed both a vocational concentration and a college preparatory curriculum.
SOURCE: U.S. Department of Education, National Center for Education Statistics, National Education Longitudinal Studyof 1988, Second Follow-up and High School Transcript Study.
Lowest quartile Middle two quartiles Highest quartile

IV. Trends in Secondary Vocational Education
78
Table 35—Average 8–10th, 10–12th, and 8–12th grade test score gains in reading for 1992 publicTable 36—high school graduates according to 8th-grade reading test score quartiles, by curriculumTable 36—specialization in high school
Curriculum specialization 8–10th 10–12th 8–12th 8–10th 10–12th 8–12th 8–10th 10–12th 8–12th
Total 6.9 9.4 16.6 8.2 11.2 19.5 10.1 13.2 23.0
College preparatory only 9.2 10.4 19.9 9.9 12.0 21.9 10.8 13.6 24.4Vocational concentrators total* 6.6 8.8 15.7 7.3 10.8 18.0 8.5 12.4 21.0 Vocational concentration only 6.4 8.8 15.5 7.0 10.7 17.6 7.7 12.2 19.9 Both vocational concentration and college preparatory 12.8 — 19.9 8.8 11.2 20.5 10.4 13.0 23.6Other/general 6.9 9.7 16.7 7.8 11.0 19.0 9.7 12.8 21.7
—Too few sample observations for a reliable estimate.*Includes students who completed both a vocational concentration and a college preparatory curriculum.
SOURCE: U.S. Department of Education, National Center for Education Statistics, National Education Longitudinal Studyof 1988, Second Follow-up and High School Transcript Study.
Lowest quartile Middle two quartiles Highest quartile
Table 36—Average 8–10th, 10–12th, and 8–12th grade test score gains in science for 1992 publicTable 37—high school graduates according to 8th-grade science test score quartiles, by curriculumTable 37—specialization in high school
Curriculum specialization 8–10th 10–12th 8–12th 8–10th 10–12th 8–12th 8–10th 10–12th 8–12th
Total 1.3 8.3 9.5 0.2 9.2 9.3 -0.6 10.2 9.6
College preparatory only 2.4 8.2 10.5 1.0 10.1 10.9 0.1 10.3 10.3 Vocational concentrators total* 1.1 8.2 9.3 -0.4 8.8 8.5 -1.4 9.7 8.5 Vocational concentration only 1.0 8.2 9.3 -0.6 8.8 8.2 -1.9 9.7 8.0 Both vocational concentration and college preparatory — — — 0.8 8.9 9.9 0.1 9.9 10.2 Other/general 1.1 8.4 9.5 0.0 8.8 8.8 -1.0 10.3 9.1
—Too few sample observations for a reliable estimate.*Includes students who completed both a vocational concentration and a college preparatory curriculum.
NOTE: Estimates appearing as 0.0 may be nonzero but less than 0.05.
SOURCE: U.S. Department of Education, National Center for Education Statistics, National Education Longitudinal Studyof 1988, Second Follow-up and High School Transcript Study.
Lowest quartile Middle two quartiles Highest quartile

IV. Trends in Secondary Vocational Education
79
One finding of this analysis was that the academic coursework of vocational concentrators
who also completed a college preparatory curriculum was more like the coursework of the col-
lege preparatory group than like that of other vocational concentrators. For example, this aca-
demically oriented group of vocational concentrators earned fewer low-level mathematics and
English credits than their strictly vocational counterparts (tables 32a,b and 37). In keeping with
this similarity in coursetaking, the test score gains for vocational concentrators who also com-
pleted a college preparatory curriculum were generally statistically indistinguishable from those
of the college preparatory group, and these vocational concentrators generally outperformed their
vocational peers who did not complete a college preparatory curriculum (tables 33–36).
Figure 18—Average 8–12th grade test score gains in reading and mathematics for 1992 public highFigure 18—school graduates who scored in the middle two quartiles on the 8th-grade reading and Figure 18—mathematics tests, by curriculum specialization in high school
*Includes students who completed both a vocational concentration and a college preparatory curriculum.
SOURCE: U.S. Department of Education, National Center for Education Statistics, National Education LongitudinalStudy of 1988, Second Follow-up and High School Transcript Study.
21.9
29.2
18.022.9
19.024.3
0
10
20
30
40
50
Reading Mathematics
College preparatory only Vocational concentrators total* Other/general
Average test score gains

IV. Trends in Secondary Vocational Education
80
Table 37—Average number of credits earned by 1992 public high school graduates in various mathematicsTable 38—and precalculus courses and average number and percentage of credits earned in low-level Table 38—mathematics courses1 according to 8th-grade mathematics test score quartiles, by curriculum Table 38—specialization in high school
Average Average Average Percent ofnumber number number of total math
of of low-level creditsCurriculum math precalculus math that arespecialization credits credits credits low-level2
Total 2.88 0.23 1.49 54.0
College preparatory only 3.80 1.10 0.46 11.0 Vocational concentrators total3 2.73 0.13 1.67 62.9 Vocational concentration only 2.71 0.10 1.71 64.3 Both vocational concentration and college preparatory — — — —Other/general 2.85 0.19 1.51 54.2
Total 3.17 0.74 0.65 22.8
College preparatory only 3.75 1.45 0.15 3.7 Vocational concentrators total3 2.84 0.47 0.87 33.7 Vocational concentration only 2.73 0.34 0.97 38.0 Both vocational concentration and college preparatory 3.62 1.39 0.15 3.6 Other/general 3.07 0.53 0.77 26.1
Total 3.62 4.02 0.12 4.0
College preparatory only 3.90 1.69 0.03 0.7 Vocational concentrators total3 3.29 1.21 0.22 8.1 Vocational concentration only 3.01 0.97 0.31 11.8 Both vocational concentration and college preparatory 3.84 1.69 0.03 0.7 Other/general 3.28 1.14 0.24 7.9
—Too few sample observations for a reliable estimate.1These include general and consumer mathematics and pre-algebra courses.2These percentages are the average rates calculated for each student in the population.3Includes students who completed both a vocational concentration and a college preparatory curriculum.
SOURCE: U.S. Department of Education, National Center for Education Statistics, National Education Longitudinal Studyof 1988, Second Follow-up and High School Transcript Study.
Lowest quartile
Middle two quartiles
Highest quartile

IV. Trends in Secondary Vocational Education
81
This suggests that the achievement gap may be narrowed by providing students in voca-
tional programs with a challenging academic curriculum. However, it may also be that vocational
concentrators who also take a college preparatory curriculum are different from other vocational
concentrators in ways that impact academic achievement. For example, as 8th-grade achievement
increased, so did the likelihood that students would meet both the vocational concentrator and
college preparatory criteria in high school. In contrast, 8th-grade achievement was inversely re-
lated to the likelihood of students meeting only the vocational concentrator criteria (table 31).
The direct impact of vocational concentrators taking more rigorous academic coursework cannot
be determined by these descriptive data.
SCHOOL REFORM EFFORTS
By 1997, public comprehensive high schools reported implementing some vocational edu-
cation-related reforms, although the quality and specific forms of these efforts were not discerni-
ble from the available survey data.66 About half of these schools reported integrating academic
and vocational education, and a similar proportion reported offering tech prep. Fewer schools
reported having block scheduling, career majors, school-based enterprises, skill standards, or
skill or occupational certificates. Generally, schools with career academies and larger schools
were more likely to report these reforms, while rural schools were less likely to do so.
• In 1997, 90 percent of public high schools reported that teachers attended conferences on
integrating academic and vocational education, and almost half (45 percent) reported
actually integrating these curricula (table 38; figure 19). Schools with career academies
were more likely than other schools to report that academic and vocational curricula
were being integrated, with 78 percent of career academy schools reporting such activity.
Rural schools were less likely to implement integration, as were smaller schools. As
mentioned above, it is not possible from the available data to discern the quality and
specific forms of the integration activities reported.
66NLSY provided information on public schools with a 12th grade. For simplicity’s sake, this section refers to these schools aspublic high schools. Because vocational schools were mistakenly excluded from the sample, the survey generally describes com-prehensive high schools, rather than all high schools, which may provide a conservative estimate of local reform efforts. Also,survey respondents were not asked to describe their reform efforts in any detail; therefore, it is not possible to know what activi-ties they classified as integration, tech-prep, and other reform efforts.

IV. Trends in Secondary Vocational Education
82
Table 38—Percentage of public schools reporting various efforts to integrate academic and vocational Table 39—education, by selected school characteristics: 1997
Teachers attend conferences School offers integratedSelected school on integrating academic academic andcharacteristics and vocational education vocational curricula
Total 90.4 45.0
Student enrollment 1–500 85.7 31.3 501–1,000 92.4 46.4 1,001 or more 93.9 62.0
Urbanicity Urban 92.2 57.1 Suburban 91.3 51.0 Rural 88.4 34.1
Career academy Yes 97.3 77.8 No 90.3 45.2
NOTE: The sample is made up of public schools with a 12th grade. Schools that were identified by school district officials asprimarily vocational in nature were not included in the sampling frame.
SOURCE: U.S. Department of Labor, Bureau of Labor Statistics, National Longitudinal Survey of Youth, 1996–97.
Figure 19—Percentage of public schools reporting various efforts to integrate academic and vocational Figure 19—education, by selected school characteristics: 1997
NOTE: The sample is made up of public schools with a 12th grade. Schools that were identified by school district officialsas primarily vocational in nature were not included in the sampling frame.
SOURCE: U.S. Department of Labor, Bureau of Labor Statistics, National Longitudinal Survey of Youth, 1996–97.
9097
8692 94 88 91 92
45
78
31
46
62
34
5157
0
20
40
60
80
100
Total Careeracademy
1–500 501–1,000 1,001 ormore
Rural Suburban Urban
Percent
Teachers attend conferences on integrating academic and vocational education
School offers integrated vocational and academic curricula
School size Urbanicity

IV. Trends in Secondary Vocational Education
83
• About 50 percent of public high schools offered tech prep (table 39; figure 20).67
Schools more likely to offer this program included schools in the Midwest and West
(versus those in the Northeast and South); suburban schools (with urban schools second
and rural schools last); schools with a career academy (versus those without); and larger
schools.
67The national tech-prep evaluation conducted by Mathematica found that by fall 1995, more than 1,000 education consortia inthe country—encompassing about 70 percent of U.S. school districts serving about 90 percent of all high school students—of-fered tech prep. This finding is not incompatible with the above finding that 50 percent of public high schools offered tech prep.The national tech-prep evaluation surveyed state-level tech prep coordinators and local tech-prep consortium coordinators, ratherthan high school administrators, who represented the survey universe for the 1997 findings presented in this report. It is possiblefor a local education consortium to offer tech prep, but not all of the high schools in the school districts participating in that con-sortium do so. See A. Hershey et al., Focus for the Future: The Final Report of the National Tech-Prep Evaluation (Princeton,NJ: Mathematica Policy Research, 1998), p. xv.
Table 39—Percentage of public schools offering tech-prep education, by selected characteristics: 1997
Selected characteristics Tech-prep education
Total 50.1
Student enrollment 1–500 40.0 501–1,000 54.6 1,001 or more 59.1
Urbanicity Urban 50.5 Suburban 61.0 Rural 37.6
Career academy Yes 77.3 No 51.7
Region Northeast 37.8 Midwest 61.9 West 60.3 South 43.2
NOTE: The sample is made up of public schools with a 12th grade. Schools that were identified by school district officials asprimarily vocational in nature were not included in the sampling frame.
SOURCE: U.S. Department of Labor, Bureau of Labor Statistics, National Longitudinal Survey of Youth, 1996–97.

IV. Trends in Secondary Vocational Education
84
• Thirty-nine percent of public high schools reported offering some form of block sched-
uling that allows for longer class periods (table 40; figure 21). About one in five public
high schools offered career majors or school-based enterprises to their students.
• Among public high schools, 28 percent reported having skill standards, 20 percent re-
ported offering skill certificates, and 20 percent occupational certificates (table 41).
Large schools and urban schools were more likely than small and rural schools to offer
these types of standards and certificates. Also, schools with higher percentages of mi-
nority students were more likely to have skill certificates and standards. For example, 51
percent of high-minority schools (those with more than 75 percent minority students)
had skill standards.
Figure 20—Percentage of public schools offering tech-prep education, by selected school characteristics:Figure 20—1997
NOTE: The sample is made up of public schools with a 12th grade. Schools that were identified by school district officialsas primarily vocational in nature were not included in the sampling frame.
SOURCE: U.S. Department of Labor, Bureau of Labor Statistics, National Longitudinal Survey of Youth, 1996–97.
School size Urbanicity
50
77
40
5559
38
61
51
0
20
40
60
80
100
Total Careeracademy
1–500 501–1,000 1,001 ormore
Rural Suburban Urban
Percent
School size Urbanicity

IV. Trends in Secondary Vocational Education
85
Table 40—Percentage of public schools offering various school-based activities, by selected characteristics:Table 40—1997
Total 38.9 19.6 19.1
Student enrollment 1–500 32.7 12.5 14.3 501–1,000 39.9 19.2 15.5 1,001 or more 46.5 29.8 29.2
Urbanicity Urban 48.0 25.8 24.7 Suburban 44.1 25.1 25.4 Rural 29.8 12.7 9.2
Career academy Yes 64.2 71.5 50.8 No 39.7 19.4 19.1
Region Northeast 35.2 20.8 23.1 Midwest 35.6 14.3 22.0 West 41.0 17.5 23.4 South 39.2 26.3 13.5
NOTE: The sample is made up of public schools with a 12th grade. Schools that were identified by school district officials asprimarily vocational in nature were not included in the sampling frame.
SOURCE: U.S. Department of Labor, Bureau of Labor Statistics, National Longitudinal Survey of Youth, 1996–97.
School-basedenterprise
Blockscheduling
Careermajor
Figure 21—Percentage of public schools offering various school-based activities: 1997
NOTE: The sample is made up of public schools with a 12th grade. Schools that were identified by school district officialsas primarily vocational in nature were not included in the sampling frame.
SOURCE: U.S. Department of Labor, Bureau of Labor Statistics, National Longitudinal Survey of Youth, 1996–97.
39
20 19
0
10
20
30
40
50
Block scheduling Career major School-based enterprise
Percent

IV. Trends in Secondary Vocational Education
86
Table 41—Percentage of public schools offering skill standards, skill certificates, and occupational Table 41—certificates, by selected school characteristics: 1997
Selected school Skill Skill Occupationalcharacteristics standards certificates certificates
Total 27.5 19.9 19.7
Region Northeast 29.3 20.8 19.2 Midwest 27.6 20.5 22.2 West 30.4 25.2 16.5 South 27.3 17.1 21.7
Public school type Comprehensive public 27.9 20.4 19.1 Public choice 15.0 12.8 19.4 Public magnet 30.2 22.3 15.2 Other public 24.9 13.1 21.2
Percent minority students 0–25 24.3 16.6 17.9 26–50 34.4 25.6 25.1 51–75 26.2 21.4 19.8 76–100 51.1 42.3 29.6
Grade span K–12 30.1 8.9 11.5 7–12 14.1 11.0 9.0 9–12 29.2 22.0 21.2 10–12 28.7 22.7 35.0
Percent taking SAT or ACT 0–25 30.3 22.2 20.9 26–50 28.2 18.3 18.4 51–75 27.9 26.7 21.3 76–100 24.9 9.5 17.8
Student enrollment 1–500 15.8 9.4 7.2 501–1,000 26.0 17.8 20.3 1,001 or more 44.6 35.7 35.8
Urbanicity Urban 41.4 31.6 33.6 Suburban 34.1 26.8 23.4 Rural 15.3 7.9 10.5
Career academy Yes 60.8 54.3 53.9 No 26.4 18.7 18.6
NOTE: The sample is made up of public schools with a 12th grade. Schools that were identified by school district officials asprimarily vocational in nature were not included in the sampling frame.
SOURCE: U.S. Department of Labor, Bureau of Labor Statistics, National Longitudinal Survey of Youth, 1996–97.

IV. Trends in Secondary Vocational Education
87
WORK EXPERIENCE AND WORK-BASED LEARNING
Most public high school graduates work during their senior year of high school, although
most of these students work part time.68 In addition to student-found employment, many schools
offer work-based learning experiences, with cooperative education being the most common form
of work-based learning, followed by job shadowing, internships, and mentoring. Although par-
ticipation in occupational education decreased between 1982 and 1994, the percentage of public
high school graduates earning cooperative education credits increased somewhat over the same
time period.69 By 1994, about one in ten graduates participated in cooperative education.
• Most 1992 public high school graduates (71 percent) worked during their senior year of
high school (table 42). Of these, most worked 20 or fewer hours per week. While voca-
tional concentrators were only slightly more likely than college preparatory and
other/general students to work during their senior year, they were significantly more
likely than these two groups to work more than 20 hours per week.70
68Some of this student-reported employment may include school-organized work experiences.69In this section, cooperative education describes programs that allow students to earn school credit for paid or unpaid employ-ment that is related to a specific occupational program of study. In contrast, general work experience is not connected to a spe-cific occupational program.70The difference in overall work rates for vocational concentrators and other/general students was not statistically significant.
Table 42—Percentage distribution of 1992 public high school graduates according to their work status Table 43—during their senior year in high school, by curriculum specialization in high school
Curriculum Never Any 20 or fewer More than 20specialization worked work hours hours
Total 29.2 70.8 67.7 32.3
College preparatory only 31.8 68.2 79.9 20.1Vocational concentrators total* 25.3 74.7 55.8 44.2 Vocational concentration only 24.5 75.5 53.8 46.3 Both vocational concentration and college preparatory 29.5 70.5 68.6 31.4Other/general 29.6 70.4 66.4 33.6
*Includes students who completed both a vocational concentration and a college preparatory curriculum.
NOTE: Percentages may not add to 100 due to rounding.
SOURCE: U.S. Department of Education, National Center for Education Statistics, National Education Longitudinal Studyof 1988, Second Follow-up and High School Transcript Study.
Hours worked

IV. Trends in Secondary Vocational Education
88
• Between 25 and 50 percent of public high schools offered each type of work-based
learning activity in 1997 (figure 22). Cooperative education and job shadowing were
more prevalent than mentoring or internships, with 48 and 43 percent of public schools
offering cooperative education and job shadowing, respectively, and 25 percent of public
schools offering mentoring and 25 percent internships.
• The percentage of public high school graduates taking cooperative education courses in-
creased from 8.0 percent in 1982 to 9.4 percent in 1994 (table 43). Given that the aver-
age number of specific occupational credits earned by graduates decreased over the same
period, this means that the share of occupationally specific credits that were cooperative
education credits increased, from 3.5 percent in 1982 to 4.5 percent in 1994 (table 44).
• Vocational concentrators exhibited the highest rates of participation in cooperative edu-
cation courses in all the years studied (tables 43 and 44). Twenty-three percent of voca-
tional concentrators earned credits in this area in 1994, compared with 3 percent of
college preparatory students and 6 percent of students completing general coursework in
high school. Similarly, vocational concentrators earned a greater share of their specific
occupational credits in cooperative education coursework than did college preparatory or
other/general students in 1994.
Figure 22—Percentage of public schools offering various work-based activities: 1997
NOTE: The sample is made up of public schools with a 12th grade. Schools that were identified by school district officialsas primarily vocational in nature were not included in the sampling frame.
SOURCE: U.S. Department of Labor, Bureau of Labor Statistics, National Longitudinal Survey of Youth, 1996–97.
4843
25 25
0
10
20
30
40
50
Cooperative education Job shadowing Internship Mentoring
Percent

IV. Trends in Secondary Vocational Education
89
Table 43—Percentage of public high school graduates completing cooperative education or work experienceTable 45—coursework in a specific occupational area, by curriculum specialization in high school: 1982,Table 45—1990, and 1994
Curriculum specialization 1982 1990 1994
Total 8.0 7.4 9.4
Vocational concentrators total* 14.9 17.6 23.1 Vocational concentration only 15.0 17.9 23.8 Both vocational concentration and college preparatory 8.0 15.4 20.4 College preparatory 0.1 1.6 3.0 Other/general 5.1 4.4 6.0
*Includes students who completed both a vocational concentration and a college preparatory curriculum.
SOURCE: U.S. Department of Education, National Center for Education Statistics, High School and Beyond Sophomore Cohort1982 High School Transcript Study and 1990 and 1994 National Assessment of Educational Progress High School TranscriptStudies.
Table 44—Average percentage of specific labor market preparation (SLMP) credits earned throughTable 46—cooperative education or work experience coursework in a specific occupational area, byTable 46—curriculum specialization in high school: 1982, 1990, and 1994
Curriculum specialization 1982 1990 1994
Total 3.5 3.2 4.5
Vocational concentrators total* 5.8 7.8 11.4 Vocational concentration only 5.8 7.8 11.5 Both vocational concentration and college preparatory 4.0 8.5 10.9 College preparatory 0.1 0.8 1.4 Other/general 2.4 1.8 2.7
*Includes students who completed both a vocational concentration and a college preparatory curriculum.
SOURCE: U.S. Department of Education, National Center for Education Statistics, High School and Beyond Sophomore Cohort1982 High School Transcript Study and 1990 and 1994 National Assessment of Educational Progress High School TranscriptStudies.

IV. Trends in Secondary Vocational Education
90
• Both vocational concentrators and college preparatory students increased their coopera-
tive education coursetaking between 1982 and 1994 (tables 43 and 44). While 15 percent
of vocational concentrators completed cooperative education courses in 1982, 23 percent
did so in 1994. Course completion rates for college preparatory students increased from
less than 1 percent in 1982 to 3 percent in 1994. Both groups also increased their share
of specific occupational credits earned in cooperative education coursework over the
years studied. However, vocational concentrators increased their absolute and relative
participation in cooperative education at a faster rate than did college preparatory stu-
dents.
• In 1994, graduates earned more cooperative education credits in business and in mar-
keting and distribution than in other program areas (table 45). The average number of
cooperative education credits earned in these program areas remained relatively un-
changed from 1982.
• The percentage of all graduates completing career preparation and general work experi-
ence courses that were not associated with a specific occupational program decreased
from 17 to 13 percent between 1982 and 1994 (table 46).
TECHNOLOGY LITERACY
The percentage of public high school graduates taking at least one computer education
course increased substantially between 1982 and 1990, and then remained relatively steady
through 1994. In that year, about 80 percent of graduates had completed at least one semester of
computer education. Participation in the more traditional “industrial arts” declined over the
1982–1994 period, while participation in the newer “technology education” increased. However,
it is not possible to determine from the available data the extent to which this shift reflects rela-
beling, rather than a change in course objectives or content. In 1994, fewer graduates completed
coursework in the combined introductory technology fields than in 1982.
• The percentage of public high school graduates who completed at least one semester of
computer education increased sixfold from 13 percent in 1982 to 78 percent in 1990, and
then remained relatively constant between 1990 and 1994 (table 47).71
71In 1990, the definition of computer education in the survey was expanded to include former “typewriting” courses, since thesewere increasingly becoming “computer keyboarding” courses.

Table 45—Average number of Carnegie units accumulated by public high school graduates in cooperative education and work experience Table 47—coursework in a specific occupational area: 1982, 1990, and 1994
Agri- Tech- culture Marketing Public nology Personal Food Child Occu-
and and and Trade and and service care pational renewable distri- Health protective and communi- other and and home
Curriculum specialization Total resources Business bution care services industry cations services hospitality education economics1
Total 0.15 0.01 0.07 0.04 0.01 0.00 0.01 0.00 0.00 0.01 0.00 0.01
Vocational concentrators total2 0.34 0.02 0.17 0.09 0.02 0.00 0.03 0.00 0.00 0.01 0.00 0.01 Vocational concentration only 0.34 0.02 0.17 0.09 0.02 0.00 0.03 0.00 0.00 0.01 0.00 0.01 Both vocational concentration and college preparatory 0.16 0.00 0.08 0.08 0.00 0.00 0.00 0.00 0.00 0.00 0.00 0.00College preparatory 0.00 0.00 0.00 0.00 0.00 0.00 0.00 0.00 0.00 0.00 0.00 0.00Other/general 0.06 0.00 0.02 0.02 0.00 0.00 0.00 0.00 0.00 0.01 0.00 0.01
Total 0.15 0.01 0.05 0.04 0.01 0.00 0.03 0.00 0.01 0.00 0.00 0.02
Vocational concentrators total2 0.45 0.04 0.14 0.10 0.02 0.00 0.11 0.00 0.04 0.00 0.01 0.05 Vocational concentration only 0.46 0.05 0.13 0.10 0.02 0.00 0.11 0.00 0.04 0.00 0.01 0.05 Both vocational concentration and college preparatory 0.40 0.00 0.22 0.08 0.03 0.00 0.03 0.00 0.03 0.00 0.00 0.03College preparatory 0.02 0.00 0.01 0.01 0.00 0.00 0.00 0.00 0.00 0.00 0.00 0.00Other/general 0.05 0.00 0.02 0.02 0.00 0.00 0.01 0.00 0.00 0.00 0.00 0.00
Total 0.21 0.01 0.06 0.06 0.02 0.00 0.03 0.00 0.02 0.01 0.01 0.03
Vocational concentrators total2 0.64 0.05 0.19 0.17 0.05 0.00 0.11 0.00 0.05 0.01 0.02 0.08 Vocational concentration only 0.67 0.06 0.19 0.19 0.03 0.00 0.12 0.00 0.05 0.02 0.02 0.08 Both vocational concentration and college preparatory 0.51 0.02 0.22 0.11 0.07 0.00 0.04 0.00 0.04 0.00 0.01 0.05College preparatory 0.03 0.00 0.01 0.01 0.00 0.00 0.00 0.00 0.00 0.00 0.00 0.01Other/general 0.08 0.00 0.02 0.03 0.00 0.00 0.01 0.00 0.01 0.00 0.00 0.011Occupational home economics combines personal and other services, food service and hospitality, and child care and education.2Includes students who completed both a vocational concentration and a college preparatory curriculum.
NOTE: Averages may not add to totals due to rounding. Estimates appearing as 0.00 may be nonzero but less than 0.005.
SOURCE: U.S. Department of Education, National Center for Education Statistics, High School and Beyond Sophomore Cohort 1982 High School Transcript Study and1990 and 1994 National Assessment of Educational Progress High School Transcript Studies.
1982
1990
1994

IV. Trends in Secondary Vocational Education
92
Table 46—Percentage of graduates completing career preparation and general work experience courses Table 48—not in a specific occupational area, by curriculum specialization in high school: 1982, 1990, Table 48—and 1994
Curriculum specialization 1982 1990 1994
Total 17.1 17.6 13.3
Vocational concentrators total* 15.5 17.3 14.3 Vocational concentration only 15.6 17.8 15.3 Both vocational concentration and college preparatory 6.5 12.8 9.7 College preparatory 5.2 9.8 7.7 Other/general 19.6 22.0 16.9
*Includes students who completed both a vocational concentration and a college preparatory curriculum.
SOURCE: U.S. Department of Education, National Center for Education Statistics, High School and Beyond Sophomore Cohort1982 High School Transcript Study and 1990 and 1994 National Assessment of Educational Progress High School TranscriptStudies.
• Although male and female graduates completed computer education coursework at
similar rates in 1982, females were more likely than males to take such coursework in
later years (table 47). In 1994, 85 percent of female graduates versus 75 percent of male
graduates took at least one semester of computer education. By contrast, earlier differ-
ences among racial–ethnic groups in completing computer coursework disappeared in
later years. In 1982, American Indians/Alaskan Natives and Hispanics were less likely
Table 47—Percentage of public high school graduates completing at least .5 credits of computer education Table 49—coursework: 1982, 1990, and 1994
Year 1982 1990* 1994
Total 13.2 78.4 79.9
Gender Male 14.0 70.5 75.1 Female 12.5 85.5 84.5
Race–ethnicity American Indian/Alaskan Native 6.1 74.7 75.1 Asian/Pacific Islander 18.1 74.8 78.5 Black, non-Hispanic 12.8 78.3 77.9 Hispanic 8.0 79.2 80.5 White, non-Hispanic 14.2 78.7 80.7
*In 1990, the definition of computer education in the survey was expanded to include former “typewriting” courses, since these were increasingly becoming “computer keyboarding” courses.
SOURCE: U.S. Department of Education, National Center for Education Statistics, High School and Beyond Sophomore Cohort1982 High School Transcript Study and 1990 and 1994 National Assessment of Educational Progress High School TranscriptStudies.

IV. Trends in Secondary Vocational Education
93
than other racial–ethnic groups to take at least one semester of computer education.72 In
1990 and 1994, however, all race–ethnicities completed computer education coursework
at similar rates. For example, in 1994, between 75 and 81 percent of students in the dif-
ferent racial–ethnic groups completed at least one semester of computer education.73
• The percentage of public high school graduates completing at least one course in tech-
nology education jumped between 1990 and 1994, from 0.8 percent to 4.2 percent (table
48). The percentage in 1982 was 0.2. Over the same period, the percentage of graduates
completing at least one course in industrial arts declined from 14 percent in 1982 to 8
percent in 1994. Combining the more traditional industrial arts with the newer technol-
ogy education, fewer graduates completed coursework in introductory technology fields
in 1994 than in 1982.74
• Female public high school graduates were less likely than their male peers to complete
introductory technology coursework in all years studied (table 48). In 1994, 3 percent of
female graduates versus 20 percent of male graduates completed introductory technology
coursework. In the same year, Asian/Pacific Islander graduates were less likely than
white and black graduates to complete introductory technology coursework.
VOCATIONAL TEACHERS
The available teacher trend data were for school years 1990–91 and 1993–94, and the
changes noted were generally small for the 3-year period. However, these changes included a
teaching force that grew older and accrued more years of teaching experience. This trend held for
vocational and academic teachers alike.
Vocational and academic teachers were similar in a number of ways: about the same pro-
portions held bachelor’s degrees, and similar percentages held either standard or advanced certi-
fication. However, about 8 percent of vocational teachers had less than a bachelor’s degree, in
comparison with less than 1 percent of academic teachers. Also, vocational teachers were gener-
ally older than academic teachers, which may be due to the fact that vocational teachers entered
the teaching profession at an older age, possibly after obtaining industry experience. There were
72The difference in course completion rates between American Indians/Alaskan Natives and blacks in 1982 was not statisticallysignificant.73These differences were not statistically significant.74It is not possible to determine from the available data the extent to which the shift from industrial arts to technology educationrepresents relabeling versus a change in course content or objectives.
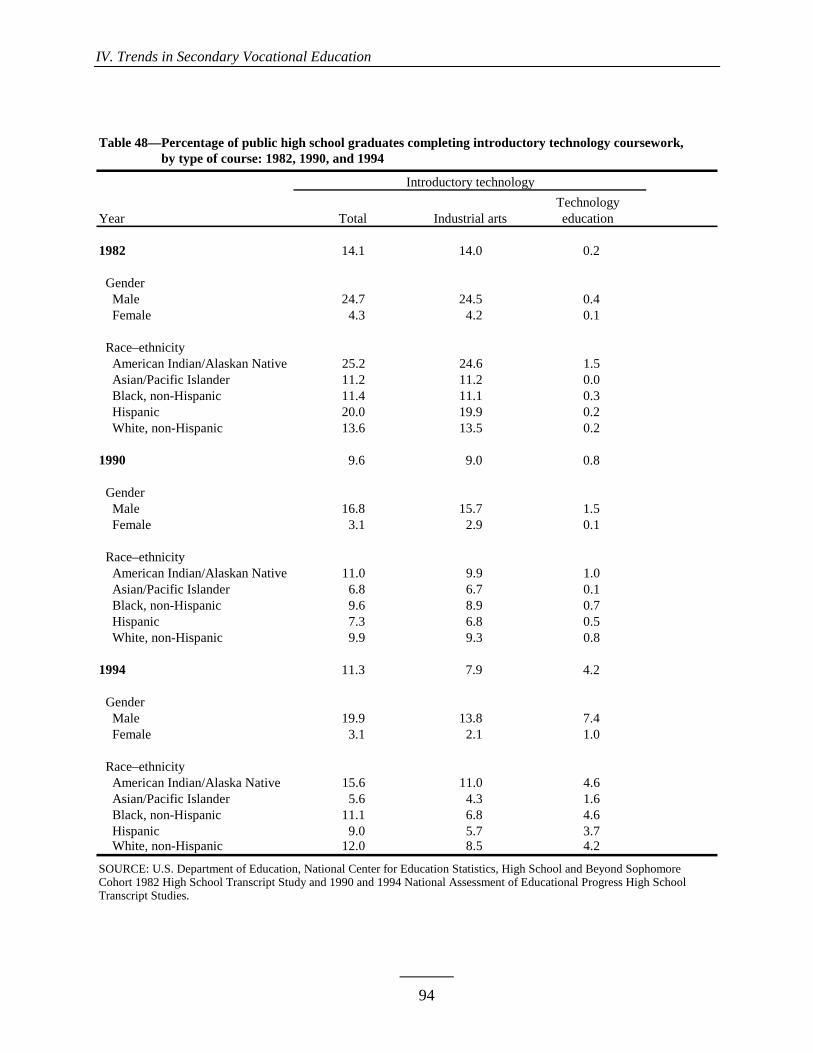
IV. Trends in Secondary Vocational Education
94
Table 48—Percentage of public high school graduates completing introductory technology coursework,Table 50—by type of course: 1982, 1990, and 1994
TechnologyYear Total Industrial arts education
1982 14.1 14.0 0.2
Gender Male 24.7 24.5 0.4 Female 4.3 4.2 0.1
Race–ethnicity American Indian/Alaskan Native 25.2 24.6 1.5 Asian/Pacific Islander 11.2 11.2 0.0 Black, non-Hispanic 11.4 11.1 0.3 Hispanic 20.0 19.9 0.2 White, non-Hispanic 13.6 13.5 0.2
1990 9.6 9.0 0.8
Gender Male 16.8 15.7 1.5 Female 3.1 2.9 0.1
Race–ethnicity American Indian/Alaskan Native 11.0 9.9 1.0 Asian/Pacific Islander 6.8 6.7 0.1 Black, non-Hispanic 9.6 8.9 0.7 Hispanic 7.3 6.8 0.5 White, non-Hispanic 9.9 9.3 0.8
1994 11.3 7.9 4.2
Gender Male 19.9 13.8 7.4 Female 3.1 2.1 1.0
Race–ethnicity American Indian/Alaska Native 15.6 11.0 4.6 Asian/Pacific Islander 5.6 4.3 1.6 Black, non-Hispanic 11.1 6.8 4.6 Hispanic 9.0 5.7 3.7 White, non-Hispanic 12.0 8.5 4.2
SOURCE: U.S. Department of Education, National Center for Education Statistics, High School and Beyond Sophomore Cohort 1982 High School Transcript Study and 1990 and 1994 National Assessment of Educational Progress High School Transcript Studies.
Introductory technology
IV. Trends in Secondary Vocational Education
95
some variations among vocational teachers who taught in different program areas and school set-
tings. For example, trade and industry and technical teachers and those teaching in more than one
vocational field were generally least likely to have a bachelor’s or advanced degree than other
vocational teachers.
Qualifications and Experience
• The educational attainment of vocational teachers as a group remained about the same in
1990–91 and 1993–94 (table 49). Although there was a small decrease in the percentage
of teachers with a master’s degree, the percentage of vocational teachers with a doctorate
or first-professional degree increased slightly.75 In both 1990–91 and 1993–94, about 8
percent of vocational teachers had less than a bachelor’s degree; 47 percent had a
bachelor’s degree; and the rest (about 45–46 percent) had some type of advanced degree.
• About the same proportion (47 percent) of vocational and academic teachers held
bachelor’s degrees as their highest degree in 1993–94 (table 49; figure 23). Vocational
teachers were more likely to have less than a bachelor’s degree (8.3 versus 0.5 percent),
while academic teachers were more likely to have a master’s or doctorate/first-
professional degree.
• Educational attainment varied markedly by vocational program area. Trade and industry
and technical teachers and those teaching in more than one vocational field were gener-
ally least likely to have a bachelor’s or advanced degree in 1993–94 (table 49). About 39
percent of trade and industry teachers, 32 percent of “mixed” vocational teachers, and 16
percent of technical teachers held less than a bachelor’s degree.76 This may reflect the
practice in some states of counting industry experience in place of education in hiring
some vocational teachers.77 In contrast, agriculture, business, career education, home
economics, and industrial arts teachers were more like academic teachers in terms of
their educational attainment, with less than 6 percent of these groups having less than a
bachelor’s degree.78
75The changes in the percentages of vocational teachers with bachelor’s and education specialist degrees were not statisticallysignificant.76The only exceptions were that technical teachers were not statistically different from career education, health, and “other” vo-cational teachers, and “mixed” vocational teachers were not statistically different from health teachers.77See “The State of Certification,” Vocational Education Journal 68 (6) (September 1993): 30–35.78Health teachers were statistically different from trade and industry teachers, and “other” vocational teachers were statisticallydifferent from both trade and industry and “mixed” vocational teachers. “Other” vocational teachers were not statistically differ-ent from academic teachers.

IV. Trends in Secondary Vocational Education
96
Table 49—Percentage distribution of public school teachers of grades 9 through 12 according to highest Table 51—educational degree, by teaching assignment and vocational program area: 1990–91 and 1993–94
Teachingassignment Less Educa- Doctorate Less Educa- Doctorateand than tional or first- than tional or first-vocational bache- Bache- special- profes- bache- Bache- special- profes-program area lor’s lor’s Master’s ist sional lor’s lor’s Master’s ist sional
Total 1.7 45.4 46.4 5.3 1.3 1.7 46.3 45.6 5.3 1.1
Teaching assignment Vocational education 8.3 45.5 41.4 4.5 0.3 8.3 46.7 38.7 5.6 0.7 Academic education 0.3 45.7 47.4 5.1 1.5 0.5 46.8 46.6 4.9 1.2 Special education 0.2 42.5 47.0 8.4 1.9 0.2 41.3 49.4 8.2 0.9
Vocational program area Agriculture 1.5 51.3 42.7 3.9 0.6 1.7 51.9 42.7 2.5 1.2 Business and accounting 0.6 43.1 50.4 5.6 0.3 0.7 48.2 44.5 6.5 0.1 Career education 0.5 42.7 47.5 9.2 0.0 5.5 39.1 42.1 10.6 2.7 Health occupations 17.9 44.4 26.1 11.6 0.0 15.1 49.5 20.4 15.0 0.0 Home economics 0.3 58.8 37.9 2.7 0.4 0.1 59.2 36.3 3.4 1.0 Industrial arts 4.0 46.9 44.8 4.3 0.0 2.4 45.7 45.2 5.1 1.6 Technical 24.7 39.0 33.1 3.2 0.0 16.0 46.3 34.3 0.9 2.5 Trade and industry 45.4 29.3 21.8 3.3 0.2 39.1 29.5 24.6 6.6 0.2 Other 18.1 43.4 32.2 4.8 1.6 12.5 40.0 41.0 6.4 0.1 Mixed* 2.9 41.8 51.7 3.6 0.0 32.2 34.8 25.0 7.1 0.9
*“Mixed” indicates that the teacher taught equal proportions in two or more vocational subjects.
NOTE: Percentages may not add to 100 due to rounding. Estimates appearing as 0.0 may be nonzero but less than 0.05.
SOURCE: U.S. Department of Education, National Center for Education Statistics, Schools and Staffing Survey, 1990–91and 1993–94.
1990–91 1993–94
Figure 23—Percentage distribution of public school teachers of grades 9 through 12 according to highest Figure 23—educational degree, by teaching assignment: 1993–94
*Includes master’s, educational specialist, doctoral degree, or first-professional degree.
NOTE: Percentages may not add to 100 due to rounding.
SOURCE: U.S. Department of Education, National Center for Education Statistics, Schools and Staffing Survey, 1993–94.
Vocational teachers
8%
47%
45%
Less than bachelor’sBachelor’sMaster’s or higher*
Academic teachers
53%47%
1%

IV. Trends in Secondary Vocational Education
97
• Between the 1990–91 and 1993–94 school years, the percentage of vocational teachers
whose highest degree was in the broad field of vocational education decreased slightly
(by about 3 percent), while the percentage who had an occupationally specific degree in-
creased by about the same amount (table 50). More than half (57 percent) of vocational
teachers in 1993–94 held their highest degree in vocational education, while approxi-
mately equal percentages of vocational teachers (12–13 percent) held degrees in the spe-
cific occupational and general education fields.
Table 50—Percentage distribution of public school teachers of grades 9 through 12 according to major field Table 52—of highest degree, by teaching assignment: 1990–91 and 1993–94
Occu-Math and Social Letters and General Special Vocational pationally
Teaching assignment science science humanities education education education specific Other
Total 7.0 5.8 9.9 41.6 6.6 11.3 3.7 14.1
Vocational education 0.7 1.3 1.1 13.0 0.9 59.7 9.0 14.2Academic education 9.3 6.9 12.8 50.7 1.2 1.7 2.9 14.4Special education 0.8 4.8 2.3 21.4 54.2 3.6 1.4 11.4
Total 8.2 5.4 10.4 41.1 6.3 10.0 4.3 14.3
Vocational education 0.7 1.0 1.2 12.9 1.0 56.8 11.5 14.8Academic education 10.5 6.3 13.2 48.8 1.1 2.1 3.3 14.6Special education 0.8 4.7 1.6 21.4 55.9 2.6 2.2 10.9
NOTE: Percentages may not add to 100 due to rounding.
SOURCE: U.S. Department of Education, National Center for Education Statistics, Schools and Staffing Survey, 1990–91and 1993–94.
1990–91
1993–94
• In 1993–94, vocational teachers as a group had accrued more years of teaching experi-
ence than in 1990–91 (table 51). In particular, the percentage of vocational teachers with
10–20 years of teaching experience decreased, while the percentage with more than 20
years of teaching experience increased.79 A similar trend was evident for academic
teachers.80 About the same percentage of vocational and academic teachers (37 percent)
had taught for more than 20 years by 1993–94.
79The percentages of vocational teachers with less than 3 years of experience and 3–9 years of experience remained about thesame between 1990–91 and 1993–94.80Unlike the increase in the percentage of vocational teachers with less than 3 years of teaching experience, which was not sta-tistically significant, the increase for academic teachers in this experience group was significant.

IV. Trends in Secondary Vocational Education
98
Table 51—Percentage distribution of public school teachers of grades 9 through 12 according to years of Table 53—teaching experience, by teaching assignment: 1990–91 and 1993–94
Teaching Less than 3–9 10–20 More than Less than 3–9 10–20 More thanassignment 3 years years years 20 years 3 years years years 20 years
Total 6.1 21.4 40.9 31.6 7.8 21.8 34.6 35.8
Vocational education 5.1 20.5 42.5 31.9 5.9 19.7 37.4 37.1Academic education 6.3 20.5 39.6 33.6 8.4 21.6 32.6 37.4Special education 7.0 29.4 47.3 16.3 6.8 26.7 46.4 20.1
NOTE: Percentages may not add to 100 due to rounding.
SOURCE: U.S. Department of Education, National Center for Education Statistics, Schools and Staffing Survey, 1990–91and 1993–94.
1990–91 1993–94
• In 1993–94, about three-quarters (75 percent) of vocational teachers had a standard
teaching credential, and an additional 17 percent had advanced certification (table 52).
About 9 percent of vocational teachers—the same proportion as academic teachers—
were teaching either without a credential or with a probationary, temporary, provisional,
emergency, or alternative certificate.81
Table 52—Percentage distribution of public school teachers of grades 9 through 12 according to type ofTable 54—credential in primary assignment field, by teaching assignment: 1990–91 and 1993–94
Teaching assignment None Standard Probationary Temporary1 Alternative2 Advanced2 Other2
1990–91
Total 2.2 76.3 2.6 3.1 — — 15.9
Vocational education 1.0 77.4 2.1 3.9 — — 15.7 Academic education 2.3 76.6 2.6 2.8 — — 15.7 Special education 3.7 72.0 2.7 4.5 — — 17.1
1993–94
Total 2.7 74.6 1.6 3.9 1.0 16.1 —
Vocational education 1.2 74.6 0.8 4.7 2.0 16.7 —Academic education 2.9 75.2 1.8 3.4 0.8 16.0 —Special education 3.6 70.1 1.7 6.9 1.3 16.4 —
—Not applicable.1In 1993–94, the “temporary” category also included “provisional” and “emergency” credentials.2In 1993–94, rather than including an “other” category, the survey asked about “alternative” and “advanced” credentials.
NOTE: Percentages may not add to 100 due to rounding.
SOURCE: U.S. Department of Education, National Center for Education Statistics, Schools and Staffing Survey, 1990–91and 1993–94.
81The certification categories were changed between 1990–91 and 1993–94, making it difficult to compare certification patternsbetween the two years.

IV. Trends in Secondary Vocational Education
99
Demographic Characteristics
• As might be expected, in addition to gaining more years of teaching experience, the
teaching force aged somewhat between 1990–91 and 1993–94 (table 53). Specifically,
while 62 percent of all teachers were age 40 or over in 1990–91, 69 percent were in this
age group in 1993–94. This aging trend held for both vocational and academic teachers.
• In both school years surveyed, vocational teachers were generally older than academic
teachers; however, as mentioned previously, they had similar years of teaching experi-
ence (table 53; figure 24). Vocational teachers may have been older than their academic
peers because they began teaching at an older age, possibly after obtaining industry ex-
perience, or because they alternated teaching spells with other experiences.
Table 53—Percentage distribution of public school teachers of grades 9 through 12 according to age in Table 55—current school year and age when began teaching, by teaching assignment: 1990–91 and 1993–94
Lessthan More
Teaching 30 30–39 40–49 50 years 25 years 26–35 36–45 46–55 thanassignment years years years or more or less years years years 55 years
Total 11.0 26.9 41.1 21.0 69.8 22.9 6.0 1.1 0.1
Vocational education 8.4 24.8 39.6 27.2 62.6 25.4 9.9 1.9 0.3Academic education 11.5 26.1 42.1 20.3 72.2 21.9 5.0 0.8 0.1Special education 12.2 36.0 36.2 15.6 64.8 26.0 7.1 2.0 0.1
Total 9.8 21.6 40.8 27.8 61.0 29.7 7.6 1.5 0.2
Vocational education 6.2 19.8 41.5 32.6 54.6 31.8 11.0 2.4 0.2Academic education 10.6 21.3 40.7 27.5 63.0 29.1 6.5 1.3 0.1Special education 8.9 27.8 40.7 22.6 55.3 31.1 10.8 2.3 0.4
NOTE: Percentages may not add to 100 due to rounding.
SOURCE: U.S. Department of Education, National Center for Education Statistics, Schools and Staffing Survey, 1990–91 and1993–94.
Age in current year Age began teaching
1993–94
1990–91

IV. Trends in Secondary Vocational Education
100
Figure 24—Percentage distribution of public school teachers of grades 9 through 12 according to age whenFigure 24—began teaching, by teaching assignment: 1993–94
SOURCE: U.S. Department of Education, National Center for Education Statistics, Schools and Staffing Survey, 1993–94.
5563
5545
3745
0
20
40
60
80
100
Vocational teachers Academic teachers Special education teachers
25 years or less More than 25 years
Percent
• About half of academic and vocational teachers were male, and half female (table 54).
This was true in both 1990–91 and 1993–94, with no significant change in the gender
ratio between the 2 years. In both years, the percentage of vocational teachers who were
black was greater than the percentage of academic teachers who were black (table 55).
However, the percentage of vocational teachers who were black decreased slightly over
the 3-year period.82
Table 54—Percentage distribution of public school teachers of grades 9 through 12 according to sex, byTable 56—teaching assignment: 1990–91 and 1993–94
Teaching assignment Male Female Male Female
Total 48.6 51.4 48.4 51.6
Vocational education 51.7 48.3 52.1 47.9Academic education 50.8 49.2 50.1 49.9Special education 28.3 71.7 27.7 72.3
NOTE: Percentages may not add to 100 due to rounding.
SOURCE: U.S. Department of Education, National Center for Education Statistics, Schools and Staffing Survey, 1990–91and 1993–94.
1990–91 1993–94
82Vocational teachers were slightly less likely than academic teachers to be Hispanic in 1990–91, although this difference wasnot significant in 1993–94.

IV. Trends in Secondary Vocational Education
101
Table 55—Percentage distribution of public school teachers of grades 9 through 12 according to race–Table 57—ethnicity, by teaching assignment: 1990–91 and 1993–94
American AmericanWhite, Black, Asian/ Indian/ White, Black, Asian/ Indian/
Teaching non- non- His- Pacific Alaskan non- non- His- Pacific Alaskanassignment Hispanic Hispanic panic Islander Native Hispanic Hispanic panic Islander Native
Total 89.1 6.6 2.8 0.8 0.7 89.1 5.8 3.4 0.9 0.7
Vocational education 87.8 8.7 2.0 0.7 0.9 88.7 7.2 2.6 0.8 0.7Academic education 89.6 5.8 3.1 0.9 0.6 89.4 5.3 3.6 0.9 0.7Special education 88.3 8.4 1.7 0.7 0.9 87.4 7.7 3.1 0.8 1.0
NOTE: Percentages may not add to 100 due to rounding.
SOURCE: U.S. Department of Education, National Center for Education Statistics, Schools and Staffing Survey, 1990–91and 1993–94.
1990–91 1993–94
Professional Development Activities
Most teachers—vocational, academic, and special education alike—reported participating
in some professional development activity during 1993–94. The professional development ac-
tivities surveyed included district- and school-sponsored workshops or inservices, postsecondary
coursework, professional association activities, and participation in various teaching-related
committees. Vocational teachers were generally more likely than other teachers to seek profes-
sional development opportunities outside their school or district. This was particularly true for
vocational teachers in a vocational school setting. This suggests that schools and districts, par-
ticularly vocational schools and the districts that oversee them, may be somewhat less successful
at providing their vocational teachers with relevant professional development activities. Alterna-
tively, it may be that these schools and districts offer fewer vocationally relevant activities di-
rectly, relying more on outside professional development providers.
• Most teachers (96 percent) reported participating in at least one type of professional de-
velopment activity in 1993–94 (table 56; figure 25). This was true for both vocational
and academic teachers. However, vocational teachers were twice as likely as other teach-
ers to participate on a curriculum integration committee, and were more likely to partici-
pate in professional association activities and take adult education courses. Vocational
teachers were slightly less likely than other teachers to participate in district-sponsored
workshops.

IV. Trends in Secondary Vocational Education
102
Table 56—Percentage of public school teachers of grades 9 through 12 who reported participating inTable 58—various professional development activities, by teaching assignment and vocational teachers byTable 58—school type: 1993–94
Profes-Exten- sional Curric-
District- School- sion/ College devel- ulum Otherspon- spon- adult courses opment inte- curric- Books/
Teaching assignment Teaching sored sored edu- in asso- gration ulum materialsand vocational teachers induction work- work- cation subject ciation com- com- com-by school type None All program shops shops courses field activities mittee mittee mittee
Total 3.8 1.9 25.9 84.2 78.4 25.6 24.4 52.2 23.6 38.6 29.6
Teaching assignment
Vocational education 3.6 2.9 25.9 82.3 77.9 30.4 24.4 57.9 43.2 37.2 26.9
Academic education 3.9 1.8 25.8 84.3 78.1 24.7 23.8 51.5 19.4 40.2 32.1
Special education 2.9 1.4 26.0 86.3 81.9 25.0 28.8 47.9 24.6 28.5 14.1
Vocational teachers by school type
Comprehensive high
school 3.6 2.8 24.4 83.8 77.9 29.2 24.1 57.8 43.0 37.6 27.4
Vocational high school 3.4 2.7 36.0 69.2 76.2 41.2 27.7 58.1 43.7 33.9 24.5 Other 4.6 5.1 34.1 81.3 82.1 31.6 24.1 59.3 45.9 36.9 22.2
SOURCE: U.S. Department of Education, National Center for Education Statistics, Schools and Staffing Survey, 1993–94.
Professional development activities
Figure 25—Percentage of public school vocational teachers of grades 9 through 12 who reportedFigure 25—participating in various professional development activities: 1993–94
SOURCE: U.S. Department of Education, National Center for Education Statistics, Schools and Staffing Survey, 1993–94.
8278
58
4337
3027 26 24
0
20
40
60
80
100
District-sponsoredworkshops
School-sponsoredworkshops
Professionaldevelopmentassociationactivities
Curriculumintegrationcommittee
Other curriculumcommittee
Extension/adulteducation courses
Books/materialscommittee
Teaching inductionprogram
College courses insubject field
Percent

IV. Trends in Secondary Vocational Education
103
• Most teachers (85 percent) participated in at least one type of inservice activity in 1993–
94 (table 57). The activities surveyed included the following topics: educational technol-
ogy, student assessment, cooperative learning, various methods of teaching in one’s
subject field, and an in-depth study in that subject field. Vocational teachers were more
likely than other teachers to participate in workshops on the uses of educational technol-
ogy and to report participating in an in-depth study in their subject field.83 However, vo-
cational teachers were less likely than other teachers to participate in workshops on
methods of teaching in their subject field.
Table 57—Percentage of public school teachers of grades 9 through 12 who reported participating in Table 59—inservice/professional development activities focusing on various topics, by teachingTable 59—assignment and vocational teachers by school type: 1993–94
Methods
Teaching assignment Uses of of teaching In-depth Cooperativeand vocational teachers educational in study in Student learningby school type None All technology subject field subject field assessment in class
Total 14.5 8.6 51.1 54.2 27.4 45.0 48.1
Teaching assignment Vocational education 14.4 10.5 58.0 49.0 31.1 43.5 47.6 Academic education 14.7 7.9 50.4 54.7 26.0 44.9 47.8 Special education 13.0 10.8 45.0 59.2 32.0 48.1 51.0
Vocational teachers by school type Comprehensive high school 14.0 10.6 59.2 48.3 30.4 43.2 48.0 Vocational high school 17.9 10.0 48.1 51.0 38.8 43.9 43.2 Other 13.9 10.1 54.5 57.5 28.4 49.2 49.7
SOURCE: U.S. Department of Education, National Center for Education Statistics, Schools and Staffing Survey, 1993–94.
Inservice/professional development activities
• Most teachers (96 percent) reported that their professional development activities had
some impact (table 58). Possible types of impacts surveyed included providing new in-
formation, changing teaching views, changing teaching practices, seeking further infor-
mation or training, or being a waste of time. About 84 percent of all teachers were
provided with new information, while 59 percent reported that the activities caused them
83The survey did not specify what methods were taught or what topic was studied in depth.

IV. Trends in Secondary Vocational Education
104
Table 58—Percentage of public school teachers of grades 9 through 12 who agreed with various Table 60—statements about the impact of professional development activities, by teaching assignment:Table 60—1993–94
Caused CausedHad Provided Changed to change to seek Was asome new views on teaching information/ waste
Teaching assignment impact information teaching practices training of time
Total 96.2 83.5 38.4 59.0 58.7 13.7
Vocational education 96.2 86.1 38.5 58.3 60.4 11.1Academic education 96.1 82.9 38.6 59.1 57.9 14.5Special education 96.8 84.3 36.4 59.4 62.5 11.2
SOURCE: U.S. Department of Education, National Center for Education Statistics, Schools and Staffing Survey, 1993–94.
to change their teaching practices.84 Vocational teachers were more likely than academic
teachers to report that professional development activities provided new information and
caused them to seek further information or training. Vocational teachers were less likely
than their academic counterparts to report that professional development activities were a
waste of time.
• Almost three-quarters (73 percent) of all teachers reported receiving some support for in-
service or professional development activities (table 59). Types of support included re-
lease time, scheduled professional development time, travel and/or per diem expenses,
tuition and/or fees, and professional growth credits. Vocational teachers were more
likely than other teachers to report receiving travel and/or per diem support. This may be
related to the fact that they were generally more likely than other teachers to seek profes-
sional development opportunities outside their school or district.
Table 59—Percentage of public school teachers of grades 9 through 12 who reported receiving various typesTable 61—of support for inservice/professional development activities, by teaching assignment: 1993–94
Release Scheduled Travel and/ Tuition and/ Professional
Teaching assignment None All time time or per diem or fees growth credits
Total 27.2 3.1 43.2 35.2 27.7 20.5 28.8
Vocational education 24.9 3.3 42.8 34.8 37.3 21.3 32.2Academic education 28.4 2.9 42.5 34.6 26.4 20.1 27.8Special education 21.2 4.1 49.7 40.2 22.6 22.9 31.1
SOURCE: U.S. Department of Education, National Center for Education Statistics, Schools and Staffing Survey, 1993–94.
Types of support
84The survey did not ask teachers how they changed their teaching practices, only whether they did so.

IV. Trends in Secondary Vocational Education
105
Vocational teachers reported different professional development experiences depending on
their school setting:
• Vocational teachers in vocational schools were significantly less likely than vocational
teachers in comprehensive high schools to participate in district-sponsored workshops
and were more likely to take extension or adult education courses (table 56).85 Voca-
tional teachers in comprehensive high schools were significantly less likely than other
vocational teachers to have participated in a teaching induction program during their first
year of teaching. These findings suggest that regular school districts may be somewhat
less successful at meeting the professional development needs of their vocational teach-
ers. It may also be that vocational schools or districts offer fewer activities directly, re-
lying more on outside professional development opportunities.
• Vocational teachers in vocational schools were less likely than vocational teachers in
comprehensive and other high schools to participate in inservices on the uses of educa-
tional technology, and more likely than these teachers to participate in an in-depth study
in their subject field (table 57).86 This may be due to the different types of vocational
programs that are typically offered in vocational and comprehensive schools.87 Alterna-
tively, this may be due to the possibility of vocational teachers in vocational schools
having greater industry experience before entering teaching. Two phenomena suggest
that this may be true. First, vocational teachers in vocational schools tended to be older
than vocational teachers in comprehensive high schools when they first began to teach
(table 60). Second, they were also more likely than these teachers to have less than a
bachelor’s degree (table 60).88 As stated previously, some states count industry experi-
ence in place of education in hiring some vocational teachers.89
85The difference in adult education participation between vocational teachers in vocational high schools and those in unspecified“other” high schools was large but not statistically significant; there were small sample sizes and large standard errors for thesetwo groups.86The difference in participation in inservices on the uses of educational technology between vocational teachers in vocationalhigh schools and those in unspecified “other” high schools was somewhat large but not statistically significant; there were smallsample sizes and large standard errors for these two groups.87The previous comprehensive NCES publication on vocational education found that vocational teachers in vocational schoolswere more like than their counterparts in comprehensive high schools to teach in the trade and industry, technical, and healthareas. See K. Levesque, et al., Vocational Education in the United States: The Early 1990s (NCES 95–024) (Washington, D.C.:U.S. Department of Education, National Center for Education Statistics, 1995) p. 20.88Vocational teachers in vocational schools were also more likely than their vocational colleagues in “other” schools to have lessthan a bachelor’s degree.89See “The State of Certification,” Vocational Education Journal 68 (6) (September 1993): 30–35.
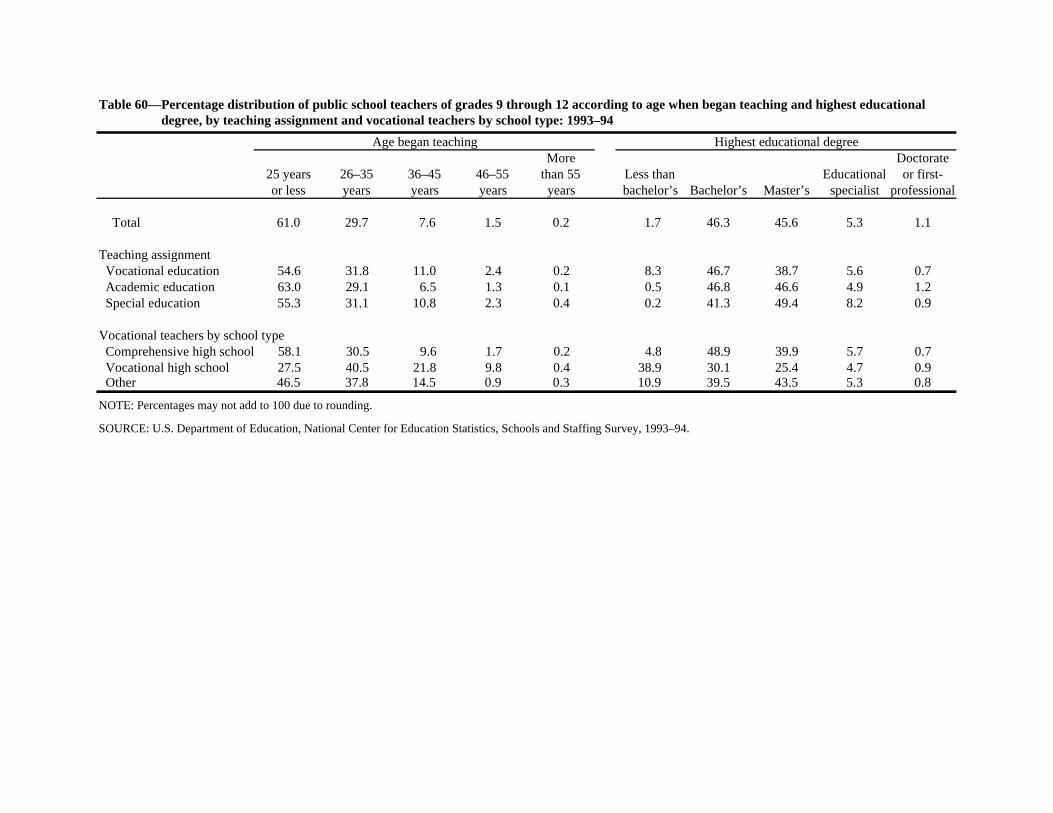
Table 60—Percentage distribution of public school teachers of grades 9 through 12 according to age when began teaching and highest educational Table 60—degree, by teaching assignment and vocational teachers by school type: 1993–94
Age began teaching Highest educational degreeMore Doctorate
25 years 26–35 36–45 46–55 than 55 Less than Educational or first-or less years years years years bachelor’s Bachelor’s Master’s specialist professional
Total 61.0 29.7 7.6 1.5 0.2 1.7 46.3 45.6 5.3 1.1
Teaching assignment Vocational education 54.6 31.8 11.0 2.4 0.2 8.3 46.7 38.7 5.6 0.7 Academic education 63.0 29.1 6.5 1.3 0.1 0.5 46.8 46.6 4.9 1.2 Special education 55.3 31.1 10.8 2.3 0.4 0.2 41.3 49.4 8.2 0.9
Vocational teachers by school type Comprehensive high school 58.1 30.5 9.6 1.7 0.2 4.8 48.9 39.9 5.7 0.7 Vocational high school 27.5 40.5 21.8 9.8 0.4 38.9 30.1 25.4 4.7 0.9 Other 46.5 37.8 14.5 0.9 0.3 10.9 39.5 43.5 5.3 0.8
NOTE: Percentages may not add to 100 due to rounding.
SOURCE: U.S. Department of Education, National Center for Education Statistics, Schools and Staffing Survey, 1993–94.