vocal tract resonances in singing: variation with ... · vocal tract resonances in singing:...
TRANSCRIPT

Vocal tract resonances in singing: Variation with laryngealmechanism for male operatic singers in chest and falsettoregisters
Nathalie Henrich Bernardonia)
Department of Speech and Cognition, GIPSA-lab (UMR5216: CNRS, Grenoble Institute of Technology,Grenoble University), Grenoble, France
John Smith and Joe WolfeSchool of Physics, University of New South Wales, Sydney, New South Wales 2052, Australia
(Received 17 October 2012; revised 5 November 2013; accepted 12 November 2013)
Seven male operatic singers sang the same notes and vowels in their chest and their falsetto registers,
covering the overlap frequency range where two main laryngeal mechanisms can be identified by
means of electroglottography: M1 in chest register and M2 in falsetto register. Glottal contact
quotients determined using electroglottography were typically lower by 0.27 in M2 than in M1.
Vocal tract resonance frequencies were measured by using broadband excitation at the lips and
found to be typically lower in M2 than in M1 sung at the same pitch and vowel; R1 typically by
65 Hz and R2 by 90 Hz. These shifts in tract resonances were only weakly correlated with the
changes in the contact quotient or laryngeal height that were measured simultaneously. There was
considerable variability in the resonance tuning strategies used by the singers, and no evidence of a
uniform systematic tuning strategy used by all singers. A simple model estimates that the shifts in
resonance frequencies are consistent with the effective glottal area in falsetto register (M2) being
60%–70% of its value in chest register (M1). VC 2014 Acoustical Society of America.
[http://dx.doi.org/10.1121/1.4836255]
PACS number(s): 43.75.Rs, 43.70.Gr [CHS] Pages: 491–501
I. INTRODUCTION
The source-filter model of voice production usually
locates the source at the glottis and identifies the vocal tract
as the filter. Resonances in the vocal tract produce maxima
in the spectral envelopes of the output sound; these maxima
are called formants. The source and filter interact and differ-
ent tract configurations are understood to affect glottal
behavior (Rothenberg, 1980; Fant and Lin, 1987; Childers
and Wong, 1994; Barney et al., 2007; Titze, 2004, 2008).
Changes in glottal configuration have been demonstrated to
change the vocal tract resonance and formant frequencies in
speech (Klatt and Klatt, 1990; Barney et al., 2007; Swerdlin
et al., 2010) and their bandwidths (Nord et al., 1986). In
singing, some research has focused on glottal properties and
some on vocal tract acoustics and articulatory behaviors, but
few studies have investigated the relationship between them
(Miller and Schutte, 2005; Hanna et al., 2012). This paper
investigates whether the vocal tract resonance frequencies
change with the change in laryngeal mechanism associated
with the chest-falsetto register transition. It reports simulta-
neous measurements of vocal fold vibration, using electro-
glottography, and vocal tract resonances, measured using
broadband excitation at the lips.
Male operatic singers commonly use from one to three
singing-voice registers to cover their working range (Henrich,
2006). Except in the case of the “voix mixte” register, these
singing-voice registers are usually associated with different
timbres, and thus can often be distinguished by a trained lis-
tener. The timbral modifications may result from several
aspects of the vocal gesture, including intrinsic differences in
the laryngeal behavior, their impact on vocal-tract acoustics,
and articulatory adjustments.
When the glottal biomechanics are considered, the fol-
lowing two main laryngeal mechanisms can be distinguished
and identified by means of electroglottography: M1, in which
modal or chest registers are produced, and M2, in which loftor falsetto registers are produced (Hollien, 1974; Roubeau,
1993; Henrich, 2006; Roubeau et al., 2009). (When the terms
“modal” and “falsetto” are used to describe laryngeal mecha-
nisms rather than specific singing-voice qualities, they are
synonymous with M1 and M2.) Laryngeal mechanisms M1
and M2 are thought to be associated, respectively, with the
increase or decrease in vibrating mass that results from the
coupling or decoupling (respectively) of the layered vocal
fold structure to the inferior thyro-arytenoid or vocalis mus-
cle (Hirano, 1982). Counter-tenors and altos excepted, male
operatic singers are trained to sing mainly in chest register,
which is produced using M1. Even if it is not used in per-
formance, some of them also practice their falsetto register,
which is produced using M2. There is a range of frequencies
where both laryngeal mechanisms are possible and the singer
can choose to use either (Roubeau et al., 2004).
The use of a given laryngeal mechanism influences
glottal-source parameters such as the open, closed or contact
quotient (Henrich et al., 2005). The glottal contact quotient
is positively correlated with sound pressure level (SPL) in
a)Author to whom correspondence should be addressed. Electronic mail:
J. Acoust. Soc. Am. 135 (1), January 2014 VC 2014 Acoustical Society of America 4910001-4966/2014/135(1)/491/11/$30.00

M1, and with fundamental frequency in M2. It is generally
less than 50% of the fundamental period in M2, while it can
take higher values (as large as 70%) in M1. At any given
pitch within the overlap range, the contact quotient is com-
monly found to be higher in M1 than in M2. The vocal-fold
vibratory amplitude also depends on the laryngeal mecha-
nism in use, being greater in M1 than in M2 (Rubin and Hirt,
1960 as cited in Hollien, 1974; Hoppe et al., 2003). Barney
et al. (2007) have demonstrated that an increase in glottal
width or glottal-opening duration will raise the first formant
frequency. It is thus possible that the observed differences in
glottal behavior between the two main laryngeal mecha-
nisms could be reflected in differences in the acoustics of the
vocal tract. Several studies have assessed the sound spectral
differences between singing-voice registers (Colton, 1972;
Large et al., 1972; Hollien, 1974; Neumann et al., 2005).
However the sound is a consequence of both the source spec-
trum at the vocal folds and the transfer characteristics of the
vocal tract, and it is difficult to untangle their relative contri-
butions using the sound spectrum alone.
Recently, dynamic magnetic resonance imaging (MRI)
has been used to study articulatory adjustments associated
with transitions between singing-voice registers (Echternach
et al., 2008, 2009, 2010). These studies have shown that
only minor changes in the vocal tract are associated with the
transition between modal and falsetto registers in male and
female voices. Larynx height and tilt were measured on MRI
images using a proper metric. The tilt was derived as the
angle between a line from the anterior commissure to the
vocal process and a line connecting the cranial-most part of
the dens axis and the caudo-anterior edge of the sixth verte-
bra. The larynx was found to be higher and more tilted in fal-
setto (M2) than in modal register (M1), and the tongue
dorsum was lifted more in falsetto register.
The acoustic response of the vocal tract can also be
measured non-invasively during a singing performance by
means of a broadband acoustic source and a microphone
placed at the lower lip (Epps et al., 1997). This introduces
the complication that the tract is measured from the opposite
end to where the vocal folds are located. It is also measured
in parallel with the external radiation field, which means
that, although the resonance frequencies can be determined,
their bandwidths and magnitudes cannot. The changes in res-
onance frequency associated with changes in tract geometry
in the supraglottal region can thus be reliably characterized
(Joliveau et al., 2004a,b; Henrich et al., 2007; Garnier et al.,2010; Henrich et al., 2011). Changes in glottal characteris-
tics alter the reflection condition at the upstream end of the
supraglottal region and can thus alter the measured reso-
nance frequencies; e.g., shifts in resonance frequencies
between normal, creak, and whisper phonation have been
measured by (Swerdlin et al., 2010). During phonation,
although the glottal area is constantly varying, the measured
impedance strongly resembles that measured by miming
with the glottis closed, albeit with the expected slight shifts
in resonance frequency due to the effective opening area of
the glottis. Resonances typically involve multiple reflections
and it might be expected that the effective glottal area is an
average of the variations in glottal area with time. The
exception is when the impedance is measured at a harmonic
of the pitch frequency when the glottal area should remain
constant, however, these are the only frequencies at which
the impedance at the lips cannot be measured during phona-
tion as the voice signal interferes with those frequency com-
ponents of the injected signal. Thus the nonlinearities
associated with vocal fold vibration do not affect the imped-
ance measurements, except at these harmonics. The subglot-
tal region also has resonances that might affect the measured
impedance via the varying glottal opening during phonation.
Experiments with a new technique (Hanna et al., 2012) have
allowed the subglottal resonances to be discerned, but only
when the folds are widely separated during respiration—
they are not evident during normal phonation. This suggests
that application of this technique to measure the differences
in resonance frequencies between M1 and M2 phonation
could provide an estimate of any change in effective area
that might be involved, and that could be related to those
observed via endoscopy.
In this paper, the resonance frequencies of the vocal
tract are measured during phonation using broadband excita-
tion at the lips. Compared with linear prediction or MRI-
reconstructed area functions, this method has the advantage
of making no assumptions about glottal source properties.
Compared with techniques requiring glottal-source adjust-
ments, such as vocal fry or ingressive phonation (Miller
et al., 1997), it has the advantage of allowing direct measure-
ment during M1 and M2 phonation. Electroglottographic
vocal-fold contact area and vocal-tract resonance frequen-
cies were measured simultaneously on professional operatic
tenors and baritones. Measurements included the overlap
range where the singer can choose to use either laryngeal
mechanism.
II. MATERIALS AND METHODS
A. Resonance measurements
Vocal tract resonances were measured at UNSW using a
modified version of a technique described previously (Epps
et al., 1997; Joliveau et al., 2004a). A computer (Macintosh
IIci–Apple Computer, CA) with an analog interface card
(National Instruments NB-A2100, Austin, TX) synthesizes a
broadband signal as a sum of sine waves with frequencies
spaced at 5.38 Hz and phases adjusted to improve the signal
to noise ratio (Smith, 1995). This signal is amplified and
drives an acoustically isolated loudspeaker connected via an
exponential horn to a tube with inner diameter 7 mm.
This acoustic source is positioned at the subject’s lower lip
(Fig. 1). Attached to it is a prepolarized pressure-field micro-
phone (DeltaTron Pressure-field 1/4 in. Microphone Type
4944A, Bruel & Kjaer, Denmark). The acoustic source
excites the vocal tract during singing, and both the singing
voice and the response of the tract to the excitation signal
are recorded by the microphone. The ratio of the latter signal
to one measured previously on the outside of the closed lips
gives the ratio of two impedances: the impedance of the tract
in parallel with the radiation field and that of the radiation
field itself. The frequencies of the vocal tract resonances are
measured from this impedance ratio.
492 J. Acoust. Soc. Am., Vol. 135, No. 1, January 2014 Henrich Bernardoni et al.: Resonance variation with laryngeal mechanism
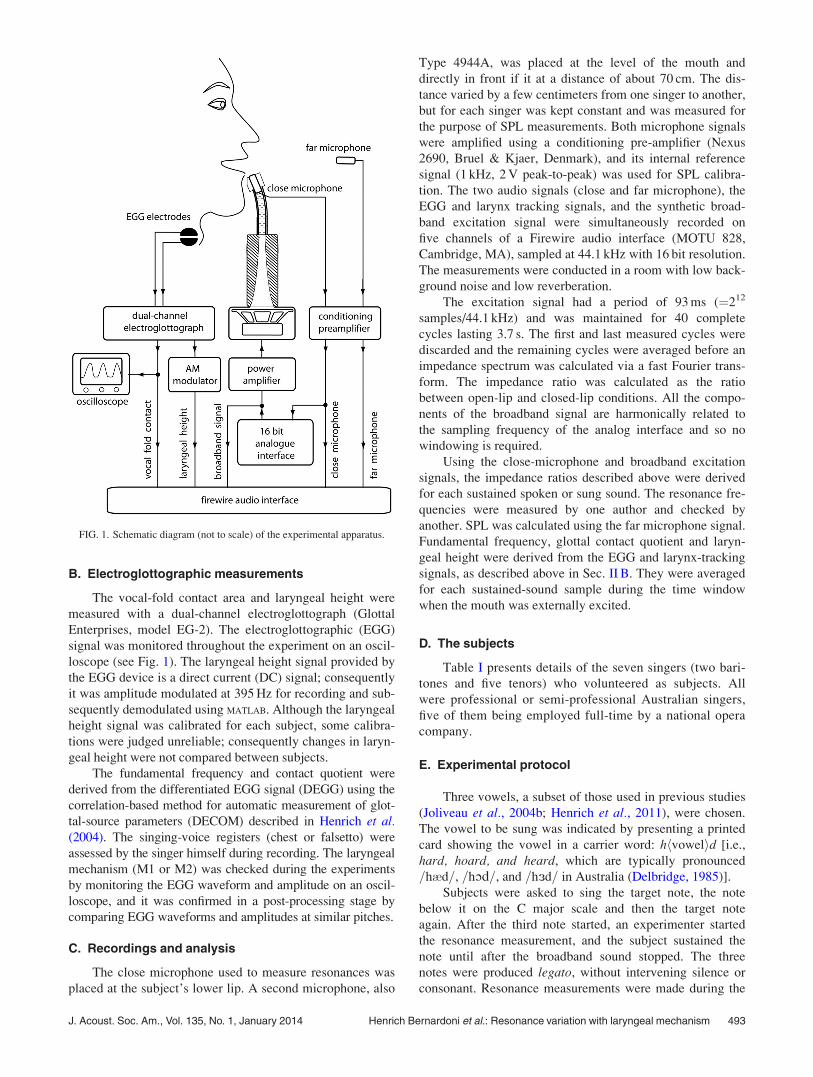
B. Electroglottographic measurements
The vocal-fold contact area and laryngeal height were
measured with a dual-channel electroglottograph (Glottal
Enterprises, model EG-2). The electroglottographic (EGG)
signal was monitored throughout the experiment on an oscil-
loscope (see Fig. 1). The laryngeal height signal provided by
the EGG device is a direct current (DC) signal; consequently
it was amplitude modulated at 395 Hz for recording and sub-
sequently demodulated using MATLAB. Although the laryngeal
height signal was calibrated for each subject, some calibra-
tions were judged unreliable; consequently changes in laryn-
geal height were not compared between subjects.
The fundamental frequency and contact quotient were
derived from the differentiated EGG signal (DEGG) using the
correlation-based method for automatic measurement of glot-
tal-source parameters (DECOM) described in Henrich et al.(2004). The singing-voice registers (chest or falsetto) were
assessed by the singer himself during recording. The laryngeal
mechanism (M1 or M2) was checked during the experiments
by monitoring the EGG waveform and amplitude on an oscil-
loscope, and it was confirmed in a post-processing stage by
comparing EGG waveforms and amplitudes at similar pitches.
C. Recordings and analysis
The close microphone used to measure resonances was
placed at the subject’s lower lip. A second microphone, also
Type 4944A, was placed at the level of the mouth and
directly in front if it at a distance of about 70 cm. The dis-
tance varied by a few centimeters from one singer to another,
but for each singer was kept constant and was measured for
the purpose of SPL measurements. Both microphone signals
were amplified using a conditioning pre-amplifier (Nexus
2690, Bruel & Kjaer, Denmark), and its internal reference
signal (1 kHz, 2 V peak-to-peak) was used for SPL calibra-
tion. The two audio signals (close and far microphone), the
EGG and larynx tracking signals, and the synthetic broad-
band excitation signal were simultaneously recorded on
five channels of a Firewire audio interface (MOTU 828,
Cambridge, MA), sampled at 44.1 kHz with 16 bit resolution.
The measurements were conducted in a room with low back-
ground noise and low reverberation.
The excitation signal had a period of 93 ms (¼212
samples/44.1 kHz) and was maintained for 40 complete
cycles lasting 3.7 s. The first and last measured cycles were
discarded and the remaining cycles were averaged before an
impedance spectrum was calculated via a fast Fourier trans-
form. The impedance ratio was calculated as the ratio
between open-lip and closed-lip conditions. All the compo-
nents of the broadband signal are harmonically related to
the sampling frequency of the analog interface and so no
windowing is required.
Using the close-microphone and broadband excitation
signals, the impedance ratios described above were derived
for each sustained spoken or sung sound. The resonance fre-
quencies were measured by one author and checked by
another. SPL was calculated using the far microphone signal.
Fundamental frequency, glottal contact quotient and laryn-
geal height were derived from the EGG and larynx-tracking
signals, as described above in Sec. II B. They were averaged
for each sustained-sound sample during the time window
when the mouth was externally excited.
D. The subjects
Table I presents details of the seven singers (two bari-
tones and five tenors) who volunteered as subjects. All
were professional or semi-professional Australian singers,
five of them being employed full-time by a national opera
company.
E. Experimental protocol
Three vowels, a subset of those used in previous studies
(Joliveau et al., 2004b; Henrich et al., 2011), were chosen.
The vowel to be sung was indicated by presenting a printed
card showing the vowel in a carrier word: hhvowelid [i.e.,
hard, hoard, and heard, which are typically pronounced
=h�d=, =hOd=, and =h˘d= in Australia (Delbridge, 1985)].
Subjects were asked to sing the target note, the note
below it on the C major scale and then the target note
again. After the third note started, an experimenter started
the resonance measurement, and the subject sustained the
note until after the broadband sound stopped. The three
notes were produced legato, without intervening silence or
consonant. Resonance measurements were made during the
FIG. 1. Schematic diagram (not to scale) of the experimental apparatus.
J. Acoust. Soc. Am., Vol. 135, No. 1, January 2014 Henrich Bernardoni et al.: Resonance variation with laryngeal mechanism 493

third note, so that for that note the sound file contained suc-
cessively voice alone, voice plus broadband signal and
voice alone. The target pitch was indicated by playing a
note on a glockenspiel. For each vowel, each note in the C
major scale was presented from the bottom to the top of
each singer’s self-described comfortable singing range.
Where the ranges of the two laryngeal mechanisms M1 and
M2 overlapped, each vowel-note combination was meas-
ured in each mechanism. After each vowel on each note
was sung, they were also asked to speak the carrier word,
but to sustain the vowel for about 4 s while a measurement
was made.
III. RESULTS AND DISCUSSION
A. Glottal behavior
Figure 2 shows an example of how the measured param-
eters glottal contact quotient (CQ), SPL, and resonance fre-
quencies (R1 and R2) varied with frequency f0 for singer B2.
CQ is seen to be distinctly higher in chest (M1) than in fal-
setto register (M2). Although there is variability among sing-
ers, CQ in M2 was always smaller than in M1 when pairs of
measurements were compared at the same pitch for the same
singer and vowel (see Fig. 3). This is similar to the decrease
in closed quotient estimated by inverse filtering when tenors
TABLE I. Details of the participating singers. The overlap range indicates the region where both M1 and M2 were studied for that singer. Experience and sing-
ing style are specified using the taxonomy of Bunch and Chapman (2000) where the integer part indicates the professional level (e.g., 2¼ international,
3¼ national, 5¼ local community) and the fractional part indicates the style (e.g., 3.1¼ national opera, 3.4¼ national concert-oratorio-recital, etc.).
Baritone Baritone Tenor Tenor Tenor Tenor Tenor
Singer B1 B2 T1 T2 T3 T4 T5
Age 32 34 35 42 33 60 22
Taxonomy 2.15, 3.4 5.3 3.4 5.4 3.1c 3.1c 3.2b, 3.4, 3.9, 3.15a, 3.17
Pitch overlap range D4–G4 A3–F4 D4–B4 D4–A4 E3–A4 A3–F4 C4–A4
Frequency overlap range (Hz) 290–400 220–350 290–500 290–440 160–440 220–350 260–440
FIG. 2. (Color online) The variation of the CQ, SPL, and the first and second resonance frequencies (R1 and R2) with the pitch frequency f0 for baritone B2
singing in chest register with laryngeal mechanism M1 (closed circles) and falsetto with M2 (open circles). The diagonal, dashed gray lines indicate when a
resonance frequency would coincide with the nth harmonic (nf0); i.e., the possible relationships Ri¼ nf0. The horizontal gray lines indicate the resonance fre-
quencies measured in speech for the same singer and vowel.
494 J. Acoust. Soc. Am., Vol. 135, No. 1, January 2014 Henrich Bernardoni et al.: Resonance variation with laryngeal mechanism
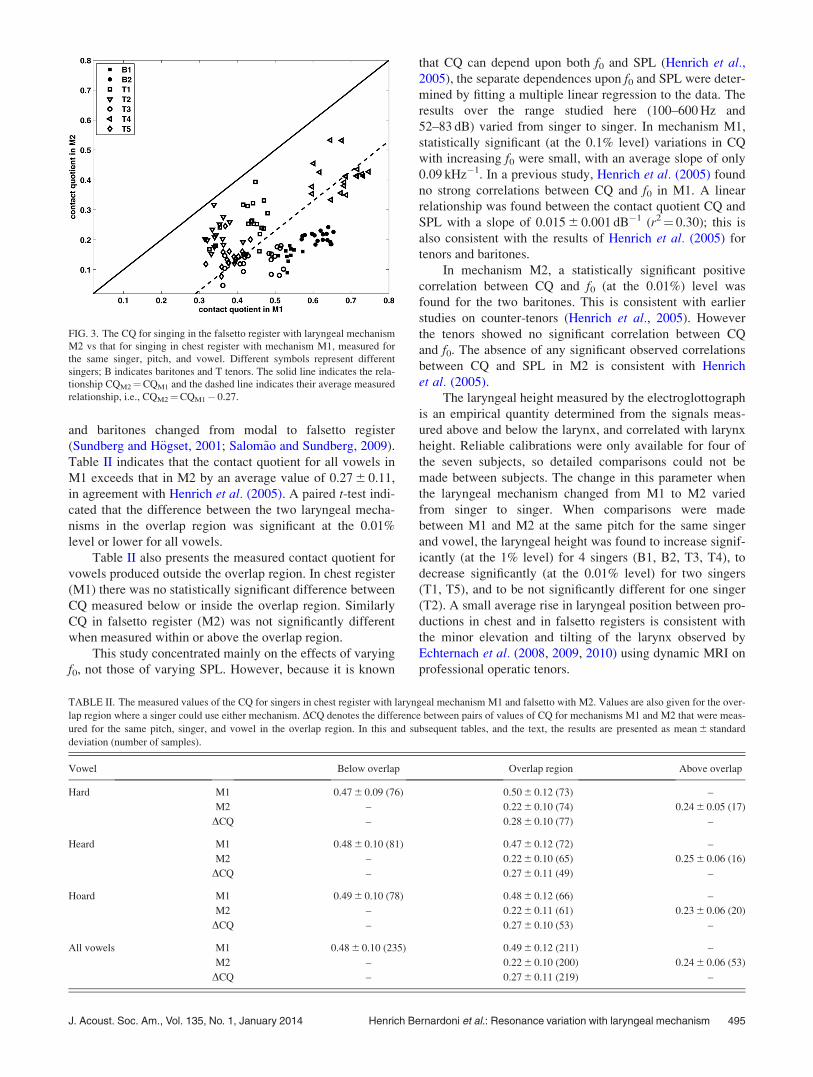
and baritones changed from modal to falsetto register
(Sundberg and H€ogset, 2001; Salom~ao and Sundberg, 2009).
Table II indicates that the contact quotient for all vowels in
M1 exceeds that in M2 by an average value of 0.27 6 0.11,
in agreement with Henrich et al. (2005). A paired t-test indi-
cated that the difference between the two laryngeal mecha-
nisms in the overlap region was significant at the 0.01%
level or lower for all vowels.
Table II also presents the measured contact quotient for
vowels produced outside the overlap region. In chest register
(M1) there was no statistically significant difference between
CQ measured below or inside the overlap region. Similarly
CQ in falsetto register (M2) was not significantly different
when measured within or above the overlap region.
This study concentrated mainly on the effects of varying
f0, not those of varying SPL. However, because it is known
that CQ can depend upon both f0 and SPL (Henrich et al.,2005), the separate dependences upon f0 and SPL were deter-
mined by fitting a multiple linear regression to the data. The
results over the range studied here (100–600 Hz and
52–83 dB) varied from singer to singer. In mechanism M1,
statistically significant (at the 0.1% level) variations in CQ
with increasing f0 were small, with an average slope of only
0.09 kHz�1. In a previous study, Henrich et al. (2005) found
no strong correlations between CQ and f0 in M1. A linear
relationship was found between the contact quotient CQ and
SPL with a slope of 0.015 6 0.001 dB�1 (r2¼ 0.30); this is
also consistent with the results of Henrich et al. (2005) for
tenors and baritones.
In mechanism M2, a statistically significant positive
correlation between CQ and f0 (at the 0.01%) level was
found for the two baritones. This is consistent with earlier
studies on counter-tenors (Henrich et al., 2005). However
the tenors showed no significant correlation between CQ
and f0. The absence of any significant observed correlations
between CQ and SPL in M2 is consistent with Henrich
et al. (2005).
The laryngeal height measured by the electroglottograph
is an empirical quantity determined from the signals meas-
ured above and below the larynx, and correlated with larynx
height. Reliable calibrations were only available for four of
the seven subjects, so detailed comparisons could not be
made between subjects. The change in this parameter when
the laryngeal mechanism changed from M1 to M2 varied
from singer to singer. When comparisons were made
between M1 and M2 at the same pitch for the same singer
and vowel, the laryngeal height was found to increase signif-
icantly (at the 1% level) for 4 singers (B1, B2, T3, T4), to
decrease significantly (at the 0.01% level) for two singers
(T1, T5), and to be not significantly different for one singer
(T2). A small average rise in laryngeal position between pro-
ductions in chest and in falsetto registers is consistent with
the minor elevation and tilting of the larynx observed by
Echternach et al. (2008, 2009, 2010) using dynamic MRI on
professional operatic tenors.
FIG. 3. The CQ for singing in the falsetto register with laryngeal mechanism
M2 vs that for singing in chest register with mechanism M1, measured for
the same singer, pitch, and vowel. Different symbols represent different
singers; B indicates baritones and T tenors. The solid line indicates the rela-
tionship CQM2¼CQM1 and the dashed line indicates their average measured
relationship, i.e., CQM2¼CQM1� 0.27.
TABLE II. The measured values of the CQ for singers in chest register with laryngeal mechanism M1 and falsetto with M2. Values are also given for the over-
lap region where a singer could use either mechanism. DCQ denotes the difference between pairs of values of CQ for mechanisms M1 and M2 that were meas-
ured for the same pitch, singer, and vowel in the overlap region. In this and subsequent tables, and the text, the results are presented as mean 6 standard
deviation (number of samples).
Vowel Below overlap Overlap region Above overlap
Hard M1 0.47 6 0.09 (76) 0.50 6 0.12 (73) –
M2 – 0.22 6 0.10 (74) 0.24 6 0.05 (17)
DCQ – 0.28 6 0.10 (77) –
Heard M1 0.48 6 0.10 (81) 0.47 6 0.12 (72) –
M2 – 0.22 6 0.10 (65) 0.25 6 0.06 (16)
DCQ – 0.27 6 0.11 (49) –
Hoard M1 0.49 6 0.10 (78) 0.48 6 0.12 (66) –
M2 – 0.22 6 0.11 (61) 0.23 6 0.06 (20)
DCQ – 0.27 6 0.10 (53) –
All vowels M1 0.48 6 0.10 (235) 0.49 6 0.12 (211) –
M2 – 0.22 6 0.10 (200) 0.24 6 0.06 (53)
DCQ – 0.27 6 0.11 (219) –
J. Acoust. Soc. Am., Vol. 135, No. 1, January 2014 Henrich Bernardoni et al.: Resonance variation with laryngeal mechanism 495

The measured variation of laryngeal height with pitch
varied considerably between singers. In chest register, the
only significant (at the 0.3% level) correlations were for
three singers (T1, T2, and T5), where the laryngeal height
increased with increasing pitch for all three vowels. In fal-
setto register, only one of the 21 possible combinations of
singer and vowel indicated a significant increase in laryngeal
height with increasing pitch, whereas in three combinations
the laryngeal height decreased.
B. Vocal tract resonances
Figure 2 shows an example of how the measured reso-
nance frequencies varied with frequency f0 for singer B2. The
values of R1 and R2 are seen to be generally lower in M2 (fal-
setto productions) than in M1 (chest productions). Although
there is variation among singers, the average values of R1 and
R2 are typically around 60–70 Hz lower in M2 than they are in
M1—see Table III. This difference can be further character-
ized by calculating DR1 and DR2, which are the amounts by
which R1 and R2 measured in M1 exceed that in M2, when
measured for the same singer, vowel, and pitch. The differen-
ces DR1 and DR2 are each statistically significant at the 0.01%
level or better. Figure 4(a) shows the values of R1 in M1 plot-
ted against R1 in M2 when measured for the same singer,
vowel, and pitch. A similar plot [Fig. 4(b)] demonstrates how
R2 varies between vowels produced in the two laryngeal
mechanisms. The average ratio of these values in M2 with
respect to those in M1 was 0.90 6 0.12 (107) for R1 and
0.92 6 0.10 (111) for R2. Tenor T5 was the only singer whose
R1 and R2 values were consistently higher in M2 than M1.
The measured overall decrease in resonance frequencies on
the transition from chest register in laryngeal mechanism M1
to falsetto register in M2 is the opposite from that reported for
the transition from “classical” to “non-classical” productions
(Sundberg et al., 2011).
Although Table III indicates that the average values of
R1 and R2 in M1 measured in the overlap region were typi-
cally slightly higher than their values measured below the
overlap region, these differences were not significant at the
1% level. Similarly, although the values of R1 and R2 in M2
were slightly lower when measured in the overlap region
than when measured above, these differences were again not
significant at the 1% level. The exception was for the vowel
in “hoard” where the increase in the values of R1 and R2 in
FIG. 4. (a) Shows plots of the first tract resonance frequency, R1, for singing
in the falsetto register with laryngeal mechanism M2 vs R1 for singing in chest
register with mechanism M1, measured for the same singer, pitch, and vowel.
(b) Shows the same for the second tract resonance, R2. The solid gray line
indicates the relationship RiM2¼RiM1, and the dashed lines indicate the aver-
age measured relationships R1M2¼R1M1 – 65 Hz and R2M2¼R2M1 – 90 Hz.
TABLE III. The measured values of the first (R1) and second (R2) vocal tract resonances for vowels produced by singers in chest register with laryngeal mech-
anism M1 and falsetto register with M2. DRi denotes the frequency by which Ri in M1 exceeded that in M2 measured between pairs of values of Ri measured
for the same pitch, singer, and vowel. The symbol * indicates that the difference DRi was significant at the 1% level or lower as indicated by a paired t-test.
Vowel
Mechanism Region Hard Heard Hoard
R1 (Hz) M1 below overlap 645 6 65 (45) 555 6 65 (40) 515 6 60 (42)
R1 (Hz) M1 overlap 645 6 70 (32) 585 6 85 (38) 580 6 70 (37)
DR1 (Hz) M1–M2 overlap 75 6 80 (32)* 50 6 70 (38)* 75 6 70 (37)*
R1 (Hz) M2 overlap 570 6 70 (32) 535 6 40 (38) 505 6 50 (37)
R1 (Hz) M2 above overlap 623 6 125 (10) 510 6 70 (10) 490 6 55 (10)
R2 (Hz) M1 below overlap 1080 6 70 (40) 1205 6 85 (45) 850 6 85 (41)
R2 (Hz) M1 overlap 1105 6 75 (43) 1230 6 75 (32) 1005 6 85 (36)
DR2 (Hz) M1–M2 overlap 85 6 110 (43)* 70 6 95 (32)* 110 6 105 (36)*
R2 (Hz) M2 overlap 1020 6 85 (43) 1160 6 55 (32) 900 6 85 (36)
R2 (Hz) M2 above overlap 1035 6 75 (9) 1090 6 85 (10) 940 6 85 (12)
496 J. Acoust. Soc. Am., Vol. 135, No. 1, January 2014 Henrich Bernardoni et al.: Resonance variation with laryngeal mechanism
M1 when in the overlap region was significant at the 0.01%
level. This is possibly because the values of R1 and R2 in
speech for “hoard” are lower than in “hard” and “heard,”
and thus resonance tuning, which usually involves an
increase in resonance frequencies, might become increas-
ingly advantageous as the frequency increases—see Fig. 2.
There thus appears to be nothing special about the tract
resonances in the overlap region that allow a singer to use
chest register with laryngeal mechanism M1 or falsetto
register with laryngeal mechanism M2.
The differences DR1 and DR2 from 34 measurements for
the same singer, pitch, and vowel were found to be correlated
(r2¼ 0.62) and described by DR2¼ 60 Hzþ 0.71�DR1 and
significant at the 0.1% level. This suggests that the changes in
resonance frequency between chest and falsetto registers
might share a common origin.
C. Are the resonances tuned to match harmonics?
As the fundamental frequency f0 increases it is likely
that R1 and R2, even if left unaltered from their values in
speech, will at times approach a harmonic. Reliable identifi-
cation of resonance tuning, which can be defined as the
adjustment of a resonance so that it becomes closer in fre-
quency to f0 or a harmonic, generally requires several suc-
cessive values of f0 to be tuned closed to the same harmonic.
Figure 2 plots R1 and R2 as a function of f0 for all three vow-
els produced in the two laryngeal mechanisms for the bari-
tone B2. Even at the highest pitches reached in M1, the
fundamental frequency f0 was less than the value of R1
measured in speech for that singer and vowel, and conse-
quently the strategy of tuning R1 to f0 (R1:f0 tuning) over a
wide pitch range that has been observed at higher pitches for
most female singers is absent (Sundberg, 1975; Joliveau
et al., 2004a,b; Garnier et al., 2010; Henrich et al., 2011).
There is, however, an indication of the onset of R1:f0 tuning
at the highest frequencies in M2 for “hoard.” There is also
evidence of R1:2f0 and R1:3f0 tuning in M1, and evidence of
R1:2f0 tuning in M2; strategies shown previously to be used
by altos, tenors, and baritones (Henrich et al., 2011). For R2,
there are possible instances of R2:4f0, R2:5f0, R2:6f0, and
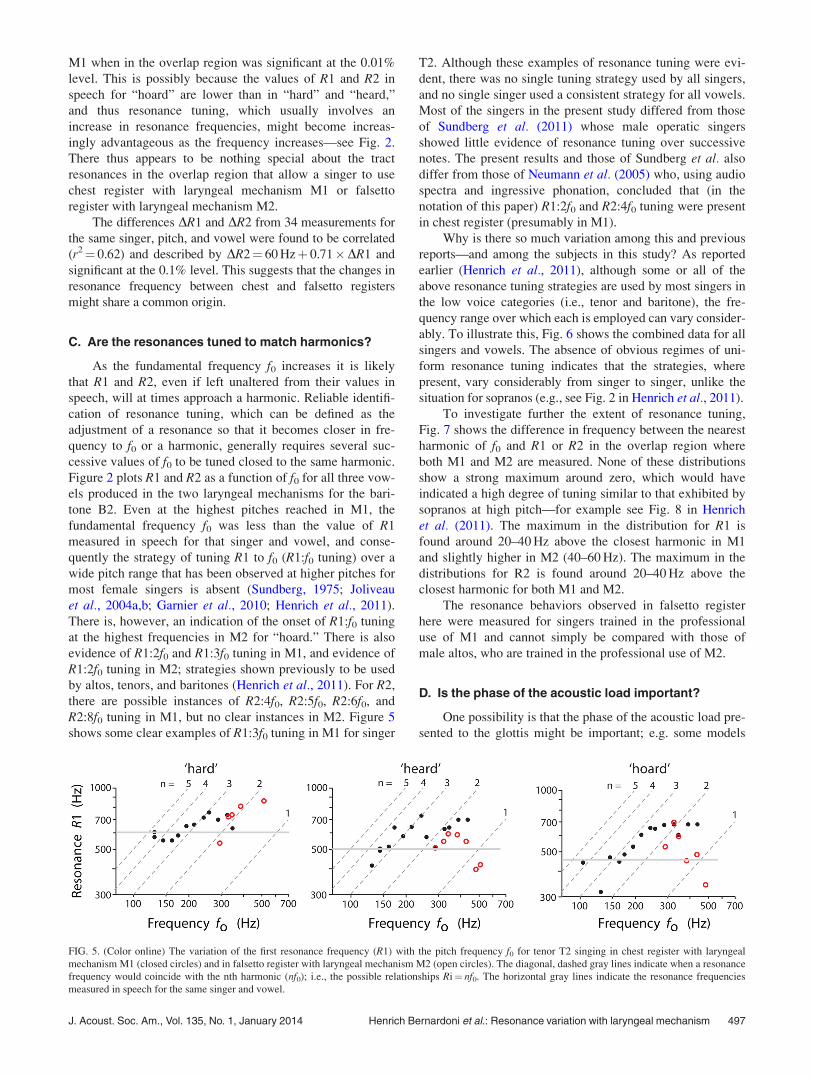
R2:8f0 tuning in M1, but no clear instances in M2. Figure 5
shows some clear examples of R1:3f0 tuning in M1 for singer
T2. Although these examples of resonance tuning were evi-
dent, there was no single tuning strategy used by all singers,
and no single singer used a consistent strategy for all vowels.
Most of the singers in the present study differed from those
of Sundberg et al. (2011) whose male operatic singers
showed little evidence of resonance tuning over successive
notes. The present results and those of Sundberg et al. also
differ from those of Neumann et al. (2005) who, using audio
spectra and ingressive phonation, concluded that (in the
notation of this paper) R1:2f0 and R2:4f0 tuning were present
in chest register (presumably in M1).
Why is there so much variation among this and previous
reports—and among the subjects in this study? As reported
earlier (Henrich et al., 2011), although some or all of the
above resonance tuning strategies are used by most singers in
the low voice categories (i.e., tenor and baritone), the fre-
quency range over which each is employed can vary consider-
ably. To illustrate this, Fig. 6 shows the combined data for all
singers and vowels. The absence of obvious regimes of uni-
form resonance tuning indicates that the strategies, where
present, vary considerably from singer to singer, unlike the
situation for sopranos (e.g., see Fig. 2 in Henrich et al., 2011).
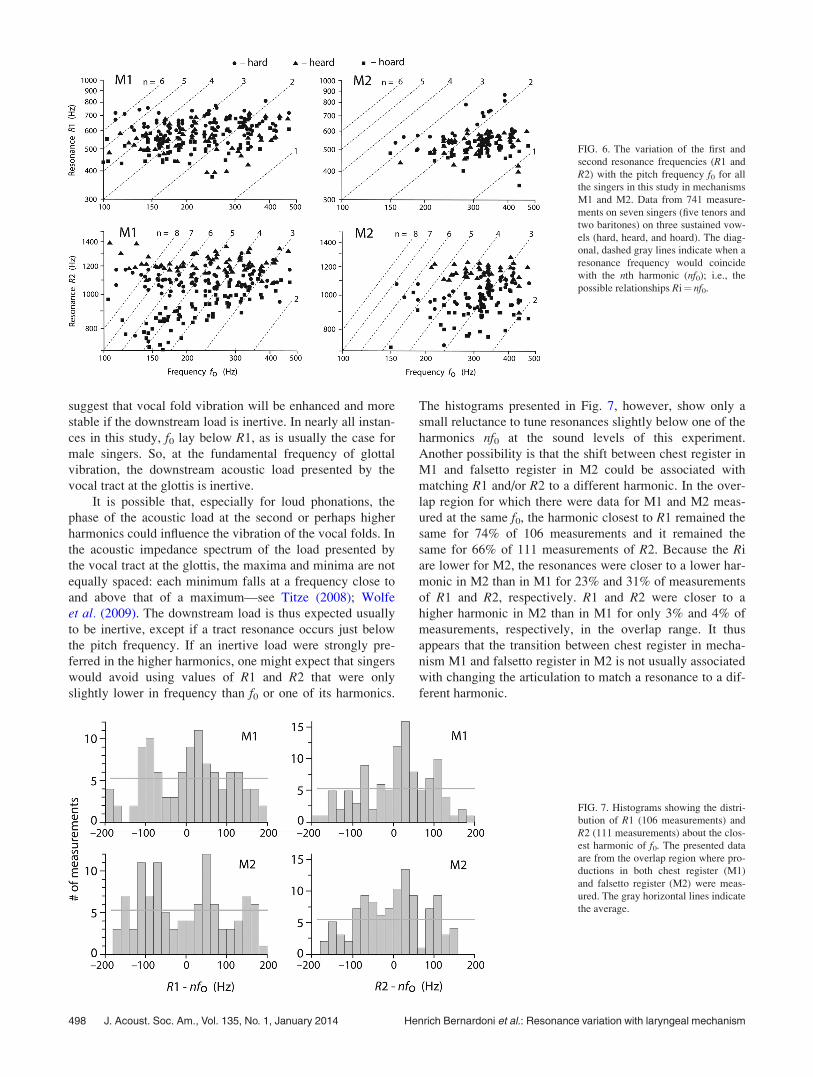
To investigate further the extent of resonance tuning,
Fig. 7 shows the difference in frequency between the nearest
harmonic of f0 and R1 or R2 in the overlap region where
both M1 and M2 are measured. None of these distributions
show a strong maximum around zero, which would have
indicated a high degree of tuning similar to that exhibited by
sopranos at high pitch—for example see Fig. 8 in Henrich
et al. (2011). The maximum in the distribution for R1 is
found around 20–40 Hz above the closest harmonic in M1
and slightly higher in M2 (40–60 Hz). The maximum in the
distributions for R2 is found around 20–40 Hz above the
closest harmonic for both M1 and M2.
The resonance behaviors observed in falsetto register
here were measured for singers trained in the professional
use of M1 and cannot simply be compared with those of
male altos, who are trained in the professional use of M2.
D. Is the phase of the acoustic load important?
One possibility is that the phase of the acoustic load pre-
sented to the glottis might be important; e.g. some models
FIG. 5. (Color online) The variation of the first resonance frequency (R1) with the pitch frequency f0 for tenor T2 singing in chest register with laryngeal
mechanism M1 (closed circles) and in falsetto register with laryngeal mechanism M2 (open circles). The diagonal, dashed gray lines indicate when a resonance
frequency would coincide with the nth harmonic (nf0); i.e., the possible relationships Ri¼ nf0. The horizontal gray lines indicate the resonance frequencies
measured in speech for the same singer and vowel.
J. Acoust. Soc. Am., Vol. 135, No. 1, January 2014 Henrich Bernardoni et al.: Resonance variation with laryngeal mechanism 497
suggest that vocal fold vibration will be enhanced and more
stable if the downstream load is inertive. In nearly all instan-
ces in this study, f0 lay below R1, as is usually the case for
male singers. So, at the fundamental frequency of glottal
vibration, the downstream acoustic load presented by the
vocal tract at the glottis is inertive.
It is possible that, especially for loud phonations, the
phase of the acoustic load at the second or perhaps higher
harmonics could influence the vibration of the vocal folds. In
the acoustic impedance spectrum of the load presented by
the vocal tract at the glottis, the maxima and minima are not
equally spaced: each minimum falls at a frequency close to
and above that of a maximum—see Titze (2008); Wolfe
et al. (2009). The downstream load is thus expected usually
to be inertive, except if a tract resonance occurs just below
the pitch frequency. If an inertive load were strongly pre-
ferred in the higher harmonics, one might expect that singers
would avoid using values of R1 and R2 that were only
slightly lower in frequency than f0 or one of its harmonics.
The histograms presented in Fig. 7, however, show only a
small reluctance to tune resonances slightly below one of the
harmonics nf0 at the sound levels of this experiment.
Another possibility is that the shift between chest register in
M1 and falsetto register in M2 could be associated with
matching R1 and/or R2 to a different harmonic. In the over-
lap region for which there were data for M1 and M2 meas-
ured at the same f0, the harmonic closest to R1 remained the
same for 74% of 106 measurements and it remained the
same for 66% of 111 measurements of R2. Because the Ri
are lower for M2, the resonances were closer to a lower har-
monic in M2 than in M1 for 23% and 31% of measurements
of R1 and R2, respectively. R1 and R2 were closer to a
higher harmonic in M2 than in M1 for only 3% and 4% of
measurements, respectively, in the overlap range. It thus
appears that the transition between chest register in mecha-
nism M1 and falsetto register in M2 is not usually associated
with changing the articulation to match a resonance to a dif-
ferent harmonic.
FIG. 6. The variation of the first and
second resonance frequencies (R1 and
R2) with the pitch frequency f0 for all
the singers in this study in mechanisms
M1 and M2. Data from 741 measure-
ments on seven singers (five tenors and
two baritones) on three sustained vow-
els (hard, heard, and hoard). The diag-
onal, dashed gray lines indicate when a
resonance frequency would coincide
with the nth harmonic (nf0); i.e., the
possible relationships Ri¼ nf0.
FIG. 7. Histograms showing the distri-
bution of R1 (106 measurements) and
R2 (111 measurements) about the clos-
est harmonic of f0. The presented data
are from the overlap region where pro-
ductions in both chest register (M1)
and falsetto register (M2) were meas-
ured. The gray horizontal lines indicate
the average.
498 J. Acoust. Soc. Am., Vol. 135, No. 1, January 2014 Henrich Bernardoni et al.: Resonance variation with laryngeal mechanism

E. What produces the changes in resonancefrequency?
There are several possibilities that might account for the
systematic decrease in resonance frequencies between vowels
sung in chest register using M1 and those sung in falsetto
register using M2.
(i) Changes in glottal-opening duration and glottal vibra-
tory amplitude: Barney et al. (2007) have argued both
theoretically, and using a time-varying mechanical
model of a rectangular glottis coupled to a rigid vocal
tract, that an increase in glottal width or an increase in
open quotient (equivalent to a decrease in contact quo-
tient) leads to an increase in R1. In the present paper,
the changes in R1 and R2 were never strongly corre-
lated with the changes in CQ measured for the same
singer, pitch, and vowel. However, glottal vibratory
amplitude, i.e., the maximum range of glottal width
change, has been found to be much wider in chest
register than in falsetto (Rubin and Hirt, 1960 as cited
in Hollien, 1974; Hoppe et al., 2003) and this may be
a reason for the increase in R1 between M2 and M1.
(ii) Changes in laryngeal height: A rise in laryngeal
height shortens the vocal tract, and would therefore
be expected to increase R1 and R2 (Sundberg and
Nordstr€om, 1983). A 1-cm rise in laryngeal height in
a tract of 16.5 cm effective length would, in a simple
model, be expected to produce an increase in R1 on
the order of several percent. However, in our meas-
urements, the changes in R1 and R2 were not signifi-
cantly correlated (at the 1% level) with changes in
laryngeal height.
(iii) Change in mouth opening and tongue shape: A small,
but measurable decrease in jaw opening could be
expected to produce a decrease in R1. However, the
mouth opening was not measured in this study.
(iv) Change in glottal area: The values of R1 and R2 are
higher in M1 compared with M2 and this would be
consistent with a larger effective area in M1 if this
were the only geometrical change produced by the
change in mechanism.
At first one might expect that the longer duration of the
measured no-contact phase in M2 would produce a larger
effective glottal area. However, the geometry of the open-
ings are different: In M1, the glottis usually uses less than
the full length of the vocal folds, but the opening between
them is relatively large. The glottal-area values measured on
a 31-yr-old male singer by Hoppe et al. are around 32 mm2.
In M2, the glottis typically has an increased length. Hoppe
et al. (2003) found an increase in glottal-length from 14 to
17 mm during an ascending glissando. The glottis is also
open for a longer fraction of the period. However, the glottal
area in M2 is much smaller than that in M1 (around 20 mm2
in Hoppe et al., 2003). Also, a long narrow slot has a smaller
inertance than a circle with the same area because its end
effect is shorter (Cremer, 1984).
A simple model described by Swerdlin et al. (2010)
gives analytical expressions for the frequency shifts
produced by different glottal geometries. The model treats
the vocal tract as a cylinder terminated at the lips by a
baffled radiation field and at the other end by a supraglottal
constriction and a glottis. Effective lengths and (uniform)
cross sections are ascribed to each. (When M2 involves glot-
tal leakage, that leakage would be included in the effective
cross section, averaged across one cycle.) Because it is an
approximate model and because only frequencies are calcu-
lated, wall losses are neglected. If it is assumed that the rest
of the geometry is unchanged, the effective change in glottal
area between different glottal mechanisms can be deter-
mined from the change in resonance frequency.
Thus if R1M1 is the value of R1 measured for mecha-
nism M1, the effective length of the tract, denoted by LT,
can be calculated using
LT ¼ tan�1ð–k1rT2LG1=rG1
2Þ=k1; (1)
where k1¼ 2pR1M1/c. This requires the assumption of values
for rT, the radius of the tract, LG1 the length of the glottis in
M1 and also rG1, the effective glottal radius in M1. Providing
that LT does not change between M1 and M2, then rG2, the
glottal radius in mechanism M2, can be calculated from
R1M2, the value of R1 measured for mechanism M2 using
rG2 ¼ ½–k2rT2LG2=tanðk2LTÞ�1=2; (2)
where k2¼ 2p R1M2/c and LG2 denotes the length of the glot-
tis in M2. Table IV shows the values of rG2 calculated from
Eqs. (1) and (2) using the values of R1 measured in M1 and
M2 for the same pitch, vowel, and singer. Occasionally these
equations yield an imaginary value for rG2, presumably
because the tract configuration was significantly different
between M1 and M2; such results have been removed from
the statistics. The calculated equivalent radii for most singers
are in the range 2.0–2.8 mm, the exceptions being B1 and
T5. If these two atypical results are omitted, the average
value of the effective glottal area in M2 is 19 mm2,
TABLE IV. The values of the effective glottal radius and area for falsetto
register in laryngeal mechanism M2 calculated using the measured difference
in R1 between chest register (M1) and falsetto register (M2) when measured
for the same pitch, singer, and vowel. The simple model described in the text
was used. The effective glottal areas for each singer are the averages of the
values calculated for each production. Calculations assumed that the radius
of the tract rT¼ 15 mm, the length of the glottis LG1¼LG2¼ 10 mm, and the
effective glottal radius in M1 rG1¼ 3.1 mm. The glottal area in M1 was thus
assumed to be 30.2 mm2. The average (last line) for “all” singers did not
include the atypical results for singers B1 and T5.
Calculated glottal parameters in falsetto register (M2)
Singer Radius (mm) Area (mm2)
B1 1.2 (1) 4.5
B2 2.0 6 1.3 (11) 18
T1 2.4 6 0.8 (13) 20
T2 2.8 6 1.1 (9) 28
T3 2.3 6 1.3 (14) 21
T4 2.0 6 0.4 (15) 14
T5 3.6 6 1.0 (14) 44
All 2.3 6 1.0 (62) 19
J. Acoust. Soc. Am., Vol. 135, No. 1, January 2014 Henrich Bernardoni et al.: Resonance variation with laryngeal mechanism 499
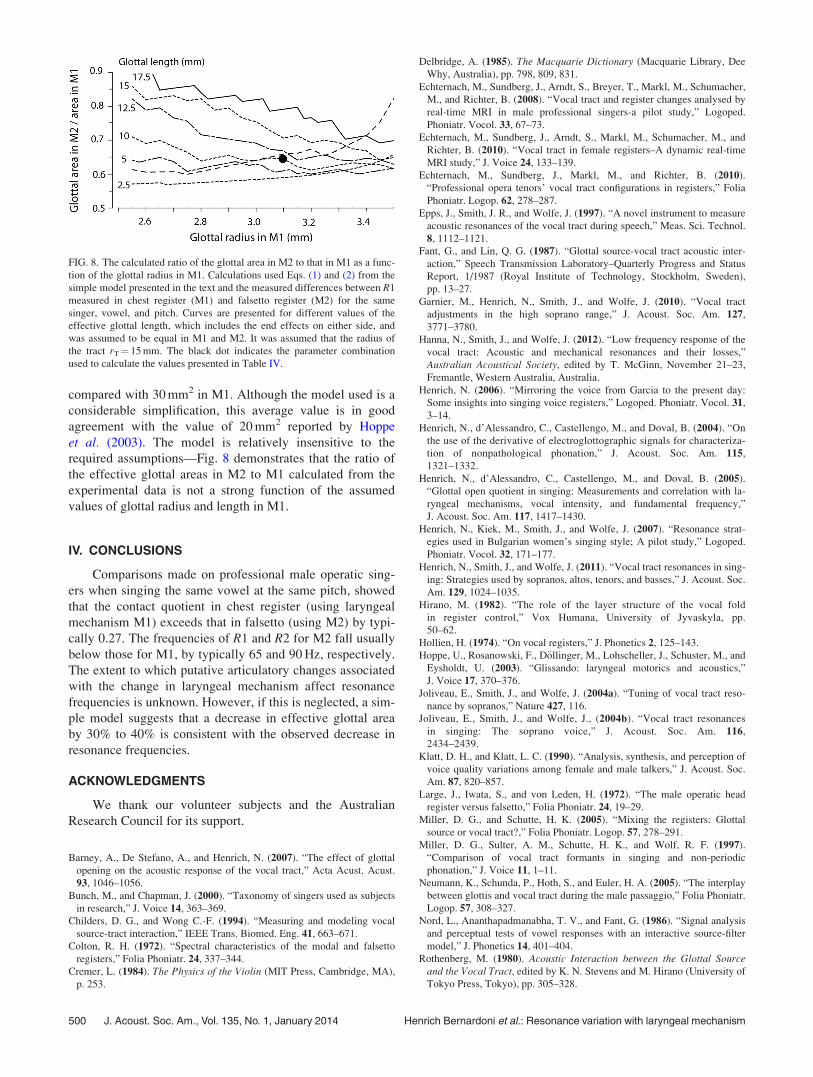
compared with 30 mm2 in M1. Although the model used is a
considerable simplification, this average value is in good
agreement with the value of 20 mm2 reported by Hoppe
et al. (2003). The model is relatively insensitive to the
required assumptions—Fig. 8 demonstrates that the ratio of
the effective glottal areas in M2 to M1 calculated from the
experimental data is not a strong function of the assumed
values of glottal radius and length in M1.
IV. CONCLUSIONS
Comparisons made on professional male operatic sing-
ers when singing the same vowel at the same pitch, showed
that the contact quotient in chest register (using laryngeal
mechanism M1) exceeds that in falsetto (using M2) by typi-
cally 0.27. The frequencies of R1 and R2 for M2 fall usually
below those for M1, by typically 65 and 90 Hz, respectively.
The extent to which putative articulatory changes associated
with the change in laryngeal mechanism affect resonance
frequencies is unknown. However, if this is neglected, a sim-
ple model suggests that a decrease in effective glottal area
by 30% to 40% is consistent with the observed decrease in
resonance frequencies.
ACKNOWLEDGMENTS
We thank our volunteer subjects and the Australian
Research Council for its support.
Barney, A., De Stefano, A., and Henrich, N. (2007). “The effect of glottal
opening on the acoustic response of the vocal tract,” Acta Acust. Acust.
93, 1046–1056.
Bunch, M., and Chapman, J. (2000). “Taxonomy of singers used as subjects
in research,” J. Voice 14, 363–369.
Childers, D. G., and Wong C.-F. (1994). “Measuring and modeling vocal
source-tract interaction,” IEEE Trans. Biomed. Eng. 41, 663–671.
Colton, R. H. (1972). “Spectral characteristics of the modal and falsetto
registers,” Folia Phoniatr. 24, 337–344.
Cremer, L. (1984). The Physics of the Violin (MIT Press, Cambridge, MA),
p. 253.
Delbridge, A. (1985). The Macquarie Dictionary (Macquarie Library, Dee
Why, Australia), pp. 798, 809, 831.
Echternach, M., Sundberg, J., Arndt, S., Breyer, T., Markl, M., Schumacher,
M., and Richter, B. (2008). “Vocal tract and register changes analysed by
real-time MRI in male professional singers-a pilot study,” Logoped.
Phoniatr. Vocol. 33, 67–73.
Echternach, M., Sundberg, J., Arndt, S., Markl, M., Schumacher, M., and
Richter, B. (2010). “Vocal tract in female registers–A dynamic real-time
MRI study,” J. Voice 24, 133–139.
Echternach, M., Sundberg, J., Markl, M., and Richter, B. (2010).
“Professional opera tenors’ vocal tract configurations in registers,” Folia
Phoniatr. Logop. 62, 278–287.
Epps, J., Smith, J. R., and Wolfe, J. (1997). “A novel instrument to measure
acoustic resonances of the vocal tract during speech,” Meas. Sci. Technol.
8, 1112–1121.
Fant, G., and Lin, Q. G. (1987). “Glottal source-vocal tract acoustic inter-
action,” Speech Transmission Laboratory–Quarterly Progress and Status
Report, 1/1987 (Royal Institute of Technology, Stockholm, Sweden),
pp. 13–27.
Garnier, M., Henrich, N., Smith, J., and Wolfe, J. (2010). “Vocal tract
adjustments in the high soprano range,” J. Acoust. Soc. Am. 127,
3771–3780.
Hanna, N., Smith, J., and Wolfe, J. (2012). “Low frequency response of the
vocal tract: Acoustic and mechanical resonances and their losses,”
Australian Acoustical Society, edited by T. McGinn, November 21–23,
Fremantle, Western Australia, Australia.
Henrich, N. (2006). “Mirroring the voice from Garcia to the present day:
Some insights into singing voice registers,” Logoped. Phoniatr. Vocol. 31,
3–14.
Henrich, N., d’Alessandro, C., Castellengo, M., and Doval, B. (2004). “On
the use of the derivative of electroglottographic signals for characteriza-
tion of nonpathological phonation,” J. Acoust. Soc. Am. 115,
1321–1332.
Henrich, N., d’Alessandro, C., Castellengo, M., and Doval, B. (2005).
“Glottal open quotient in singing: Measurements and correlation with la-
ryngeal mechanisms, vocal intensity, and fundamental frequency,”
J. Acoust. Soc. Am. 117, 1417–1430.
Henrich, N., Kiek, M., Smith, J., and Wolfe, J. (2007). “Resonance strat-
egies used in Bulgarian women’s singing style; A pilot study,” Logoped.
Phoniatr. Vocol. 32, 171–177.
Henrich, N., Smith, J., and Wolfe, J. (2011). “Vocal tract resonances in sing-
ing: Strategies used by sopranos, altos, tenors, and basses,” J. Acoust. Soc.
Am. 129, 1024–1035.
Hirano, M. (1982). “The role of the layer structure of the vocal fold
in register control,” Vox Humana, University of Jyvaskyla, pp.
50–62.
Hollien, H. (1974). “On vocal registers,” J. Phonetics 2, 125–143.
Hoppe, U., Rosanowski, F., D€ollinger, M., Lohscheller, J., Schuster, M., and
Eysholdt, U. (2003). “Glissando: laryngeal motorics and acoustics,”
J. Voice 17, 370–376.
Joliveau, E., Smith, J., and Wolfe, J. (2004a). “Tuning of vocal tract reso-
nance by sopranos,” Nature 427, 116.
Joliveau, E., Smith, J., and Wolfe, J., (2004b). “Vocal tract resonances
in singing: The soprano voice,” J. Acoust. Soc. Am. 116,
2434–2439.
Klatt, D. H., and Klatt, L. C. (1990). “Analysis, synthesis, and perception of
voice quality variations among female and male talkers,” J. Acoust. Soc.
Am. 87, 820–857.
Large, J., Iwata, S., and von Leden, H. (1972). “The male operatic head
register versus falsetto,” Folia Phoniatr. 24, 19–29.
Miller, D. G., and Schutte, H. K. (2005). “Mixing the registers: Glottal
source or vocal tract?,” Folia Phoniatr. Logop. 57, 278–291.
Miller, D. G., Sulter, A. M., Schutte, H. K., and Wolf, R. F. (1997).
“Comparison of vocal tract formants in singing and non-periodic
phonation,” J. Voice 11, 1–11.
Neumann, K., Schunda, P., Hoth, S., and Euler, H. A. (2005). “The interplay
between glottis and vocal tract during the male passaggio,” Folia Phoniatr.
Logop. 57, 308–327.
Nord, L., Ananthapadmanabha, T. V., and Fant, G. (1986). “Signal analysis
and perceptual tests of vowel responses with an interactive source-filter
model,” J. Phonetics 14, 401–404.
Rothenberg, M. (1980). Acoustic Interaction between the Glottal Sourceand the Vocal Tract, edited by K. N. Stevens and M. Hirano (University of
Tokyo Press, Tokyo), pp. 305–328.
FIG. 8. The calculated ratio of the glottal area in M2 to that in M1 as a func-
tion of the glottal radius in M1. Calculations used Eqs. (1) and (2) from the
simple model presented in the text and the measured differences between R1
measured in chest register (M1) and falsetto register (M2) for the same
singer, vowel, and pitch. Curves are presented for different values of the
effective glottal length, which includes the end effects on either side, and
was assumed to be equal in M1 and M2. It was assumed that the radius of
the tract rT¼ 15 mm. The black dot indicates the parameter combination
used to calculate the values presented in Table IV.
500 J. Acoust. Soc. Am., Vol. 135, No. 1, January 2014 Henrich Bernardoni et al.: Resonance variation with laryngeal mechanism

Roubeau, B. (1993). “M�ecanismes vibratoires laryng�es et controle neuro-
musculaire de la fr�equence fondamentale” (“Laryngeal vibratory mecha-
nisms and neuro-muscular control of fundamental frequency”), Ph.D.
thesis, Universit�e Paris-Orsay, Orsay.
Roubeau, B., Castellengo, M., Bodin, P., and Ragot, M. (2004).
“Phon�etogramme par m�ecanisme laryng�e” (“Laryngeal registers as shown
in the voice range profile”) Folia Phoniatr. Logop. 56, 321–333.
Roubeau, B., Henrich, N., and Castellengo, M. (2009). “Laryngeal vibratory
mechanisms: The notion of vocal register revisited,” J. Voice 23,
425–438.
Salom~ao, G. L., and Sundberg, J. (2009). “What do male singers mean by
modal and falsetto register? An investigation of the glottal voice source,”
Logoped. Phoniatr. Vocol. 34, 73–83.
Smith, J. R. (1995). “Phasing of harmonic components to optimize measure
signal-to-noise ratios of transfer functions,” Meas. Sci. Technol. 6,
1343–1348.
Sundberg, J. (1975). “Formant technique in a professional female singer,”
Acustica 32, 89–96.
Sundberg, J., and H€ogset, C. (2001). “Voice source differences between fal-
setto and modal registers in counter tenors, tenors and baritones,”
Logoped. Phoniatr. Vocol. 26, 26–36.
Sundberg, J., La, F. M. B., and Gill, B. P. (2011). “Professional male sing-
ers’ formant tuning strategies for the vowel /a/,” Logoped. Phoniatr.
Vocol. 36, 156–167.
Sundberg, J., and Nordstr€om, P.-E. (1983). “Raised and lowered larynx: The
effect on vowel formant frequencies,” J. Res. Singing 6, 7–15.
Swerdlin, Y., Smith, J., and Wolfe, J. (2010). “The effect of whisper and
creak vocal mechanisms on vocal tract resonances,” J. Acoust. Soc. Am.
127, 2590–2598.
Titze, I. R. (2004). “Theory of glottal airflow and source-filter interaction in
speaking and singing,” Acta Acust. Acust. 90, 641–648.
Titze, I. R. (2008). “Nonlinear source-filter coupling in phonation: Theory,”
J. Acoust. Soc. Am. 123, 2733–2749.
Wolfe, J., Garnier, M., and Smith, J. (2009). “Vocal tract resonances in
speech, singing and playing musical instruments,” Human Frontier Sci.
Progr. J. 3, 6–23.
J. Acoust. Soc. Am., Vol. 135, No. 1, January 2014 Henrich Bernardoni et al.: Resonance variation with laryngeal mechanism 501