vmware horizon 6 3d engineering workloads reference architecture
TRANSCRIPT

VMware Horizon 6 3D Engineering Workloads Reference Architecture
T E C H N I C A L W H I T E PA P E R

VMware Horizon 6 3D Engineering Workloads Reference Architecture
T E C H N I C A L W H I T E PA P E R / 2
Table of Contents
Executive Summary . . . . . . . . . . . . . . . . . . . . . . . . . . . . . . . . . . . . . . . . . . . . . . . . . . . . . . . . . 7
About This Document . . . . . . . . . . . . . . . . . . . . . . . . . . . . . . . . . . . . . . . . . . . . . . . . . . . . . . .8
About the Tests and Results . . . . . . . . . . . . . . . . . . . . . . . . . . . . . . . . . . . . . . . . . . . . . . . . .8
Solution Summary . . . . . . . . . . . . . . . . . . . . . . . . . . . . . . . . . . . . . . . . . . . . . . . . . . . . . . . . . . 9
Solution Architecture . . . . . . . . . . . . . . . . . . . . . . . . . . . . . . . . . . . . . . . . . . . . . . . . . . . . . . 10
VMware ESXi Hosts . . . . . . . . . . . . . . . . . . . . . . . . . . . . . . . . . . . . . . . . . . . . . . . . . . . . . . . 11
NVIDIA GRID Cards . . . . . . . . . . . . . . . . . . . . . . . . . . . . . . . . . . . . . . . . . . . . . . . . . . . . . . . 12
VMware vSphere . . . . . . . . . . . . . . . . . . . . . . . . . . . . . . . . . . . . . . . . . . . . . . . . . . . . . . . . . . 12
VMware Horizon 6 . . . . . . . . . . . . . . . . . . . . . . . . . . . . . . . . . . . . . . . . . . . . . . . . . . . . . . . . 13
Benchmarking and Testing Software . . . . . . . . . . . . . . . . . . . . . . . . . . . . . . . . . . . . . . . . 13
Reference Architecture Overview . . . . . . . . . . . . . . . . . . . . . . . . . . . . . . . . . . . . . . . . . . . . 14
Designing for 3D Desktop Workload Use Cases . . . . . . . . . . . . . . . . . . . . . . . . . . . . . . 14
Task Workers . . . . . . . . . . . . . . . . . . . . . . . . . . . . . . . . . . . . . . . . . . . . . . . . . . . . . . . . . . 15
Knowledge Workers . . . . . . . . . . . . . . . . . . . . . . . . . . . . . . . . . . . . . . . . . . . . . . . . . . . . 16
Power Users . . . . . . . . . . . . . . . . . . . . . . . . . . . . . . . . . . . . . . . . . . . . . . . . . . . . . . . . . . . 16
Designers . . . . . . . . . . . . . . . . . . . . . . . . . . . . . . . . . . . . . . . . . . . . . . . . . . . . . . . . . . . . . 17
Choosing a 3D Graphics Acceleration Technology . . . . . . . . . . . . . . . . . . . . . . . . . . . . 17
Virtual Dedicated Graphics Acceleration (vDGA) . . . . . . . . . . . . . . . . . . . . . . . . . . 18
Virtual Graphics Processing Unit (vGPU) . . . . . . . . . . . . . . . . . . . . . . . . . . . . . . . . . . 19
Virtual Shared Graphics Acceleration (vSGA) . . . . . . . . . . . . . . . . . . . . . . . . . . . . . 22
3D Workload Compatibility . . . . . . . . . . . . . . . . . . . . . . . . . . . . . . . . . . . . . . . . . . . . . . 23
Sizing vSphere for 3D Workloads . . . . . . . . . . . . . . . . . . . . . . . . . . . . . . . . . . . . . . . . . . . 23
ESXi Host Sizing Considerations . . . . . . . . . . . . . . . . . . . . . . . . . . . . . . . . . . . . . . . . . 24
Host Sizing Example . . . . . . . . . . . . . . . . . . . . . . . . . . . . . . . . . . . . . . . . . . . . . . . . . . . . 25
Sizing GPU for 3D Workloads . . . . . . . . . . . . . . . . . . . . . . . . . . . . . . . . . . . . . . . . . . . . . . 27
vGPU and vDGA Performance . . . . . . . . . . . . . . . . . . . . . . . . . . . . . . . . . . . . . . . . . . . 28
Sizing Storage for 3D Workloads . . . . . . . . . . . . . . . . . . . . . . . . . . . . . . . . . . . . . . . . . . . 28
ESXi Configuration . . . . . . . . . . . . . . . . . . . . . . . . . . . . . . . . . . . . . . . . . . . . . . . . . . . . . . . . 29
Configuration for vDGA . . . . . . . . . . . . . . . . . . . . . . . . . . . . . . . . . . . . . . . . . . . . . . . . . 29
Configuration for vGPU . . . . . . . . . . . . . . . . . . . . . . . . . . . . . . . . . . . . . . . . . . . . . . . . . 30
Virtual Machine Sizing for 3D Workloads . . . . . . . . . . . . . . . . . . . . . . . . . . . . . . . . . . . . 31
Sizing vCPU for 3D Workloads . . . . . . . . . . . . . . . . . . . . . . . . . . . . . . . . . . . . . . . . . . . 32
Sizing Memory for 3D Workloads . . . . . . . . . . . . . . . . . . . . . . . . . . . . . . . . . . . . . . . . 34
Virtual Desktop Machine Configuration . . . . . . . . . . . . . . . . . . . . . . . . . . . . . . . . . . . . . . 36
Optimizing the OS . . . . . . . . . . . . . . . . . . . . . . . . . . . . . . . . . . . . . . . . . . . . . . . . . . . . . . 36
Enabling the Virtual Machine for GPU Pass-Through . . . . . . . . . . . . . . . . . . . . . . . . 36

VMware Horizon 6 3D Engineering Workloads Reference Architecture
T E C H N I C A L W H I T E PA P E R / 3
Design Approach for 3D Workloads . . . . . . . . . . . . . . . . . . . . . . . . . . . . . . . . . . . . . . . . . 37
Horizon 6 Management Block . . . . . . . . . . . . . . . . . . . . . . . . . . . . . . . . . . . . . . . . . . . . 38
Horizon 6 Desktop Blocks and Clusters . . . . . . . . . . . . . . . . . . . . . . . . . . . . . . . . . . . 39
Setting Up Horizon for 3D Workloads . . . . . . . . . . . . . . . . . . . . . . . . . . . . . . . . . . . . 39
View 3D Desktop Pools . . . . . . . . . . . . . . . . . . . . . . . . . . . . . . . . . . . . . . . . . . . . . . . . . 39
Designing for User Experience . . . . . . . . . . . . . . . . . . . . . . . . . . . . . . . . . . . . . . . . . . . . . 40
Client Devices . . . . . . . . . . . . . . . . . . . . . . . . . . . . . . . . . . . . . . . . . . . . . . . . . . . . . . . . . 40
Client Device User Experience and Performance . . . . . . . . . . . . . . . . . . . . . . . . . . . 40
PCoIP Performance . . . . . . . . . . . . . . . . . . . . . . . . . . . . . . . . . . . . . . . . . . . . . . . . . . . . . 41
Conclusion . . . . . . . . . . . . . . . . . . . . . . . . . . . . . . . . . . . . . . . . . . . . . . . . . . . . . . . . . . . . . . . . 43
About the Author and Contributors . . . . . . . . . . . . . . . . . . . . . . . . . . . . . . . . . . . . . . . . . . 43
References . . . . . . . . . . . . . . . . . . . . . . . . . . . . . . . . . . . . . . . . . . . . . . . . . . . . . . . . . . . . . . . . 44
Appendix A: Test Results . . . . . . . . . . . . . . . . . . . . . . . . . . . . . . . . . . . . . . . . . . . . . . . . . . . 45
CATIA R20 . . . . . . . . . . . . . . . . . . . . . . . . . . . . . . . . . . . . . . . . . . . . . . . . . . . . . . . . . . . . . . . 45
CATIA Benchmark Results . . . . . . . . . . . . . . . . . . . . . . . . . . . . . . . . . . . . . . . . . . . . . . . 50
CATIA R20 Test Conclusion . . . . . . . . . . . . . . . . . . . . . . . . . . . . . . . . . . . . . . . . . . . . . . 50
REDWAY3D CAD Turbine Benchmark . . . . . . . . . . . . . . . . . . . . . . . . . . . . . . . . . . . . . . . 51
Bench Revit – RFO Benchmark 2015 . . . . . . . . . . . . . . . . . . . . . . . . . . . . . . . . . . . . . . . . 56
Revit Complete Benchmark Suite . . . . . . . . . . . . . . . . . . . . . . . . . . . . . . . . . . . . . . . . 57
Elapsed Time to Complete Benchmark Suite . . . . . . . . . . . . . . . . . . . . . . . . . . . . . . 58
Render Elapsed Time . . . . . . . . . . . . . . . . . . . . . . . . . . . . . . . . . . . . . . . . . . . . . . . . . . . 60
PassMark CPU . . . . . . . . . . . . . . . . . . . . . . . . . . . . . . . . . . . . . . . . . . . . . . . . . . . . . . . . . . . . 61
AIDA CAD Memory Test . . . . . . . . . . . . . . . . . . . . . . . . . . . . . . . . . . . . . . . . . . . . . . . . . . . 62
ANSYS Mechanical Benchmarks . . . . . . . . . . . . . . . . . . . . . . . . . . . . . . . . . . . . . . . . . . . . 66
Non-Optimized Run . . . . . . . . . . . . . . . . . . . . . . . . . . . . . . . . . . . . . . . . . . . . . . . . . . . . 66
Optimized Run . . . . . . . . . . . . . . . . . . . . . . . . . . . . . . . . . . . . . . . . . . . . . . . . . . . . . . . . . 66
Anvil Storage Benchmark 1.1.0 . . . . . . . . . . . . . . . . . . . . . . . . . . . . . . . . . . . . . . . . . . . . . 69
Storage Performance Impact Summary . . . . . . . . . . . . . . . . . . . . . . . . . . . . . . . . . . . 72
PassMark Benchmark . . . . . . . . . . . . . . . . . . . . . . . . . . . . . . . . . . . . . . . . . . . . . . . . . . . 73
Appendix B: Hardware and Software Requirements . . . . . . . . . . . . . . . . . . . . . . . . . . . . 75

VMware Horizon 6 3D Engineering Workloads Reference Architecture
T E C H N I C A L W H I T E PA P E R / 4
List of Figures
Figure 1: Highlights . . . . . . . . . . . . . . . . . . . . . . . . . . . . . . . . . . . . . . . . . . . . . . . . . . . . . . . . . . . . 7
Figure 2: Virtualization of 3D Workloads . . . . . . . . . . . . . . . . . . . . . . . . . . . . . . . . . . . . . . . . . 9
Figure 3: Horizon 6 Components . . . . . . . . . . . . . . . . . . . . . . . . . . . . . . . . . . . . . . . . . . . . . . . 10
Figure 4: 3D Technologies for Different Use Cases . . . . . . . . . . . . . . . . . . . . . . . . . . . . . . . 14
Figure 5: Products Plotted Against Use Cases by Increasing Quality and Cost . . . . . . . 15
Figure 6: Knowledge Worker Applications Show Improved Performance with vSGA . . . . 16
Figure 7: Typical Power User Applications that Are Somewhat Less
Compute-Intensive . . . . . . . . . . . . . . . . . . . . . . . . . . . . . . . . . . . . . . . . . . . . . . . . . . . . . . . . . 16
Figure 8: Example Screens for Dassault CATIA (left) and Autodesk 3ds Max (right) . . 17
Figure 9: GPU Pass-Through (vDGA) . . . . . . . . . . . . . . . . . . . . . . . . . . . . . . . . . . . . . . . . . . . 18
Figure 10: Hardware GPU Virtualization . . . . . . . . . . . . . . . . . . . . . . . . . . . . . . . . . . . . . . . . . 19
Figure 11: GPU Sharing vSGA . . . . . . . . . . . . . . . . . . . . . . . . . . . . . . . . . . . . . . . . . . . . . . . . . . 22
Figure 12: SDDC Platform . . . . . . . . . . . . . . . . . . . . . . . . . . . . . . . . . . . . . . . . . . . . . . . . . . . . . 23
Figure 13: vDGA Configuration . . . . . . . . . . . . . . . . . . . . . . . . . . . . . . . . . . . . . . . . . . . . . . . . 29
Figure 14: vGPU Configuration . . . . . . . . . . . . . . . . . . . . . . . . . . . . . . . . . . . . . . . . . . . . . . . . . 30
Figure 15: Performance of a Single Virtual Machine (in Red) Versus
Four Component Virtual Machines . . . . . . . . . . . . . . . . . . . . . . . . . . . . . . . . . . . . . . . . . . . 32
Figure 16: Impact of Adding CPU Cores in Monothreaded Applications . . . . . . . . . . . . . 33
Figure 17: Resource (CPU) Allocation – Rendering Impact . . . . . . . . . . . . . . . . . . . . . . . . 33
Figure 18: Memory Performance Across Concurrent Virtual Machines . . . . . . . . . . . . . . 34
Figure 19: Memory Performance Increase from Two to Four Cores . . . . . . . . . . . . . . . . . 35
Figure 20: Memory Performance Increase from 16 GB to 32 GB . . . . . . . . . . . . . . . . . . . . 35
Figure 21: Horizon Pod with Management Block, Desktop Block, and Clusters . . . . . . 37
Figure 22: Management Block vSphere Cluster . . . . . . . . . . . . . . . . . . . . . . . . . . . . . . . . . . 38
Figure 23: Steps to Configure Horizon for 3D Workloads . . . . . . . . . . . . . . . . . . . . . . . . . . 39
Figure 24: Performance Settings K2 vDGA Proportional . . . . . . . . . . . . . . . . . . . . . . . . . . 46
Figure 25: File Open Elapsed Time K2 vDGA . . . . . . . . . . . . . . . . . . . . . . . . . . . . . . . . . . . . 46
Figure 26: Drawing Elapsed Time K2 vDGA . . . . . . . . . . . . . . . . . . . . . . . . . . . . . . . . . . . . . . 47
Figure 27: Nice Airport File Open Elapsed Time . . . . . . . . . . . . . . . . . . . . . . . . . . . . . . . . . . 47
Figure 28: Nice Airport Drawing Elapsed Time . . . . . . . . . . . . . . . . . . . . . . . . . . . . . . . . . . . 48
Figure 29: Performance Settings K2 vDGA Fixed . . . . . . . . . . . . . . . . . . . . . . . . . . . . . . . . . 49
Figure 30: File Open Elapsed Time . . . . . . . . . . . . . . . . . . . . . . . . . . . . . . . . . . . . . . . . . . . . . 49
Figure 31: Drawing Elapsed Time . . . . . . . . . . . . . . . . . . . . . . . . . . . . . . . . . . . . . . . . . . . . . . . 50
Figure 32: REDWAY3D CAD Turbine Rendering Model . . . . . . . . . . . . . . . . . . . . . . . . . . . . 51

VMware Horizon 6 3D Engineering Workloads Reference Architecture
T E C H N I C A L W H I T E PA P E R / 5
Figure 33: vDGA-Enabled Virtual Machine Versus a Physical Workstation . . . . . . . . . . . 51
Figure 34: Four Concurrent Virtual Machines with vDGA Compared to One
Virtual Machine with vDGA . . . . . . . . . . . . . . . . . . . . . . . . . . . . . . . . . . . . . . . . . . . . . . . . . . 52
Figure 35: Four Concurrent Virtual Machines and One Virtual Machine . . . . . . . . . . . . . 52
Figure 36: Profile Performance – vDGA Versus vGPU . . . . . . . . . . . . . . . . . . . . . . . . . . . . . 53
Figure 37: CAD Turbine on Three Concurrent Virtual Machines . . . . . . . . . . . . . . . . . . . . 54
Figure 38: Eight Concurrent Virtual Machines Compared to a Single vGPU
Virtual Machine . . . . . . . . . . . . . . . . . . . . . . . . . . . . . . . . . . . . . . . . . . . . . . . . . . . . . . . . . . . . 55
Figure 39: Revit Benchmark Rendering . . . . . . . . . . . . . . . . . . . . . . . . . . . . . . . . . . . . . . . . . 56
Figure 40: Revit Benchmark CAD Drawing . . . . . . . . . . . . . . . . . . . . . . . . . . . . . . . . . . . . . . 56
Figure 41: Revit Benchmark Results for Four Identical Virtual Machines . . . . . . . . . . . . 57
Figure 42: Total Elapsed Time for Four Virtual Machines Versus One Virtual Machine . . . 58
Figure 43: Impact of Adding CPU Cores to Monothreaded Applications . . . . . . . . . . . . 59
Figure 44: Total Elapsed Time for Two, Four, and Six CPU Cores . . . . . . . . . . . . . . . . . . . 59
Figure 45: Resource Allocation Rendering Impact . . . . . . . . . . . . . . . . . . . . . . . . . . . . . . . . 60
Figure 46: Comparison of Virtual Machines Running in Parallel . . . . . . . . . . . . . . . . . . . . . 61
Figure 47: Memory Performance Across Concurrent Virtual Machines . . . . . . . . . . . . . . 62
Figure 48: Memory Latency Across Concurrent Virtual Machines . . . . . . . . . . . . . . . . . . . 63
Figure 49: Memory Performance Increase from Two to Four Cores . . . . . . . . . . . . . . . . . 64
Figure 50: Memory Performance Increase 16 GB Versus 32 GB . . . . . . . . . . . . . . . . . . . . 64
Figure 51: PassMark Memory Summary . . . . . . . . . . . . . . . . . . . . . . . . . . . . . . . . . . . . . . . . . 65
Figure 52: Memory Mark Summary . . . . . . . . . . . . . . . . . . . . . . . . . . . . . . . . . . . . . . . . . . . . . 66
Figure 53: Modal Analysis Benchmark Specifications . . . . . . . . . . . . . . . . . . . . . . . . . . . . . 67
Figure 54: Physical and Virtual Environments Compared . . . . . . . . . . . . . . . . . . . . . . . . . . 68
Figure 55: Anvil Storage SSD Benchmark for One Virtual Machine (Score: 7143.52) . . . 69
Figure 56: Anvil Storage SSD Benchmark VM1 (Score: 3836.58) . . . . . . . . . . . . . . . . . . . 70
Figure 57: Anvil Storage SSD Benchmark VM2 (Score: 3990.31) . . . . . . . . . . . . . . . . . . . 70
Figure 58: Anvil Storage SSD Benchmark VM3 (Score: 4040.85) . . . . . . . . . . . . . . . . . . . 71
Figure 59: Anvil Storage SSD Benchmark VM4 (Score: 3909.17) . . . . . . . . . . . . . . . . . . . 71
Figure 60: Performance Degradation . . . . . . . . . . . . . . . . . . . . . . . . . . . . . . . . . . . . . . . . . . . 72
Figure 61: Dedicated Resources Not Affected by Number of Virtual Machines . . . . . . . 73
Figure 62: Impact on Storage When the Number of Virtual Machines Increases . . . . . . 74

VMware Horizon 6 3D Engineering Workloads Reference Architecture
T E C H N I C A L W H I T E PA P E R / 6
List of Tables
Table 1: High-Level Infrastructure . . . . . . . . . . . . . . . . . . . . . . . . . . . . . . . . . . . . . . . . . . . . . . 11
Table 2: ESXi Components . . . . . . . . . . . . . . . . . . . . . . . . . . . . . . . . . . . . . . . . . . . . . . . . . . . . . 11
Table 3: NVIDIA GRID K1 and K2 Specifications . . . . . . . . . . . . . . . . . . . . . . . . . . . . . . . . . . 12
Table 4: vSphere Software Components . . . . . . . . . . . . . . . . . . . . . . . . . . . . . . . . . . . . . . . . . 12
Table 5: Horizon Software Component Versions . . . . . . . . . . . . . . . . . . . . . . . . . . . . . . . . . . 13
Table 6: Benchmarking Software . . . . . . . . . . . . . . . . . . . . . . . . . . . . . . . . . . . . . . . . . . . . . . . 13
Table 7: 3D Graphics Acceleration Comparison . . . . . . . . . . . . . . . . . . . . . . . . . . . . . . . . . . 18
Table 8: Pros and Cons of vDGA . . . . . . . . . . . . . . . . . . . . . . . . . . . . . . . . . . . . . . . . . . . . . . . 19
Table 9: vGPU Profiles . . . . . . . . . . . . . . . . . . . . . . . . . . . . . . . . . . . . . . . . . . . . . . . . . . . . . . . . . 20
Table 10: Pros and Cons of vGPU . . . . . . . . . . . . . . . . . . . . . . . . . . . . . . . . . . . . . . . . . . . . . . . 21
Table 11: Pros and Cons of vSGA . . . . . . . . . . . . . . . . . . . . . . . . . . . . . . . . . . . . . . . . . . . . . . . 23
Table 12: Sizing Considerations for 3D Workloads on ESXi Hosts . . . . . . . . . . . . . . . . . . 24
Table 13: Maximum Number of Users per vGPU . . . . . . . . . . . . . . . . . . . . . . . . . . . . . . . . . . 25
Table 14: Maximum Number of Users per Host for vGPU . . . . . . . . . . . . . . . . . . . . . . . . . . 25
Table 15: Maximum Number of Users per vDGA . . . . . . . . . . . . . . . . . . . . . . . . . . . . . . . . . . 26
Table 16: Maximum Number of Users per Host for vDGA . . . . . . . . . . . . . . . . . . . . . . . . . . 26
Table 17: Recommended 3D Desktop Sizing . . . . . . . . . . . . . . . . . . . . . . . . . . . . . . . . . . . . . 27
Table 18: Recommended GPUs by Use Case . . . . . . . . . . . . . . . . . . . . . . . . . . . . . . . . . . . . . 28
Table 19: Sizing Considerations for 3D Workloads . . . . . . . . . . . . . . . . . . . . . . . . . . . . . . . . 31
Table 20: Windows 7 Image Virtual Machine Specifications . . . . . . . . . . . . . . . . . . . . . . . . 36
Table 21: Recommended Pool Specifications . . . . . . . . . . . . . . . . . . . . . . . . . . . . . . . . . . . . 39
Table 22: Parameters for GPU Throughput Calculations . . . . . . . . . . . . . . . . . . . . . . . . . . . 41
Table 23: CATIA R20 Setup Information . . . . . . . . . . . . . . . . . . . . . . . . . . . . . . . . . . . . . . . . . 45
Table 24: CATIA R20 Hardware Information for a Four-Core Virtual Machine . . . . . . . . 45
Table 25: CATIA R20 Hardware Information for a Six-Core Virtual Machine . . . . . . . . . . 47
Table 26: CATIA Benchmark Results for Four-Core and Six-Core Virtual Machines . . . 48
Table 27: Proportional Compared to Fixed for Four Dedicated Cores . . . . . . . . . . . . . . . 50
Table 28: Effect of Running Concurrent Virtual Sessions . . . . . . . . . . . . . . . . . . . . . . . . . . 61
Table 29: Memory Throughput – One Versus Four Concurrent Virtual Machines . . . . . . 62
Table 30: PassMark Memory Throughput Comparison . . . . . . . . . . . . . . . . . . . . . . . . . . . . . 65
Table 31: Hardware Configuration for ANSYS Mechanical Benchmark . . . . . . . . . . . . . . 67
Table 32: Modal Analysis Test Conditions . . . . . . . . . . . . . . . . . . . . . . . . . . . . . . . . . . . . . . . . 67
Table 33: Hardware Requirements for vDGA and vGPU . . . . . . . . . . . . . . . . . . . . . . . . . . . 75
Table 34: Software Requirements for vSGA, vDGA, and vGPU . . . . . . . . . . . . . . . . . . . . . 76

T E C H N I C A L W H I T E PA P E R / 7
VMware Horizon 6 3D Engineering Workloads Reference Architecture
Executive SummaryVirtual desktops offer centralized management, lower maintenance costs, improved security, and remote access to superior storage and computing capabilities. Historically, however, they were limited by the inability to handle the graphics-intensive computing needs of designers, engineers, and scientists. The graphics processing requirements of computer-aided technologies (CAx), limited graphics API support, and the inability to share physical GPUs all made it unfeasible to use virtual desktops as graphics workstations.
The latest generation of hardware-based graphics acceleration technology from VMware and NVIDIA makes this task not only feasible but practical, by moving the required functionality from the individual workstation to the data center, making immersive 3D graphics available to remote users. This solution enables users with the most demanding graphics needs, such as 3D engineering applications, to take advantage of the superior computing, storage, and networking power of the data center while freeing them from the limitations of the physical workstation.
vGPU is the most �exible GPU
virtualization technology, with 4-64 users per host
Best performance at scale, suitable for many use cases
REDWAY CAD Turbine Benchmark scores:
Virtual machine = 3,657 Physical workstation = 2,505
User graphical experience equivalent or better on virtual machine than on physical workstation
8 concurrent VMs performas well as a single VM
ESX and vGPU scale with concurrent workloads
4 vCPU and 16 GB RAM o�er best performance for
engineering workloads
No noticeable bene�t with more vCPU or RAM in benchmark tests
Client device and protocol are key to satisfactory
user experience
Provision su�cient client resources and bandwidth for protocol
3D engineering users can require up to
1 TB of storage
Size virtual desktop storage for large data sets
• Access to all critical applications, including 3D, from anywhere on any device
• Centralized administration and provisioning of desktops and applications
• Fast provisioning of 3D-enabled desktops
• Enhanced data and IP security for 3D models and other assets
• Highly responsive Windows and rich multimedia experience
• Improved user productivity and mobility
• Reduced CapEx and OpEx
CPU
Figure 1: Highlights
The tests conducted as part of this reference architecture highlight the more than acceptable performance characteristics of 3D and engineering benchmarks and applications when running on a virtual desktop. The key elements that make this solution possible are graphics cards compatible with GPU virtualization, that is, NVIDIA GRID K1 and K2 cards, and the supporting virtualization infrastructure for View desktops supplied by VMware vSphere® and VMware Horizon® 6. Customers can choose among three hardware-based graphics acceleration options:
•Virtual Dedicated Graphics Acceleration (vDGA)
•Virtual Graphics Processing Unit (vGPU)
•Virtual Shared Graphics Acceleration (vSGA)

T E C H N I C A L W H I T E PA P E R / 8
VMware Horizon 6 3D Engineering Workloads Reference Architecture
About This Document
This paper offers guidance for deploying engineering workstations designed to support heavy 3D workloads on View virtual desktops in Horizon 6. Among other topics, it discusses
•How to choose the right GPU acceleration technology
•How to size hardware resources for computer-aided design (CAD) and other CAx applications
•The relation between hardware and software for graphics acceleration
•How to identify potential bottlenecks
•The use of direct pass-through and vGPU technology to illustrate the level of performance that typical CAD and CAx users can expect when working in a virtualized environment
About the Tests and Results
The tests reported in this paper relied on standard rackmount server hardware with NVIDIA graphics cards, running vSphere 5.5 or 6.0 and Horizon 6 software.
•Horizon 6 software handles provisioning, management, and access to the 3D workloads.
•View virtual desktops run on vSphere hosts, located in the data center and configured with NVIDIA graphics cards.
•Horizon Client software installed on users’ endpoint devices connects to users’ virtual desktops.
In industry-standard CAD and computer-aided manufacturing (CAM) software and benchmarks, workload performance tests showed the following:
•The entire software-defined data center (SDDC) software stack integrates well, serving a virtualized 3D workstation that performs at least as well as most physical 3D workstations.
•Performance tends to improve when based in the data center because, compared to typical, or even the best, workstations, the data center offers more CPU power, better GPU performance, faster storage, and usually better network capabilities, such as Gigabyte LAN. Applications load faster, and complex 3D operations, such as real-time viewing and rendering, are also faster.
•The limiting factors are usually network bandwidth and CPU utilization (lack of CPU cores). LAN performance can be good to excellent, but WAN performance requires optimization. For WAN implementations, suitable bandwidth is required to provide an acceptable user experience. In these cases, expectations should be set with the user. Heavy 3D workloads often require high-frequency CPUs (typically 2.7 GHz and higher), and these processors are often limited by the number of cores available.
Benchmark testing also produced some surprising results concerning the number of virtual machines that can be deployed before an impact on performance can be detected at the user level.

T E C H N I C A L W H I T E PA P E R / 9
VMware Horizon 6 3D Engineering Workloads Reference Architecture
Solution SummaryThe Horizon 6 3D engineering workload solution described in this paper combines data center and desktop virtualization technologies from VMware with GPU technology from NVIDIA.
GPU-Enabled Data Center
ESXi
x86 Architecture and Hardware Resources
NVIDIA Manager (optional)
App
OS
View Agent
App
OS
View Agent
App
OS
View Agent
Horizon 6
View Desktop
Desktop Clients
Thin Clients
Multimonitor
Android
iOSGPU
Figure 2: Virtualization of 3D Workloads
The addition of GPU virtualization to Horizon 6 gives users access to the computing power, memory, networking, and storage of the data center to run graphics-intensive applications on virtual desktops. Placing graphics-intensive workloads in the data center provides secure and mobile access to a wide range of distributed users. Centralizing these workloads also provides easier management, provisioning, and maintenance of desktops, applications, and data. On remote devices, it enables an immersive 3D graphics experience that compares favorably to dedicated graphics workstations. Appropriate network bandwidth and a suitable device guarantee user experience for a mobile or distributed user.

T E C H N I C A L W H I T E PA P E R / 1 0
VMware Horizon 6 3D Engineering Workloads Reference Architecture
Solution Architecture
Figure 3 provides a high-level overview of the solution architecture.
iOSor Android
Mac OSXHorizon Clients
View Security Servers
HTTPS / PCoIP
DMZ (HTTPS / PCoIP)
PCoIP
ESX, vCenter, View, Mirage, AD Tra�c
Shared Storage
View Connection Servers
vRealize Operationsfor Horizon
Thin Client Windows
ViewComposer
vCenter
View Virtual DesktopsView 3D Virtual Desktop
3D Desktop ClustervSphere
+ NVIDIA GFX Cards
Desktop ClustervSphere
Shared Storage
Management ClustervSphere
MS SQL
Fine PrintServer
ActiveDirectory
Figure 3: Horizon 6 Components

T E C H N I C A L W H I T E PA P E R / 1 1
VMware Horizon 6 3D Engineering Workloads Reference Architecture
The high-level infrastructure consists of the following products and components:
HORIZON vSPHERE ESXi NVIDIA GRID K2 WINDOWS 7
•ViewinHorizon6version 6.0.1
•ViewConnectionServers
•Viewsecurityservers
•VMwareView®Composer™
•ActiveDirectory
•MicrosoftSQL
•VMwarevRealize™Operations for Horizon
•VMwareESXi™5.5
•VMwareESXi6.0
•VMwarevCenterServer™
•ESXihosts
•2.7GHzIntelE5-2697v2or3.3GHzE5-2667v2processor
•256GBRAMperESXihost
•6xIntel730Series(480 GB) SSDs
•IntelRS3DC080SAS Controller
•LocalSSDstorageforESXiandvirtualmachines
•2xGRIDK2
•Latest NVIDIA GRID driver
•Windows7SP1x64virtual desktops
Table 1: High-Level Infrastructure
VMware ESXi Hosts
TheconfigurationtestedforthispaperusedastandardrackmountserverintheASUSESC4000G2,thelatestASUSserverbasedonthedualIntelXeonE5-2600v2processorplatform.TheASUSESC4000hassixverticallyoriented, hot-swappable 2.5-inch SATA HDD bays with 8 x PCIe Gen3 x16 expansion slots.
Most major hardware vendors, such as Dell, HP, Cisco, and IBM, offer servers that support VMware 3D graphics acceleration technologies. Before you select a server, verify that it is on the VMware Hardware Compatibility List and the NVIDIA GRID certified list.
HARDWARE COMPONENT SUBSYSTEMS
ASUSESC4000G2ESXihost •IntelE5-2667v2(3.3GHz)
•IntelE5-2697v2(2.7GHz)
•ASMB6-iKVM-over-Internet
(remote connection)
•AspeedAST230016MBVRAMonboardgraphics
•IntelGigabitEthernetcontroller
128GBmemoryperESXihost
Intel RS3DC080 SAS controller
Intel 730 Series (480 GB) SSDs 6x 480 GB RAID 0
NVIDIA GRID K2 2 x GRID K2
Table 2: ESXi Components

T E C H N I C A L W H I T E PA P E R / 1 2
VMware Horizon 6 3D Engineering Workloads Reference Architecture
NVIDIA GRID Cards
NVIDIA GRID GPUs are based on the NVIDIA Kepler GPU architecture. NVIDIA GRID GPUs support vGPU—the ability for multiple users to share a single physical GPU in a virtualized environment.
SPECIFICATION GRID K1 GRID K2
Number of GPUs 4 x entry Kepler GPUs 2 x high-end Kepler GPUs
Total NVIDIA CUDA cores 768 3072
Total memory size 16 GB DDR3 8 GB GDDR5
Maximum power 130 W 225 W
Card equivalent QuadroK600 QuadroK5000
Board length 10.5 10.5
Board height 4.4 4.4
Board width Dual-slot Dual-slot
Aux power 6-pin connector 8-pin connector
PCIe X16 X16
PCIe generation Gen3 (Gen2 compatible) Gen3 (Gen2 compatible)
Cooling solution Passive Passive
Technical specifications GRID K1 board specifications GRID K2 board specifications
Table 3: NVIDIA GRID K1 and K2 Specifications
VMware vSphere
Table4liststheESXiandvSpherecomponents.
ESXi 5.5 ESXi 6.0
ESXi5.5.0update01-1623387 ESXi6.0.0-2367142
vSphere Client 5.5.0 update 1618071 vSphere Client 6.0.0 2143706
vCenter Server 5.5.0 update 2183111 vCenter Server 6.0.0 2367421
VMware Client Integration Plug-in VMware Client Integration Plug-in
VMwareToolsversion9349 VMwareToolsversion9536
NVIDIA GRID driver NVIDIA GRID driver
Table 4: vSphere Software Components
T E C H N I C A L W H I T E PA P E R / 1 3
VMware Horizon 6 3D Engineering Workloads Reference Architecture
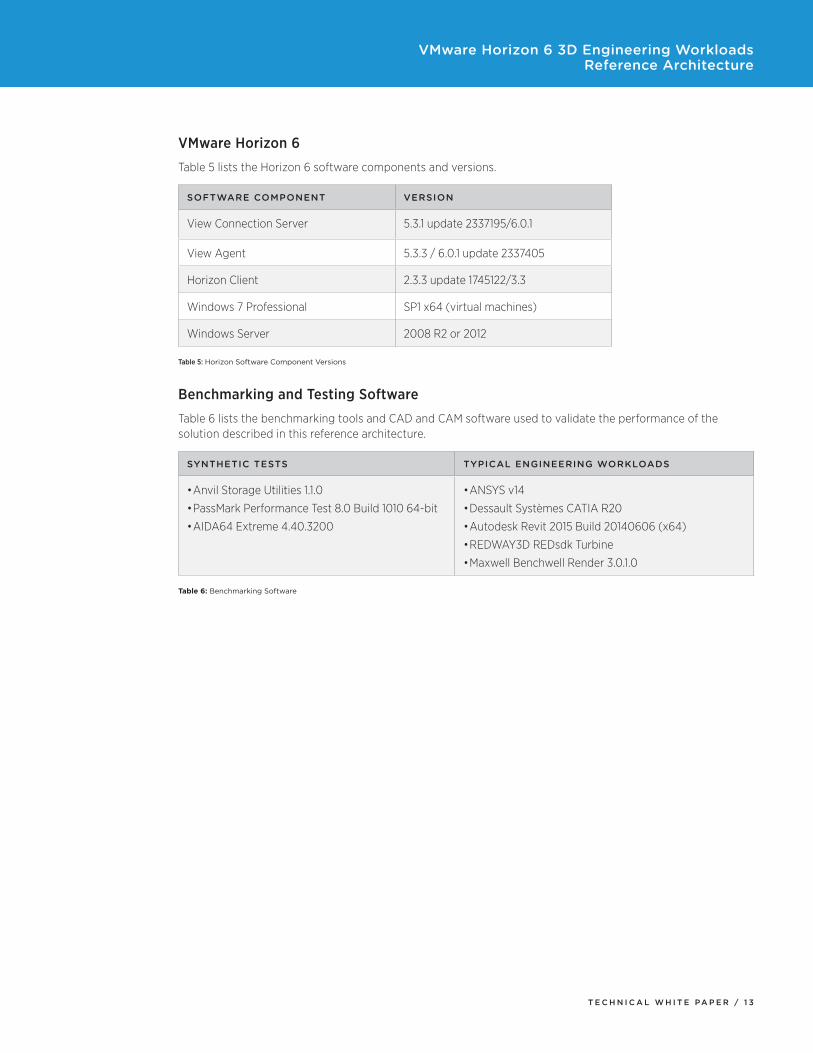
VMware Horizon 6
Table 5 lists the Horizon 6 software components and versions.
SOFTWARE COMPONENT VERSION
View Connection Server 5.3.1update2337195/6.0.1
View Agent 5.3.3/6.0.1update2337405
Horizon Client 2.3.3update1745122/3.3
Windows 7 Professional SP1 x64 (virtual machines)
Windows Server 2008 R2 or 2012
Table 5: Horizon Software Component Versions
Benchmarking and Testing Software
Table 6 lists the benchmarking tools and CAD and CAM software used to validate the performance of the solution described in this reference architecture.
SYNTHETIC TESTS TYPICAL ENGINEERING WORKLOADS
•AnvilStorageUtilities1.1.0
•PassMarkPerformanceTest8.0Build101064-bit
•AIDA64Extreme4.40.3200
•ANSYSv14
•DessaultSystèmesCATIAR20
•AutodeskRevit2015Build20140606(x64)
•REDWAY3DREDsdkTurbine
•MaxwellBenchwellRender3.0.1.0
Table 6: Benchmarking Software

T E C H N I C A L W H I T E PA P E R / 1 4
VMware Horizon 6 3D Engineering Workloads Reference Architecture
Reference Architecture OverviewVMware vSphere servers with Horizon 6 hosted in enterprise data centers enable users to access virtual desktops running 3D applications from a wide range of client devices. This solution provides users with graphics performance roughly equivalent to high-end graphics workstations, using lower-cost clients or repurposed devices. The solution uses PCoIP or a secure WebSocket protocol for remote display, and VMware vRealize Operations Manager to monitor the health and performance of all components.
Designing for 3D Desktop Workload Use Cases
Horizon 6 offers four types of 3D graphics acceleration: software-based Soft 3D, and hardware-based vSGA, vGPU, and vDGA. Figure 4 illustrates how the 3D technologies map to the main use case categories: task workers, knowledge workers, power users, and designers.
Light UsersFewer Applications
Task Worker Knowledge Worker Power User Designer
Aero
Productivity Apps with Graphics
WebGL
3D Viewers
Lightweight CAD
Diagnostics
GIS
Media and Graphics
Engineering
Architecture Design
Oil and GasImage
QualityInteractivity
Cost per Seat2D and 3D
Heavy UsersMany Applications
NVIDIA GRID vGPUSoft 3DvSGA
vDGA
Figure 4: 3D Technologies for Different Use Cases

T E C H N I C A L W H I T E PA P E R / 1 5
VMware Horizon 6 3D Engineering Workloads Reference Architecture
Task WorkersTask workers often require only Soft 3D, a software-based 3D renderer suitable for less graphics-intensive applications. They do not need, or realize a noticeable benefit from, hardware-based 3D acceleration. For that reason, the task worker use case is not considered in this paper. Soft 3D is a standard component of Horizon 6.
Light UsersFewer Applications
Task Worker Knowledge Worker Power User Designer
Aero
Productivity Apps with Graphics
WebGL
3D Viewers
Lightweight CAD
Diagnostics
GIS
Media and Graphics
Engineering
Architecture Design
Oil and GasImage
QualityInteractivity
Cost per Seat2D and 3D
Heavy UsersMany Applications
Figure 5: Products Plotted Against Use Cases by Increasing Quality and Cost

T E C H N I C A L W H I T E PA P E R / 1 6
VMware Horizon 6 3D Engineering Workloads Reference Architecture
Knowledge WorkersOffice workers and executives fall into this category, typically using applications such as Microsoft Office, Adobe Photoshop, and other non-specialized end-user applications. A vSGA solution can improve performance for this use case by providing high levels of consolidation of users across GPUs.
Figure 6: Knowledge Worker Applications Show Improved Performance with vSGA
However, vSGA does not provide a wide range of graphics API support, so it is often worthwhile to consider a vGPU-based solution for knowledge workers.
Power UsersThese users consume more complex visual data, but their requirements for manipulations of large datasets and specialized software are less intense than for designers. Their needs can typically be served more than adequately with access to a shared vGPU.
Figure 7: Typical Power User Applications that Are Somewhat Less Compute-Intensive

T E C H N I C A L W H I T E PA P E R / 1 7
VMware Horizon 6 3D Engineering Workloads Reference Architecture
DesignersDesigners and advanced engineering and scientific users often create and work with large, complex datasets and require graphics-intensive applications such as 3D design, molecular modeling, and medical diagnostics softwarefromcompaniessuchasDassaultSystèmes,Enovia,SiemensNX,andAutodesk.Theseuserstypicallyrequire either a vGPU- or vDGA-based solution.
Figure 8: Example Screens for Dassault CATIA (Left) and Autodesk 3ds Max (Right)
Choosing a 3D Graphics Acceleration Technology
The three types of hardware-based graphics acceleration available for View virtual desktops in Horizon 6 map well to the three major use cases considered here. However, vGPU provides the greatest performance and compatibility trade-off. Table 7 compares the main features of these technologies.
vDGA vGPU vSGA
GPU dedicated to one user GPUs shared among users but can be dedicated
GPUs shared among users
1:1 consolidation ratio(1 user per physical GPU)
Good consolidation ratio(8 users per physical GPU)
High consolidation ratio (limited by video memory on graphics card)
Workstation-level performance Entry-levelworkstationperformance under load
Solid performance for lightweight applications, but no driver certification
Maximum compatibility with all 3D GPU rendering and computation applications
Full compatibility with all 3D and GPU rendering applications; requires certification
Compatibility limited by API support and virtual machine video RAM capacity
DirectX9,10,or11 DirectX9,10,or11 DirectX9.0SM3only
OpenGL 2.1, 3.x, or 4.x OpenGL 2.1, 3.x, or 4.x OpenGL 2.1 only
Hardware video playback Hardware video playback Software video playback only

T E C H N I C A L W H I T E PA P E R / 1 8
VMware Horizon 6 3D Engineering Workloads Reference Architecture
vDGA vGPU vSGA
Compute APIs with CUDA or OpenCL
Does not support compute APIs, CUDA, or OpenCL
Does not support compute APIs, CUDA, or OpenCL
Not compatible with VMware vSphere vMotion® and vSphere High Availability
Not compatible with vSphere vMotion and HA
vSphere vMotion, HA, and VMware vSphere Distributed Resource Scheduler™ compatible—automatically falls back to software renderer as needed
Table 7: 3D Graphics Acceleration Comparison
Note: The key to maximizing return on investment when configuring 3D graphics acceleration is to provide sufficient 3D resources without overprovisioning.
Virtual Dedicated Graphics Acceleration (vDGA)This technology provides a user with unrestricted, fully dedicated access to a single vGPU. Although consolidation and management trade-offs are associated with dedicated access, vDGA offers the highest level of performance for users with the most intensive graphics computing needs. It enables the use of applications thatrunOpenGL4.4,MicrosoftDirectX9,10,or11,andNVIDIACUDA5.0.
With vDGA, the hypervisor passes the GPUs directly to guest virtual machines, so the technology is also known as GPU pass-through. No special drivers are required in the hypervisor. However, to enable graphics acceleration, the appropriate NVIDIA driver needs to be installed on the guest virtual machines. The installation procedures are the same as for physical machines.
CPU Memory Storage
Hypervisor (vSphere)
Guest OS
Virtual Machine
Network GPU
vCPU vMemory vStorage vNetwork GPU
VirtualDriver
VirtualDriver
VirtualDriver
NVIDIADriver
App App App
Soft
war
e
Clients
Virt
ualiz
atio
nH
ardw
are
ViewAgent
PCoIP
Figure 9: GPU Pass-Through (vDGA)

T E C H N I C A L W H I T E PA P E R / 1 9
VMware Horizon 6 3D Engineering Workloads Reference Architecture
Because the GPU is passed through to the guest OS, which uses native graphics drivers, vDGA fully supports everythingthechosendrivercandonatively,includingbutnotlimitedtoallversionsofDirectX,OpenGL,andCUDA.
BENEFITS PROS CONS
•Enablesdedicatedaccesstophysical GPU hardware for 3D and high-performance graphical workloads.
•UsesnativeNVIDIAdrivers
•CUDAavailabletovirtualmachine
•Bestforsuperhigh-performanceneeds
•Outstandingperformance
•Performanceequivalenttodedicated GPU in physical desktop
•SupportstheentireAPIstack
•DirectdriversupportforGPU
•Vendorcertification—technologyis direct pass-through
•Couldbeatrueworkstationreplacement option
•1:1consolidationratio
Table 8: Pros and Cons of vDGA
Virtual Graphics Processing Unit (vGPU)Horizon 6 version 6.1 and vSphere 6.0 include vGPU support. Like vDGA, vGPU brings the benefit of wide API support and native NVIDIA drivers but with greater scalability.
Guest OS
VirtualDriver
VirtualDriver
VirtualDriver
NVIDIADriver
App App App View Agent
Guest OS
VirtualDriver
VirtualDriver
VirtualDriver
NVIDIADriver
App App App ViewAgent
CPU Memory Storage
Virtual Machine
Network GPU
vCPU vMemory vStorage vNetwork vGPU
Soft
war
e
State
Stat
e
Gra
phic
Com
man
ds
Virt
ualiz
atio
nH
ardw
are
GRID Software
Clients
PCoIP
Guest OS
VirtualDriver
VirtualDriver
VirtualDriver
NVIDIADriver
App App App ViewAgent
Hypervisor (vSphere)
Figure 10: Hardware GPU Virtualization

T E C H N I C A L W H I T E PA P E R / 2 0
VMware Horizon 6 3D Engineering Workloads Reference Architecture
vGPU is essentially vDGA with multiple users instead of one user. As with vDGA, a user or administrator needs to install the appropriate NVIDIA driver on the guest virtual machine, and all graphics commands are passed directly to the GPU without having to be translated by the hypervisor. Up to eight virtual machines can share a GPU. Calculating the exact number of desktops or users per GPU depends on application requirements, screen resolution, number of displays, and frame rate measured in frames per second (FPS).
The vGPU technology provides better performance than vSGA and higher consolidation ratios than vDGA. It is a good technology to use for low-, mid-, or even advanced-level engineers and designers as well as for power users with 3D application requirements. One drawback of vGPU, however, is that it might require applications be recertified in order to be supported.
Choosing a vGPU ProfileEachphysicalGPUcansupportseveralvirtualGPUtypes,orprofiles.EachvGPUprofilehasafixedamountof frame buffer memory, number of supported display heads, and maximum resolutions, and is targeted at different classes of workload.
TheGPUprofiles(endinginQ,asshowninTable9)undergothesameapplicationcertificationprocessastheNVIDIAQuadroworkstation-classprocessors.
GRAPHICS BOARD
VIRTUAL GPU PROFILE
GRAPHICS MEMORY
MAXIMUM DISPLAYS PER USER
MAXIMUM RESOLUTION PER DISPLAY
MAXIMUM USERS PER GRAPHICS BOARD
USE CASE
NVIDIA GRID K2
K280Q 4,096MB 4 2560x1600 2 Advanced Designer or Engineer
K260Q 2,048 MB 4 2560x1600 4 DesignerEngineerPower User
K240Q 1,024 MB 2 2560x1600 8 DesignerEngineerPower User
K220Q 512 MB 2 2560x1600 16 DesignerPower User
NVIDIA GRID K1
K180Q 4,096MB 4 2560x1600 4 EntryDesigner
K160Q 2,048 MB 4 2560x1600 8 Power User
K140Q 1,024 MB 2 2560x1600 16 Power User
K120Q 512 MB 2 2560x1600 32 Power User
Table 9: vGPU Profiles
For a list of certified applications, download NVIDIA GRID Remote Workstation Certifications from the NVIDIA Web site.

T E C H N I C A L W H I T E PA P E R / 2 1
VMware Horizon 6 3D Engineering Workloads Reference Architecture
BENEFITS PROS CONS
•Lowercostduetogreaterconsolidation (up to 8 users per GPU)
•Supportforwiderangeof3Dapplications due to use of native NVIDIA drivers
•Goodfordesignerandengineeruse cases
•vGPUoffersvDGAperformanceandDirectXandOpenGLsupportwith the density of vSGA
•SharedGPUforupto 16 users on GRID K2, and 32 users on GRID K1
•Graphicscommandsofeachvirtual machine are passed directly to the GPU without translation
•GPUhardwareistime-slicedtodeliver a high-performance, shared virtualized graphics experience
•Full3Dapplicationcompatibilityusing certified NVIDIA drivers
•Abilitytoassignjusttherightamount of memory to meet each user’s specific needs
•Consolidationlimitedto8usersper GPU
•UnlikevSGA,vGPUdedicatesaportion of video RAM on the graphics card on a per-user basis
•Requiresindependentsoftwarevendor (ISV) certification in some cases
Table 10: Pros and Cons of vGPU

T E C H N I C A L W H I T E PA P E R / 2 2
VMware Horizon 6 3D Engineering Workloads Reference Architecture
Virtual Shared Graphics Acceleration (vSGA) This technology allows a GPU to be shared across multiple virtual desktops. It is an attractive solution for users who require the full potential of the GPU’s capability during brief periods. However, vSGA can create bottlenecks, depending on which applications are used and resources needed from the GPU. vSGA is generally used for knowledge workers and occasionally for power users, but it is restricted in its support for OpenGL and DirectXversions.FormoreinformationonvSGAperformance,seeVMware Horizon View 5.2 and Hardware Accelerated 3D Graphics.
Memory Storage Network
Guest OS
Virtual Machine
GraphicsCPU
vCPU vMemory vStorage vNetwork vGraphics
VirtualDriver
VirtualDriver
VirtualDriver
GRID K1, K2Quadro 4000, 5000, 6000
Tesla M2070Q
VMware vSGA – DX9, OGL2.1RemoteFX
Microsoft Server2008 R2 – DX9
Microsoft Server 2012 – DX9, 10, 11
VirtualGraphics
Driver
App App App
Soft
war
e
Clients
Virt
ualiz
atio
nH
ardw
are
ViewAgent
PCoIP
NVIDIADriver
Hypervisor (vSphere)
Figure 11: GPU Sharing vSGA
With vSGA, the physical GPUs in the host are virtualized and shared across multiple guest virtual machines. An NVIDIAdriverneedstobeinstalledinthehypervisor.EachguestvirtualmachineusesaproprietaryVMwarevSGA 3D driver that communicates with the NVIDIA driver in vSphere.

T E C H N I C A L W H I T E PA P E R / 2 3
VMware Horizon 6 3D Engineering Workloads Reference Architecture
Note: ThemainlimitationisthatthesedriversonlyworkwithDirectXuptoversion9.0candOpenGLuptoversion 2.1.
BENEFITS PROS CONS
•Enablessharedaccesstophysical GPU hardware for 3D and high-performance graphical workloads
•DesktopsstillseeabstractedVMware SVGA device for maximum virtual machine compatibility and portability
•Costeffectivewithmultiplevirtual machines sharing single GPU resource
•Maturetechnologywithappropriate number of ISVs supporting this type of configuration
•Scaleswellandprovidesgoodperformance
•Fullcompatibilitywithhostslacking physical GPUs (for vSphere vMotion, DRS, and so on)
•Notsuitableforhigh-endorcompute-intensive workloads
•Sharedenvironment,sharedproblems
•LimitedAPIsupport(Microsoft)
•LimitedmaximumvideoRAMof512 MB
Table 11: Pros and Cons of vSGA
3D Workload CompatibilityWhen not using vDGA mode, applications require certification against solutions that use vSGA or vGPU. Make sure that any applications are certified to work on vSGA or vGPU. For more information, see NVIDIA GRID GPUs and Drivers Are ISV Tested and Supported.
Sizing vSphere for 3D Workloads
Horizon uses the VMware SDDC platform to provide 3D graphics acceleration.
Horizon 6
vSphere
Available
ApplicationServices
Security Scalability
vSGAvDGAvGPU
LinkedClones
VirtualSAN
NetworkSpeci�cation
SESparse
DiskCBRC VAAI
vMotionStorage vMotionHAFault ToleranceData Recovery
NSXVMsafe
DRSHot Add
vCompute
InfrastructureServices
vStorage vNetwork
ESX and ESXiDRS and DPMMemoryOvercommit
VMFSThin ProvisioningStorage I/O Control
Distributed SwitchNetwork I/O Control
Figure 12: SDDC Platform

T E C H N I C A L W H I T E PA P E R / 2 4
VMware Horizon 6 3D Engineering Workloads Reference Architecture
Horizon 6 utilizes vSphere features, such as a DRS, HA, VMware VMsafe®, distributed vSwitch, thin provisioning, transparent page sharing, and memory compression. It also integrates with the following:
•VMware View Accelerator™ – Host-based memory cache of the most commonly read disk blocks. Helps reducereadI/Ostormsduringbootorloginevents.
•Automated deployment of desktops across a cluster – For vSGA and vGPU workloads only.
•vSphere vMotion of vSGA workloads – To ensure the highest level of uptime for knowledge workers.
•GPU virtualization – Support for a wide range of 3D-based use cases, using both shared (vSGA) and dedicated (vDGA) GPU virtualization. vGPU graphics acceleration technology is now available in vSphere 6.0 and Horizon 6 version 6.1.
Horizon 6 can be managed and monitored with vCenter Server, View Administrator Console, and vRealize Operations for Horizon.
ESXi Host Sizing ConsiderationsTable 12 summarizes the main sizing considerationsforESXihosts.
COMPONENT CONSIDERATIONS
GPU •vGPU–Allowscustomerstoscaleout3Ddesktopdeploymentswiththegreatestdriver support and performance. Supports power users, engineers, and designers. Requires NVIDIA GRID K1 or K2 cards.
•vDGA–Asafirststep,orinitialimplementation,configureeachgraphicscardinthevirtual machine as vDGA to eliminate potential driver issues and allow each user to benefit from full GPU performance. NVIDIA GRID cards are recommended for the greatest flexibility. If an application is not certified for GRID, consider the NVIDIA K4000 for CAD, or K5000 for DMU for manufacturing use cases.
CPU •CPUfrequencyisextremelyimportant,especiallyformonothreaded3Dapplications.Our testing indicated that four-vCPU desktops with no CPU overcommit provides the best performance. Only two vCPUs are required for the OS and application. However, additional vCPUs improve memory performance, display protocol, and application response time.
•DeployingfourvCPUworkloadsatscalewithoutCPUovercommitrequires16–32physical cores for a typical 4–8-user vGPU host deployment.
Memory •HighestfrequencymemoryintheESXihostyieldsbestperformanceresults.
•Giventhenatureof3Dapplications,virtualdesktopscanrequire16to64GBforheavy workloads. Supporting up to eight users per host can require 256 to 512 GB RAMintheESXihost.
•Increasingtheamountofmemoryinthevirtualmachineoftenleadstobetterperformance when models are cached in RAM rather than accessed from disk.
Storage •Thegreatestperformanceimpactcomesfromthechoiceofstoragesolutionanditsconfiguration. It is important to understand each user’s needs and plan accordingly.
•CADapplicationsareIOPS-bound,soitiscrucialtosizeandconfiguretheproperstorage solution for CAD users.
•CADuserscandemandmorethan1TBofstorageperdesktop.LocalSSDstoragesolutions (such as VMware Virtual SAN™) or all-flash SAN are recommended.
Table 12: Sizing Considerations for 3D Workloads on ESXi Hosts
Note: Understanding user requirements is the key to getting maximum performance from each virtual machine onyourESXihosts.

T E C H N I C A L W H I T E PA P E R / 2 5
VMware Horizon 6 3D Engineering Workloads Reference Architecture
Host Sizing ExampleThis reference architecture uses standard rackmount servers with dual-socket, 12-core, 2.7 GHz or 8-core, 3.3 GHzCPUs,and256GBRAM,runningESXi5.5orvSphere6.0.Thedesktopworkloadsusethe3.3GHzhosts,and the management workloads use the 2.7 GHz hosts.
AnESXihostcansupportamaximumofeightgraphicscards.Mostserverstodaysupport1–4dual-slotgraphics cards, such as the NVIDIA GRID K1 and K2. An NVIDIA GRID card can support up to eight users per GPU.TheK2hastwoGPUs;theK1hasfourGPUs.Forexample,theASUSservermodelESC4000G2,with8 x PCIe-x16 slots and only four slots populated by two dual-slot cards or four single-slot cards, allows the following maximum configurations:
vGPUTable 13 shows the maximum numberofusersbasedonthespecificationoftheESXihost.
GRAPHICS CARD TOTAL AVAILABLE PCIe
NUMBERS OF CARDS MAXIMUM NUMBER OF USERS FOR vGPU
GRID K2 4 2 (4 GPU) 32 (4 GPU x 8 users)
GRID K1 4 2 (8 GPU) 64 (8 GPU x 8 users)
Table 13: Maximum Number of Users per vGPU
Table 14 shows the maximum number of users per host based on the per-user requirements for CPU, memory, and storage.
COMPONENT REQUIREMENTS PER USER
TOTAL AVAILABLE
MAXIMUM NUMBER OF USERS
NOTES
Processor 2 CPUs 24 CPUs 11 without overcommit
Allocate 2 cores for hypervisor
Memory 16 GB 256 GB 15 Allocate 8 GB for hypervisor
SSD storage 250 GB 3 TB 12 Allocate 100 GB for hypervisor
GPUs 1 4–32 32, depending on workload
2 K2 cards with up to 16 users per card1 K2 = 2 K5000
Table 14: Maximum Number of Users per Host for vGPU
The CPU dictates the maximum number of users per vGPU-based architecture, depending on the vGPU profile and workload. CPU frequency is a more important consideration than the number of cores.
Note: For all configurations, the hypervisor requires a minimum of two CPU cores, 8 GB of memory, and 100 GB of available storage space.

T E C H N I C A L W H I T E PA P E R / 2 6
VMware Horizon 6 3D Engineering Workloads Reference Architecture
vDGAThe GPU dictates the scalability of a vDGA-based architecture. Table 15 shows the maximum number of users forvDGA,brokendownbytypeofgraphicscard.ThecalculationsarebasedonthespecificationoftheESXihost and the heavy workload expected to be supported by vDGA.
GRAPHICS CARD TOTAL AVAILABLE PCIe
NUMBERS OF CARDS MAXIMUM NUMBER OF USERS FOR vDGA
QuadroK5000 4 2 2
QuadroK4000 4 4 4
QuadroK2000 4 4 4
GRID K2 4 2 4
Table 15: Maximum Number of Users per vDGA
Table 16 shows the maximum number of users per host, based on the per-user requirements for CPU, memory, and storage.
COMPONENT REQUIREMENTS PER USER
TOTAL AVAILABLE
MAXIMUM NUMBER OF USERS
NOTES
Processor 2–4 cores 24 cores 5–11 without overcommit
Allocate 2 cores for hypervisor
Memory 32 GB 256 GB 8 Allocate 8 GB for hypervisor
SSD storage 400 GB 3 TB 7 Allocate 100 GB for hypervisor
Graphics card 1 4 4 Depends on card; for heavy workloads, maximum is 4 users
Table 16: Maximum Number of Users per Host for vDGA
Note: The hypervisor requires a minimum of two CPU cores, 8 GB of memory, and 100 GB of available storage space.

T E C H N I C A L W H I T E PA P E R / 2 7
VMware Horizon 6 3D Engineering Workloads Reference Architecture
Sizing GPU for 3D Workloads
Rotational fluidity—how smoothly the rotation of a part appears to a CAD user—is a key to user acceptance and satisfaction for the most graphics-intense use cases. GPU-based performance in CAD environments is based on tessellation—the number of triangles used to display the part. In general, the higher the GPU performance, the smoother the rotation. This consideration is crucial because engineers and designers need to be able to rotate parts with maximum precision. The rotation itself is performed by the GPU, while the CPU and other resources are responsible only for the elapsed time spent opening the part or object in a File Open operation.
IntheREDWAY3DCADTurbineBenchmarkusedtotesttheperformanceoftheGPUanditsabilitytohandle3D models and tessellation, the results show that both vDGA and vGPU can equal or even outperform a typical physical workstation. For example, Figure 33 shows results 2.5 times better for the high-quality, real-time benchmark and nearly 4 times better for high-quality view port performance on virtual machines than on an example physical machine.
To size the GPU accurately, the 3D engineering use cases can be defined as
•Entry-levelengineerordesigner
•Mid-level engineer or designer
•Advanced-level engineer or designer
•Digital mockup users (DMU)
•Manufacturing simulations
The following recommendations are based on NVIDIA and VMware testing:
USE CASE GPU vCPU vRAM (GB)
VIDEO RAM
DISPLAYS GPU
Power users and entry-level engineers and designers
vGPU 2 4 1 GB 2 GRID K1 or K2 K240Qprofile
3D mid-level engineers and designers
vGPU 4 8–16 2 GB 2–4 GRID K1 or K2K260Qprofile
3D advanced engineers
vDGA or vGPU
4 16 4 GB 2–4 NVIDIA K4000 or GRID K2
3D DMUs vDGA or vGPU
4 32–64 4 GB 2–4 NVIDIA K5000 or GRID K2
Manufacturing simulations
vDGA or vGPU
4 32–64 4 GB 2–4 NVIDIA K5000 or GRID K2
Table 17: Recommended 3D Desktop Sizing

T E C H N I C A L W H I T E PA P E R / 2 8
VMware Horizon 6 3D Engineering Workloads Reference Architecture
vGPU and vDGA PerformanceBased on several tests, the following GPU configurations are highly recommended.
USER TYPE RECOMMENDED CONFIGURATION
PowerUsers/Entry-LevelEngineers NVIDIA GRID K1 offers the greatest scalability for low-end engineering or power users.
Mid/Advanced-LevelEngineers NVIDIA K2 offers a scalable solution with the most performance for mid-to-high-end engineers and designers.
Advanced-LevelEngineers NVIDIAQuadroK4000providesthebestperformance-to-price ratio for vDGA. NVIDIA K2 is recommended for vGPU.
Heavy digital mock-up (DMU) NVIDIA K5000 or K2 (which is equal to 2 x K5000 on single GPU) are highly recommended for vDGA. NVIDIA K2 is recommended for vGPU.
Manufacturing Simulations NVIDIA K5000 offers the best overall performance for vDGA. NVIDIA K2 is recommended for vGPU.
Table 18: Recommended GPUs by Use Case
AsseenintheREDWAY3DCADTurbineBenchmark,thenumberofvirtualmachinesrunninginconcurrentsessions does not affect GPU performance when they are not sharing the GPU, although a minute fluctuation inresultsduetophysicalhardwarecharacteristicsalwaysoccurs.Eventhoughresultsmightvaryslightly,usersare not affected as long as the number of virtual machines remains within specifications.
Effect of Frame Rate Limiting (FRL) in vGPUTo share GPU resources effectively, vGPU limits the frames per second, based on the profile configured. Frame rate limiting is enabled by default and set to 60 FPS or 45 FPS, depending on the profile. For benchmarking purposes, frame rate limiting for the vGPU was turned off when the GPU was not shared.
Sizing Storage for 3D Workloads
The greatest performance impact comes from the storage solution and its configuration. It is crucial to understand each user’s needs and plan accordingly.
To minimize potential storage bottlenecks, choose a storage solution with the highest IOPS performance and most bandwidth possible. The size and throughput required for the optimum storage solution are determined byapplicationperformanceandsoftwareinteraction.Fortestresults,seeANSYSMechanicalBenchmark.
SSD-based local storage or use of Virtual SAN can be beneficial for 3D workloads. All-flash-based arrays are also a good choice for these workloads. Customers’ IOPS requirements should be validated against any potential storage solution. Refer to VMware and storage vendor reference architectures for more information.
Among the most important storage factors are size and performance:
•As capacity increases, so does the price.
•High-density storage is readily available at increasingly lower prices.
•Capacity needed for typical CAD users can be up to 1 TB.
•Storage performance is directly impacted as the number of desktops increases.
•Consider the use of VMware App Volumes™ to reduce the storage footprint of installed applications.
The total throughput capability of a given storage solution is shared among all virtual machines that utilize it, so increasing the number of virtual machines directly affects storage performance. All tests have shown that when virtual machines share storage, the maximum throughput for each virtual machine simultaneously performing

T E C H N I C A L W H I T E PA P E R / 2 9
VMware Horizon 6 3D Engineering Workloads Reference Architecture
IOPS-intensive tasks is equal to the maximum throughput that the given storage can sustain, divided by the number of virtual machines.
This calculation is a general rule of thumb. Try to allocate each virtual machine, or small group of virtual machines, to its or their own storage. In heavy 3D workloads with four to eight desktops per host, virtual machine placement across disks is crucial to performance optimization.
CAD applications are IOPS-bound, so it is especially important to size and configure the proper storage solution for CAD users.
ESXi Configuration
Before vDGA or vGPU can be enabled, make sure that the appropriate hardware support, such as Intel VirtualizationTechnologyforDirectedI/O(VT-d)orAMDI/OMemoryManagementUnit(IOMMU),isenabledontheESXihostbycheckingtheserverBIOSandverifyingthepowerandperformancesettings.Ifthereareany questions about finding this setting in the server BIOS, contact the hardware vendor.
Configuration for vDGAFigure13isanoverviewofthestepsneededtoconfigureESXiwithvDGA.
Install NVIDIAGPU Adapter
Edit VMX(pci.Hole.start) if
RAM > 2 GB
vSphere 5.5 or EarlierEnable Proprietary
NVIDIA CaptureAPIs in Guest OS
Horizon 6.0 or Earlier
Enable DevicePass-ThroughUsing vSphere
Web Client
Install NVIDIADriver and View Agent in Guest OS
Update VirtualMachine to
Hardware Version11
Add PCI Device toVirtual Machine
Connect via PCoIPon First Use
Figure 13: vDGA Configuration
ToenableGPUdevicepass-throughontheESXihost,performthefollowingsteps:
1. Using the vSphere Web Client, connect to VMware vCenter™ and select the host that has the GPU card installed.
2. Click the host’s Manage tab.
3. If the Hardware group is not expanded, click the down arrow next to it.
4. Click PCI Devices.
5. Right-click one of the GPUs installed in the system and select Edit.
6. In the Edit PCI Device Availability window, select the options that correspond to the GPU adapters that you want to use for pass-through.
7. Click OK.
The GPU should now be listed in the window on the Advanced Settings page.
Note: If the PCI devices are not shown as Available, restart the host to enable them.

T E C H N I C A L W H I T E PA P E R / 3 0
VMware Horizon 6 3D Engineering Workloads Reference Architecture
Configuration for vGPUFigure14isanoverviewofthestepsneededtoconfigureESXiwithvGPU.
Install NVIDIAGPU Adapter to
Host(s)
Put Host intoMaintenance Modeand Install NVIDIA
VIB
Con�gure VM forShared PCI Device
and Choose thevGPU Pro�le
Install NVIDIADriver and
View Agent in Guest OS
Add GRID-EnabledHosts to vSphere
Cluster
Build VM Templateswith GRID vGPUand VM Setting
Connect via PCoIPon First Use
Figure 14: vGPU Configuration
ToenablevGPUontheESXihost,performthefollowingsteps:
1. Download the vSphere Installation Bundle (VIB) for NVIDIA vGPU on vSphere 6.0.
2. Upload the VIB to your host using the vSphere Web Client Utility.
3. Put the host in maintenance mode.
4. Install the NVIDIA vGPU VIB.
5. Exit maintenance mode.
6. Reboot the host.
7. Confirm the VIB installation with the following command:
esxcli software vib list | grep –i nvidia
8. Confirm the GPU detection with nvidia-smi.
For more information, see the NVIDIA GRID vGPU Deployment Guide.
Note: If the PCI devices are not shown as Available, restart the host to enable them.
T E C H N I C A L W H I T E PA P E R / 3 1
VMware Horizon 6 3D Engineering Workloads Reference Architecture
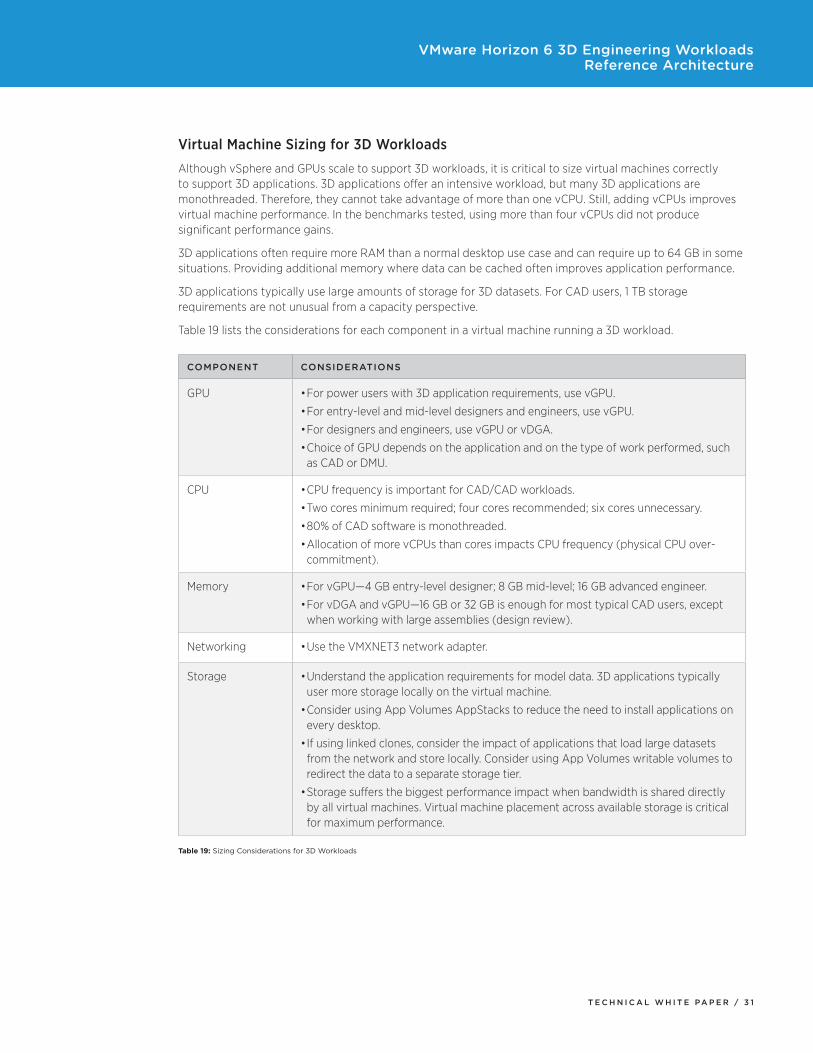
Virtual Machine Sizing for 3D Workloads
Although vSphere and GPUs scale to support 3D workloads, it is critical to size virtual machines correctly to support 3D applications. 3D applications offer an intensive workload, but many 3D applications are monothreaded. Therefore, they cannot take advantage of more than one vCPU. Still, adding vCPUs improves virtual machine performance. In the benchmarks tested, using more than four vCPUs did not produce significant performance gains.
3D applications often require more RAM than a normal desktop use case and can require up to 64 GB in some situations. Providing additional memory where data can be cached often improves application performance.
3D applications typically use large amounts of storage for 3D datasets. For CAD users, 1 TB storage requirements are not unusual from a capacity perspective.
Table19liststheconsiderationsforeachcomponentinavirtualmachinerunninga3Dworkload.
COMPONENT CONSIDERATIONS
GPU •Forpoweruserswith3Dapplicationrequirements,usevGPU.
•Forentry-levelandmid-leveldesignersandengineers,usevGPU.
•Fordesignersandengineers,usevGPUorvDGA.
•ChoiceofGPUdependsontheapplicationandonthetypeofworkperformed,suchas CAD or DMU.
CPU •CPUfrequencyisimportantforCAD/CADworkloads.
•Twocoresminimumrequired;fourcoresrecommended;sixcoresunnecessary.
•80%ofCADsoftwareismonothreaded.
•AllocationofmorevCPUsthancoresimpactsCPUfrequency(physicalCPUover-commitment).
Memory •ForvGPU—4GBentry-leveldesigner;8GBmid-level;16GBadvancedengineer.
•ForvDGAandvGPU—16GBor32GBisenoughformosttypicalCADusers,exceptwhen working with large assemblies (design review).
Networking •UsetheVMXNET3networkadapter.
Storage •Understandtheapplicationrequirementsformodeldata.3Dapplicationstypicallyuser more storage locally on the virtual machine.
•ConsiderusingAppVolumesAppStackstoreducetheneedtoinstallapplicationsonevery desktop.
•Ifusinglinkedclones,considertheimpactofapplicationsthatloadlargedatasetsfrom the network and store locally. Consider using App Volumes writable volumes to redirect the data to a separate storage tier.
•Storagesuffersthebiggestperformanceimpactwhenbandwidthisshareddirectlyby all virtual machines. Virtual machine placement across available storage is critical for maximum performance.
Table 19: Sizing Considerations for 3D Workloads

T E C H N I C A L W H I T E PA P E R / 3 2
VMware Horizon 6 3D Engineering Workloads Reference Architecture
Figure 15 highlights how vSphere and the GPU scale when running four concurrent virtual machines with four vCPUand16GBRAM.Exceptfordiskperformance,theirperformanceisidenticaltorunningasinglevirtualmachine with the same configuration.
Single VM – 4 cores, 16 GB 4037
0
2000
4000
6000
8000
10000
12000
14000
16000
18000
20000
3817
3798
3786
3925
7465
7411
7400
7473
7516
705
649
648
644
668
4491
4389
4397
4397
4457
1681
1867
1825
1815
1848
22090
6697
6757
6588
8520
PassMarkRating
CPUMark
2DGraphics
3DGraphics
MemoryMark
DiskMark
VM1 – 4 cores, 16 GB
VM2 – 4 cores, 16 GB
VM3 – 4 cores, 16 GB
VM4 – 4 cores, 16 GB
Score – Higher Is Better
Scor
e
PassMark Summary
Figure 15: Performance of a Single Virtual Machine (in Red) Versus Four Component Virtual Machines
Sizing vCPU for 3D WorkloadsTheCPUisthemostimportantcomponentfor3Dworkloads.Eachtimeauserloadsa3Dmodel,theCPUdedicates itself to computations, depending on model and mesh setup.
Operations, such as update, clash detection, drawing, and weight analysis, are especially CPU-intensive. Because most operations, including CAD operations, are monothreaded, a higher CPU clock frequency increases performance more than an increase in CPU cores (or vCPUs). Multithreaded applications, however, which are the exception, can benefit from running application threads across multiple CPU cores (or vCPUs).

T E C H N I C A L W H I T E PA P E R / 3 3
VMware Horizon 6 3D Engineering Workloads Reference Architecture
Figure 16 shows that no matter how many extra vCPUs are assigned to the virtual machine, the end result remains the same. With monothreaded applications, a virtual machine configured with two CPU cores performs identically to a virtual machine configured with six CPU cores for certain operations.
VM1 – 2 cores, 16 GB 5.2
0
10
20
30
40
50
60
70
5.5
4.5
11.4
11.9
11.9
28.6
30.3
30.8
54.3
56.3
57.4
18.6
18.3
18.1
12.2
12.5
12.8
8.2
7.8
7.6
8.2
7.8
7.6
37.7
36.1
35.9
Open and
LoadTemplate
CreateFloors
andGrid
CreateWallsand
Doors
AddCurtain
Wall
CreateExterior
Wall
CreateSections
ChangePanelType
ExportViews(PNG)
ExportViews(DWG)
VM1 – 4 cores, 16 GB
VM1 – 6 cores, 16 GB
Time (in seconds) – Lower Is Better
Tim
e (in
sec
onds
)
Revit – 2 Cores, 16 GB Versus 4 Cores, 16 GB Versus 6 Cores, 16 GB
Figure 16: Impact of Adding CPU Cores in Monothreaded Applications
However, for CPU-bound or CPU-sensitive rendering operations, each virtual machine benefits from the added number of allocated cores. Figure 17 shows that render times can be improved by the allocation of additional CPU cores to a virtual machine.
VM1 – 2 cores, 16 GB
0100200300400500600
542.1
542.1
276.8
276.8
278.7
278.7
212.3
212.3
Render Benchmark
VM1 – 4 cores, 32 GB
VM1 – 4 cores, 64 GB
Time (in seconds) – Lower Is Better
Revit Render Benchmark – Resource Allocation Comparison
VM1 – 6 cores, 16 GB
Figure 17: Resource (CPU) Allocation – Rendering Impact

T E C H N I C A L W H I T E PA P E R / 3 4
VMware Horizon 6 3D Engineering Workloads Reference Architecture
Sizing Memory for 3D Workloads3D engineering applications usually require a lot of memory. It is not uncommon for desktops to require 16–64 GB RAM to process large CAD models. When sizing memory for 3D workloads, consider the following rules of thumb:
•HighestfrequencymemoryintheESXihostyieldsthebestresults.
•Typical CAD designers require 16 GB of memory.
•Typical CAD DMUs require 32–64 GB of memory.
•Typical CAD manufacturing requires 16 GB of memory.
•Memory consumption is based on model and mesh size, number of parameters, and product structure.
AddingvirtualmachineshasnearlynoimpactonmemorythroughputonanESXihost.Memoryread/writeand latency are stable and uniform across all virtual machines. The slight variation shown in Figure 18 can be attributed to internal communication between hardware and software and some variability among memory modules.
The number of allocated CPU cores has a more significant impact on a given virtual machine, which is why correct sizing is so important for obtaining the most efficient virtualized environment.
Read (in MBps) 18354
05000
1000015000200002500030000350004000045000
6177
32659
12063
36813
16423
40563
16364
42190
16410
40441
16529
SingleVM – 2 core,
16 GB
SingleVM – 4 core,
16 GBVM1 – 4 core,
16 GBVM2 – 2 core,
16 GBVM3 – 4 core,
16 GBVM4 – 4 core,
16 GB
Write (in MBps)
Throughput – Higher Is Better
Thro
ughp
ut (i
n M
Bps)
Memory Performance Across Concurrent VMs
Figure 18: Memory Performance Across Concurrent Virtual Machines

T E C H N I C A L W H I T E PA P E R / 3 5
VMware Horizon 6 3D Engineering Workloads Reference Architecture
Memory performance increases when CPU cores are added to a single virtual machine. An application might not benefit directly from the added number of cores, except when it is a multithreaded application, such as rendering, video editing, or similar applications, but the user can notice a significant boost from the added memory throughput.
VM – 2 cores, 16 GBVersusVM – 4 cores, 16 GB
0%
20%
40%
60%
80%
100%
44% 49% 86% 0%
0%
86%
49%44%
Read(in MBps)
Write(in MBps)
Copy(in MBps)
Latency(in ns)
4 Co
res
– %
of I
ncre
ase
Memory Performance Increase from 2 Cores to 4 Cores
Figure 19: Memory Performance Increase from Two to Four Cores
Adding memory improves performance, despite an increase in latency. It also yields a greater performance impact than adding vCPUs, as seen in Figure 20.
VM – 2 cores, 16 GBVersus32 GB
0%
5%
10%
15%
20%
25%
30%
18% 28% 9% 19%
19%
9%
28%
18%
Read(in MBps)
Write(in MBps)
Copy(in MBps)
Latency(in ns)
32 G
B –
% o
f Inc
reas
e
Performance Increase – Higher Is Better
Memory Performance Increase from 16 GB to 32 GB
Figure 20: Memory Performance Increase from 16 GB to 32 GB

T E C H N I C A L W H I T E PA P E R / 3 6
VMware Horizon 6 3D Engineering Workloads Reference Architecture
Virtual Desktop Machine Configuration
The reference architecture used a Windows 7 image with the specifications listed in Table 20.
ATTRIBUTE SPECIFICATION
Desktop OS Windows7EnterpriseSP1(64-bit)
Hardware VMware virtual hardware version 11
CPU 4
Memory 16 GB
Memory reserved 16 GB
Video RAM 4 GB
3D graphics Hardware
NICs 1
Virtual network adapter 1 VMXNet3Adapter
Virtual SCSI controller 0 LSI Logic SAS
Virtual disk – VMDK 250 GB
Table 20: Windows 7 Image Virtual Machine Specifications
Optimizing the OSUse a fresh installation of the guest OS so that the correct versions of the hardware abstraction layer (HAL), drivers (including the optimized network and SCSI driver), and OS components are installed. A fresh installation also avoids performance issues with legacy applications and configurations of the desktop virtual machine. The image was optimized in accordance with the VMware Horizon with View Optimization Guide for Windows 7 and Windows 8. The changes were made with the free VMware OS Optimization Tool.
Enabling the Virtual Machine for GPU Pass-ThroughTo enable a virtual machine for GPU pass-through (vDGA), follow the checks and steps in the Horizon documentation. These are the key steps:
1. Update or verify that your virtual machine hardware version is at least version 9. Version 11 is recommended.
2. For Horizon 5.3, if a virtual machine has more than 2048 MB of configured memory, adjust the pciHole.start value in the VMX file to 2048.
3. Verify that the PCI device is added to the virtual machine’s hardware.
4. Install the NVIDIA driver.
5. Install the View Agent.
6. If using Horizon 5.3, manually enable the NVIDIA API capture (MontereyEnable.exe).

T E C H N I C A L W H I T E PA P E R / 3 7
VMware Horizon 6 3D Engineering Workloads Reference Architecture
7. Connect to the virtual machine for the first time.
To prevent the virtual machine from using the Soft 3D display adapter, activate the NVIDIA display adapter by connecting to the virtual machine from the endpoint for the first time with PCoIP. Use full-screen mode at native resolution.
Note: GPU pass-through does not work when accessed from the vSphere console session.
8. After the virtual machine has rebooted and you have connected through PCoIP in full screen mode, verify that the GPU is active by viewing the display information in DXDiag.exe.
Design Approach for 3D Workloads
VMware recommends that customers follow the proven approach of scalable and modular design principles illustrated in the VMware Horizon 6 Reference Architecture.
In this approach, server workloads and desktop workloads are placed into separate logical blocks that make up an instance of Horizon 6, known as a Horizon 6 pod. A Horizon pod, consisting of one or more View Connection Servers, is a logical administrative entity that can support anywhere from a few virtual desktops to thousands. A pod contains a management block and one or more desktop blocks. Server workloads are placed in the management block, and desktop workloads are placed in the desktop block. Separation of 2D and 3D desktops workloadsismaintainedbydistinctvSphereclustersmadeupofseveralESXihosts.
<n> 2D Desktops
Horizon 6 Pod
View Desktop Pools
Desktop Cluster
ESXi ESXi ESXi ESXi
ESXi ESXi ESXi ESXi
ESXi ESXiESXi
View 3DDesktop Pools
Desktop Cluster
Desktop Block
ESXi
Shared Storage
Server Cluster
Horizon Management Block
ESXi ESXi ESXi
ESXi ESXi ESXi ESXi
vCenter Server and View Composer
View Connection Server
View Security Server
View Security Server
vRealizeOperations
Manager
View Connection Server
Switched Ethernet Network
<n> 3D Desktops
Figure 21: Horizon Pod with Management Block, Desktop Block, and Clusters
T E C H N I C A L W H I T E PA P E R / 3 8
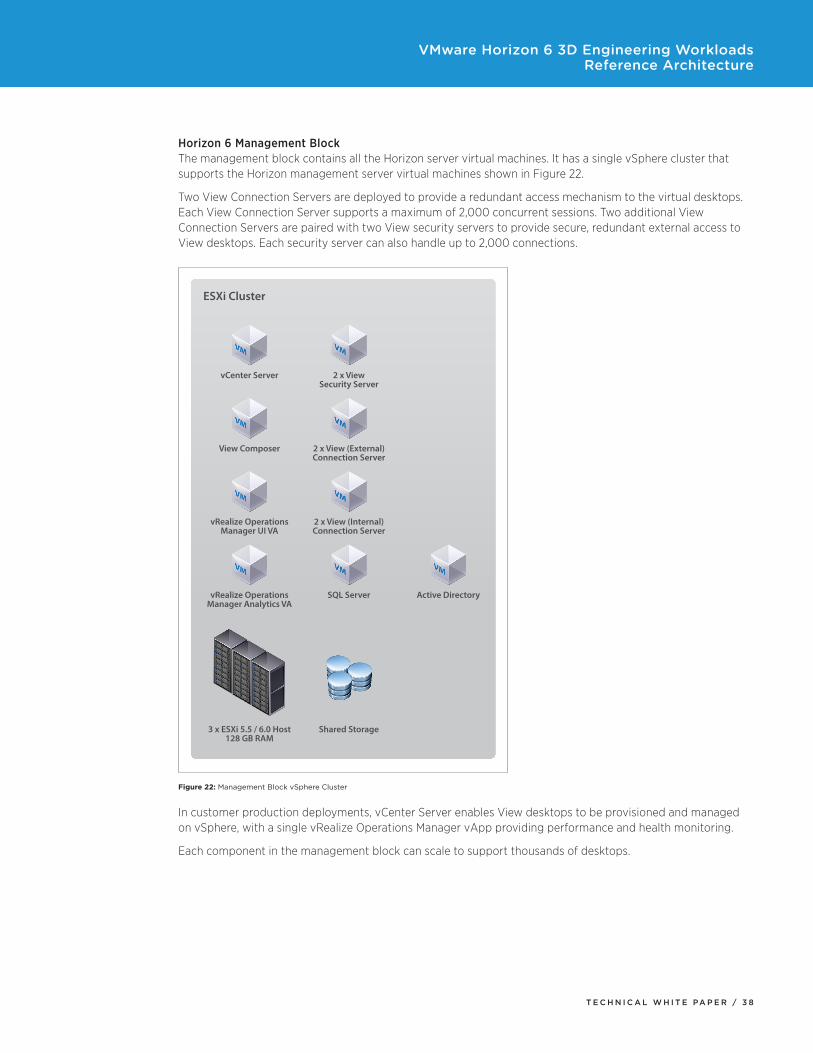
VMware Horizon 6 3D Engineering Workloads Reference Architecture
Horizon 6 Management BlockThe management block contains all the Horizon server virtual machines. It has a single vSphere cluster that supports the Horizon management server virtual machines shown in Figure 22.
Two View Connection Servers are deployed to provide a redundant access mechanism to the virtual desktops. EachViewConnectionServersupportsamaximumof2,000concurrentsessions.TwoadditionalViewConnection Servers are paired with two View security servers to provide secure, redundant external access to Viewdesktops.Eachsecurityservercanalsohandleupto2,000connections.
ESXi Cluster
vCenter Server
View Composer
vRealize OperationsManager UI VA
vRealize OperationsManager Analytics VA
2 x ViewSecurity Server
2 x View (External)Connection Server
2 x View (Internal)Connection Server
SQL Server
3 x ESXi 5.5 / 6.0 Host128 GB RAM
Shared Storage
Active Directory
Figure 22: Management Block vSphere Cluster
In customer production deployments, vCenter Server enables View desktops to be provisioned and managed on vSphere, with a single vRealize Operations Manager vApp providing performance and health monitoring.
Eachcomponentinthemanagementblockcanscaletosupportthousandsofdesktops.

T E C H N I C A L W H I T E PA P E R / 3 9
VMware Horizon 6 3D Engineering Workloads Reference Architecture
Horizon 6 Desktop Blocks and ClustersA Horizon 6 desktop block is a logical entity made up of vSphere clusters dedicated to virtual desktop workloads. A desktop block usually shares networking and storage resources and can support a known maximum number of desktops. A Horizon desktop block is usually managed by an instance of vCenter Server deployed in the management block.
In a standard View reference architecture design, a desktop block, delineated by a dedicated vCenter Server instance, supports up to 2,000 concurrent sessions or desktops.
A desktop block can accommodate multiple vSphere clusters. To prevent 2D desktop users from getting over-provisioned or taking up valuable 3D GPU resources, put 2D and 3D desktop workloads in separate clusters.
In addition, you can create 3D clusters based on profiles to ensure that different specifications are not mixed in the same cluster.
Local storage (using Virtual SAN) or shared storage can be used to store the virtual desktop workloads.
Setting Up Horizon for 3D WorkloadsTake the following steps to set up 3D desktop pools in Horizon 6.
Create 3D AutomatedDesktop Pools in HorizonUsing View Administrator
Select NVIDIA GRIDGPU vCenter Clusters to
Back the Pool
Add User / GroupEntitlements to
View Desktop Pool
Connect over PCoIPUsing a View Client
View Desktop PoolDefault Protocol Set to
PCoIP
View Desktop PoolSetting to Disable User
Protocol Change
Create View Desktop Pool
• View Pool 3D Renderer set toAutomatic (vDGA)
Power O� Any ExistingDesktops
• Registered for 3D Renderersetting to take e�ect
• Restart is not enough
• View Pool 3D Renderer set toNVIDIA GRID vGPU (vGPU)
Figure 23: Steps to Configure Horizon for 3D Workloads
View 3D Desktop PoolsFor the use cases in this reference architecture, View desktop pools with the following specifications are recommended.
POOL NAME USE CASE GPU DESKTOP IMAGE
Power 3D Power Users, Entry-LevelEngineersand Designers
vGPU 2 vCPU 4 GB RAM HW11, Windows 7 64-bit, 1 GB videoRAM,2displays,K240Qprofile
Engineer 3DMid-LevelEngineersand Designers
vGPU 4 vCPU, 8 GB RAM HW11, Windows 64-bit, 2 GB videoRAM,4displays,K260Qprofile
CAD 3D CAD Users vDGA or vGPU
4 vCPU 16 GB RAM HW11, Windows 7 64-bit, 4 GB videoRAM,K280QprofileorvDGAequivalent
DMU 3D DMU Users vDGA or vGPU
4 vCPU 32 GB RAM HW11, Windows 7 64-bit, 4 GB videoRAM,K280QprofileorvDGAequivalent
Table 21: Recommended Pool Specifications

T E C H N I C A L W H I T E PA P E R / 4 0
VMware Horizon 6 3D Engineering Workloads Reference Architecture
Designing for User Experience
With Horizon, IT can deliver desktops and applications to end users through a unified workspace, using the following features:
•AdaptiveUX–OptimizedaccessacrosstheWANandLANthroughanHTMLbrowserorthepurpose-builtdesktop protocol PCoIP
•Multimedia – High-performance multimedia streaming for a rich user experience
•3D – Rich virtualized graphics delivering workstation-class performance
•Live communications – Fully optimized unified communications and real-time audio and video support (Horizon 6 includes support for Microsoft Lync with Windows 8)
•Unity Touch – Intuitive and contextual user experience across devices, making it easy to run Windows on mobile
•Local access – Access to local devices, USB, and device peripherals
Client Devices All client devices use either VMware Workspace™ Portal or Horizon Client to connect to 3D desktops. Horizon Client software is publicly available for download and can be installed on many different devices. Horizon supports many types of client devices, or endpoints, including
•Apple iPhone 5 and 6
•Apple iPad 2
•Apple MacBook
•Android tablet
•Teradici-based zero clients
•Linux- and Windows-based thin clients
•Microsoft PC running Windows 7 with single or dual monitors
Horizon Client is required for access to View desktops supported by vSGA, vGPU, or vDGA. HTML access is supported on desktops running Soft 3D and vDGA.
Client Device User Experience and PerformanceAlthough Horizon Client is supported across many client devices, it is important not to underestimate the amount of CPU and memory that a device needs to decode the display protocol.
3D applications with fast-changing graphics can require considerable bandwidth to support the PCoIP traffic that flows between the virtual desktop in the data center and end-user client devices. Lack of sufficient bandwidth can lead to a poor end-user experience.
PCoIP is an adaptive protocol that uses as much bandwidth as is available in LAN scenarios. In some 3D use cases, as much as 70 Mbps of PCoIP traffic per virtual desktop has been observed during peak loads. This high bandwidth requirement is caused by a number of factors, including FPS, changes to the desktop display, display resolution, color depth, and many PCoIP settings. For a high-fidelity experience over the LAN, client devices must have the resources needed to decode the protocol at speed.
Some low-end thin clients do not have the CPU processing power they need to decode PCoIP data fast enough to render a smooth and uninterrupted end-user experience. However, this is not always the case for every environment and end-user client; it depends on which applications users are running on their virtual desktops.

T E C H N I C A L W H I T E PA P E R / 4 1
VMware Horizon 6 3D Engineering Workloads Reference Architecture
For high-end 3D and video workloads, use a high-performance zero client with a Teradici PCoIP Tera2-based chip or a modern Core i3-, i5-, or i7-based Windows PC to achieve best performance with multiple high-resolution displays.
Note: Older Teradici zero clients with Tera1 chips can support a maximum rate of 30 FPS. The current Tera2 chip can achieve up to 60 FPS. High frame rates can be important to the usability of certain engineering applications.
PCoIP is optimized to provide the best user experience across the available network bandwidth. In network-constrained scenarios, it is imperative to tune PCoIP settings and optimize the network for PCoIP.
PCoIP Performance3Dengineeringworkloadshaveuniqueperformancerequirements.Engineersanddesignersoftenneedadesktop that is highly responsive and that builds to a lossless image.
GPU Throughput Calculation The calculation for GPU throughput for uncompressed video is straightforward, based on the following three parameters:
PARAMETER CONSIDERATIONS
Color depth Also referred to as bits per pixel or BPP, color depth defines how many colors can be represented by each pixel in a video.
Video resolution The number of pixels wide by the number of pixels high for the current display.
Frame rate The number of still images or FPS sent as part of the display stream.
Table 22: Parameters for GPU Throughput Calculations
With these three parameters, you can calculate the total GPU throughput requirements for uncompressed HD video. For example, consider the following calculation:
Color depth x Video resolution x Frame rate = Throughput
Substitute the following values:
32BPPx1920pixelsx1200pixelsx30FPS=2211Mbps
Calculate a potential optimization based on reducing the color depth and frame rate:
16BPPx1920pixelsx1200pixelsx24FPS=884Mbps
The display protocol performs a critical function in optimizing the transmission of the frame buffer, often reducing the average and average peak network bandwidth to less than 2 Mbps and 5 Mbps, respectively.
PCoIP and Network Bandwidth ConsumptionPCoIP uses compression, intelligent frame buffer analysis, and other techniques to send only pixels that have changed. This allows it to optimize bandwidth and throughput by reducing the number of pixels sent to a remote client.
Use the following guidelines for a typical CAD use case:
•Plan for 2–2.5 Mbps average bandwidth for a CAD user in a WAN scenario.
•Plan for 4–7 Mbps average peak bandwidth to provide headroom for bursts of display changes. In general, size networks based on the average bandwidth, but consider peak bandwidth to accommodate bursts of imaging traffic associated with large changes to the screen.
•CAD use can peak to 70 Mbps on LAN networks if bandwidth is available.
•Plan for less than 70–80 percent network utilization.

T E C H N I C A L W H I T E PA P E R / 4 2
VMware Horizon 6 3D Engineering Workloads Reference Architecture
Note: Average bandwidths are often in the 2–5 Mbps range, because users are seldom continuously active throughout the day. To be sure of the average, put at least five CAD users under network monitoring for a minimum period of a week.
PCoIP OptimizationTo optimize bandwidth without reducing the resolution, the following measures were taken to control the image in the tests. All measures were implemented via the Microsoft Group Policy template for PCoIP.
•Imagequalitywaslimitedat90percent,whichissufficienttomaintainaccuracyforCADandpreprocessing.
•The frame rate was limited at 24 FPS, which often meets CAD and CAM expectations. In some instances, FPS can be limited further if the engineer is not working with animation or video. Limiting the FPS can lower the required bandwidth.
•The build-to-lossless function was disabled.
For more information about PCoIP settings, see the VMware knowledge base article on Configuring PCoIP session variables.

T E C H N I C A L W H I T E PA P E R / 4 3
VMware Horizon 6 3D Engineering Workloads Reference Architecture
ConclusionEvenbeforethefirstvirtualdesktopsbecamecommerciallyavailable,around2007,remotecomputingsolutionsforapplicationssuchasCAD/CAM,diagnosticimaging,moleculardesign,andspaceexplorationprovedelusive.This reference architectures shows, based on extensive testing and industry-standard benchmarks, how NVIDIA GRID vGPU technology and VMware vSphere and Horizon 6 virtualization software offer viable, cost-effective, solutions for design engineers, scientific investigators, and data explorers.
Although Horizon 6 offers software-based graphics acceleration that is sufficient for basic use, the testing reported here focuses on hardware-based graphics acceleration, showing how various combinations of GRID graphics cards and server and memory configurations can be used to accommodate a range of advanced user requirements and match them with budgetary considerations.
Shared access to the virtualized graphics processing unit makes immersive 3D graphics applications accessible from remote devices. This solution all but eliminates the need for dedicated graphics workstations, improving security and freeing the investigator from the confines of the office or laboratory.
About the Author and ContributorsMattCoppingerisDirector,EUCTechnicalMarketingandEnablement,End-UserComputingatVMware.Hehasworked on desktop virtualization in a variety of roles since its inception at VMware in 2007, writing reference architectures for VMware Horizon 6 and speaking at VMworld. He wishes to thank the following people for their contributions to this reference architecture:
•FabriceGirerd,CEOandDirectorofMVConcept.Fabricehasextensiveknowledgeacrossallsegments,fromCAD/CAx/PLMandHPCtoremotesolutionsandarchitecture,withafocusonoptimizations.
•David Bonnet, co-owner and Technical Director of MVConcept. David has extensive experience in application optimization and benchmarking as well as in understanding and analysis of engineering workloads.
•Gary Sloane, consulting editor and writer for VMware. Gary has contributed to dozens of white papers, technical reports, and reference architectures as well as hundreds of manuals.
Tocommentonthispaper,contacttheVMwareEnd-User-ComputingTechnicalMarketingteamat [email protected].

T E C H N I C A L W H I T E PA P E R / 4 4
VMware Horizon 6 3D Engineering Workloads Reference Architecture
ReferencesAntivirus Best Practices for Horizon View 5.x
Configuring PCoIP session variables
NVIDIA GRID Certified Servers
VMware and NVIDIA GRID vGPU Deployment Guide
NVIDIA GRID vGPU with VMware Horizon 6.1
Optimization Guide for Windows 7 and Windows 8 Virtual Desktops in Horizon with View
View Planner Resources
View Storage Accelerator
VMware Desktop Virtualization Services
VMware End-User Computing Solutions
VMware Hardware Compatibility List
VMware Horizon Documentation
VMware Horizon Technical Resources
VMware Horizon with View and Hardware Accelerated 3D Graphics Performance (vSGA)
VMware Horizon with View Graphics Acceleration Deployment Guide
VMware Horizon with View and Virtual SAN Reference Architecture
VMware Horizon 6 Reference Architecture
VMware Products
VMware vCenter Database Performance Improvements and Best Practices for Large-Scale Environments

T E C H N I C A L W H I T E PA P E R / 4 5
VMware Horizon 6 3D Engineering Workloads Reference Architecture
Appendix A: Test ResultsvGPU and vDGA testing focused on the following representative benchmarks for 3D workloads.
CATIA R20
Setup information and results of the CATIA benchmarks are detailed in the following tables and figures:
SETUP INFORMATION
Product name Nice_Airport.CATPRODUCT
Dataset size 1.20 GB
Number of files 319
Number of instances 336
Number of triangles 2291453
3D accuracy Proportional 0.01
2D accuracy Proportional 0.01
Table 23: CATIA R20 Setup Information
HARDWARE INFORMATION – VIRTUAL MACHINE 4 CORES, 16 GB
CPU 2667V2/4cores(VMSize)
RAM 16 GB
Graphics card NVIDIA GRID K2 (vDGA)
Hard drive 240 GB 730 Series RAID 0
Table 24: CATIA R20 Hardware Information for a Four-Core Virtual Machine

T E C H N I C A L W H I T E PA P E R / 4 6
VMware Horizon 6 3D Engineering Workloads Reference Architecture
Figure 24: Performance Settings K2 vDGA Proportional
Figure 25: File Open Elapsed Time K2 vDGA

T E C H N I C A L W H I T E PA P E R / 4 7
VMware Horizon 6 3D Engineering Workloads Reference Architecture
Figure 26: Drawing Elapsed Time K2 vDGA
HARDWARE INFORMATION – VIRTUAL MACHINE 6 CORES, 16 GB
CPU 2667V2/6cores(VMSize)
RAM 16 GB
Graphics card NVIDIA GRID K2 (vDGA)
Hard drive 240 GB 730 Series RAID 0
Table 25: CATIA R20 Hardware Information for a Six-Core Virtual Machine
Figure 27: Nice Airport File Open Elapsed Time

T E C H N I C A L W H I T E PA P E R / 4 8
VMware Horizon 6 3D Engineering Workloads Reference Architecture
Figure 28: Nice Airport Drawing Elapsed Time
OPERATION ELAPSED TIME FOR 4-CORE DESIGN MODE VIRTUAL MACHINE
ELAPSED TIME FOR 6-CORE DESIGN MODE VIRTUAL MACHINE
Dataset Opening Opening time 2 minutes 14 seconds 2 minutes 14 seconds
CPU time 2 minutes 12 seconds 2 minutes 17 seconds
Dataset Drawing Creation time 1 hour 13 minutes 1 hour 17 minutes 16 seconds
CPU time 1 hour 13 minutes 6 seconds 1 hour 14 minutes 54 seconds
Table 26: CATIA Benchmark Results for Four-Core and Six-Core Virtual Machines
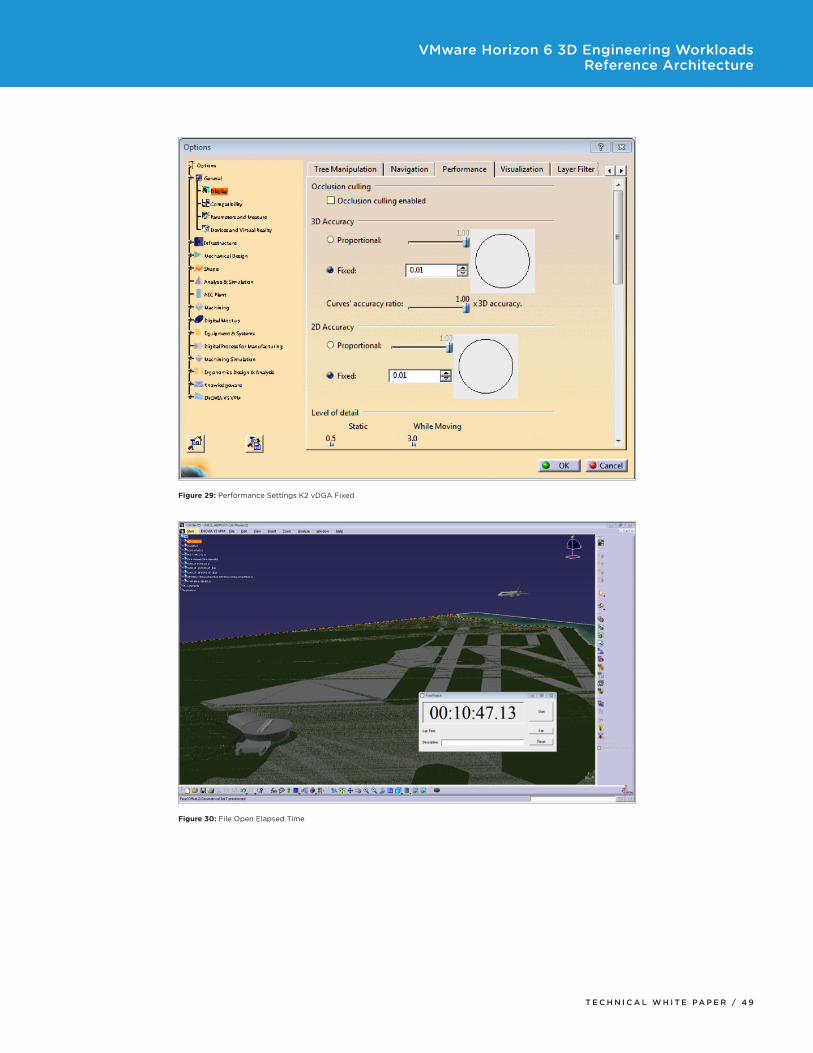
T E C H N I C A L W H I T E PA P E R / 4 9
VMware Horizon 6 3D Engineering Workloads Reference Architecture
Figure 29: Performance Settings K2 vDGA Fixed
Figure 30: File Open Elapsed Time

T E C H N I C A L W H I T E PA P E R / 5 0
VMware Horizon 6 3D Engineering Workloads Reference Architecture
Figure 31: Drawing Elapsed Time
CATIA Benchmark ResultsThe following table compares the results for four dedicated cores (Proportional 0.01) to four dedicated cores (Fixed 0.01).
BENCHMARK RUN TEST
OPERATION Design Mode Virtual Machine 4 Cores Proportional 0.01ElapsedTime
Design Mode Virtual Machine 4 Cores Fixed 0.01ElapsedTime
Dataset Opening Opening time 2 minutes 14 seconds 11 minutes 25 seconds
CPU time 2 minutes 12 seconds 11 minutes 22 seconds
Dataset Drawing Creation time 1 hour 13 minutes 1 hour 12 minutes 45 seconds
CPU time 1 hour 13 minutes 6 seconds 1 hour 12 minutes 30 seconds
Table 27: Proportional Compared to Fixed for Four Dedicated Cores
CATIA R20 Test ConclusionThe test results show the CPU and CAD interaction. Whether an engineer initiates a File Open operation, opens a model, or draws or drafts the model, all results show the same performance. CPU time and total elapsed time for each job remain in sync and provide optimal performance and efficiency.
After a virtual machine is sized and configured correctly with respect to CPU frequency, memory frequency and quantity, and storage, it is possible to optimize the software layer by properly configuring the 2D and 3D accuracy of the model. Adjustments depend on user requirements and can be expected to yield different results for different tasks.

T E C H N I C A L W H I T E PA P E R / 5 1
VMware Horizon 6 3D Engineering Workloads Reference Architecture
REDWAY3D CAD Turbine Benchmark
The REDWAY3D CAD Turbine benchmarkisfreelyavailablefromREDWAY3D.
Figure 32: REDWAY3D CAD Turbine Rendering Model
For the first test (vDGA) only, two virtual machines can be active in concurrent sessions on a single GPU (NVIDIA GRID K2).
The virtual machines are configured with four dedicated cores, with hyperthreading, 16 GB of memory, and NVIDIA GRID K2.
Resolution 1024 x 768
4017
3937
6518
1734
3657
1135
1541
8363
2692
2505
Real-TimeViewport
High-QualityReal-Time
Dynamic AmbientOcclusion
HybridRay-Tracing
Total Score
Resolution 1024 x 768
Real-TimeViewport
High-QualityReal-Time
Dynamic AmbientOcclusion
HybridRay-Tracing
Total Score
REDsdk Turbine Benchmark
Virtual Machine
REDsdk Turbine Benchmark
Graphical User Experience – View vDGA Versus NVIDIA GeForce Physical Workstation
Physical Workstation
Figure 33: vDGA-Enabled Virtual Machine Versus a Physical Workstation
Although the physical workstation produced slightly better results for occlusion and ray tracing, the superior performance of the virtual machines on the viewport and rendering tests yielded an overall score that was 45 percent better.

T E C H N I C A L W H I T E PA P E R / 5 2
VMware Horizon 6 3D Engineering Workloads Reference Architecture
The next test demonstrates how vDGA scales across the GPU and vSphere by running four concurrent vDGA virtual machines. The performance of each of the virtual machines is equivalent to the performance of a single virtual machine. In fact, running concurrent virtual machines shows a slight performance enhancement.
4252
0
1000
2000
3000
4000
5000
6000
7000
8000
Real-TimeViewport
3699
High-QualityReal-Time
6478 1699 3627
Dynamic AmbientOcclusion
Hybrid Ray-Tracing
TotalScore
Scor
e –
Hig
her I
s Be
tter
3D CAD Turbine – Single VM (vDGA) Versus 4x Concurrent VMs (vDGA) – vSphere 5.5
Single Virtual Machine
4120 3690 6846 1695 3645VM2 4x Concurrent VMs
4202 3803 7010 1762 3748VM1 4x Concurrent VMs
4211 3838 7010 1784 3771VM3 4x Concurrent VMs
4260 3875 7051 1836 3823VM4 4x Concurrent VMs
Figure 34: Four Concurrent Virtual Machines with vDGA Compared to One Virtual Machine with vDGA
3500
3550
3600
3650
3700
3750
3800
3850 3823
37713748
36453627
3D CAD Turbine – Single VM Versus 4x Concurrent VMs Total Score
Total Score – Higher Is Better
Single Virtual Machine
VM2 4x Concurrent VMs
VM1 4x Concurrent VMs
VM3 4x Concurrent VMs
VM4 4x Concurrent VMs
Figure 35: Four Concurrent Virtual Machines and One Virtual Machine

T E C H N I C A L W H I T E PA P E R / 5 3
VMware Horizon 6 3D Engineering Workloads Reference Architecture
The next test compares vDGA to the same profile on vGPU. In the following test, each vGPU profile on a single virtual machine is compared to a vDGA-enabled virtual machine. In this test, the frame rate limiter for vGPU was disabled because the GPU is not shared.
Single vGPU K260Q 4369
0
1000
2000
3000
4000
5000
6000
7000
8000
4665
4385
4240
4252
Real-TimeViewport
4824
4752
4469
4647
3699
High-QualityReal-Time
6928
6846
6846
6969
6478
1870
1946
1780
1936
1699
4065
4146
3931
4038
3627
Dynamic AmbientOcclusion
Hybrid Ray-Tracing
TotalScore
Single vGPU K240Q
Single vGPU K200
Single vGPU K220Q
Single Virtual Machine vDGA
Scor
e –
Hig
her I
s Be
tter
3D CAD Turbine – Single VM vDGA Versus Single VM vGPU (All)
Figure 36: Profile Performance – vDGA Versus vGPU
Note: ThistesthasnoGPUsharing.EachvGPUprofilehasaccesstoafullGPUinthesamewaythatvDGAhasaccess to a single GPU. Although different profiles have been selected, the performance is equivalent across the board.

T E C H N I C A L W H I T E PA P E R / 5 4
VMware Horizon 6 3D Engineering Workloads Reference Architecture
The next test shows the performance of a vGPU-enabled virtual machine with the frame rate limiter enabled. This reduces the maximum number of available frames per second to 60 for each virtual machine. Note the impact of the frame rate limiter in this test.
1324
0
1000
2000
3000
4000
5000
6000
7000
1330
1340
1320
Real-TimeViewport
2011
2013
2012
2009
High-QualityReal-Time
6231
6272
6354
6272
1237
1317
1389
1283
2128
2169
2209
2149
Dynamic AmbientOcclusion
Hybrid Ray-Tracing
TotalScore
VM3 3x VMs vGPU
VM1 3x VMs vGPU
VM2 3x VMs vGPU
Single vGPU
Scor
e –
Hig
her I
s Be
tter
3D CAD Turbine – Single VM vGPU Versus 3x Concurrent VMs vGPU
Figure 37: CAD Turbine on Three Concurrent Virtual Machines

T E C H N I C A L W H I T E PA P E R / 5 5
VMware Horizon 6 3D Engineering Workloads Reference Architecture
The final test demonstrates the scalability of vGPU by testing eight concurrent virtual machines, sharing the GPU (two users per GPU, four users per card, and eight users per host).
This test shows that, even when sharing the GPU, the performance of vGPU is equivalent to the performance of a single vGPU-enabled virtual machine.
1365
0
1000
2000
3000
4000
5000
6000
7000
1254
1356
1349
Real-TimeViewport
1943
1817
1940
2013
High-QualityReal-Time
4715
4427
4715
6313
1554
1254
1527
1427
2100
1886
2086
2224
1374 1953 4715 1539 2101
1284 1864 4715 1741 2105
1189 1794 4468 1307 1878
1275 1817 4715 1847 2120
1261 1791 4796 1754 2088
Dynamic AmbientOcclusion
Hybrid Ray-Tracing
TotalScore
VM3 8x VMs vGPU 260Q
VM1 8x VMs vGPU K260Q
VM2 8x VMs vGPU K260Q
Single vGPU K260Q
Scor
e –
Hig
her I
s Be
tter
3D CAD Turbine – Single VM vGPU Versus 8x Concurrent VMs vGPU (K260Q)
VM4 8x VMs vGPU 260Q
VM5 8x VMs vGPU 260Q
VM6 8x VMs vGPU 260Q
VM7 8x VMs vGPU 260Q
VM8 8x VMs vGPU 260Q
Figure 38: Eight Concurrent Virtual Machines Compared to a Single vGPU Virtual Machine

T E C H N I C A L W H I T E PA P E R / 5 6
VMware Horizon 6 3D Engineering Workloads Reference Architecture
Bench Revit – RFO Benchmark 2015
For these tests, the virtual machines were configured with four dedicated cores (with hyperthreading), 16 GB of memory, and NVIDIA GRID K2.
The tasks tested were model creation and view export, render benchmark, and GPU benchmark.
Figure 39: Revit Benchmark Rendering
Figure 40: Revit Benchmark CAD Drawing

T E C H N I C A L W H I T E PA P E R / 5 7
VMware Horizon 6 3D Engineering Workloads Reference Architecture
Revit Complete Benchmark SuiteAs shown in Figure 41, no matter how many virtual machines are configured, scalability across all virtual machines should be constant.
VM4 4x Concurrent VMs 213.9
0
100
200
400
500
600
700
800
215.4
215.7
213.9
208.8
Model Creationand View Export
332.6
326.3
320.1
320.8
300.0
Drawing RenderBenchmark
193.5
195.4
194.0
191.5
173.9
740.0
737.1
729.8
726.2
682.7
GPUBenchmark
TotalScore
VM2 4x Concurrent VMs
VM1 4x Concurrent VMs
VM3 4x Concurrent VMs
Single Virtual Machine
Tim
e (in
sec
onds
)
Time (in seconds) – Lower Is Better
Revit Benchmark – Single VM Versus 4x Concurrent VMs
Figure 41: Revit Benchmark Results for Four Identical Virtual Machines

T E C H N I C A L W H I T E PA P E R / 5 8
VMware Horizon 6 3D Engineering Workloads Reference Architecture
Elapsed Time to Complete Benchmark SuiteTotal elapsed times are similar across all virtual machines, although the single virtual machine has a much shorter elapsed time.
The difference in total elapsed time between running the benchmark suite on a single virtual machine and on four concurrent virtual machines is less than 1 percent: All users obtain the same user experience, with no drawbacks.
650
660
670
680
690
700
710
720
730
740
750740.0 737.1
729.8 726.2
682.7
Revit Benchmark – Single VM Versus 4x Concurrent VMs Total Score
Total Score
Time (in seconds) – Lower Is Better
Single Virtual Machine
VM3 4x concurrent VMs
VM1 4x concurrent VMs
VM2 4x concurrent VMs
VM4 4x concurrent VMs
Figure 42: Total Elapsed Time for Four Virtual Machines Versus One Virtual Machine
Revit model creation and view export benchmark analysis are based on the number of CPU cores allocated to each virtual machine.
It is crucial to understand whether an application is monothreaded or multithreaded. Typical CAD applications are monothreaded. Monothreading allows a virtual machine to be as efficient as possible while using the fewest CPU cores, freeing extra cores for use by another virtual machine.

T E C H N I C A L W H I T E PA P E R / 5 9
VMware Horizon 6 3D Engineering Workloads Reference Architecture
Figure 43 shows that no matter how many extra CPU cores are assigned to the virtual machine, the end result remains the same. With monothreaded applications, a virtual machine configured with two CPU cores produces the same performance as a virtual machine configured with six CPU cores.
VM1 – 2 cores, 16 GB 5.2
0
10
20
30
40
50
60
70
5.5
4.5
11.4
11.9
11.9
28.6
30.3
30.8
54.3
56.3
57.4
18.6
18.3
18.1
12.2
12.5
12.8
8.2
7.8
7.6
32.8
30.1
29.7
37.7
36.1
35.9
Open and
LoadTemplate
CreateFloors
andGrid
CreateWallsand
Doors
AddCurtain
Wall
CreateExterior
Wall
CreateSections
ChangePanelType
ExportViews(PNG)
ExportViews(DWG)
VM1 – 4 cores, 16 GB
VM1 – 6 cores, 16 GB
Time (in seconds) – Lower Is Better
Tim
e (in
sec
onds
)
Revit – 2 Cores, 16 GB Versus 4 Cores, 16 GB Versus 6 Cores, 16 GB
Figure 43: Impact of Adding CPU Cores to Monothreaded Applications
VM1 – 2 cores, 16 GB
0
50
100
150
200
209.0
209.0
208.8
208.8
208.7
208.7
Total Score
VM1 – 4 cores, 16 GB
Time (in seconds) – Lower Is Better
Tim
e (in
sec
onds
)
Revit Benchmark Total Score – 2 Cores, 16 GB Versus 4 Cores, 16 GB Versus 6 Cores, 16 GB
VM1 – 6 cores, 16 GB
Figure 44: Total Elapsed Time for Two, Four, and Six CPU Cores

T E C H N I C A L W H I T E PA P E R / 6 0
VMware Horizon 6 3D Engineering Workloads Reference Architecture
Render Elapsed TimeFigure 45 shows that rendering times can be affected by the number of CPU cores allocated to a virtual machine, but only slightly. As long as the minimum required amount of memory is met, allocating more memory to a single virtual machine does not increase its performance. However, for CPU-bound and CPU-sensitive rendering applications such as Revit, each virtual machine benefits from the added number of allocated cores.
VM1 – 2 cores, 16 GB
0100200300400500600
542.1
542.1
276.8
276.8
278.7
278.7
212.3
212.3
Render Benchmark
VM1 – 4 cores, 32 GB
VM1 – 4 cores, 64 GB
Time (in seconds) – Lower Is Better
Tim
e (in
sec
onds
) Revit Render Benchmark – Resource Allocation Comparison
VM1 – 6 cores, 16 GB
Figure 45: Resource Allocation Rendering Impact

T E C H N I C A L W H I T E PA P E R / 6 1
VMware Horizon 6 3D Engineering Workloads Reference Architecture
PassMark CPU
The following table and graph show that the CPU performance of each virtual machine is not impacted by the number of virtual machines running in parallel. As long as the number of available CPU cores is not exceeded, each virtual machine can utilize 100 percent of the available CPU resources when the application running on the virtual machine requests it.
REF VM
VM1 VM2 VM3 VM4 VM1 VERSUS REF
VM2 VERSUS REF
VM3 VERSUS REF
VM4 VERSUS REF
VM2 VERSUS VM1
VM3 VERSUS VM1
VM4 VERSUS VM1
CPU Mark 7465 7411 7400 7473 7516 -1% -1% 0% 0% 0% 1% 1%
Integers 9617 9085 9378 9476 9515 -6% -3% -1% 3% 3% 4% 5%
Floating Point 7200 6980 7016 7002 7056 -3% -3% -3% 1% 1% 0% 1%
Prime Numbers
46.2 46 44 45 45 -2% -5% -2% -3% -3% 0% 0%
ExtInstructions (SSE)
25.9 25 26 26 26 -3% -2% -1% 1% 1% 2% 2%
Compression 9089 8983 8950 8935 9012 -1% -2% -2% 0% 0% -1% 0%
Encryption 1328 1300 1223 1297 1305 -2% -9% -2% -6% -6% 0% 0%
Physics 574 560 560 561 568 -3% -3% -2% 0% 0% 0% 1%
Sorting 5435 5465 5451 5445 5507 1% 0% 0% 0% 0% 0% 1%
Monothreaded 1703 1882 1899 1900 1892 10% 10% 10% 1% 1% 1% 1%
Table 28: Effect of Running Concurrent Virtual Sessions
-1%
0%
1%
1%
-1%
-1%
2%
2%
-1%
0%
0%
CPU Mark
-1% -1%
0%
1%
1%
0% 0%
0%
1%
1%
VM1 vs. Ref VM
VM2 vs. Ref VM
VM3 vs. Ref VM
VM4 vs. Ref VM
CPU
Res
ult V
aria
tion
CPU Mark – VM CPU Results – Comparisons
VM2 vs. VM1
VM3 vs. VM1
VM4 vs. VM1
Figure 46: Comparison of Virtual Machines Running in Parallel

T E C H N I C A L W H I T E PA P E R / 6 2
VMware Horizon 6 3D Engineering Workloads Reference Architecture
AIDA CAD Memory Test
For this test, each virtual machine was configured with four dedicated CPU cores and 16 GB of memory.
Theresultsshowthataddingvirtualmachineshashardlyanyimpactonthroughput.Memoryread/writeandlatency are stable and uniform across all virtual machines. There is always a slight variation, as shown in Figure 49, but it is attributed to the nature of memory modules and internal communication between hardware and software.
Latency also increases as the number of virtual machine diminishes, but the slight loss in latency does not necessarily account for a loss of performance. Reducing the number of allocated CPU cores has a more significant impact on a given virtual machine, which is why correct sizing is so important for maximizing efficiency in a virtualized environment.
SINGLE VM2 CORES16 GB
SINGLE VM4 CORES16 GB
VM14 CORES16 GB
VM24 CORES16 GB
VM34 CORES16 GB
VM44 CORES16 GB
Mem
ory
Read (MBps)
18354 32659 36813 40563 42190 40441
Write (MBps)
6177 12063 16423 16364 16410 16529
Latency (ns)
131.9 132.3 113.5 112.8 112 112.1
Table 29: Memory Throughput – One Versus Four Concurrent Virtual Machines
Read (in MBps) 18354
05000
1000015000200002500030000350004000045000
6177
32659
12063
36813
16423
40563
16364
42190
16410
40441
16529
SingleVM – 2 cores,
16 GB
SingleVM – 4 cores,
16 GBVM1 – 4 cores,
16 GBVM2 – 4 cores,
16 GBVM3 – 4 cores,
16 GBVM4 – 4 cores,
16 GB
Write (in MBps)
Throughput – Higher Is Better
Thro
ughp
ut (i
n M
Bps)
Memory Performance Across Concurrent VMs
Figure 47: Memory Performance Across Concurrent Virtual Machines

T E C H N I C A L W H I T E PA P E R / 6 3
VMware Horizon 6 3D Engineering Workloads Reference Architecture
Single VM – 4 cores,16 GB
131.9
100
105
110
115
120
125
130
135
132.3
113.5
112.8
112.0
112.1
VM1 – 4 cores, 16 GB
VM2 – 4 cores, 16 GB
VM3 – 4 cores, 16 GB
VM4 – 4 cores, 16 GB
Latency – Lower Is Better
131.9 132.3
113.5 112.8 112.0 112.1La
tenc
y (in
ns)
Memory Latency Across Concurrent VMs
Single VM – 2 cores,16 GB
Figure 48: Memory Latency Across Concurrent Virtual Machines
Because current CPU architecture and technology conventions include an integrated memory controller, adding dedicated CPU cores to a single virtual machine boosts memory performance.
Configuring a virtual machine with four CPU cores instead of two can increase memory performance from 44 percent to as much as 86 percent. Applications that rely heavily on memory usage see a significant performance improvement.
Because most applications are monothreaded, users are unlikely to notice any significant CPU performance increase from the additional cores, except when using multithreaded applications, such as for rendering or video editing.

T E C H N I C A L W H I T E PA P E R / 6 4
VMware Horizon 6 3D Engineering Workloads Reference Architecture
VM – 2 cores, 16 GBVersusVM – 4 cores, 16 GB
0%
20%
40%
60%
80%
100%
44% 49% 86% 0%
0%
86%
49%44%
Read(in MBps)
Write(in MBps)
Copy(in MBps)
Latency(in ns)
4 Co
res
– %
of I
ncre
ase
Memory Performance Increase from 2 Cores to 4 Cores
Figure 49: Memory Performance Increase from Two to Four Cores
The following figures and table show that adding memory to a virtual machine yields better performance than adding CPU cores. Adding memory always increases memory latency, but even with increased latency, these tests show that memory performance was improved.
VM – 2 cores, 16 GBVersus32 GB
0%
5%
10%
15%
20%
25%
30%
18% 28% 9% 19%
19%
9%
28%
18%
Read(in MBps)
Write(in MBps)
Copy(in MBps)
Latency(in ns)
32 G
B –
% o
f Inc
reas
e
Memory Performance Increase from 16 GB to 32 GB
Performance Increase – Higher Is Better
Figure 50: Memory Performance Increase 16 GB Versus 32 GB

T E C H N I C A L W H I T E PA P E R / 6 5
VMware Horizon 6 3D Engineering Workloads Reference Architecture
PassMark Memory BenchmarkTable 30 summarizes memory throughput across four virtual machines as compared to a single virtual machine.
REF VM
VM1 VM2 VM3 VM4 VM1 VERSUS REF
VM2 VERSUS REF
VM3 VERSUS REF
VM4 VERSUS REF
VM2 VERSUS VM1
VM3 VERSUS VM1
VM4 VERSUS VM1
Memory Mark
1681 1867 1825 1815 1848 10% 8% 7% 9% -2% -3% -1%
Read Cached
27076 24240 25642 25470 25505 -12% -6% -6% -6% 5% 5% 5%
Read Uncached
6634 8427 8088 7682 7396 21% 18% 14% 10% -4% -10% -14%
Write 6693 7392 7586 7293 7201 9% 12% 8% 7% 3% -1% -3%
Available RAM
14672 14697 14569 14474 14719 0% -1% -1% 0% -1% -2% 0%
Threaded 24739 29950 27029 29632 30349 17% 8% 17% 18% -11% -1% 1%
Database Operations
53 57 49 57 58 7% -8% 6% 8% -16% -1% 1%
Latency 52 46 44 48 44 -13% -18% -8% -18% -5% 4% -4%
Table 30: PassMark Memory Throughput Comparison
Ref VM 1681
0
5000
10000
15000
20000
25000
30000
1867
1825
1815
1848
MemoryMark
27076
24240
25642
25470
25505
ReadCached
6634
8427
8088
7682
7396
6693
7392
7586
7293
7201
14672
14697
14569
14474
14719
24739
29950
27029
29632
30349
ReadUncached
Write ThreadedAvailableRAM
VM2
VM1
VM3
VM4
Thro
ughp
ut p
er S
eque
nce
Throughput – Higher Is Better
PassMark Memory Summary
Figure 51: PassMark Memory Summary
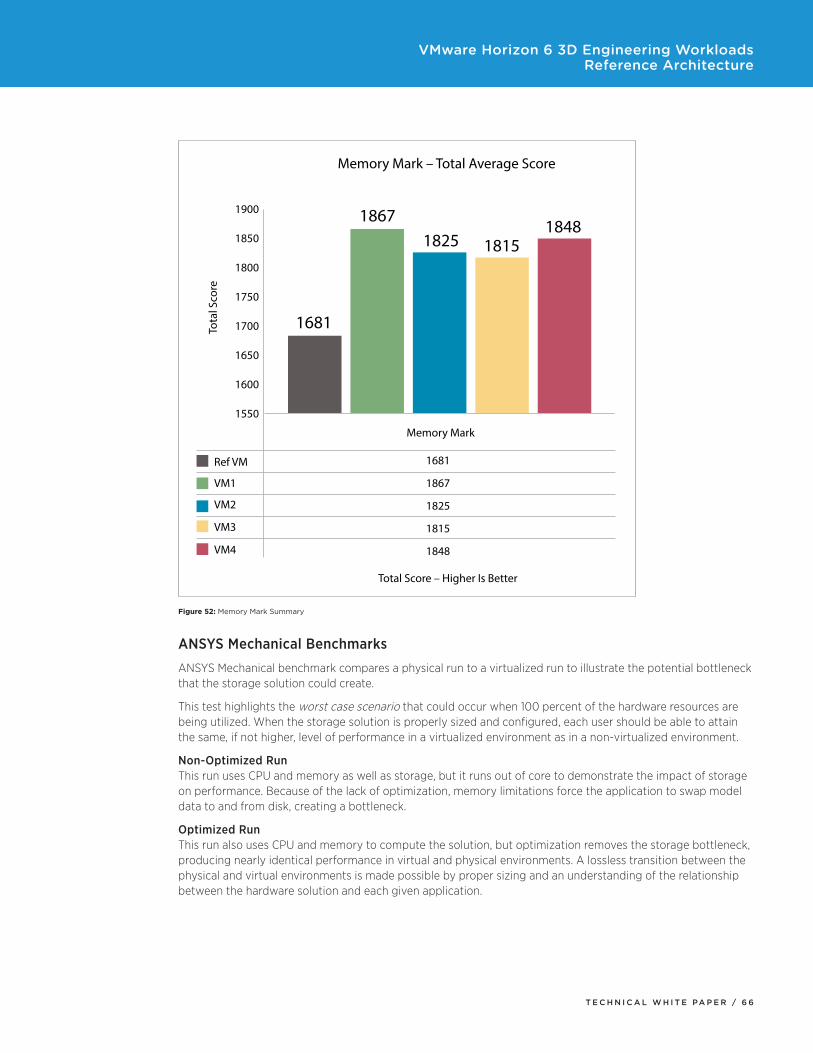
T E C H N I C A L W H I T E PA P E R / 6 6
VMware Horizon 6 3D Engineering Workloads Reference Architecture
Ref VM 1681
1681
18671825 1815
1848
1550
1600
1650
1700
1750
1800
1850
1900
1867
1825
1815
1848
Memory Mark
VM2
VM1
VM3
VM4
Tota
l Sco
re
Total Score – Higher Is Better
Memory Mark – Total Average Score
Figure 52: Memory Mark Summary
ANSYS Mechanical Benchmarks
ANSYSMechanicalbenchmarkcomparesaphysicalruntoavirtualizedruntoillustratethepotentialbottleneckthat the storage solution could create.
This test highlights the worst case scenario that could occur when 100 percent of the hardware resources are being utilized. When the storage solution is properly sized and configured, each user should be able to attain the same, if not higher, level of performance in a virtualized environment as in a non-virtualized environment.
Non-Optimized RunThis run uses CPU and memory as well as storage, but it runs out of core to demonstrate the impact of storage on performance. Because of the lack of optimization, memory limitations force the application to swap model data to and from disk, creating a bottleneck.
Optimized RunThis run also uses CPU and memory to compute the solution, but optimization removes the storage bottleneck, producing nearly identical performance in virtual and physical environments. A lossless transition between the physical and virtual environments is made possible by proper sizing and an understanding of the relationship between the hardware solution and each given application.

T E C H N I C A L W H I T E PA P E R / 6 7
VMware Horizon 6 3D Engineering Workloads Reference Architecture
The same hardware platforms with identical configurations were used to compare optimized and non-optimized runs.
CONFIGURATION ASUS ESC4000 G2 VIRTUAL MACHINE
6 cores allocated to system 6 cores
32 GB memory 32 GB RAM
4 x Intel 730 Series RAID 0 4 x Intel 730 Series RAID 0
Table 31: Hardware Configuration for ANSYS Mechanical Benchmark
Figure 53: Modal Analysis Benchmark Specifications
TEST CONDITIONS DISTRIBUTED
Solver PCG Solver_Modal Analysis
# of Nodes 1340453
#ofContactElements 21763
#ofSolidElements 833530
#ofTotalElements 862707
Table 32: Modal Analysis Test Conditions

T E C H N I C A L W H I T E PA P E R / 6 8
VMware Horizon 6 3D Engineering Workloads Reference Architecture
Optimized (Non-Virtual)
14441483
918110843
0 2000 4000 6000 8000 10000 12000
Elapsed Time (in seconds) – Lower Is Better
0.02% Di�erence
15% Di�erence
Non-Optimized (Physical)
Optimized (Virtual)
Non-Optimized (Virtual)
Modal Benchmark – Physical Versus Virtual Environment
Figure 54: Physical and Virtual Environments Compared

T E C H N I C A L W H I T E PA P E R / 6 9
VMware Horizon 6 3D Engineering Workloads Reference Architecture
Anvil Storage Benchmark 1.1.0
The Anvil Storage Benchmark provides a baseline for the performance of underlying storage, which is critical on 3D engineering workloads. It is important to understand how to size and configure the storage architecture to avoid bottlenecks.
For these tests, the hardware-specific storage consisted of 4x Intel 730 Series (480 GB) RAID 0 and an Intel RS3DC080 SAS controller. The virtual machines were each configured with two dedicated cores and 16 GB of memory.
Test results for a single virtual machine are shown in Figure 55.
Figure 55: Anvil Storage SSD Benchmark for One Virtual Machine (Score: 7143 .52)

T E C H N I C A L W H I T E PA P E R / 7 0
VMware Horizon 6 3D Engineering Workloads Reference Architecture
Equivalenttestsforeachofthefourconcurrentvirtualmachinesareshowninthenextfourfigures.
Figure 56: Anvil Storage SSD Benchmark VM1 (Score: 3836 .58)
Figure 57: Anvil Storage SSD Benchmark VM2 (Score: 3990 .31)

T E C H N I C A L W H I T E PA P E R / 7 1
VMware Horizon 6 3D Engineering Workloads Reference Architecture
Figure 58: Anvil Storage SSD Benchmark VM3 (Score: 4040 .65)
Figure 59: Anvil Storage SSD Benchmark VM4 (Score: 3909 .17)

T E C H N I C A L W H I T E PA P E R / 7 2
VMware Horizon 6 3D Engineering Workloads Reference Architecture
Storage Performance Impact SummaryIncreasing the number of virtual machines directly affects the performance of the storage solution, the total throughput capability of which is shared among all virtual machines. The tests show that when virtual machines share a common storage solution, the maximum throughput that each virtual machine can attain while simultaneously performing IOPS-intensive tasks is equal to the maximum throughput that the given storage can sustain, divided by the number of virtual machines that share the storage.
This is a general rule of thumb. Try to allocate each virtual machine, or small group of virtual machines, to its or their own storage. For example, assign two virtual machines to a RAID 0 array of 2x hard drives to minimize the performance drop of each virtual machine.
-150%
0%
-20%
-40%
-60%
-80%
-100%
-120%
-140%
-160%
-150%
-123%
-153%
-35%
-35%
-43%
-38%
-79%
-79%
-77%
-83%
Read Run Write Run Average
VM2 vs. VM Ref
VM1 vs. VM Ref
VM3 vs. VM Ref
VM4 vs. VM Ref
Perf
orm
ance
Dro
p
Storage Performance Drop – 1x VM Versus Concurrent
Figure 60: Performance Degradation

T E C H N I C A L W H I T E PA P E R / 7 3
VMware Horizon 6 3D Engineering Workloads Reference Architecture
PassMark BenchmarkA virtual machine’s CPU, 2D graphics, 3D graphics, and memory performance do not degrade as the number of virtual machines increases. Assigned resources are not only allocated but dedicated to each virtual machine. Storage is the only resource that faces significant impact as the number of virtual machines per host is increased.
Single VM – 4 cores, 16 GB 4037
0
1000
2000
3000
4000
5000
6000
7000
8000
3817
3798
3786
3925
7465
7411
7400
7473
7516
705
649
648
644
668
4461
4389
4397
4397
4452
1681
1867
1825
1815
1848
PassMarkRating
CPUMark
2DGraphics
3DGraphics
MemoryMark
VM1 – 4 cores, 16 GB
VM2 – 4 cores, 16 GB
VM3 – 4 cores, 16 GB
VM4 – 4 cores, 16 GB
Score – Higher Is Better
Scor
e
PassMark Summary
Figure 61: Dedicated Resources Not Affected by Number of Virtual Machines

T E C H N I C A L W H I T E PA P E R / 74
VMware Horizon 6 3D Engineering Workloads Reference Architecture
Single VM – 4 cores, 16 GB
0
5000
10000
15000
20000
25000
22090
22090
6697 6757 65888520
6697
6757
6588
8520
Disk Mark
VM1 – 4 cores, 16 GB
VM2 – 4 cores, 16 GB
VM3 – 4 cores, 16 GB
VM4 – 4 cores, 16 GB
Score – Higher Is Better
Scor
e
PassMark Summary – Storage
Figure 62: Impact on Storage When the Number of Virtual Machines Increases

T E C H N I C A L W H I T E PA P E R / 7 5
VMware Horizon 6 3D Engineering Workloads Reference Architecture
Appendix B: Hardware and Software RequirementsTable 33 lists the hardware required for compatibility with vDGA and vGPU.
COMPONENT DESCRIPTION
Physical space for graphics cards
Many high-end GPU cards are full height, full length, and double width, most taking up two slots on the motherboard, but using only a single PCIe x16 slot.
Verify that the host has enough room internally to hold the chosen GPU card in the appropriate PCIe slot.
PCIe x16 PCIe x16 is required for all supported highest end GPU cards.
Host Power Supply Unit (PSU)
Check the power requirements of the GPU to make sure that the PSU is powerful enough and contains the proper power cables to power the GPU. For example,asingleNVIDIAQuadro6000GPUcanuseasmuchas204Wofpower and requires either a single 8-pin PCIe power cord or dual 6-pin PCIe power cords.
Virtual Technology for DirectedI/O(VT-d)
To use vDGA, verify that the host supports either Intel VT-d or AMD IOMMU (input/outputmemorymanagementunit).Withoutthis,GPUpass-throughcannot be enabled.
To check if VT-d or AMD IOMMU is enabled on the host, check the server BIOS. To locate this setting in the server BIOS, contact the hardware vendor.
Two-display adapters If the host does not have an onboard graphics adapter, VMware recommends that you install an additional low-end display adapter to act as your primary displayadapter,becausetheESXiconsoledisplayadapterisnotavailabletoXorg.Ifthehigh-endAMDorNVIDIAGPUcardissetastheprimaryadapter,XorgcannotusetheGPUforrendering.
If you have two GPUs installed, the server BIOS might give you the option to select which GPU is primary and which is secondary. If this option is available, make sure that the standard GPU is set as primary, and the high-end GPU is set as secondary.
Table 33: Hardware Requirements for vDGA and vGPU
Note: GPU support is dictated by the graphics card vendor, not by VMware.

VMware, Inc. 3401 Hillview Avenue Palo Alto CA 94304 USA Tel 877-486-9273 Fax 650-427-5001 www.vmware.comCopyright © 2015 VMware, Inc. All rights reserved. This product is protected by U.S. and international copyright and intellectual property laws. VMware products are covered by one or more patents listed athttp://www.vmware.com/go/patents. VMware is a registered trademark or trademark of VMware, Inc. in the United States and/or other jurisdictions. All other marks and names mentioned herein may be trademarks of their respective companies. Item No: VMW-TWP-HORIZ63DENGWKLDRA-USLET-20150824-WEB
VMware Horizon 6 3D Engineering Workloads Reference Architecture
Table 34 lists the software required for compatibility with vSGA, vDGA, and vGPU.
COMPONENT DESCRIPTION
VMware vSphere hypervisor
•vSGAandvDGA–ESXi5.1U1orESXi5.5(ESXi5.5recommended)
•vGPU–ESXi6.0
VMware Horizon with a View implementation
•vSGA–Horizon5.2orlater(Horizon6version6.1recommended)
•vDGA–Horizon5.3(Horizon6version6.1recommended)
•vGPU–Horizon6version6.1
•Linux–Horizon6version6.1.1(withHorizonClient3.4)
Display protocol •vSGA,vGPU,andvDGA–PCoIPwithamaximumoftwodisplaymonitors
•vDGA–SecureWebSocketconnectionfromtheHorizonClient(6.1.1required),up to four display monitors
NVIDIA drivers •vSGA–NVIDIAdriversforvSphereESXi5.5version–LatestVersion
•vDGA–Tesla/GRIDdesktopdriverversion–LatestVersion
•vGPU–NVIDIAvgxVMware–LatestVersion
Note: These drivers are supplied and supported by NVIDIA. Both drivers can be downloaded from the NVIDIA Drivers Download page.
Guest OS •vSGA–Windows732-or64-bit
•vDGA–Windows764-bit
•vGPU–Windows764-bit
Table 34: Software Requirements for vSGA, vDGA, and vGPU