vitrification and product testing of az-101 pretreated law ... · pdf filerpl radiochemical...
TRANSCRIPT

PNWD-3464 WTP-RPT-106 Rev. 0
Vitrification and Product Testing of AZ-101 Pretreated LAW Envelope B Glass H. D. Smith R. J. Bates P. R. Bredt J. V. Crum P. R. Hrma M. J. Schweiger
June 2004 Prepared for Bechtel National Inc. under Contract 24590-101-TSA-W000-00004

LEGAL NOTICE This report was prepared by Battelle Memorial Institute (Battelle) as an account of sponsored research activities. Neither Client nor Battelle nor any person acting on behalf of either: MAKES ANY WARRANTY OR REPRESENTATION, EXPRESS OR IMPLIED, with respect to the accuracy, completeness, or usefulness of the information contained in this report, or that the use of any information, apparatus, process, or composition disclosed in this report may not infringe privately owned rights; or Assumes any liabilities with respect to the use of, or for damages resulting from the use of, any information, apparatus, process, or composition disclosed in this report. References herein to any specific commercial product, process, or service by trade name, trademark, manufacturer, or otherwise, does not necessarily constitute or imply its endorsement, recommendation, or favoring by Battelle. The views and opinions of authors expressed herein do not necessarily state or reflect those of Battelle.


iii
Contents
Abbreviations and Acronyms ...................................................................................................................... ix
References.................................................................................................................................................... xi
Testing Summary .......................................................................................................................................xiii Objectives .........................................................................................................................................xiii Test Exceptions.................................................................................................................................xiii Results and Performance Against Success Criteria .......................................................................... xiv Quality Requirements ........................................................................................................................ xv R&T Test Conditions.......................................................................................................................xvii Discrepancies and Follow-on Tests .................................................................................................. xxi
1.0 Introduction....................................................................................................................................... 1.1
2.0 Quality Assurance Requirements...................................................................................................... 2.1 2.1 Application of RPP-WTP Quality Assurance Requirements................................................... 2.1 2.2 Conduct of Experimental and Analytical Work ...................................................................... 2.1 2.3 Internal Data Verification and Validation ............................................................................... 2.2
3.0 Objectives ......................................................................................................................................... 3.1
4.0 Success Criteria................................................................................................................................. 4.1
5.0 Experimental Method ....................................................................................................................... 5.1 5.1 Glass Fabrication ..................................................................................................................... 5.1
5.1.1 Pretreated AZ-101 Waste ........................................................................................... 5.1 5.1.2 RPP-WTP Mineral Additives ..................................................................................... 5.2 5.1.3 Batch Recipe............................................................................................................... 5.2 5.1.4 Melter Feed Preparation ............................................................................................. 5.6 5.1.5 Glass Melting.............................................................................................................. 5.7 5.1.6 Container-Centerline Cooling..................................................................................... 5.8
5.2 Glass Analyses and Testing ..................................................................................................... 5.9 5.2.1 Chemical Composition ............................................................................................. 5.10 5.2.2 Radiochemical Composition..................................................................................... 5.10 5.2.3 Crystalline and Non-Crystalline Phase Determination............................................. 5.13 5.2.4 TCLP ........................................................................................................................ 5.13 5.2.5 PCT........................................................................................................................... 5.14
6.0 Results............................................................................................................................................... 6.1 6.1 LAW AZ-101 Waste Components Content............................................................................. 6.1 6.2 LAW Glass AZ-101 Chemical Composition........................................................................... 6.1 6.3 LAW Glass AZ-101 Radiochemical Composition .................................................................. 6.9
6.3.1 Data Comparison with Requirements ....................................................................... 6.10
iv
6.3.2 Measured Dose Rates from LAW Glasses ............................................................... 6.12 6.4 Crystalline and Noncrystalline Phases................................................................................... 6.13 6.5 PCT .................................................................................................................................. 6.18 6.6 TCLP .................................................................................................................................. 6.21 6.7 Property Comparison of Actual and Simulated AZ-101 Waste, Melter Feed and Glass....... 6.22
7.0 Conclusions....................................................................................................................................... 7.1
Appendix A: Radiochemistry Summary for AZ-101 Glass ...................................................................... A.1
Appendix B: ICP Mass Spectrometry Summary for AZ-101 Pretreated Waste ........................................B.1
Appendix C: ICP Mass Spectrometry Summary for AZ-101 Glass .........................................................C.1
Appendix D: VSL Batch Sheet for AZ-101(B) Waste Glass LAWB83................................................... D.1
Appendix E: TCLP Results for AZ-101 Envelope B Glass.......................................................................E.1

v
List of Figures
Figure 5.1. Photograph of AZ-101 Molten Glass being Quenched by Pouring the Melt on a Steel Plate .......................................................................................................................................... 5.8
Figure 5.2. Measured CCC Heat Treatment Temperature Profile for AZ-101 Envelope B Glass Plotted Against Target Temperature Control Points ......................................................................... 5.9
Figure 5.3. Desensitized Type 304L Stainless Steel, 22 mL, PCT Vessel and Lid (Teflon gasket, nickel-plated brass compression fittings are also shown) ............................................................... 5.15
Figure 6.1. Analyzed Versus Target Mass Fractions of AZ-101 LAW Glass Components ..................... 6.6
Figure 6.2. Analyzed Versus Target Mass Fractions of AZ-101 LAW Glass Components (except SiO2) with Mass Fractions >0.005........................................................................................ 6.7
Figure 6.3. Individual Versus All-Average Analyzed Mass Fractions of AZ-101 LAW Glass Components....................................................................................................................................... 6.8
Figure 6.4. Optical Images (multicolored in polarized light) of Crystals in AZ-101 LAW Glass Subjected to CCC Heat Treatment .................................................................................................. 6.14
Figure 6.5. SEM Micrographs of AZ-101 LAW Melt Subjected to CCC Heat Treatment .................... 6.15
Figure 6.6. XRD Pattern of AZ-101 LAW Glass Subjected to CCC Heat Treatment............................ 6.16
Figure 6.7. Normalized PCT Releases Versus Crystallinity Fraction in AZ-101 LAW Glass ............... 6.21
List of Tables
Table S.1. Summary of Test Objectives and Results ................................................................................xiii
Table S.2. Test Exceptions........................................................................................................................ xiv
Table S.3. Success Criteria ....................................................................................................................... xiv
Table S.4. R&T Test Conditions..............................................................................................................xvii
Table S.5. Target and Measured (Best Analytical Estimate) AZ-101 LAW Glass Composition............. xix
Table S.6. Analytical Results for TCLP Inorganic Constituents of Potential Concern ............................. xx
Table 5.1. Chemical Composition of AZ-101 LAW Pretreated Waste: Inorganic Analytes in mg/L ...... 5.1
Table 5.2. Chemical Composition of AZ-101 Pretreated Waste (in mg/L): Ion Chromatography and Oxidation Analysis ..................................................................................................................... 5.1
Table 5.3. Radionuclide Activity of AZ-101 Pretreated Waste in µCi/mL .............................................. 5.2
Table 5.4. Solution Properties of AZ-101 Pretreated LAW....................................................................... 5.2

vi
Table 5.5. Glass Forming Minerals and Chemicals .................................................................................. 5.3
Table 5.6. Glass Forming Minerals to Make 425 g of AZ-101 LAW Glass............................................. 5.4
Table 5.7. Composition of Glass Forming Minerals and Pretreated AZ-101 (B) in Mass% .................... 5.5
Table 5.8. Mass Fractions of Glass Components in AZ-101 Pretreated LAW Waste, Glass-Former Mineral Mix, and AZ-101 Glass ....................................................................................................... 5.6
Table 5.9. Quantities of Raw Minerals to Prepare Additive Mix for AZ-101 LAW Glass ...................... 5.7
Table 5.10. CCC Schedule for Crucible Testing....................................................................................... 5.9
Table 5.11. Summary of Analytical Methods ......................................................................................... 5.12
Table 5.12. TCLP Inorganic Constituents of Potential Concern (CoPC) ............................................... 5.14
Table 6.1. Solids and Oxide Content of AZ-101 Pretreated LAW Solution............................................. 6.1
Table 6.2. Best Analytical Estimates for AZ-101 LAW Glass Composition in Mass Fractions .............. 6.5
Table 6.3. Values of 104σA for Best Analytical Estimates for AZ-101 LAW Glass Composition .......... 6.6
Table 6.4. Averaged Best Analytical Estimates for AZ-101 LAW Glass Composition in Mass Fractions Sorted by Target ................................................................................................................ 6.7
Table 6.5. Waste Loading as Dilution Factor for AZ-101 LAW Waste Glass Constituents .................... 6.9
Table 6.6. Radioisotope Activity in AZ-101 Glass in µCi/g (including dates of analysis) .................... 6.10
Table 6.7. Expected and Measured Radionuclide Content in µCi/g of AZ-101 Glass ........................... 6.11
Table 6.8. Measured Dose Rates of ILAW Glasses at Contact .............................................................. 6.12
Table 6.9. EDS Composition (in atomic fractions) of Spinel Crystals in AZ-101 LAW Melt Subjected to CCC Heat Treatment .................................................................................................. 6.16
Table 6.10. EDS Composition (in atomic fractions of spinel-forming cations) of Spinel Crystals in AZ-101 LAW Melt Subjected to CCC Heat Treatment.............................................................. 6.16
Table 6.11. EDS Composition (in atomic fractions of cations) of Augite Crystals in AZ-101 LAW Melt Subjected to CCC Heat Treatment.......................................................................................... 6.17
Table 6.12. EDS Composition (in atomic fractions) of Glass Matrix in AZ-101 LAW Melt Subjected to CCC Heat Treatment .................................................................................................. 6.17
Table 6.13. EDS Composition of Bulk Glass Matrix in AZ-101 LAW Melt Subjected to CCC Heat Treatment ................................................................................................................................ 6.17
Table 6.14. 7-Day PCT Solution Analysis of AZ-101 LAW Glass Subjected to CCC Heat Treatment ........................................................................................................................................ 6.19
Table 6.15. Normalized 7-Day PCT Releases of AZ-101 LAW Glass Subjected to CCC Heat Treatment ........................................................................................................................................ 6.20

vii
Table 6.16. Calculated Compositions of Amorphous Matrices and PCT Releases for AZ-101 LAW Glass as Functions of Mass Fraction of Pyroxene Crystals (Vienna et al. 2002).................. 6.20
Table 6.17. Concentrations of TCLP Inorganic Constituents of Potential Concern (CoPC).................. 6.22
Table 6.18. Properties of Actual and Simulant AZ-101 Waste at 2.75M Na.......................................... 6.23
Table 6.19. Properties of Actual and Simulant AZ-101 Melter Feed at 2.75M Na ................................ 6.24
Table 6.20. Properties of Actual and Simulant AZ-101 LAW Glass...................................................... 6.24
Table 6.21. Comparison of PCT Normalized Releases (in g/m2) Between Actual and Simulant AZ-101 CCC-Treated Glass............................................................................................................ 6.24
Table 6.22. Comparison of Average 7-Day 90°C PCT Normalized Mass Loss Data Between VSL Non-Radioactive Simulant Glasses and Actual Radioactive LAW Glass Counterparts from this Study………............................................................................................................................. 6.25
Table 6.23. Durability of the LRM Glass Shown for the Two Different Studies ................................... 6.25
Table 7.1. Summary of Radiochemical Results Showing Contract Compliance for Waste Glass ........... 7.2


ix
Abbreviations and Acronyms
AEA alpha energy analysis AES atomic emission spectroscopy ALO Analytical Laboratory Operations ARG-1 Analytical Reference Glass-1 ASO Analytical Service Operations ASTM American Society for Testing and Materials BNI Bechtel National Inc. CAS Chemical Abstract Service CCC container centerline cooling CFR U.S. Code of Federal Regulations CMC Chemical Management Center CoPC Constituents of Potential Concern CRM Certified Reference Material CUA Catholic University of America CVAA cold vapor atomic absorption spectroscopy DIW deionized water DOE U.S. Department of Energy EDS energy dispersive spectroscopy EPA U.S. Environmental Protection Agency EQL estimated quantification limit GEA gamma energy analysis HLW high-level waste IC ion chromatography ICP inductively coupled plasma ICP-AES inductively coupled plasma-atomic emission spectroscopy ICP-MS inductively coupled plasma-mass spectroscopy ILAW immobilized low-activity waste ISE ion-specific electrode KPA kinetic phosphorescence analysis LAW low-activity waste LCS laboratory control standard LDR Land Disposal Restrictions LFCM liquid-fed ceramic melter LRM low-activity test reference material mass% mass percent

x
MDL method detection limit MS mass spectrometry M&TE measuring and test equipment ND non detect NSBG near-surface burial ground ORP Office of River Protection PCT Product Consistency Test PNWD Battelle—Pacific Northwest Division QA quality assurance QAPjP quality assurance project plan QC quality control RCRA Resource Conservation Recovery Act RPD relative percent deviation RPL Radiochemical Processing Laboratory RPP-WTP River Protection Project-Waste Treatment Plant RSD relative standard deviation SEM scanning electron microscopy TCLP Toxicity Characteristic Leaching Procedure TDS total dissolved solids TIC total inorganic carbon TOC total organic carbon TRU transuranic UTS Universal Treatment Standards vol% volume percent VSL Vitreous State Laboratory WAC Washington Administrative Code WTP Hanford Waste Treatment and Immobilization Plant WTPSP Waste Treatment Plant Support Project XRD x-ray diffraction

xi
References
40 CFR 268. U.S. Environmental Protection Agency, “Land Disposal Restrictions,” U.S. Code of Federal Regulations. Washington, D. C.
49 CFR 172.101, Table 2. U.S. Department of Transportation, “Radionuclides,” U.S. Code of Federal Regulations. Washington, D. C. American Society for Testing and Materials (ASTM). 1997. ASTM C1285-97, Standard Test Methods for Determining Chemical Durability of Nuclear, Hazardous, and Mixed Waste Glasses: The Product Consistency Test (PCT). West Conshohoken, PA. Brackenbury P. 2001. Interface Control Document for Waste Treatability Samples. Bechtel Document Number ICD-24590-01-00023, Rev 0A, Bechtel National, Inc. Richland, WA. Burgeson IE. 2002. Small Column Testing of SuperLig® 639 for Removing 99Tc from Hanford Tank Waste Envelope A (Tank 241-AZ-101). PNWD-3222, Battelle Pacific Northwest Division., Richland, WA. Ebert WL and SF Wolf. 1999. Round-Robin Testing of a Reference Glass for Low-Activity Waste Forms. ANL-99/22, Argonne National Laboratory, Argonne, IL. Fiskum SK. 2002. Small Column Ion Exchange Testing of SuperLig® 644 for Removal of 137Cs from Hanford Waste Tank 241-AZ-101 Diluted Feed (Envelope A). PNWD-3198, Battelle Pacific Northwest Division, Richland, WA. Goheen SC, PR Bredt, OT Farmer, SK Fiskum, KA Gaither, LR Greenwood, LK Jagoda, AP Poloski, RD Scheele, CZ Soderquist, RG Swoboda, MP Thomas, MW Urie, and JJ Wagner. 2002. Chemical Analyses and Physical Property Testing of Diluted 241-AZ-101 Tank Waste. PNWD-3174, Battelle Pacific Northwest Division, Richland, WA. Hansen EK, and RF Schumacher. 2003. Characterization of HLW and LAW Glass Formers – Final Report. SRT-RPP-2002-00146 Rev. 1, Westinghouse Savannah River Company, Aiken, SC. Hrma P, P Izak, JD Vienna, GM Irwin, and M-L Thomas. 2002. “Partial Molar Liquidus Temperatures of Multivalent Elements in Multicomponent Borosilicate Glass.” Phys. Chem. Glasses 43(2):128-136. Muller, I. S., A. C. Buechelle, and I. L. Pegg. 2001. Glass Formulation and Testing with RPP-WTP LAW Simulants, VSL-01R3560-2, Vitreous State Laboratory, Washington, D. C. Muller, Isabelle S., and Ian L. Pegg. 2003. “LAW Glass Formulation to Support AZ-101 Actual Waste Testing”. VSL-03R3470-3. Vitreous State Laboratory, The Catholic University of America for Duratek, Inc. and Bechtel National, Inc.

xii
Poloski AP, PR Bredt, RG Swoboda, and DE Wallace. 2003. Rheological and Physical Properties of AZ-101 LAW Pretreated Waste and Melter Feed. PNWD-3367, Battelle Pacific Northwest Division, Richland, WA. Russell RL. 2002. AZ-101 Diluted Batch (Envelope B) Simulant Development Report. PNWD-3248, Battelle Pacific Northwest Division, Richland, WA. Sidibe A. 2002. AZ-101 (Envelope B) LAW Vitrification, Product Testing, and Regulatory Analyses. 24590-LAW-TSP-RT-02-004, Rev. 0. Bechtel National, Inc. Richland, WA. Smith GL. 1993. Characterization of Analytical Reference Glass-1 (ARG-1). PNL-8992, Pacific Northwest National Laboratory, Richland, WA. Smith, G. L., Greenwood, L. R., Piepel, G. F., Schweiger, M. J., Smith, H. D., Urie, M.W., and Wagner, J. J. 2000. Vitrification and Product Testing of AW-101 and AN-107 Pretreated Waste. PNNL- 13372, Pacific Northwest National Laboratory, Richland, WA. Smith, H. D., R. J. Bates, P. R. Bredt, L. R. Greenwood, M. J. Schweiger, M. W. Urie, and D. R. Weier. 2004. Vitrification and Initial Product Testing of AP-101 Pretreated LAW Envelope A Glass. WTP-RPT-092. Rev. 0, Pacific Northwest National Laboratory, Richland, WA. U.S. Environmental Protection Agency (EPA). 1992. “Toxicity Characteristic Leaching Procedure (TCLP).” SW-846, Method 1311, Rev. 0. In: Test Methods for Evaluating Solid Waste, Volume 1C: Laboratory Manual Physical/Chemical Methods, Office of Solid Waste and Emergency Response, Washington, D.C. U.S. Department of Energy, Office of River Protection (DOE-ORP). 2000. Contract between DOE Office of River Protection and Bechtel National, Inc. for the Design and Construction of the Hanford Tank Waste Treatment and Immobilization Plant. DE-AC27-01RV14136, Richland, WA U.S. Nuclear Regulatory Commission (NRC). 1998. Instructions for Completing NRC’s Uniform Low-Level Radioactive Waste Manifest. NUREG/BR-0204, Washington, D.C. Vienna JD, D-S Kim, and P Hrma. 2002. Database and Interim Glass Property Models for Hanford HLW and LAW Glasses. PNNL-14060, Pacific Northwest National Laboratory, Richland, WA. Washington Administrative Code (WAC). 2000. “Dangerous Waste Regulations, as amended.” WAC 173-303, Olympia, WA. Weier DR, and GF Piepel. 2002. Methodology for Adjusting and Normalizing Analyzed Glass Compositions. WTP-RPT-049, Battelle Pacific Northwest Division, Richland, WA.

xiii
Testing Summary
This document describes work performed under Battelle—Pacific Northwest Division (PNWD) Test Plan TP-RPP-WTP-177, Rev 0, “AZ-101 (Envelope B) LAW Vitrification, Product Testing, and Regulatory Analyses” by S. K. Fiskum, 2002. The U.S. Department of Energy (DOE) Office of River Protection (ORP) has contracted with Bechtel National Inc. (BNI) to design, construct, and demonstrate a waste treatment plant (WTP) (DOE-ORP 2000). The River Protection Project-Waste Treatment Plant (RPP-WTP) will separate waste into low-activity waste (LAW) and high-level waste (HLW) and will separately vitrify these wastes into borosilicate glasses.
Objectives The primary objective for vitrifying the LAW sample is to generate glass for subsequent product testing. The work presented in this report includes seven work elements: 1) glass fabrication, 2) chemical-composition analyses, 3) radiochemical composition analyses, 4) waste loading, 5) determination of crystalline and noncrystalline phases, 6) waste-form leachability, and 7) demonstrating that the waste form can meet requirements for land disposal under the State of Washington Dangerous Waste Regulations, WAC 173-303 (WAC 2000), and Resource Conservation and Recovery Act (RCRA) Land Disposal Restrictions (LDR) in 40 CFR 268 (The Toxicity Characteristic Leaching Procedure [TCLP] [EPA 1992] for hazardous inorganics was applied to show that the waste form met the UTS limits). Crystalline and noncrystalline phase determination and the Product Consistency Test (PCT) (waste-form leachability) are performed on the centerline-cooled glass. These work elements will help demonstrate the River Protection Project-Waste Treatment Plant (RPP-WTP) project’s ability to satisfy the product requirements concerning chemical and radionuclide reporting, waste loading, identification and quantification of crystalline and noncrystalline phases, and waste-form leachability. Table S.1 gives a summary of the attained objectives.
Table S.1. Summary of Test Objectives and Results
Test Objective Objective
Met Discussion 1. Glass Fabrication yes ~425 grams of glass fabricated 2. Chemical Composition Analyses yes ICP-AES(a) – Statistically Refined 3. Radiochemical Composition Analyses yes A combination of Radiochemistry and ICP-MS(b) 4. Waste loading yes >5 Wt % of glass consists of waste Na2O 5. Determination of Crystalline and
Noncrystalline Phases yes A combination of XRD(c), optical microscopy, and SEM(d) identified a pyroxene devitrification phase.
6. Waste-Form Leachability (PCT) yes Met requirements 7. Dangerous Waste Limitations - the waste
form meets requirements for land disposal. yes Met UTS limits (a) ICP-AES = inductively coupled plasma-atomic emission spectroscopy. (b) ICP-MS = inductively coupled plasma-mass spectrometry. (c) XRD = X-ray diffraction. (d) SEM = scanning electron microscopy.
Test Exceptions One test exception was issued during the course of this work, 24590-WTP-TEF-RT-03-025. This test exception resulted in four changes to the Test Plan as shown in Table S.2:
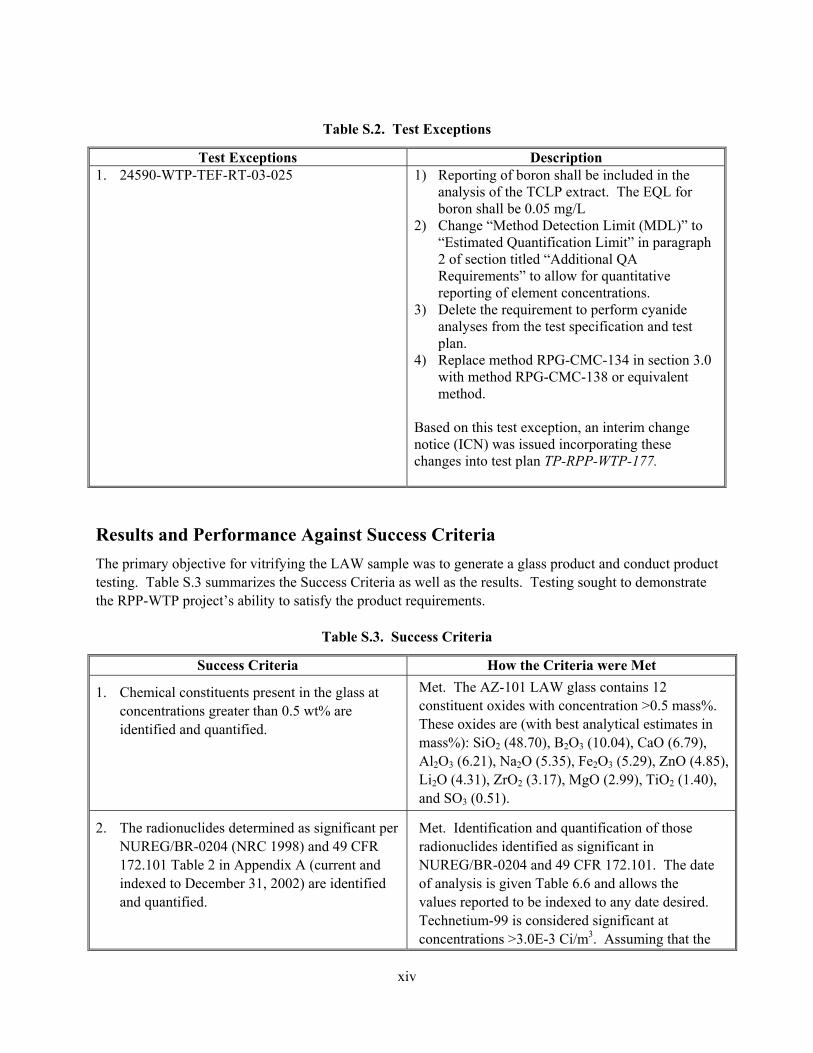
xiv
Table S.2. Test Exceptions
Test Exceptions Description 1. 24590-WTP-TEF-RT-03-025 1) Reporting of boron shall be included in the
analysis of the TCLP extract. The EQL for boron shall be 0.05 mg/L
2) Change “Method Detection Limit (MDL)” to “Estimated Quantification Limit” in paragraph 2 of section titled “Additional QA Requirements” to allow for quantitative reporting of element concentrations.
3) Delete the requirement to perform cyanide analyses from the test specification and test plan.
4) Replace method RPG-CMC-134 in section 3.0 with method RPG-CMC-138 or equivalent method.
Based on this test exception, an interim change notice (ICN) was issued incorporating these changes into test plan TP-RPP-WTP-177.
Results and Performance Against Success Criteria The primary objective for vitrifying the LAW sample was to generate a glass product and conduct product testing. Table S.3 summarizes the Success Criteria as well as the results. Testing sought to demonstrate the RPP-WTP project’s ability to satisfy the product requirements.
Table S.3. Success Criteria
Success Criteria How the Criteria were Met
1. Chemical constituents present in the glass at concentrations greater than 0.5 wt% are identified and quantified.
Met. The AZ-101 LAW glass contains 12 constituent oxides with concentration >0.5 mass%. These oxides are (with best analytical estimates in mass%): SiO2 (48.70), B2O3 (10.04), CaO (6.79), Al2O3 (6.21), Na2O (5.35), Fe2O3 (5.29), ZnO (4.85), Li2O (4.31), ZrO2 (3.17), MgO (2.99), TiO2 (1.40), and SO3 (0.51).
2. The radionuclides determined as significant per NUREG/BR-0204 (NRC 1998) and 49 CFR 172.101 Table 2 in Appendix A (current and indexed to December 31, 2002) are identified and quantified.
Met. Identification and quantification of those radionuclides identified as significant in NUREG/BR-0204 and 49 CFR 172.101. The date of analysis is given Table 6.6 and allows the values reported to be indexed to any date desired. Technetium-99 is considered significant at concentrations >3.0E-3 Ci/m3. Assuming that the

xv
Success Criteria How the Criteria were Met density of the glass is 2.7 g/mL, the AZ-101 glass contains a maximum of 9.29E-4 Ci/m3 of 99Tc. Hence, this glass does not contain a significant quantity of 99Tc.
3. The concentrations of 137Cs, 90Sr, 99Tc and transuranic (TRU) radionuclides in the ILAW product are less than 0.3 Ci/m3, 20 Ci/m3, 0.1 Ci/m3, and 100 nCi/g, respectively. In another section, the contractual requirement indicates that 137Cs will be less than 3 Ci/m3of glass. Note that the glass meets the most stringent limit. See Section 4.0 for contract reference.
Met. The AZ-101 LAW glass contains 90Sr, 99Tc, 137Cs, and TRU at levels considerably below the contract limits as shown in the table.
90Sr (Ci/m3) 0.347 99Tc (Ci/m3) 7.16E-2 137Cs (Ci/m3) 3.43E-2 TRU (nCi/g) 0.046
4. The mass fraction of Na2O from LAW for Envelope B in the LAW glass is >5 wt%.
Met. The measured Na2O mass fraction in the AZ-101 LAW glass is 5.58 mass%. Hence, the AZ-101 LAW glass meets the task specification concentration.
5. Crystalline and non-crystalline phases are identified and quantified.
Met. The AZ-101 LAW glass subjected to CCC contained sporadic crystals of spinel (mainly zincochromite) and augite of a similar composition to the glass. The total amount is less than ~0.8 wt%.
6. The normalized mass loss of sodium, silicon, and boron, is <2.0 g/m2 measured with a 7-day Product Consistency Test (PCT) at 90oC as defined in C1285-97 (ASTM 1997).
Met. The measured normalized PCT releases from the AZ-101 LAW glass are 0.26 g/m2 for B, 0.11 g/m2 for Si, and 0.25 g/m2 for Na. These values are well below the limit of 2.0 g/m2. The precipitation of crystals on cooling apparently does not affect glass leachability.
7. The glass meets the Land Disposal Restrictions (LDR) of Washington Dangerous Waste Regulations, WAC 173-303 (WAC 2000), and Resource Conservation Recovery Act (RCRA) LDR in 40 CFR 268 (TCLP for hazardous inorganics) or the TCLP response of the LDR components meet the UTS limits.
Met. The TCLP leachate from the AZ-101 LAW glass had inorganic hazardous constituent concentrations below the UTS limits of the LDR regulations for Washington state and RCRA.
Quality Requirements Application of RPP-WTP Quality Assurance Requirements PNWD implements the RPP-WTP quality requirements by performing work in accordance with the PNWD Waste Treatment Plant Support Project quality assurance project plan (QAPjP) approved by the

xvi
RPP-WTP Quality Assurance (QA) organization. This work was performed to the quality requirements of NQA-1-1989 Part I, Basic and Supplementary Requirements, and NQA-2a-1990, Part 2.7. These quality requirements are implemented through PNWD's Waste Treatment Plant Support Project (WTPSP) Quality Assurance Requirements and Description Manual. The work reported in Sections 5.1.1, 5.1.4, 5.1.5, and 6.1 and all analytical data collection pertaining to the pretreated AZ-101 LAW were conducted in the summer of 2002 accordance with PNWD’s Conducting Analytical Work in Support of Regulatory Programs. The work pertaining to the vitrification of pretreated AZ-101 LAW and glass testing reported in Sections 5.2.1 - 5.2.5 and 6.2 - 6.7 and all analytical data collections were performed in the fall of 2003 and winter of 2004 and met the analytical requirements as implemented through WTPSP’s Statement of Work (WTPSP-SOW-005) with the Radiochemical Processing Laboratory (RPL) Analytical Service Operations (ASO). A matrix that cross-references the NQA-1 and 2a requirements with the PNWD’s procedures for this work is given in Test Plan TP-RPP-WTP-177, Rev 0, Table 5. It includes justification for those requirements not implemented. Conduct of Experimental and Analytical Work Experiments that were not method-specific were performed in accordance with PNWD’s procedures QA-RPP-WTP-1101 “Scientific Investigations” and QA-RPP-WTP-1201 “Calibration Control System” assuring that sufficient data were taken with properly calibrated measuring and test equipment (M&TE) to obtain quality results. As specified in Test Specification, 24590-LAW-TSP-RT-02-004, Rev 0., BNI’s QAPjP, PL-24590-QA00001, Rev 0, is applicable to the TCLP activities since the work might be used in support of environmental/regulatory compliance. The applicable quality control (QC) parameters for chemical analysis are delineated in Test Plan TP-RPP-WTP-177, Rev 0, Table 3. The ICP-AES analysis of the AZ-101 ILAW (glass) was carried out by dissolving the powdered glass in a molten salt using both KOH, KNO3 in a Ni crucible and Na2O2-NaOH in a Zr crucible. Then the fusion buttons are dissolved in nitric acid and aliquots of these solutions are analyzed. The only QC issue with the analysis using the KOH, KNO3 – Ni crucible fusion was a low recovery for manganese with one of the laboratory control standards. For the Na2O2-NaOH - Zr crucible fusion the only QC issues arose for Ni and P, which consisted of high and low recoveries respectively and for Ni a RPD of over 15%. The levels of Mn, Ni, and P oxides in the glass are about 0.04%, 0.04%, and 0.1% respectively and well below the 0.5% contract criteria for quantification. So these results should be considered acceptable. TCLP Results for AZ-101 Envelope B Glass are summarized in Appendix E. Internal Data Verification and Validation PNWD addresses internal verification and validation activities by conducting an Independent Technical Review of the final data report in accordance with PNWD’s procedure QA-RPP-WTP-604. This review verifies that the reported results are traceable, that inferences and conclusions are soundly based, and the
xvii
reported work satisfies the Test Plan objectives. This review procedure is part of PNWD’s WTPSP Quality Assurance Requirements and Description Manual.
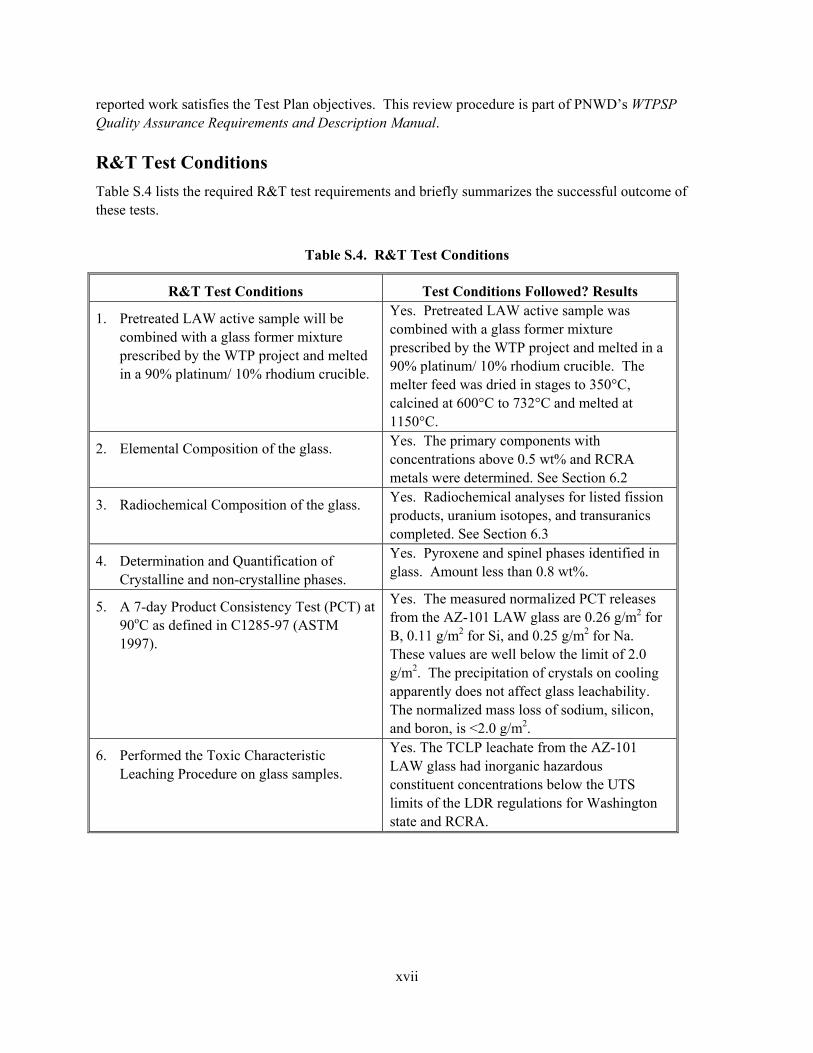
R&T Test Conditions Table S.4 lists the required R&T test requirements and briefly summarizes the successful outcome of these tests.
Table S.4. R&T Test Conditions
R&T Test Conditions Test Conditions Followed? Results
1. Pretreated LAW active sample will be combined with a glass former mixture prescribed by the WTP project and melted in a 90% platinum/ 10% rhodium crucible.
Yes. Pretreated LAW active sample was combined with a glass former mixture prescribed by the WTP project and melted in a 90% platinum/ 10% rhodium crucible. The melter feed was dried in stages to 350°C, calcined at 600°C to 732°C and melted at 1150°C.
2. Elemental Composition of the glass. Yes. The primary components with concentrations above 0.5 wt% and RCRA metals were determined. See Section 6.2
3. Radiochemical Composition of the glass. Yes. Radiochemical analyses for listed fission products, uranium isotopes, and transuranics completed. See Section 6.3
4. Determination and Quantification of Crystalline and non-crystalline phases.
Yes. Pyroxene and spinel phases identified in glass. Amount less than 0.8 wt%.
5. A 7-day Product Consistency Test (PCT) at 90oC as defined in C1285-97 (ASTM 1997).
Yes. The measured normalized PCT releases from the AZ-101 LAW glass are 0.26 g/m2 for B, 0.11 g/m2 for Si, and 0.25 g/m2 for Na. These values are well below the limit of 2.0 g/m2. The precipitation of crystals on cooling apparently does not affect glass leachability. The normalized mass loss of sodium, silicon, and boron, is <2.0 g/m2.
6. Performed the Toxic Characteristic Leaching Procedure on glass samples.
Yes. The TCLP leachate from the AZ-101 LAW glass had inorganic hazardous constituent concentrations below the UTS limits of the LDR regulations for Washington state and RCRA.

xviii
Glass Fabrication
A pretreated tank supernatant, LAW originating from Hanford Tank 241-AZ-101 (AZ-101) was prepared as melter feed for vitrification. The analyzed composition of the pretreated AZ-101 LAW was used by Catholic University of America’s (CUA’s) Vitreous State Laboratory (VSL) to formulate the target glass composition (LAWB83). The supernatant tank samples from AZ-101 were received by PNWD in glass jars transferred from Hanford’s 222-S facility. These jars contained only tank supernatant liquid with no visible solids. The materials in the jars were composited, homogenized, and characterized (Goheen et al. 2002). The composite was then processed through pretreatment chemical separation processes, including the following unit operations to simulate the RPP-WTP project flowsheet: 1) dilution of the batch, 2) removal of 137Cs by ion exchange, and 3) removal of 99Tc by ion exchange. Project-approved glass-former additives were added to the pretreated LAW to produce a melter feed. These additives are kyanite (Al2SiO5), boric acid (H3BO3), wollastonite (CaSiO3), iron III oxide (Fe2O3), lithium carbonate (Li2CO3), olivine (Mg2SiO4), silica (SiO2), rutile (TiO2), zinc oxide (ZnO), and zircon (ZrSiO4). The AZ-101 melter feed was dried at 200°C, calcined to 732°C, and melted at 1150°C for 1 hour. The melt was then poured onto a stainless steel plate, cooled, crushed to a fine powder in a tungsten carbide mill, mixed, added back into the crucible, and melted for an additional hour at 1150°C to assure the homogenization of the glass melt. The product-quality-related properties of the glass, which are the focus of this study, are determined by the composition and temperature history of the glass. The preparation of glass in this project roughly reproduced the three phases of feed-to-glass conversion in the large-scale melter (drying, calcining, and melting). Except the impact of gas atmosphere on the redox states of multivalent oxides, any other differences between crucible and melter vitrification conditions are virtually inconsequential for the properties of the final product. To bracket the effects of temperature histories on product quality, both steel quenching and simulated container centerline cooling were performed on glass samples used for testing. Analytical Results The measured chemical composition of AZ-101 LAW glass is close to its target composition (VSL glass composition designated “LAWB83,” see table in Appendix D). Per the RPP-WTP project LAW glass Task Specification 24590-LAW-TSP-RT-02-004, Rev 0, “AZ-101 (Envelope B) LAW Vitrification, Product Testing, and Regulatory Analyses,” the concentration of the waste sodium oxide shall be greater than 3 mass%. The target mass fraction of Na2O for AZ-101 LAW was 5.35, and the measured mass fraction of Na2O was 5.58 mass%. These low values are necessitated by the following constraint: the product of Na2O and SO3 mass fractions in glass must be no greater than 5×10⁻⁴ for the melt to be processable in WTP melters. The actual value of this product, based on the best analytical estimates for Na2O and SO3 fractions, is 3.1×10⁻⁴. As all of the Na2O content for the AZ-101 glass originated from the initial tank waste, the AZ-101 LAW glass has a waste Na2O content compatible with the contract limits. The target and measured total content of LAW components in glass (the waste loading) was 6.67 mass% and 6.68 mass%, respectively. The difference between the actual and target composition of
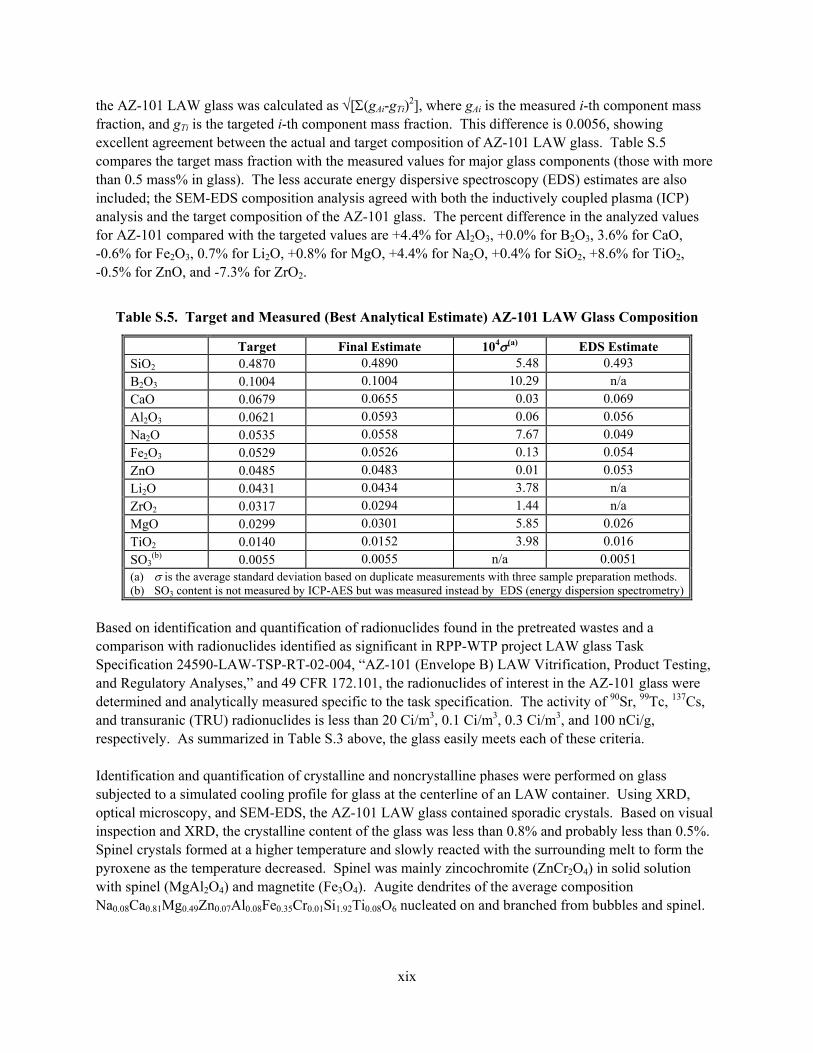
xix
the AZ-101 LAW glass was calculated as √[Σ(gAi-gTi)2], where gAi is the measured i-th component mass fraction, and gTi is the targeted i-th component mass fraction. This difference is 0.0056, showing excellent agreement between the actual and target composition of AZ-101 LAW glass. Table S.5 compares the target mass fraction with the measured values for major glass components (those with more than 0.5 mass% in glass). The less accurate energy dispersive spectroscopy (EDS) estimates are also included; the SEM-EDS composition analysis agreed with both the inductively coupled plasma (ICP) analysis and the target composition of the AZ-101 glass. The percent difference in the analyzed values for AZ-101 compared with the targeted values are +4.4% for Al2O3, +0.0% for B2O3, 3.6% for CaO, -0.6% for Fe2O3, 0.7% for Li2O, +0.8% for MgO, +4.4% for Na2O, +0.4% for SiO2, +8.6% for TiO2, -0.5% for ZnO, and -7.3% for ZrO2.
Table S.5. Target and Measured (Best Analytical Estimate) AZ-101 LAW Glass Composition
Target Final Estimate 104σ(a) EDS Estimate SiO2 0.4870 0.4890 5.48 0.493 B2O3 0.1004 0.1004 10.29 n/a CaO 0.0679 0.0655 0.03 0.069 Al2O3 0.0621 0.0593 0.06 0.056 Na2O 0.0535 0.0558 7.67 0.049 Fe2O3 0.0529 0.0526 0.13 0.054 ZnO 0.0485 0.0483 0.01 0.053 Li2O 0.0431 0.0434 3.78 n/a ZrO2 0.0317 0.0294 1.44 n/a MgO 0.0299 0.0301 5.85 0.026 TiO2 0.0140 0.0152 3.98 0.016 SO3
(b) 0.0055 0.0055 n/a 0.0051 (a) σ is the average standard deviation based on duplicate measurements with three sample preparation methods. (b) SO3 content is not measured by ICP-AES but was measured instead by EDS (energy dispersion spectrometry)
Based on identification and quantification of radionuclides found in the pretreated wastes and a comparison with radionuclides identified as significant in RPP-WTP project LAW glass Task Specification 24590-LAW-TSP-RT-02-004, “AZ-101 (Envelope B) LAW Vitrification, Product Testing, and Regulatory Analyses,” and 49 CFR 172.101, the radionuclides of interest in the AZ-101 glass were determined and analytically measured specific to the task specification. The activity of 90Sr, 99Tc, 137Cs, and transuranic (TRU) radionuclides is less than 20 Ci/m3, 0.1 Ci/m3, 0.3 Ci/m3, and 100 nCi/g, respectively. As summarized in Table S.3 above, the glass easily meets each of these criteria. Identification and quantification of crystalline and noncrystalline phases were performed on glass subjected to a simulated cooling profile for glass at the centerline of an LAW container. Using XRD, optical microscopy, and SEM-EDS, the AZ-101 LAW glass contained sporadic crystals. Based on visual inspection and XRD, the crystalline content of the glass was less than 0.8% and probably less than 0.5%. Spinel crystals formed at a higher temperature and slowly reacted with the surrounding melt to form the pyroxene as the temperature decreased. Spinel was mainly zincochromite (ZnCr2O4) in solid solution with spinel (MgAl2O4) and magnetite (Fe3O4). Augite dendrites of the average composition Na0.08Ca0.81Mg0.49Zn0.07Al0.08Fe0.35Cr0.01Si1.92Ti0.08O6 nucleated on and branched from bubbles and spinel.

xx
The release of sodium, silicon, and boron from crushed AZ-101 glass into water was measured with a 7-day PCT at 90°C as defined in ASTM C1285-97. The normalized mass loss is required to be less than 2.0 g/m2. The measured normalized PCT releases of the AZ-101 LAW glass (measured in triplicate) were 0.26 g/m2 for B, 0.25 g/m2 for Na, and 0.11 g/m2 for Si. These values are well below the limit of 2.0 g/m2. Because the composition of the crystalline phase (augite) that precipitates from the glass on cooling is close to that of the glass, the impact of crystallization on PCT is virtually zero. Dangerous-waste limitations testing (the TCLP test [EPA 1992]) was completed on 10 g of quenched AZ-101 LAW glass. As shown in Table S.6., AZ-101 LAW glass passes this test and qualifies for land disposal.
Table S.6. Analytical Results for TCLP Inorganic Constituents of Potential Concern
Element UTS(a)
(mg/L-TCLP) Required for LDR
Measured (mg/L-TCLP)
Antimony Sb 1.15 X 0.028 U Arsenic As 5.0 VIT 0.045 U Barium Ba 21 VIT 0.24 J Beryllium Be 1.22 X 0.0002 U Boron(b) B n/a n/a 0.428 Cadmium Cd 0.11 VIT 0.006 U Chromium Cr 0.6 VIT 0.008 J Lead Pb 0.75 VIT 0.035 U Mercury Hg 0.025 VIT 0.000049 J Nickel Ni 11 X 0.014 U Selenium Se 5.7 VIT 0.042 U Silver Ag 0.14 VIT 0.005 U Thallium Tl 0.20 X 0.00011J Vanadium V 1.6 n/a 0.003 U Zinc Zn 4.3 n/a 0.79 J (a) UTS = Universal treatment standard, 40 CFR 268 (b) Boron is included for information only and is not a Constituent of
Potential Concern. X = Required for LDR VIT = vitrification has been recognized as the best available technology
for immobilizing these elements per 40 CFR 268.40. n/a = not applicable U = Undetected. Analyte was analyzed but not detected (e.g., no measurable
instrument response), or response was less than the MDL. J = Estimated value. Value is below EQL and above MDL.
Simulant Use Simulant produced by VSL and characterized by them was shown to produce a melter feed with physical properties like those of the AZ-101 (B) actual melter feed and produced a glass with similar properties too. See Section 6.7.

xxi
Discrepancies and Follow-on Tests None

1.1
1.0 Introduction
The U.S. Department of Energy (DOE) Office of River Protection (ORP) has contracted with Bechtel National Inc. (BNI) to design, construct, and demonstrate a waste treatment plant (WTP) (DOE-ORP 2000). The River Protection Project-Waste Treatment Plant (RPP-WTP) will separate Hanford tank waste into low-activity waste (LAW) and high-level waste (HLW) and will separately vitrify them into borosilicate glasses. Battelle—Pacific Northwest Division, hereafter referred to as PNWD, has been contracted to produce and test a vitrified immobilized low-activity waste (ILAW) form from the AZ-101 Envelope B LAW samples previously supplied to the RPP-WTP project by DOE. DOE currently has radioactive waste stored in underground storage tanks at the Hanford site in southeastern Washington State. A supernatant sample was taken from Tank AZ-101. Before the vitrification testing reported here, most of the radioactivity was removed from the supernatant sample through pretreatment chemical-separation processes (Burgeson 2002). The decontaminated supernatant was then processed into LAW glass. The AZ-101 supernatant sample was processed through the following unit operations to simulate the RPP-WTP project flowsheet: 1) dilute the batch, 2) remove 137Cs by ion exchange (Fiskum 2002), and 3) remove 99Tc by ion exchange. The primary objective for vitrifying the Tank AZ-101 (Envelope B) pretreated waste sample was to characterize the glass produced from the crucible melt. [24590-LAW-TSP-RT-02-004, Rev. 0, AZ-101 (Envelope B) LAW Vitrification, Product Testing, and Regulatory Analyses, by A. Sidibe]. The objective of this testing is to demonstrate compliance with the RPP-WTP contractual requirements, such as chemical and radionuclide reporting, product loading, and dangerous-waste limitations and to validate the use of simulants for estimation of glass properties. The work scope reported here is divided into 7 work elements: 1) glass fabrication, 2) chemical composition analyses, 3) radiochemical composition analyses, 4) waste loading, 5) identification of crystalline and noncrystalline phases, 6) waste-form leachability, and 7) Toxicity Characteristic Leaching Procedure (U.S. Environmental Protection Agency (EPA). 1992). The various properties of the glass are then compared to those of a simulant glass fabricated to the same target composition and characterized by VSL (Muller and Pegg 2003). These work elements will help demonstrate the River Protection Project-Waste Treatment Plant (RPP-WTP) project’s ability to satisfy the product requirements concerning chemical and radionuclide reporting, waste loading, identification and quantification of crystalline and noncrystalline phases, and waste-form leachability.

2.1
2.0 Quality Assurance Requirements
2.1 Application of RPP-WTP Quality Assurance Requirements
PNWD implements the RPP-WTP quality requirements by performing work in accordance with the PNWD Waste Treatment Plant Support Project quality assurance project plan (QAPjP) approved by the RPP-WTP Quality Assurance (QA) organization. This work was performed to the quality requirements of NQA-1-1989 Part I, Basic and Supplementary Requirements, and NQA-2a-1990, Part 2.7. These quality requirements are implemented through PNWD’s Waste Treatment Plant Support Project (WTPSP) Quality Assurance Requirements and Description Manual. The analytical requirements are implemented through WTPSP’s Statement of Work (WTPSP-SOW-005) with the Radiochemical Processing Laboratory (RPL) Analytical Service Operations (ASO). A matrix that cross-references the NQA-1 and 2a requirements with the PNWD’s procedures for this work is given in test plan TP-RPP-WTP-177, Rev 0, Table 5. (Applicable Quality Assurance Procedures) It includes justification for those requirements not implemented.
2.2 Conduct of Experimental and Analytical Work
Experiments that were not method-specific were performed in accordance with PNWD’s procedures QA-RPP-WTP-1101 “Scientific Investigations” and QA-RPP-WTP-1201 “Calibration Control System,” verifying that sufficient data were taken with properly calibrated measuring and test equipment (M&TE) to obtain quality results. As specified in Test Specification, 24590-LAW-TSP-RT-02-004, Rev 0, AZ-101 (Envelope B) LAW Vitrification, Product Testing, and Regulatory Analyses, BNI’s QAPjP, PL-24590-QA00001, Rev 0 is applicable to the TCLP activities since the work might be used in support of environmental/regulatory compliance. The applicable quality control (QC) parameters for chemical analysis are delineated in Table 5 in Test Plan TP-RPP-WTP-177, Rev 0 (Quality Control Parameters for ILAW Analysis). The ICP-AES analysis of the AZ-101 ILAW (glass) was carried out using both a KOH, KNO3 - Ni crucible fusion and a Na2O2 - NaOH - Zr crucible fusion. The only QC issue with the analysis using the KOH, KNO3 - Ni crucible fusion was a low recovery for manganese with one of the laboratory control standards. For the Na2O2 - NaOH - Zr crucible fusion the only QC issues arose for Ni and P, which consisted of high and low recoveries respectively and for Ni a RPD of over 15%. The levels of Mn, Ni, and P oxides in the glass are about 0.04%, 0.04%, and 0.1% respectively and well below the 0.5% contract criteria for quantification. So these results should be considered acceptable. TCLP Results and QA data for AZ-101 Envelope B Glass are completely summarized in Appendix E.

2.2
2.3 Internal Data Verification and Validation
PNWD addresses internal verification and validation activities by conducting an Independent Technical Review of the final data report in accordance with PNWD’s procedure QA-RPP-WTP-604. This review verifies that 1) the reported results are traceable, 2) inferences and conclusions are soundly based, and 3) the reported work satisfies the Test Plan objectives. This review procedure is part of PNWD’s WTPSP Quality Assurance Requirements and Description Manual. Third-party independent validation is beyond the scope of this report.

3.1
3.0 Objectives
This work addresses RPP-WTP contract requirements to demonstrate the contractor’s ability to satisfy the ILAW product requirements (Specification 2 of the Contract between DOE Office of River Protection and Bechtel National, Inc. for the Design and Construction of the Hanford Tank Waste Treatment and Immobilization Plant. (DOE-ORP 2000)) with samples of LAW. See 24590-LAW-TSP-RT-02-004, Rev. 0, AZ-101 (Envelope B) LAW Vitrification, Product Testing, and Regulatory Analyses and TP-RPP-WTP-177, Rev 0, AZ-101 (Envelope B) LAW Vitrification, Product Testing, and Regulatory Analyses. All work was performed to the test plan which was approved by BNI. The primary objective for vitrifying the AZ-101 (Envelope B) LAW sample (see Brackenbury 2001) was to generate a glass product for subsequent testing to demonstrate the Waste Treatment Plant (WTP) project’s ability to satisfy the product requirements concerning:
• chemical and radionuclide reporting
• waste loading
• identification and quantification of crystalline and non-crystalline phases
• waste-form leachability
• land-disposal requirements .
4.1
4.0 Success Criteria
The primary success criteria are associated with the product requirements as delineated in Specification 2 of the RPP-WTP project contract (24590-LAW-TSP-RT-02-004, Rev. 0, AZ-101 (Envelope B) LAW Vitrification, Product Testing, and Regulatory Analyses). All work was performed to the test plan which was approved by BNI. (TP-RPP-WTP-177, Rev 0, AZ-101 (Envelope B) LAW Vitrification, Product Testing, and Regulatory Analyses). These criteria are:
• Chemical constituents present in the glass at concentrations greater than 0.5 wt% are identified and quantified.
• The radionuclides determined as significant per NUREG/BR-0204 (NRC 1998) and 49 CFR 172.101 Table 2 in Appendix A (current and indexed to December 31, 2002) are identified and quantified.
• The concentrations of 137Cs, 90Sr, 99Tc and transuranic (TRU) radionuclides in the ILAW product are less than 3 Ci/m3, 20 Ci/m3, 0.1 Ci/m3, and 100 nCi/g, respectively. [2.2.2.8 Radionuclide Concentration Limitations clause Section C from WTP Contract- DE-AC27-01RV1413 Modification No. M033] Note Waste Treatment and Immobilization Plant Unit Operation – iii - Cs Removal: This operation removes 137Cs from the filtered supernatant to allow for production of an ILAW waste product that meets the Specification 2.2.2.8, Radionuclide Concentration Limitations. In addition, 137Cs will be further removed, to achieve a 0.3 Ci/m3 in the ILAW product, to facilitate the maintenance concept established for the ILAW melter system. Hence our target is actually 0.3 Ci/m3 in the ILAW product.
• The mass fraction of Na2O from LAW for Envelope B in the LAW glass is >5 wt%. Note that at the time the Test Specification and BNI approved Test Plan were written the contract limit was >5 wt%.
• Crystalline and non-crystalline phases are identified and quantified.
• The normalized mass loss of sodium, silicon, and boron, is <2.0 g/m2 measured with a 7-day Product Consistency Test (PCT) at 90oC as defined in C1285-97 (ASTM 1997).
• The glass meets the Land Disposal Restrictions (LDR) of Washington Dangerous Waste Regulations, WAC 173-303 (WAC 2000), and Resource Conservation Recovery Act (RCRA) LDR in 40 CFR 268 (TCLP for hazardous inorganics) or the TCLP response of the LDR components meet the UTS limits.

5.1
5.0 Experimental Method
5.1 Glass Fabrication
A pretreated tank supernatant LAW (AZ-101) was prepared as a melter feed for vitrification. The analyzed composition of the pretreated AZ-101 wastes was used by Catholic University of America (CUA) Vitreous State Laboratory (VSL) to formulate the target glass composition (LAWB83)( Muller and Pegg. 2003). The recipe was forwarded to PNWD to prepare the waste glass.
5.1.1 Pretreated AZ-101 Waste
The pretreated AZ-101 waste was blended with glass-forming chemicals. Before preparing the melter feed, the mass of the pretreated LAW solutions was checked to determine any weight change between the pretreatment process and the initiation of vitrification processing. The composition and properties of the pretreated AZ-101 waste are given in Table 5.1 through Table 5.4(Burgeson 2002, Goheen et al. 2002, Fiskum 2002).
Table 5.1. Chemical Composition of AZ-101 LAW Pretreated Waste: Inorganic Analytes in mg/L
Analyte mg/L Al 5280 As 13.5 B 7.75 Cr 569.5 Hg 0.0116 K 3800 Mo 85.3 Na 99000 P 482 Pb 6.65 Si 52.5 Sn 44 Ti 2.55 V 1.35 W 51 Zn 1.65 Zr 1.95
Table 5.2. Chemical Composition of AZ-101 Pretreated Waste (in mg/L): Ion Chromatography and Oxidation Analysis
Analyte mg/L Br- 685 F- 1900 NO2
- 61900 NO3
- 52950 C2O4
-2 1000 PO4
-3 1600 SO4
-2 16500 TIC(a) 6380 TOC(b) 345 NH3 4.11 (a) TIC = total inorganic carbon (b) TOC = total organic carbon

5.2
Table 5.3. Radionuclide Activity of AZ-101 Pretreated Waste in µCi/mL
Isotope µCi/mL Reference Date
Isotope µCi/mL Reference Date
Isotope µCi/mL Reference Date
3H 3.24×10⁻² 9/12/02 113Sn <7×10⁻⁵ 10/30/02 232Th <8×10⁻⁵ 10/30/02 14C 1.92×10⁻³ n/a 106RuRh <3×10⁻⁴ 10/30/02 236Pu <6×10⁻⁸ 9/12/02
51Cr <4×10⁻⁴ 10/30/02 125Sb 9.98×10⁻³ 10/30/02 238Pu 1.07×10⁻⁶ 9/12/02 54Mn(a) nr n/a 126SnSb 2.23×10⁻³ 10/30/02 239Pu 9.25×10⁻⁶ 9/12/02
59Fe <2×10⁻⁵ 10/30/02 134Cs <2×10⁻⁵ 10/30/02 242Pu <2×10⁻⁷ 9/18/02 60Co 1.68×10⁻⁵ 10/30/02 137Cs 3.56×10⁻² 10/30/02 241Pu 5.24×10⁻⁵ n/a 79Se 1.40×10⁻⁴ 8/8/02 144Ce <3×10⁻⁴ 10/30/02 241Am 6.75×10⁻⁷ 9/12/02 88Y <1×10⁻⁵ 10/30/02 151Sm 6.04×10⁻⁵ n/a 243Am <2×10⁻⁷ 9/18/02 90Sr 1.60×10⁻¹ 9/12/02 152Eu <2×10⁻⁵ 10/30/02 242Cm <5×10⁻⁸ 9/12/02
99Tc(b) 9.33×10⁻⁴ 9/12/02 154Eu <2×10⁻⁵ 10/30/02 243Cm + 244Cm <1×10⁻⁷ 9/12/02 103Ru <5×10⁻⁵ 10/30/02 155Eu <2×10⁻⁴ 10/30/02 not used
(a) Nondetect – interference (b) Pertechnetate is reported since the sample was analyzed under oxidizing conditions. nr = not reported n/a = not available
Table 5.4. Solution Properties of AZ-101 Pretreated LAW
Property Units Value Solution Density, g/mL 1.224 Fraction of Solids(a) Mass % 26.68Fraction of Oxides(b) Mass % 14.79(a) Dried to constant weight at 105°C. (b) Fired to constant weight at 1050°C.
5.1.2 RPP-WTP Mineral Additives
Table 5.5 lists the project-approved glass-former minerals (Hansen and Schumacher 2003) for the target glass composition. The chemicals were received from each vendor in the condition that would be used by the vitrification plant at Hanford.
5.1.3 Batch Recipe
The batch composition used to batch the AZ-101 glass was designed by VSL (See the table in Appendix D) (Muller and Pegg, 2003). The VSL batch is made up on the basis of incorporating 2.75 moles of waste sodium and is projected to make 1586 g of glass. For the product testing carried out for this report, it was determined that 425 g of glass would be sufficient. The batch amounts given in Table 5.6 were calculated by multiplying the VSL numbers by 425/1586 = 0.268, so for kyanite, we find 156.19 × 0.268 = 41.85. Notice that the weight of the raw minerals used in the batch were greater than 425 g because they contained some H2O and CO2. Also from the VSL formulation, it is indicated that the glass contained 6.68 wt% waste oxides, so the total waste oxides in the 425 g of glass will be 425 × 0.0668 = 28.39 g. Since the waste solution is 14.79 wt% waste oxides, the weight of the waste solution needed will be 28.39/0.1479 = 191.95 g.

5.3
Table 5.5. Glass Forming Minerals and Chemicals
Oxide Mineral Grade Company Telephone No.
Al2O3 Kyanite
Al2O3-SiO2 Raw -325
Kyanite Mining Corp Dillwyn, VA, 23936 www.kyanite.com
804-983-2043 Carrol Kay VP
B2O3 Boric Acid
H3BO3 Technical
Grade-Granular
U.S. Borax Valencia, CA, 91355-1847
www.borax.com 805-287-5400
CaO Wollastonite CaSiO3
NYADM325 NWest Mexico
NYCO Wilsboro, NY
www.nycominerals.com 518-963-4262
Fe2O3 Hematite
Fe2O3 Fe2O3 5001
Prince Mfg. Co. Quincey, IL 62306
www.princemfg.com 217-222-8854
Li2O Li2CO3 Technical
Grade
Chemettal-Foote Kings Mt, NC
www.chemetalllithium.com
704-734-2501 704-734-2670
MgO Olivine #180 Hamilton, WA
Unimin Corp [email protected] 800-243-9004
SiO2 SiO2 SCS-75
Mill Creek OK
U.S. Silica Berkeley Springs WV www.u-s-silica.com
800-243-7500 304-258-2500
FAX304-258-8295
TiO2 Rutile (Air
floated) TiO2/Fe2O3
Air Float Rutile 94 Phil. PA
Chemalloy Co. Bryn Mawr, PA
www.chemalloy.com 610-527-3700
ZnO ZnO Kadox
920 Camden, NJ
Zinc Corp Amer. Monaca, PA
horseheadinc.com
800-962-7500 724-774-1020
ZrO2 ZrSiO4 Zircon Flour
Amer. Miner. Inc. Monaca, PA 19406
www.americanminerals.net 610-652-3301

5.4
Table 5.6. Glass Forming Minerals to Make 425 g of AZ-101 LAW Glass
Additives mj (g) Kyanite (Al2SiO5) 325 mesh 41.85 H3BO3 (technical - granular) 75.80 Wollastonite NYAD 325 mesh 63.37 Fe2O3 (iron III oxide, Prince Mgt.) 20.34 Li2CO3 (Chemetall Foote Co. tech. gr.) 45.72 Olivine (Mg2SiO4) 325 mesh (#180) 25.61 SiO2 (Sil-co-Sil 75) 138.73 TiO2 (rutile - airfloated) 6.33 ZnO (K-920) 20.62 Zircon ZrSiO4 (flour) 325 mesh 20.34 Total 458.71
PNWD confirmed the VSL formulation using a linear algebra approach as follows. The component mass balance requires that
iG
J
jijj gMxm =∑
=1 (i =1,2,…,K) (1)
where MG = mass of glass to be produced
gi = i-th oxide (including chlorine and fluorine) mass fraction in the glass (i.e., the target glass composition)
mj = j-th batch component (i.e., the waste and glass forming mineral mass) xij = i-th oxide mass fraction in the glass in the j-th batch component.
The recipe to attain the target glass composition is obtained by solving the set of Equation 1 for mj. The xij values for the glass forming minerals used are in Table 5.7. The mj values determined for MG = 425 g are in Table 5.6 and the bottom row of Table 5.7.

5.5
Table 5.7. Composition of Glass Forming Minerals and Pretreated AZ-101 (B) in Mass%. Note that the relationship between gi, mj, and xij is shown in the table below where the matrix (shaded area) of xij relate the oxide amounts for a given quantity of glass (gi × MG column) to the batch component amounts (mj) to make the glass when melted together.
Kyanite Boric Acid Wollastonite Iron Oxide Li2CO3 Olivine Silica Rutile Zinc Oxide Zircon AZ-101 (B)
AZ-101- ILAW
oxide xij gi × MG Al2O3 0.5703 0.000 0.002 0.015 0.000 0.0019 0.00135 0.005 0.000 0.0025 0.0598 26.32 B2O3 0.000 0.5652 0.000 0.000 0.000 0.000 0.000 0.000 0.000 0.000 0.001 42.84 CaO 0.0003 0.000 0.475 0.0004 0.00001 0.0002 0.00008 0.000 0.000 0.000 0.000 30.14 Cr2O3 0.000 0.000 0.000 0.000 0.000 0.0013 0.000 0.0016 0.000 0.000 0.0050 0.19 Fe2O3 0.0078 0.00001 0.004 0.97 0.0004 0.0768 0.00016 0.007 0.001 0.00075 0.000 22.38 Li2O 0.000 0.000 0.000 0.000 0.4012 0.000 0.000 0.000 0.000 0.000 0.000 18.34 MgO 0.0001 0.000 0.001 0.001 0.00099 0.4801 0.00008 0.000 0.000 0.000 0.000 12.44 Nb2O5 0.000 0.000 0.000 0.000 0.000 0.000 0.000 0.0040 0.000 0.000 0.000 0.03 NiO 0.000 0.000 0.000 0.000 0.000 0.0037 0.000 0.000 0.000 0.000 0.000 0.09 P2O5 0.000 0.000 0.000 0.00275 0.000 0.000 0.000 0.000 0.000 0.000 0.0072 0.26 PbO 0.000 0.000 0.000 0.000 0.000 0.000 0.000 0.000 0.00001 0.000 0.000 0.00 R2Oa 0.0042 0.000 0.001 0.000 4E-06 0.0003 0.00019 0.000 0.000 0.000 0.8275 23.70 SiO2 0.4067 0.000 0.51 0.0135 0.000 0.4252 0.997 0.022 0.000 0.3225 0.0007 205.54 SO3 0.000 0.00029 0.000 0.00075 0.00003 0.000 0.000 0.000 0.000 0.000 0.0825 2.38 TiO2 0.0079 0.000 0.0002 0.000 0.000 0.000 0.00008 0.932 0.000 0.001 0.000 6.27 U+Th 0.000 0.000 0.000 0.000 0.000 0.000 0.000 0.000 0.000 0.00004 0.000 0.00 V2O5 0.000 0.000 0.000 0.000 0.000 0.000 0.000 0.0045 0.000 0.000 0.000 0.03 ZnO 0.000 0.000 0.000 0.000 0.000 0.000 0.000 0.000 0.999 0.000 0.000 20.60 ZrO2 0.000 0.000 0.000 0.000 0.000 0.000 0.000 0.019 0.000 0.66 0.000 13.54 mj (g) 41.85 75.80 63.37 20.34 45.72 25.61 138.73 6.33 20.62 20.34 28.39 SUM(gi×
MG) = 425.09
a R2O includes Na2O, K2O, and H2O

5.6
The batch composition was determined using the analyzed composition of AZ-101 LAW (Table 5.1 through Table 5.3) with the waste loading of 0.0668 g (oxides + halogens) from the waste per g of glass. The compositions of the glass forming minerals and the target glass composition (gi) were provided by the VSL (LAWB83) (see Appendix D). Table 5.8 lists the compositions of the AZ-101 LAW, the glass forming minerals mix, and the glass in terms of oxide mass fractions. The relationship between these three compositions is subjected to the mass-balance equation (Equation 1), so, for example, as illustrated in Table 5.7 the total SiO2 in the glass is 205.54 g (= gSiO2 × MG) = 41.85 g × 0.4067 + 63.37 g × 0.51 + ----- + 138.73 g × 0.997 + ---- + 20.34 g × 0.3225 + 28.39 g × 0.0007 and so forth for each oxide in the glass.
Table 5.8. Mass Fractions of Glass Components in AZ-101 Pretreated LAW Waste, Glass Former Mineral Mix, and AZ-101 Glass
Glass Comp wi ai gi Al2O3 0.0598 0.0622 0.0620As2O3 0.0001 n/a 0.0000B2O3 0.0001 0.1076 0.1004Br 0.0041 n/a 0.0003CaO 0.0000 0.0727 0.0678Cr2O3 0.0050 n/a 0.0003F- 0.0114 n/a 0.0008Fe2O3 0.0000 0.0567 0.0529K2O 0.0274 n/a 0.0018Li2O 0.0000 0.0462 0.0431MgO 0.0000 0.0320 0.0299MoO3 0.0008 n/a 0.0001Na2O 0.8001 n/a 0.0534P2O5 0.0072 n/a 0.0005SO3 0.0825 n/a 0.0055SiO2 0.0007 0.5216 0.4868SnO2 0.0003 n/a 0.0000TiO2 0.0000 0.0150 0.0140V2O5 0.0000 n/a 0.0000WO3 0.0004 n/a 0.0000ZnO 0.0000 0.0520 0.0485ZrO2 0.0000 0.0340 0.0317SUM 1.0000 1.0000 1.0000
5.1.4 Melter Feed Preparation
To prepare the AZ-101 LAW melter feed, the glass former minerals were mixed with the waste to make a melter feed that was dried, calcined, and melted. The following paragraphs describe this process in greater detail. The mass of the AZ-101 pretreated LAW available was 460 g. The solution density was checked and found to be within the limits of the reported density, 1.224±0.030 g/mL (Table 5.9), confirming that

5.7
negligible evaporation of the LAW sample occurred during storage. Based on the solution density and the waste loading, it was determined that 192 g of the LAW solution was needed to make 425 g of glass. The quantities of glass former minerals given in Table 5.9 are 10% higher than those needed for making 425 g of glass (Table 5.6). This was done so that any material loss during mixing would not impact the final amount of glass produced. The measured total mass of the mix was 504.45 g; this was considered a satisfactory agreement with the projected mass, 504.58 g (= 458.71 × 1.1). The minerals were well mixed, first in a plastic bag and then for 4 minutes in a 500-mL agate mill. The mass of the mix after milling was 503.99 g.
Table 5.9. Quantities of Raw Minerals to Prepare Additive Mix for AZ-101 LAW Glass
Additives Mass (g)Kyanite (Al2SiO5) 325 mesh 46.04 H3BO3 (technical - granular) 83.38 Wollastonite NYAD 325 mesh 69.71 Fe2O3 (iron III oxide, Prince Mgt.) 22.37 Li2CO3 (Chemetall Foote Co. tech. gr.) 50.29 Olivine (Mg2SiO4) 325 mesh (#180) 28.17 SiO2 (Sil-co-Sil 75) 152.60 TiO2 (rutile - airfloated) 6.96 ZnO (K-920) 22.68 Zircon ZrSiO4 (flour) 325 mesh 22.37 Total 504.58
The LAW solution (192 g) was preheated at 97ºC in a shatter-resistant beaker. The amount of 458.71 g of the additive mix was stirred into the LAW solution, adding about 20 g of the mix at a time while the solution was agitated with a magnetic stirrer, keeping all solids completely dispersed. Melter-feed heating and stirring was maintained until it began to thicken, forming rounded clumps. The stir bar was then removed, and the dried feed was transferred to a Pt-Rh melting crucible and placed into an oven at 200ºC for 1 hour. The temperature was gradually increased to 350ºC. Then the crucible was transferred to a melting furnace preheated at 600°C. To prepare calcine, the temperature was slowly (in 1 hour) increased to 732°C.
5.1.5 Glass Melting
After calcination was complete, the crucible was removed from the furnace. The furnace temperature was then raised to 1150ºC, and the crucible was placed back into the furnace. When the melting reactions were complete (after about 20 minutes), the crucible was covered with a lid and heated at 1150°C for an additional 1 hour. The melt was quenched by pouring onto a clean stainless steel plate. On cooling to ambient temperature, the poured glass broke into a number of shards. These shards of the quenched glass were milled in a 100-mL tungsten-carbide disc mill for 5 minutes. This glass powder was remelted at 1150°C for 1 hour and quenched again on a stainless steel plate see Figure 5.1.

5.8
The total amount of glass thus made was 422.64 g of which 338.10 g were shards and 82.97 g remained in the crucible. After the residual glass was removed from the crucible, 1.57 g of glass adhered to crucible walls. Hence, the experiment yielded 421.07 g of usable glass. Quenched glass was used for chemical and radiochemical composition analysis (∼1 g for each) and TCLP (22 g). For PCT (∼20 g) and crystalline phase identification (∼10 g for SEM-EDS and ∼1 g for XRD), the glass was subjected to container-centerline cooling (CCC).
Figure 5.1. Photograph of AZ-101 Molten Glass being
Quenched by Pouring the Melt on a Steel Plate
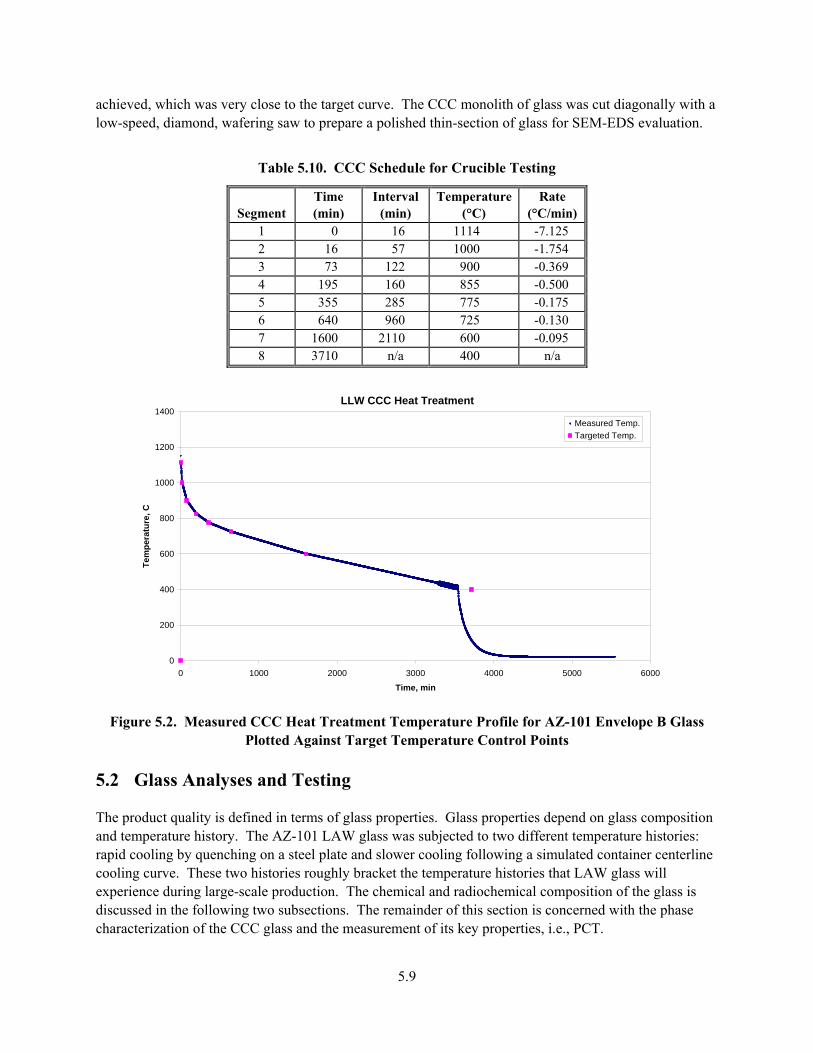
5.1.6 Container-Centerline Cooling
The CCC schedule given in Table 5.10 was provided by BNI in the form of a letter.(a) The CCC schedule was derived from measurements on an LAW container of glass at a position at 2/5 of the melt height from the bottom of the full container. The calculated CCC time-temperature history was approximated by a series of seven linear time-temperature segments duplicated with a programmable furnace. The eighth segment was a natural cooling down of the sample left in the furnace. This segment occurs below Tg where the cooling rate does not affect crystallinity and does not cause any permanent stresses. (Tg - the glass transformation temperature below which the glass is considered a true solid)
For the CCC heat treatment, 29.3 g of glass was added to a Pt/Rh rectangular mold (25×25×25 mm) with a tight-fitting cover. The mold was placed in the furnace at 1150ºC for 30 minutes before the CCC treatment was initiated according to the CCC procedure. Figure 5.2 shows the CCC curve that was
(a) L. Petkus to C. Musick. October 16, 2003. “LAW Container Centerline Cooling Data.” CCN 074181,
Contract No. DE-AC27-01RV14136.
5.9
achieved, which was very close to the target curve. The CCC monolith of glass was cut diagonally with a low-speed, diamond, wafering saw to prepare a polished thin-section of glass for SEM-EDS evaluation.
Table 5.10. CCC Schedule for Crucible Testing
Segment Time (min)
Interval (min)
Temperature(°C)
Rate (°C/min)
1 0 16 1114 -7.125 2 16 57 1000 -1.754 3 73 122 900 -0.369 4 195 160 855 -0.500 5 355 285 775 -0.175 6 640 960 725 -0.130 7 1600 2110 600 -0.095 8 3710 n/a 400 n/a
LLW CCC Heat Treatment
0
200
400
600
800
1000
1200
1400
0 1000 2000 3000 4000 5000 6000
Time, min
Tem
pera
ture
, C
Measured Temp.Targeted Temp.
Figure 5.2. Measured CCC Heat Treatment Temperature Profile for AZ-101 Envelope B Glass
Plotted Against Target Temperature Control Points
5.2 Glass Analyses and Testing
The product quality is defined in terms of glass properties. Glass properties depend on glass composition and temperature history. The AZ-101 LAW glass was subjected to two different temperature histories: rapid cooling by quenching on a steel plate and slower cooling following a simulated container centerline cooling curve. These two histories roughly bracket the temperature histories that LAW glass will experience during large-scale production. The chemical and radiochemical composition of the glass is discussed in the following two subsections. The remainder of this section is concerned with the phase characterization of the CCC glass and the measurement of its key properties, i.e., PCT.
5.10
5.2.1 Chemical Composition
For chemical and radiochemical analyses, a representative powdered sample of about 2 g of the quenched glass was produced by grinding in a tungsten carbide disc mill for 2 minutes. Approximately ¼ g quantities were dissolved in a Sodium peroxide (Na2O2-NaOH) fusion conducted in a zirconium crucible according to procedure PNL-ALO-114 and in a potassium hydroxide (KOH) fusion conducted in a nickel crucible according to procedure PNL-ALO-115. The same fusions were made for the low-activity reference material (LRM) and analytical reference ARG-1 powdered glass standards described below. All sample material appeared to go into solution (no apparent residue remained in fusion crucibles or as precipitate in final solution) after the fusion procedures. Analytical dilutions of 5×, 10×, and 50× were prepared for each fusion preparation. Table 5.11 provides a summary of the preparation and analysis methods performed. Cation analysis was performed using inductively coupled plasma-atomic emission spectrometry (ICP-AES). Before ICP-AES analysis, a small amount (0.1 mL) of hydrofluoric acid was added to the prepared samples. Portions of the samples fused with sodium peroxide were submitted for radiochemical analysis and inductively coupled plasma-mass spectrometry (ICP-MS). Specifically, thallium was measured by ICP-MS. No hydrofluoric acid was added to the aliquots submitted for radiochemistry or ICP-MS analysis. The chemical composition of the glass was measured in duplicate along with low-activity reference material (LRM) and analytical reference ARG-1 powdered glass standards (Ebert and Wolf 1999; Smith 1993). The ARG-1 and LRM glasses are compositionally well characterized and provide an excellent independent check of the analytical processes and results. Cation analysis of the TCLP leachate solutions for all elements except for thallium was completed using a Thermo Jarrell-Ash, Model 61 inductively coupled argon plasma spectrometer according to procedure PNL-ALO-211. Thallium was measured with mass spectrometry per 329-OP-SC01. Corrections to the waste-glass analysis were applied using a procedure developed by Weier and Piepel (2002).
5.2.2 Radiochemical Composition
About 0.1 g of the powdered quenched glass prepared under section 5.2.1 was solubilized with a Na2O2-NaOH fusion in a Zr crucible according to procedure PNL-ALO-114. The material fused was dissolved in HNO3 and diluted to 100 mL with deionized water. Radiochemical analyses included 99Tc, 129I, 237Np, 233U, 234U, 235U, 236U, 238U, 239Pu, 240Pu, 241Pu / 241Am, and 242Pu by ICP-MS; 63Ni, 79Se, 90Sr, 151Sm, and 241Pu with separation and β-counting; 236Pu, 238Pu, 239/240Pu, 241Am, 243Am, 242Cm, 242Pu, and 243/244Cm with separation and α energy analysis (AEA); and 60Co, 95Nb, 113Sn, 125Sb, 126Sn/Sb, 134Cs, 137Cs, 144Ce, 152Eu, 154Eu, 155Eu, and 232Th with extended counting time γ energy analysis (GEA). Concentration values or less-than values of other γ emitters, e.g., 51Cr, 59Fe, 88Y, 95Zr, 103Ru, and 106Ru, were obtained with GEA, depending on concentrations and detection limits.

5.11
For Pu, Am, Cm, and Sr analyses, a 10-mL aliquot of dissolved material was evaporated to dryness to remove HCl and then brought back to 10-mL volume with 2 molar HNO3 and filtered through a 0.45-micron filter. Where appropriate, larger samples were taken for analysis in the case of responses that were close to the detection limits. The fused sample material in 10-mL aliquots was directly γ counted for 14 hours on high-efficiency Ge detectors according to procedure PNL-ALO-450. The Pu and Am/Cm separations were performed on a 4-mL fusion aliquot according to procedure PNL-ALO-417. The separated fractions were precipitation plated according to PNL-ALO-496, and the samples were counted by α spectrometry according to PNL-ALO-422. Plutonium recovery was traced with 242Pu. The curium is known to follow the americium, and both these isotopes were traced with 243Am. The Sr separation was performed according to PNL-ALO-476, and radiochemical yields were traced with 85Sr. The separated fractions were then β-counted according to RPG-CMC-408 and γ-counted according to PNL-ALO-450 (for 85Sr determination and 137Cs impurity assessment). Samples of the AZ-101 glass were analyzed with a ICP-MS for 99Tc, 237Np, 239Pu, and 240Pu according to 329-OP-SC01 using a machine set up to handle radioactive materials. Dilutions of isotope product standards for 237Np and 239Pu and an Amersham 99Tc standard were used to generate calibration curves. The 1% high-purity nitric acid solution was used to dilute the standards and samples, and also as a reagent blank.

5.12
Table 5.11. Summary of Analytical Methods
Analysis Preparative Method Analysis Method Density Direct PNL-ALO-501 Mass% Total Solids/TDS(a) Direct PNL-ALO-501 ICP-AES(b) (metals) PNL-ALO-128 RPG-CMC-211 Rev. 0 ICP-MS(c) (except iodine) PNL-ALO-128 329-OP-SC01 Rev. 0 ICP-MS (iodine) Direct 329-OP-SC01 Rev. 0 KPA(d) (uranium) PNL-ALO-128 RPG-CMC-4014 IC(e)-Inorg (inorganic anions) Direct PNL-ALO-212 IC-F(f) (F only) Direct TP-RPP-WTP-212 IC-Org (organic acids/anions) TP-RPP-WTP-049 TP-RPP-WTP-046 TOC(g)/TIC(h) – furnace Direct PNL-ALO-380 TOC/TIC - hot persulfate Direct PNL-ALO-381 CN(i) PNL-ALO-287 PNL-ALO-289 Hg RPG-CMC-131 RPG-CMC-201 Rev. 0 OH(j) Direct PNL-ALO-228 ISE(k) (ammonia) Direct RPG-CMC-226 GEA(l) PNL-ALO-128 PNL-ALO-450
Total α PNL-ALO-128 RPG-CMC-4001, RPG-CMC-408
Total β PNL-ALO-128 RPG-CMC-4001, RPG-CMC-408
90Sr PNL-ALO-128, PNL-ALO-476
RPG-CMC-408, PNL-ALO-450
99Tc+7 PNL-ALO-432(m) RPG-CMC-474 3H PNL-ALO-418 RPG-CMC-474 14C PNL-ALO-482 RPG-CMC-474 79Se PNL-ALO-128,
PNL-ALO-440 RPG-CMC-474
Pu, Am, Cm PNL-ALO-128, PNL-ALO-417, PNL-ALO-496
RPG-CMC-422
Toxic Characteristic Leaching Procedure (TCLP) RPG-CMC-110 Rev. 1 RPG-CMC-139 Rev. 0 RPG-CMC-101 Rev. 0
RPG-CMC-211 Rev. 0 RPG-CMC-201 Rev. 0
(a) TDS = total dissolved solids (b) ICP-AES = inductively coupled plasma-
atomic emission spectroscopy (c) ICP-MS = inductively coupled plasma-
mass spectroscopy (d) KPA = kinetic phosphorescence analysis (e) IC = ion chromatography (f) F = fluorine
(g) TOC = total organic carbon (h) TIC = total inorganic carbon (i) CN = cyanide (j) OH = hydroxide (k) ISE = ion specific electrode (l) GEA = gamma energy analysis (m) Without sodium dichromate added.

5.13
5.2.3 Crystalline and Non-Crystalline Phase Determination
Crystalline and noncrystalline phases in the CCC glass were identified with X-ray diffraction (XRD), optical microscopy, and scanning electron microscope (SEM). Glass samples were cut and polished with Buhler diamond saw and polishing equipment. Crystalline material content was estimated from the XRD results and visual observations. Optical examination was conducted both with a metallurgical microscope (magnification from 10× to 70×) and a transmitting polarized light Meiji Techno microscope (magnification at 100× to 250×). XRD was performed with a SCINTAG model PAD V Powder X-ray diffractometer using Cu K∀ radiation (1.54056 ) having a scan 2θ increment of 0.05°, a dwell time of 6 seconds, and a 2θ range of 5 to 70°. The glass was powdered, spiked with 5 wt% of CaF2 standard, and mixed in a tungsten carbide grinding chamber using a disc mill. An approximately 100-mg sample of glass was mounted on a plastic XRD sample mount, leveled to the X-ray beam height, encapsulated in Mylar film, transported to an XRD facility, and analyzed. A SEM (model VG elemental shielded PQ2) with energy dispersive spectroscopy (EDS) capabilities analyzed crystals and chemical inhomogeneities. A thin section of the LAW glass sample, approximately 1 cm2 in area and 4 mm thick, was polished and mounted on an aluminum SEM specimen holder. The glass sample was polished to a minimum of #600 grit. The mount was coated with a transparent conducting film and examined both at low magnification (15× and 100×) and higher magnifications (500× through 20,000×).
5.2.4 TCLP
A TCLP test was performed on two quench-cooled AZ-101 LAW glass samples. Leachates were analyzed with inductively coupled plasma-atomic emission spectroscopy (ICP-AES) for Sb, As, Ba, Be, B, Cd, Cr, Pb, Ni, Se, Ag, V, and Zn and with cold vapor atomic absorption spectroscopy (CVAA) for Hg. ICP-MS was used for Tl. Table 5.12 presents the universal treatment standard (UTS) limits for the concentrations of these elements in the TCLP solution. The testing was conducted per SW-846, Method 1311 (EPA 1992). The amount of ~25 g of quenched glass was sieved to pass through a 9.5-mm (USA 3/8 inch Mesh) sieve. Larger pieces were broken with a hammer in a plastic bag. Per procedure RPG-CMC-110, a 10-g sample was placed into an extractor vessel with 200 mL of extraction fluid #1. The sample was rotated head-over-heel at 30 rpm for 18 hours at 23°C (±2°C). The extract was acidified by adding concentrated nitric acid, and then aliquots were taken for subsequent acid digestion per procedure RPG-CMC-139 using from 40 to 45 mL of the acidified TCLP extract. Two digests were conducted, one using nitric and hydrochloric acids, and the other using nitric acid alone.

5.14
Table 5.12. TCLP Inorganic Constituents of Potential Concern (CoPC)
CAS# Constituent Symbol UTS(a) mg/L TCLP 7440-36-0 Antimony Sb 1.15 7440-38-2 Arsenic As 5.0 7440-39-3 Barium Ba 21 7440-41-7 Beryllium Be 1.22 7440-42-8 Boron B 0.05 7440-43-9 Cadmium Cd 0.11 18540-29-9 Chromium Cr 0.6 Total 7439-92-1 Lead Pb 0.75 7439-97-6 Mercury Hg 0.025 7440-02-0 Nickel Ni 11 7782-49-2 Selenium Se 1 7440-22-4 Silver Ag 0.14 7440-28-0 Thallium Tl 0.20 7440-62-2 Vanadium V 1.6 7440-66-6 Zinc Zn 4.3 (a) UTS = Universal Treatment Standard, 40 CFR 268.
5.2.5 PCT
The PCT is conducted in accordance to the ASTM procedure C 1285-97, “Standard Test Methods for Determining Chemical Durability of Nuclear, Hazardous, and Mixed Waste Glasses: The Product Consistency Test (PCT)” (ASTM 1997). The test was conducted on both AZ-101 LAW glass subjected to CCC cooling and the LRM glass. The glass was ground in a tungsten-carbide disc mill and then sieved through 75 and 150 µm (-100 to +200 mesh) stainless steel sieves. The glass particles were cleaned by washing in deionized water (DIW) and ethanol with an ultrasonic cleaner and dried in an oven at 90°C. Approximately 1.5 g of glass were placed into a 22-mL desensitized type 304L stainless steel container filled with approximately 15 mL of DIW. The glass was precisely weighed and the leachate volume precisely controlled to achieve a solution volume-to-glass mass ratio of 10 mL/g glass. The container and its contents were held (without agitation) at 90ºC temperature for 7 days. The initial and final pH values of the solution were taken. Aliquots of the solution were filtered through a 0.45-µm filter and analyzed using ICP. The ratio of the surface area of the sample to solution volume is estimated to be 2000 m-1. This estimate is based on the assumption that spherical particles with Gaussian size distribution range from 74 µm to 149 µm in diameter. This estimated particle-size distribution closely approximates the observed distribution for the -100 to +200 mesh sieve fraction—see Appendix 11 of ASTM C 1285-97. Assuming that particles are cubic or tabular results in ∼1% difference in the specific surface area. Therefore, no significant error is introduced when the release of elements (sodium, silicon, and boron) from the glass is expressed per exposed glass surface area thus estimated. Triplicate samples were prepared and tested for each glass. The LRM standard glass was included in these tests to provide a reliable baseline of results by which to judge the quality of the PCT results for the
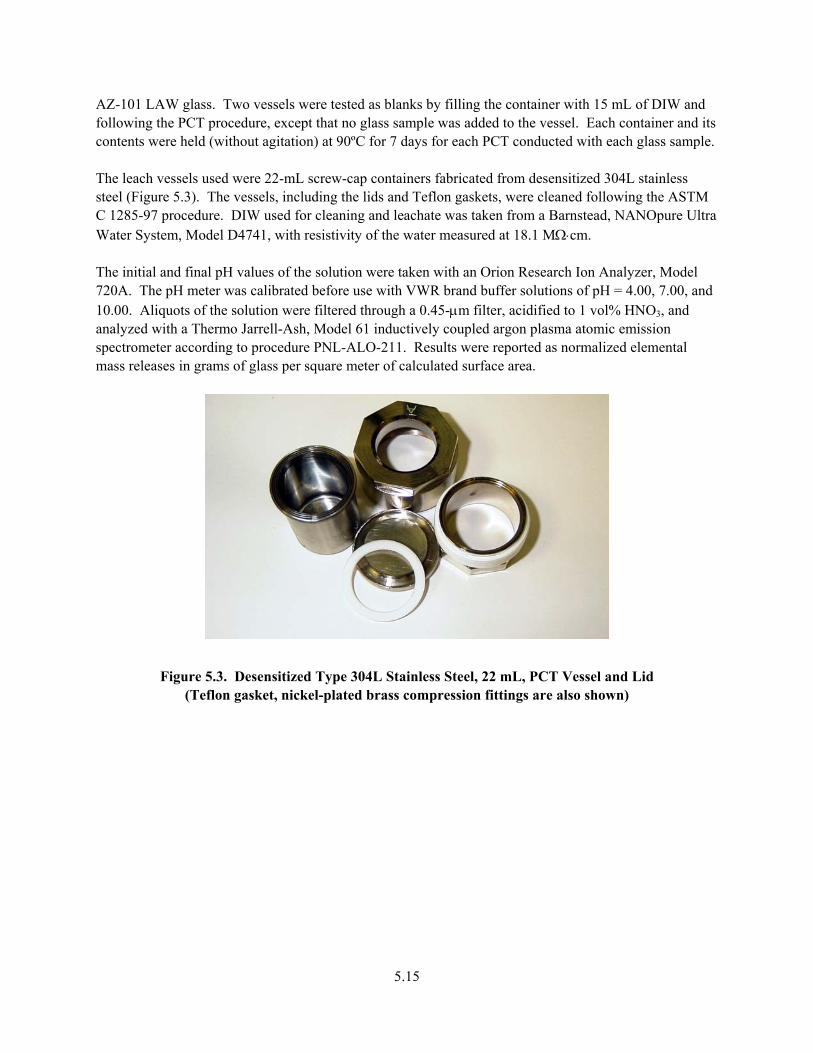
5.15
AZ-101 LAW glass. Two vessels were tested as blanks by filling the container with 15 mL of DIW and following the PCT procedure, except that no glass sample was added to the vessel. Each container and its contents were held (without agitation) at 90ºC for 7 days for each PCT conducted with each glass sample. The leach vessels used were 22-mL screw-cap containers fabricated from desensitized 304L stainless steel (Figure 5.3). The vessels, including the lids and Teflon gaskets, were cleaned following the ASTM C 1285-97 procedure. DIW used for cleaning and leachate was taken from a Barnstead, NANOpure Ultra Water System, Model D4741, with resistivity of the water measured at 18.1 MΩ⋅cm. The initial and final pH values of the solution were taken with an Orion Research Ion Analyzer, Model 720A. The pH meter was calibrated before use with VWR brand buffer solutions of pH = 4.00, 7.00, and 10.00. Aliquots of the solution were filtered through a 0.45-µm filter, acidified to 1 vol% HNO3, and analyzed with a Thermo Jarrell-Ash, Model 61 inductively coupled argon plasma atomic emission spectrometer according to procedure PNL-ALO-211. Results were reported as normalized elemental mass releases in grams of glass per square meter of calculated surface area.
Figure 5.3. Desensitized Type 304L Stainless Steel, 22 mL, PCT Vessel and Lid (Teflon gasket, nickel-plated brass compression fittings are also shown)

6.1
6.0 Results
The AZ-101 LAW glass melter feed was successfully processed and melted into an LAW glass that was prepared for chemical and radiochemical composition determination and for property testing (TCLP and PCT); glass was also archived for future testing. Material was also used for phase characterization. Approximately 421 g of usable glass was recovered from the targeted 425 g LAW and mineral additives batch that was melted. The preparation of glass in this work roughly reproduced the three phases of feed-to-glass conversion in the liquid-fed ceramic melter (LFCM) (dry, calcine, and melt). Except the impact of gas atmosphere on the redox states of multivalent oxides, any other differences between crucible and melter vitrification conditions are virtually inconsequential for the properties of the final product (cf. Hrma et al. 2002). The crucible lid kept the batch gases in the crucible.
6.1 LAW AZ-101 Waste Components Content
The content of the dried and calcined waste in the as-received AZ-101 LAW solution was checked by taking an ∼4-g aliquot of the solution that was first dried in a porcelain crucible for 24 hours at 105°C and then calcined for 130 minutes at 1050°C. The measurement was performed in duplicate. The test was then modified by adding 14 to 16 g of silica to the LAW before drying. On calcination, the silica reacts with the LAW, reducing its hydroscopic nature and assisting the decomposition reactions of inorganic salts. This test was also performed in duplicate. A blank test was performed with silica alone. The mass loss on drying (0.01%) and on calcining (0.13%) of the silica was used to correct the values listed in Table 6.1, which compares the measured and reported values. The fraction of dry solids (26.1 mass% with silica addition and 26.5 mass% without silica addition) is slightly lower than a previously determined value of 26.7 mass%. The measured fraction of glass components (oxides, halides, and sulfates), both 14.8 mass% with and without silica addition, is in excellent agreement with the reported fraction of 14.8 mass%. From these results, it was concluded that the waste solution had not changed significantly in concentration since the time it had been sampled to perform chemical analysis.
Table 6.1. Solids and Oxide Content of AZ-101 Pretreated LAW Solution
Reported (mass %) (Goheen et al.,
2002)
Measured Without Silica
(mass %)
Measured with Silica
(mass %) Fraction of solids(a) 26.68 26.52 26.09 Fraction of refractory components(b) 14.79 14.79 14.83 (a) Dried to constant weight at 105°C. (b) Fired to constant weight at 1050°C.
6.2 LAW Glass AZ-101 Chemical Composition
Three different sample-preparation methods were used on the glasses: Na2O2-NaOH fusion in a Zr crucible (PNL-ALO-114), KOH-KNO3 fusion in a Ni crucible (PNL-ALO-115), and acid digestion

6.2
(PNL-ALO-138). For each method, ICP-AES analyses was performed for a batch containing a blank, two Certified Reference Material (CRM) glasses, ARG-1 (Smith 1993) and LRM (Ebert and Wolf 1999), and duplicate samples of the AZ-101 LAW glass. Inclusion of the standard glasses allowed a way to screen out matrix effects when doing analyses with the ICP-AES technique when a large number of elements are analyzed simultaneously. However, the instrument cannot be set up to optimize each of a large number of elements. Therefore, the analytical values obtained by the ICP-AES technique were corrected using analyses of standard glasses with well-established compositions, such as ARG-1 and LRM and sound statistical principles. This section describes the procedure for corrections made to the waste glass analysis based on standard glass analyses (Weier and Piepel 2002). This correction was used to extract the most likely composition of the glass indicated by the ICP-AES data. As outlined by Weier and Piepel (2002), the following steps were performed to obtain a single “best” estimate from individual AZ-101 LAW glass sample analytical results: 1. analyte screening 2. blank correction 3. nondetect replacement 4. relative standard deviation computation 5. bias correction 6. normalization. Unlike the analysis reported by Weier and Piepel (2002), the sampling variability (σS) did not need to be addressed in this project. The current project performed multiple CRMs in a batch instead of multiple analyses of a CRM in a batch as assumed by Weier and Piepel (2002). Multiple unknown glass replicates in each batch were handled identically. Concentrations of some constituents were not reported because of the nature of analytical methods used: Na and Zr concentrations were not obtained from the analysis using Na2O2-NaOH fusion, K and Ni concentrations were not obtained from the analysis using KOH-KNO3 fusion, and Si concentration was not obtained from the analysis using acid digestion. Also, concentrations of F and SO3 were not obtained by the analytical methods used for most of the elements, but SO3 was determined in the glass by SEM-EDS at 0.51 Wt% consistent with the expected of 0.55 Wt% based on its concentration in the pretreated waste. Some known minor waste LAW constituents (As and W) were not detected in the glass. Unlike in Weier and Piepel (2002), all adjustments to the analytical data were done in the original analytical units. Conversions to mass fractions were done after adjustment and before normalization. Several analytes were not detected in any of the AZ-101-LAW glasses: Ag, As, Ce, Dy, Eu, Nd, Pd, Ru, Sb, Se, Te, Th, Tl, U, W, and Y; because no adjustments or corrections could be performed on these analytes, they were removed from the list of constituents. Further, because of the large differences in detection limits between the acid-digestion method and the fusion-preparation methods, Be, Cd, Co, La, and Mo, analytes that were detected in the acid-digestion results but not detected in either of the fusion preparation methods, were also removed from the list of constituents. Of all of these removed analytes, only As, Mo, and W were listed in the AZ-101 LAW target composition as minor components; their calculated fractions in the glass were less than 0.01 mass%. Concentrations of these non-detect (ND) constituents were assumed 0 in blanks and 1/2 method detection limit (MDL) in AZ-101 LAW; for CRMs, the ND’s concentration was assumed 1/2 MDL for elements in the recipe; 0 concentration was

6.3
used when it could be assumed that the element was absent in blanks and in CRM (elements not in their recipe). A pair of AZ-101 LAW replicate measurements was available for each digestion method. This gave three pairs of measurements for a direct estimate of analytical uncertainty with the exception of only two pairs for Na, Zr, K, Ni, and Si. Na and Zr were not reported for Na2O2-NaOH fusion, K and Ni were not reported for KOH-KNO3 fusion, and Si was not reported for acid digestion. Relative percent deviations (RPDs) were computed for each of the available pairs. If both of the paired values were NDs, the pair was not included in the relative standard deviation (RSD) estimation. From the RPDs available for each analyte, a pooled estimate was obtained by squaring the RPDs, averaging their squares, and taking the square root. This value was then divided by √2 to obtain an estimate of the RSD (ρA) and standard deviation (Std) values (RSD = Std/Concentration). It was assumed that the Std for the blank (ρB) was 15%. Further, ρA, the RSD for glass analysis, was estimated from replicated AZ-101 analyses, and σT, the Std for the CRM target value, was obtained from CRM reports. Thus, σB = BρB, σA = XρA or CρA, and ρT = σT/T, where, B, X, C, and T denote the concentration of the blank, unknown glass analysis, CRM analysis, and CRM target value, respectively. For each sample-preparation batch, the blank concentrations were subtracted from each of the four glass measurements (one such subtraction resulted in a negative value, which was set to 0). In most cases, the blank corrections had little effect, as expected, but there was an especially noticeable improvement in the repeatability for Ca and also some improvement for Sn and Sr. Analytical results that have not been blank corrected retained their uncertainty of σA (see Weier and Piepel 2002, Equation 3.9) while those that have been blank corrected (X - B or C - B) had an uncertainty of σ A
2 +σ B2 (see Weier and
Piepel 2002, Equation 3.7). The AZ-101 analytical results were corrected for analytical bias using the CRM target values. The bias correction is better for those constituents for which the unknown glass and the CRM glass concentrations are closer. For a given constituent bias correction, that CRM was chosen in which that constituent concentration was closer than in the AZ-101 LAW glass. The minor constituent analytes not represented in either CRM were Bi, Rh, Sn, and V; their concentrations could not be bias adjusted. For Ba, K, Mn, Ni, Pb, and Zr, only one of the CRMs contained a particular analyte. These analytes were subject to bias correction. The majority of detected analytes are subject to bias correction by ARG-1; they include Al, B, Ca, Cr, Cu, Fe, Li, Mg, Na, P, Si, Sr, Ti, and Zn. Accordingly, the selected target CRM value was compared to the measured CRM concentration for each analyte. The difference was compared to the appropriate function of the estimated uncertainty of the measured result and an uncertainty associated with the actual target values. Bias correction was performed only if the difference was statistically significant relative to these uncertainties (>1.96). When the correction was required, it was performed by multiplying the concentration value for the AZ-101 LAW glass by the ratio of the CRM target values to the CRM measured value. The uncertainty of the bias-corrected value for the AZ-101 LAW glass was increased since it then also included the influence of the uncertainties of the CRM target and the CRM measured result. At the completion of these data-adjustment steps, element concentrations were converted to glass constituent (mainly oxide) mass fraction. Values for unanalyzed, undetected, or unreported glass

6.4
constituents were substituted before performing normalization. Two expected but unanalyzed components (F and SO3) and three expected but undetected constituents (As, Mo, and W) were given their calculated values (based on the compositions of LAW and mineral additives); these values have no quantifiable uncertainty. Unreported components in any method (Na, Zr, K, Ni, and Si) were substituted with inverse-variance weighted means of the results from the other two methods. The final adjusted normalized results for each of the two replicates in each of the three digestions are summarized in Table 6.2. Table 6.3 lists the standard deviations for each analysis and each constituent. Table 6.4 summarizes the averages for the two duplicate values for each sample preparation method and the overall average. It also shows, in the last two rows, the sums of squared standard deviations, the ΣσA
2 for all constituents listed in the target composition; the ΣσA
2 is smallest for the acid-digestion preparation method (ΣσA
2 = 8.1×10⁻⁶) and largest for the Na2O2-NaOH fusion preparation method (ΣσA2 = 4.3×10⁻⁵).
The squared error, Σ(A-T)2, was highest for the KOH-KNO3 fusion preparation method [Σ(A-T)2 = 9.0×10⁻⁵] and lowest for the average value for all three methods [Σ(A-T)2 = 3.1×10⁻⁵]. Thus, it can be concluded that the actual and target compositions differ by √[Σ(A-T)2] = 0.0056. This 0.56 mass% difference qualifies as excellent agreement between the actual and target composition of AZ-101 LAW glass. The mass-fraction values from Table 6.4 are graphically displayed in Figure 6.1 through Figure 6.3. Figure 6.1 compares the analytical values (the best estimates averaged for the two measured duplicate samples) with the target values, showing excellent agreement for components with mass fractions higher than 0.005. For components with mass fractions lower than 0.005, the relative deviation from the target generally increases, and the mass fraction of constituents decreases. For these constituents, the analyses tend to provide exaggerated concentration values. Identification and quantification is required only for the chemical constituents present at concentrations greater than 0.5 mass% (indicated by lines in Figure 6.1). Figure 6.2 compares the analytical values (the best estimates averaged for the two measured duplicate samples) with the target values for all components with mass fractions higher than 0.005, except SiO2, which was not included in the plot because of its high mass fraction. Finally, Figure 6.3 compares best estimates for the individual sample preparation method with the overall averages, showing good agreement. At the time this work was initiated, the RPP-WTP contract ILAW specification (DOE-ORP 2000) required a waste loading of 5 weight percent based on Na2O for Envelope B wastes, The requirement was subsequently changed to 3.0 weight percent based upon Na2O for Envelope B wastes, which include AZ-101. The target and measured mass fractions of Na2O for AZ-101 LAW are 5.35 and 5.58 mass%, respectively. This low concentration of Na2O in LAW Envelope B glass was necessitated by an additional constraint that the product of Na2O and SO3 mass fractions in glass must be no greater than 5×10⁻⁴. According to Muller et al. (2001), LAW glass segregates molten salt when processed in a Joule-heated melter if 4
SOONa 10532
−×>xx where ONa2x and
3SOx are the mass fractions of Na2O and SO3 in
glass [also known as the VSL rule of five, i.e., Na2O×SO3 ≤ 5 (mass%)2 limit]. According to Muller et al. (2001), this inequality was an empirically determined based on melter processing data at a relatively fixed processing rate. The measured content of SO3 in the glass was 0.51 mass% and the measured Na2O×SO3 product was 2.8 (mass%)2, while the target content of SO3 in the glass was 0.55 mass% and the target Na2O×SO3 product was 2.9 (mass%)2

6.5
Table 6.2. Best Analytical Estimates for AZ-101 LAW Glass Composition in Mass Fractions
Na2O2-NaOH KOH-KNO3 Acid Digestion Al2O3 0.0593 0.0589 0.0588 0.0591 0.0600 0.0592 B2O3 0.1019 0.1009 0.1018 0.1013 0.0974 0.0983 BaO 0.0000 0.0000 0.0001 0.0001 0.0001 0.0001 Bi2O3 0.0002 0.0002 0.0002 0.0002 0.0001 0.0001 CaO 0.0649 0.0645 0.0643 0.0643 0.0671 0.0671
Cr2O3 0.0008 0.0008 0.0008 0.0008 0.0008 0.0008 CuO 0.0000 0.0000 0.0000 0.0000 0.0000 0.0000 Fe2O3 0.0520 0.0512 0.0507 0.0507 0.0552 0.0555 K2O 0.0037 0.0040 0.0019 0.0019 0.0018 0.0017 Li2O 0.0422 0.0416 0.0434 0.0432 0.0454 0.0444 MgO 0.0308 0.0302 0.0301 0.0301 0.0293 0.0298 MnO 0.0004 0.0004 0.0002 0.0002 0.0004 0.0004 Na2O 0.0551 0.0551 0.0554 0.0558 0.0569 0.0562 NiO 0.0004 0.0003 0.0002 0.0002 0.0002 0.0002 P2O5 0.0011 0.0011 0.0008 0.0008 0.0007 0.0007 PbO 0.0002 0.0002 0.0002 0.0002 0.0000 0.0000
Rh2O3 0.0007 0.0007 0.0003 0.0003 0.0001 0.0001 SiO2 0.4864 0.4906 0.4929 0.4930 0.4827 0.4834 SnO2 0.0004 0.0005 0.0005 0.0005 0.0002 0.0001 SrO 0.0000 0.0000 0.0000 0.0000 0.0000 0.0000 TiO2 0.0154 0.0151 0.0151 0.0151 0.0153 0.0152 V2O5 0.0002 0.0002 0.0002 0.0002 0.0002 0.0002 ZnO 0.0483 0.0477 0.0465 0.0462 0.0504 0.0502 ZrO2 0.0293 0.0293 0.0292 0.0293 0.0295 0.0297
As2O3 7.E-06 7.E-06 7.E-06 7.E-06 7.E-06 7.E-06 F 0.0008 0.0008 0.0008 0.0008 0.0008 0.0008 MoO3 5.E-05 5.E-05 5.E-05 5.E-05 5.E-05 5.E-05 SO3 0.0055 0.0055 0.0055 0.0055 0.0055 0.0055 WO3 3.E-05 3.E-05 3.E-05 3.E-05 3.E-05 3.E-05 Notes: (1) Two analyses were performed for each sample preparation method
(i.e., Na2O2-NaOH, KOH-KNO3, and acid digestion). (2) As2O3, F, MoO3, SO3, and WO3 concentrations were calculated from the
Mass balance equation. (3) Na and Zr concentrations were not obtained from the analysis using
Na2O2-NaOH fusion, K and Ni concentrations were not obtained from the analysis using KOH-KNO3 fusion, and Si concentration was not obtained from the analysis using acid digestion; their values were substituted with inverse-variance weighted means of the concentrations from the other two methods before the final normalization.

6.6
Table 6.3. Values of 104σA for Best Analytical Estimates for AZ-101 LAW Glass Composition (see Table 6.2)
Na2O2-NaOH KOH-KNO3 Acid digestionAl2O3 6.30 6.23 6.21 6.23 3.98 3.93B2O3 10.93 10.78 10.51 10.44 9.50 9.56BaO 0.04 0.04 0.01 0.01 0.03 0.03Bi2O3 0.08 0.07 0.07 0.07 0.03 0.03CaO 13.31 13.28 6.00 5.99 3.71 3.71Cr2O3 0.12 0.12 0.14 0.14 0.13 0.14CuO 0.01 0.01 0.03 0.03 0.00 0.00Fe2O3 3.80 3.74 3.74 3.74 3.81 3.83K2O 2.69 2.91 0.61 0.61 0.94 0.88Li2O 5.07 5.00 7.33 7.29 5.25 5.13MgO 3.78 3.72 3.55 3.55 4.59 4.66MnO 0.06 0.06 0.98 1.00 0.06 0.06Na2O 3.02 3.02 7.45 7.45 5.12 5.06NiO 0.88 0.72 0.15 0.15 0.23 0.23P2O5 0.73 0.73 0.42 0.42 0.36 0.37PbO 0.14 0.15 0.17 0.18 0.02 0.02Rh2O3 0.18 0.19 0.08 0.07 0.03 0.03SiO2 19.87 19.73 16.95 16.89 13.01 13.01SnO2 2.64 2.71 0.45 0.44 0.15 0.13SrO 0.14 0.14 0.00 0.00 0.00 0.00TiO2 1.66 1.64 1.62 1.62 0.96 0.96V2O5 0.00 0.00 0.00 0.00 0.00 0.00ZnO 2.81 2.77 2.69 2.68 2.90 2.89ZrO2 1.11 1.11 2.21 2.21 2.22 2.23
1.E-05
1.E-04
1.E-03
1.E-02
1.E-01
1.E+00
1.E-05 1.E-04 1.E-03 1.E-02 1.E-01 1.E+00
Target mass fraction
Ana
lyse
d m
ass
frac
tion
NaOH
KOH
Acid
Figure 6.1. Analyzed Versus Target Mass Fractions of AZ-101 LAW Glass Components

6.7
Table 6.4. Averaged Best Analytical Estimates for AZ-101 LAW Glass Composition in Mass Fractions Sorted by Target
Na2O2-NaOH KOH-KNO3 Acid Digestion Average Target SiO2 0.4896 0.4937 0.4836 0.4890 0.4870 B2O3 0.1016 0.1017 0.0980 0.1004 0.1004 CaO 0.0648 0.0644 0.0671 0.0655 0.0679 Al2O3 0.0592 0.0591 0.0596 0.0593 0.0621 Na2O 0.0552 0.0557 0.0566 0.0558 0.0535 Fe2O3 0.0517 0.0507 0.0554 0.0526 0.0529 ZnO 0.0481 0.0464 0.0504 0.0483 0.0485 Li2O 0.0420 0.0433 0.0450 0.0434 0.0431 ZrO2 0.0293 0.0293 0.0296 0.0294 0.0317 MgO 0.0305 0.0302 0.0296 0.0301 0.0299 TiO2 0.0153 0.0151 0.0153 0.0152 0.0140 SO3 0.0055 0.0055 0.0055 0.0055 0.0055 K2O 0.0038 0.0019 0.0018 0.0025 0.0018 F- 0.0008 0.0008 0.0008 0.0008 0.0008 P2O5 0.0011 0.0008 0.0007 0.0009 0.0005 Cr2O3 0.0008 0.0008 0.0008 0.0008 0.0003 MoO3 0.0001 0.0001 0.0001 0.0001 0.0001 SnO2 5.E-04 5.E-04 2.E-04 0.0004 2.E-05 As2O3 n/a n/a n/a n/a 7.E-06 104ΣσA
2 0.427 0.196 0.081 n/a n/a 104Σ(A-T)2 0.437 0.897 0.527 0.311 n/a
0.005
0.025
0.045
0.065
0.085
0.105
0.005 0.025 0.045 0.065 0.085 0.105
Target mass fraction
Ana
lyse
d m
ass
frac
tion
NaOH
KOH
Acid
Figure 6.2. Analyzed Versus Target Mass Fractions of AZ-101 LAW Glass
Components (except SiO2) with Mass Fractions >0.005

6.8
1.E-05
1.E-04
1.E-03
1.E-02
1.E-01
1.E+00
1.E-05 1.E-04 1.E-03 1.E-02 1.E-01 1.E+00
Averaged analyzed mass fraction
Ana
lyze
d m
ass
frac
tion
NaOH
KOH
Acid
Figure 6.3. Individual Versus All-Average Analyzed Mass Fractions
of AZ-101 LAW Glass Components
The waste-loading fraction in the glass can be obtained based on the dilution of major waste components in the glass. This calculation constitutes an independent check that the glass was formulated according to plan. The dilution factor D was calculated as
ii
iii aw
agD
−−
= (2)
where the subscript i at D signifies that Di can vary with the component selected. Table 6.5 summarizes the values of Di for 7 of 8 most abundant components of the AZ-101 LAW glass. One major component, Al2O3, was not included because the waste, the additive mix, and the glass all contain ∼6 mass% Al2O3; by Equation (4), DAl2O3 would be an indeterminate. The last column in Table 6.5 shows the relative difference between Di values and the target waste loading, i.e., the expression (Di – D)/D, where D = 0.0668. As Table 6.3 shows, the value of DB2O3 is exactly on target. The values of Di for SiO2, Na2O, Fe2O3, and ZnO do not deviate more than 10 relative % from the target. The 3 mass% (49 relative %) deviation in D based on the CaO fraction is caused by a minor difference of 0.24 mass% in the analyzed and targeted fraction of CaO (Table 6.4) that could be caused by the uncertainty of the CaO content in the mineral additives used, but also by an analytical error (see the large Std values listed for CaO in Table 6.3).
The overall measured waste loading ( aD ) can be defined either as an average value, i.e.,
∑=
−=m
iia DmD
1
1 (3)

6.9
or as a weighted average ( WaD ) defined as
∑
∑
=
== m
iiA
iA
m
ii
Wa
g
gDD
1
1 (4)
where m = 7 is the number of abundant components listed in Table 6.5. These values are listed in Table 6.5, showing that the weighted average is 6.73 mass%, a value higher than the targeted 6.68 mass%. The difference between the actual and targeted values is 0.05 mass% (1 relative %). Summarizing, the waste fraction of AZ-101 LAW glass is very close to and slightly exceeds the target.
Table 6.5. Waste Loading as Dilution Factor for AZ-101 LAW Waste Glass Constituents
Glass Comp wi ai gi(a) Di
(b) RP SiO2 0.0007 0.5216 0.4890 0.0627 -0.06 B2O3 0.0001 0.1076 0.1004 0.0666 0.00 CaO n/a 0.0727 0.0655 0.0997 0.49 Na2O 0.8001 n/a 0.0558 0.0698 0.04 Fe2O3 n/a 0.0567 0.0526 0.0718 0.07 ZnO n/a 0.052 0.0483 0.0712 0.07 Li2O n/a 0.0462 0.0434 0.0598 -0.10 Average 0.0717 0.07 Weighted average 0.0673 0.01 (a) The averaged best analytical estimate for AZ-101 LAW glass. (b) The waste loading (W) was calculated from Equation 4, where
wi, ai, and gi are the measured i-th component mass fractions in waste, additive mix, and AZ-101 LAW glass.
RP = Relative percent
6.3 LAW Glass AZ-101 Radiochemical Composition
Table 6.6 summarizes the radioisotope analysis results for the quenched AZ-101 glass. The dates of analysis allow the analytical values to be indexed to any date. Note that all of the isotopes reported were determined radiochemically, except for 99Tc, 241Pu, and Uranium. The 241Pu activity based on the less-than mass spectrometry number is very high and effectively almost meaningless, because of the high activity of 241Pu. The expected value in the glass based on the radiochemical measurement of 241Pu in the AZ-101(B) waste solution will be used in the computation of the TRU loading of the glass because that 241Pu concentration is based on a measured quantity. The uranium in the glass is almost all due to uranium in the zircon added as a glass forming chemical. If the zircon is 200-ppm uranium, the uranium contributed to the glass will be (20.34/425) × 200 ppm = 9.6 ppm, where 20.34 is the mass of the zircon in the batch producing 425 g of glass. This is quite close to the 10.67 ppm reported for the glass.

6.10
Table 6.6. Radioisotope Activity in AZ-101 Glass in µCi/g (including dates of analysis)
Isotope Activity µCi/g Date Isotope Activity
µCi/g Date 60Co <5E-6 5/19/2003 151Sm <8E-4 3/15/2004 63Ni 2.59E-3 11/21/2003 152Eu <2E-5 5/19/2003 79Se <3.3E-3 3/1/2004 154Eu <2E-5 5/19/2003 90Sr 1.285E-1 9/25/2003 155Eu <8E-5 5/19/2003
95Nb <5E-6 5/19/2003 232Th <4E-5 5/19/2003 99Tc(a) <2.65E-2 3/16/2004 238Pu <8E-5 2/24/2004 113Sn <3E-5 5/19/2003 239+240Pu <9E-5 2/24/2004 125Sb 3.02E-3 5/19/2003 241Pu(a) <8E-0 3/16/2004
126SnSb 7.73E-4 5/19/2003 241Am <2E-5 2/24/2004 134Cs <7E-6 5/19/2003 242Cm <7.0E-6 2/24/2004 137Cs 1.27E-2 5/19/2003 243+244Cm <7.5E-6 2/24/2004 144Ce <2E-4 5/19/2003 U(µg/g) (a) 10.67 n/a
(a) ICP-MS
6.3.1 Data Comparison with Requirements
Table 6.7 gives the analysis for AZ-101 glass determined by radiochemistry or ICP-MS for radioisotopes that could be measured in the AZ-101 waste solution given in Table 5.3. Appendices A, B, and C provide additional analysis information. The expected loading (µCi/g glass) was calculated from the radiochemical analysis of the waste by taking those analytical values (Table 5.3) that are in µCi/mL, converting to µCi/g dried solids by dividing by the density (1.224 g/mL), and then by the weight fraction of dried solids (0.2668), and converting that value to µCi/g waste oxides by dividing by the calcination factor (14.79/26.68 = 0.554 weight fraction of oxide in dried solids). The µCi/g waste oxides are then multiplied by the waste loading factor (0.0668) to give µCi/g glass. All of these operations can be combined into one factor (0.369), which multiplies the original waste analytical value (Table 5.3) to give the expected radionuclide content of the glass. Note for the elements in Table 6.7 for which definite values are available for both the expected and measured categories that their ratio is close to one, as expected, if the glass contained all of the waste radionuclides. The activity of 90Sr is present in the glass at 1.285E-1 µCi/g of glass. The factor of two difference between the measured and expected value for 90Sr is not explained at present. Assuming conservatively that the density of the glass is 2.7 g/cc, there are 3.47E-1 Ci of 90Sr in a cubic meter of glass. The requirement is that 90Sr be present in a quantity that is less than 20 Ci/m3. Hence, the concentration of 90Sr in the AZ-101 glass easily meets the requirement because it is about 58 times less concentrated. Less than 1.56 µg/g 99Tc was measured by ICP-MS in the AZ-101 glass or less than 4.212 g/m3, assuming a density of 2.7 g/cc for the glass. This is equivalent to less than 7.16E-2 Ci/m3. The requirement is that the glass contains less than 1.0E-1 Ci/m3 99Tc. The requirement is easily met being only 70% of the limit at the maximum.

6.11
Table 6.7. Expected and Measured Radionuclide Content in µCi/g of AZ-101 Glass
Isotope Expected(a)
µCi/g Measured(b)
µCi/g Ratio(c) 60Co 6.20E-6 <5E-6 n/a 63Ni 4.5E-5 <3E-3 n/a 90Sr 5.91E-2 1.285E-1 2.17 99Tc 3.44E-4 <2.65E-2 n/a 125Sb 3.68E-3 3.02E-3 0.821 126SnSb 8.23E-4 7.73E-4 0.939 137Cs 1.314E-2 1.27E-2 0.967 151Sm 1.247E-5 <8.E-4 n/a 238Pu 3.95E-7 <8E-5 n/a 239Pu 3.42E-6 <9E-5 n/a 241Pu 1.93E-5 <8.21E+0 n/a 241Am 2.49E-7 <2.E-5 n/a Total U (µg/g) <4.3E-3 10.67(d) n/a (a) This is the amount of activity expected to be included in the final glass
based on the waste content. (b) This is the measured concentration in the final glass. (c) This is the measured divided by the expected, which ideally should be one. (d) This uranium is believed to originate from the zircon batch mineral.
The activity of 137Cs measured in the glass is 1.27E-2 µCi/g of glass. This measured value is slightly less than the expected value, which is based on the contribution made by the AZ-101(B) LAW. Using the same conservative density (2.7 g/cc), AZ-101 glass contains 3.43E-2 Ci/m3 of 137Cs, which is about 87 times less than the maximum requirement of 3 Ci/m3. The TRU activity in the glass is required be less than 0.10 µCi/g (100 nCi/g). The sum total given in Table 6.8 is <4.6 ×10⁻⁴ µCi/g or <0.046 nCi/g. Hence, the requirement is met by a wide margin. Note that to estimate the total activity of all of the radioisotopes, those that are reported as “less than” in Table 6.8 were included at their “less than” value, so the 0.046 nCi/g total TRU is expected to be greater than the actual total for the glass.

6.12
Table 6.8. Measured or Calculated Activity (in µCi/g) of TRU Isotopes in the AZ-101 Glass(a)
TRU Isotope Activity µCi/g AZ-101 236Pu nd 237Np <2.2E-4 238Pu <8E-5 239Pu + 240Pu <9E-5 241Pu 1.93E-5 242Pu <3.3E-6 244Pu nd 241Am <2.E-5 242Cm <8.0E-6 243Am <7.5E-6 243Cm + 244Cm <8.0E-6 Maximum Total TRU Activity (a) <4.6E-4
(a)The values are based on mass spectrometry or direct radiological determination. MS values were used when radiological data were not available. Where the data gave only an upper limit, that value was used as the measured amount. nd = non-detect
6.3.2 Measured Dose Rates from LAW Glasses
The dose rates were measured on LAW glass fragments weighing from 2 to 13 grams by an RPL radiation control technician (RCT). The standard RCT instrument was used in the standard way to make these measurements. That means radiation rates were measured at about 5 and 30 cm distant from the glass fragment with the shield off and on. The shield allows gamma radiation to pass while blocking the beta component, so total and gamma radiation are measured directly and the beta component is the difference between the total and the gamma dose rates. Note that alpha radiation does not contribute to the dose rate because of its very short range and the very low content of alpha emitters in the glass. Table 6.9 gives the uncorrected and corrected dose rates normalized to mass measured on the four LAW glasses fabricated to date. The uncorrected values are the direct instrument reading while the corrected values are calculated from the uncorrected values. The correction is done by multiplying the uncorrected values by factors which take into account the geometric configuration of the sample and detection instrument as well as the counting efficiency of the instrument, which has been previously determined.
Table 6.9. Measured Dose Rates of ILAW Glasses at Contact
Uncorrected Corrected Sample ID Weight, g Beta mr/g Gamma mr/g Beta mr/g Gamma mr/g AP-101(a) 1.949 0.77 - 69 - AZ-101(b) 13.392 0.48 0.04 17 1.05 AN-107(C) 10.922 0.15 0.07 1 0.29 AW-101(d) 11.208 0.56 0.06 30 1.07 (a) AP-101 is described in RPP-WTP-092. (b) AZ-101 is described in RPP-WTP-106 (this report). (c) AN-107 is described in WTP-RPT -003. (d) AW-101 is described in WTP-RPT -003.

6.13
6.4 Crystalline and Noncrystalline Phases
Optical microscopy revealed transparent monoclinic crystals of augite (Figure 6.4). SEM micrographs (Figure 6.5) show that the dendrites of augite (the light gray crystals) nucleated on and branched from bubbles and spinel (the bright crystals). Spinel crystals formed at a higher temperature. As temperature decreased, spinel was slowly reacting with the surrounding melt to form pyroxene. Based on these visual inspections and XRD, the crystalline content of the glass was estimated to be less than 0.8 wt% and probably less than 0.5 wt%. The uncertainty in the amount arises from the heterogeneous distribution of the crystals as shown in Figures 6.4 and 6.5. Table 6.10 lists the compositions of spinel crystals as determined with EDS. Based on the average atomic fractions of the spinel-forming cations (Table 6.11), the following formula was obtained:
(Mg0.11Fe0.19Zn0.70)O·(Al0.05Cr0.79Fe0.19)2O3 It can also be written as
Mg0.11Fe0.19Zn0.70Al0.09Cr1.53Fe0.38O4. Hence, the bright crystals are mainly zincochromite (ZnCr2O4) in solid solution with spinel (MgAl2O4) and magnetite (Fe3O4). Table 6.12 lists the compositions of augite crystals as determined with EDS. Based on the average atomic fractions of cations, the following formula was obtained:
0.08Na2O·1.37(Mg0.49Ca0.81Zn0.07)O·0.21(Al0.04Cr0.005Fe0.17)2O3·2Si0.96Ti0.04O2. It can also be written as
Na0.08Ca0.81Mg0.49Zn0.07Al0.08Fe0.35Cr0.01Si1.92Ti0.08O6. Hence, the light gray crystals are mainly augite (Ca0.9Na0.1Mg0.9Fe2+
0.2Al0.4Ti0.1Si1.9O6) in solid solution with other pyroxenes. Because the fraction of crystalline phase in the CCC-treated AZ-101 sample was very low, the XRD analysis (see Figure 6.6) did not result in a sufficiently distinct pattern. Therefore, the suggested structures of minerals in the sample are subjected to a high uncertainty. A good fit was found for protoenstatite (MgSiO3) and aenigmatite (Na2Fe5TiSi6O20), a mineral rich in sodium (7.16 mass% Na2O). Its Na fraction of cations is 0.143 compared to 0.020 from EDS. Though sodium is an element that is usually underestimated in EDS analysis by approximately 10%, this possible error cannot account for the large difference in the Na2O content between stoichiometric aenigmatite and the crystals measured with EDS, which are most likely pyroxene.
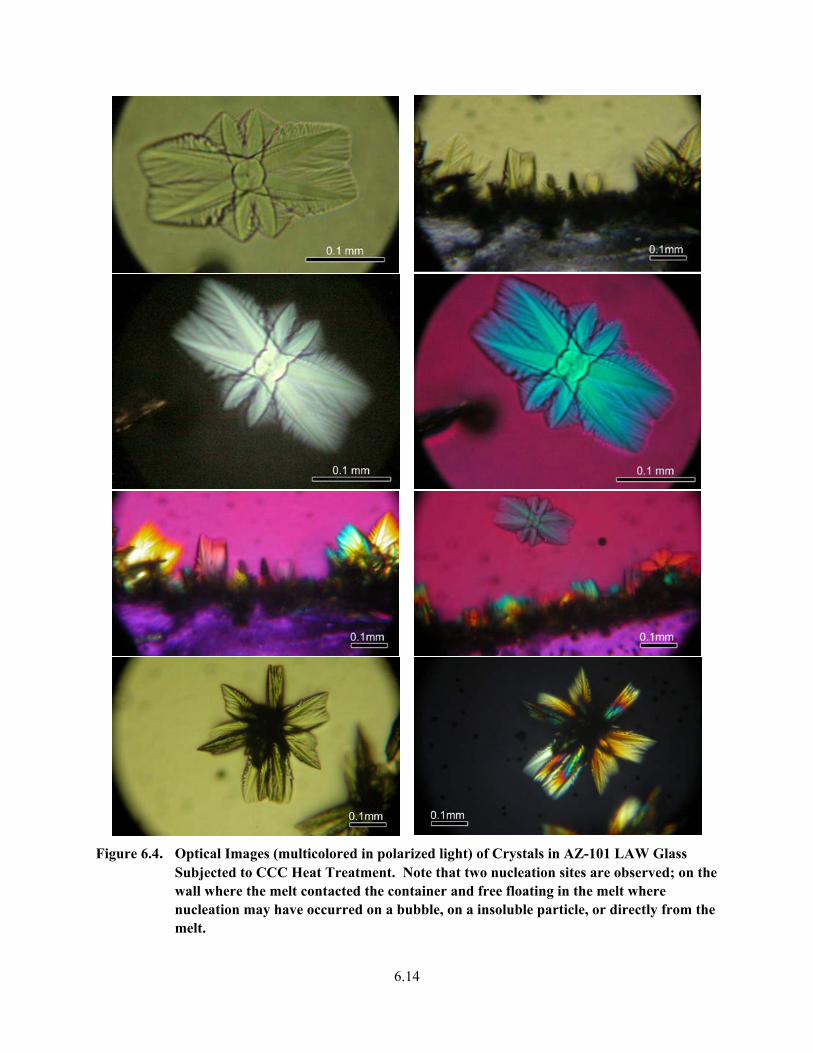
6.14
Figure 6.4. Optical Images (multicolored in polarized light) of Crystals in AZ-101 LAW Glass Subjected to CCC Heat Treatment. Note that two nucleation sites are observed; on the wall where the melt contacted the container and free floating in the melt where nucleation may have occurred on a bubble, on a insoluble particle, or directly from the melt.

6.15
Figure 6.5. SEM Micrographs of AZ-101 LAW Melt Subjected to CCC Heat Treatment
Platinum

6.16
Table 6.10. EDS Composition (in atomic fractions) of Spinel Crystals in AZ-101 LAW Melt Subjected to CCC Heat Treatment
Label O Na Mg Al Si Ca Ti Cr Fe Zn AZ-101eds01 0.535 0.006 0.017 0.015 0.001 0.001 0.001 0.224 0.107 0.093AZ-101eds17 0.498 0.015 0.016 0.018 0.081 0.013 0.003 0.195 0.069 0.093AZ-101eds19 0.537 0.007 0.015 0.007 0.002 0.004 0.001 0.243 0.069 0.116
Table 6.11. EDS Composition (in atomic fractions of spinel-forming cations) of Spinel Crystals in AZ-101 LAW Melt Subjected to CCC Heat Treatment
Mg Al Cr Fe Zn AZ-101eds01 0.04 0.03 0.49 0.24 0.20AZ-101eds17 0.04 0.05 0.50 0.18 0.24AZ-101eds19 0.03 0.01 0.54 0.15 0.26Average 0.04 0.03 0.51 0.19 0.23
Figure 6.6. XRD Pattern of AZ-101 LAW Glass Subjected to CCC Heat Treatment
Table 6.13 presents EDS data of the glass-matrix composition in the AZ-101 sample subjected to CCC heat treatment. Data numbered 23 to 30 were taken from the bulk glass (far from crystals); the rest of the data relate to glass near crystals. Bulk glass data are averaged and compared with the target composition in Table 6.14; for fair comparison, the EDS data were normalized to the sum of the mass fractions of the target components. Table 6.14 indicates that fractions of low-atomic-mass elements tend to be underestimated by EDS, whereas fractions of high-atomic-mass elements tend to be overestimated.
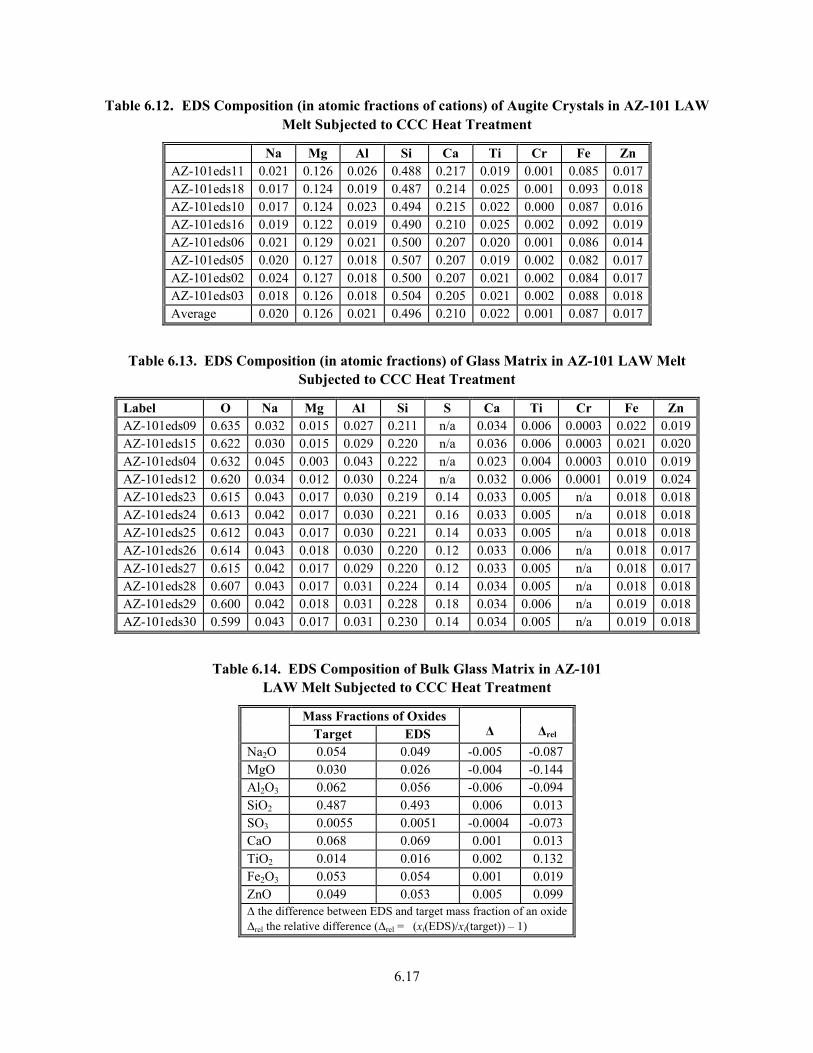
6.17
Table 6.12. EDS Composition (in atomic fractions of cations) of Augite Crystals in AZ-101 LAW Melt Subjected to CCC Heat Treatment
Na Mg Al Si Ca Ti Cr Fe Zn AZ-101eds11 0.021 0.126 0.026 0.488 0.217 0.019 0.001 0.085 0.017 AZ-101eds18 0.017 0.124 0.019 0.487 0.214 0.025 0.001 0.093 0.018 AZ-101eds10 0.017 0.124 0.023 0.494 0.215 0.022 0.000 0.087 0.016 AZ-101eds16 0.019 0.122 0.019 0.490 0.210 0.025 0.002 0.092 0.019 AZ-101eds06 0.021 0.129 0.021 0.500 0.207 0.020 0.001 0.086 0.014 AZ-101eds05 0.020 0.127 0.018 0.507 0.207 0.019 0.002 0.082 0.017 AZ-101eds02 0.024 0.127 0.018 0.500 0.207 0.021 0.002 0.084 0.017 AZ-101eds03 0.018 0.126 0.018 0.504 0.205 0.021 0.002 0.088 0.018 Average 0.020 0.126 0.021 0.496 0.210 0.022 0.001 0.087 0.017
Table 6.13. EDS Composition (in atomic fractions) of Glass Matrix in AZ-101 LAW Melt Subjected to CCC Heat Treatment
Label O Na Mg Al Si S Ca Ti Cr Fe Zn AZ-101eds09 0.635 0.032 0.015 0.027 0.211 n/a 0.034 0.006 0.0003 0.022 0.019AZ-101eds15 0.622 0.030 0.015 0.029 0.220 n/a 0.036 0.006 0.0003 0.021 0.020AZ-101eds04 0.632 0.045 0.003 0.043 0.222 n/a 0.023 0.004 0.0003 0.010 0.019AZ-101eds12 0.620 0.034 0.012 0.030 0.224 n/a 0.032 0.006 0.0001 0.019 0.024AZ-101eds23 0.615 0.043 0.017 0.030 0.219 0.14 0.033 0.005 n/a 0.018 0.018AZ-101eds24 0.613 0.042 0.017 0.030 0.221 0.16 0.033 0.005 n/a 0.018 0.018AZ-101eds25 0.612 0.043 0.017 0.030 0.221 0.14 0.033 0.005 n/a 0.018 0.018AZ-101eds26 0.614 0.043 0.018 0.030 0.220 0.12 0.033 0.006 n/a 0.018 0.017AZ-101eds27 0.615 0.042 0.017 0.029 0.220 0.12 0.033 0.005 n/a 0.018 0.017AZ-101eds28 0.607 0.043 0.017 0.031 0.224 0.14 0.034 0.005 n/a 0.018 0.018AZ-101eds29 0.600 0.042 0.018 0.031 0.228 0.18 0.034 0.006 n/a 0.019 0.018AZ-101eds30 0.599 0.043 0.017 0.031 0.230 0.14 0.034 0.005 n/a 0.019 0.018
Table 6.14. EDS Composition of Bulk Glass Matrix in AZ-101 LAW Melt Subjected to CCC Heat Treatment
Mass Fractions of Oxides Target EDS ∆ ∆rel
Na2O 0.054 0.049 -0.005 -0.087 MgO 0.030 0.026 -0.004 -0.144 Al2O3 0.062 0.056 -0.006 -0.094 SiO2 0.487 0.493 0.006 0.013 SO3 0.0055 0.0051 -0.0004 -0.073 CaO 0.068 0.069 0.001 0.013 TiO2 0.014 0.016 0.002 0.132 Fe2O3 0.053 0.054 0.001 0.019 ZnO 0.049 0.053 0.005 0.099 ∆ the difference between EDS and target mass fraction of an oxide ∆rel the relative difference (∆rel = (xi(EDS)/xi(target)) – 1)

6.18
6.5 PCT
Results of the analyses of 7-day PCT solutions from testing the CCC-treated AZ-101 glass are summarized in Table 6.15. Concentrations of elements were measured for AZ-101 LAW glass and for LRM standard glass, both in triplicate. Normalized elemental releases for the key elements are listed in Table 6.16. The measured normalized releases of the standard glass are in good agreement with reported values, except for lithium. The large error in the normalized Li release from the LRM glass is caused by its small content of Li, only 0.1 mass% compared to 4.3 mass% of Li in AZ-101 LAW glass. As expected, normalized boron, sodium, and lithium releases from AZ-101 LAW glass are close: 0.26 g/m2 for B, 0.11 g/m2 for Si, and 0.25 g/m2 for Na; all these values are well below the limit of 2.0 g/m2. One reason for performing the PCT on glasses that have partially crystallized is that the growth of the crystals can modify the composition of the glass in the neighborhood of the crystal and the modified glass composition can be less durable. Precipitation of the pyroxene crystals of the composition listed in Table 6.12 is an example where this phenomena has very little impact on the PCT release from the glass matrix. The impact is virtually zero because the composition of the crystalline phase is close to that of the glass. The calculated PCT normalized releases based on the model developed by Vienna et al. (2002) are listed in Table 6.17 for glasses with mass fractions of pyroxene crystals of the composition found in the glass and in the range from 0 to 15 mass%. The calculated release is plotted as a function of percent crystallinity in Figure 6.7 illustrating the fact that the pyroxene crystallization during the CCC heat treatment has not significantly affected the AZ-101 glass durability.

6.19
Table 6.15. 7-Day PCT Solution Analysis of AZ-101 LAW Glass Subjected to CCC Heat Treatment and LRM Glass.
Element AZ-101-C-90(a)
(mg/L) LAW-TP121-LRM-90(a)
(mg/L) B 16.7 15.7 15.8 26.1 26.4 25.8 Li 12.1 11.5 11.7 0.088 0.088 0.088 Na 21.2 20.0 20.2 163.0 165.0 162.0 Si 52.2 49.8 50.3 85.2 86.1 85.2 Ag n/a 0.007 n/a n/a n/a n/a Al 1.37 1.38 1.45 15.4 15.6 15.5 Ba 0.001 0.001 0.001 0.001 n/a n/a Ca 2.25 2.36 2.28 0.40 0.16 0.37 Co 0.005 0.007 n/a 0.009 0.008 0.009 Cr 0.062 0.059 0.071 0.378 0.379 0.386 Cu 0.010 0.013 0.011 0.013 0.012 0.013 Fe 0.283 0.362 0.391 2.910 2.860 2.930 K 1.2 1.7 1.5 4.0 3.9 3.6 Mg 0.180 0.290 0.300 0.120 0.110 0.094 Mn 0.007 0.008 0.009 0.157 0.145 0.149 Mo 0.033 0.040 0.032 0.253 0.257 0.247 Nd n/a 0.047 n/a n/a n/a n/a Ni 0.067 0.070 0.070 0.561 0.567 0.558 P 0.150 0.150 0.160 0.759 0.780 0.745 Pb 0.037 0.050 0.042 0.216 0.209 0.200 Rh n/a 0.051 n/a n/a n/a n/a Ru n/a 0.024 n/a n/a n/a n/a Sb 0.045 0.050 0.056 0.045 0.040 0.040 Se n/a 0.036 0.045 n/a n/a n/a Sn n/a 0.170 n/a n/a n/a n/a Sr n/a 0.002 n/a 0.002 n/a n/a Te n/a 0.052 n/a n/a n/a n/a Ti 0.007 0.011 0.012 0.156 0.157 0.158 Tl 0.022 0.023 n/a n/a n/a n/a V 0.041 0.040 0.039 0.007 0.006 0.006 W 0.083 0.098 0.090 n/a n/a n/a Zn 0.287 0.388 0.430 0.049 0.066 0.048 Zr n/a 0.006 0.007 1.720 1.750 1.730 (a) Analyses were performed in triplicate.

6.20
Table 6.16. Normalized 7-Day PCT Releases of AZ-101 LAW Glass Subjected to CCC Heat Treatment
Element AZ-101(a)
(g/m2) LAW-TP121-LRM-90(a)
(g/m2) 1 2 3 Average 1 2 3 Average Reported(b) ∆rel
(c)
B 0.27 0.25 0.25 0.26 0.52 0.53 0.52 0.52 0.59 -0.11Li 0.30 0.29 0.29 0.29 0.07 0.07 0.07 0.07 0.21 -0.65Na 0.26 0.25 0.25 0.25 0.55 0.55 0.54 0.55 0.57 -0.04Si 0.11 0.11 0.11 0.11 0.17 0.17 0.17 0.17 0.17 0.01(a) Analyses were performed in triplicate. (b) Values reported in WSRC-TR-99-00095. (c) ∆rel = Average/Reported – 1, note for LRM glass only.
Table 6.17. Calculated Compositions of Amorphous Matrices and PCT Releases for AZ-101 LAW Glass as Functions of Mass Fraction of Pyroxene Crystals (Vienna et al. 2002)
Glass with Crystals C(a) Crystal 0.000 0.020 0.040 0.060 0.080 0.100 0.150 bB,i bLi,i bNa,i Al2O3 0.011 0.090 0.091 0.093 0.095 0.097 0.099 0.104 -28.48 -28.87 -27.37B2O3 0.099 0.101 0.103 0.106 0.108 0.110 0.117 13.75 11.09 8.98CaO 0.225 0.054 0.051 0.047 0.043 0.039 0.035 0.024 -11.54 -7.37 -4.04F 0.000 0.000 0.000 0.000 0.000 0.000 0.000 15.96 24.63 11.99Fe2O3 0.047 0.120 0.122 0.123 0.125 0.126 0.128 0.133 -9.69 -10.01 -11.60K2O 0.002 0.003 0.003 0.003 0.003 0.003 0.003 8.06 2.93 11.81Li2O 0.018 0.019 0.019 0.019 0.020 0.020 0.022 9.06 9.00 7.18MgO 0.135 0.017 0.015 0.012 0.010 0.007 0.004 0.000 7.03 5.32 9.06Na2O 0.011 0.047 0.048 0.049 0.049 0.050 0.051 0.054 11.51 12.62 15.19P2O5 0.001 0.001 0.001 0.001 0.001 0.001 0.001 -24.52 -8.03 -19.35SiO2 0.530 0.416 0.413 0.411 0.408 0.406 0.403 0.395 -4.35 -3.94 -4.67SO3 0.006 0.006 0.007 0.007 0.007 0.007 0.007 75.52 n/a 49.95TiO2 0.023 0.016 0.016 0.016 0.015 0.015 0.015 0.015 -27.16 -20.20 -30.91ZnO 0.018 0.056 0.057 0.058 0.059 0.059 0.060 0.063 -3.51 14.49 -21.49ZrO2 0.056 0.057 0.058 0.059 0.060 0.062 0.065 -19.61 -18.66 -17.05Others 0.001 0.001 0.001 0.001 0.001 0.001 0.001 0.001 1.91 0.64 -1.99rB, g/m2 0.005 0.005 0.006 0.006 0.006 0.006 0.006 0.006 n/a n/a n/a rLi, g/m2 0.021 0.012 0.012 0.012 0.012 0.011 0.011 0.011 n/a n/a n/a rNa, g/m2 0.019 0.002 0.002 0.001 0.001 0.001 0.001 0.001 n/a n/a n/a (a) C is the mass fraction of crystals in glass ; rB, rLi, and rNa are normalized PCT releases of B, Li, and Na;
bB,i, bLi,i, and bNa,i are partial molar normalized PCT releases of B, Li, and Na.

6.21
0.000
0.002
0.004
0.006
0.008
0.010
0.012
0.014
0 0.05 0.1 0.15
Crystal mass fraction
Nor
mal
ized
rele
ase,
g/m
2
rB
rLi
rNa
Figure 6.7. Normalized PCT Releases Versus Crystallinity Fraction in AZ-101 LAW Glass
6.6 TCLP
Leachates from the TCLP test were analyzed for Sb, As, Ba, Be, B, Cd, Cr, Pb, Hg, Ni, Se, Ag, Tl, V, and Zn. The only elements detected in the TCLP leachates were Ba, B, Cr, Hg, and Zn. The CoPCs (Ba, Cr, Hg, and Zn) were all significantly below the UTS limit (Table 6.18). Thallium was detected by ICP-MS at 0.000113 mg/L while the MDL was stated to be 0.000013 mg/L, so this element is also present significantly below its UTS as shown in Table 6.18. Note that the elements that need to be beneath the UTS to meet Land Disposal Restrictions are indicated with an “×” in Table 6.18. All those elements meet the LDR. The blank-spike recovery values were within the acceptance criterion of 80% to 120% for all analytes. Both matrix-spike and post-spike recovery values were within the acceptance criterion of 75% to 125% for all analytes.

6.22
Table 6.18. Concentrations of TCLP Inorganic Constituents of Potential Concern (CoPC)
CAS# Element Symbol Required for LDR
ICP-AES(a)
(mg/L TCLP) MDL(b)
(mg/L) EQL(c)
(mg/L) 7440-36-0 Antimony Sb X 0.028 U 0.028 1.15 7440-38-2 Arsenic As VIT 0.045 U 0.045 5.0 7440-39-3 Barium Ba VIT 0.24 J 0.002 21 7440-41-7 Beryllium Be X 0.0002 U 0.0002 1.22 7440-42-8 Boron(d) B n/a 0.428 0.012 0.05 7440-43-9 Cadmium Cd VIT 0.006 U 0.006 0.11 18540-29-9 Chromium Cr VIT 0.008 J 0.004 0.6 7439-92-1 Lead Pb VIT 0.035 U 0.034 0.75 7439-97-6 Mercury Hg VIT 0.000049 J 0.000045 0.025 7440-02-0 Nickel Ni X 0.014 U 0.014 11 7782-49-2 Selenium Se VIT 0.042 U 0.042 1.0 7440-22-4 Silver Ag VIT 0.005 U 0.004 0.14 7440-28-0 Thallium Tl X 0.00011J 0.000013 0.20 7440-62-2 Vanadium V n/a 0.003 U 0.003 1.6 7440-66-6 Zinc Zn n/a 0.79 J 0.005 4.3 (a) Average of sample and duplicate; Hg was measured with CVAA; Tl was measured with ICP-MS; U (undetected), analyte had
no measurable instrument response, or response was <MDL. (b) MDLs were determined with dilute acidified water (2% HNO3) per ASO-QAP-001 and adjusted by the average sample
processing factor (~1.01). (c) Estimated quantitation limits (EQLs) were set equal to the Universal Treatment Standards (UTS); no specific EQLs have been
established for TCLP solutions; the EQL for B was specified in the ASR. (d) Boron is included for information only and is not a Constituent of Potential Concern. U = Undetected. Analyte was analyzed but not detected (e.g., no measurable instrument response), or response was less than the
MDL. J = Estimated value. Value is below EQL and above MDL. X = Required for LDR VIT = vitrification has been recognized as the best available technology for immobilizing these elements per 40 CFR 268.40. n/a = not applicable
6.7 Property Comparison of Actual and Simulated AZ-101 Waste, Melter
Feed and Glass
Table 6.19 through Table 6.23 list physical, chemical, and rheological properties for actual and simulated AZ-101 waste, melter feed, and glass. As Table 6.19 and Table 6.20 show, the actual and simulated wastes have similar pH values, the actual and simulated melter feed have similar bulk densities and the actual and simulated melter feed have similar Bingham model yield stresses . The shear-strength results indicate that the settled solids for the actual melter feed slurries can form a very cohesive layer that is difficult to shear. The 2.75 M Na sample possessed a shear strength that exceeded the scale of the viscometer. The top scale of the viscometer with the 1.6 × 1.6 cm (0.63 × 0.63 in.) shear vane is approximately 11,600 Pa (Poloski et al. 2003). Note that yield stress is a model fit parameter for a system undergoing shearing while shear strength is a direct measurement of the stress required to initiate shearing

6.23
and as indicated in Table 6.18 they can differ by several orders of magnitude. VSL data is from Muller and Pegg, 2003. Table 6.22 compares the PCT results for PNWD actual and VSL simulant AZ-101 ILAW. Both the PNWD actual and VSL simulant AZ-101 ILAW received a CCC heat treatment as described in Section 5.1.6. Variation of the normalized release rates between the VSL simulant AZ-101LAW glass and the PNWD actual AZ-101 LAW glass is within 0.03g/m2 for PCT method A. This degree of variation is only slightly higher than the experimental error (0.02 g/m2) observed between the triplicate samples of AZ-101 LAW glass by PNWD. Smith et al. (2000) provides similar test results for Envelope A and Envelope C glasses. First, it should be noted that the LRM glass gave close to the same leaching result in both sets of tests at 90°C indicating test conditions have been closely reproduced (Table 6.24). Table 6.25 compares the TCLP results for PNWD actual and VSL simulant AZ-101 LAW glasses. The PNWD actual AZ-101 LAW glass was quenched from melt while the VSL simulant AZ-101 LAW glass was given a CCC heat treatment. The TCLP results for the simulant AZ-101 LAW CCC glass and actual AZ-101 LAW quenched waste glass are very similar with the exception of Zn, which is approximately twice as high for the simulant AZ-101 LAW CCC waste glass.
Table 6.19. Properties of Actual and Simulant AZ-101 Waste at 2.75M Na
Property Actual (PNWD) Simulant (VSL)pH 13.4 at 25°C 13.21(a)
Density, g/mL 1.15 1.12 (a) Temperature not specified; it is assumed that the values
were obtained at room temperature.

6.24
Table 6.20. Properties of Actual and Simulant AZ-101 Melter Feed at 2.75M Na (Poloski et al. 2003) and (Muller and Pegg 2003)
Property Actual (PNWD)
at 25°C Simulant (VSL)(a) pH 7.5 7.38 Median volume PS (µm) 13.3 n/a 95% volume PSD, D95 (µm) 74 n/a Bulk density (g/mL) 1.736 1.71 Supernatant liquid density (g/mL) 1.171 n/a Settled solids (vol%) 73.8 n/a Centrifuged solids density (g/mL) 1.939 n/a Centrifuged solids (vol%) 73.7 n/a Centrifuged solids (mass% 82.4 n/a Total solid (mass%) 62.7 n/a Undissolved solids (mass%) 54.0 n/a Newtonian viscosity at 25°C (cP) 80 n/a Newtonian viscosity at 40°C (cP) 33 n/a Yield stress at 25° (Pa) 5.3 5.2
Shear strength at 40°C (Pa) >11600 n/a Glass components(c) (mass%) n/a n/a (a) Temperature not specified (it is assumed the values were obtained at room
temperature); Glass formulated to LAWB83; n/a = not available. (b) ND = not detected. (c) Glass components are oxides and halogens present in the glass.
Table 6.21. Properties of Actual and Simulant AZ-101 LAW Glass
Property Actual (PNWD) Simulant (VSL) Waste loading in glass (mass fraction) 0.0668 0.0667 Na2O mass fraction in waste oxides 0.8037 0.8051 Na2O mass fraction in glass 0.0557(a) 0.0603(b) Density (g/mL) n/a 2.75(c) (a) The best estimate based on Na2O2-NaOH fusion, KOH fusion, and acid digestion analyses. (b) X-ray fluorescence analysis. (c) LB83PNCC.
Table 6.22. Comparison of PCT Normalized Releases (in g/m2) Between Actual and Simulant AZ-101 CCC-Treated Glass
PNWD VSL(a) ∆CCC(b) ∆CCC,rel
(c) B 0.26 0.23 -0.03 -0.12 Li 0.29 n/a n/a n/a Na 0.25 0.23 -0.02 -0.08 Si 0.11 0.10 -0.01 -0.10 (a) Glass LB83PNCC (b) ∆CCC
is the difference between the VSL and PNWD-measured PCT normalized release.
(c) ∆CCC,rel is ∆CCC divided by the VSL-PNWD average.

6.25
Table 6.23. Comparison of Average 7-Day 90°C PCT Normalized Mass Loss Data Between VSL Non-Radioactive Simulant Glasses and Actual Radioactive LAW Glass Counterparts from this Study. LRM Data are Provided for Comparison Purposes.
Average 7-DAY 90ºC PCT Normalized Mass Loss (g/m2) Element Glass
B Na Si AZ-101 0.26 0.25 0.11 LB83PNCC 0.23 0.23 0.10 LRM 0.506 0.504 0.165 LAWA88 (simulant AW-101 glass) 0.434 0.426 0.171 AW-101 (leachate pH range = 10.27 – 10.33) 0.569 0.589 0.196 LAWC15 (simulant AN-107 glass) 0.329 0.335 0.161 AN-107 (leachate pH range = 10.02 – 10.05) 0.354 0.422 0.191 Note: ORP contract requirement from Specification 2, Section 2.2.2.17.2 requires that the normalized mass loss of the LAW waste glasses produced be < 2 g/m2.
Table 6.24. Durability of the LRM Glass Shown for the Two Different Studies
Standard LRM Glass (g/m2) This Study Smith et al. 2000B 0.52 0.506 Li 0.07 --- Na 0.55 0.504 Si 0.17 0.165
Table 6.25. Comparison of TCLP Results Between AZ-101 Actual and Simulant Glass in mg/L
Element UTS Actual Quenched
(PNWD) (mg/L TCLP) Simulated CCC
(VSL) (mg/L TCLP) Antimony Sb 1.15 <0.043 n/a Arsenic As <0.25 <0.045 <0.05 Barium Ba 21.00 0.24 <0.6 Beryllium Be 1.22 <0.0002 n/a Boron B 0.05 0.425 n/a Cadmium Cd 0.11 <0.006 <0.005 Chromium Cr 0.60 0.008 <0.006 Lead Pb 0.75 <0.034 <0.02 Mercury Hg 0.025 0.000085 n/a Nickel Ni 11 <0.014 <0.008 Selenium Se 5.70 <0.042 <0.05 Silver Ag 0.14 <0.004 <0.003 Thallium Tl 0.20 0.000113 n/a Vanadium V 1.6 <0.003 n/a Zinc Zn 4.30 0.79 1.64
7.1
7.0 Conclusions
The primary objective for vitrifying the AZ-101 LAW sample was to demonstrate the RPP-WTP project’s ability to satisfy the ILAW product ORP contract requirements concerning chemical and radionuclide reporting, waste loading, identification and quantification of crystalline and noncrystalline phases, and waste-form PCT and TCLP leachability. A pretreated tank supernatant was prepared as a melter feed for vitrification. The analyzed composition of the pretreated AZ-101 LAW was used by CUA VSL to formulate a target glass composition LAWB83. The supernatant tank sample, i.e., AZ-101 LAW, was processed through pretreatment chemical separation processes, and the decontaminated supernatant was mixed with mineral additives to be converted to LAW glass with acceptable properties. The primary success criteria associated with the LAW product requirements were all met: 1. Chemical constituents present in the glass at concentrations greater than 0.5 wt% are identified and
quantified. The AZ-101 LAW glass contains 12 constituent oxides with concentration >0.5 mass%. These oxides are (with best analytical estimates in mass%): SiO2 (48.70), B2O3 (10.04), CaO (6.79), Al2O3 (6.21), Na2O (5.35), Fe2O3 (5.29), ZnO (4.85), Li2O (4.31), ZrO2 (3.17), MgO (2.99), TiO2 (1.40), and SO3 (0.51). [2.2.2.6.1 Chemical Composition Qualification clause Section C from WTP Contract- DE-AC27-01RV1413 Modification No. M033]
2. Key radionuclides are identified and quantified. Identification and quantification of those radionuclides identified as significant in NUREG/BR-0204 and 49 CFR 172.101. The date of analysis is given Table 6.6 and allows the values reported to be indexed to any date desired. Technetium-99 is considered significant at concentrations >3.0E-3 Ci/m3. Assuming that the density of the glass is 2.7 g/mL, the AZ-101 glass contains a maximum of 9.29E-4 Ci/m3 of 99Tc. Hence, this glass does not contain a significant quantity of 99Tc. [2.2.2.7 Radiological Composition Documentation clause Section C from WTP Contract- DE-AC27-01RV1413 Modification No. M033]
3. The activities of radionuclides in the ILAW product are: 137Cs <3 Ci/m3or<0.3 Ci/m3(see note below), 90Sr<20 Ci/m3, 99Tc <0.1 Ci/m3, and transuranic (TRU) <100 nCi/g. The AZ-101 LAW glass contains 90Sr, 99Tc, 137Cs, and TRU at levels considerably below the contract limits as shown in the Table 7.1. [2.2.2.8 Radionuclide Concentration Limitations clause Section C from WTP Contract- DE-AC27-01RV1413 Modification No. M033]. Note C.7 FACILITY SPECIFICATION, subheading d)Waste Treatment and Immobilization Plant Unit Operation from WTP Contract- DE-AC27-01RV1413 Modification No. M033]: specifies “In addition, 137Cs will be further removed, to achieve a 0.3 Ci/m3 in the ILAW product, to facilitate the maintenance concept established for the ILAW melter system.”

7.2
Table 7.1. Summary of Radiochemical Results Showing Contract Compliance for Waste Glass
Radionuclide Contract Limit Based on Measured
Value Ratio –Contract Limit
to Measured Value 90Sr 20 Ci/m3 0.347 Ci/m3 58 99Tc 0.1 Ci/m3 7.16E-2 Ci/m3 1.4 137Cs 3 Ci/m3or 0.3 Ci/m3 3.43E-2 Ci/m3 87 or 8.7 TRU 100 nCi/g 0.046 nCi/g 2174
4. The fraction of Na2O from LAW for Envelope B in the glass is >5 mass%.
The measured Na2O mass fraction in the AZ-101 LAW glass is 5.58 mass%. Hence, the AZ-101 LAW glass meets the task specification concentration. [2.2.2.2 Waste Loading from WTP Contract- DE-AC27-01RV1413 Modification No. M033]: The loading of waste sodium from Envelope A in the ILAW glass shall be greater than 14 weight percent based on Na2O. The loading of waste sodium from Envelope B in the ILAW glass shall be greater than 3.0 weight percent based on Na2O. The loading of waste sodium from Envelope C in the ILAW glass shall be greater than 10 weight percent based on Na2O. The loading of waste sodium for waste from double shelled tank (DST) AZ-102 shall be greater than 3.0 weight percent based upon Na2O.]
5. Crystalline and non-crystalline phases are identified and quantified. The AZ-101 LAW glass subjected to CCC contained sporadic crystals of spinel (mainly zincochromite) and augite of a similar composition to the glass. The estimated total in the glass was <0.8 wt%. [2.2.2.6.3 Crystalline Phase Identification from WTP Contract- DE-AC27-01RV1413 Modification No. M033]: The ILAW Product Qualification Report (Table C.5-1.1, Deliverable 6.6) shall provide the crystalline and non-crystalline phases expected to be present and the estimated amount of each phase for the waste form and filler material.]
6. The 7-day PCT normalized mass loss of Na, Si, and B <2.0 g/m2 (at 90oC). The measured normalized PCT releases from the AZ-101 LAW glass are 0.26 g/m2 for B, 0.11 g/m2 for Si, and 0.25 g/m2 for Na. These values are well below the limit of 2.0 g/m2. The precipitation of crystals on cooling apparently does not affect glass leachability. [2.2.2.17.2 Product Consistency Test from WTP Contract- DE-AC27-01RV1413 Modification No. M033]: The normalized mass loss of sodium, silicon, and boron shall be measured using a seven day product consistency test run at 90°C as defined in ASTM C1285-98.]
7. The glass meets the Land Disposal Restrictions (LDR) of Washington Dangerous Waste Regulations, WAC 173-303, and RCRA LDR in 40 CFR 268 (TCLP for hazardous inorganics). The AZ-101 LAW glass passed the TCLP test and qualifies for land disposal. [2.2.2.20 Dangerous Waste Limitations from WTP Contract- DE-AC27-01RV1413 Modification No. M033]: The ILAW product shall be acceptable for land disposal under the State of Washington Dangerous Waste Regulations, WAC 173-303, and RCRA LDR in 40CFR268.]
The ILAW product testing results show that the AZ-101 LAW glass meets or exceeds ORP contract specifications for waste loading, chemical composition documentation, radionuclide concentration limitations, and waste-form leachability.

7.3

Appendix A
Radiochemistry Summary for AZ-101 Glass

A.1
Appendix A: Radiochemistry Summary for AZ-101 Glass
Table A.1. Radiochemistry Summary for AZ-101 Glass
Measured Activity µCi/g
Radionuclide MeasuredRadiation
Proc. Blank Sample ±1σ(%)*
RSD %
60Co γ nr <5E-6 nr nr 63Ni β nr <3E-3 nr nr 79Se β nr <3.3E-3 nr nr 90Sr β <3E-3 1.285E-1 3 3.4 95Nb γ nr <5E-6 nr nr 99Tc(a) γ nr <2.65E-2 nr nr 113Sn γ nr <3E-5 nr nr 125Sb γ nr 3.02E-3 3 nr 126SnSb γ nr 7.73E-4 5 nr 134Cs γ nr <7E-6 nr nr 137Cs γ nr 1.27E-2 nr nr 144Ce γ nr <2E-4 nr nr 151Sm β nr <8E-4 nr nr 152Eu γ nr <2E-5 nr nr 154Eu γ nr <2E-5 nr nr 155Eu γ nr <8E-5 nr nr 232Th γ nr <4E-5 nr nr 238Pu α nr <8E-5 nr nr 239Pu + 240Pu α nr <9E-5 nr nr 241Pu β nr <8E-0 nr nr 241Am α nr <2E-5 nr nr 242Cm α nr <7E-6 nr nr 243Cm + 244Cm α nr <7.5E-6 nr nr Total U ICP-AES 10.67µg/g nr = not reported Note: Table includes only those radioisotopes for which values were reported * ±1σ(%) is the probability that the true value does not differ from the reported value by more than the given percent.

Appendix B
ICP Mass Spectrometry Summary for AZ-101 Pretreated Waste
B.1
Appendix B: ICP Mass Spectrometry Summary for AZ-101 Pretreated Waste
Table B1. ICP Mass Spectrometry Summary for AZ-101 Pretreated Waste
Element Concentrationµg/g (*µCi/g) ±1 Sigma
MDL µg/g
Tc-99 9.44E-02 4.39E-03 7.15E-03 Tc(dup) <7.15E-02 n/a n/a Pd-105 4.66E00 1.95E-02 1.11E-01 Pd (dup) 4.19E00 1.22E-03 1.11E-01 Ru-101 1.89E00 1.07E-02 9.01E-03 Ru (dup) 1.83E00 6.09E-04 9.01E-03 Ru-102 8.85E-01 3.14E-03 6.77E-03 Ru (dup) 8.61E-01 5.96E-04 6.77E-03 Rh-103 2.17E00 9.67E-03 5.21E-03 Rh (dup) 2.10E00 5.66E-04 5.21E-03 I-129* <2.94E-06 n/a <1.03E-06 Cs-133 <2.53E-01 n/a <2.53E-02 Cs (dup) <2.53E-01 n/a <2.53E-02 Pr-141 <7.09E-01 n/a <7.09E-02 Pr (dup) <7.09E-01 n/a <7.09E-02 Ta-181 <4.67E-02 n/a <4.67E-03 Ta(dup) <4.67E-02 n/a <4.67E-03 Pt-195 <1.22E-01 n/a <1.22E-02 Pt (dup) <1.22E-01 n/a <1.22E-02 U <1.16E-02 n/a <1.16E-03 U (dup) <1.16E-02 n/a <1.16E-03 U-233 <9.56E-06 n/a <9.56E-07 U(dup) <9.56E-06 n/a <9.56E-07 U-234 <2.06E-06 n/a <2.06E-07 U(dup) <2.06E-06 n/a <2.06E-07 U-235 <4.07E-09 n/a <4.07E-10 U(dup) <4.07E-09 n/a <4.07E-10 U-236 <1.58E-08 n/a <1.58E-09 U(dup) <1.58E-08 n/a <1.58E-09 U-238 <8.12E-09 n/a <8.12E-10 U(dup) <8.12E-09 n/a <8.12E-10 Pu-239 <1.62E-02 n/a <1.62E-03 Pu(dup) <1.62E-02 n/a <1.62E-03 Pu-240 <1.17E-03 n/a <1.17E-04 Pu(dup) <1.17E-03 n/a <1.17E-04 Pu-242 <8.42E-07 n/a <8.42E-08 Pu(dup) <8.42E-07 n/a <8.42E-08 Mass241 <6.66E-04 n/a <6.66E-05 Mass(dup) <6.66E-04 n/a <6.66E-05 * µCi/L n/a = not applicable

Appendix C
ICP Mass Spectrometry Summary for AZ-101 Glass

C.1
Appendix C: ICP Mass Spectrometry Summary for AZ-101 Glass
Table C.1. Mass Spectrometry Results for AZ-101 Glass (µg/g)
Isotope K Fusion ± 1σ MDL QC Status 99Tc <1.56E-0 n/a 1.56E-0 OK
109Ag 1.34E+1 1.7E-1 7.93E-2 OK 111Cd 3.84E+1 2.7E-1 1.7E-0 OK 121Sb <2.20E-0 n/a 2.20E-0 OK
129I <9.91E-0 n/a 9.91E-0 OK 205Tl <2.59E-0 n/a 2.59E-0 OK 208Pb <8.69E+1 n/a 8.69E+1 OK 233U <7.98E-2 n/a 7.98E-2 OK 234U <1.31E-1 n/a 1.31E-1 OK 235U 1.71E-1 1.3E-2 1.22E-1 OK 236U <6. 20E-2 n/a 6.20E-2 OK
237Np <3.11E-1 n/a 3.11E-1 OK 238U 1.05E+1 5.8E-1 1.56E-0 OK
239Pu <2.20E-2 n/a 2.20E-2 OK 240Pu <8.38E-4 n/a 8.38E-4 OK 241Pu/ 241Am
<7.97E-2 n/a 7.97E-2 OK
242Pu <8.38E-4 n/a 8.38E-4 OK n/a = not applicable
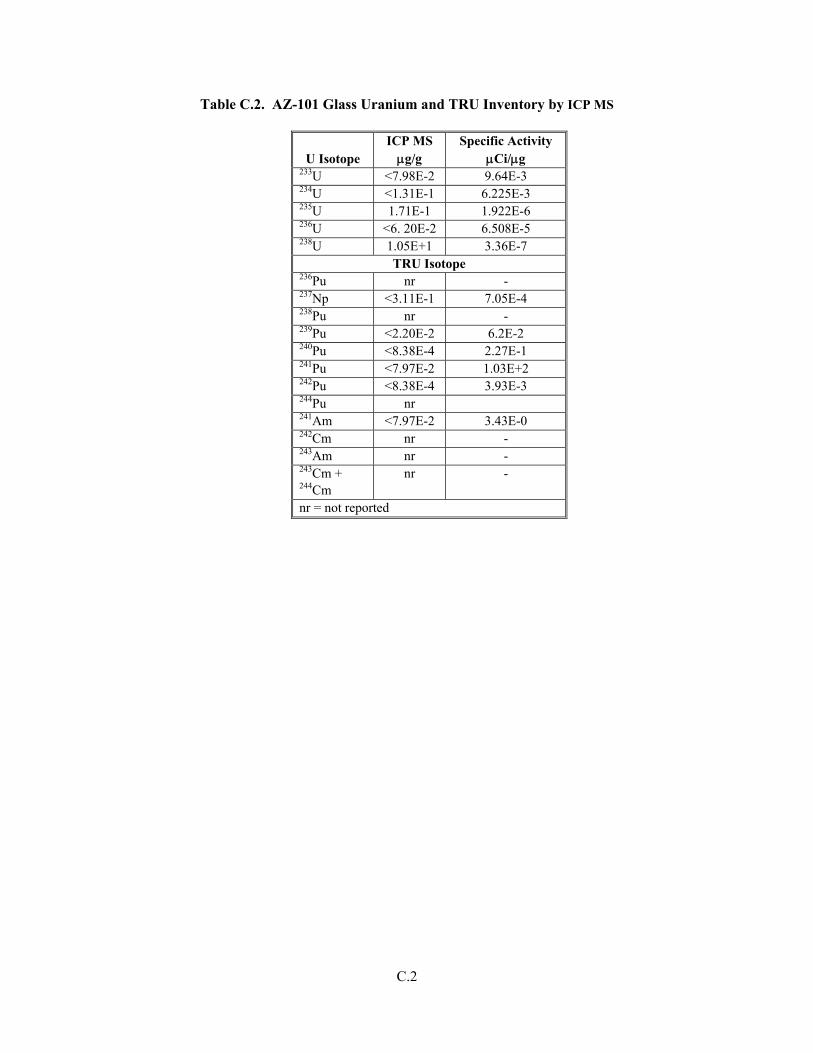
C.2
Table C.2. AZ-101 Glass Uranium and TRU Inventory by ICP MS
U Isotope ICP MS µg/g
Specific Activity µCi/µg
233U <7.98E-2 9.64E-3 234U <1.31E-1 6.225E-3 235U 1.71E-1 1.922E-6 236U <6. 20E-2 6.508E-5 238U 1.05E+1 3.36E-7
TRU Isotope 236Pu nr - 237Np <3.11E-1 7.05E-4 238Pu nr - 239Pu <2.20E-2 6.2E-2 240Pu <8.38E-4 2.27E-1 241Pu <7.97E-2 1.03E+2 242Pu <8.38E-4 3.93E-3 244Pu nr 241Am <7.97E-2 3.43E-0 242Cm nr - 243Am nr - 243Cm + 244Cm
nr -
nr = not reported

Appendix D
VSL Batch Sheet for AZ-101(B) Waste Glass LAWB83 Muller, Isabelle S., and Ian L. Pegg. 2003. “LAW Glass Formulation to Support AZ-101 Actual Waste Testing”. VSL-03R3470-3. Vitreous State Laboratory, The Catholic University of America for Duratek, Inc. and Bechtel National, Inc.
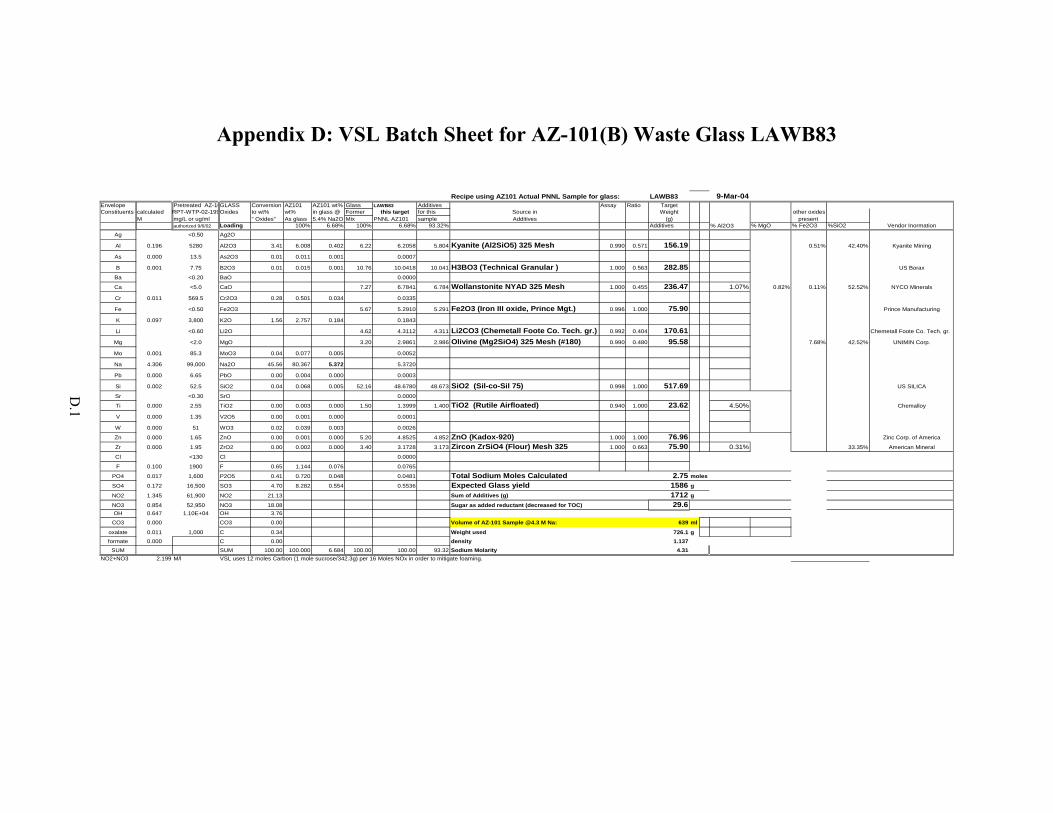
D.1
Appendix D: VSL Batch Sheet for AZ-101(B) Waste Glass LAWB83
Recipe using AZ101 Actual PNNL Sample for glass: LAWB83 9-Mar-04
Envelope Pretreated AZ-10GLASS Conversion AZ101 AZ101 wt% Glass LAWB83 Additives Assay Ratio TargetConstituents calculated RPT-WTP-02-199Oxides to wt% wt% in glass @ Former this target for this Source in Weight other oxides
M mg/L or ug/ml " Oxides" As glass 5.4% Na2O Mix PNNL AZ101 sample Additives (g) present authorized 9/6/02 Loading 100% 6.68% 100% 6.68% 93.32% Additives % Al2O3 % MgO % Fe2O3 %SiO2 Vendor Inormation
Ag <0.50 Ag2O
Al 0.196 5280 Al2O3 3.41 6.008 0.402 6.22 6.2058 5.804 Kyanite (Al2SiO5) 325 Mesh 0.990 0.571 156.19 0.51% 42.40% Kyanite Mining
As 0.000 13.5 As2O3 0.01 0.011 0.001 0.0007
B 0.001 7.75 B2O3 0.01 0.015 0.001 10.76 10.0418 10.041 H3BO3 (Technical Granular ) 1.000 0.563 282.85 US Borax
Ba <0.20 BaO 0.0000
Ca <5.0 CaO 7.27 6.7841 6.784 Wollanstonite NYAD 325 Mesh 1.000 0.455 236.47 1.07% 0.82% 0.11% 52.52% NYCO Minerals
Cr 0.011 569.5 Cr2O3 0.28 0.501 0.034 0.0335
Fe <0.50 Fe2O3 5.67 5.2910 5.291 Fe2O3 (Iron III oxide, Prince Mgt.) 0.996 1.000 75.90 Prince Manufacturing
K 0.097 3,800 K2O 1.56 2.757 0.184 0.1843
Li <0.60 Li2O 4.62 4.3112 4.311 Li2CO3 (Chemetall Foote Co. Tech. gr.) 0.992 0.404 170.61 Chemetall Foote Co. Tech. gr.
Mg <2.0 MgO 3.20 2.9861 2.986 Olivine (Mg2SiO4) 325 Mesh (#180) 0.990 0.480 95.58 7.68% 42.52% UNIMIN Corp.
Mo 0.001 85.3 MoO3 0.04 0.077 0.005 0.0052
Na 4.306 99,000 Na2O 45.56 80.367 5.372 5.3720
Pb 0.000 6.65 PbO 0.00 0.004 0.000 0.0003
Si 0.002 52.5 SiO2 0.04 0.068 0.005 52.16 48.6780 48.673 SiO2 (Sil-co-Sil 75) 0.998 1.000 517.69 US SILICA
Sr <0.30 SrO 0.0000
Ti 0.000 2.55 TiO2 0.00 0.003 0.000 1.50 1.3999 1.400 TiO2 (Rutile Airfloated) 0.940 1.000 23.62 4.50% Chemalloy
V 0.000 1.35 V2O5 0.00 0.001 0.000 0.0001
W 0.000 51 WO3 0.02 0.039 0.003 0.0026
Zn 0.000 1.65 ZnO 0.00 0.001 0.000 5.20 4.8525 4.852 ZnO (Kadox-920) 1.000 1.000 76.96 Zinc Corp. of America
Zr 0.000 1.95 ZrO2 0.00 0.002 0.000 3.40 3.1728 3.173 Zircon ZrSiO4 (Flour) Mesh 325 1.000 0.663 75.90 0.31% 33.35% American Mineral
Cl <130 Cl 0.0000
F 0.100 1900 F 0.65 1.144 0.076 0.0765
PO4 0.017 1,600 P2O5 0.41 0.720 0.048 0.0481 Total Sodium Moles Calculated 2.75 moles
SO4 0.172 16,500 SO3 4.70 8.282 0.554 0.5536 Expected Glass yield 1586 g
NO2 1.345 61,900 NO2 21.13 Sum of Additives (g) 1712 g
NO3 0.854 52,950 NO3 18.08 Sugar as added reductant (decreased for TOC) 29.6OH 0.647 1.10E+04 OH 3.76
CO3 0.000 CO3 0.00 Volume of AZ-101 Sample @4.3 M Na: 639 ml
oxalate 0.011 1,000 C 0.34 Weight used 726.1 gformate 0.000 C 0.00 density 1.137
SUM SUM 100.00 100.000 6.684 100.00 100.00 93.32 Sodium Molarity 4.31NO2+NO3 2.199 M/l VSL uses 12 moles Carbon (1 mole sucrose/342.3g) per 16 Moles NOx in order to mitigate foaming.

Appendix E
TCLP Results for AZ-101 Envelope B Glass
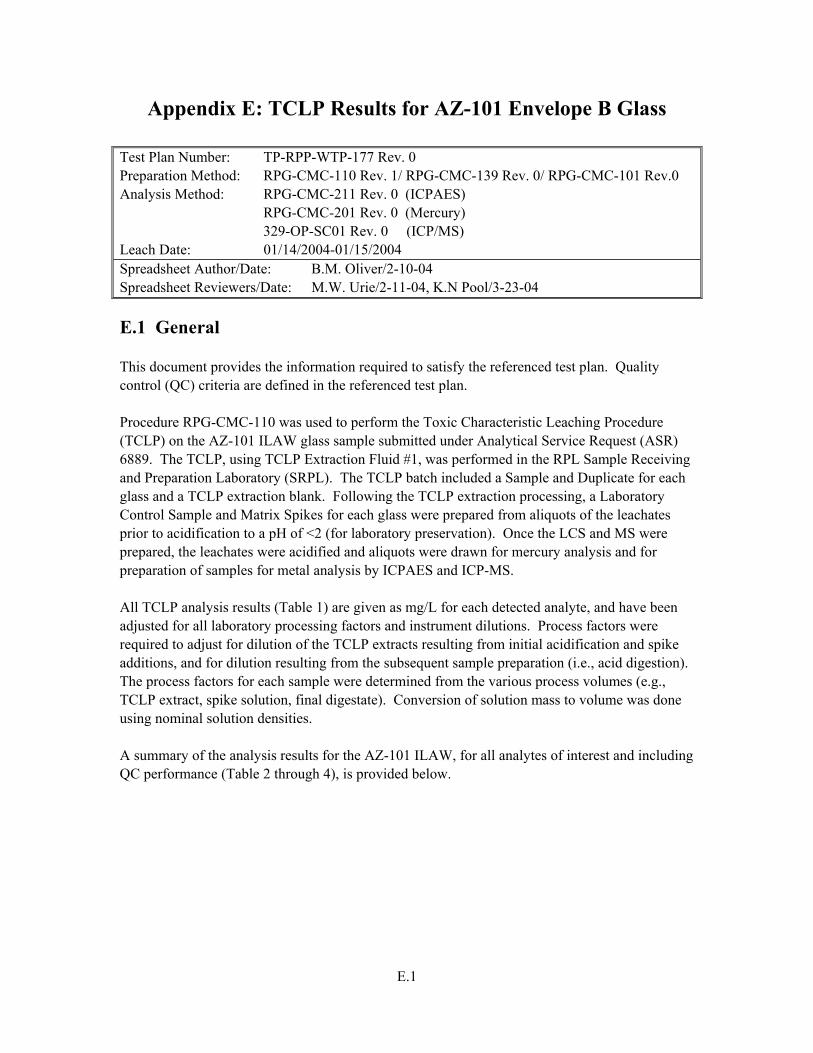
E.1
Appendix E: TCLP Results for AZ-101 Envelope B Glass
Test Plan Number: TP-RPP-WTP-177 Rev. 0 Preparation Method: RPG-CMC-110 Rev. 1/ RPG-CMC-139 Rev. 0/ RPG-CMC-101 Rev.0 Analysis Method: RPG-CMC-211 Rev. 0 (ICPAES) RPG-CMC-201 Rev. 0 (Mercury) 329-OP-SC01 Rev. 0 (ICP/MS) Leach Date: 01/14/2004-01/15/2004 Spreadsheet Author/Date: B.M. Oliver/2-10-04 Spreadsheet Reviewers/Date: M.W. Urie/2-11-04, K.N Pool/3-23-04
E.1 General This document provides the information required to satisfy the referenced test plan. Quality control (QC) criteria are defined in the referenced test plan. Procedure RPG-CMC-110 was used to perform the Toxic Characteristic Leaching Procedure (TCLP) on the AZ-101 ILAW glass sample submitted under Analytical Service Request (ASR) 6889. The TCLP, using TCLP Extraction Fluid #1, was performed in the RPL Sample Receiving and Preparation Laboratory (SRPL). The TCLP batch included a Sample and Duplicate for each glass and a TCLP extraction blank. Following the TCLP extraction processing, a Laboratory Control Sample and Matrix Spikes for each glass were prepared from aliquots of the leachates prior to acidification to a pH of <2 (for laboratory preservation). Once the LCS and MS were prepared, the leachates were acidified and aliquots were drawn for mercury analysis and for preparation of samples for metal analysis by ICPAES and ICP-MS. All TCLP analysis results (Table 1) are given as mg/L for each detected analyte, and have been adjusted for all laboratory processing factors and instrument dilutions. Process factors were required to adjust for dilution of the TCLP extracts resulting from initial acidification and spike additions, and for dilution resulting from the subsequent sample preparation (i.e., acid digestion). The process factors for each sample were determined from the various process volumes (e.g., TCLP extract, spike solution, final digestate). Conversion of solution mass to volume was done using nominal solution densities. A summary of the analysis results for the AZ-101 ILAW, for all analytes of interest and including QC performance (Table 2 through 4), is provided below.

E.2
E.2 Sample Analysis Results
Table E.1. TCLP Sample Results
CAS # Constituent Sample Result
(mg/L)(1)
Duplicate Result
(mg/L)(1) MDL(1) (mg/L)
EQL(2) (mg/L)
7440-36-0 Antimony 0.028 U 0.028 U 0.028 1.15 7440-38-2 Arsenic 0.045 U 0.045 U 0.045 5.0 7440-39-3 Barium 0.24 J 0.24 J 0.002 21 7440-41-7 Beryllium 0.0002 U 0.0002 U 0.0002 1.22 7440-42-8 Boron 0.428 0.421 0.012 0.05 7440-43-9 Cadmium 0.006 U 0.006 U 0.006 0.11 18540-29-9 Chromium 0.008 J 0.007 J 0.004 0.6 7439-92-1 Lead 0.035 U 0.035 U 0.035 0.75 7439-97-6 Mercury 0.000049 J 0.00012 J 0.000045 0.025 7440-02-0 Nickel 0.014 U 0.014 U 0.014 11 7782-49-2 Selenium 0.042 U 0.042 U 0.042 1.0 7440-22-4 Silver 0.005 U 0.005 U 0.005 0.14 7440-28-0 Thallium 0.00011J 0.00010J 0.000013(3) 0.20 7440-62-2 Vanadium 0.003 U 0.003 U 0.003 1.6 7440-66-6 Zinc 0.79 J 0.79 J 0.005 4.3 U = Undetected. Analyte was analyzed but not detected (e.g., no measurable instrument response), or response was
less than the MDL. J = Estimated value. Value is below EQL and above MDL. (1) MDLs determined per Quality Assurance Plan ASO-QAP-001 Rev. 1 and adjusted by the average sample
processing factors. (2) As no specific EQL’s have been established for TCLP solutions, the estimated quantitation limits (EQL) were set
equal to the Universal Treatment Standards (UTS) for TCLP analyses or to the quantitation limit specified in the ASR if no UTS value is specified.
(3) The ICP/MS MDL was determined for each analytical run using 3 standard blank solutions which were evaluated throughout the analytical run.
E.2.1 ICPAES and ICP-MS Analysis Acid digestion of the TCLP extract solutions was done per procedure RPG-CMC-139 using from 40 to 45 mL of the acidified TCLP extract. Procedure RPG-CMC-139 includes two digestion options, one using nitric and hydrochloric acids and the other using nitric acid alone; samples were prepared using both digestion options. Metals analysis of the acid digested samples was performed per procedure RPG-CMC-211 (ICPAES) and 329-OP-SC01 (ICP-MS). ICPAES results for Ag and Sb are from the nitric acid digests; the results for As, B, Ba, Be, Cd, Cr, Ni, Pb, Se, V, and Zn are from the combined nitric and hydrochloric acid digests. ICP-MS analysis was performed for thallium only.

E.3
E.2.2 Mercury Analysis Acid digestion of the TCLP extract solutions was done per procedure RPG-CMC-131 using approximately 1.5 mL of the acidified TCLP extract. The samples were analyzed per procedure RPG-CMC-201.
E.3 Quality Control Criteria E.3.1 Preparation Blank (PB) and Laboratory Control Sample (LCS) Results
Table E.2. Preparation Blank (PB) and Laboratory Control Sample (LCS) Results
PB success Criteria: <EQL LCS Success Criteria: 75%-125%
Recovery
Analyte
Success Criteria (EQL) mg/L
Prep Blank Results
mg/L
Expected Spike Cone
mg/L
LCS/BS Results mg/L
Recovery(a)
(%) Antimony 1.15 0.028 U 2.21 2.26 102 Arsenic 5.0 0.045 U 3.10 3.09 J 100 Barium 21 0.20 J 2.21 2.38 J 98 Beryllium 1.22 0.0002 U 1.11 1.08 J 97 Boron 0.05 0.049 J 8.86 8.90 100 Cadmium 0.11 0.020 J 1.11 1.08 96 Chromium 0.6 0.005 J 2.21 2.27 102 Lead 0.75 0.035 U 1.33 1.38 104 Mercury 0.025 0.000045 U 0.00260 0.00208 80(b)
Nickel 11 0.019 J 4.43 4.57 J 103 Selenium 1.0 0.042 U 1.77 1.78 100 Silver 0.14 0.005 U 0.664 0.649 98 Thallium 0.20 0.00027J 3.10 3.38 109 Vanadium 1.6 0.003 U 2.21 2.07 93 Zinc 4.3 0.27 J 4.43 4.80 102 (a) LCS/BS recoveries have been corrected for contribution of analyte concentration
in the preparation blank. (b) No acceptance criteria provided for mercury analysis.
E.3.2 Process Blank
ICPAES (Metals, except Hg and Tl)
A process blank was prepared for each digestion option from a portion of the acidified TCLP extraction blank. The concentration of all analytes of interest in both process blanks was within the acceptance criteria of <EQL or ≤ 5% of the concentration in the samples.

E.4
Mercury Analysis
A process blank was prepared from a portion of the TCLP extraction blank. The concentration of Mercury in both process blanks was within the acceptance criteria of <EQL or ≤ 5% of the concentration in the samples.
ICP-MS (Tl only)
A process blank was prepared from a portion of the TCLP extraction blank. The concentration of Thallium in the process blank was within the acceptance criteria of <EQL or ≤ 5% of the concentration in the samples.
E.3.3 Laboratory Control Sample (i.e., Blank Spike):
Two blank spikes were prepared (one for each digestion option) by addition of 0.2 mL of multi-element spike solution INT-QC-TCLP-A (containing all analytes of interest except B, Cu, Sb, Tl, and Hg) combined with 0.2 mL each of separate spike solutions containing boron, copper, antimony, and thallium (Tl analyzed by ICP-MS). A mercury spike solution was added to only one of the blank spike preparations.
ICPAES (Metals, except Hg and Tl)
The recovery values for both digestions were within the success criterion for all analytes.
Mercury Analysis
Although the blank spike mercury recovery was on the low side, the recovery value was within the success criterion defined by the QA Plan; the test plan defined no success criterion for mercury. An additional laboratory control sample (NIST SRM 1641d) digested and analyzed with the TCLP extract samples, but not prepared from the TCLP blank extract, demonstrated excellent recovery at 97%.
ICP-MS (Tl only)
The recovery value for the digestion was within the success criteria.

E.5
E.4 Matrix Spike (MS) Results
Table E.3. Matrix Spike (MS) Results
Matrix Spike success criteria: 75%-125%
Analyte
Expected Spike Conc.
(mg/L)
Original Sample Results (mg/L)
Matrix Spike
(mg/L) Recovery
(%)(a) Antimony 1.11 0.028 U 1.13 J 102 Arsenic 1.55 0.045 U 1.56 J 101 Barium 1.11 0.24 J 1.32 J 97 Beryllium 0.553 0.0002 U 0.53 J 96 Boron 4.43 0.428 4.82 99 Cadmium 0.549 0.006 U 0.531 96 Chromium 1.10 0.01 J 1.14 102 Lead 0.664 0.035 U 0.68 J 103 Mercury 0.00131 0.000049 J 0.000819 62(b)
Nickel 2.21 0.014 U 2.28 J 103 Selenium 0.885 0.042 U 0.91 J 103 Silver 0.332 0.005 U 0.320 96 Thallium 1.549 0.00011J 1.41 91 Vanadium 1.11 0.003 U 1.03 J 93 Zinc 2.21 0.79 J 3.03 J 101 (a) MS recoveries have been corrected for contribution of analyte concentration in
the preparation blank. (b) No acceptance criteria provided for mercury analysis.
Two matrix spikes were prepared for the AZ-101 sample (one matrix spike for each sample for each digestion option) in the same manner as the blank spike except that 0.1 mL of each spike component was used. Again, a mercury spike solution was added to only one matrix spike preparation for each sample.
ICPAES (Metals, except Hg and Tl)
Recovery values were within the success criterion for all analytes measured by ICPAES.
Mercury Analysis
The test plan defined no success criterion for mercury. However, the matrix spike recovery was outside the success criterion defined by the QA Plan, and post spike were prepared and analyzed. Results of the matrix spike, as well as the lower than normal recovery of the LCS (spike prior to acidification), appear to indicate a matrix related problem or loss of mercury prior to or during acidification.
ICP-MS (Tl only) The recovery value for thallium was within the success criteria.

E.6
E.5 Post Spike Results
Table E.4. Post Spike Results
Post Spike Success Criteria: 75%-125%
Analyte
Expected Spike Conc
(mg/L) Sample (mg/L)
Post Spike (mg/L)
Recovery (%)(a)
Antimony 1.25 0.028 U 1.31 105 Arsenic 1.25 0.045 U 1.27 J 101 Barium 0.25 0.25 J 0.38 J 103 Beryllium 0.05 0.0002 U 0.05 J 98 Boron 1.00 0.431 1.27 105 Cadmium 0.25 0.006 U 0.246 99 Chromium 0.50 0.01 J 0.53 J 105 Mercury 0.00200 0.0000029 J 0.00209 105(b)
Lead 1.25 0.035 U 1.31 105 Nickel 0.50 0.014 U 0.53 J 106 Selenium 1.25 0.042 U 1.29 103 Silver 0.25 0.005 U 0.241 96 Thallium (c) (c) (c) (c) Vanadium 0.50 0.003 U 0.48 J 95 Zinc 0.75 0.80 J 1.22 J 109 (a) PS recoveries have been corrected for contribution of analyte
concentration in the preparation blank. (b) No acceptance criteria provided for mercury analysis. (c) The post spike analyses were performed on the AP-101 TCLP
extract sample run with the AZ-101 glass in this batch. The post spike recovery was within acceptance limit at 76%.
E.6 Post Spike Results Narrative:
ICPAES (Metals, except Hg and Tl)
A post spike (containing all ICPAES analytes of interest) was conducted on both samples for each digestion. Recovery values are listed for all analytes in the spike that had a concentration ≥ 25% of that in the sample. The recovery values were within the success criterion for all analytes of interest.
Mercury Analysis
A post spike was prepared and analyzed for the AZ-101 LAW glass sample. The post spike recoveries were well within the success criterion.
ICP-MS (Tl only)
A post spike was prepared and analyzed for the AP-101 TCLP extract sample run with the AZ-101 glass in this batch. The post spike recovery was within the success criteria.
E.7
E.7 Serial Dilution Results (ICPAES Only): For both sample digestions (nitric/HCl or nitric only), no analyte of interest had concentrations that exceeded 100 times the concentration in the process blank. Therefore, per Bechtel QAPP, PL-24590-QA00001, Rev 0, serial dilution was not required. Matrix effects were evaluated from the respective post spike data. E.8 Modifications to Procedures No modifications were made to the test plan.

PNWD-3464 WTP-RPT-106 Rev. 0
Distr. 1
Distribution No. of Copies OFFSITE
No. of Copies ONSITE
1 Savannah River National Laboratory Richard Edwards Westinghouse SA
Aiken SC 29808-0001
11 Battelle - Pacific Northwest Division
R. J. Bates K5-12 P. R. Bredt P7-25 J. V. Crum K6-24 P. R. Hrma K6-24 D. E. Kurath P7-28 M. J. Schweiger K6-24 H. D. Smith K6-24 Project File (2) P7-28 Information Release (2) K1-09
5 Bechtel National, Inc. J. F. Doyle (2) H4-02 D. E. Larson H4-02 C. A. Musick H4-02 D. B. Blumenkranz H4-02