visualizing work: new ways to map how businesses … work: new ways to map ... one dimension of...
TRANSCRIPT

Visualizing Work: New Ways to Map How Businesses Operate Stowe Boyd February 10, 2015 This report is underwritten by Smartsheet.

The Visualization of Work 2
TABLE OF CONTENTS Executive Summary .................................................................................................................................... 3
Introduction ................................................................................................................................................. 4
Strategic Insight through Abstraction .......................................................................................................... 5
Project Management Visualization .......................................................................................................... 6
The Percentage of Jobs That Are Non-routine Is Rising ......................................................................... 8
Business Process Visualizations ............................................................................................................. 8
Business Intelligence Visualizations ..................................................................................................... 11
Strategic Insight through the Work Graph ................................................................................................. 14
Conclusions and Takeaways .................................................................................................................... 20
About Stowe Boyd ..................................................................................................................................... 21
About Gigaom Research ........................................................................................................................... 21

The Visualization of Work 3
Executive Summary Most of the myriad approaches that visually represent what goes on in a business—such as organization
charts and Gantt charts for project management—date from the start of the twentieth century. These
outdated visualizations simply don’t match up with the way today’s businesses operate: they fail to
provide strategic and quick insight into what people are doing. The rise of more recent business
intelligence (BI) and business process for visualizing work still fail to provide much insight into the social
dimension of work: where people are communicating, interacting, and sharing. The greatest degree of
insight into today’s business is likely to come from tools that build on visualizing work based on the social networks within and across businesses.
Key takeaways from this report, which takes a close look at many of the approaches to visualize work, are:
• The older the technique for visualizing work, the more out of step it is with modern work.
• In an accelerating and big data world, techniques that rely on dynamically tapping into live data rather than manual updating have great advantages.
• The work graph—the social network of people in a business, plus the information objects that they
share in the performance of their work—will likely be the central motif for visualizing work in the years to come and is where the most exciting research and development is taking place today.

The Visualization of Work 4
Introduction In an increasingly sped-up and complex world, understanding truly understanding business operations
can be difficult, if not impossible. The blizzard of emails, reports, and slide presentations creates a fog
that blocks understanding rather than facilitates it. Conventional abstractions such as organization charts,
business process diagrams, or Gantt timelines are often out-of-date or so removed from actual activities
that the individual, the workforce, or management involved have difficulty knowing who is involved with what projects, has access to what data, or is working with whom.
Other data- and interaction-driven approaches to visualizing what’s going on in business might offer a
more dynamic and direct way to gain strategic insight into what’s going on across the business. The
question is, in a world in which the nature of work is changing, what is the most useful way to visualize
work so that all involved—the individual, the workforce as a whole, and management—can gain strategic
insight?
This report explores various approaches used to visualize work, particularly those building on the work-
graph model: business social networks and the artifacts that people use to get work accomplished, such as documents, designs, code, chats, and tasks.

The Visualization of Work 5
Strategic Insight through Abstraction When asked to characterize their company in a diagram, most people will fall back on the organization
(org) chart—or some part of one—to show their place in the overall scheme. But org charts are notorious
for concealing as much as they show. As Geary Rummler once observed, the real work is done in the white
space of the org chart. That white space, Mark C. Maletz and Nitin Nohria once wrote, is “the large but
mostly unoccupied territory in every company where rules are vague, authority is fuzzy, budgets are
nonexistent, and strategy is unclear—and where, as a consequence, entrepreneurial activity that helps reinvent and renew an organization takes place.”
So the org chart is the first visualization that we can rule out for gaining any real insight into the
operations of business in 2015. This is not because we’ve seen a millennial deconstruction of the
hierarchy—we haven’t—but because businesses involve much more than the direct reporting structure
that the org chart reflects.
1917 Org Chart of the Tabulating Machine Co., later Known as IBM
Source: Wikipedia

The Visualization of Work 6
However, understanding how work is done in a business is necessary for strategic insight, for
management, the workforce, and the individual. So we must examine other models that businesses use:
business process models and workflows, social networks and work graphs, project status and task management, and financial models. Each has its own strengths and weaknesses.
One dimension of major importance is whether the abstraction is a static mapping or a dynamic
representation of live data being pulled from a system in use. Those that are static, or proscriptive, such
as the traditional top-down project management tools like Microsoft Project are always out of date and
require laborious tweaking. And even when they are up to date, they fail to show the rich social interactions that make work human.
Clearly, we are better off visualizing work with dynamic tools driven by real-world data, but even with that baseline, there are still many potential ways to visualize work.
Project Management Visualization
Dozens of project management approaches visualize work. One well-known staple of project planning
and management is the Gantt chart, named for Henry Gantt, who designed his chart between 1910 and
1915. Like the org chart, this technique is approximately one hundred years old, which may explain why
these techniques, while well understood, are increasingly out of step with the way most work is performed today.
The Gantt chart’s basic premise is representing project activities as tasks that are assigned to workers.
Dependencies between tasks—task 1 must be complete before task 3 can start, while task 2 can start at
any time, for example—are constraints added to determine work sequencing, along with estimates of time
needed, and once the project has started, capturing actual time applied. Dependencies also lead to project
analyses, like the critical path shown in red in the figure below. The critical path comprises the tasks that
define the duration of the project. The grey bars in this chart are slack time: the amount of extra time associated with non-critical path activities.

The Visualization of Work 7
Gantt Chart from Microsoft Project
Source: Wikipedia
Gantt charts and other project management tools are largely proscriptive, and in general, require manual
updating, although more comprehensive and expensive project management solutions tie into large
enterprise work reporting solutions, so that as employees and managers enter data in timecards (or their
equivalents, online), the actual time can automatically update charts. These tools require training and
technical knowledge to be used effectively. Another approach is burndown analysis which displays the tasks in a project as a declining graph showing completed and remaining tasks.
Burndown Chart
Source: Wikipedia

The Visualization of Work 8
One of the factors making project management approaches to visualizing work less effective today is the
changing nature of many people’s work. Much of today’s work is improvised and doesn’t follow step-by-
step from a plan created at the outset, and the rate at which work plans are altered is increasing. Likewise,
as work is increasingly decentralized, changes in one part of a project may happen without others knowing.
Researchers from the New York Federal Reserve analyzed census data to find a key trend: more U.S.
occupations are involved in non-routine and cognitive work, currently approaching 70 percent of all jobs
(see Work is rapidly becoming nonroutine). As a result, much of what people are doing is not project
related, or else the work activities are proceeding in a fashion where the work starts before all the tasks are identified and scoped.
The Percentage of Jobs That Are Non-routine Is Rising
The strengths of project management-oriented visualization approaches are that project management
techniques are well understood, and that tools for working with project management techniques are
mature, so they can scale and provide roll-up for sub-projects. In this way, they provide a comprehensive
approach to thinking about project work, especially in large projects involving complex coordination of many individuals or groups.
But the weaknesses of project approaches are many. They downplay the human dimension of work, too
often treating workers like gears in a machine, and at any given time the most relevant information may not easy to find. They miss what’s going on in the whitespace.
Business Process Visualizations
While efforts to model business process, like Gantt and flow charts, have been around since the start of
the 20th century, the term business process modeling has been in use only since the 1970s. It arose in the
field of systems engineering, attributed to S. Williams, Business Process Modeling Improves Administrative Control (1967).
Most process-oriented techniques in wide use today share a task-oriented orientation with Gantt and
project management approaches, but they add more attributes in the visualization of work. The next
figure shows a process model with “swimlanes” that denote what agent or group is responsible for the
tasks that are drawn within them. Two consultants, Geary Rummler and Alan Brache, proposed swimlanes in their book Improving Processes (1990).

The Visualization of Work 9
Swimlane Process Model
Source: Wikipedia
Swimlanes have been adopted in more modern and sophisticated techniques, like Unified Modeling
Language (UML) Activity Diagrams. But in all cases, they focus on who has the responsibility for the task,
the logic that drives alternate paths, as well as the sequence of the steps. It is a much richer visualization
of what is going on in well-defined business processes and it counters the lack of the human dimension to
some extent, since human agents are depicted explicitly. However, in any but the most deterministic
business activities, there is clearly a great deal of human communication not surfaced in this diagram. For
example, it might be reasonable for the lawyer and agent in the chart above to communicate about the approval of the order, but that isn’t evident.

The Visualization of Work 10
And the other weaknesses of project techniques remain: these representations are manual and require
updating when changes are made. The more sophisticated methods, such as UML and Systems Dynamics
models, require formal training and an inclination toward logical rather that social thinking. Following is
the depiction of a brainstorming process in a UML Activity diagram (this one without swimlanes). Note
diamonds indicate decisions, rounded rectangles are actions, and black bars enclose concurrent activities.
Seems intuitive for programmers, perhaps, which is what UML is for.
UML Activity Diagram
Source: Wikipedia
Systems Dynamics models, that Jay Forrester invented in the 1950s, are based around different concepts:
feedback loops and stocks and flows. The following stock and flow diagram models the New Product
Adoption system for a company making a product. Here we see the ‘stock’ of potential adopters being

The Visualization of Work 11
transferred to the ‘stock’ of adopters, which is what we generally call adoption. The blue feedback loops
show the impact of forces, like word of mouth. Here word of mouth is clockwise relative to the flow,
meaning it helps convert adopters. Likewise, the plus and minus signs indicate positive or negative feedback.
Systems Dynamics Model of New Product Adoption
Source: Wikipedia
This is another example of an approach that requires technical knowledge to make sense of, and even
more to construct such models. Like the other techniques covered so far, these fail the abstraction test:
the user must read all the parts and construct a mental model of what’s going on in totality before having a general sense of the process. There is deep insight, but no quick insight.
Business Intelligence Visualizations
BI is a set of practices and technologies that allow the raw data to be transformed into information for
business analysis and insight. Unlike the techniques described earlier, BI starts with data rather than manual entry or diagramming.

The Visualization of Work 12
The modern use of the term dates back to a 1958 article by Hans Peter Luhn in A Business Intelligence
System. But in its modern form, BI allows insight into the various operations of a business through
computer-mediated representations in financial charts, operations dashboards, milestones against business objectives, and so on.
The following screenshot shows a Daily Sales Dashboard from Tableau, one of the leaders in business
analytics. It includes the characteristic features of BI dashboards: financial and other data is represented
in various widgets, such as a sales chart, a geographical depiction of that data, as well as a customer
demographic detail section. Dashboards like these are generally driven by live or very recent data, so the charts can be updating in real time, which is very unlike the earlier manual techniques.
Tableau Dashboard
Another example (following screenshot) from Domo Software consolidates financial information,
information on sales, cash balance, expenses, etc., with performance goals, such as new-hire training program, fulfilled orders, etc.

The Visualization of Work 13
Domo Dashboard
One of the greatest strengths is that BI dashboards and analytics can be driven by actual company data,
and can boil down a great deal of complexity into a small area. Especially as companies are gathering ever
more information from operations, employees, and customers there will be a mounting interest in making sense of that data.
Note also that these BI dashboards are significantly more intuitive for those without the formal and
logical training involved in other representations. Any college graduate with an understanding of
statistics and accounting basics can grasp what’s shown in the screens above. And it’s much easier to get the gestalt of what is indicated: BI supports quick insight once the short learning curve is complete.
However, BI does have some weaknesses. The social dimension may be underrepresented and it tends to
resolve to an industrial orientation toward work as opposed to a human-centered approach, although that
can be countered to some extent by creating widgets that focus on people data, like the new-hire training program example above.

The Visualization of Work 14
Strategic Insight through the Work Graph Social network analysis grew out of the social sciences starting in the 1890s, when Emile Durkheim and
others researched social groups. But social scientists like Bronislaw Malinowski and Claude Lévi-Strauss
began—in the 1930s—the work that has become the foundation for understanding the social nature of human communities and society.
The anthropologist Gregory Bateson wrote in the 1960s that “a business is best considered as a network of
conversations.” This sentence establishes the deep context for thinking about businesses as communities and societies, with social relationships and how we communicate and influence each other at work.
In recent years the term “social graph” made a careful distinction between social networks that are made
up of nodes representing people and arcs representing relationships, as shown in the following figure,
and a more complex system in which social objects are also depicted. These are the items that people
share in social networks, such as photos, messages, and tags. Social objects plus the social network result
in a social graph.
Social network in the Framingham Heart Study
Source: New York Times

The Visualization of Work 15
Modeling social connection as graphs, where the arcs are relationships and the nodes are people, has
been a commonplace of sociology and other social sciences for generations. The analysis of social
networks has a solid mathematical foundation, so the strength of a relationship between two people can
be measured by how quickly and frequently those two people communicate via email, for example. This
could be denoted by the distance between the two nodes in a graph depiction, or using wider lines in the
graph to represent stronger connections, and thinner ones for weaker links
The social graph below was generated by computerized email analysis across a company and analyzing
the communication between the folks in various departments and their partners and customers. Note,
however that the emails involved aren’t shown in the rendered graph because the volume would overwhelm.
A Social Graph Based on Email Communications
Source: VoloMetrix

The Visualization of Work 16
This sort of presentation allows for quick insight. For example, imagine a CEO viewing this VoloMetrix
display, looking to contrast it with the previous time period and to learn if the company’s initiative to
build stronger connections between customers and the company’s services and support organization has
been successful. Simply glancing at two social graphs might give her that insight. And of course, the numbers behind the chart are available as well.
So, adding work objects like documents, messages, blog posts, customer information, and links, to the
social network leads to what many refer to as the “work graph.” The Volometrix example above is based
on analysis of emails alone, but analysis of communications in other media, such as shared documents,
chat, and so on, are equally possible. Likewise, representations that correspond to group membership,
trust, closeness, and almost any other dimension of social relationship are possible, given the corresponding data.
Microsoft’s work on Delve is similar to VoloMetrix: Delve analyzes document use and other information
in Office 365 to try to surface what’s relevant for each user. However, it provides a dashboard-style
interface based on a card or tile design metaphor to present each user an individual user experience tailored by the work graph, or as they call it, the office graph.
Microsoft Office Delve User Interface
Source: Microsoft
The Visualization of Work 17
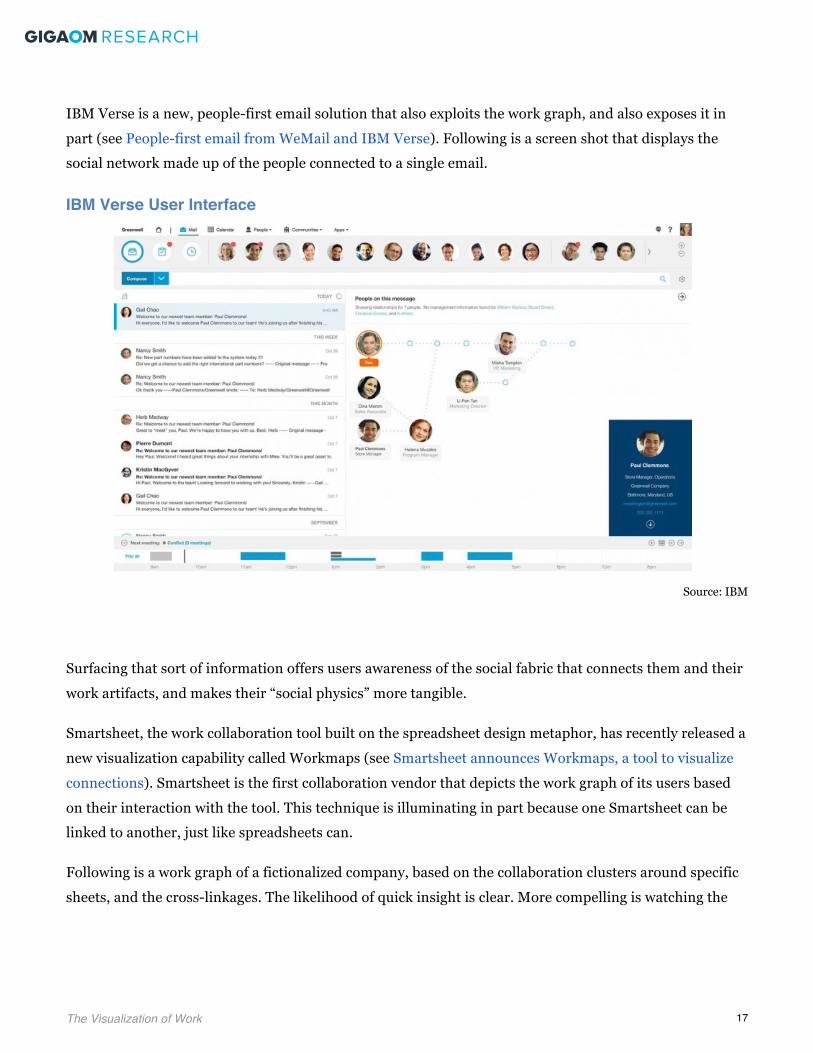
IBM Verse is a new, people-first email solution that also exploits the work graph, and also exposes it in
part (see People-first email from WeMail and IBM Verse). Following is a screen shot that displays the social network made up of the people connected to a single email.
IBM Verse User Interface
Source: IBM
Surfacing that sort of information offers users awareness of the social fabric that connects them and their
work artifacts, and makes their “social physics” more tangible.
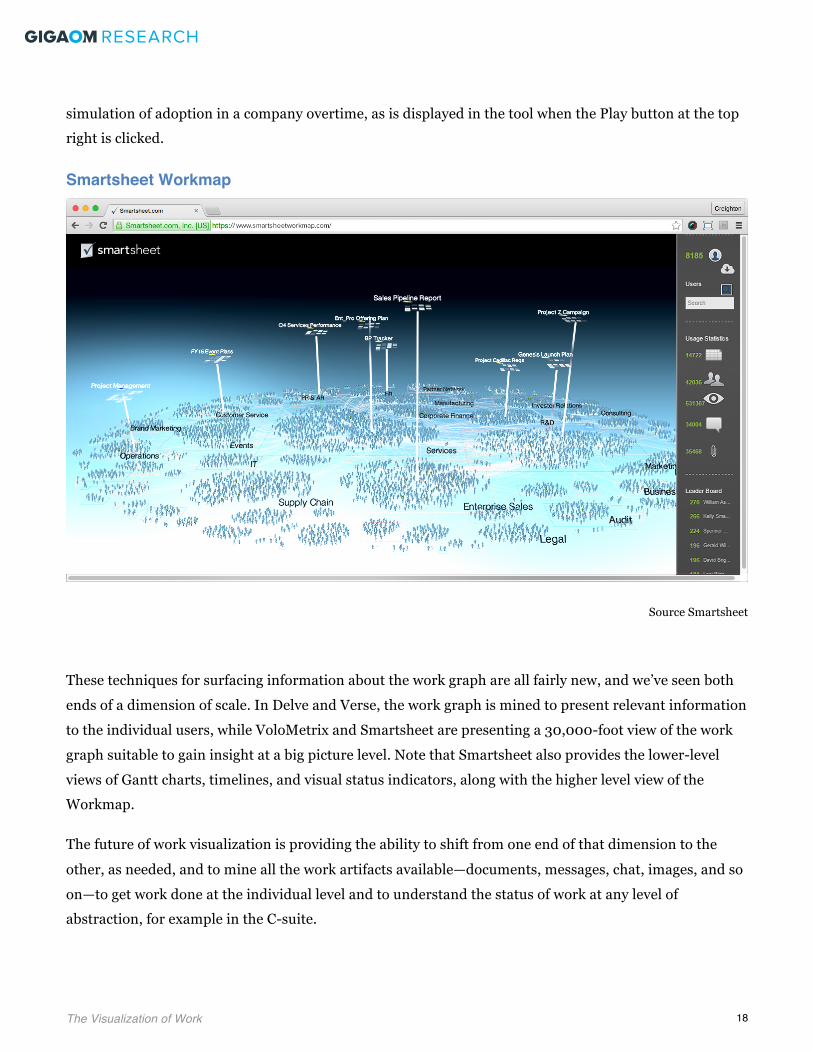
Smartsheet, the work collaboration tool built on the spreadsheet design metaphor, has recently released a
new visualization capability called Workmaps (see Smartsheet announces Workmaps, a tool to visualize
connections). Smartsheet is the first collaboration vendor that depicts the work graph of its users based
on their interaction with the tool. This technique is illuminating in part because one Smartsheet can be linked to another, just like spreadsheets can.
Following is a work graph of a fictionalized company, based on the collaboration clusters around specific
sheets, and the cross-linkages. The likelihood of quick insight is clear. More compelling is watching the
The Visualization of Work 18
simulation of adoption in a company overtime, as is displayed in the tool when the Play button at the top right is clicked.
Smartsheet Workmap
Source Smartsheet
These techniques for surfacing information about the work graph are all fairly new, and we’ve seen both
ends of a dimension of scale. In Delve and Verse, the work graph is mined to present relevant information
to the individual users, while VoloMetrix and Smartsheet are presenting a 30,000-foot view of the work
graph suitable to gain insight at a big picture level. Note that Smartsheet also provides the lower-level
views of Gantt charts, timelines, and visual status indicators, along with the higher level view of the Workmap.
The future of work visualization is providing the ability to shift from one end of that dimension to the
other, as needed, and to mine all the work artifacts available—documents, messages, chat, images, and so
on—to get work done at the individual level and to understand the status of work at any level of abstraction, for example in the C-suite.

The Visualization of Work 19
To counter concerns that this sort of analysis steps over privacy boundaries, VoloMetrix’s technology does
not read the content of the emails that it analyzes. Instead, it relies only on the subject line and the
sender’s and receiver’s addresses. Similarly, Smartsheet reads the names of the sheets and identifies with
whom the sheets are shared, but does not have access to the sheet contents. In general, vendors must
walk a careful line in shaping these tools, and the ways in which they undertake the analysis of our
communications to get at the work graph. For example, during Microsoft “YamJam” about Delve, some
wondered about the possible consequences of people accessing company HR documents, like
psychological assistance, domestic partner coverage, and maternity benefits. If such documents became
part of someone’s work graph, and that work graph was available to others, it would in effect go past privacy boundaries. But Delve only shows whether someone modifies a document.
On one hand, those limitations restrict the benefits of work graph analysis and visualization for those
parts of our working life that is about the work we do. On the other hand, it is obviously necessary to have
strong privacy controls in force when dealing with more personal matters, such as HR issues, or emails
sent to loved ones. People must have personal control and be able to make certain activities and information private or secret, or the benefits of such analysis may not be realized.
In the near future, we will see a growing demand for the visualization of work, and most specifically, the
emergence of the work graph as the central motif in our perception of work on a social level. Its strengths
are based on the intuitive nature of the work graph, and the mathematical rigor that underlies social
network analysis. Plus the connections between people and the artifacts that they work with lead to
contextually relevant collaboration, which is going to be a massive trend over the next few years, and which is driven by exploiting the work graph at a foundational level.

The Visualization of Work 20
Conclusions and Takeaways Walking through the various sorts of work visualization has been revealing. One important takeaway is
that we are still using techniques from the early 20th century to understand 21st century work. That
might be alright if the two time periods have a great deal in common, but the stark truth is, they don’t, at least not in the ways that matter relative to succeeding in business, today.
The organization chart fails to show what is going on in the whitespace of the organization, where people collaborate, work gets done, and products ship.
Gannt charts and business process diagrams have their place, but much of the work being done today is
non-routine, so those techniques are increasingly irrelevant as proscriptive ways to channel people’s work.
Such techniques are still powerful when tied to live data from ongoing projects or processes, but they often fail to capture the give-and-take going on outside the swimlanes.
The dashboards of business intelligence can provide powerful ways of understanding operational detail,
but aside from quite modern ones, BI dashboards fail to cast a light on the social interactions that define
organizational culture, which is the wellspring of creativity, innovation, and grit in business.
A new wave of tools building on the dynamics inherent in the work graph will displace conventional
approaches, and establish a new dimension of enterprise software competition.
Companies such as VoloMetrix, Microsoft, IBM, and Smartsheet are taking quite different paths, but are building on analysis and visualization of the work graph to help drive strategic insight.

The Visualization of Work 21
About Stowe Boyd Stowe Boyd describes himself as a web anthropologist, futurist, and analyst. His focus is the future of
work and the tectonic forces pushing business into an unclear and accelerating future. Boyd has worked
as an analyst for Gigaom Research for several years and as the curator in the social and future of work
area since fall 2012. Boyd has been tracking the social revolution online since 1999, when he coined the
term “social tools” and starting blogging. He was president of Corante, a blogging pioneer, in the mid-
2000s and has been widely recognized as a theorist and influencer in the social web. He coined the term “hashtag” in ’07 during an online conversation with Chris Messina, the originator of the convention.
He is at work on a book, Fast-and-Loose: The New Form Factor For Work. Boyd has participated in
numerous conferences and events worldwide, including Web 2.0, Enterprise 2.0, Gigaom Net:Work, Reboot, Next, Mesh, Shift, Lift, SIBOS, Defrag, SXSW, and several TEDx events.
About Gigaom Research Gigaom Research gives you insider access to expert industry insights on emerging markets. Focused on
delivering highly relevant and timely research to the people who need it most, our analysis, reports, and
original research come from the most respected voices in the industry. Whether you’re beginning to learn
about a new market or are an industry insider, Gigaom Research addresses the need for relevant, illuminating insights into the industry’s most dynamic markets.
Visit us at: research.gigaom.com.
© 2014 Giga Omni Media, Inc. All Rights Reserved. This publication may be used only as expressly permitted by license from Gigaom and may not be accessed, used, copied, distributed, published, sold, publicly displayed, or otherwise exploited without the express prior written permission of Gigaom. For licensing information, please contact us.