visualizing software architectures. objectives concepts u what is visualization? u differences...
Post on 19-Dec-2015
220 views
TRANSCRIPT

Visualizing Software Architectures

Objectives
Concepts What is visualization? Differences between modeling and
visualization What kinds of visualizations do we use? Visualizations and views How can we characterize and evaluate
visualizations? Examples
Concrete examples of a diverse array of visualizations

Objectives
Concepts What is visualization? Differences between modeling and
visualization What kinds of visualizations do we use? Visualizations and views How can we characterize and evaluate
visualizations? Examples
Concrete examples of a diverse array of visualizations

What is Architectural Visualization?
Recall that we have characterized architecture as the set of principal design decisions made about a system
Recall also that models are artifacts that capture some or all of the design decisions that comprise an architecture
An architectural visualization defines how architectural models are depicted, and how stakeholders interact with those depictions Two key aspects here:
Depiction is a picture or other visual representation of design decisions
Interaction mechanisms allow stakeholders to interact with design decisions in terms of the depiction

Models vs. Visualizations
It is easy to confuse models and visualizations because they are very closely related
A model is just abstract information – a set of design decisions
Visualizations give those design decisions form: they let us depict those design decisions and interact with them in different ways Because of the interaction aspect,
visualizations are often active – they are both pictures AND tools

Models vs. Visualizations
Model
DD DD
DD DD
DD
<?xml version=“1.0”><model> <decision num=“1”…/> <decision num=“2”…/></model>
<?xml version=“1.0”><model> <decision num=“1”…/> <decision num=“2”…/></model>
Our first decision isthat the system will have two components, C1 and C2...
Our first decision isthat the system will have two components, C1 and C2...
C1
C2
XML-based visualization
Natural language visualization
Box-and-arrowvisualization

Kinds of Visualizations: Textual Visualizations
Depict architectures through ordinary text files Generally conform to some syntactic format,
like programs conform to a language May be natural language, in which case the
format is defined by the spelling and grammar rules of the language
Decorative optionsFonts, colors, bold/italicsTables, bulleted lists/outlines

Textual Visualizations
<instance:xArch xsi:type=”instance:XArch”> <types:archStructure xsi:type=”types:ArchStructure” types:id=”ClientArch”> <types:description xsi:type=”instance:Description”> Client Architecture </types:description> <types:component xsi:type=”types:Component” types:id=”WebBrowser”> <types:description xsi:type=”instance:Description”> Web Browser </types:description> <types:interface xsi:type=”types:Interface” types:id=”WebBrowserInterface”> <types:description xsi:type=”instance:Description”> Web Browser Interface </types:description> <types:direction xsi:type=”instance:Direction”> inout </types:direction> </types:interface> </types:component> </types:archStructure></instance:xArch>
<instance:xArch xsi:type=”instance:XArch”> <types:archStructure xsi:type=”types:ArchStructure” types:id=”ClientArch”> <types:description xsi:type=”instance:Description”> Client Architecture </types:description> <types:component xsi:type=”types:Component” types:id=”WebBrowser”> <types:description xsi:type=”instance:Description”> Web Browser </types:description> <types:interface xsi:type=”types:Interface” types:id=”WebBrowserInterface”> <types:description xsi:type=”instance:Description”> Web Browser Interface </types:description> <types:direction xsi:type=”instance:Direction”> inout </types:direction> </types:interface> </types:component> </types:archStructure></instance:xArch>
XML visualization
Software Architecture: Foundations, Theory, and Practice; Richard N. Taylor, Nenad Medvidovic, and Eric M. Dashofy; © 2008 John Wiley & Sons, Inc. Reprinted with permission.

Textual Visualizations (cont’d)
<instance:xArch xsi:type=”instance:XArch”> <types:archStructure xsi:type=”types:ArchStructure” types:id=”ClientArch”> <types:description xsi:type=”instance:Description”> Client Architecture </types:description> <types:component xsi:type=”types:Component” types:id=”WebBrowser”> <types:description xsi:type=”instance:Description”> Web Browser </types:description> <types:interface xsi:type=”types:Interface” types:id=”WebBrowserInterface”> <types:description xsi:type=”instance:Description”> Web Browser Interface </types:description> <types:direction xsi:type=”instance:Direction”> inout </types:direction> </types:interface> </types:component> </types:archStructure></instance:xArch>
<instance:xArch xsi:type=”instance:XArch”> <types:archStructure xsi:type=”types:ArchStructure” types:id=”ClientArch”> <types:description xsi:type=”instance:Description”> Client Architecture </types:description> <types:component xsi:type=”types:Component” types:id=”WebBrowser”> <types:description xsi:type=”instance:Description”> Web Browser </types:description> <types:interface xsi:type=”types:Interface” types:id=”WebBrowserInterface”> <types:description xsi:type=”instance:Description”> Web Browser Interface </types:description> <types:direction xsi:type=”instance:Direction”> inout </types:direction> </types:interface> </types:component> </types:archStructure></instance:xArch>
xArch{ archStructure{ id = “ClientArch” description = “Client Architecture” component{ id = “WebBrowser” description = “Web Browser” interface{ id = “WebBrowserInterface” description = “Web Browser Interface” direction = “inout” } } }}
xArch{ archStructure{ id = “ClientArch” description = “Client Architecture” component{ id = “WebBrowser” description = “Web Browser” interface{ id = “WebBrowserInterface” description = “Web Browser Interface” direction = “inout” } } }}
XML visualization
Compact visualizationSoftware Architecture: Foundations, Theory, and Practice; Richard N. Taylor, Nenad Medvidovic, and Eric M. Dashofy; © 2008 John Wiley & Sons, Inc. Reprinted with permission.

Textual Visualizations: Interaction
Generally through an ordinary text editor or word processor
Some advanced mechanisms available Syntax highlighting Static checking Autocomplete Structural folding

Textual Visualizations
Advantages Depict entire architecture in a single file Good for linear or hierarchical structures Hundreds of available editors Substantial tool support if syntax is rigorous
(e.g., defined in something like BNF) Disadvantages
Can be overwhelming Bad for graphlike organizations of information Difficult to reorganize information
meaningfully Learning curve for syntax/semantics

Kinds of Visualizations: Graphical Visualizations
Depict architectures (primarily) as graphical symbols Boxes, shapes, pictures, clip-art Lines, arrows, other connectors Photographic images Regions, shading 2D or 3D
Generally conform to a symbolic syntax But may also be ‘free-form’ and stylistic

Graphical Visualizations
Abstract, stylizedvisualization
Software Architecture: Foundations, Theory, and Practice; Richard N. Taylor, Nenad Medvidovic, and Eric M. Dashofy; © 2008 John Wiley & Sons, Inc. Reprinted with permission.

Graphical VisualizationsAbstract, stylized
visualization
More rigorous deploymentvisualization
Software Architecture: Foundations, Theory, and Practice; Richard N. Taylor, Nenad Medvidovic, and Eric M. Dashofy; © 2008 John Wiley & Sons, Inc. Reprinted with permission.

Graphical Visualizations: Interaction
Generally graphical editors with point-and-click interfaces Employ metaphors like scrolling, zooming, ‘drill-down’
Editors have varying levels of awareness for different target notations For example, you can develop UML models in
PowerPoint (or Photoshop), but the tools won’t help much
More exotic editors and interaction mechanisms exist in research 3D editors “Sketching-based” editors

Graphical Visualizations
Advantages Symbols, colors, and visual decorations more
easily parsed by humans than structured text Handle non-hierarchical relationships well Diverse spatial interaction metaphors
(scrolling, zooming) allow intuitive navigation Disadvantages
Cost of building and maintaining tool supportDifficult to incorporate new semantics into
existing tools Do not scale as well as text to very large
models

Hybrid Visualizations
Many visualizations are text-only Few graphical notations are purely symbolic
Text labels, at a minimum Annotations are generally textual as well
Some notations incorporate substantial parts that are mostly graphical alongside substantial parts that are mostly or wholly textual

Hybrid Visualizations (cont’d)
context UserInterface inv: new_burn_rate >= 0
Architectural constraintsexpressed in OCL
Primarily graphicalUML class diagram
Software Architecture: Foundations, Theory, and Practice; Richard N. Taylor, Nenad Medvidovic, and Eric M. Dashofy; © 2008 John Wiley & Sons, Inc. Reprinted with permission.

Views, Viewpoints, & Visualizations
Recall that a view is a subset of the design decisions in an architecture
And a viewpoint is the perspective from which a view is taken (i.e., the filter that selects the subset)
Visualizations are associated with viewpoints
Software Architecture: Foundations, Theory, and Practice; Richard N. Taylor, Nenad Medvidovic, and Eric M. Dashofy; © 2008 John Wiley & Sons, Inc. Reprinted with permission.
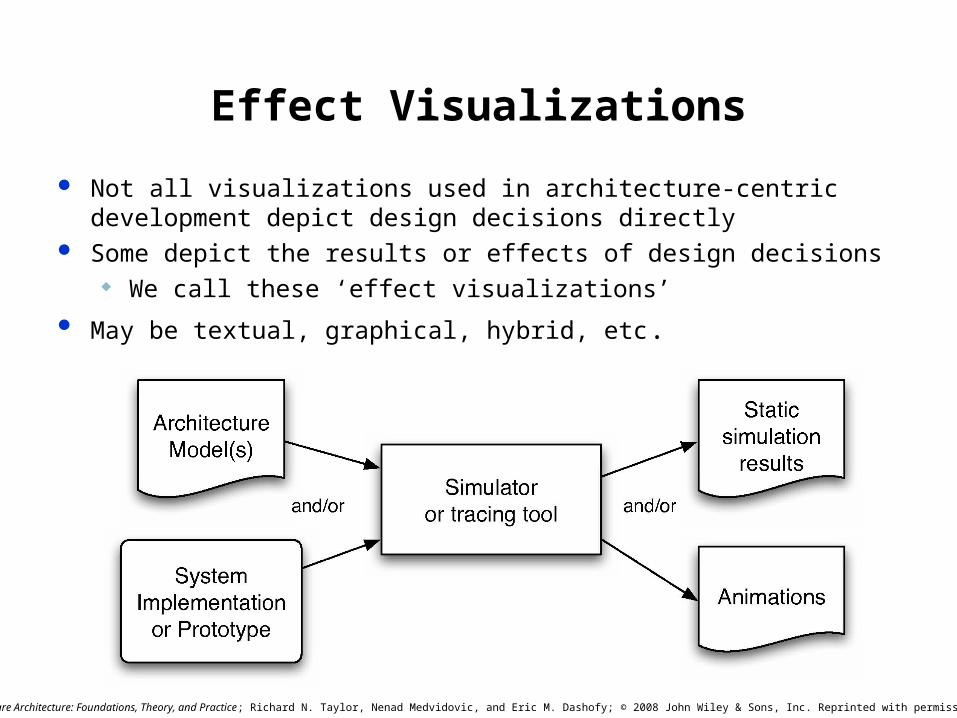
Effect Visualizations
Not all visualizations used in architecture-centric development depict design decisions directly
Some depict the results or effects of design decisions We call these ‘effect visualizations’
May be textual, graphical, hybrid, etc.
Software Architecture: Foundations, Theory, and Practice; Richard N. Taylor, Nenad Medvidovic, and Eric M. Dashofy; © 2008 John Wiley & Sons, Inc. Reprinted with permission.

Evaluating Visualizations
Scope and Purpose What is the visualization for? What can it
visualize? Basic Type
Textual? Graphical? Hybrid? Effect? Depiction
What depiction mechanisms and metaphors are primarily employed by the visualization?
Interaction What interaction mechanisms and metaphors
are primarily employed by the visualization?

Evaluating Visualizations (cont’d)
Fidelity How well/completely does the visualization
reflect the information in the underlying model?
Consistency How well does the visualization use similar
representations for similar concepts? Comprehensibility
How easy is it for stakeholders to understand and use a visualization
Note: this is a function of both the visualization and the stakeholders

Evaluating Visualizations (cont’d)
Dynamism How well does the visualization support
models that change over time (dynamic models)?
View Coordination How well the visualization is connected to
and kept consistent with other visualizations Aesthetics
How pleasing is the visualization (look and feel) to its users?
A very subjective judgment Extensibility
How easy is it to add new capabilities to a visualization?

Concepts What is visualization? Differences between modeling and
visualization What kinds of visualizations do we use? Visualizations and views How can we characterize and evaluate
visualizations? Examples
Concrete examples of a diverse array of visualizations
Objectives

Text Visualizations
Text visualizations are generally provided through text editors
Examples: Simple: Windows Notepad, SimpleText, pico,
joe For experts: vi, emacs With underlying language support: Eclipse,
UltraEdit, many HTML editors Free-form text documents: Microsoft Word,
other word processors

Text Visualizations (cont’d)
Advantages Provide a uniform way of working with many
different underlying notations Wide range of editors available to suit any
need Many incorporate advanced ‘content assist’
capabilities Many text editors can be extended to handle
new languages or integrate new tools easily Disadvantages
Increasing complexity as models get bigger Do not handle graph structures and complex
interrelationships well

Text Visualizations: Evaluation
Scope/Purpose Visualizing design
decisions or effects as (structured) text
Basic Type Textual
Depiction Ordered lines of
characters possibly grouped into tokens
Interaction Basic: insert, delete, copy,
paste Advanced: coloring, code
folding, etc. Fidelity
In general, it depicts entire model including all detail
Consistency Generally good; depends on
underlying notation Comprehensibility
Drops with increasing complexity
Dynamism Depends on editor – model
change will update text visualization
View coordination In some integrated env., textual
visualization can be coordinated with other visualization
Aesthetics Varies; can be overwhelming or
elegant and structured Extensibility
Depends on the editor

General Graphical Visualizations E.g., PowerPoint, OmniGraffle, etc. Provide point-and-click manipulation of graphical
symbols, interconnections, and text blocks Advantages
Friendly UI can create nice-looking depictions Nothing hidden; no information difference
between model and depiction Disadvantages
No underlying semantics; difficult to add themVisio is a partial exceptionThis means that interaction mechanisms
can offer minimal support Difficult to connect to other visualizations

General Graphical Example
Software Architecture: Foundations, Theory, and Practice; Richard N. Taylor, Nenad Medvidovic, and Eric M. Dashofy; © 2008 John Wiley & Sons, Inc. Reprinted with permission.

General Graphical: Evaluation
Scope/Purpose Visualizing design decisions
as symbolic pictures Basic Type
Graphical Depiction
(Possibly) interconnected symbols on a finite canvas
Interaction Point and click, drag-and-
drop direct interactions with symbols, augmented by menus and dialogs
Fidelity Generally canonical
Consistency User is responsible in
developing consistent representations
Comprehensibility Depends on skill of the
modeler and use of consistent symbols/patterns
Dynamism Some animation capabilities
View coordination Difficult to coordinate with
other visualizations Aesthetics
Modeler’s responsibility Extensibility
Adding new symbols is easy, adding semantics is harder