visualizing social impact - unicorn invasion 2015
TRANSCRIPT

VISUALIZING SOCIAL IMPACTPAUL LANDON

OUR FIRSTSOCIAL POSTS(Total ‘Likes’ received: Unknown)
HOW WE USED TO ‘MEASURE’ SOCIAL IMPACT
VISUALIZING SOCIAL IMPACT 3
100+ LIKES... WINNING!

HOW WE USED TO ‘MEASURE’ SOCIAL IMPACT
VISUALIZING SOCIAL IMPACT 4
100+ LIKES... WINNING!
FIRE #HASHTAG, BRO... WE’RE TRENDING!

HOW WE USED TO ‘MEASURE’ SOCIAL IMPACT
VISUALIZING SOCIAL IMPACT 5
100+ LIKES... WINNING!
FIRE #HASHTAG, BRO... WE’RE TRENDING!
DOES THIS FILTER MAKE ME LOOK TAN?
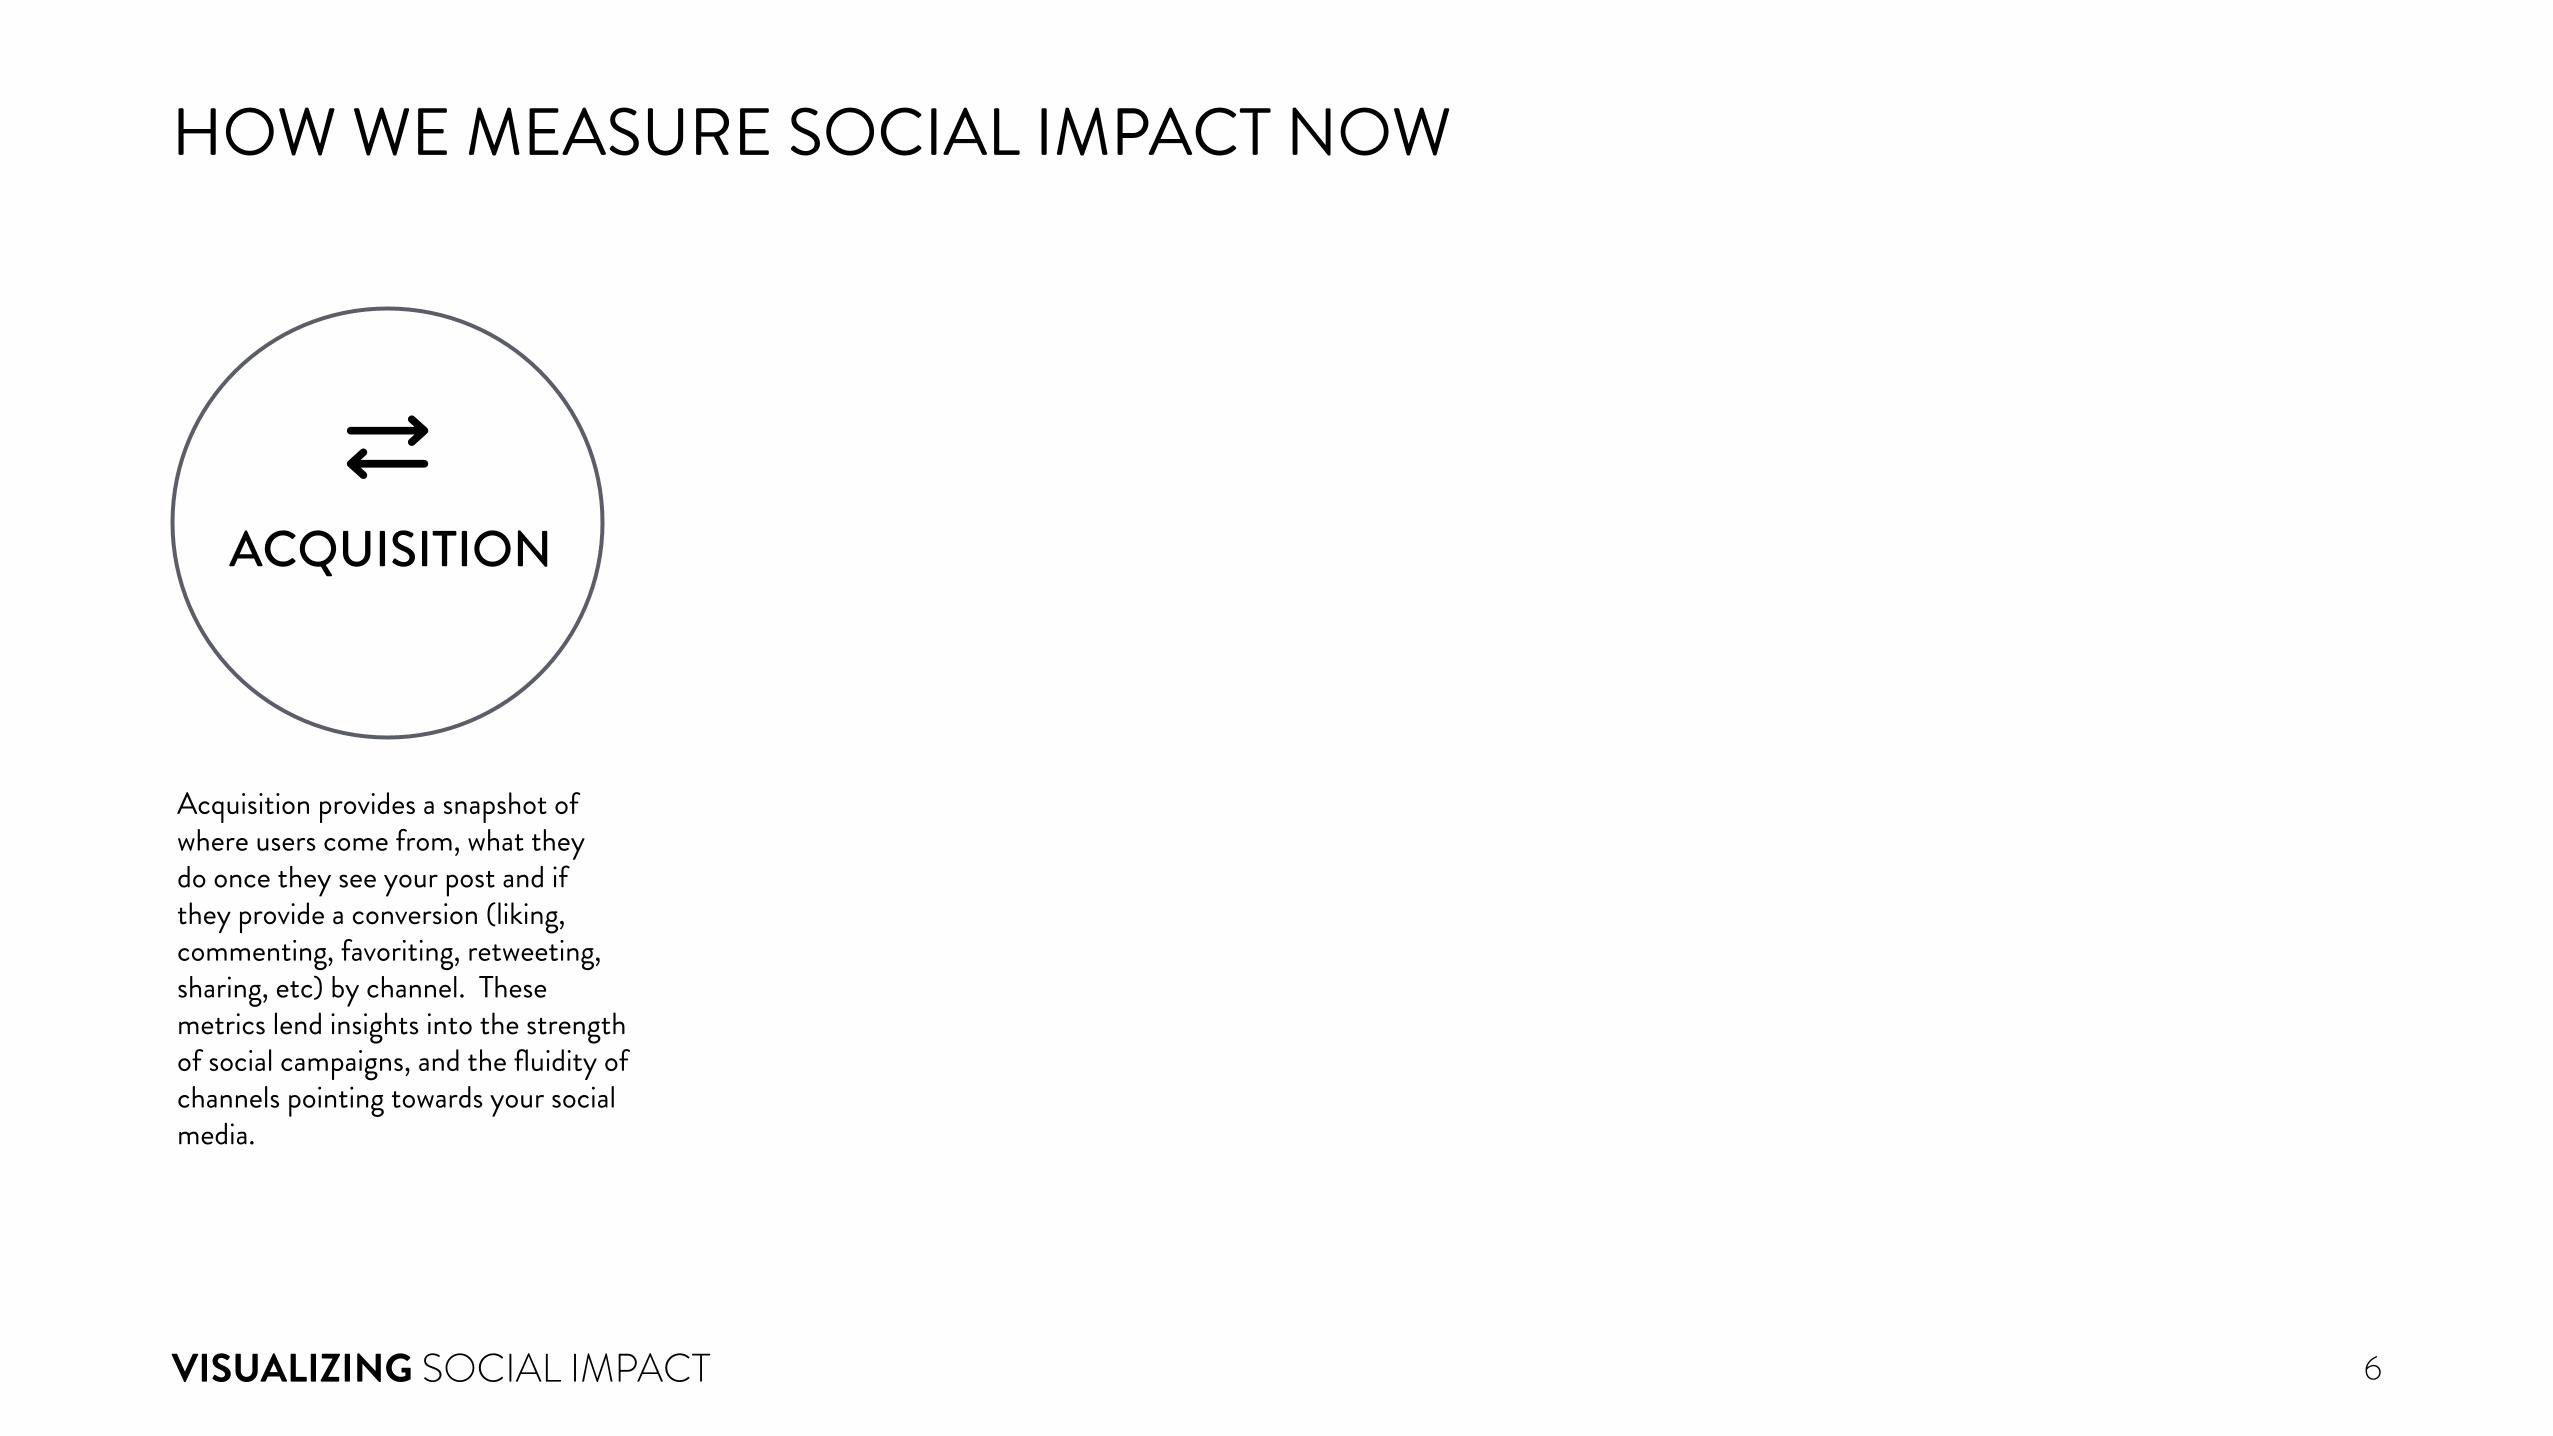
Acquisition provides a snapshot of where users come from, what they do once they see your post and if they provide a conversion (liking, commenting, favoriting, retweeting, sharing, etc) by channel. These metrics lend insights into the strength of social campaigns, and the fluidity of channels pointing towards your social media.
ACQUISITION
6VISUALIZING SOCIAL IMPACT
HOW WE MEASURE SOCIAL IMPACT NOW

Reach is another quantitative metric, and is defined as the number of people who received impressions of a Social post. Basically, the breadth or expanse of how far your post traveled. Usually this is expressed on a per-post basis as a percentage of your available audience that had an impression of that post.
Acquisition provides a snapshot of where users come from, what they do once they see your post and if they provide a conversion (liking, commenting, favoriting, retweeting, sharing, etc) by channel. These metrics lend insights into the strength of social campaigns, and the fluidity of channels pointing towards your social media.
ACQUISITION REACH
7VISUALIZING SOCIAL IMPACT
HOW WE MEASURE SOCIAL IMPACT NOW
+

Reach is another quantitative metric, and is defined as the number of people who received impressions of a Social post. Basically, the breadth or expanse of how far your post traveled. Usually this is expressed on a per-post basis as a percentage of your available audience that had an impression of that post.
Acquisition provides a snapshot of where users come from, what they do once they see your post and if they provide a conversion (liking, commenting, favoriting, retweeting, sharing, etc) by channel. These metrics lend insights into the strength of social campaigns, and the fluidity of channels pointing towards your social media.
Engagement refers to the actions visitors to your social media perform with regards to that post (liking, commenting, favoriting, retweeting, sharing, etc). Basically, this measures how active your audience is in interacting with your social media, and is expressed as a quantitative metric.
ACQUISITION REACH ENGAGEMENT
8VISUALIZING SOCIAL IMPACT
HOW WE MEASURE SOCIAL IMPACT NOW
++
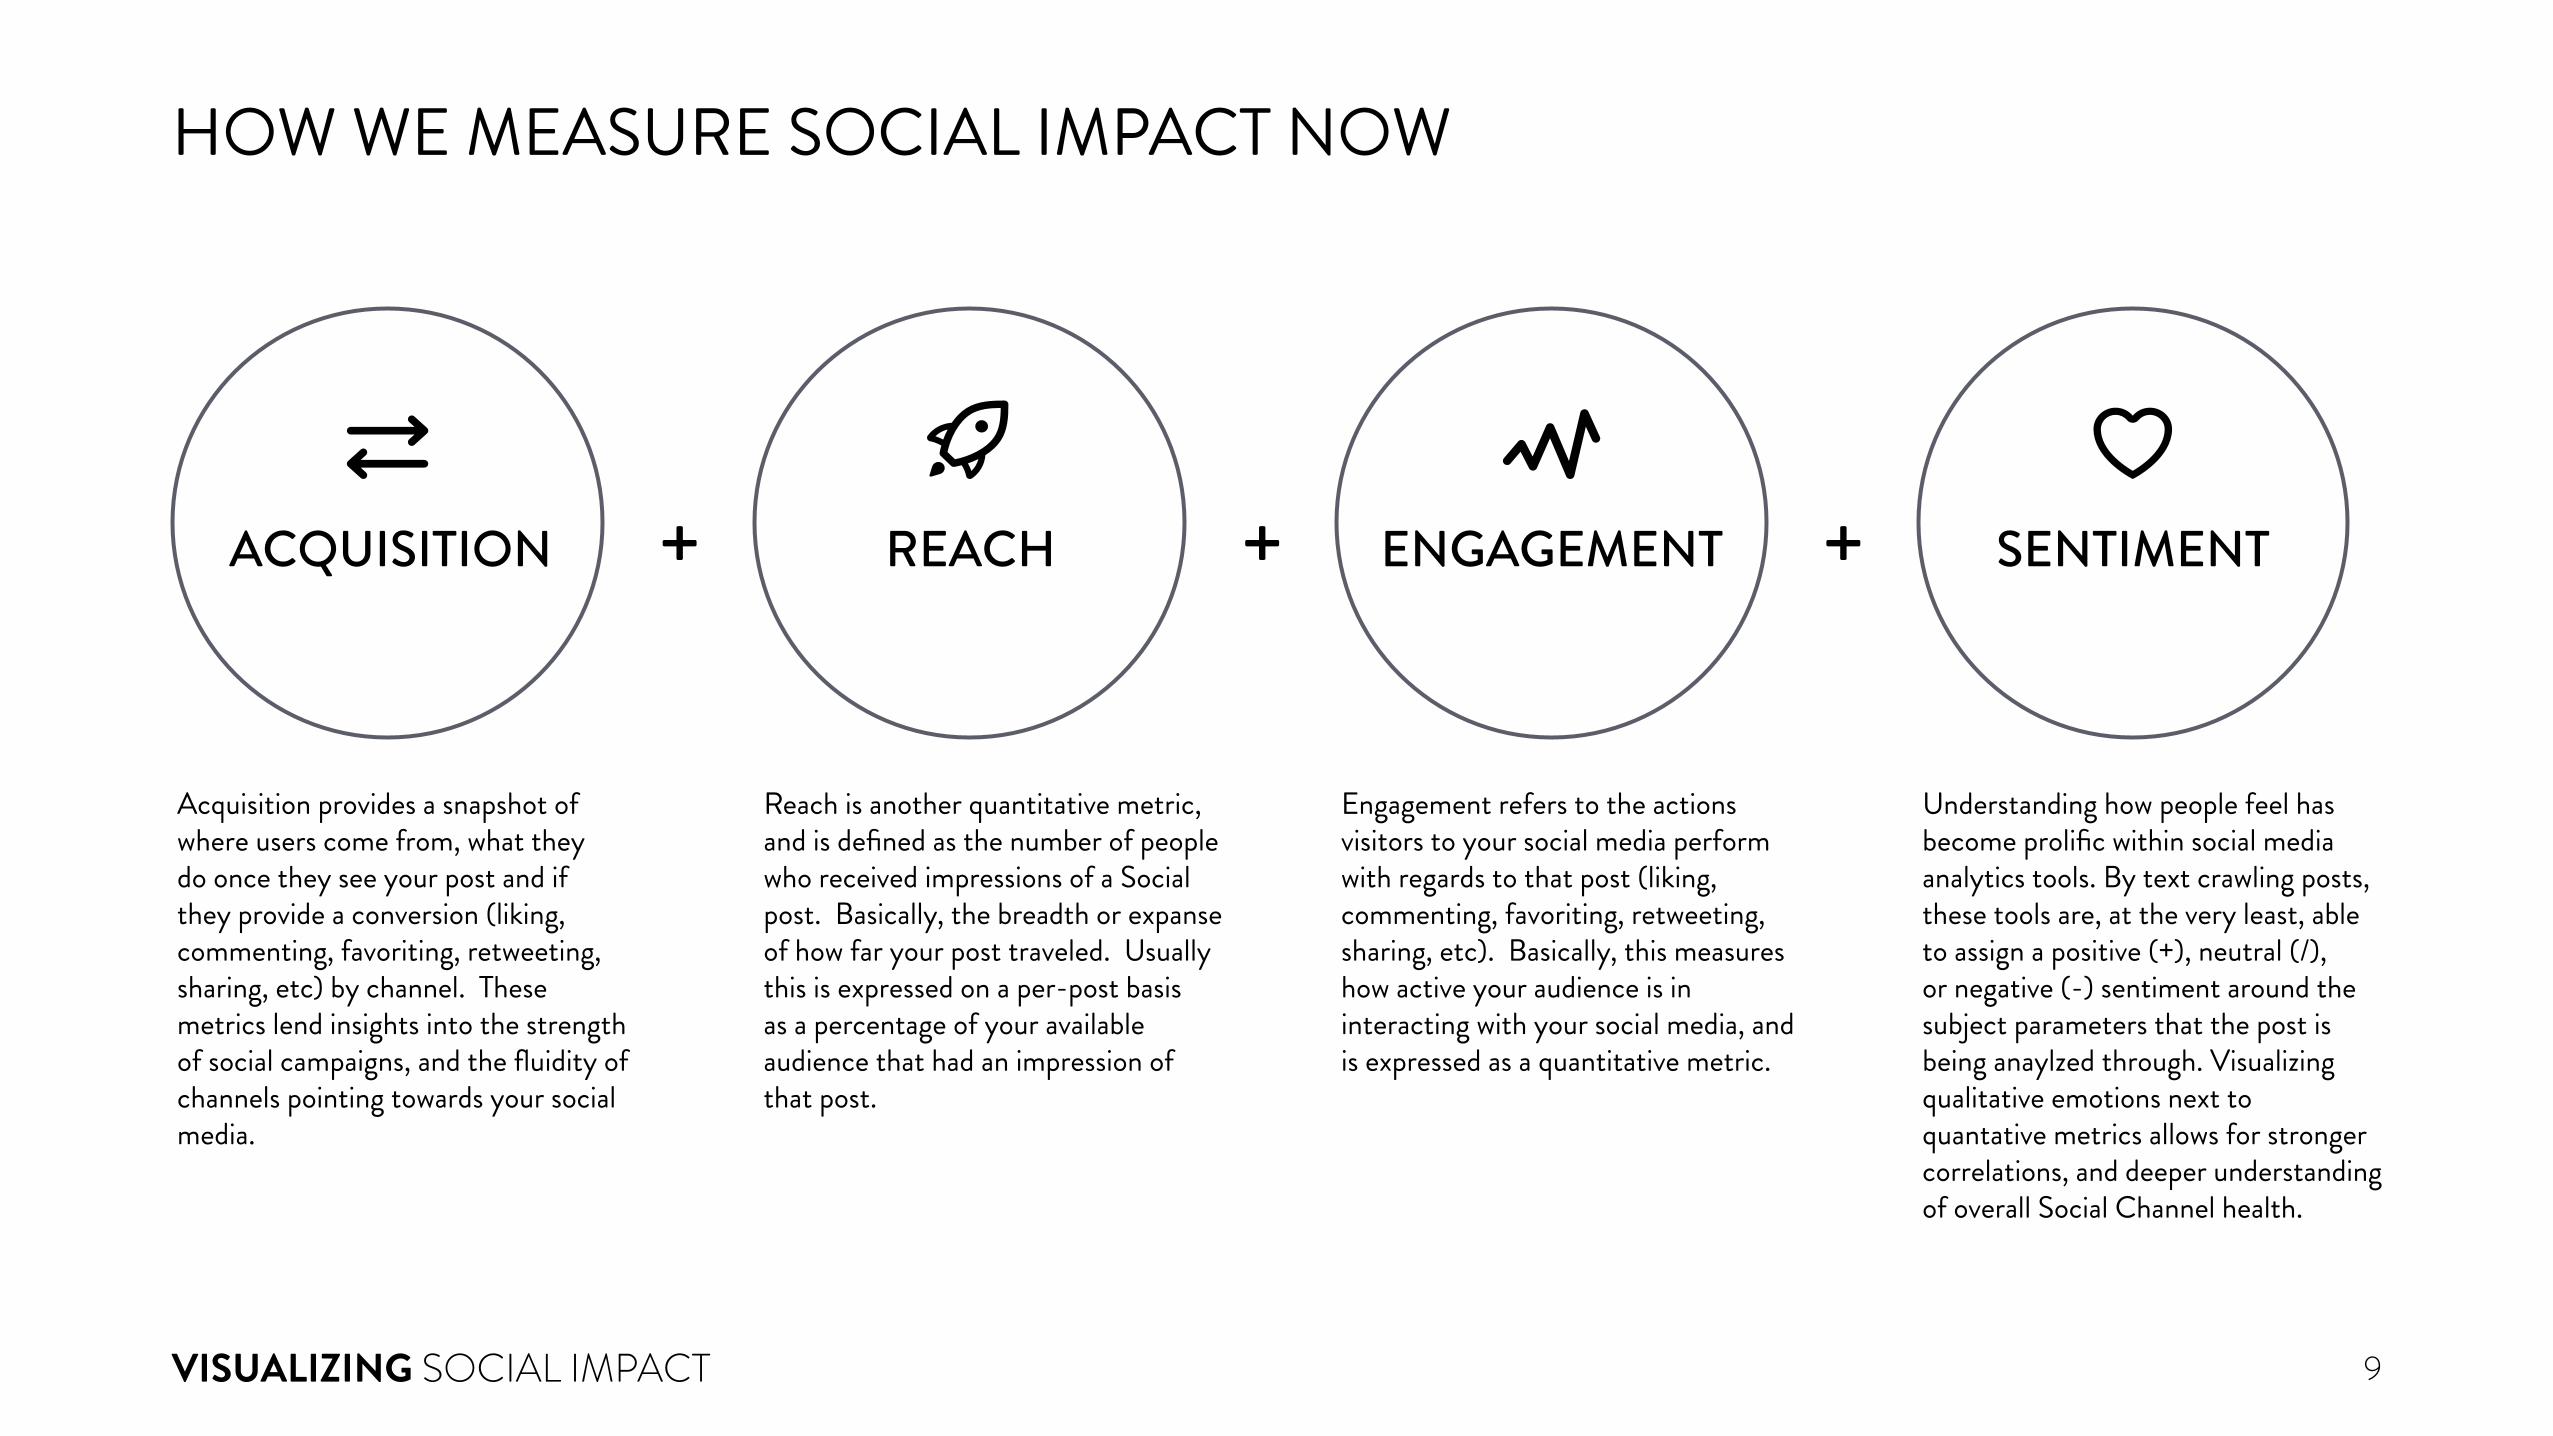
Reach is another quantitative metric, and is defined as the number of people who received impressions of a Social post. Basically, the breadth or expanse of how far your post traveled. Usually this is expressed on a per-post basis as a percentage of your available audience that had an impression of that post.
Acquisition provides a snapshot of where users come from, what they do once they see your post and if they provide a conversion (liking, commenting, favoriting, retweeting, sharing, etc) by channel. These metrics lend insights into the strength of social campaigns, and the fluidity of channels pointing towards your social media.
Engagement refers to the actions visitors to your social media perform with regards to that post (liking, commenting, favoriting, retweeting, sharing, etc). Basically, this measures how active your audience is in interacting with your social media, and is expressed as a quantitative metric.
Understanding how people feel has become prolific within social media analytics tools. By text crawling posts, these tools are, at the very least, able to assign a positive (+), neutral (/), or negative (-) sentiment around the subject parameters that the post is being anaylzed through. Visualizing qualitative emotions next to quantative metrics allows for stronger correlations, and deeper understanding of overall Social Channel health.
ACQUISITION REACH ENGAGEMENT SENTIMENT
9VISUALIZING SOCIAL IMPACT
HOW WE MEASURE SOCIAL IMPACT NOW
++ +

How we visualize these metrics shouldCRAFT A NARRATIVE.

...FASTER THAN GEORGE R.R. MARTINWRITES HIS NOVELS(5 GoT novels in 24 years... 2 left)

This narrative gets formed when you JUXTAPOSE METRICS and create RELATIONSHIPS over time.

STRATEGIES FOR VISUALIZING SOCIAL
VISUALIZING SOCIAL IMPACT 13
UNDERSTAND METRICS,
DEFINE KPIs
Understanding the metrics that can be correlated requires an intimate development knowledge of each social channel’s API. In our own work, we’ve experienced headache with making the disparate channel’s APIs play nicely together, version control and changes each API makes, and normalizing the nomenclature each platform boasts to juxtapose metrics usefully. Key Performance Indicators help evaluate the performative success of our social media visualization strategy.

STRATEGIES FOR VISUALIZING SOCIAL
VISUALIZING SOCIAL IMPACT 14
UNDERSTAND METRICS,
DEFINE KPIs
EMPLOYMEASUREMENT
STRATEGY
Once KPIs are formalized, a strategy should be crafted to measure and analyze the performance towards those goals. This strategy should be a living plan, and should always strive to be optimized for continued future growth as an insightful and actionable lens for understanding social health.
Understanding the metrics that can be correlated requires an intimate development knowledge of each social channel’s API. In our own work, we’ve experienced headache with making the disparate channel’s APIs play nicely together, version control and changes each API makes, and normalizing the nomenclature each platform boasts to juxtapose metrics usefully. Key Performance Indicators help evaluate the performative success of our social media visualization strategy.

STRATEGIES FOR VISUALIZING SOCIAL
VISUALIZING SOCIAL IMPACT 15
UNDERSTAND METRICS,
DEFINE KPIs
EMPLOYMEASUREMENT
STRATEGY
SET VISUALHIERARCHY
Once KPIs are formalized, a strategy should be crafted to measure and analyze the performance towards those goals. This strategy should be a living plan, and should always strive to be optimized for continued future growth as an insightful and actionable lens for understanding social health.
Understanding the metrics that can be correlated requires an intimate development knowledge of each social channel’s API. In our own work, we’ve experienced headache with making the disparate channel’s APIs play nicely together, version control and changes each API makes, and normalizing the nomenclature each platform boasts to juxtapose metrics usefully. Key Performance Indicators help evaluate the performative success of our social media visualization strategy.
Visual hierarchy refers to the arrangement or presentation of elements in a way that implies importance. In other words, visual hierarchy influences the order in which the human eye perceives what it sees, thus dictating the cognitive load required to understand the metrics and the actionable efficiency for the narrative presented.

STRATEGIES FOR VISUALIZING SOCIAL
VISUALIZING SOCIAL IMPACT 16
UNDERSTAND METRICS,
DEFINE KPIs
EMPLOYMEASUREMENT
STRATEGY
SET VISUALHIERARCHY
UTILIZEINFOGRAPHIC
DESIGN
Once KPIs are formalized, a strategy should be crafted to measure and analyze the performance towards those goals. This strategy should be a living plan, and should always strive to be optimized for continued future growth as an insightful and actionable lens for understanding social health.
Understanding the metrics that can be correlated requires an intimate development knowledge of each social channel’s API. In our own work, we’ve experienced headache with making the disparate channel’s APIs play nicely together, version control and changes each API makes, and normalizing the nomenclature each platform boasts to juxtapose metrics usefully. Key Performance Indicators help evaluate the performative success of our social media visualization strategy.
Visual hierarchy refers to the arrangement or presentation of elements in a way that implies importance. In other words, visual hierarchy influences the order in which the human eye perceives what it sees, thus dictating the cognitive load required to understand the metrics and the actionable efficiency for the narrative presented.
Every picture tells a story, as they say, but sometimes it takes a clever combination of words and graphs to tell a story quickly, concisely and such that it provides actionable insights to the user. Using a strong infographic design toolkit synthesizes the data collected, and crafts a narrative that is easily digestable.

VISUALIZING SOCIAL IMPACT 17
DRAW!

WHERE WE’RE GOING, WE DON’T NEED ROADS

VISUALIZING SOCIAL IMPACT 19
A MORE HOLISTIC APPROACH
DIGITAL + PHYSICAL
Social media buffs have spent years touting that they have insights into a consumer’s brain based on their understanding of their audience’s social behavior. We beleive that this is only half of the story. The collection of Physical attributes like dwell, gaze, pathing, traffic, purchase history, repeat visits, and phsyical and emotional responses (blink rate, microexpressions, etc) coupled with this understanding of Social seems the way forward. By blending verifiable social, physical, and emotional data with creative excellence, we can create a deeper connection with people through more personalized, immersive experiences.

THREE SOCIAL DASHBOARDS

VISUALIZING SOCIAL IMPACT 21
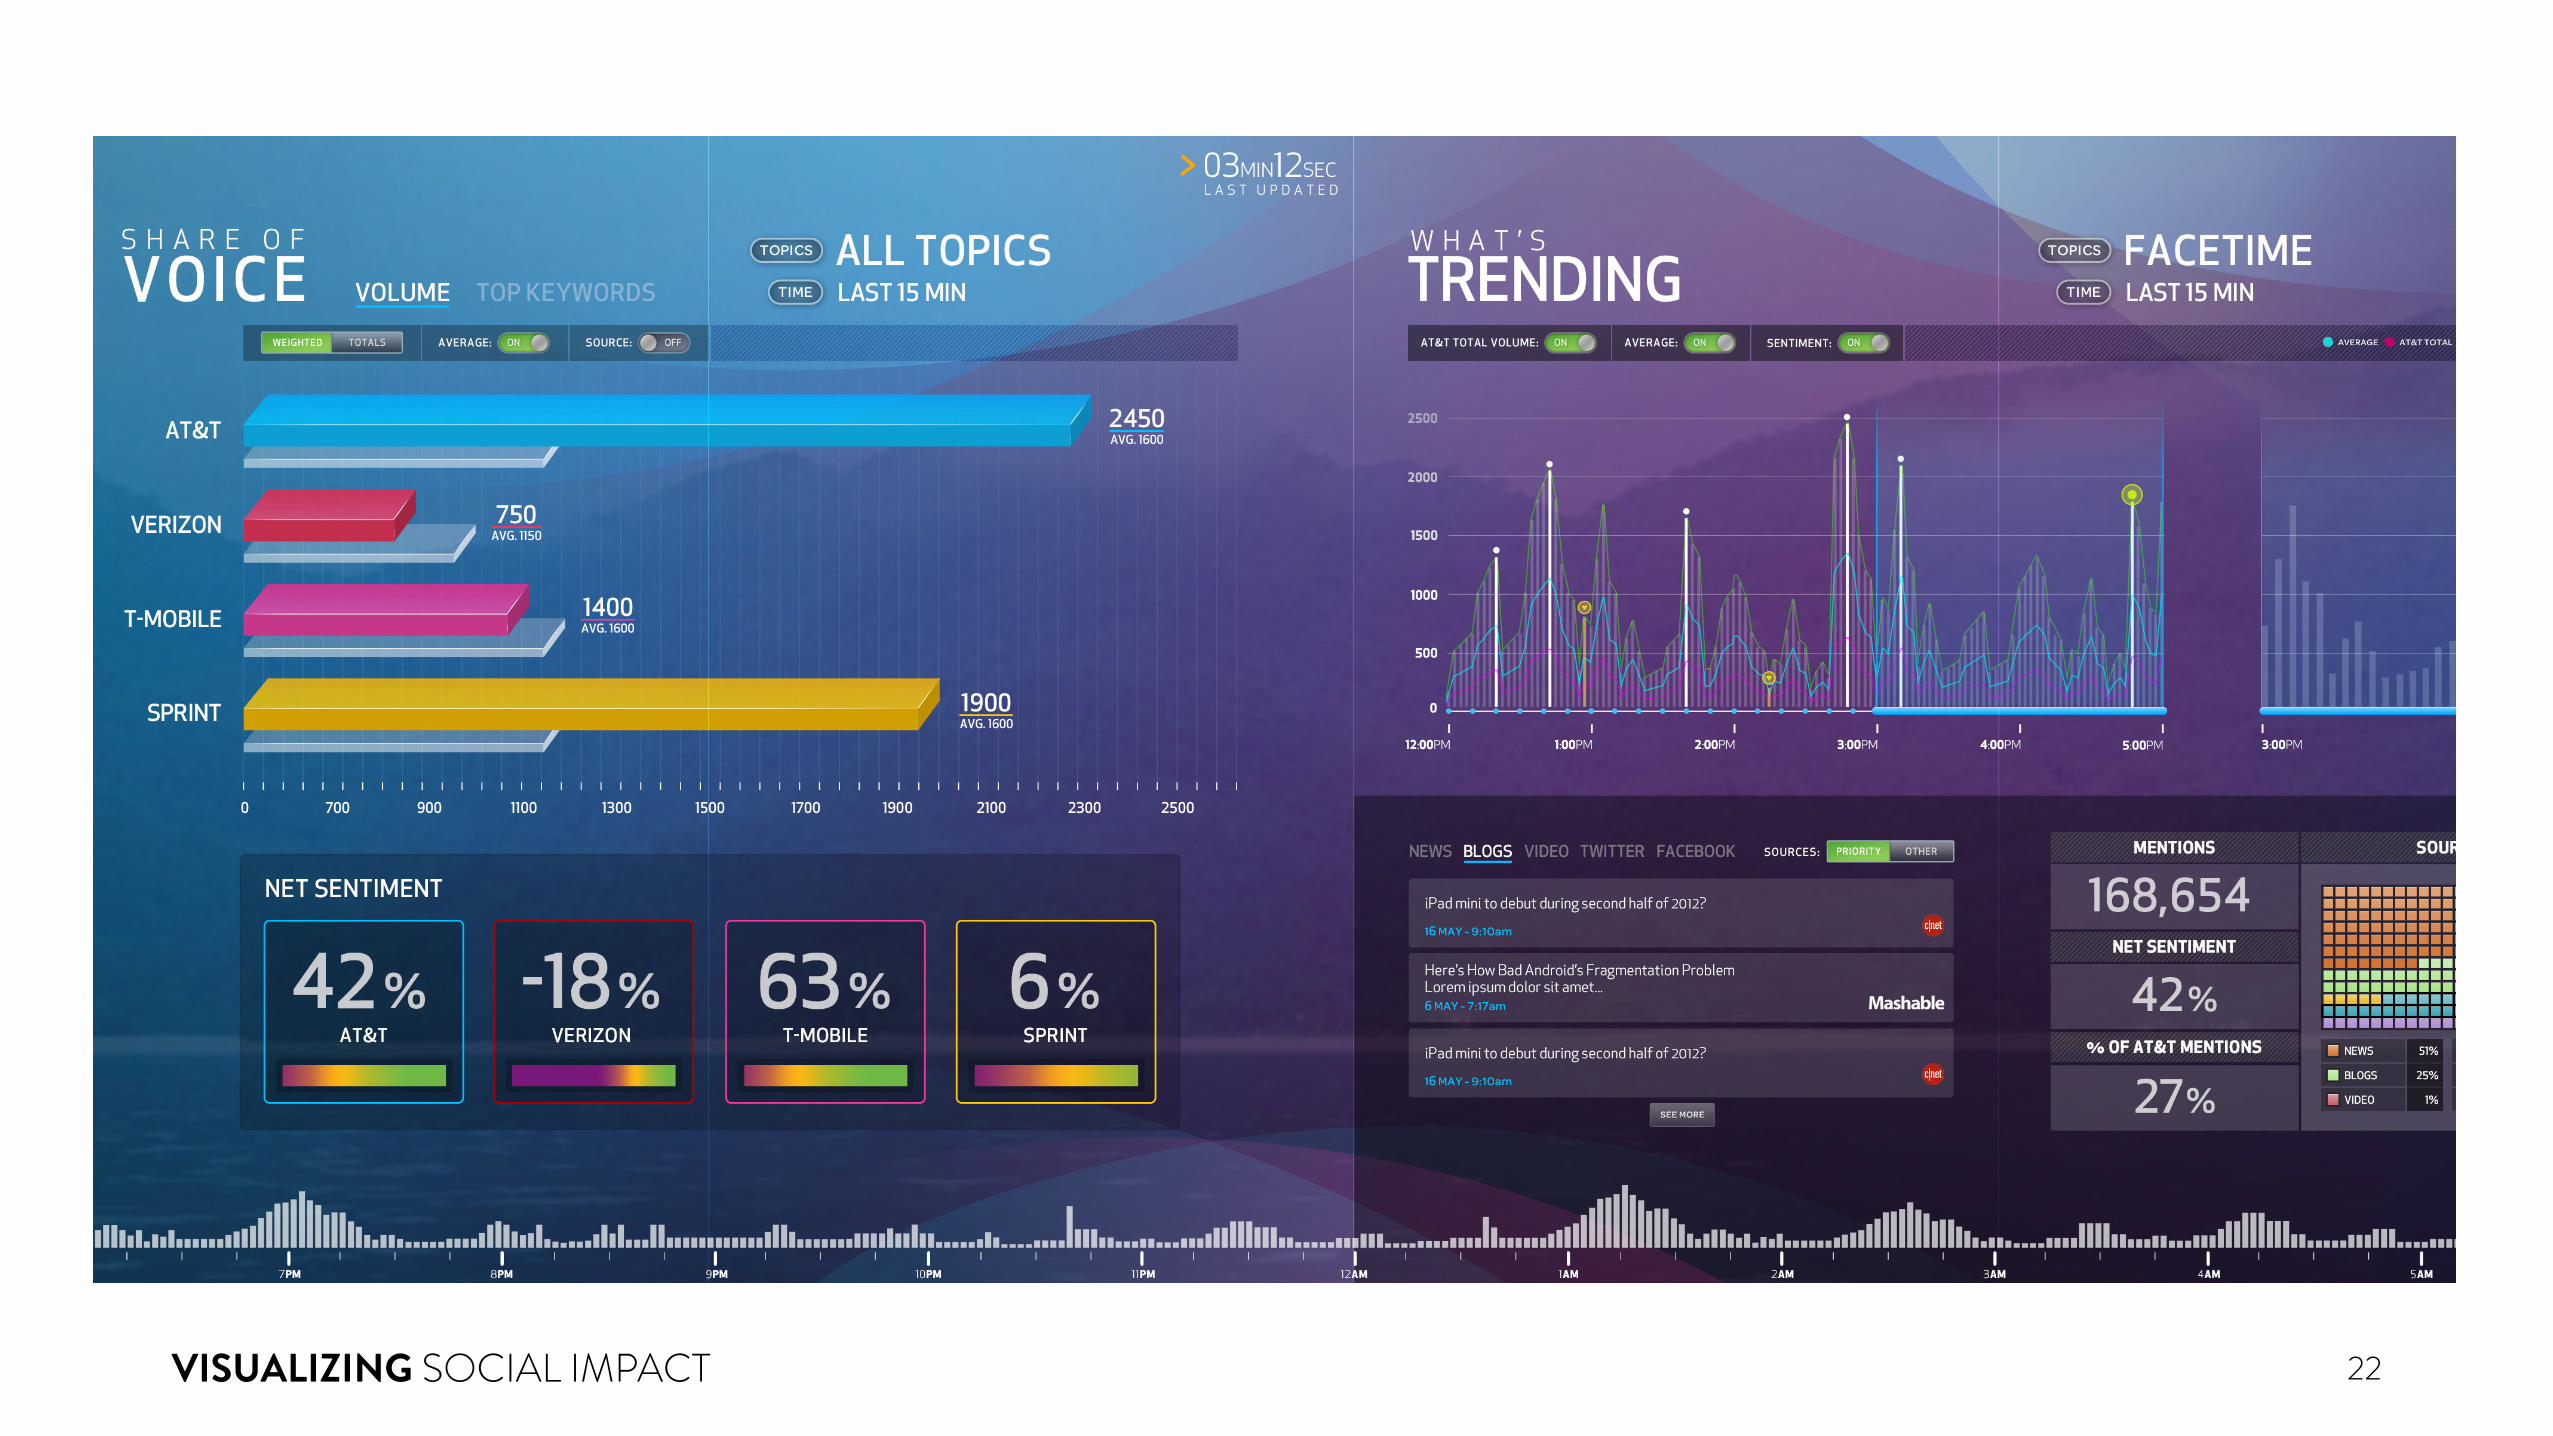
VISUALIZING SOCIAL IMPACT 22

VISUALIZING SOCIAL IMPACT 23
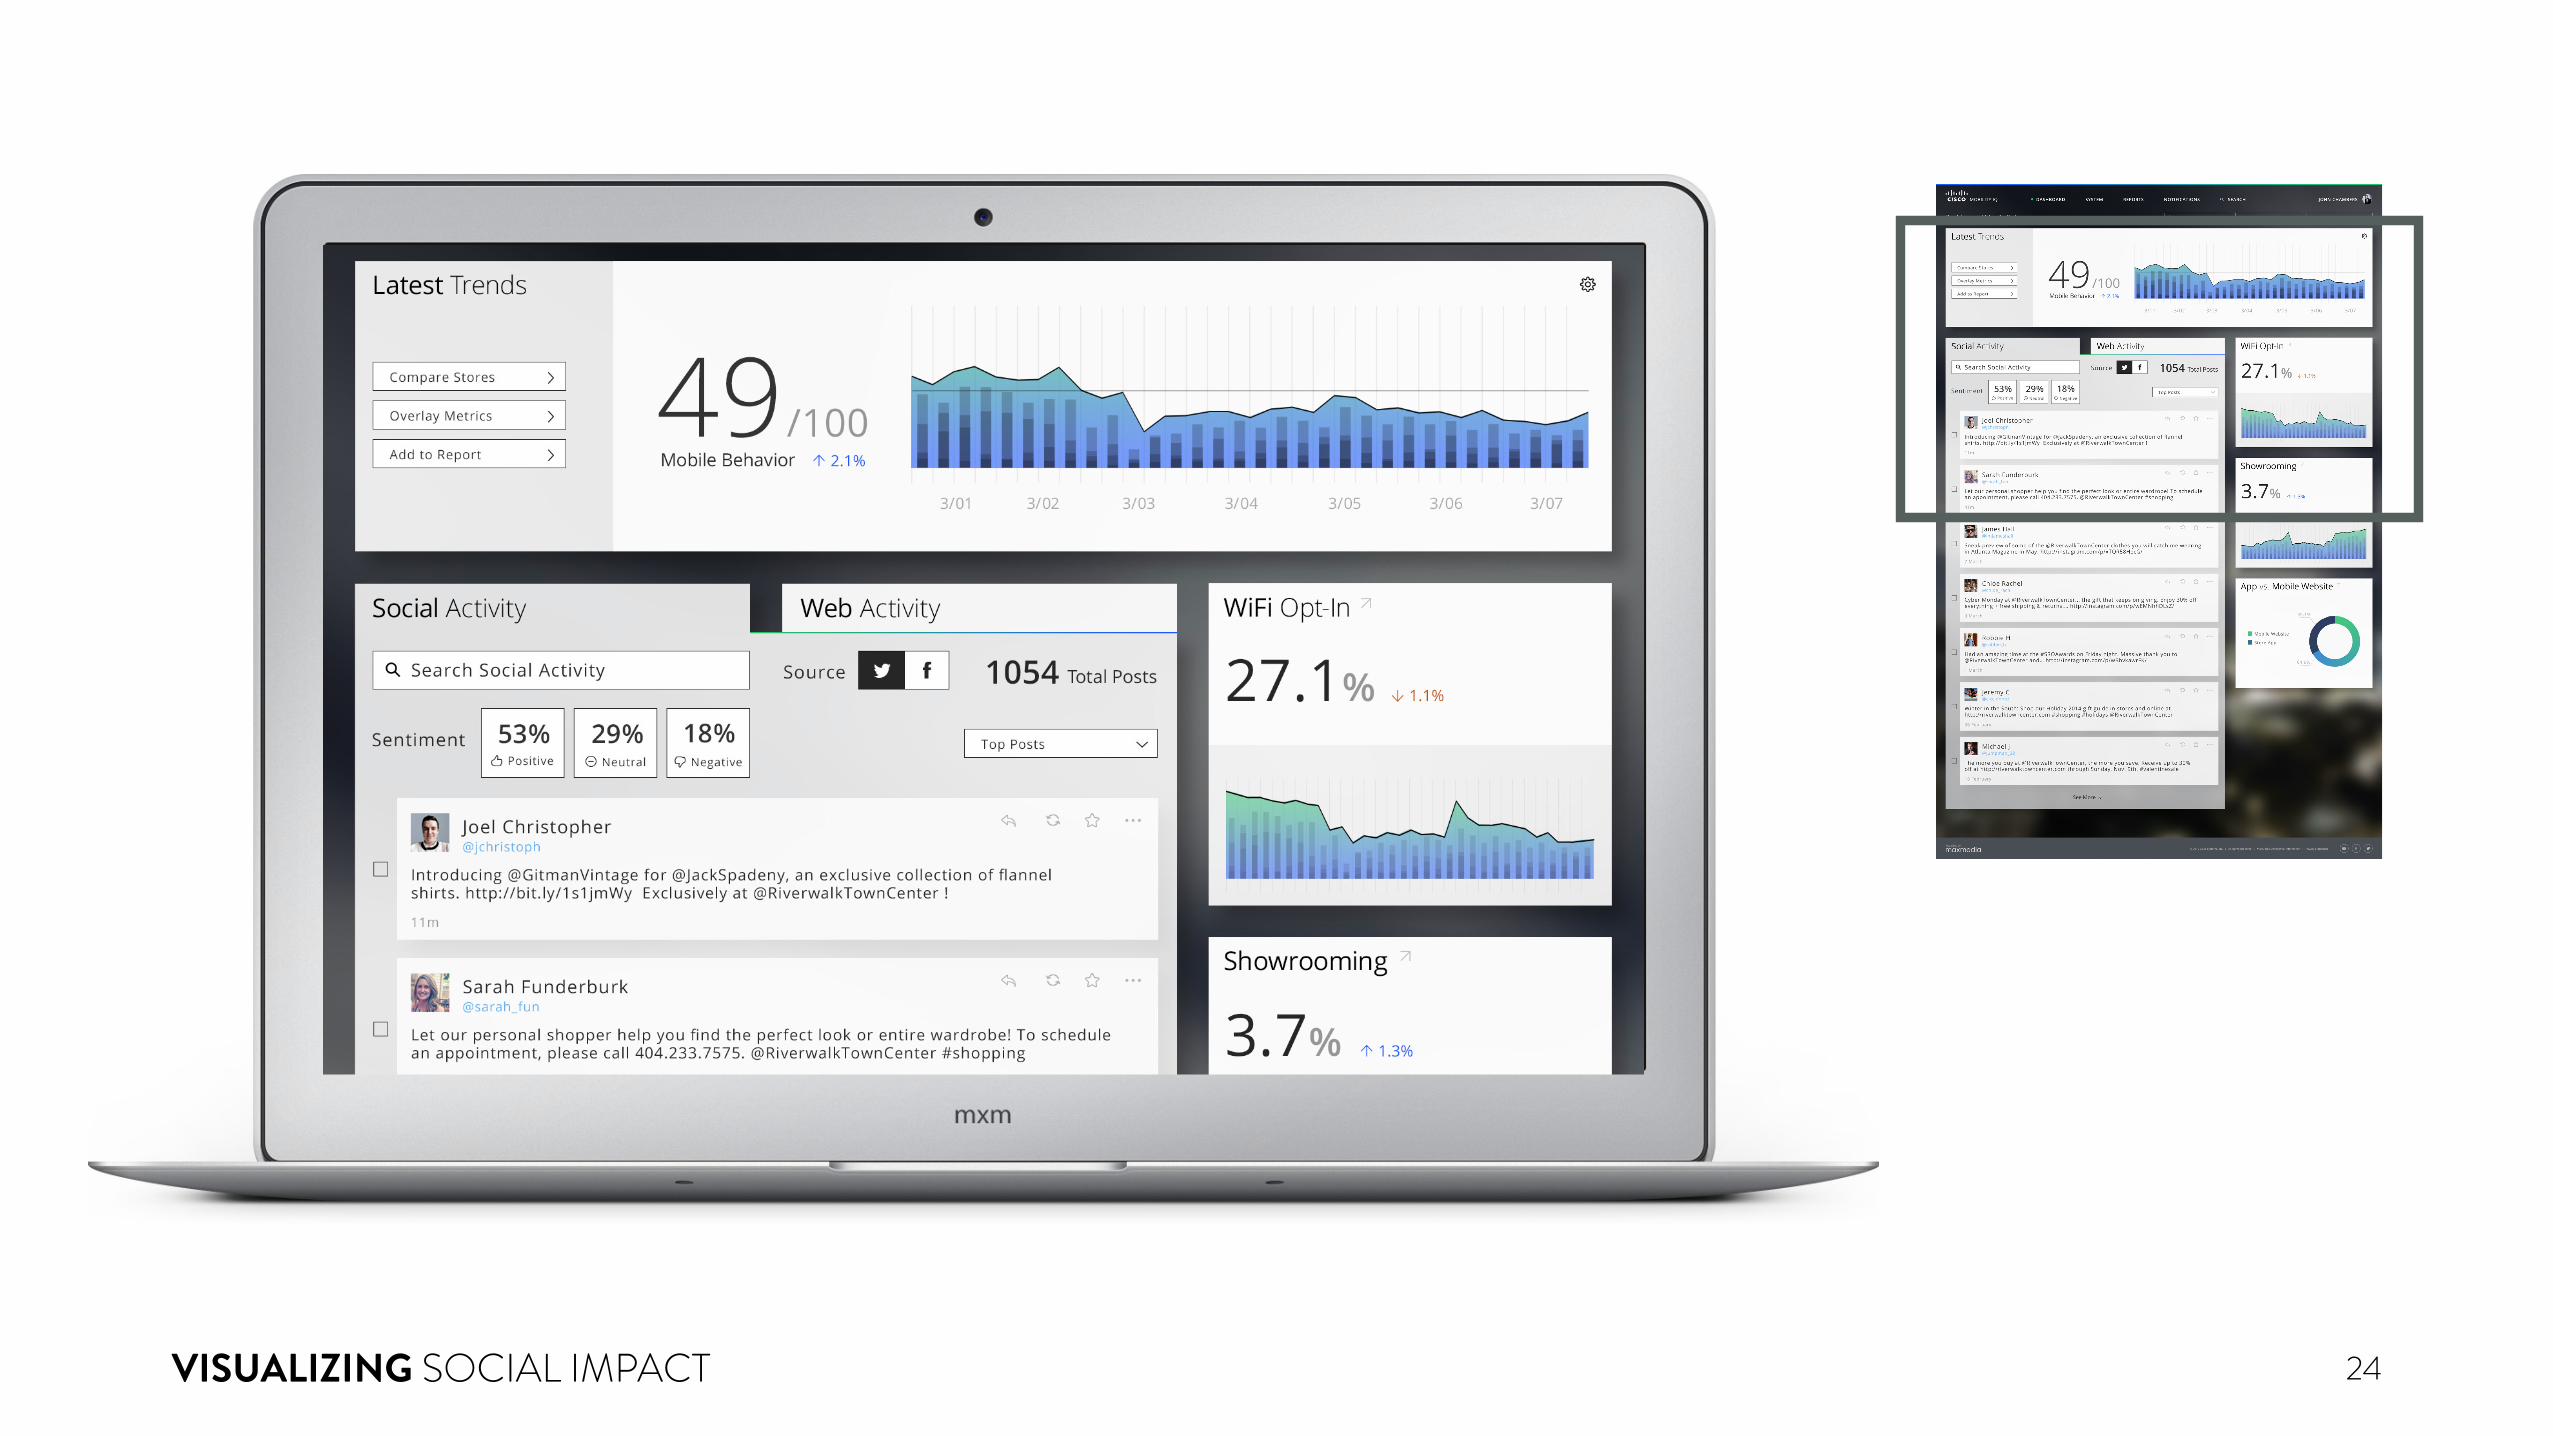
VISUALIZING SOCIAL IMPACT 24
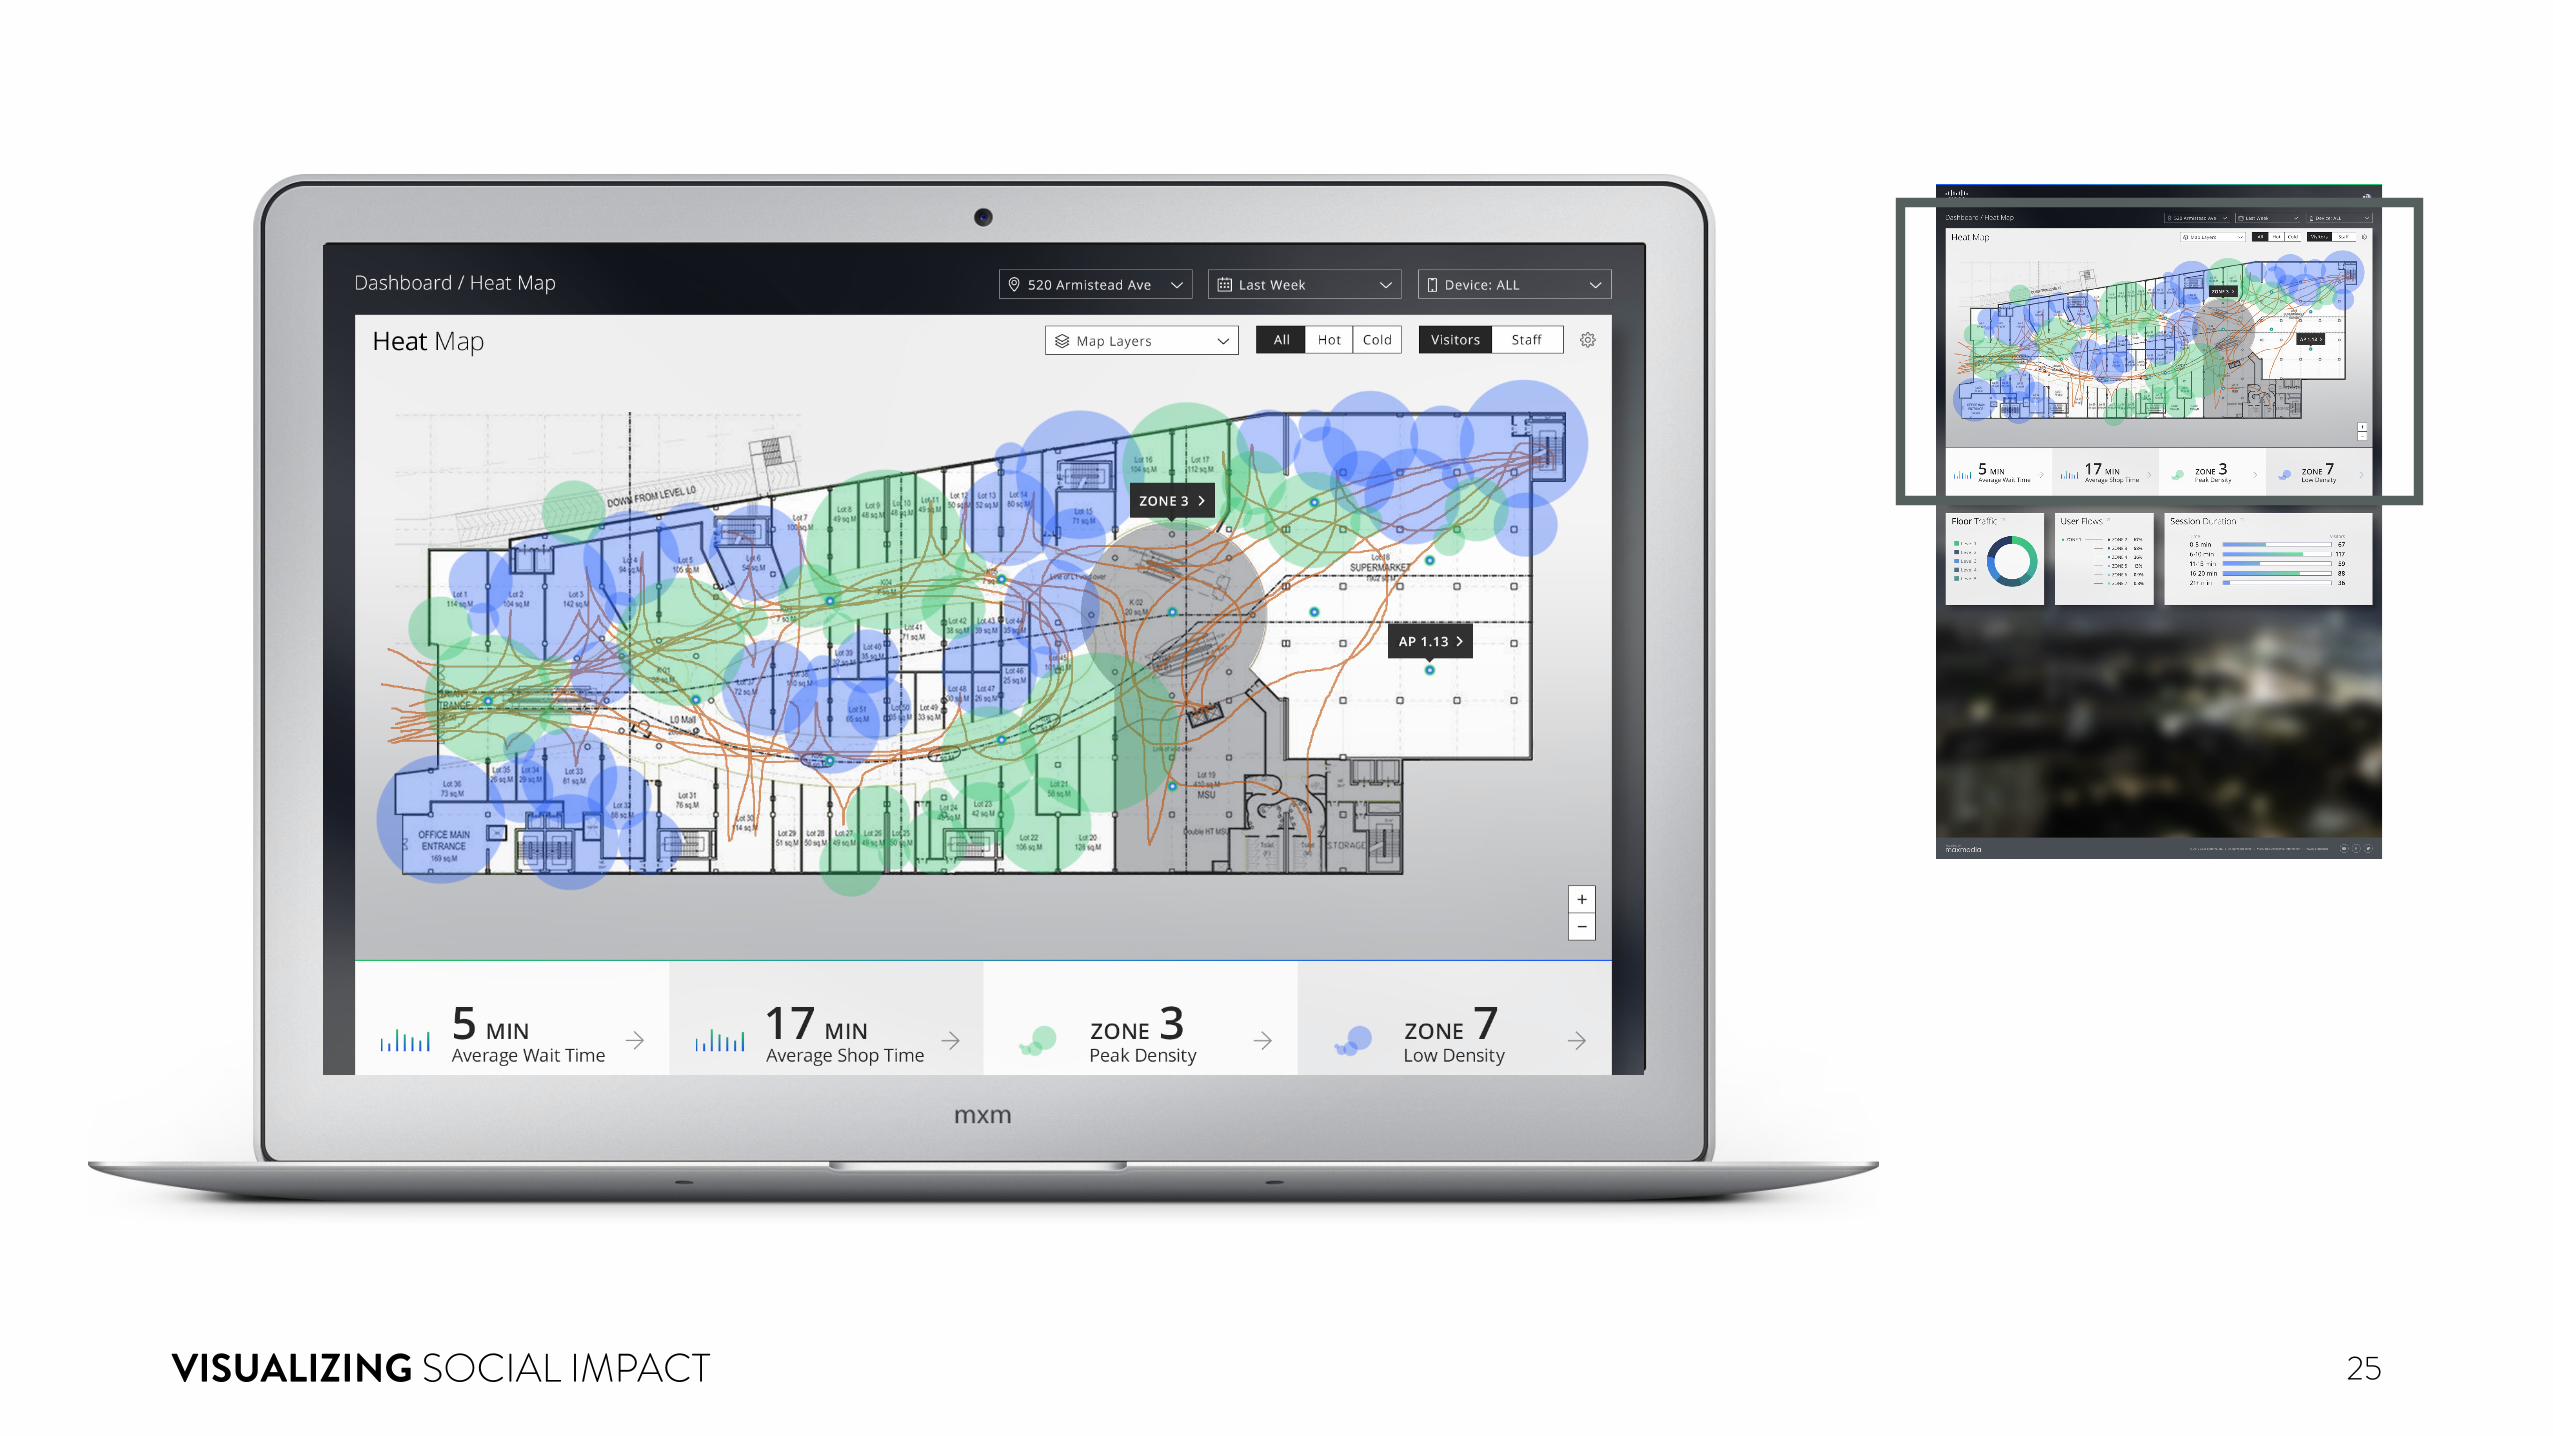
VISUALIZING SOCIAL IMPACT 25
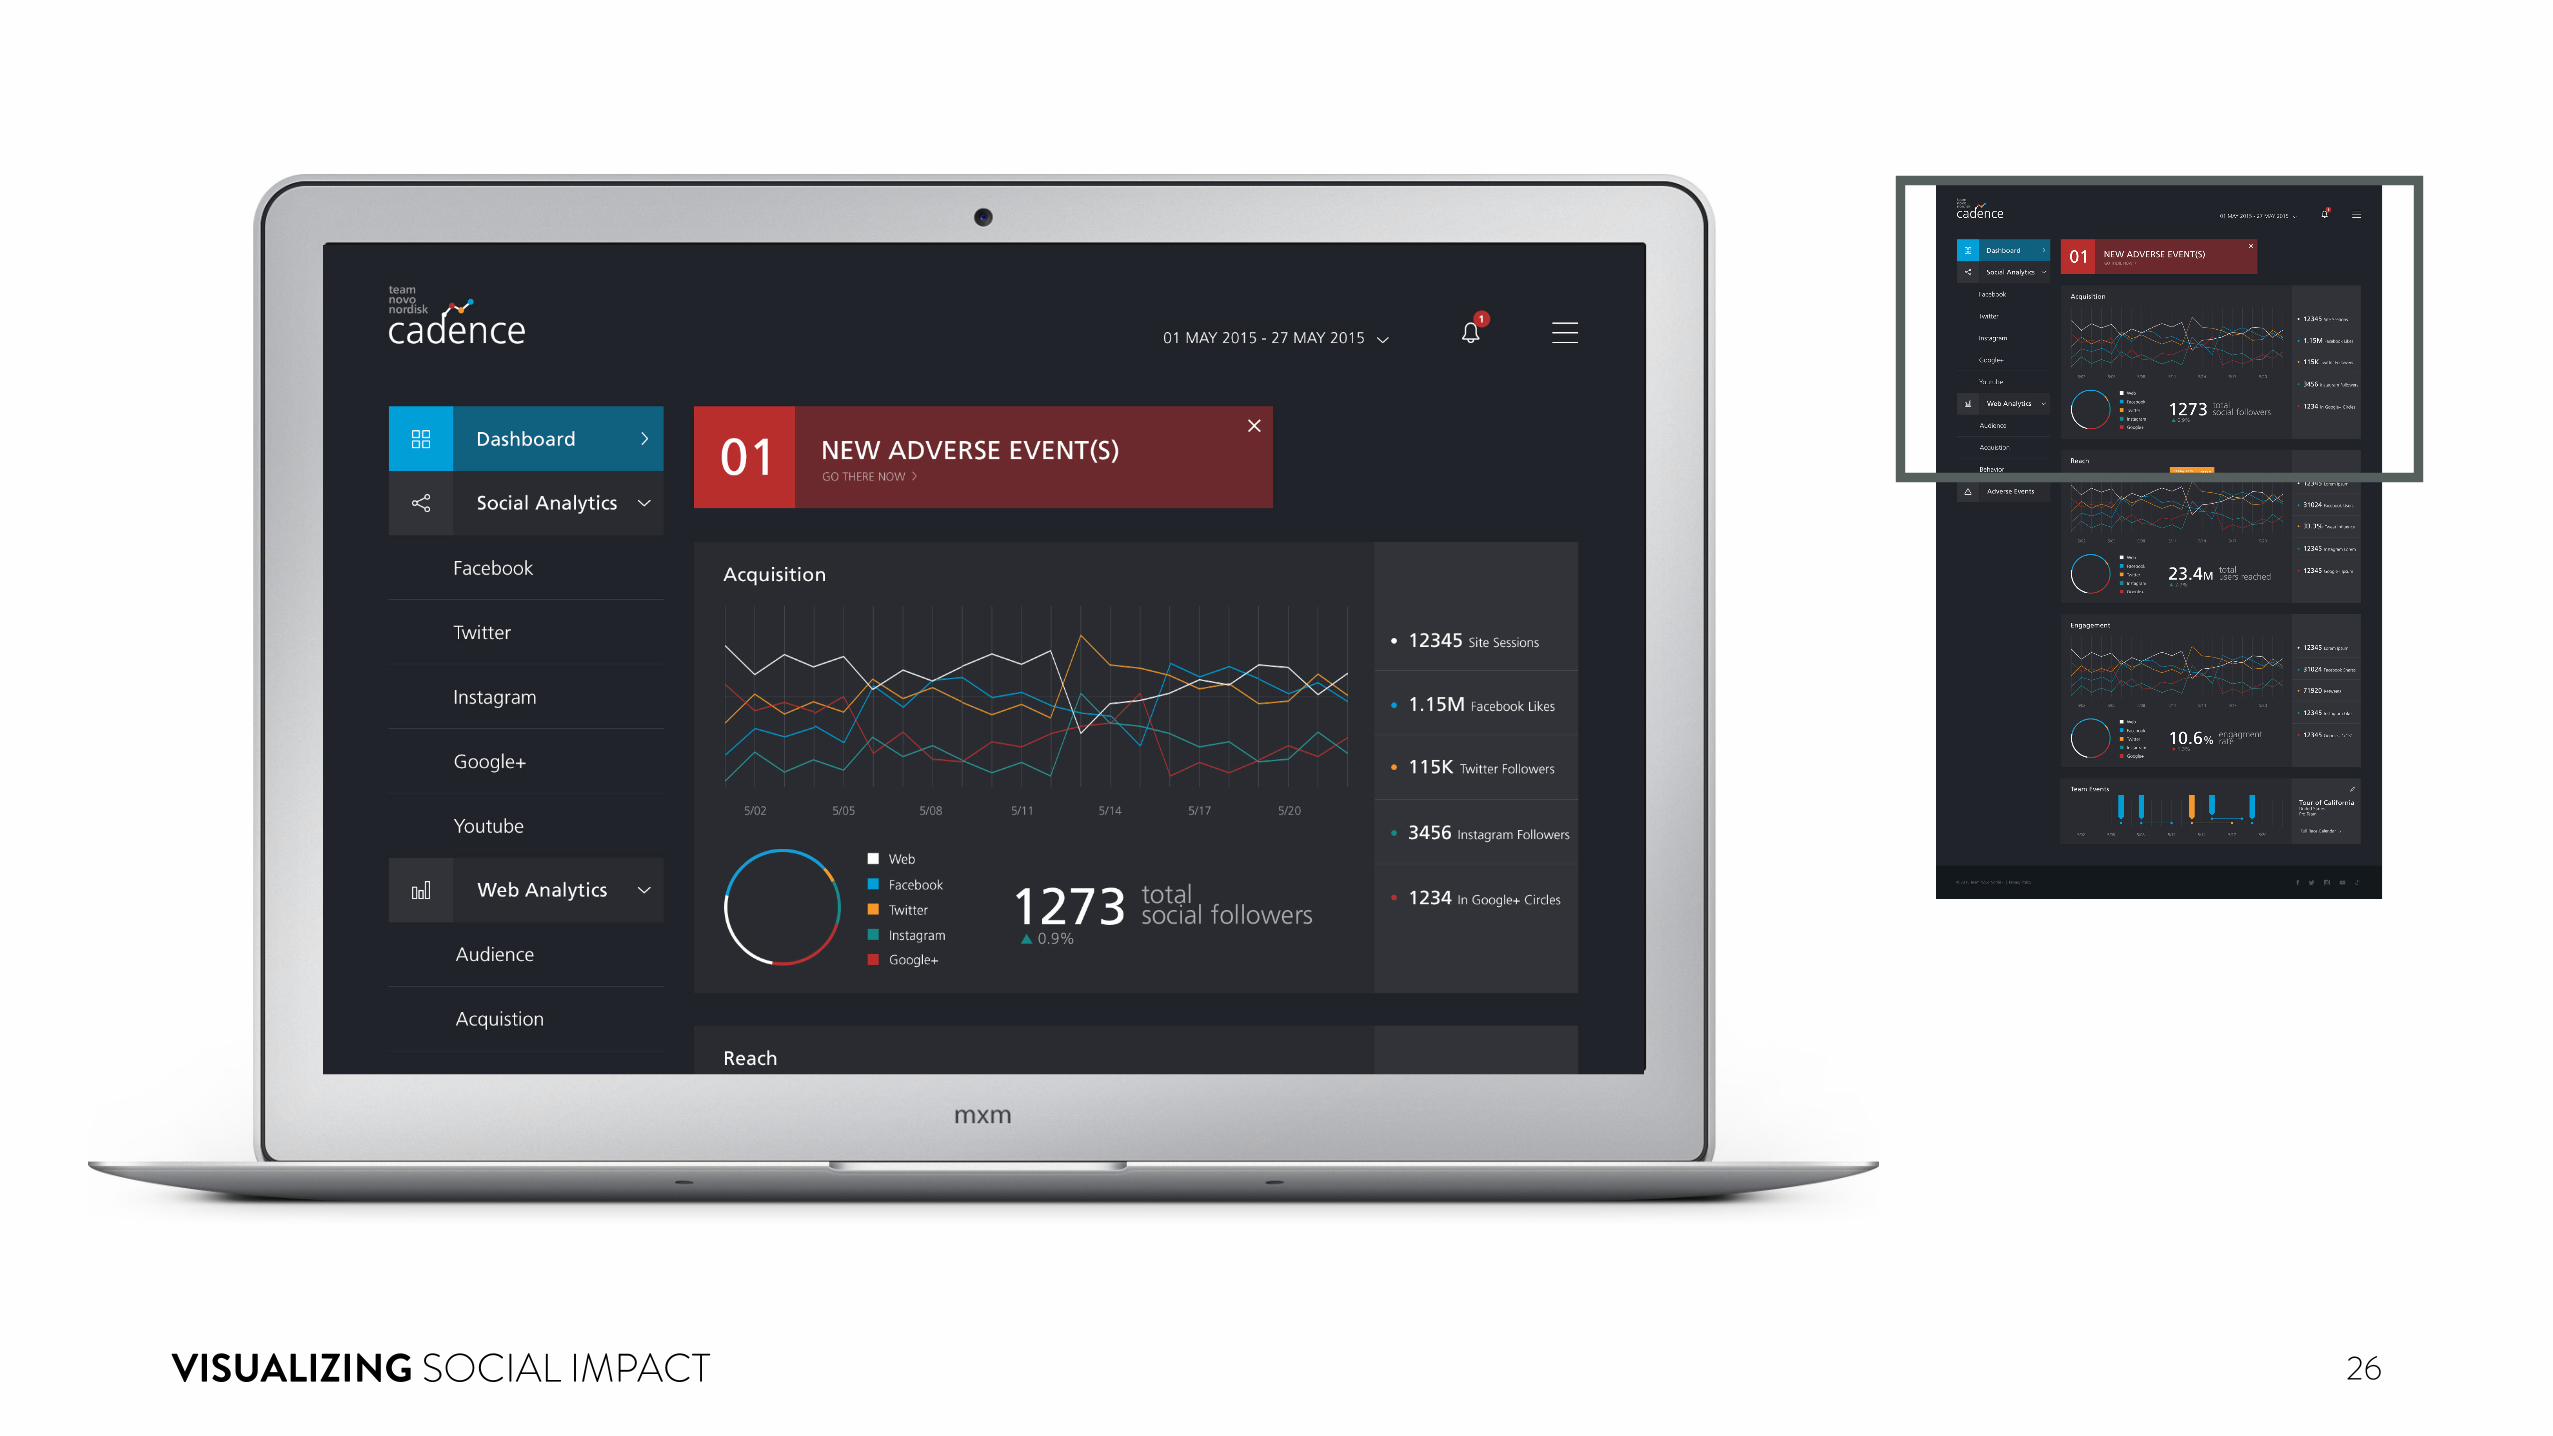
VISUALIZING SOCIAL IMPACT 26
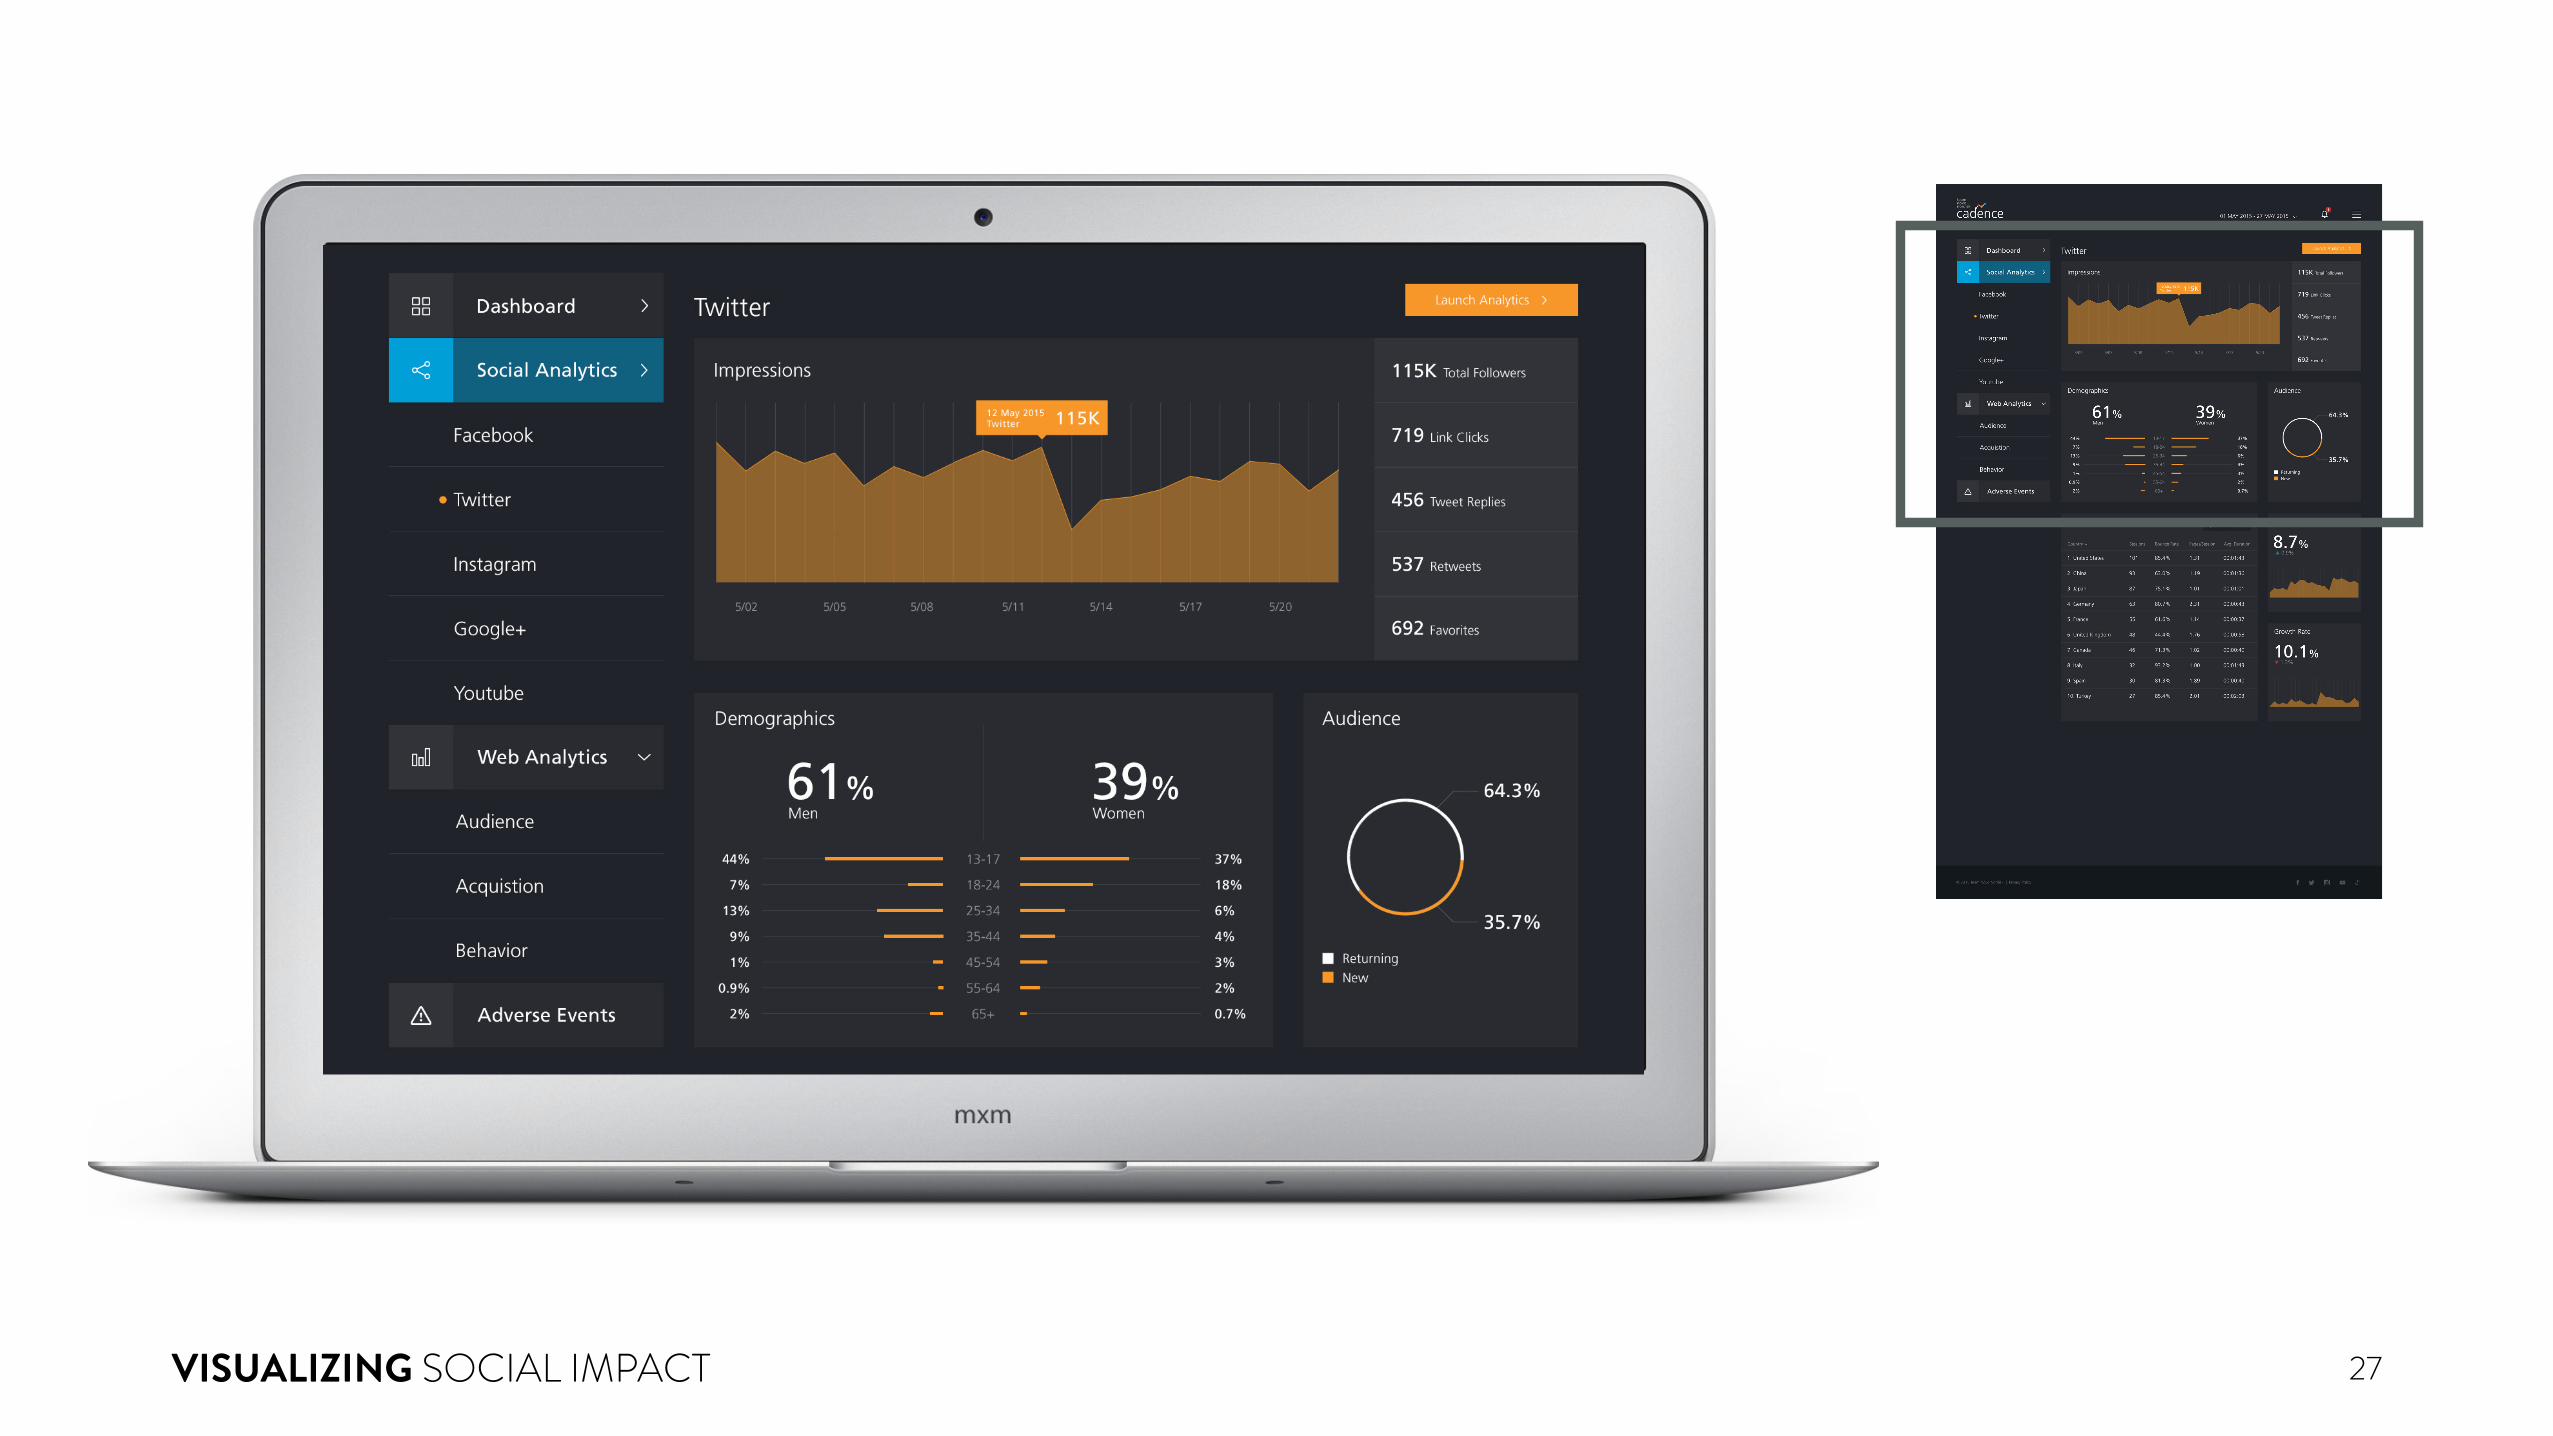
VISUALIZING SOCIAL IMPACT 27

VISUALIZING SOCIAL IMPACT 28

THANKS!