visualized articles · 2016-04-13 · visualized articles combine research, surveys/interviews and...
TRANSCRIPT
What they are and why we use themVisualized articles
Erin Cristales: [email protected]
WITH YOUR HOSTS ...
Marco Martell: [email protected]

www.surveymonkey.com/r/QQB2RZZ
Go to the following link ...

The purpose of visualizedarticlesVisualized articles combine research, surveys/interviews and images to tell a complete story graphically.They are one step beyond infographics because your reader should see themselves in the content … which means you need to survey/interview your readers.

The seven main types of visualizedarticles➔ Best/favorites➔ Flow chart➔ Timeline➔ Useful bait➔ Versus➔ By the numbers➔ Photo➔ Also incorporate quotes and
charts for impact

Best/favoritesThis type of graphic is technically a listicle, but told visually. It breaks down the best/worst or favorite/least favorite on a particular topic.Examples:➔ The best video games➔ The best Twitter posts of
2015➔ The worst “Walking
Dead” characters ever
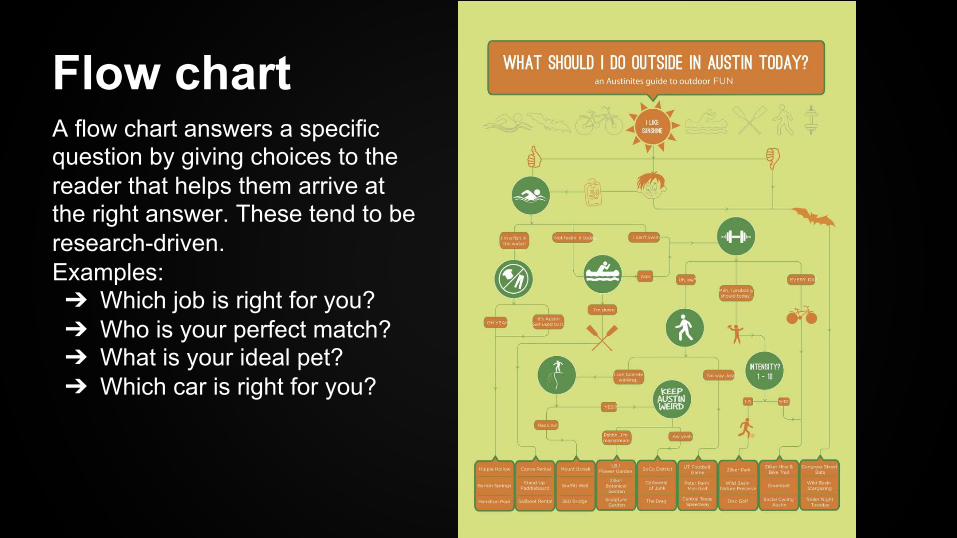
Flow chartA flow chart answers a specific question by giving choices to the reader that helps them arrive at the right answer. These tend to be research-driven.Examples:➔ Which job is right for you?➔ Who is your perfect match?➔ What is your ideal pet?➔ Which car is right for you?
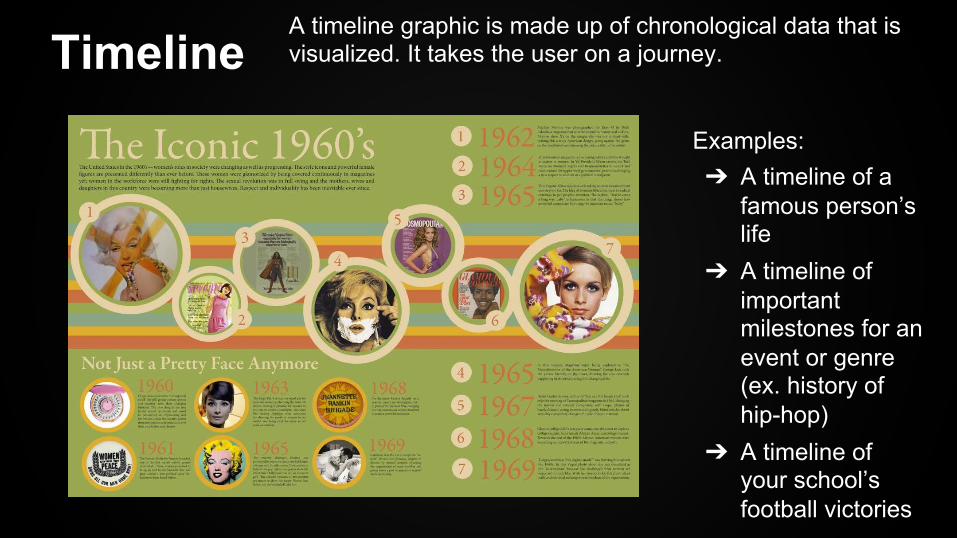
TimelineA timeline graphic is made up of chronological data that is visualized. It takes the user on a journey.
Examples:➔ A timeline of a
famous person’s life
➔ A timeline of important milestones for an event or genre (ex. history of hip-hop)
➔ A timeline of your school’s football victories

A way to explain something or answer a question by visually showing how to do it. It can be great to get quotes from students who have experience with the topic you are discussing.
Useful bait
Examples:➔ How to train for
your first marathon
➔ How to perfect a particular soccer move
➔ How to throw the perfect birthday party
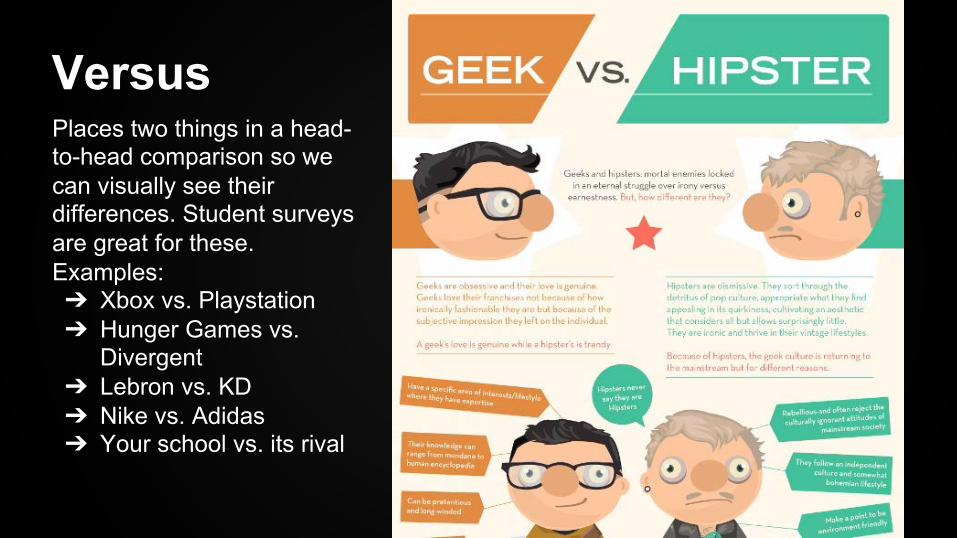
VersusPlaces two things in a head-to-head comparison so we can visually see their differences. Student surveys are great for these.Examples:➔ Xbox vs. Playstation➔ Hunger Games vs.
Divergent➔ Lebron vs. KD➔ Nike vs. Adidas➔ Your school vs. its rival
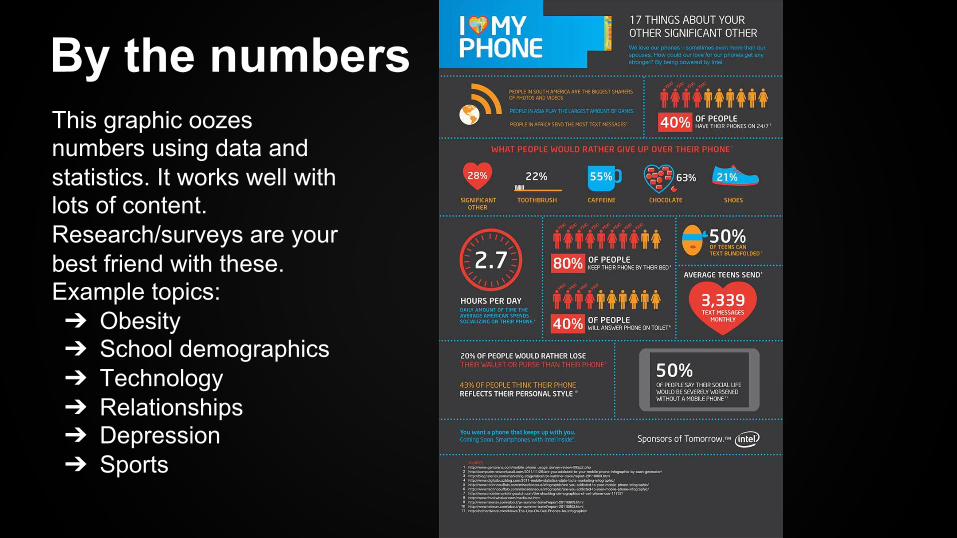
By the numbersThis graphic oozes numbers using data and statistics. It works well with lots of content. Research/surveys are your best friend with these.Example topics:➔ Obesity➔ School demographics➔ Technology➔ Relationships➔ Depression➔ Sports

PhotoUses photos to visualize the content of tell the story. Text is used to describe and explain the elements in the photo. Use research/student or staff quotes for text.Example topics:➔ School blueprint➔ Sports/academic clubs➔ Shoes➔ Anatomy of a classroom➔ Dress code


Programs forcreating graphicsYou can use Photoshop or Illustrator for infographics.It is much easier to create charts and graphs in Illustrator.You can also use InDesign to create interactive graphics that use motion, video, sound, etc.Click on the video to the right to learn how to create interactive graphics in InDesign.

Other programs for the less Adobe Creative Suite inclined ...Canva (Canva.com) ~ FreePiktochart (Piktochart.com) ~ Basic is free; Pro is notVenngage (Venngage.com) ~ FreeEasely.ly (Easely.ly) ~ FreeInfogr.am (Infogr.am) ~ FreeDipity (Dipity.com) ~ Great for interactive timelines; is free,
but user can upgrade Visme (Visme.co) ~ Free, with (pay) premium features

How do you get the info?Online surveys/pollsIn-person interviewsRESEARCH!!!And inspiration ...
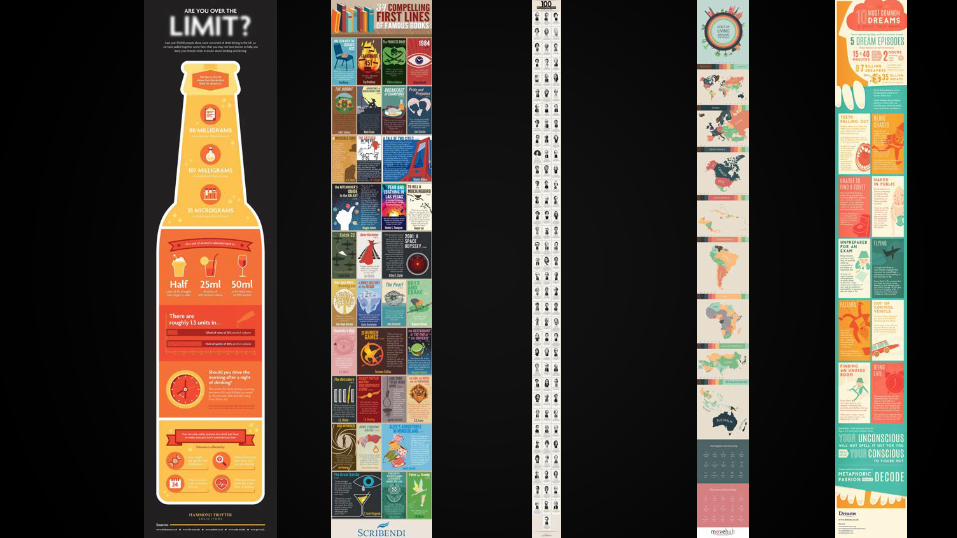
Look at great examples ...Go to GOOD Infographics, online newspaper sites, advertising/marketing agencies like 160over90, Design Taxi on Twitter, Pinterest.
Look at what the design is … and what it could be for your audience.


Exampleshttps://www.good.is/infographics/gap-girl-power-101#open
https://www.good.is/infographics/infographic-why-it-s-physically-impossible-to-look-like-barbie#open

BrainstormUse the handout provided to think of a few visualized article ideas. I would LOVE for volunteers to share what they’re thinking.