visualization of transport pathways for organic compounds in undisturbed soil monoliths
TRANSCRIPT
Geoderma 195–196 (2013) 70–78
Contents lists available at SciVerse ScienceDirect
Geoderma
j ourna l homepage: www.e lsev ie r .com/ locate /geoderma
Visualization of transport pathways for organic compounds in undisturbedsoil monoliths
Roy Kasteel ⁎, Frauke Schnitzler, Anne E. Berns, Jan Vanderborght, Harry VereeckenAgrosphere Institute, IBG-3, Forschungszentrum Jülich GmbH, Leo-Brandt-Strasse, D-52425 Jülich, Germany
Abbreviations: MRZ, Merzenhausen; SCH, ScheyeBrilliant Blue; TLC, thin layer chromatography.⁎ Corresponding author at: Agroscope ACW, Plant Pr
CH-8820 Wädenswil, Switzerland. Tel. +41 44 783 62E-mail address: [email protected] (R. Kaste
0016-7061/$ – see front matter © 2012 Elsevier B.V. Allhttp://dx.doi.org/10.1016/j.geoderma.2012.11.014
a b s t r a c t
a r t i c l e i n f oArticle history:Received 3 July 2012Received in revised form 19 November 2012Accepted 21 November 2012Available online 28 December 2012
Keywords:Vadose zoneDye tracersContaminant transportPreferential flow
Small amounts of organic compounds are often found at much larger depths than expected from their organiccarbon normalized distribution coefficient (Koc). In this study the food dye Brilliant Blue (BB) was used tovisualize the (preferential) transport pathways in undisturbed soil monoliths taken from an Orthic Luvisol andfrom a Eutric Cambisol. After spiking the monoliths with 1.0 MBq of either 14C-labeled benazolin (leacher) or14C-labeled benzo[a]pyrene (BaP, nonleacher), theywere intermittently irrigated under free-draining conditionstwice weekly with 4 mm of rain water for 17 weeks. BB (4 g L−1) was added to the rain water during the last4 weeks. After irrigation, the monoliths were sliced and photographs were taken from horizontal cross-sections. Soil was dried and incinerated to measure total 14C-activity. The mean travel depth for benazolin(6–7 cm) was larger than for BaP (2 cm), which is in line with their Koc values, although BaP was much moremobile than expected from the Koc value. BB patterns, arbitrarily classified into five intensity classes, showedthat large parts of the monolith were bypassed below the completely stained upper two to five centimeter.Furthermore, BB patterns indicated the locations of strongly sorbing compounds in the deeper soil layersand are therefore a helpful tool to selectively sample the soil for these compounds. A continuously stainedroot channel below the 20-cm depth contained substantial amounts of BaP, indicating that soil structure cannotbe neglected to assess the fate of nonleachers in undisturbed soils.
© 2012 Elsevier B.V. All rights reserved.
1. Introduction
Small amounts of xenobiotics are often found at much largerdepths than expected from their chemical properties (Flury, 1996).For nonpolar, non-ionisable compounds, strong positive correlationshave been observed between sorption strength, expressed as thedistribution coefficient, Kd, which characterizes the partitioning of asolute between the liquid and the solid phase, and total soil organiccarbon (e.g. Mermoud et al., 2008). This led to the development of thewidely-used approach of the organic carbon normalized distributioncoefficient, Koc, where the distribution coefficient, Kd, was normalizedby the total organic carbon content, foc, thus decreasing the variabilityof the distribution coefficients between different sites. Implicit assump-tions for the application of this bulk soil approach to assess transportvelocities of organic contaminants are local sorption equilibrium(Valocchi, 1985) and uniform water flow.
However, several objections can be raised regarding the normaliza-tion of the distribution coefficient by the total organic carbon content.First, not only the quantity of the soil organic matter, but also its nature,
rn; BaP, benzo[a]pyrene; BB,
otection Chemistry, Schloss 1,35; fax: +41 44 780 63 41.el).
rights reserved.
i.e. the composition of organic matter regarding the functional groups,affects sorption (Grathwohl, 1990). For example, Hawthorne et al.(2006) still found a variation in sediment-measured Koc values of upto three orders of magnitudes for several polycyclic aromatic hydrocar-bons, including benzo[a]pyrene. Ahmad et al. (2001) considerablyreduced the variation in the normalized distribution coefficient byusing aromaticity instead of foc. Second, the strong relationship betweenthe distribution coefficient and the soil organic matter weakens underflow conditions (Elabd et al., 1986; Lennartz, 1999). This is especiallythe case when structure-dependent fast transport pathways, such asearthworm burrows, roots, cracks, and fissures, are active (Flury,1996; Kasteel et al., 2010), thereby violating at least the assumption ofa uniform flow field. The activation of preferential flow pathways isaffected by climatic factors (rainfall intensity), soil management prac-tice (application date, tillage), and history of the water status in thesoil (Gerke, 2006; Jarvis, 2007). Local water fluxes in these preferentialflow pathways are much higher than those assumed for a uniform flowfield, which leads to high local transport velocities. High transportvelocities may lead to chemical non-equilibrium and less sorption com-pared to the bulk soil. Thus, apart from bypassing a part of the bulk soil,the non-compliance with the assumptions of a local equilibrium and auniform flow field results in a much faster transport of solutes throughsoils thanmight be expected based on the Koc values. Third, the normal-ized distribution coefficient Koc is often inaccurately applied to organiccompound where soil organic matter may not be the key sorbate. For
71R. Kasteel et al. / Geoderma 195–196 (2013) 70–78
example, the mineral phase (mainly oxides) is responsible for thestrong sorption of glyphosate in soils, not the soil organic matter(Vereecken, 2005). Fourth, chemical properties of the soil particlesand organic matter in preferential flow paths are different from thebulk soil (e.g., Leue et al., 2010). At last, there is a discrepancy betweenlaboratory-derived Koc values and field-derived Koc values due to differ-ences in contact times (Vereecken et al., 2011).
The food dye Brilliant Blue FCF (Colour Index 42090) is a commonlyused tracer for the visualization of the transport pathways of water inthe vadose zone (Flury et al., 1994). It is often continuously applied atthe soil's surfacewith the invading fluid using rather high input concen-tration in the order of gram per liter to get a visible contrast with thenon-stained soil. In this application mode, Brilliant Blue (BB) is consid-ered to be a rather mobile compound, in contrast to a pulse applicationof similar input concentration followed by a subsequent dilution of theconcentration by a tracer-free solution (Kasteel et al., 2002). Now,Brilliant Blue can be considered as a moderately to strongly sorbingcompound. Digitized images of dye patterns are evaluated in either aqualitative, in a semi-quantitative, or in a quantitative way to interpretthe flow and transport behavior in soils. Where initially the analysis ofthe dye patterns was restricted to binary images, i.e., a pixel is eitherstained or unstained (Flury et al., 1994; Petersen et al., 1997), it evolvedto a semi-quantitative method, where pixels are assigned to dye inten-sity classes (Cey et al., 2009;Weiler and Flühler, 2004), and to the quan-tification of dye concentrations in soil (Ewing and Horton, 1999; Forreret al., 2000; Morris and Mooney, 2004). The information on the dyepatterns is then used to interpret the flow behavior.
In a field-plot transport study with ten herbicide and insecticides,Reichenberger et al. (2002) found that, considering mass fractions,the less mobile (apolar) pesticides were more prone to vertical trans-port by preferential flow than the more mobile (polar) pesticides.They confirmed that the dye BB marked the transport pathways ofthe pesticides and thus can be used as a tool for an effective pesticidesampling strategy (see also Gjettermann et al., 2011). Also Burkhardtet al. (2008) and Cey et al. (2009) used the staining pattern of BB toguide the selective sampling of the hydrologically active preferentialtransport pathways for microspheres, which are frequently beingused as a substitute for bacteria and colloids and which can act as acarrier for strongly sorbing pesticides.
This study comprises controlled leaching experiments with benzo[a]pyrene (BaP) and the herbicide benazolin in combination with BBin undisturbed soil monoliths. BaP is a nonpolar organic compoundwith a high sorption affinity to the soil's organic phase and is, as ahigher molecular weight polycyclic aromatic hydrocarbon, quiteresistant to microbial decay. Its pKoc value is in the order of 5 for humicacids extracted from four typical Chinese soils (Zhang et al., 2009),with pKoc values varying from 4.8 to 6.4 for soil from a plow layer(Kögel-Knabner et al., 2009), and with pKoc values ranging from 5.5to 8.3 for different sediments with a median pKoc value of 6.65(Hawthorne et al., 2006). The post-emergence acidic herbicide benazolin(4-chloro-2-oxo-benzothiazolin-3-yl acetic acid) is thefirst transforma-tion product of benazolin-ethyl. The laboratory-determined half-lifevalue, DT50, of this transformation is less than one day (Leake, 1989).Benazolin itself is also not stable and is further degraded withlaboratory-determined half-life of two–four weeks into thiazolin (4-chloro-benzothiazolin-2-one), which has similar transport propertiesas benazolin (Leake, 1989). In transport studies, benazolin-ethyl wasless mobile compared to benazolin (Leake, 1989), the latter having apKoc value in the order of 1.34 (Goudarzi et al., 2009). The pesticideproperty database PPDB (2011) reflects the sorption and degradationbehavior of benazolin-ethyl (pKoc=3.12 and DT50=1.5 d) andbenazolin (pKoc=1.56 and DT50=21 d).
Jury and Gruber (1989) classified pesticides based on their differentenvironmental fate properties, i.e., sorption and degradation, into low-and high-risk leaching classes to assess their leaching potential belowthe microbial active topsoil. Following this classification, benazolin is a
potential leacher, whereas BaP is a virtually immobile nonleacher. Theobjective of this study is to verify the assessment of the travel distanceof the leacher benazolin and the nonleacher BaP in undisturbed soilmonoliths of two distinct top soils based on the approach of organiccarbon normalized distribution coefficient by measuring bulk soil andlocal concentrations. For the determination of local concentrations,the dye tracer BB is used to visualize the hydrologically active transportpathways which then can be used to guide a selective sampling of thepesticides. Benazolin and BaP are both 14C-labeled, which allows thedetermination of bulk soil 14C-activity by combustionwithout addition-al extraction steps.
2. Material and methods
2.1. Experimental setup
The leaching experiments with the dye tracer BB were conductedin the framework of a larger study on the effect of maize residues onthe fate of benazolin in undisturbed soil monoliths (Berns et al., 2007;Schnitzler et al., 2007). We refer to these two studies for more detailedinformation on the experimental setup. For this study, in short, twoundisturbed soil monoliths (diameter is 20 cm; length is 40 cm) weretaken from a silty loam (Dystric Luvisol) near Merzenhausen (MRZ),North Rhine–Westphalia, and one from a loam (Dystric Cambisol)near Scheyern (SCH), Bavaria, both in Germany. The soils were classi-fied according to the World Reference Base for Soil Resources (FAO,2006). Both sites were located on arable land used for agricultural pro-duction. The plow layer of the silty loam (0–35 cm depth) consisted of4% sand, 79% silt and 17% clay and that of the loam (0–25 cm depth) of42% sand, 36% silt and 22% clay measured by the pipette method afteroxidation of the organic matter with H2O2 (Berns et al., 2007). Thesilty loam had an organic carbon content of 1.0% in the plow layer com-pared to 1.4% in the loam. A plow panwas existent in all monoliths, butit was considered to be of minor importance for the transport of themean travel distance of organic compounds, since it was either of a lim-ited extent, starting close to the artificial zero-potential lower boundary(Merzenhausen) or the applied tracer was expected to show a verystrong interaction with the solid phase (Scheyern). The occurrence oforganic compounds in the drainage water was expected to happenonly through transport in macropore structures, consisting of biopores,inter-aggregate structures and cracks, which were more abundant inthe Scheyern soil.
Steel cylinders with a sharpened lower edge were pressed from thesoil surface into the soils by a hydraulic drilling system. The monolithswere operated in the dark at a constant temperature of 12±1 °C. Inline with the maize-amended treatments of the larger study, the top5-cm of the monolith was loosened by a spoon, after removing possibleplant residues from the soil surface. This homogenization also reducedpotential wall bypassflow in the upper part of the soilmonoliths. Beforeoperation, the monoliths were closed to prevent loss of water byevaporation.
All monoliths were irrigated twice weekly with 4-mm of rainwater for 17 weeks. No ponding was observed at the subsequentwater application. Drainage was allowed by gravity. During the firstirrigation event starting from field-moist conditions close to fieldcapacity, the monoliths from MRZ were spiked with 1.0 MBq 14C-labeled benazolin and the monolith from SCH with 1.0 MBq 14C-labeled BaP using an application solution. A soda lime trap was onlymounted on the benazolin monoliths to detect mineralization of theapplied 14C-benazolin. The trap was removed and analyzed duringthe bi-weekly irrigation events (Schnitzler et al., 2007).
Irrigation resulted in a cumulative amount of drainage water of13.9 cm for the two MRZ soils compared to 13.3 cm for the SCH soil.Cumulative drainage expressed as a fraction of the total water inputwas 1.02 for the MRZ soil compared to 0.98 for the SCH soil (seealso Fig. 4c). These values demonstrate that evaporation losses were
72 R. Kasteel et al. / Geoderma 195–196 (2013) 70–78
negligible and that the initialmoisture statuswas close to field capacity.For the last 4 weeks, the rain water – which was applied bi-weekly –
was spiked with 4 g L−1 of the dye tracer BB. This application modefor BB can be regarded as a step application, since no dilution withdye-free irrigation water occurred at the soil surface. The weeklycollected drainage water was analyzed for 14C-activity using a liquidscintillation counter (Schnitzler et al., 2007). The BB concentrationwas measured with a UV photo-spectrometer (Uvikon 860) at a wave-length of 630 nm.
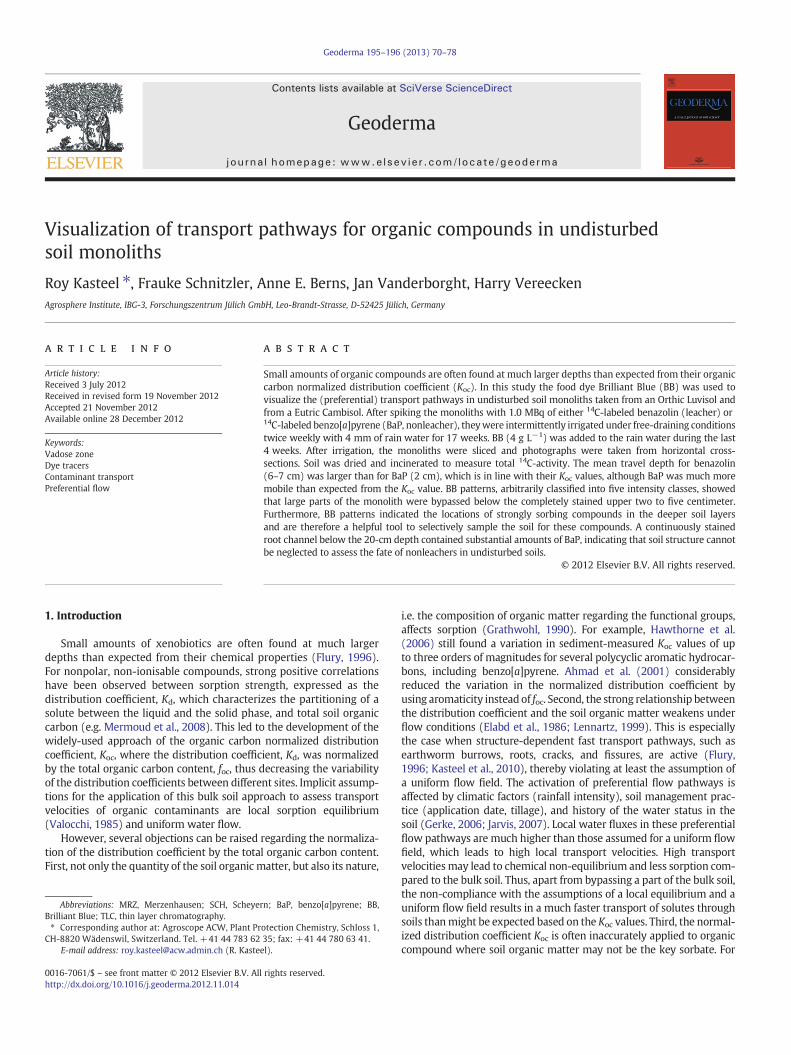
Upon completion of the tracer application, horizontal cross-sections were prepared, at one to five centimeters depth intervals.The surfaces of these cross-sections were photographed with a digitalcamera mounted on a tripod. The distance between the camera andthe surface of the monolith was kept constant. Two flash units wereinstalled, both having an angle of 45° to the soil surface. Photographsof the soil were obtained in color, together with a Kodak color andgray scale, a gray paperboard, and a ruler in the image (see Fig. 1).The cross-sections were selectively sampled by scraping approxi-mately 1.5 g soil from stained and non-stained regions with a knife.These sampling locations were marked with a pin and an additionalpicture was taken. For each monolith we photographed and sampled10 to 16 horizontal cross-sections.
The soil slices with known volume were weighted before and afteroven-drying at 105 °C to determine the volumetric water content, θ,and the dry bulk density, ρb. After oven-drying, each slice was homoge-nized, ground, and the 14C-activity was determined by combustionusing an oxidizer (Schnitzler et al., 2007). For each soil slice, 14C-activityper dry mass of soil was converted to
14C-activity per volume of dry
soil using its measured dry bulk density. Note that liquid scintillationcounting and the combustion method only provide a measure of 14C-equivalents, which consists of the parent compound plus theirmetabolites.
2.2. Moment analysis
The transport behavior of pesticides and BB was characterized bymoment analysis. This is a purely statistical technique for summariz-ing solute transport without making any assumptions on a specifictransport model. Spatial (soil concentration) and temporal (drainagewater concentration) moments were numerically evaluated using thetrapezoidal rule (Das et al., 2005).
Fig. 1. Example of an original image for the 9
2.3. Image analysis
The pixel number of the original images, as shown in Fig. 1 (3007×1959), was reduced by a factor of four, after smoothing using a medianfilter with a side length of two pixels. The final image had a pixel size of0.58×0.58 mm2. The static photographical setup ensured that imageswere not geometrically distorted.
Background subtraction based on the value V of a gray area is aneffective method to reduce the effect of inhomogeneous illumination(Forrer et al., 2000). We therefore sampled the RGB values on each ofthe four corners of the gray paperboard and transformed it to the HSVcolor space. The analysis of the mean value V revealed that, in general,it hardly varied within each image and was nearly constant betweenthe images of the same monolith. Thus, no corrections were performedfor inhomogeneous illumination.
The goal of the image analysis procedure is to classify the dyepatterns in intensity classes, which are in a non-linear way related toconcentrations. Based on Ewing and Horton (1999), who found theclosest relationships between the H and V values and the logarithm ofthe dye concentration,Weiler and Flühler (2004) defined a transforma-tion variable, T,
T ¼ H360π
1−Vð Þ ð1Þ
where H (rad) is the hue and V (−) is the value which ranges between0 and 1. All the images were transformed according to Eq. (1), reducingthe three-dimensional RGB color space to one dimension.
We used conditional dilation (Serra, 1988) to classify images instained and non-stained areas. In this method, a lower and upperlimit is used for thresholding and the region in between is consideredas a fuzzy region. To define the lower threshold limit, we sampledT-values in circular areas with a radius of three pixels in the non-stained areas. The average of these values was used as the lowerlimit and the upper limit was arbitrarily taken 1.5 times as large. Allpixels with a T value lower than the lower limit or with a T valuelower than the upper limit and with at least one direct neighborpixel with a T value lower than the lower limit were assigned to benon-stained. This algorithm is repeated iteratively until no pixel isto be changed. Isolated stained pixels, which have no stained neigh-bors, are then removed. Finally, the stained areas were arbitrarily
-cm depth of the Scheyern soil monolith.
73R. Kasteel et al. / Geoderma 195–196 (2013) 70–78
subdivided into four intensity classes related to increasing dyeconcentrations.
3. Results and discussion
The setup of the experiment with the application of the herbicidesin different soil types does not allow to separate out the influence ofdifferences in soil properties from that of differences in the herbicide'schemical properties. The soil monolith studies provide illustrativeexamples on the interaction of a herbicide with the soil under theprevailing water flow conditions.
3.1. Total 14C-activity profiles
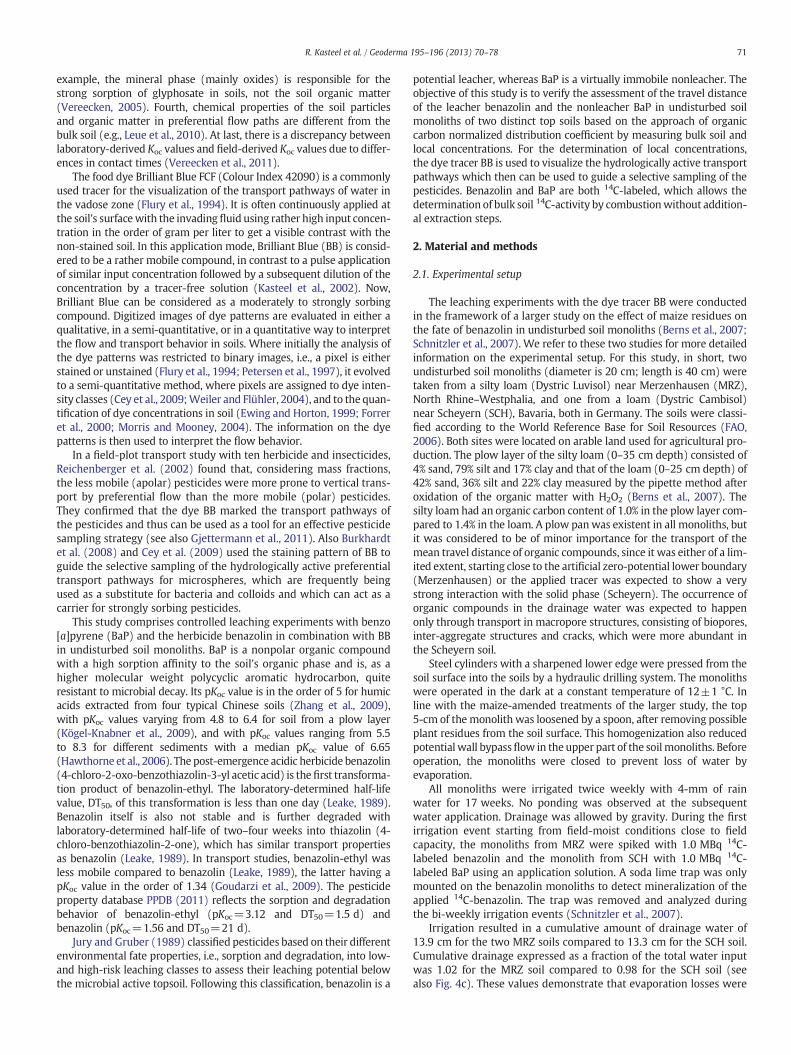
The depth profiles of dry bulk density, ρb, and water content, θ, atthe end of irrigation are shown in Fig. 2 for the three soil monoliths.Although the upper 5 cm of soil in the monoliths was loosened,bulk density was markedly higher in the upper slice in both MRZmonoliths compared to the SCH soil. The structural stability of theMRZ soil (silty loam) was not large enough to retain the loose structureduring irrigation. Dry bulk density was on average larger in the MRZmonoliths (ρb≈1.6 g cm−3) compared to the SCH monolith (ρb≈1.4 g cm−3). The depth profiles of the volumetric water content, θ,closely followed the course of the dry bulk densities, with on averagea lower value in the MRZ monoliths (θ≈0.27 cm3 cm−3) than in theSCH monolith (θ≈0.30 cm3 cm−3) (Fig. 2c and d).
Mass recoveries in the soil and in the drainage water are expressedas the ratio of zeroth spatial or temporal moment and the total massapplied per unit area. The overall mass recovery, which is the sumof the zeroth spatial moment, the zeroth temporal moment, and
1.0 2.0
0
10
20
30
40
ρb (g cm -3)
1.0 1.51.5 2.0
0
10
20
30
40
ρb (g cm -3)
Dep
th (
cm)
#1#2
MRZ
a b) SCH
0.2 0.4
0
10
20
30
40
θ (cm3 cm -3 )
0.2 0.30.3 0.4
0
10
20
30
40
θ (cm3 cm -3)
Dep
th (
cm)
#1#2
MRZ
c d) SCH
Fig. 2. Depth profiles of dry bulk density, ρb, for (a) the Merzenhausen (MRZ) and(b) the Scheyern (SCH) monoliths and of volumetric water content, θ, for (c) theMRZ and (d) the SCH soil monoliths.
mineralization, was good with values between 90 and 100% for thetwo compounds (Table 1). Even for the more mobile benazolin (MRZ),most mass (90%) still resided in the soil after 13.9 cm of cumulative netinfiltration – which equals equivalent pore volumes of 1.31 for MRZ#1and 1.24 for MRZ#2, based on the assumption that all water participatedin solute transport – with only minor mass losses due to mineralization(5%) and leaching (1–3%). For the nonleacher BaP (SCH), all mass residedin the soil monolith after 13.3 cm of cumulative net infiltration –
representing an equivalent pore volume of 1.08 – with virtually noleaching (2×10⁻³%).
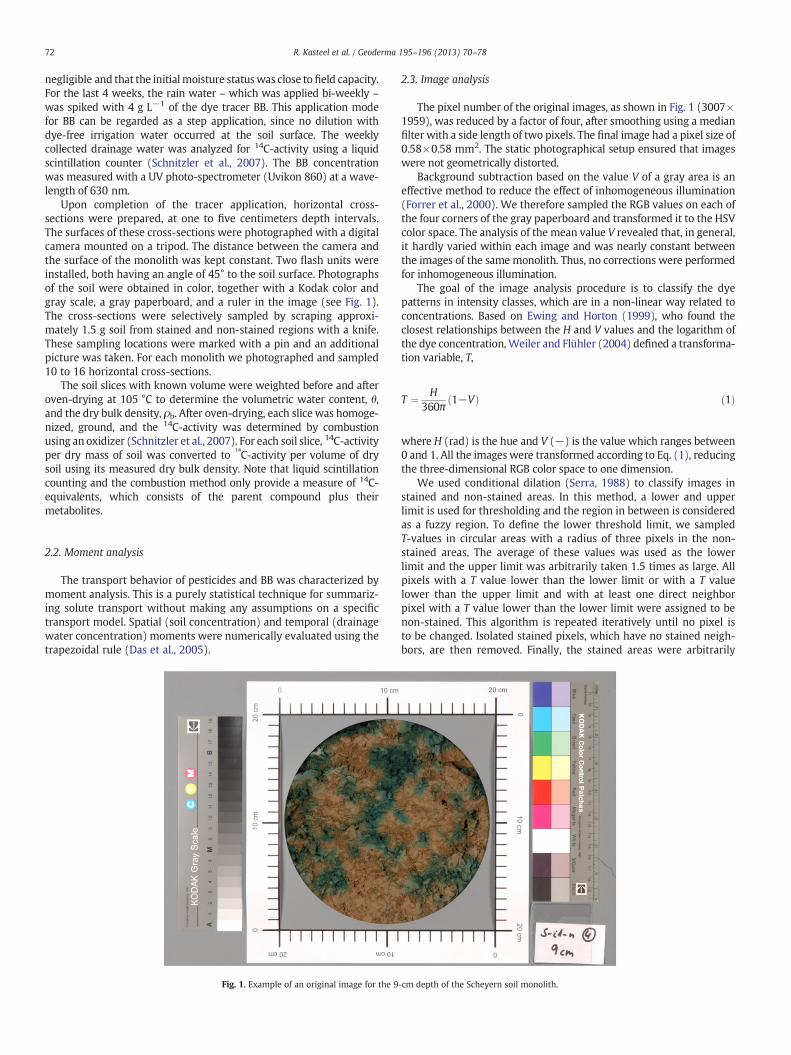
Fig. 3 shows the concentration profiles of the organic compoundsin the soil monoliths. In contrast to BaP, whose bulk soil 14C-activitywas above the detection limit only in the upper 25 cm of the soilmonolith, 14C-benazolin was detected in all soil slices. BaP showed ahighermaximum 14C-activity and amuch faster decline of the 14C-activitywith depth compared to benazolin. This is qualitatively congruent withthe reported much higher Koc values for BaP, which results in a higherretardation. The replicate monoliths of the MRZ soil showed a similartrend in 14C-benazolin activities from the soil surface down to the20-cm depth. Below, a sudden drop in 14C-activity occurred inmonolithMRZ#2 with subsequent increasing concentrations near the monolithoutlet. This might be an indication of an artifact associated with wallflow. In contrast, an exponential decline in 14C-benazolin activity overthe entire depth was observed in monolith MRZ#1, which is ofteninterpreted as an indication of preferential flow (Kasteel et al., 2005).
3.2. Mean travel depth
Since most mass of benazolin and BaP was retained in the soil, wefurther interpreted their spatial moments, i.e., the first normalizeddepth moment or mean travel depth, μz, and the second centraldepth moment or variance, σ2
z, which describes the solute spreadingaround the mean travel depth (see Table 1). The mean travel depth inthe two benazolin monoliths (μz=6–7 cm) was a factor 3 to 4 largercompared to themean travel depth of BaP (μz=1.8 cm). This differencein mean travel depth was remarkably small considering the disparity ofmore than three orders of magnitude in their Koc values. Notice that theslice thickness (1 cm for benazolin and 0.5 cm for BaP in the upper partof the monoliths) was considerably smaller than the first moment. Thetwofold larger variance of benazolin in soil monolith MRZ#2 comparedto MRZ#1 was remarkable and indicates a more pronounced spreadingover the monolith. The spreading of BaP is lower by a factor of 5 to 10compared to benazolin,which qualitatively reflects the lower spreadingpotential for substances with larger retardation.
Assuming that water flow is uniform in soil and that the sorbedconcentration of a reactive compound is in instantaneous equilibriumwith the concentration in the liquid phase, i.e., the local equilibriumassumption (Valocchi, 1985), an estimate of the travel depth, μ̂z, forboth compounds in the monolith can be calculated as follows:
μ̂z ¼ IθR
¼ Iθ 1þ ρbfocKoc=θð Þ ð2Þ
Table 1Mass recovery in the various compartments, mean travel depth, μz, and variance, σ2
z ,determined by moment analysis for the 14C-labeled compounds benazolin in theMerzenhausen soil (MRZ) and benzo[a]pyrene (BaP) in the Scheyern (SCH) soil.
Soil Compound Mass recovery (%) μz (cm) σ2z (cm2)
Soil Outflow Mineralizationa Total
MRZ#1 Benazolin 91.9 0.5 6.4 98.8 5.7 33MRZ#2 Benazolin 81.8 2.9 4.5 89.2 7.0 66SCH BaP 92.7 0.0 n.a.b 92.7 1.8 7.0
a Mineralization was measured as 14CO2 with a soda lime trap on the benazolinmonoliths.
b Not analyzed. Mineralization was assumed to be negligible in the benzo[a]pyrenemonolith.
4
0
10
20
30
40
log10(14Crt )( Bq cm -3 )
Radio-TL C
0 20 2 4
0
10
20
30
40
log10(14Crt )( Bq cm -3)
Dep
th (
cm)
a) MRZ b) SCH
#1#2
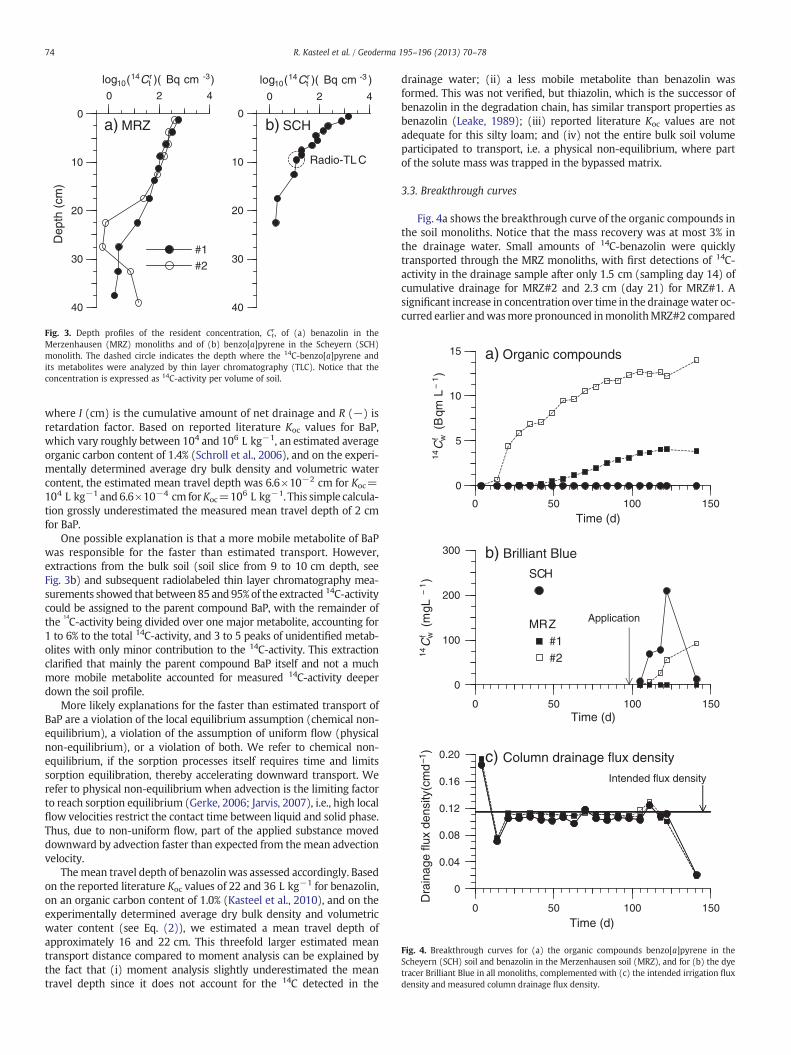
Fig. 3. Depth profiles of the resident concentration, Ctr, of (a) benazolin in the
Merzenhausen (MRZ) monoliths and of (b) benzo[a]pyrene in the Scheyern (SCH)monolith. The dashed circle indicates the depth where the 14C-benzo[a]pyrene andits metabolites were analyzed by thin layer chromatography (TLC). Notice that theconcentration is expressed as 14C-activity per volume of soil.
0 50 100 150
0
5
10
15
Time (d)
14C
f w(B
qmL
−1)
a) Organic compounds
100 150
0
100
200
300
Time (d)
14C
f w(m
gL−
1)
c) Column drainage flux density
0 50
0 50 100 150
0
0.04
0.08
0.12
0.16
0.20
Time (d)
Dra
inag
e flu
x de
nsity
(cm
d−1 )
Intended flux density
Application
b) Brilliant Blue
SCH
MRZ#1#2
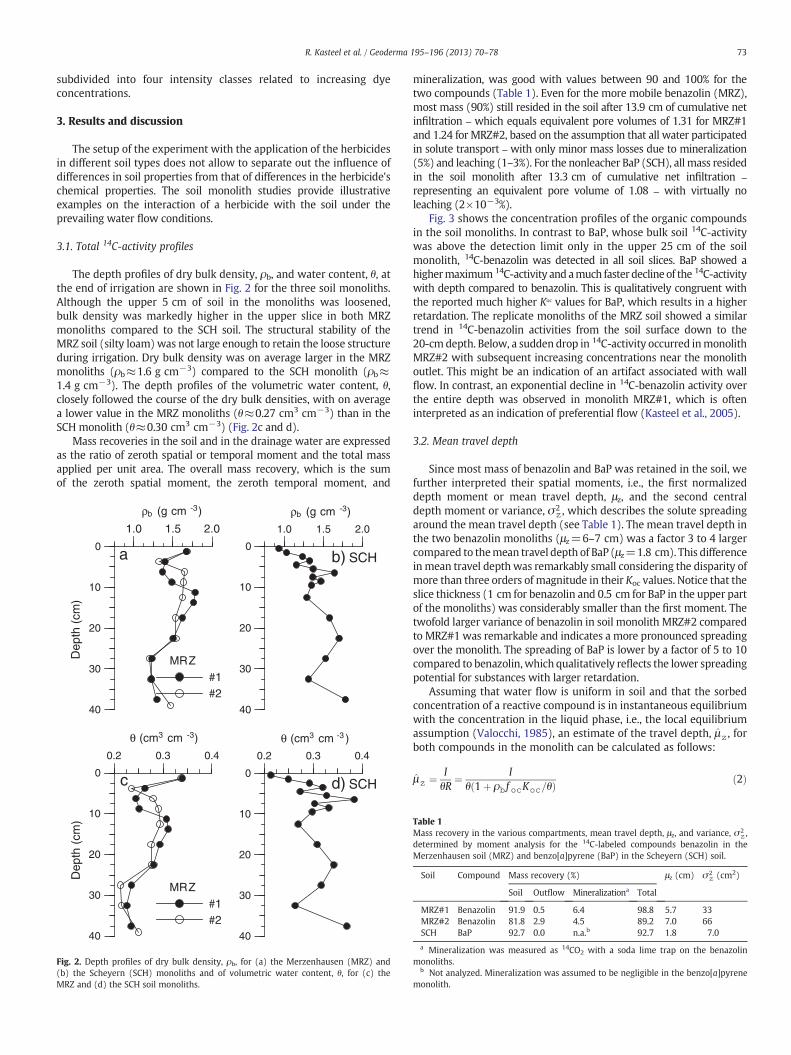
Fig. 4. Breakthrough curves for (a) the organic compounds benzo[a]pyrene in theScheyern (SCH) soil and benazolin in the Merzenhausen soil (MRZ), and for (b) the dyetracer Brilliant Blue in all monoliths, complemented with (c) the intended irrigation fluxdensity and measured column drainage flux density.
74 R. Kasteel et al. / Geoderma 195–196 (2013) 70–78
where I (cm) is the cumulative amount of net drainage and R (−) isretardation factor. Based on reported literature Koc values for BaP,which vary roughly between 104 and 106 L kg−1, an estimated averageorganic carbon content of 1.4% (Schroll et al., 2006), and on the experi-mentally determined average dry bulk density and volumetric watercontent, the estimated mean travel depth was 6.6×10⁻² cm for Koc=104 L kg−1 and 6.6×10⁻⁴ cm forKoc=106 L kg−1. This simple calcula-tion grossly underestimated the measured mean travel depth of 2 cmfor BaP.
One possible explanation is that a more mobile metabolite of BaPwas responsible for the faster than estimated transport. However,extractions from the bulk soil (soil slice from 9 to 10 cm depth, seeFig. 3b) and subsequent radiolabeled thin layer chromatography mea-surements showed that between85 and 95% of the extracted 14C-activitycould be assigned to the parent compound BaP, with the remainder ofthe
14C-activity being divided over one major metabolite, accounting for
1 to 6% to the total 14C-activity, and 3 to 5 peaks of unidentified metab-olites with only minor contribution to the 14C-activity. This extractionclarified that mainly the parent compound BaP itself and not a muchmore mobile metabolite accounted for measured 14C-activity deeperdown the soil profile.
More likely explanations for the faster than estimated transport ofBaP are a violation of the local equilibrium assumption (chemical non-equilibrium), a violation of the assumption of uniform flow (physicalnon-equilibrium), or a violation of both. We refer to chemical non-equilibrium, if the sorption processes itself requires time and limitssorption equilibration, thereby accelerating downward transport. Werefer to physical non-equilibrium when advection is the limiting factorto reach sorption equilibrium (Gerke, 2006; Jarvis, 2007), i.e., high localflow velocities restrict the contact time between liquid and solid phase.Thus, due to non-uniform flow, part of the applied substance moveddownward by advection faster than expected from the mean advectionvelocity.
Themean travel depth of benazolin was assessed accordingly. Basedon the reported literature Koc values of 22 and 36 L kg−1 for benazolin,on an organic carbon content of 1.0% (Kasteel et al., 2010), and on theexperimentally determined average dry bulk density and volumetricwater content (see Eq. (2)), we estimated a mean travel depth ofapproximately 16 and 22 cm. This threefold larger estimated meantransport distance compared to moment analysis can be explained bythe fact that (i) moment analysis slightly underestimated the meantravel depth since it does not account for the 14C detected in the
drainage water; (ii) a less mobile metabolite than benazolin wasformed. This was not verified, but thiazolin, which is the successor ofbenazolin in the degradation chain, has similar transport properties asbenazolin (Leake, 1989); (iii) reported literature Koc values are notadequate for this silty loam; and (iv) not the entire bulk soil volumeparticipated to transport, i.e. a physical non-equilibrium, where partof the solute mass was trapped in the bypassed matrix.
3.3. Breakthrough curves
Fig. 4a shows the breakthrough curve of the organic compounds inthe soil monoliths. Notice that the mass recovery was at most 3% inthe drainage water. Small amounts of 14C-benazolin were quicklytransported through the MRZ monoliths, with first detections of 14C-activity in the drainage sample after only 1.5 cm (sampling day 14) ofcumulative drainage for MRZ#2 and 2.3 cm (day 21) for MRZ#1. Asignificant increase in concentration over time in the drainagewater oc-curred earlier andwasmore pronounced inmonolithMRZ#2 compared
a) Merzenhausen # 1
0.0 cm 2.5 cm 5.0 cm 7.5 cm
10.0 cm 12.5 cm 15.0 cm 20.0 cm
25.0 cm 30.0 cm
b) Merzenhausen # 2
0.0 cm 2.5 cm 5.0 cm 7.5 cm
10.0 cm 15.0 cm 20.0 cm 25.0 cm
30.0 cm 35.0 cm
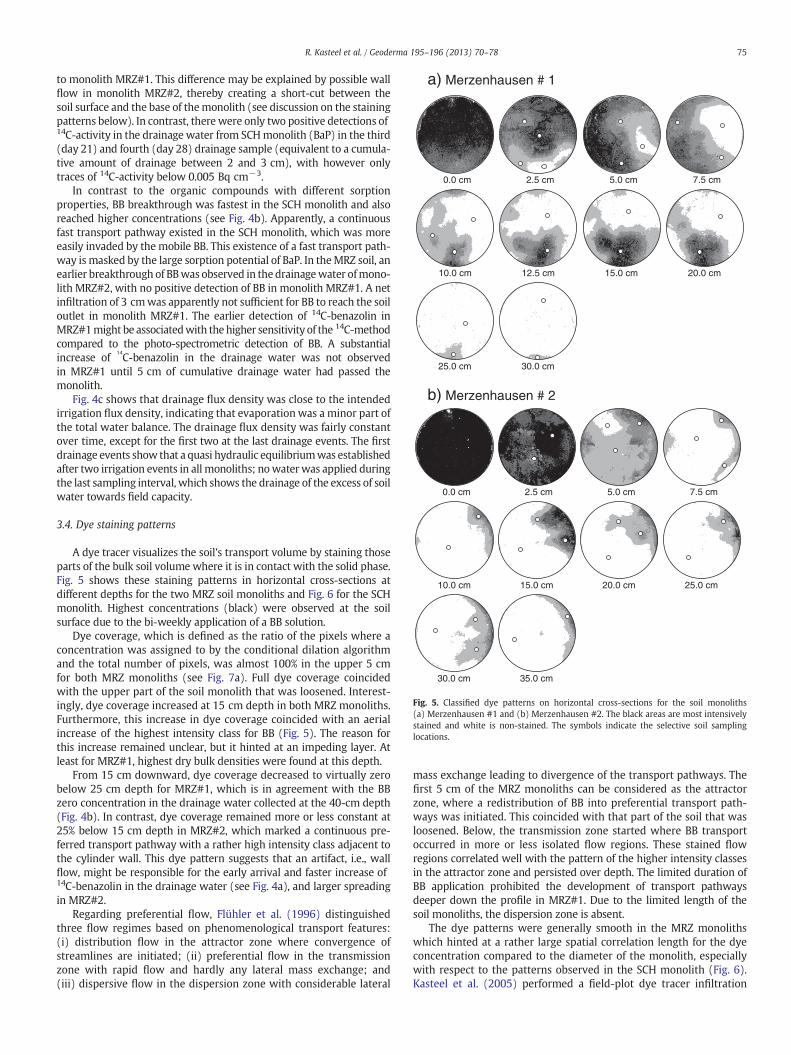
Fig. 5. Classified dye patterns on horizontal cross-sections for the soil monoliths(a) Merzenhausen #1 and (b) Merzenhausen #2. The black areas are most intensivelystained and white is non-stained. The symbols indicate the selective soil samplinglocations.
75R. Kasteel et al. / Geoderma 195–196 (2013) 70–78
to monolith MRZ#1. This difference may be explained by possible wallflow in monolith MRZ#2, thereby creating a short-cut between thesoil surface and the base of themonolith (see discussion on the stainingpatterns below). In contrast, there were only two positive detections of14C-activity in the drainage water from SCHmonolith (BaP) in the third(day 21) and fourth (day 28) drainage sample (equivalent to a cumula-tive amount of drainage between 2 and 3 cm), with however onlytraces of 14C-activity below 0.005 Bq cm−3.
In contrast to the organic compounds with different sorptionproperties, BB breakthrough was fastest in the SCH monolith and alsoreached higher concentrations (see Fig. 4b). Apparently, a continuousfast transport pathway existed in the SCH monolith, which was moreeasily invaded by the mobile BB. This existence of a fast transport path-way is masked by the large sorption potential of BaP. In theMRZ soil, anearlier breakthrough of BBwas observed in the drainagewater ofmono-lith MRZ#2, with no positive detection of BB in monolith MRZ#1. A netinfiltration of 3 cmwas apparently not sufficient for BB to reach the soiloutlet in monolith MRZ#1. The earlier detection of 14C-benazolin inMRZ#1might be associatedwith the higher sensitivity of the 14C-methodcompared to the photo-spectrometric detection of BB. A substantialincrease of
14C-benazolin in the drainage water was not observed
in MRZ#1 until 5 cm of cumulative drainage water had passed themonolith.
Fig. 4c shows that drainage flux density was close to the intendedirrigation flux density, indicating that evaporation was a minor part ofthe total water balance. The drainage flux density was fairly constantover time, except for the first two at the last drainage events. The firstdrainage events show that a quasi hydraulic equilibriumwas establishedafter two irrigation events in all monoliths; nowaterwas applied duringthe last sampling interval, which shows the drainage of the excess of soilwater towards field capacity.
3.4. Dye staining patterns
A dye tracer visualizes the soil's transport volume by staining thoseparts of the bulk soil volume where it is in contact with the solid phase.Fig. 5 shows these staining patterns in horizontal cross-sections atdifferent depths for the two MRZ soil monoliths and Fig. 6 for the SCHmonolith. Highest concentrations (black) were observed at the soilsurface due to the bi-weekly application of a BB solution.
Dye coverage, which is defined as the ratio of the pixels where aconcentration was assigned to by the conditional dilation algorithmand the total number of pixels, was almost 100% in the upper 5 cmfor both MRZ monoliths (see Fig. 7a). Full dye coverage coincidedwith the upper part of the soil monolith that was loosened. Interest-ingly, dye coverage increased at 15 cm depth in both MRZ monoliths.Furthermore, this increase in dye coverage coincided with an aerialincrease of the highest intensity class for BB (Fig. 5). The reason forthis increase remained unclear, but it hinted at an impeding layer. Atleast for MRZ#1, highest dry bulk densities were found at this depth.
From 15 cm downward, dye coverage decreased to virtually zerobelow 25 cm depth for MRZ#1, which is in agreement with the BBzero concentration in the drainage water collected at the 40-cm depth(Fig. 4b). In contrast, dye coverage remained more or less constant at25% below 15 cm depth in MRZ#2, which marked a continuous pre-ferred transport pathway with a rather high intensity class adjacent tothe cylinder wall. This dye pattern suggests that an artifact, i.e., wallflow, might be responsible for the early arrival and faster increase of14C-benazolin in the drainage water (see Fig. 4a), and larger spreadingin MRZ#2.
Regarding preferential flow, Flühler et al. (1996) distinguishedthree flow regimes based on phenomenological transport features:(i) distribution flow in the attractor zone where convergence ofstreamlines are initiated; (ii) preferential flow in the transmissionzone with rapid flow and hardly any lateral mass exchange; and(iii) dispersive flow in the dispersion zone with considerable lateral
mass exchange leading to divergence of the transport pathways. Thefirst 5 cm of the MRZ monoliths can be considered as the attractorzone, where a redistribution of BB into preferential transport path-ways was initiated. This coincided with that part of the soil that wasloosened. Below, the transmission zone started where BB transportoccurred in more or less isolated flow regions. These stained flowregions correlated well with the pattern of the higher intensity classesin the attractor zone and persisted over depth. The limited duration ofBB application prohibited the development of transport pathwaysdeeper down the profile in MRZ#1. Due to the limited length of thesoil monoliths, the dispersion zone is absent.
The dye patterns were generally smooth in the MRZ monolithswhich hinted at a rather large spatial correlation length for the dyeconcentration compared to the diameter of the monolith, especiallywith respect to the patterns observed in the SCH monolith (Fig. 6).Kasteel et al. (2005) performed a field-plot dye tracer infiltration

0.0 cm 1.0 cm 2.0 cm 3.0 cm
4.0 cm 5.0 cm 6.0 cm 7.0 cm
8.0 cm 9.0 cm 10.0 cm 15.0 cm
20.0 cm 25.0 cm 30.0 cm 35.0 cm
Fig. 6. Classified dye patterns on horizontal cross-sections for the soil monolithScheyern. The black areas are most intensively stained and white is non-stained. Thesymbols indicate the selective soil sampling locations.
76 R. Kasteel et al. / Geoderma 195–196 (2013) 70–78
experiment in the same MRZ soil. For the upper 30 cm of the soilprofile, they found a correlation length for the dye concentration of5 to 7 cm on several 1×1 m2 plots. No such data were available forthe SCH soil, but this soil is more macroporous and the observeddye patterns are a reflection of this, resulting in an obviously muchsmaller spatial correlation length for the dye concentration. The dyepatterns in both soils indirectly show that physical non-equilibriumprocesses were likely to be more dominant in the SCH monolith,thereby affecting transport processes in a more pronounced way.Rapid local velocities induced by physical non-equilibrium may reducesorption if it is kinetically limited (thereby promoting chemical non-equilibrium). This is reflected in a better prediction of the mean traveldistance of benazolin using the Koc-concept compared to BaP.
0 0.2 0.4 0.6 0.8 1.0 0 0.2 0.4 0.6 0.8 1.0
0
10
20
30
40
Dye coverage (-) Dye coverage (-)
Dep
th (
cm)
0
10
20
30
40
a) MRZ b) SCH
#1#2
Fig. 7. Depth profiles of dye coverage for (a) the Merzenhausen (MRZ) soil monolithsand (b) the Scheyern (SCH) monolith.
Dye coverage was also nearly 100% close to the soil surface for theSCHmonolith (Fig. 7b). The homogenization process by loosening theupper 5 cm was less effective for loam in the SCH monolith comparedto the silty loam in the MRZ monolith, resulting in an only 1 to 2 cmthick attractor zone, with more small-scale structures in the concen-tration patterns. A less deep complete staining of the upper part ofthe SCH monolith can also be attributed to the supposedly larger BBsorption capacity, which is strongly positively correlated with clay con-tent (Ketelsen and Meyer-Windel, 1999; Morris and Mooney, 2008).
The transmission zone started below 1 to 2 cm depth, but wasstructured differently compared to the MRZ monoliths. A remarkabledecrease in dye coverage to only 20 to 30% was observed between 4and 6 cm depth. A few black spots (highest intensity class) markedmacropores, the majority of the stained pixels belonged to the lessintense dye intensity classes. Dye coverage then increased to almost60% at 10 cm depth, due to a redistribution of dye initialized at 7 cmdepth by diverging transport pathways. Below this redistributionzone, a large part of the stained pixels belonged to the highest intensityclass. This is an indication that these pathways were fed directly by theinput solution without much dilution by mixing processes. Dye cover-age rapidly decreased below 20 cm depth. An important feature was asingle continuous root channel, which was stained blue. This indicatedthat this root channel conducted water andwasmost likely responsiblefor the rapid increase of BB and its high concentration in the drainagewater (Fig. 4b).
The percentage of the bulk soil volume in the monolith that isstained with BB can be deduced from the dye coverage using the trap-ezoidal rule. Note that the dye stained soil volume is not identical tothe transport volume, which is the soil volume that participates tosolute transport, since the volume of the soil matrix is excluded inthe definition of the latter. From these calculations it follows thatthe dye tracer stained more volume in the MRZ monoliths (42% forMRZ#1 and 36% for MRZ#2) than in the SCH monolith (31%). This isin line with the slightly larger averaged volumetric water contentand the supposedly larger sorption in the SCH monolith.
3.5. Selective sampling
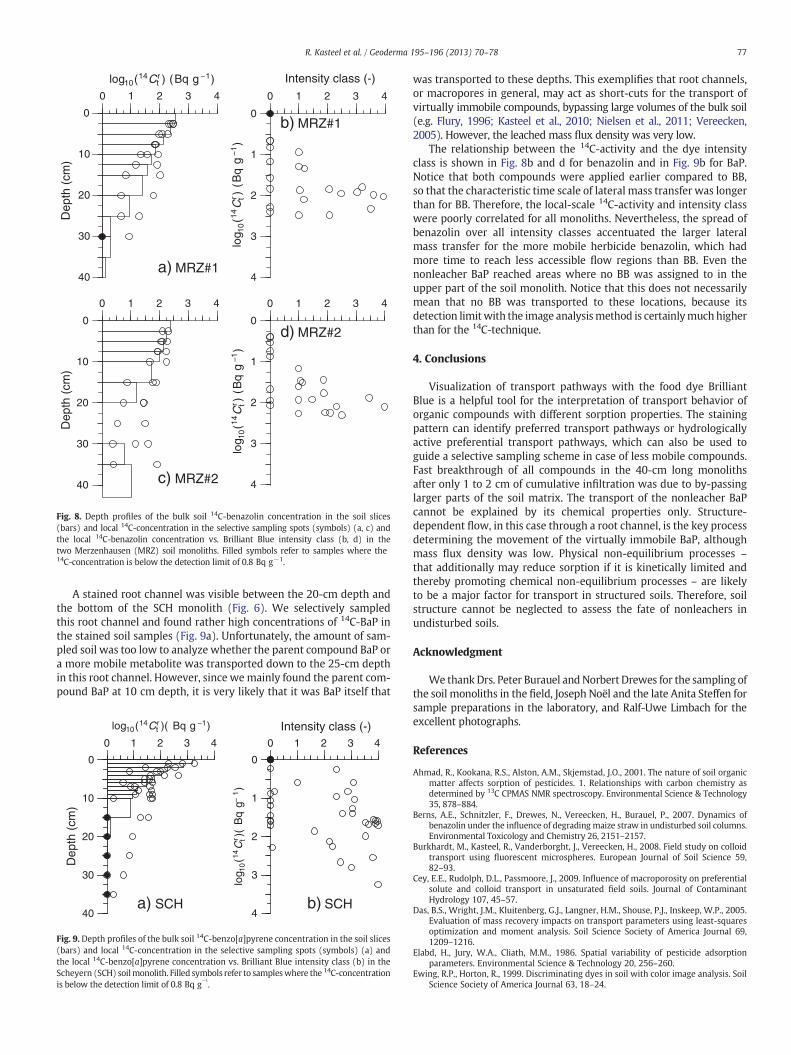
For each horizontal cross-section, we selectively took one sampleof a few grams from the non-stained areas and one to three samplesfrom the stained areas (see Fig. 5 and Fig. 6 for the exact samplinglocations). We analyzed the samples for total 14C-activity and theresults are shown in Fig. 8a and c for benazolin (MRZ) and in Fig. 9afor BaP (SCH), together with the bulk soil total 14C-activity in the slices.
For heterogeneous concentration distribution in soils, it is obviousthat the analysis of total 14C-activity in larger soil volumes (slices)diluted the concentration, even below the detection limit (see between20 and 30 cm depth for benazolin in Fig. 8c and below 25 cm depth forBaP in Fig. 9a), because contaminated soil ismixedwith uncontaminatedsoil. Thus, local concentrations might be much higher than expectedfrom concentration analyses in bulk soil. These differences were morepronounced deeper in themonolithswhere smaller parts of the horizon-tal cross-sections were stained. For all depths and all concentrations, thelowest measured local concentration could always be assigned to thesamples chosen from the non-stained areas.
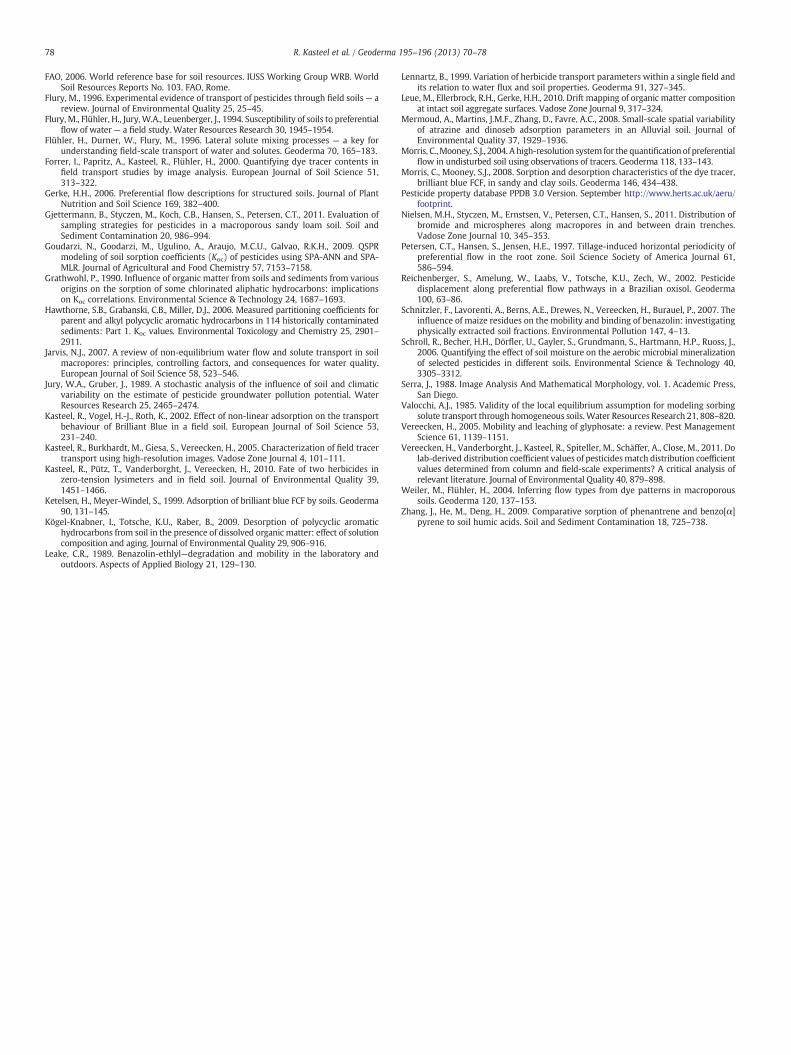
For the mobile leacher benazolin in the MRZ monolith, we foundtotal 14C-activity in each selectively sampled soil sample, except forthe deepest sampling location in MRZ#1, irrespective whether thesesampling locations were stained or non-stained. For the nonleacherBaP in the SCH monolith, BB was a much better indicator for possibledetection of 14C-activity deeper than 15 cm below the soil surface,with only a few water-conducting preferential transport pathways.Here, total 14C-activity was consistently below the limit of detectionin the non-stained areas. The strong sorption of BaP limits its lateralmass exchange, which is accentuated when its transport occurs mainlyin isolated transport pathways.
0 4
0
10
20
30
40
log10(14Crt ) (Bq g −1)
Dep
th (
cm)
Dep
th (
cm)
1 2 3 0 1 2 3 4
0
1
2
3
4
Intensity class (-)
log 1
0(14
Cr t)
(Bq
g−
1)
a) MRZ#1
b) MRZ#1
4
0
10
20
30
40
0 1 2 3 0 1 2 3 4
0
1
2
3
4
log 1
0(14
Cr t)
(Bq
g−1
)
c) MRZ#2
d) MRZ#2
Fig. 8. Depth profiles of the bulk soil 14C-benazolin concentration in the soil slices(bars) and local 14C-concentration in the selective sampling spots (symbols) (a, c) andthe local 14C-benazolin concentration vs. Brilliant Blue intensity class (b, d) in thetwo Merzenhausen (MRZ) soil monoliths. Filled symbols refer to samples where the14C-concentration is below the detection limit of 0.8 Bq g−1.
77R. Kasteel et al. / Geoderma 195–196 (2013) 70–78
A stained root channel was visible between the 20-cm depth andthe bottom of the SCH monolith (Fig. 6). We selectively sampledthis root channel and found rather high concentrations of 14C-BaP inthe stained soil samples (Fig. 9a). Unfortunately, the amount of sam-pled soil was too low to analyze whether the parent compound BaP ora more mobile metabolite was transported down to the 25-cm depthin this root channel. However, since wemainly found the parent com-pound BaP at 10 cm depth, it is very likely that it was BaP itself that
4
0
10
20
30
40
log10(14Crt )( Bq g −1)
Dep
th (
cm)
0 1 2 3 0 1 2 3 4
0
1
2
3
4
Intensity class (-)
log 1
0(14
Cr t)(
Bq
g−1)
a) SCH b) SCH
Fig. 9. Depth profiles of the bulk soil 14C-benzo[a]pyrene concentration in the soil slices(bars) and local 14C-concentration in the selective sampling spots (symbols) (a) andthe local 14C-benzo[a]pyrene concentration vs. Brilliant Blue intensity class (b) in theScheyern (SCH) soilmonolith. Filled symbols refer to sampleswhere the 14C-concentrationis below the detection limit of 0.8 Bq g
−1.
was transported to these depths. This exemplifies that root channels,or macropores in general, may act as short-cuts for the transport ofvirtually immobile compounds, bypassing large volumes of the bulk soil(e.g. Flury, 1996; Kasteel et al., 2010; Nielsen et al., 2011; Vereecken,2005). However, the leached mass flux density was very low.
The relationship between the 14C-activity and the dye intensityclass is shown in Fig. 8b and d for benazolin and in Fig. 9b for BaP.Notice that both compounds were applied earlier compared to BB,so that the characteristic time scale of lateral mass transfer was longerthan for BB. Therefore, the local-scale 14C-activity and intensity classwere poorly correlated for all monoliths. Nevertheless, the spread ofbenazolin over all intensity classes accentuated the larger lateralmass transfer for the more mobile herbicide benazolin, which hadmore time to reach less accessible flow regions than BB. Even thenonleacher BaP reached areas where no BB was assigned to in theupper part of the soil monolith. Notice that this does not necessarilymean that no BB was transported to these locations, because itsdetection limitwith the image analysismethod is certainlymuchhigherthan for the 14C-technique.
4. Conclusions
Visualization of transport pathways with the food dye BrilliantBlue is a helpful tool for the interpretation of transport behavior oforganic compounds with different sorption properties. The stainingpattern can identify preferred transport pathways or hydrologicallyactive preferential transport pathways, which can also be used toguide a selective sampling scheme in case of less mobile compounds.Fast breakthrough of all compounds in the 40-cm long monolithsafter only 1 to 2 cm of cumulative infiltration was due to by-passinglarger parts of the soil matrix. The transport of the nonleacher BaPcannot be explained by its chemical properties only. Structure-dependent flow, in this case through a root channel, is the key processdetermining the movement of the virtually immobile BaP, althoughmass flux density was low. Physical non-equilibrium processes –
that additionally may reduce sorption if it is kinetically limited andthereby promoting chemical non-equilibrium processes – are likelyto be a major factor for transport in structured soils. Therefore, soilstructure cannot be neglected to assess the fate of nonleachers inundisturbed soils.
Acknowledgment
We thank Drs. Peter Burauel and Norbert Drewes for the sampling ofthe soil monoliths in the field, Joseph Noël and the late Anita Steffen forsample preparations in the laboratory, and Ralf-Uwe Limbach for theexcellent photographs.
References
Ahmad, R., Kookana, R.S., Alston, A.M., Skjemstad, J.O., 2001. The nature of soil organicmatter affects sorption of pesticides. 1. Relationships with carbon chemistry asdetermined by 13C CPMAS NMR spectroscopy. Environmental Science & Technology35, 878–884.
Berns, A.E., Schnitzler, F., Drewes, N., Vereecken, H., Burauel, P., 2007. Dynamics ofbenazolin under the influence of degrading maize straw in undisturbed soil columns.Environmental Toxicology and Chemistry 26, 2151–2157.
Burkhardt, M., Kasteel, R., Vanderborght, J., Vereecken, H., 2008. Field study on colloidtransport using fluorescent microspheres. European Journal of Soil Science 59,82–93.
Cey, E.E., Rudolph, D.L., Passmoore, J., 2009. Influence of macroporosity on preferentialsolute and colloid transport in unsaturated field soils. Journal of ContaminantHydrology 107, 45–57.
Das, B.S., Wright, J.M., Kluitenberg, G.J., Langner, H.M., Shouse, P.J., Inskeep, W.P., 2005.Evaluation of mass recovery impacts on transport parameters using least-squaresoptimization and moment analysis. Soil Science Society of America Journal 69,1209–1216.
Elabd, H., Jury, W.A., Cliath, M.M., 1986. Spatial variability of pesticide adsorptionparameters. Environmental Science & Technology 20, 256–260.
Ewing, R.P., Horton, R., 1999. Discriminating dyes in soil with color image analysis. SoilScience Society of America Journal 63, 18–24.
78 R. Kasteel et al. / Geoderma 195–196 (2013) 70–78
FAO, 2006. World reference base for soil resources. IUSS Working Group WRB. WorldSoil Resources Reports No. 103. FAO, Rome.
Flury, M., 1996. Experimental evidence of transport of pesticides through field soils— areview. Journal of Environmental Quality 25, 25–45.
Flury, M., Flühler, H., Jury, W.A., Leuenberger, J., 1994. Susceptibility of soils to preferentialflow of water— a field study. Water Resources Research 30, 1945–1954.
Flühler, H., Durner, W., Flury, M., 1996. Lateral solute mixing processes — a key forunderstanding field-scale transport of water and solutes. Geoderma 70, 165–183.
Forrer, I., Papritz, A., Kasteel, R., Flühler, H., 2000. Quantifying dye tracer contents infield transport studies by image analysis. European Journal of Soil Science 51,313–322.
Gerke, H.H., 2006. Preferential flow descriptions for structured soils. Journal of PlantNutrition and Soil Science 169, 382–400.
Gjettermann, B., Styczen, M., Koch, C.B., Hansen, S., Petersen, C.T., 2011. Evaluation ofsampling strategies for pesticides in a macroporous sandy loam soil. Soil andSediment Contamination 20, 986–994.
Goudarzi, N., Goodarzi, M., Ugulino, A., Araujo, M.C.U., Galvao, R.K.H., 2009. QSPRmodeling of soil sorption coefficients (Koc) of pesticides using SPA-ANN and SPA-MLR. Journal of Agricultural and Food Chemistry 57, 7153–7158.
Grathwohl, P., 1990. Influence of organic matter from soils and sediments from variousorigins on the sorption of some chlorinated aliphatic hydrocarbons: implicationson Koc correlations. Environmental Science & Technology 24, 1687–1693.
Hawthorne, S.B., Grabanski, C.B., Miller, D.J., 2006. Measured partitioning coefficients forparent and alkyl polycyclic aromatic hydrocarbons in 114 historically contaminatedsediments: Part 1. Koc values. Environmental Toxicology and Chemistry 25, 2901–2911.
Jarvis, N.J., 2007. A review of non-equilibrium water flow and solute transport in soilmacropores: principles, controlling factors, and consequences for water quality.European Journal of Soil Science 58, 523–546.
Jury, W.A., Gruber, J., 1989. A stochastic analysis of the influence of soil and climaticvariability on the estimate of pesticide groundwater pollution potential. WaterResources Research 25, 2465–2474.
Kasteel, R., Vogel, H.-J., Roth, K., 2002. Effect of non-linear adsorption on the transportbehaviour of Brilliant Blue in a field soil. European Journal of Soil Science 53,231–240.
Kasteel, R., Burkhardt, M., Giesa, S., Vereecken, H., 2005. Characterization of field tracertransport using high-resolution images. Vadose Zone Journal 4, 101–111.
Kasteel, R., Pütz, T., Vanderborght, J., Vereecken, H., 2010. Fate of two herbicides inzero-tension lysimeters and in field soil. Journal of Environmental Quality 39,1451–1466.
Ketelsen, H., Meyer-Windel, S., 1999. Adsorption of brilliant blue FCF by soils. Geoderma90, 131–145.
Kögel-Knabner, I., Totsche, K.U., Raber, B., 2009. Desorption of polycyclic aromatichydrocarbons from soil in the presence of dissolved organic matter: effect of solutioncomposition and aging. Journal of Environmental Quality 29, 906–916.
Leake, C.R., 1989. Benazolin-ethlyl—degradation and mobility in the laboratory andoutdoors. Aspects of Applied Biology 21, 129–130.
Lennartz, B., 1999. Variation of herbicide transport parameters within a single field andits relation to water flux and soil properties. Geoderma 91, 327–345.
Leue, M., Ellerbrock, R.H., Gerke, H.H., 2010. Drift mapping of organic matter compositionat intact soil aggregate surfaces. Vadose Zone Journal 9, 317–324.
Mermoud, A., Martins, J.M.F., Zhang, D., Favre, A.C., 2008. Small-scale spatial variabilityof atrazine and dinoseb adsorption parameters in an Alluvial soil. Journal ofEnvironmental Quality 37, 1929–1936.
Morris, C.,Mooney, S.J., 2004. A high-resolution system for the quantification of preferentialflow in undisturbed soil using observations of tracers. Geoderma 118, 133–143.
Morris, C., Mooney, S.J., 2008. Sorption and desorption characteristics of the dye tracer,brilliant blue FCF, in sandy and clay soils. Geoderma 146, 434–438.
Pesticide property database PPDB 3.0 Version. September http://www.herts.ac.uk/aeru/footprint.
Nielsen, M.H., Styczen, M., Ernstsen, V., Petersen, C.T., Hansen, S., 2011. Distribution ofbromide and microspheres along macropores in and between drain trenches.Vadose Zone Journal 10, 345–353.
Petersen, C.T., Hansen, S., Jensen, H.E., 1997. Tillage-induced horizontal periodicity ofpreferential flow in the root zone. Soil Science Society of America Journal 61,586–594.
Reichenberger, S., Amelung, W., Laabs, V., Totsche, K.U., Zech, W., 2002. Pesticidedisplacement along preferential flow pathways in a Brazilian oxisol. Geoderma100, 63–86.
Schnitzler, F., Lavorenti, A., Berns, A.E., Drewes, N., Vereecken, H., Burauel, P., 2007. Theinfluence of maize residues on the mobility and binding of benazolin: investigatingphysically extracted soil fractions. Environmental Pollution 147, 4–13.
Schroll, R., Becher, H.H., Dörfler, U., Gayler, S., Grundmann, S., Hartmann, H.P., Ruoss, J.,2006. Quantifying the effect of soil moisture on the aerobic microbial mineralizationof selected pesticides in different soils. Environmental Science & Technology 40,3305–3312.
Serra, J., 1988. Image Analysis And Mathematical Morphology, vol. 1. Academic Press,San Diego.
Valocchi, A.J., 1985. Validity of the local equilibrium assumption for modeling sorbingsolute transport through homogeneous soils. Water Resources Research 21, 808–820.
Vereecken, H., 2005. Mobility and leaching of glyphosate: a review. Pest ManagementScience 61, 1139–1151.
Vereecken, H., Vanderborght, J., Kasteel, R., Spiteller, M., Schäffer, A., Close, M., 2011. Dolab-derived distribution coefficient values of pesticidesmatch distribution coefficientvalues determined from column and field-scale experiments? A critical analysis ofrelevant literature. Journal of Environmental Quality 40, 879–898.
Weiler, M., Flühler, H., 2004. Inferring flow types from dye patterns in macroporoussoils. Geoderma 120, 137–153.
Zhang, J., He, M., Deng, H., 2009. Comparative sorption of phenantrene and benzo[α]pyrene to soil humic acids. Soil and Sediment Contamination 18, 725–738.