visualization of exon junction complex (ejc) and related...
TRANSCRIPT

Visualization of Exon Junction Complex (EJC) and related
factors at transcription sites of Drosophila polytene chromosomes
Subhendu Roy Choudhury
Supervised by Dr. Saverio Brogna
A thesis submitted to
The University of Birmingham
For the degree of
DOCTOR OF PHILOSOPHY
School of Biosciences
College of Life and
Environmental Sciences
The University of Birmingham
September 2015

University of Birmingham Research Archive
e-theses repository This unpublished thesis/dissertation is copyright of the author and/or third parties. The intellectual property rights of the author or third parties in respect of this work are as defined by The Copyright Designs and Patents Act 1988 or as modified by any successor legislation. Any use made of information contained in this thesis/dissertation must be in accordance with that legislation and must be properly acknowledged. Further distribution or reproduction in any format is prohibited without the permission of the copyright holder.

i
Summary
It was long believed that cytoplasmic events like translation and mRNA degradation are not
linked to nuclear events such as pre-mRNA splicing. This view has been challenged in recent
years by the discovery that pre-mRNA splicing can affect cytoplasmic processes such as
nonsense-mediated mRNA decay (NMD). The current explanation is that this
nucleus/cytoplasm communication is mediated by the exon junction complex (EJC), a
multiprotein complex deposited during splicing in the nucleus and which remains associated
with the mRNA during export to the cytoplasm. The consensus is that the EJC is deposited
exclusively on spliced mRNA, 20-24 nucleotides upstream of the exon-exon junction.
Splicing appears to deposit the EJC similarly in Drosophila melanogaster, yet it has also
been reported that, in contrast to mammalian cells, the EJC might be required for splicing,
suggestive of an earlier association with the pre-mRNA. The EJC appears to have an
important role in the localization oskar mRNA to the posterior of the Drosophila oocyte. My
PhD project aimed to visualize the assembly of the EJC on nascent RNA at polytene
chromosome transcription sites. The main conclusion of these studies is that, contrary to
current predictions, EJC components are recruited at transcription sites corresponding to both
intron-containing and intron-less genes. A similar conclusion was reached in Drosophila S2
cells, where chromatin immunoprecipitation coupled with high-throughput sequencing
(ChIP-seq) data indicate that the core EJC protein Y14 associates to transcription sites
independently of the gene having introns. Additionally, here I also report the results of two
parallel projects aimed at testing whether ribosomal proteins and the NMD protein UPF1 also
associate with Pol II transcription sites. My results confirm the presence of additional
ribosomal proteins at transcription sites and also indicate the presence of UPF1 at these sites.

ii
Acknowledgements
Firstly, I would like to thank my supervisor Dr. Saverio Brogna for accepting me as a PhD
student in his laboratory. His guidance and supervision allowed me to finish my PhD work on
time. Secondly, I would like to thanks the Indian Government for providing a studentship for
my PhD living expense in the United Kingdom.
I would also like to thank Dr. Alicia Hidalgo for her useful suggestion in my experiment, Dr.
Paul Badenhorst for helping me to carry out the ChIP-seq experiments at IBR and also Dr.
Aditi Kanhere for analysing the ChIP-seq data. I am also thankful to other PIs and other
people on the 6th floor of Biosciences, who let me use their equipment, reagents and gave
useful suggestions. I would like to express my thanks to Saverio’s lab past members,
particularly Preethi Ramanathan, Kim Piechocki and Dr. Jikai Wen for their valuable time
and help during the initial stage of my PhD study. I am also grateful and thankful to the
present lab members, particularly Tina McLeod and Marija Petrick for the time they put in
helping me with the writing of thesis, and also Jianming Wang for being a good friend
throughout the PhD. Thanks to the School of Biosciences, and University of Birmingham
different events they organized for PhD students to fulfill my PhD study.
Last but not least, a special gratitude goes to my family for their patience and support
throughout the whole four years and their sacrifice for me to complete my study.
SUBHENDU ROY CHOUDHURY

iii
Dedication
This work is dedicated to my dearest parents Satyajit Roy Choudhury and Gita Roy
Choudhury and my family members.

iv
Table of Contents
Chapter 1 ............................................................................................................................................... 1
1.0 Introduction ................................................................................................................................... 1
1.1 Summary of eukaryotic gene expression ...................................................................................... 1
1.1.1Pre-mRNA processing ................................................................................................................ 1
1.1.2 Coupling of transcription and pre-mRNA splicing .................................................................... 4
1.2 Eukaryotic cell compartmentalization and the bridge between transcription and translation ....... 8
1.2.1 Nonsense Mediated Decay (NMD) ............................................................................................ 9
1.2.3 Canonical and non-canonical form of EJC .............................................................................. 17
1.2.4 The EJC is deposited at splice junctions also in Drosophila ................................................... 18
1.3 Nuclear Translation ..................................................................................................................... 21
1.3.1 PTC recognition in the nucleus ................................................................................................ 21
1.3.2 Controversial issue with nuclear translation ............................................................................ 22
1.0 Aims, and research plan .................................................................................................................. 24
Chapter 2 ............................................................................................................................................. 26
2.0 Materials and Methods ................................................................................................................ 26
2.1 Solutions and buffers .................................................................................................................. 26
2.2 Drosophila Schneider 2 cells (S2 cells) culture and maintenance .............................................. 26
2.2.1 Transfection of S2 cells............................................................................................................ 27
2.3 Chromatin Immunoprecipitation (S2 cells) ................................................................................. 27
2.3.1 Cross-linking and sonication .................................................................................................... 27
2.3.3 Chromatin immunoprecipitation .............................................................................................. 30
2.3.4 Washing steps .......................................................................................................................... 31
2.3.5 Elution steps and reverse cross-links ....................................................................................... 31
2.3.7 Solid ChIP-Seq library preparation .......................................................................................... 32
2.4 S2 cells RNA interference (RNAi) ............................................................................................. 33
2.4.1 Purifying dsRNA ..................................................................................................................... 33

v
2.4.2 S2 cells siRNA ......................................................................................................................... 34
2.4.3 RNA extraction and complementary DNA synthesis (cDNA) ................................................ 34
2.4.4 Quantitative Real-Time PCR ................................................................................................... 35
2.5 Purification of nuclear and cytoplasmic fractions from S2 cells ................................................ 35
2.6 S2 cells and salivary glands Western blotting ............................................................................ 36
2.6.1 Sample preparation .................................................................................................................. 36
2.6.2 Western Blotting ...................................................................................................................... 37
2.6.3 Reprobing of Western blot membranes ................................................................................... 38
2.7 Fly genomic DNA extraction and Polymerase Chain Reaction .................................................. 38
2.7.1 DNA Sequencing ..................................................................................................................... 39
2.8 Salivary gland dissection and polytene chromosome squashing ................................................ 39
2.8.1 Salivary gland dissection ......................................................................................................... 39
2.8.2 Squashing ................................................................................................................................. 40
2.8.3 Immunostaining ....................................................................................................................... 40
2.8.4 Fluorouridine (FU) labelling of polytene chromosome nascent RNA ..................................... 41
2.8.5 Salivary gland RNase treatment ............................................................................................... 42
2.8.6 Acid-free polytene chromosome squashing ............................................................................. 42
2.8.7 Salivary glands heat shock induction ....................................................................................... 42
2.8.8 Salivary glands ecdysone treatment protocol ........................................................................... 43
2.8.9 Antibodies ................................................................................................................................ 43
2.8.10 Fluorescence microscopy ....................................................................................................... 44
2.9 Whole salivary glands immunostaining ...................................................................................... 44
2.10 Puromycin labelling of nascent peptides on polytene chromosomes ........................................ 45
2.10.1 Polytene chromosome squashing and ribo-puromycylation .................................................. 45
2.10.2 Immunostaining and antibody ................................................................................................ 45
2.11 Incorporation of puromycin in whole salivary glands of D. melanogaster ............................. 46
2.11.1 Puromycin and emetine labelling ........................................................................................... 46

vi
2.11.2 Immunostaining ..................................................................................................................... 46
2.11.3 Confocal microscopy/image processing ................................................................................ 47
2.12 Genetics..................................................................................................................................... 47
2.12.1 Virgin collection .................................................................................................................... 47
2.12.2 Setting up crosses ................................................................................................................... 47
2.12.3 GAL4/UAS expression system .............................................................................................. 48
2.12.4 Generation of a fly strain expressing both LacI-GFP and MCP-RFP .................................... 48
2.13 Parameters used to select target epitopes for UPF1 and UPF2 ................................................. 50
2.13.1 Step wise Antibody production from Abmart ........................................................................ 53
2.14 Statistical analysis ..................................................................................................................... 53
Chapter 3 ............................................................................................................................................. 54
3.0 EJC components associate with transcription sites on Drosophila polytene chromosomes ....... 54
3.1 Summary or Introduction ............................................................................................................ 54
3.2 Results ......................................................................................................................................... 56
3.2.1 The core EJC proteins are abundant in both nucleus and cytoplasm ....................................... 56
3.2.2 Visualization of EJC components at polytene chromosome transcription sites ....................... 60
3.2.3 Colocalization confirms Y14 and MAGO might form a heterodimer at same transcription sites
.......................................................................................................................................................... 63
3.2.4 Association of Y14 and MAGO with transcription sites differs from that of eIF4AIII ........... 70
3.2.5 Knockdown of the core EJC component eIF4AIII affects the development of Drosophila
salivary glands in vivo ....................................................................................................................... 73
3.2.6 Y14 is required for the association of MAGO with transcription sites in vivo ........................ 77
3.2.7 Dimerization stabilizes Y14 and MAGO ................................................................................. 80
3.2.8 Association of EJC core components at transcription sites seems RNA independent ............. 83
3.2.9 Nascent RNA labelling indicates EJC core proteins are not primarily associated with pre-
mRNA ............................................................................................................................................... 87
3.2.10 EJC core components are recruited at transcription sites independently of introns ............... 91
3.2.11 Transcription dependent recruitment of EJC components at ecdysone induced puffs........... 94
3.2.12 Y14/MAGO might regulate expression of ecdysone induced genes ..................................... 98

vii
3.2.13 ChIP-seq data indicates recruitment of Y14 predominantly at transcription start sites ....... 101
3.3 Discussion ................................................................................................................................. 104
Chapter 4 ........................................................................................................................................... 106
4.0 Visualization of ribosomes, translation and the NMD factor UPF1 at transcription sites ........ 106
4.1 Summary ................................................................................................................................... 106
4.2 Results ....................................................................................................................................... 108
4.2.1 Characterization of YFP tagged ribosomal protein expression in salivary glands................. 108
4.2.2 Confirmation of the transgene inserts of each fly strain ........................................................ 111
4.2.3 Localization of ribosomal proteins in whole salivary glands ................................................. 114
4.2.4 Endogenously tagged RpL41-YFP associates with transcription sites .................................. 117
4.2.5 Ribopuromycylation allows visualisation of translation sites in vivo .................................... 119
4.2.6 Puromycylation observed in salivary glands and S2 cells ..................................................... 121
4.2.7 Puromycin incorporation in intact whole salivary glands ...................................................... 124
4.2.8 Incorporation of puromycin at polytene chromosome transcription sites .............................. 127
4.2.9 Generation of monoclonal antibodies against UPF1 and UPF2 of Drosophila ..................... 132
4.2.10 Western blot analysis of UPF1 ascites identified three potential clones specific for UPF1 137
4.2.11 Validation of potential UPF1 monoclonal antibodies .......................................................... 140
4.2.12 Purified UPF1 antibodies show specificity against endogenous UPF1 ............................... 143
4.2.13 UPF1 associates with most of the transcription sites of polytene chromosomes ................. 149
4.2.14 UPF1 accumulates in the nuclei of salivary gland cells ....................................................... 152
4.3 Discussion ................................................................................................................................. 157
Chapter 5 ........................................................................................................................................... 159
5.0 Visualization of co-transcriptional pre-mRNA splicing on polytene chromosomes of salivary
glands .............................................................................................................................................. 159
5.1 Summary ................................................................................................................................... 159
5.2 Result ........................................................................................................................................ 161
5.2.1 Visualization of nascent RNA in Drosophila salivary glands ............................................... 161
5.2.2 Versatile gene reporter constructs allow visualisation of splicing ......................................... 163

viii
5.2.3 Visualization of pre-mRNA splicing in nuclei of Drosophila salivary glands ...................... 165
5.2.4 Transgene visualisation using lacI-GFP ................................................................................ 167
5.2.5 Simultaneous visualisation of nascent RNP and transgenic locus ......................................... 170
5.3 Discussion ................................................................................................................................. 173
Chapter 6 ........................................................................................................................................... 175
6.0 Discussion and Conclusion ....................................................................................................... 175
6.1 Association of eIF4AIII at transcription sites distinct to that of Y14 and MAGO ................... 175
6.1.1 MAGO is not essential for Y14 association with transcription sites ..................................... 176
6.1.2 The association of the EJC with transcription sites is splicing independent .......................... 177
6.1.3 Nuclear translation visualized at transcription sites ............................................................... 179
6.1.4 UPF1 recruitment at transcription sites indicates possible nuclear function ......................... 180
6.1.5 Transgenic reporter constructs provide an effective model to visualize splicing .................. 181
6.2 Conclusion ................................................................................................................................ 182
References ........................................................................................................................................... 184
Appendices .......................................................................................................................................... 194
Appendix I ...................................................................................................................................... 194
Protocol for ChIP ............................................................................................................................ 194
Standard Protocol for Salivary glands squashing and immunostaining .......................................... 197
Appendix II ..................................................................................................................................... 200
List of Primers................................................................................................................................. 200
Appendix III .................................................................................................................................... 202
List of Fly stocks ............................................................................................................................. 202
Appendix IV.................................................................................................................................... 205
List of plasmid ................................................................................................................................ 205
Appendix V ..................................................................................................................................... 206
DNA sequencing and BLAT search were matched with tagging construct of RpL41-YFP and
RpL10Ab-YFP and RpS9-YFP (034) ............................................................................................. 206
Appendix VI.................................................................................................................................... 209

ix
None of the UPF2 monoclonal antibodies could recognize UPF2 protein by Western blotting ... 209
Appendix VII .................................................................................................................................. 211
(A) List of UPF1 Ascites ................................................................................................................ 211
(B) List of UPF2 Ascites ................................................................................................................. 213
Appendix VIII ................................................................................................................................. 215
Y14 ChIP-seq genes list (top 20 based on their Wig peak height) ................................................. 215
Appendix IX........................................................................................................................................ 215
Published articles ................................................................................................................................ 215
x
List of Abbreviations
EJC Exon Junction Complex
NMD Nonsense-mediated mRNA decay
PTC Premature termination codon
UPF Up-frame shift
40S Eukaryotic small ribosomal subunit
60S Eukaryotic large ribosomal subunit
80S Eukaryotic ribosomes
BSA Bovine serum albumin
CBC Cap binding complex
ChIP Chromatin immunoprecipitation
DAPI 4’-6-diamidino-2-phenylinodole
DDAB Dimethyl dioctadecyl ammonium bromide
EDTA Ethylenediaminotetra-acetic acid
eEF1 / eEF2/ eEF3 Eukaryotic translation elongation factors
eIF3/eIF4AIII/eIF4G Eukaryotic translation initiation factors
eRF1/eRF3 Eukaryotic release factor 1 and 3
FBS Fetal bovine serum
FITC Fluorescein isothiocyanate
GFP Green fluorescent protein

xi
RFP Red fluorescent protein
HRP Horseradish peroxidase
PABPC Poly(A) binding protein, cytoplasm
Pol (I, II, and III) RNA polymerases (I, II, and III).
RPs Ribosomal proteins
SDS Sodium dodecyl sulfate
TBS Tris-buffered saline
TRIS Tris(hydromethyl-amino)ethane
UAS Upstream activating sequences
UTR Untranslated region
WT Wild-type
YFP Yellow fluorescent protein
RNA Ribonucleic acid
DNA Deoxyribonucleic acid
RpL Ribosomal protein large subunit
RpS Ribosomal protein small subunit
PBS Phosphate buffered saline
PMSF Phenylmethylsulfonyl fluoride

1
Chapter 1
1.0 Introduction
1.1 Summary of eukaryotic gene expression
Gene expression of protein-coding genes is a process in which genetic information contained
in DNA is transcribed into messenger RNA (mRNA) which is then translated into protein.
This process is different between eukaryotic and prokaryotic organisms. In prokaryotes,
transcription and translation are a coupled process and transcripts start to translate during
their transcription. However, eukaryotes possess a nuclear envelope which separates the
transcription that occurs in the nucleus, from translation which takes place in the cytoplasm.
Whilst within the nucleus, the primary transcripts (pre-mRNAs) must undergo post-
transcriptional modifications including 5’end capping, 3’end processing, and intron splicing
(Figure 1.0). Following these processing the mature mRNA is then exported from the nucleus
to the cytoplasm where it is translated by the ribosome.
1.1.1 Pre-mRNA processing
The first step of pre-mRNA processing is 5’ capping during which a guanine nucleotide is
added to the 5’ end of pre-mRNA which is subsequently methylated to produce 7-
methylguanosine (m7G) (Shuman, 2001). This cap structure is recognized by the cap-
binding complex (CBC), consisting of two proteins, cap-binding protein 80 (CBP80) and
CBP20. The 5’ cap protects the mRNA from 5’-3’ exonuclease degradation, thus playing an
important role in mRNA stabilization (Beelman and Parker, 1995). The 3’ end processing
reaction, which involves cleavage of the pre-mRNA and addition of a poly (A) tail at the
3’end (Colgan and Manley, 1997), results in transcription termination and release of RNA
Polymerase II (Pol II) from the DNA template. The majority of eukaryotic protein-coding

2
genes contain non-coding sequences, termed introns, that are removed from the primary
transcript, in a process called splicing, to produce a functional mRNA. Segments of the pre-
mRNA that are retained in the mature mRNA are called exons. The splicing reaction is
carried out by a large macromolecular complex, the spliceosome (Zhou et al., 2002).
Additionally, transcripts of eukaryotic genes can undergo alternative splicing, which results
in the production of different functional mRNAs from a single pre-mRNA molecule (Berget
et al., 2000). Therefore, alternative splicing has the potential to produce several protein
variants from a single gene and is partly responsible for increased diversity of proteins in
higher eukaryotes (Hui, 2009). Moreover, in eukaryotes, some of the RNA such as tRNA,
rRNA, mRNA also undergoes RNA editing process (Su and Randau, 2011). Although, RNA
editing is rare compared to normal RNA processing as mentioned earlier, yet RNA editing
responsible for great molecular diversity by addition, deletion or substitution of nucleotide
bases within the RNA molecule.
Once the processing of pre-mRNA is complete, mature mRNA is then exported from nucleus
to the cytoplasm through the nuclear pore complex (NPC). By the time the mRNA is exported,
it associates with several proteins to form an mRNA-protein complex (mRNP) – the formation
of the mRNP starts cotranscriptionally, possibly with the binding of the CBC to the cap as it
emerges from Pol II, it involves a large number of proteins and depends, as detailed in the
sections below, on pre-mRNA processing. The mRNPs undergo extensive remodelling as
enter in the cytoplasm, yet some components which associated in the nucleus persist so that the
structure and composition of the nuclear mRNPs influence downstream processes such as
export, localization and translation and mRNA stability (Brodsky and Silver, 2000).

3
Figure 1.0 Schematic representation of eukaryotic gene expression. Gene expression in
eukaryotes involves transcription of genomic DNA into pre-mRNA, which further undergoes
several steps of processing, including 5’ capping, splicing, and 3’ polyadenylation, to produce
mature RNA. Mature mRNA is then transported through the nuclear pore complex to the
cytoplasm where it is translated into protein by the ribosome. This model is adapted from
Zhang (2002).

4
1.1.2 Coupling of transcription and pre-mRNA splicing
Splicing is a multistep process catalysed by the spliceosome which consists of five small
nuclear ribonucleoprotein complexes (snRNPs) each of which is composed of a small nuclear
RNA (snRNA - U1, U2, U4, U5 or U6) and a number of associated proteins. Up to 300
different proteins have been identified to be associated with the spliceosome (Nilsen, 2003).
Some of these proteins are specific to a certain snRNP while others are present in all (Will
and Luhrmann, 2001). The first step in splicing is recognition of the 5’ and 3’ splice sites
(SS); this is mediated by the U1 and U2 snRNP U1 binds to the 5’end of the intron, while U2
associates with the adenosine in the pyrimidine rich region known as the branch point (20-
50nt upstream of the 3’SS). This binding occurs in an ATP-dependent manner and, as a
result, the pre-spliceosomal A complex is formed. Subsequent binding of U4, U5 and U6
snRNPs as a tri-snRNP complex gives rise to the complex B or complete spliceosome
(Sharma et al., 2008). Further structural arrangements are required to form the catalytically
active spliceosome (C complex) which includes dissociation of U1 and U4 (Figure 1.1).
However, in metazoan the second type of intron with different splice sites recognized by the
second class of U12 spliceosome or minor spliceosomes. The minor spliceosome consists of
U11, U12, U4atac and U6atac which are functionally analog of U1, U2 and U4/U6 of the
major spliceosome (Hall and Padgett, 1996). Although minor spliceosome contains U12
snRNP instead of U2 snRNP, yet U12 dependent spliceosome follows the same splicing
pathway as U2 dependent or major spliceosome.
Although it was believed that pre-mRNA processing is independent from transcription, it is
now clear that all these reactions are in fact coupled to this process. Most introns are spliced
while the 3’ end of the pre-mRNA is still being synthesized by the RNA Pol II. Studies

5
performed by Carrillo Oesterreich (2010), using high-density tiling arrays for nascent RNA,
indicate that splicing in yeast predominantly occurs co-transcriptionally. This is supported by
additional chromatin immunoprecipitation (ChIP) experiments (Abruzzi et al., 2004;
Gornemann et al., 2005). The carboxy-terminal domain (CTD) of RNA Pol II plays a key role
in the coupling of splicing and other pre-mRNA processing reactions to transcription. The
CTD serves as a platform for assembly of the pre-mRNA processing machinery and it is
necessary for the efficiency of these processes (Phatnani and Greenleaf, 2006; Shatkin and
Manley, 2000). The heptad repeats of Pol II CTD (26 in yeast and 52 in mammals) with the
consensus sequence YS2PTS5PS7 undergo phosphorylation and dephosphorylation at several
positions in such a way that enables RNA Pol II to associate with appropriate factors in
different phases of the transcription cycle. Moreover, another in vitro study showed that CTD
increases the rate of 5’ capping and 3’ end formation by functioning as a “landing pad” for
processing factors, therefore facilitating their association with the nascent transcript or the
correct assembly of these in multisubunit complexes (Carrillo Oesterreich et al., 2011;
Perales and Bentley, 2009). One early study reported that deletion of CTD results in defects
in 3’ end processing, splicing and transcription in human cells (McCracken et al., 1997). Co-
transcriptional splicing was first observed in Drosophila embryos by electron microscopy
(Beyer and Osheim, 1988) as well as in further biochemical experiments in Drosophila
salivary glands (LeMaire and Thummel, 1990). Moreover, an in vitro study in HeLa cells
revealed that the assembly of the spliceosome on RNA Pol II transcript is proportional to the
rate of its synthesis therefore, immediate spliceosome assembly, increased yields of spliced
mRNA and increase in the kinetics of splicing spliceosome (Das et al., 2006). Pol II
elongation rate also appears to be a critical factor for co-transcriptional splicing, as mutation
which induces lower Pol II elongation rate results in increased co-transcriptional splicing
efficiency. In yeast and mammals, alternative splicing depends on the Pol II elongation rate

6
(de la Mata et al., 2010; Kadener et al., 2001). Also, it has been suggested that efficient
cotranscriptional splicing may require a pause in Pol II elongation around the 3’SS
(Alexander et al., 2010). Transcriptional pause release is recognized as an important step of
gene expression regulation in mammals (Adelman and Lis, 2012). The transition from this
paused state to elongation state requires the recruitment of positive transcription elongation
factor b (P-TEFb), a cyclin-dependent kinase that is normally localized in an inhibitory
complex containing 7SK noncoding RNA (Peterlin and Price, 2006). A recent report
indicates that a splicing factor, specifically serine/arginine–rich splicing factor 2 (SRSF2), is
a part of 7SK complex assembled at gene promoters and has a direct role in transcriptional
pause release (Ji et al., 2013). Thus, the function of SRSF2 in transcription activation further
indicates co-regulation of gene expression at both transcriptional and posttranscriptional
levels in mammalian cells. SR proteins are a family of RNA-binding proteins that play an
important role in splicing (Lin and Fu, 2007) and colocalize with 7SK in nuclear speckles,
specific nuclear domains that are enriched in splicing factors. Additionally, previous studies
have reported that a delay in transcript release may be required for complete processing in
yeast (Schmid and Jensen, 2010).
Recent studies of nascent transcripts in Drosophila indicate that fifty percent of introns are
spliced co-transcriptionally, while the remaining ones are either poorly spliced or retained in
the mature mRNA (Khodor et al., 2011). Co-transcriptional splicing also depends on factors
such as intron length, intron number, exon length (Neugebauer, 2002). Several lines of
evidence also suggest that the longer the gene is, the greater the chance of splicing of the
nascent transcript (Beyer and Osheim, 1988). In addition, a recent cotranscriptional splicing
study in mouse suggest that gene length and position strongly affects the efficiency of
cotranscriptional splicing (Khodor et al., 2012).
7
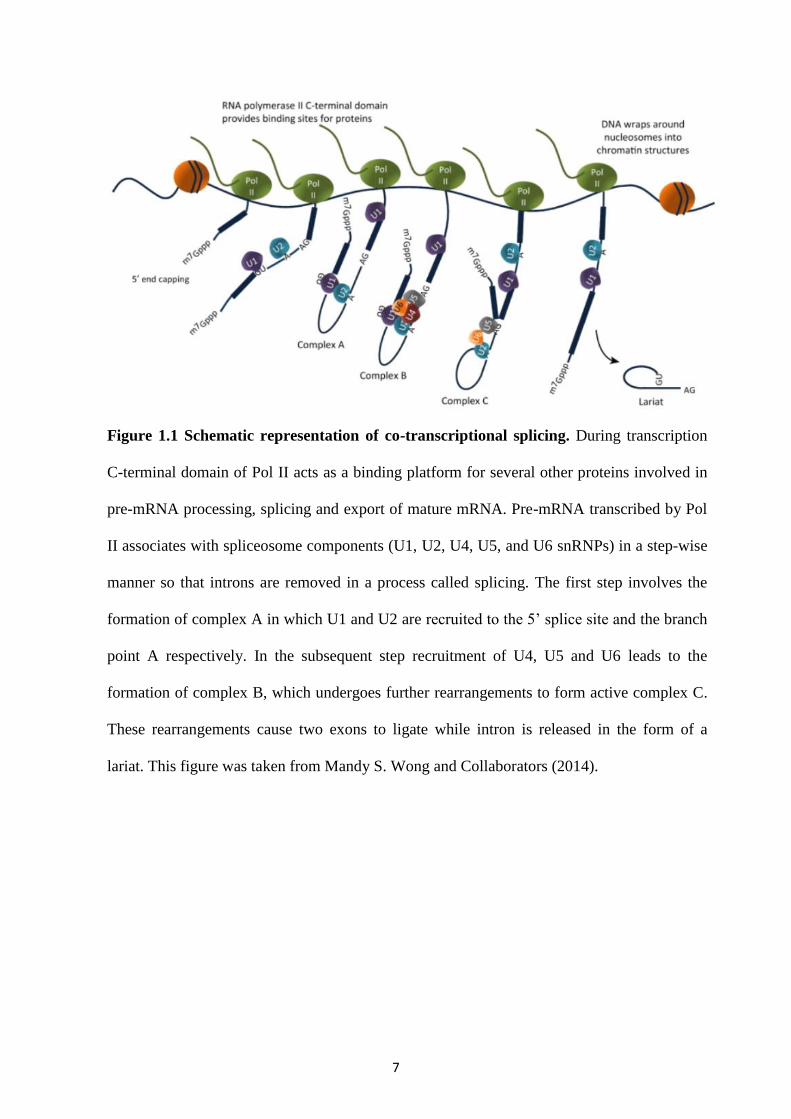
Figure 1.1 Schematic representation of co-transcriptional splicing. During transcription
C-terminal domain of Pol II acts as a binding platform for several other proteins involved in
pre-mRNA processing, splicing and export of mature mRNA. Pre-mRNA transcribed by Pol
II associates with spliceosome components (U1, U2, U4, U5, and U6 snRNPs) in a step-wise
manner so that introns are removed in a process called splicing. The first step involves the
formation of complex A in which U1 and U2 are recruited to the 5’ splice site and the branch
point A respectively. In the subsequent step recruitment of U4, U5 and U6 leads to the
formation of complex B, which undergoes further rearrangements to form active complex C.
These rearrangements cause two exons to ligate while intron is released in the form of a
lariat. This figure was taken from Mandy S. Wong and Collaborators (2014).
8
1.2 Eukaryotic cell compartmentalization and the bridge between transcription and
translation
The distinctive feature of eukaryotic gene expression is that translation occurs only in the
cytoplasm. However, coordination between transcription and translation is required to
express genes accurately and efficiently. In case of prokaryotes, this is achieved directly, by
physical coupling between the RNA polymerase and ribosomes which are loaded on the
nascent transcript (Proshkin et al., 2010). Since in eukaryotes the nuclear envelope separates
the nucleus from the cytoplasm, such direct coordination does not occur; transcription and
RNA processing take place in the nucleus and translation in the cytoplasm. However, some
studies indicate that pre-mRNA splicing, as a nuclear process, enhances cytoplasmic events
such as nonsense mediated mRNA decay (NMD), outlined in the next section, which is
coupled to translation (Carter et al., 1996). These studies suggest that there must be some
means by which mRNAs that have been spliced are differentiated from otherwise identical
transcripts generated from intron-less genes. The discovery of the exon junction complex
(EJC), a number of proteins deposited on mRNA during splicing and transported along with
it to the cytoplasm, provides an explanation. Next I will review the NMD phenomenon and
published data that provide a model of how the EJC could coordinate splicing and NMD.
9
1.2.1 Nonsense Mediated Decay (NMD)
NMD is a translation dependent process found in all eukaryotes that rapidly destroys mRNA
containing a premature translation termination codon (PTC) (Muhlemann et al., 2008). NMD
is thought to reduce the accumulation of proteins derived from PTC-containing mRNAs that
could be detrimental to survival. NMD targets are originally identified as point mutations in
the DNA which generated PTCs, but have since been found to arise from errors during
transcription or pre- mRNA processing (Chang et al., 2007). NMD has been more intensely
studied in Saccharomyces cerevisiae, D. melanogaster, Caenorhabditis elegans and
mammalian cells (Amrani et al., 2004; Le Hir et al., 2001). All these studies indicate that
NMD is an active process which requires mRNA translation and specific trans-acting factors.
These include the up-frameshift proteins (UPF) encoded by the upf1, upf2, and upf3 genes,
which were first discovered in a genetic suppressor screen in S. cerevisiae (Cummins et al.,
1980). A similar study also identified seven genes encoding NMD factors (SMG1-7) in C.
elegans, The NMD factors UPF1, UPF2, and UPF3 are homologous to SMG-2, SMG-3 and
SMG-4 in C. elegans. These three proteins are highly conserved in all eukaryotic organisms
and deletion of one of these genes, particularly UPF1 or UPF2, result in stabilization of PTC-
containing mRNAs (Conti and Izaurralde, 2005; Perlick et al., 1996).
UPF1 is considered to be the key component of NMD and current models suggest that it
forms a surveillance complex by interacting with eukaryotic translation release factors (eRF1
and eRF3) together with UPF2, UPF3 and exon junction complex (EJC) proteins to degrade
PTC-containing mRNAs in the cytoplasm (Leeds et al., 1991). The UPF proteins associate

10
together to form an active complex which carries out NMD from yeast to humans (Conti and
Izaurralde, 2005). However, a key outstanding question is how the cell distinguishes between
those mRNAs that contain PTCs and those which possess normal stop codons. One model,
known as faux 3’UTR model, predicts that this distinction depends on the distance between
the stop codon and the 3’ end of the mRNA (Amrani et al., 2004; Behm-Ansmant et al.,
2007). The other model, as reviewed below, predicts that the PTC can be recognized by the
presence of one or more downstream introns, which instead are typically not present in
standard 3’UTRs.
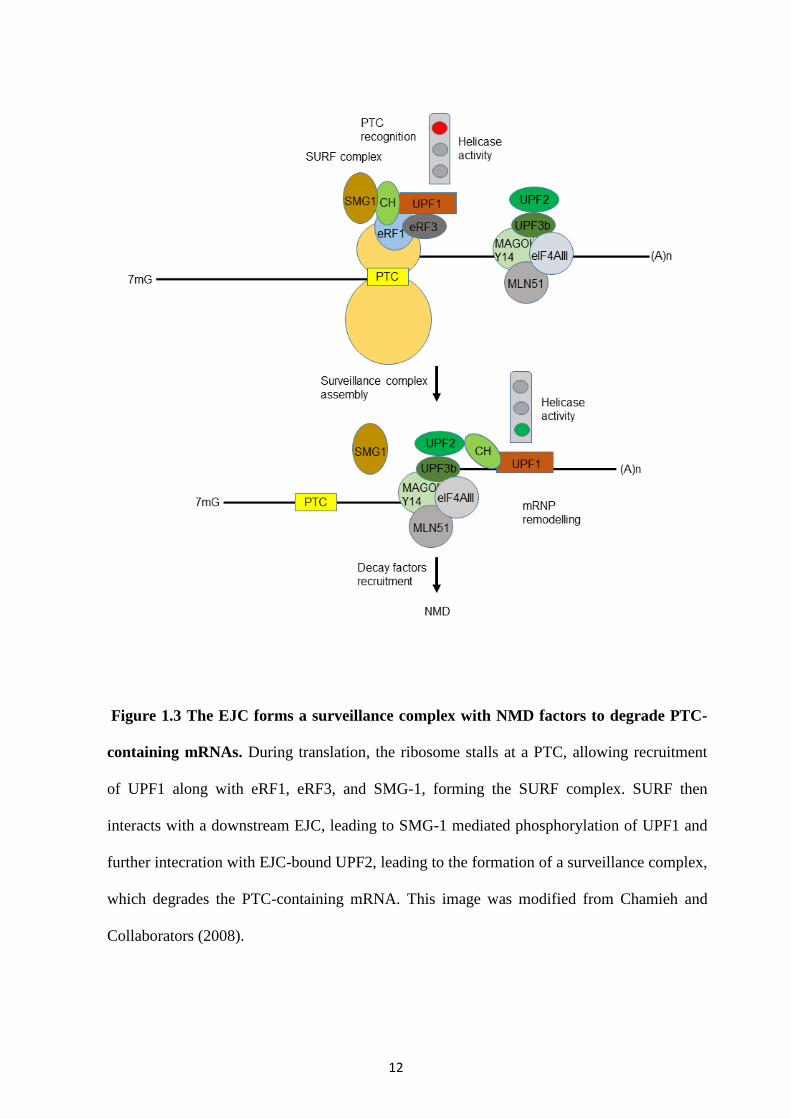
1.2.2 EJC stimulates NMD in mammalian cells
Studies in mammalian cells indicate that a PTC is distinguished from a normal stop codon by
its position relative to an exon-exon junction (Zhang et al., 1998). When a PTC is located
more than 50-55 nucleotides upstream of last exon-exon junction the mRNA is targeted for
rapid degradation (Zhang et al., 1998). This has been explained by the presence of EJC
proteins, which are deposited on a spliced mRNA ~20-24 nucleotides (nt) upstream of the
exon-exon junction; this binding is sequence independent, but position dependent (Figure
1.2) (Le Hir et al., 2000a). This model provides a very plausible account of how splicing and
NMD are linked. According to this model, during translation, when a ribosome reaches a stop
codon upstream of the EJC, it serves as a binding platform for NMD factors which initiate
mRNA degradation (Figure 1.3).

11
Figure 1.2 Association of the EJC with spliced mRNA enables interaction with
associated factors. The EJC is deposited 20-24 nt upstream of an exon-exon junction during
splicing. The EJC bound to a spliced mRNA creates a platform for other peripheral factors to
assemble. Most of these factors are transiently associated with the EJC and their functions
include NMD, mRNA transport, splicing, and mRNA localization. This image was modified
from Tange and Collaborators (2004).
12
Figure 1.3 The EJC forms a surveillance complex with NMD factors to degrade PTC-
containing mRNAs. During translation, the ribosome stalls at a PTC, allowing recruitment
of UPF1 along with eRF1, eRF3, and SMG-1, forming the SURF complex. SURF then
interacts with a downstream EJC, leading to SMG-1 mediated phosphorylation of UPF1 and
further intecration with EJC-bound UPF2, leading to the formation of a surveillance complex,
which degrades the PTC-containing mRNA. This image was modified from Chamieh and
Collaborators (2008).
13
The EJC contains four proteins at its core: Y14 and MAGO, which form a heterodimer,
eukaryotic translation initiation factor 4AIII (eIF4AIII) (Tange et al., 2004) and metastatic
lymph node 51 (MLN51) (Barentsz or Btz in Drosophila) (Degot et al., 2004). These core
EJC components allow it to interact in a dynamic manner with peripheral factors involved in
splicing, mRNA localization, EJC assembly and the latter stages of mRNA metabolism
(Figure 1.2). In the cytoplasm, apart from having a role in NMD, EJC components Y14,
MAGO and RNPS1, when tethered to an artificial reporter, enhance the translation yield
from intronless mRNAs (Nott et al., 2004). In Xenopus oocytes, spliced mRNAs yield more
protein than identical mRNAs produced from intronless genes. Thus, it has been concluded
that splicing can enhance translation (Matsumoto et al., 1998).
It has been proposed that eIF4AIII is the only component of the EJC in direct contact with the
RNA, and it is with this that Y14 and MAGO interact before export to the cytoplasm (Ballut
et al., 2005). eIF4AIII is a DEAD-box protein and belongs to the subgroup of DExH/D-box
family of RNA-dependent ATPases, which bind to the RNA directly (Shibuya et al., 2004).
The crystal structure of the three-dimensional core of the EJC explains how these
components are organized into a complex (Bono et al., 2006). The structure of the EJC core
is L- shaped with eIF4AIII and Btz at the base and the Y14-MAGO heterodimer arranged
perpendicularly to it (Figure 1.4) (Bono et al., 2006). In the presence of ATP eIF4AIII adopts
a closed conformation and binds to the RNA. Y14–MAGO forms a stable heterodimer with a
molecular mass of about 40 kDa on spliced mRNAs and is considered to be a nuclear shuttle
protein, which is imported back to the nucleus by Importin 13 (Imp13), a protein transport
factor belonging the karyopherin-beta family (Bono et al., 2010). Although Y14 has an RNA
recognition motif (RRM), its RNA binding site is buried when in association with MAGO
(Fribourg et al., 2003). Thus, rather than binding to RNA, the main function of the Y14-

14
MAGO heterodimer is to inhibit ATP hydrolysis of eIF4AIII, so that eIF4AIII effectively
locks onto the RNA. This explains the remarkable ability of the EJC to persist through
nuclear export and cytoplasmic localisation (Ballut et al., 2005). As described above, the
Y14-MAGO heterodimer has been shown to increase the translation of spliced mRNAs and
both are also required for cell viability (Mohr et al., 2001). Additionally, a mutated form of
Y14, which prevents its interaction with MAGO, leads to stabilization of NMD substrates.
These observations suggest that Y14 and MAGO interaction is also crucial to elicit NMD
(Kim et al., 2001).
It has been reported that eIF4AIII is recruited to the spliceosome during the early step of
splicing rather than after splicing (Gehring et al., 2009). The mechanism of EJC loading
during splicing was not clear until recent reports showed that the spliceosome component
CWC22 interacts directly with eIF4AIII via a specific domain, which probably drives the
splicing-dependent assembly of EJCs (Figure 1.5) (Barbosa et al., 2012; Steckelberg et al.,
2012). CWC22 is an abundant component of the activated spliceosomal C complex
(Bessonov et al., 2010).

15
Figure 1.4 Three-dimensional representation of the arrangement of core EJC
components. Human EJC seen here in two orientations rotated by 180⁰ about a vertical axis.
In this model, Btz, marked in red, stretches over eIF4AIII (yellow). RNA (black line)
interacts with two RecA-like domains of eIF4AIII. MAGO (in blue) and Y14 (in magenta)
bind to domain 2 of eIF4AIII, and this interaction surface also included domain 1 of
eIF4AIII. The dotted red line indicates the approximate position of a region of Btz not present
in the X-ray structure. This image was taken from Bono and Collaborators (2006).

16
Figure 1.5 The EJC component eIF4AIII is deposited during early steps of splicing. The
interaction of the EJC core component eIF4AIII with splicing factor CWC22 creates a
platform for other core factors, Y14 and MAGO, enabling their deposition on spliced
mRNAs. Once the EJC has associated with spliced mRNA, it assists in guiding the mRNA
through the nuclear pore complex to the cytoplasm. In the cytoplasm, the EJC has a role in
enhancing translation, degrading PTC-containing mRNAs and localizing mRNAs to their
specific location.
17
1.2.3 Canonical and non-canonical form of EJC
Previously, most research into the mammalian EJC was conducted, either in vitro or in vivo,
with artificially tethered reporter RNAs or expressed proteins (Bono and Gehring., 2011).
However, the most recent studies into endogenous EJC proteins show that in fact EJCs
multimerize together with numerous SR proteins to form mega-Dalton sized complexes, in
which SR proteins are super-stoichiometric to the EJCs core factors (Singh et al., 2012).
These complexes, termed high molecular weight (HMW) EJCs, probably protect long
stretches of RNA from nuclease digestion. Immunoprecipitation experiments confirmed the
presence of the SRSF1, SRSF3, and SRSF7 SR proteins within the HMW complex. In these
studies, as expected, most of the EJC deposition sites were at the 24 nucleotide position
upstream of the last exon-exon junction. EJCs located in this position are termed canonical
EJCs (cEJCs), however, recent RNA seq data indicate EJC binding is not always at such
sites and enrichment is also found at other exonic locations, termed non-canonical EJC
(ncEJC) sites (Singh et al., 2012). Unlike cEJCs, whose binding is sequence independent,
ncEJCs are mainly observed to bind specific sequences including CG-rich motif regions in
the first exon, C-rich motifs regions which resemble high affinity binding sites for SRSF3 in
internal exons and AG-rich motif regions resembling the binding site for SRSF1 (Singh et al.,
2012).
In a similar cross-linking immunoprecipitation (CLIP) study, which was followed by high-
throughput sequencing of eIF4AIII, one of the EJC’s core components was found to occupy
both canonical and non-canonical regions (Sauliere et al., 2012). Remarkably, cEJCs and
ncEJCs share similar features. There is no enrichment of either cEJCs or ncEJCs on the exons
of intron-less mRNAs, while they are found in the CDS of spliced mRNAs and specifically

18
associated with exons flanked by long introns (Sauliere et al., 2012). Moreover, both CLIP-
seq and mRNA-seq data of two spliced mRNAs showed that eIF4AIII occupancy varies
between the exon junctions from the same transcript, raising the question of whether other
factors influence the presence of the EJC on spliced mRNAs (Sauliere et al., 2012). Analysis
of the sequence motif region for eIF4AIII indicates enrichment associated with a GAAGA
region at both canonical and non-canonical sites. Interestingly, GAAGA regions are higher
affinity binding sites for SR proteins. This observation suggests that the binding of the EJC is
not uniform across exon-exon junction, as reported earlier. In addition, the EJC forms a tight
molecular bond with SR proteins, as previously reported in an in vitro study (Le Hir et al.,
2000b). Therefore, it is possible that SR proteins, or other RNA binding factors, directly or
indirectly modulate the binding of the EJC to a particular site.
1.2.4 The EJC is deposited at splice junctions also in Drosophila
The EJC core proteins are well conserved in Drosophila; where Y14, MAGO and MLN51
are also known as Tsunagi, Mago Nashi and Barentsz (BTZ) respectively (Macchi et al.,
2003; Mohr et al., 2001; Palacios et al., 2004). The core components eIF4AIII, Y14 and
MAGO are mostly localized in the nucleus (Le Hir et al., 2001; Palacios et al., 2004).
Although BTZ considered as a core EJC component, evidence suggests that BTZ associates
with the EJC after mRNA export to the cytoplasm (Macchi et al., 2003). As described above
eIF4AIII interact with splicing factor CWC22 and recruited early step of splicing, whereas
MAGO and Y14 bind during excision of intron and exon ligation (Ballut et al., 2005).
Association of BTZ further stabilizes the EJC core on the mRNA in the cytoplasm (Bono
and Gehring, 2011). A study into the Y14-MAGO heterodimer carried out in Drosophila,
showed that it is required for the localization of oskar mRNA, a gene involved in Drosophila
embryonic development, to the posterior pole of the oocyte (Hachet and Ephrussi, 2001). In

19
addition, mutant forms of either of the two proteins lead to mislocalization of oskar mRNA in
Drosophila oocytes (Mohr et al., 2001). Recent findings reported that partner of Y14 and
MAGO (PYM), a cytoplasmic protein in Drosophila, enables the dissociation of the EJC
from oskar mRNA, which leads to its mislocalization and female infertility (Ghosh et al.,
2014). Additionally, Y14 and MAGO are also required for germline stem cell differentiation
and oocyte maturation (Parma et al., 2007). Unlike the mammalian heterodimer, Drosophila
Y14-MAGO does not have any role in NMD (Gatfield et al., 2003).
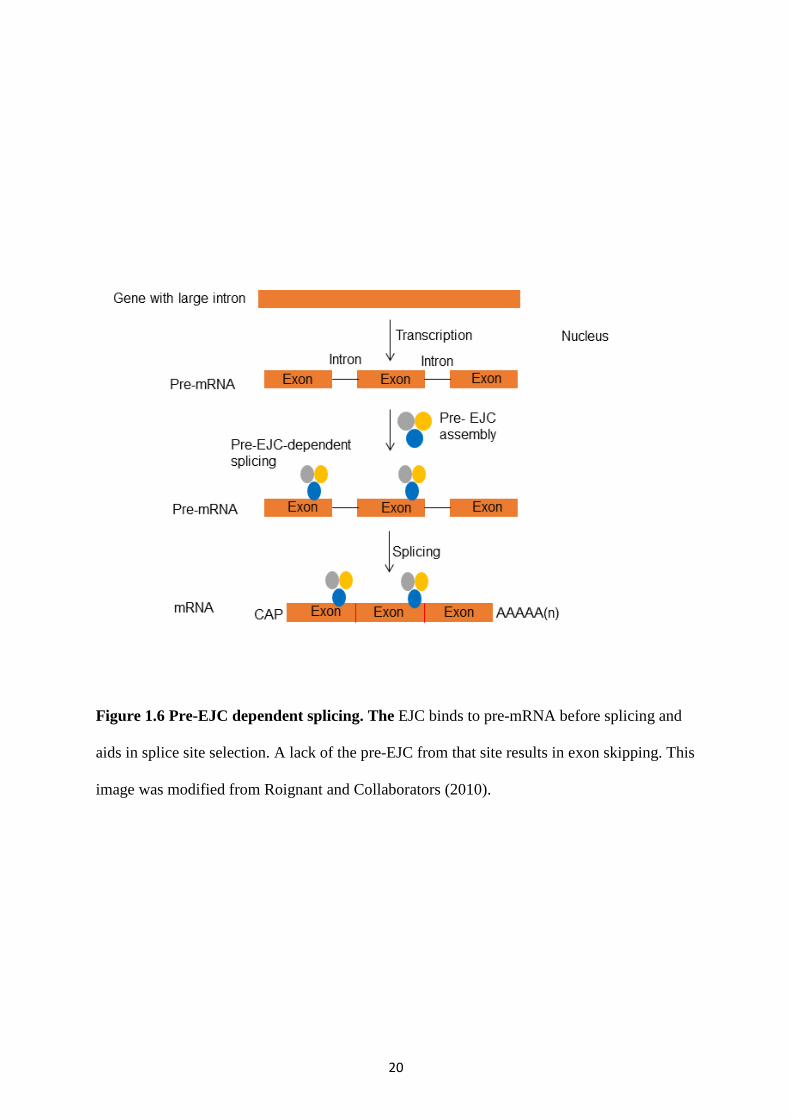
Although the majority of research focuses on the EJC’s role in post-splicing events, some
recent data in Drosophila has shown that it could exist initially as a pre-EJC which influences
the splicing process itself (Ashton-Beaucage et al., 2010; Roignant and Treisman, 2010).
Evidence from these studies suggests that the pre-EJC plays an important role in splicing of a
specific subset of primary transcripts, including mitogen activated protein kinases (MAPK)
pre-mRNA, and in the absence of pre-EJC subunits, MAPK mRNA levels are significantly
reduced. Based on their model, binding of the EJC occurs before splicing, and loss of the EJC
from those sites results in exon skipping during splicing (Figure 1.6). This demonstrates
another role for the EJC, that of influencing the processing of a specific set of transcripts in
the nucleus. Moreover, it has also been proposed that pre-mRNA having large introns are
more sensitive to depletion of pre-EJC, which result in exon exclusion indicates that the EJC
has a role in exon definition of long intron-containing genes (Ashton-Beaucage et al., 2010).
In a similar study it has been reported that the EJC is required for splicing of intron 4 of the
piwi transcript, (a small non-coding RNA) and lack of the EJC results in splicing defects of
this intron (Hayashi et al., 2014) .
In summary, the EJC seems to have diverse functions, both in the nucleus and the cytoplasm,
which further indicates that it plays an important role in coupling nuclear and cytoplasmic
events in gene expression.
20
Figure 1.6 Pre-EJC dependent splicing. The EJC binds to pre-mRNA before splicing and
aids in splice site selection. A lack of the pre-EJC from that site results in exon skipping. This
image was modified from Roignant and Collaborators (2010).
21
1.3 Nuclear Translation
1.3.1 PTC recognition in the nucleus
Although the EJC model provides a reasonable explanation of how splicing could affect
NMD, and translation, other data from the NMD field indicate that PTC-containing mRNAs
might also be degraded in the nucleus. Early studies suggest that many mammalian mRNAs
are down-regulated by NMD in the nuclear fraction (Belgrader et al., 1994; Chang and Kan,
1979; Urlaub et al., 1989). Additionally, it has also been reported that scanning of mRNA
occurs either in the nucleus or when it is still associated with the nucleus before entering the
cytoplasm (Maquat and Carmichael, 2001). Earlier evidence that nonsense mutations in the
human triosephosphate isomerase (TPI) gene lead to the reduction of 25% of normal mRNA
in the nucleus further support the suggestion that NMD is a nucleus-associated event
(Belgrader et al., 1994). In addition, there is evidence from mammalian systems suggesting
that NMD may take place in the nucleus (Chang and Kan, 1979).
The discovery of the cap binding complex (CBC) further supports the idea that NMD occurs
on newly synthesized mammalian mRNAs. The cap binding complex (CBC) consists of the
CBP20 and CBP80 subunits that bind to the 5’ cap of nascent mRNAs during transcription
and are required for stability of the mRNA (Leeds et al., 1992). During the pioneer round of
translation, CBP80 is replaced by cytoplasmic translation initiation factor eIF4E (Maquat et
al., 2010). However, the study suggests that PTC recognition occurs while mRNA still bound
with CBP80 before replace with cytoplasmic eIF4E, therefore NMD does occur with CBP80
associated mRNA not with eIF4AE associated mRNA (Ishigaki et al., 2001). Therefore,
CBP80-bound mRNAs harbouring a PTC are the primary targets of NMD, rather than eIF4E-

22
bound mRNAs during the pioneer round of translation. In addition, NMD factors UPF2 and
UPF3 are also observed to associate with spliced mRNPs when immunopurified with an anti-
CBP80 antibody (Ishigaki et al., 2001). However, this may suggest that nuclear NMD occurs
during a pioneer round of translation of mRNAs which have not yet been released from the
nuclear envelope. Moreover, in a parallel study it was also reported that EJC components co-
immunopurified with CBP80 but not with eIF4E (Lejeune et al., 2002). In addition, it is also
reported that the level of mRNAs bound by the CBP80 subunit decreases in the presence of
PTC. In contrast, there is no such decrease in mRNA levels observed when bound by eIF4E,
further indicating that NMD acts only on CBP80-bound mRNAs (Cui et al., 1995).
However, it is also proposed that PTC recognition occurs on nascent transcript and this idea is
supported by experiments showing that PTCs can affect specific nuclear events, such as
alternative splicing and 3’ end formation (Brogna, 1999; Wang et al., 2002) . Moreover, a ChIP
study indicated that SMG6 and UPF1 associate with transcription sites of both PTC+ and PTC–
reporter genes in mammalian cells, suggesting that NMD may occur co-transcriptionally (de
Turris et al., 2011). Taken together, the evidence suggests that PTC recognition, and therefore
translation, might also occur in the nucleus, possibly close to sites of pre-mRNA synthesis.
1.3.2 Controversial issue with nuclear translation
The hypothesis that some translation occurs in the nucleus remains debated. The debate has
been re-opened following the observation that some NMD also occurs in the nucleus. Thus, it
has been proposed that NMD mechanism utilizes active nuclear ribosomes (Wilkinson and
Shyu, 2002). More recently, direct evidence for nuclear translation was provided by
experiments that allow visualization of translation sites in mammalian cells (Iborra et al.,
2001). It was reported that fluorescently labelled amino acids could be incorporated into
nascent peptides in highly purified nuclei. In this assay, putative translation sites were readily

23
visible under a fluorescence microscope and appeared as distinct fluorescent dots. The
occurrence of this nuclear fluorescence was prevented by translation inhibitor drugs.
In Drosophila, similar observations were reported and found that [35S] methionine/cysteine
was rapidly incorporated at active transcription sites of polytene chromosomes and also in the
nucleolus; this incorporation is sensitive to translation inhibitor drugs (Brogna et al., 2002). In
addition, many ribosomal proteins and some translation factors are found associated with
transcription sites, and an in-situ hybridization study showed that rRNAs are also present at
these chromosomal sites (Brogna et al., 2002). It was argued, that the nuclear translation
reported by Iborra et al (2001) may be an artefact of over-permeabilization that allowed entry
of cytoplasmic ribosomes into the nucleus (Nathanson et al., 2003). Additionally, it was also
argued that the antibodies used by Brogna et al to detect ribosomal proteins were not
sufficiently specific. However, one study in yeast suggests that ribosomal proteins also present
at chromosomal sites (De et al., 2011; Schroder and Moore, 2005). In addition, fluorescent
protein tagging recently confirmed the presence of ribosomal proteins at Drosophila polytene
chromosomes (Rugjee et al., 2013). This further observation is consistent with previous
observations made by Brogna et al (2002). Furthermore, it has very recently been reported that
puromycin can be incorporated into the nucleus and nucleolus of mammalian cells, and it was
concluded that translation therefore must occur at these sites (David et al., 2012). In this study,
they developed a novel technique known as ribopuromycylation in which the usually released
puromycylated peptide is immobilized on ribosome by translation elongation inhibitor drugs,
followed by detection of these nascent chains with an antibody specific to puromycin. It has
however been argued that puromycylation is an indicator of peptidyl transferase activity, and
not necessarily of 80S engaged in translation (Dahlberg and Lund, 2012). The question of
whether translation can occur in the nucleus was therefore, unanswered at the start of my PhD.

24
1.0 Aims, and research plan
I would like to advance our understanding of the mechanism that links pre-mRNA splicing
with NMD. The results of a number of studies across organisms show that pre-mRNA
splicing, a strictly nuclear process, affects NMD, a process expected to be restricted to the
cytoplasm. It has been proposed that this link is mediated by the exon junction complex
(EJC), a multiprotein complex deposited during splicing in the nucleus, which remains
associated with the mRNA during export to the cytoplasm. Some observations are not
consistent with this function attributed to the EJC. For example, all of the proteins that
constitute the EJC are well conserved in Drosophila, yet these proteins are not required for
NMD in this organism. Since splicing is a co-transcriptional process in Drosophila,
I aimed to visualize the association of EJC proteins at the sites of transcription at
which nascent RNA is present, in the polytene chromosome. If these proteins do
associate with transcription sites, I will then directly test key predictions of current
models such as that EJC proteins are recruited selectively at intron-containing genes
and will also assess whether EJC assembly differs depending on specific intron
features.
In my second project I will investigate whether there are functional ribosomes and
ribosomal proteins at transcription sites and whether there is a link between these
ribosomes and NMD. I plan to investigate the presence of both ribosomes and
ribosomal proteins at transcription sites by using the same approach as used for EJC
proteins. In parallel, I will use a similar experimental approach to visualize nascent

25
RNPs and pre-mRNA splicing at the site of transcription, which will give us a better
understanding of the proteins associated during splicing such as the EJC.

26
Chapter 2
2.0 Materials and Methods
2.1 Solutions and buffers
All buffers, solutions, and media were prepared according to standard protocols described in
Molecular Cloning 4th edition (Sambrook et al., 2012). Molecular biology kits were used as
directed by the company, unless otherwise stated. All solutions were prepared with analytical
grade reagents (Sigma-Aldrich, Fisher Scientific or VWR) in double distilled water and
subsequently sterilized by autoclaving or by filtration through a 0.22 µm filter (Pall
Corporations). Solutions used for RNA experiments were treated with diethylpyrocarbonate
(DEPC, 0.1% v/v), incubated overnight in a laminar flow hood and subsequently sterilized by
autoclaving the next morning.
2.2 Drosophila Schneider 2 cells (S2 cells) culture and maintenance
The S2 cell line derives from a primary culture of late stage (20-24 h old) Drosophila
melanogaster embryos (Schneider, 1972). S2 cells are easy to maintain as they normally
grow at room temperature without CO2 and form a semi-adherent monolayer in tissue culture
flasks. S2 cells were maintained in T25 tissue culture flasks in Insect–XPRESS medium
(Lonza) supplemented with 10% (v/v) fetal bovine serum (FBS) and 1% (v/v) Penicillin-
Streptomycin-Glutamine (P/S/G) (Invitrogen), incubated at 27°C without CO2. S2 cells were
normally split in a 1:5 ratio of cells to media into a fresh tissue culture flask every two days
until the confluence reached ~70%-80%.

27
2.2.1 Transfection of S2 cells
To carry out transfection, cells were seeded at a 3 X 10⁶ cells/well in a 6 well plate with
complete media (10% v/v FBS and 1% v/v P/S/G) and were grown at 27⁰C. The following
day, transfection was carried out by mixing plasmid DNA (2.5 µg/ml per well) with 5µl of 4
mg/ml of the transfection reagent dimethyldioctadecylammoniumbromide (DDAB, Sigma-
Aldrich) as described in Ramanathan and collaborators (2008). DNA was thoroughly mixed
with DDAB and incubated for 30 min at room temperature. Meanwhile, cells were washed
twice with 1 ml serum-free media (no FBS and P/S/G). Following incubation, the whole
transfection mix was diluted with serum-free media to a final volume of 1 ml shaken
vigorously to ensure thorough mixing, then transferred into the well of the cell culture plate.
The cell culture plates were kept in the 27⁰C incubator for 2 h and 30 min. After incubation,
the transfection mix was carefully removed from the well and replaced with 2 ml 10% (v/v)
complete media (10% v/v FBS and 1% v/v P/S/G,) and returned it is only similar with those
with to 27⁰C incubator for a further two days.
2.3 Chromatin Immunoprecipitation (S2 cells)
2.3.1 Cross-linking and sonication
S2 cells were grown in a T75 tissue culture flask at 27°C in 15 ml of Insect–XPRESS
medium (Lonza) supplemented with 10% (v/v) fetal bovine serum (FBS) and 1% v/v P/S/G
(Invitrogen) for 2 days. The cells were counted with a haemocytometer and 107 cells were
used for each ChIP. Cells were fixed by adding formaldehyde (10% EM grade, Polyscience)
to a final concentration of 1% (v/v) and incubated at 25°C for 15 min. After fixation, glycine
was added to the cell mixture at a concentration of 125mM, followed by incubation another 5
min at 25°C to stop the cross-linking reaction. Next the cells were pelleted by centrifugation

28
at 3000 rpm/ 835 g (Eppendorf) for 5 min at 4⁰C. The cell pellet was resuspended in 500 µl
of 1X PBS with one tablet of EDTA-free Complete Protease Inhibitor Cocktail (Roche) and
washed for two times. After washing, the supernatant was discarded, and cell pellets were
stored at -80°C for further used in a ChIP experiment.
2.3.2 Sonication optimization
Sonication is one of the key steps for successful ChIP as it renders the chromatin soluble and
dictates the resolution of the assay. Normally the DNA fragment size used in a ChIP
experiment is 200 – 1000 bp. Sonication conditions should be optimized for different cell
lines, and the sonication efficiency depends on the cell line, cell density, and the extent of
cross-linking. Sonication was performed with Biorupture (Diagenode). Conditions were
optimized using S2 cells with different time intervals and a pulse of 15 seconds on and 15
seconds off, to produce DNA fragments in the range of 0.5-1.0 kb in size. The fragment sizes
were checked by agarose gel electrophoresis (Figure 2.1). Judging from the gel, sonication
carried out between 8 and 16 minutes produced the desired sized fragments. Therefore,
sonication was performed for 12 minutes to achieve optimal fragment size.

29
Figure 2.1 Optimization of sonication time
Sonication of chromatin samples for different time intervals (2 min, 4 min, 8 min and 16 min)
using a Biorupture sonicator. The samples were run on a 1% agarose gel (w/v), and the size
of the fragment was determined by comparison with a 100 bp DNA marker (Thermo
Scientific) run in parallel.

30
2.3.3 Chromatin immunoprecipitation
ChIP was performed using 40 µL of Dynabeads®Protein-G beads, per sample. The 40µL of
beads was split into two tubes, 25µL of which were coated with the desired antibody (+Ab)
and 15 µL of which were pre-absorbed (-Ab). The beads were then washed four times in
LoBind microcentrifuge tubes (Eppendorf) with 1ml of 1X PBS containing 5 mg/ml bovine
serum albumin (BSA). Washing steps were carried out by rotating the tubes six times in a
magnetic stand. After each wash the beads were allowed to migrate to the back of the
magnetic stand so that the supernatant could be discarded completely.
After the final wash, beads were resuspended again in 500 µL of 1 X PBS with 5mg/ml BSA.
Typically, 2µg of anti-Y14 antibody (see section 2.8.10) were added to the tube derived from
25 µL of beads. Both +Ab and –Ab tubes were incubated overnight at 4⁰C with rotation. The
next day pellets of cross-linked cells (section 2.3.1) were thawed on ice and resuspended in
100 µl of SDS lysis buffer (1% w/v SDS, 10 mM EDTA). The cell suspension was then
sonicated at high intensity for 12 min with 15 sec on/off in a Bioruptor sonicator. Samples
were diluted in 1 ml ChIP dilution buffer (0.01% w/v Sodium dodecyl sulfate (SDS), 1.1%
v/v Triton X-100, 1.2 mM EDTA, 16.7 mM Tris-HCl pH 8.1, 167 mM NaCl) and centrifuged
at 13000 rpm/ 15682 g (Eppendorf) for 10 min at 18°C (n.b. SDS will precipitate at 4⁰C) to
pellet insoluble material. The supernatant (soluble chromatin) was kept in LoBind
microcentrifuge tubes at 4⁰C. In the meantime, both +Ab and -Ab beads were washed four
times with 1 ml of 1 X PBS with 5mg/ml BSA to remove unbound antibody, using a
magnetic stand as before. +Ab beads were then resuspended in 40 µl of 1X PBS with 5mg/ml
BSA, whereas -Ab beads were resuspended in 25 µL and added to prepared before. Next 1 ml
of the soluble chromatin was added to the -Ab beads and incubated for 15 min at room

31
temperature with rotation. The mixture was then spun briefly, the beads were pelleted in a
magnetic stand and the supernatant was transferred into a fresh LoBind microcentrifuge tube.
Approximately 50-100µL of the soluble chromatin was kept as an input control and stored at
-20°C. The 40µL+Ab beads sample was added to the remainder of the soluble chromatin and
incubated for two and a half hours at room temperature with rotation to allow the formation
of antibody-antigen immune complexes on the beads.
2.3.4 Washing steps
The beads were separated from the supernatant using a magnetic stand, as previously
explained. Beads were then sequentially washed with rotation at room temperature for 5 min
with 1 ml of each of the following buffers: low salt wash (0.1% w/v SDS, 1% v/v Triton X-
100, 2 mM EDTA, 20 mM Tris-HCL pH 8.1, 150 mM NaCl); high salt wash (0.1% w/v SDS,
1% v/v Triton X-100, 2 mM EDTA, 20 mM Tris-HCL pH 8.1, 500 mM NaCl); LiCl wash
(0.25M LiCl, 1% v/v IGEPAL-CA630, 1% w/v deoxycholic acid, 1 mM EDTA, 10 mM Tris-
HCL (pH 8.1); two 5 min washes in 1mL of TE buffer (10 mM Tris-HCL (pH 8.0), 1 mM
EDTA). Beads were vortexed in each washing buffer and collecting on a magnetic stand, as
previously described. The supernatant was discarded after each wash.
2.3.5 Elution steps and reverse cross-links
Protein-DNA complexes were eluted from the beads by washing them twice with 75µl of
freshly prepared 0.1M NaHC03 solution containing 1% w/v SDS. The mix was then vortexed,
briefly spun and incubated with rotation at a room temperature for 15 min. The tube was spun
briefly and the beads were separated from the supernatant using a magnetic stand. The
supernatant was transferred to a new LoBind microcentrifuge tube and the beads were
resuspended with a further 75 µl of elution buffer and the process was repeated, resulting in a
32
final volume of 150 µl. More elution buffer was added to the input sample to bring it up to
the same volume as the ChIP sample (150 µl). Protease K was added to all samples (2 µl of
50 mg/ml) which were then incubated overnight at 65⁰C on a dry heat block to digest
proteins and to reverse crosslinks.
2.3.6 Purification steps
Following overnight incubation, DNA samples (both the input and ChIP samples) were
purified using AMPure XP beads (Beckman Coulter). 1.8 volumes of AMPure XP bead
slurry was added to each DNA sample. Samples were mixed by vortexing thoroughly and
were incubated with rotation for 10 min at room temperature to allow the DNA to bind to the
beads. Once the incubation was completed, samples were briefly spun, and beads were
recovered using a magnetic stand while the supernatant was discarded. Beads were then
washed three times with 300 µL of freshly prepared 70% v/v ethanol (EtOH), using a
magnetic stand as previously described, ensuring all EtOH was removed. The pellet was air-
dried in a magnetic stand until cracks were visible in the beads slurry. DNA was eluted by
resuspending the beads in 30µL of 10 mM Tris elution buffer (pH 8.0). The tube was placed
back into the magnetic stand to separate the beads from the eluate. This process was repeated
three times until all the beads were removed.
2.3.7 Solid ChIP-Seq library preparation
Library preparation and sequencing of ChIP DNA were performed by Dr. Paul Badenhorst at
the Institute of Biomedical Research (IBR), University of Birmingham, UK, using the SOLID
system Fragment Library protocol from Applied Biosystems.

33
2.4 S2 cells RNA interference (RNAi)
A primer pair for the gene of interest was obtained from an online tool - fly RNAi Updated
Targets of RNAi Reagents (UP-TORR) - www.flyrnai.org/up-torr, and the desired gene Y14
and eIF4AIII was PCR amplified from FLAG-tagged plasmid (Appendix IV) and MAGO
from fly cDNA plasmid library (available in Dr. Brogna lab). PCR fragments were purified
with a QIAquick PCR Purification Kit (QIAGEN) according to the provided protocol. All the
primer pairs used were tagged with the T7 promoter sequence (5’-
TTAATACGACTCACTATAGGGGAGA-3’) at the 5’ end. The dsRNAs were synthesized
using the T7 RiboMAX express RNAi system (Promega) according to the manufacturer’s
instructions: 1µg of DNA was used as a template in a 20µl reaction containing 10µl
RiboMAX Express T7 2X buffer and 2µl Enzyme Mix T7 express. The final volume was
adjusted to 20µl with diethylpyrocarbonate (DEPC) treated water. The tube was gently mixed
and incubated for 2 h at 37⁰C. The mix was then incubated for 20 min at 70⁰C in a dry
heating block to inactivate the enzyme and to allow the RNA strands to anneal. 1µl of DNase
I (Promega) was added to the mix to remove the DNA template and the sample was further
incubated for 30 min at 37⁰C.
2.4.1 Purifying dsRNA
To purify dsRNA, 2.5 volumes of 95% v/v EtOH and 0.1 volumes of 3M sodium acetate (pH
5.2) were added to the mix and incubated for 30 min at -20⁰C. The RNA was then pelleted by
centrifugation at 13,000 rpm/ 15682 g (Eppendorf) for 15 min at 4⁰C, and the supernatant
was discarded. The pellet was washed in 70% v/v EtOH and air dried for 15 min at room
temperature, then resuspended in 100µl of DEPC treated water. Nanodrop spectrophotometer
was used to measure the concentration of dsRNA, and its integrity was checked by running
1µl on a 1% w/v agarose gel.

34
2.4.2 S2 cells siRNA
S2 cells were grown for two days in T25 culture flasks with 5 ml of Insect–XPRESS medium
(Lonza) supplemented with 10% v/v fetal bovine serum (FBS) and 1% v/v P/S/G (Invitrogen)
media. On the day of the RNAi treatment, cells confluency were checked by phase contrast
microscopy and subsequently transferred into a 50 ml falcon tube. The cell culture was then
centrifuged at 1000 rpm/ 92 g (Eppendorf) for 3 min at room temperature, the supernatant
was discarded and the cell pellet was diluted with serum-free media (without FBS and P/S/G)
to a final concentration of 106 cells/ml. Next 1 ml of cell culture was transferred to each well
of a six-well cell culture plate and 15µg of dsRNA was added to each. The cell culture and
dsRNA were mixed by moving the plate back and forth several times and were incubated for
a further hour at room temperature. After incubation, 2 ml of complete media (10% v/v FBS
and 1% v/v P/S/G) was added to the plate, mixed and placed in the 27⁰C incubator. The plate
was then incubated for a further four days to allow depletion of the pre-existing targeted
protein. After four days, cells were treated with 1µM ecdysone without changing the media
and incubated for 2 h at room temperature. RNA was then extracted from all the samples.
2.4.3 RNA extraction and complementary DNA synthesis (cDNA)
RNA extraction from S2 cells was carried out using the RNeasy Mini Kit (QIAGEN)
according to the manufacturer’s instructions. 700ng of total RNA was used for cDNA
synthesis using a qScript Kit (Quanta Biosciences). Synthesized cDNA was kept at -20⁰C for
later usage.

35
2.4.4 Quantitative Real-Time PCR
Quantitative real-time PCR was carried out using the SensiFAST SYBR Hi-ROX Kit
(Bioline). Real-time PCR was carried out in 96 well plates in an Applied Biosystems Prism
(ABI PRISM) 7000. The qPCR reaction was a two-step cycle with an initial denaturation at
95⁰C for 2 min, followed by 40 cycles of denaturation at 95⁰C for 15 s and annealing and
extension at 60⁰C for 1 min. The primer pairs used to check transcript levels of various genes
are listed in Appendix II. The threshold cycle (Ct) was set at a point where all samples were
in the exponential stage of amplification. This value was used to measure transcript levels of
target genes and was normalized by dividing by the level of the reference RpL32 control
transcript for each sample.
2.5 Purification of nuclear and cytoplasmic fractions from S2 cells
To separate nuclear and cytoplasmic fractions, a protocol based on one published by Parker
and Topol (1984) was used. S2 cells were grown in a T75 tissue culture flask at 27°C in 15
ml of Insect – XPRESS medium (Lonza) supplemented with 10% v/v fetal bovine serum
(FBS) and 1% v/v penicillin/streptomycin/glutamine mix (Invitrogen) for 2 days. Cells were
then pelleted by centrifugation at 2500 rpm/ 580 g (Eppendorf) at for 5 min and washed with
ice cold PBS twice (a 1 ml aliquot of the culture was pelleted and kept as whole cell extract).
The cell pellet was resuspended in five times its volume in buffer A (15 mM KCL, 10 mM
HEPES (pH 7.6), 2mM MgCl2, 0.1 mM EDTA) and was centrifuged at 5000 rpm/ 2319 g
(Eppendorf) for 5 min at 4⁰C. Supernatant was discarded, and the pellet was resuspended in
the same volume of buffer A with the addition of DTT to the concentration of 1mM. The
cells were then homogenized using a Dounce glass homogenizer (a 2 ml homogenizer with a

36
tight (B) pestle) and checked under a phase contrast microscope to confirm that at least 85%
of the cells were broken. The cell suspension was then mixed with 1/10 volume of buffer B (1
M KCl, 50 mM HEPES (pH 7.6), 30mM MgCl2, 0.1mM EDTA, 1mM DTT) and centrifuged
at 10000 rpm/ 9279 g (Eppendorf) at 4⁰C or 10 min. After centrifugation the supernatant was
kept as a cytoplasmic fraction (1ml) and the pellet was considered a crude nuclear extract
which was dissolved in 400µl of 9 parts buffer A and 1part buffer B. 100µl of the crude
nuclear extract was transferred to a new tube and 4 M ammonium sulfate (pH 7.9) was added
to the remainder at a final concentration of 0.36 M. The mix was gently rotated at 4⁰C for 30
min to lyse the nuclei and then centrifuged at 16000 rpm/ 23755 g (Eppendorf) at 4⁰C for 1h
30 min to pellet the DNA. To the supernatant ammonium sulfate was added at 0.25 g/ml,
followed by centrifugation at 16000/ 23755 g (Eppendorf) rpm for 15 min at 4⁰C and pellet
was kept as soluble precipitated protein.
2.6 S2 cells and salivary glands Western blotting
2.6.1 Sample preparation
Salivary glands (20-30 pairs) were dissected from mid-3rd instar larvae in Shields and Sang
M3 insect medium consist of inorganic salt, amino acid, vitamins, sugar and yeast extract
(Sigma-Aldrich). All glands were then transferred to 2x SDS loading dye supplemented with
5% v/v β-mercaptoethanol and 1mM PMSF and homogenized with a plastic pestle grinder in
a 2ml microcentrifuge tube. The lysate was boiled for 6 min in a heat block which was
followed by cooling for 1 min on ice. Samples were centrifuged at the highest speed at 4⁰C
for 2 min in a microcentrifuge and either loaded on SDS-PAGE gels or stored at -20⁰C.
S2 cells were grown in six-well plates to a density of 3x10⁶ cells/ml, as described above
(section 2.2.1). 1 ml of cells was collected in a 1.5 ml microcentrifuge tube and centrifuged at
5000 rpm/ 2319 g (Eppendorf) at 4⁰C for 3 min. Cells were washed twice with 500 µl of ice-

37
cold PBS and the pellet was dissolved in 100 µl of 2X SDS loading dye. Samples were then
boiled in a heat block for 6 min which was followed by cooling for 1 min on ice. The protein
mixture was then centrifuged at the highest speed at 4⁰C for 2 min and used directly for
loading on SDS-PAGE gels or stored at -20⁰C.
2.6.2 Western Blotting
Protein extracts were typically loaded on a 12% v/v SDS-PAGE gel which was run for 90
min at room temperature. The prestained protein marker, broad range (7-175 kDa) from New
England Biolabs (NEB) was used as a ladder in the gel. Proteins were then transferred to a
nitrocellulose membrane (Protran BA-85, Geneflow) using a wet blotting apparatus
(BioRad). The transfer was carried out at 350 mA in transfer buffer (25 mM Tris, 192 mM
glycine and 10% v/v methanol) at 4⁰C for 2 h. The membrane was then stained with Ponceau
S to check that the proteins were transferred on the membrane uniformly. The membrane was
blocked in Tris-buffered Saline containing 0.05% v/v Tween-20 (TBST) containing 5% w/v
milk (Marvel) on a rocker for 1 h at room temperature. The membranes were incubated with
primary antibody diluted in 1X TBST overnight at 4°C (dilution dependant on the
concentration of the antibody). The membrane was washed five times with 1X TBST prior to
secondary antibody incubation. The secondary antibody was HRP conjugated specific for the
species and Ig class of the primary antibody (Chemicon), typically diluted 1:10000 in 1X
TBST and incubated for 1 h on a rocker at room temperature. The membranes were washed
again as before and incubated with Amersham ECL Prime Western Blotting Detection
Reagent (GE Healthcare Life Science) for 5 min and then visualized with a GelVue Dual UV
Transilluminator using the Gene Snap Software (Syngene).

38
2.6.3 Reprobing of Western blot membranes
Membranes were stripped using the Abcam stripping protocol. The membrane was washed
with mild stripping buffer (15 g glycine, 1 g SDS and 10 ml Tween-20 in a 1L volume of
water, pH 2.2) two times for 10 min each at room temperature. The membrane was then
further washed with 1X PBS two times for 10 min followed by two times washed with 1X
TBST for 5 min each at room temperature. The same membrane was blocked again with
TBST containing 5% w/v milk and then re-probed with a different primary antibody as
described above. As a loading control, membranes were typically incubated with a tubulin
primary antibody (Sigma-Aldrich, T5168 1:4000) with the appropriate HRP conjugated
secondary antibody.
2.7 Fly genomic DNA extraction and Polymerase Chain Reaction
A single male fly was first frozen at -20°C for 30 min in a PCR tube, then squashed against
the tube wall using a pipette tip, in 50 µL ‘squishing’ buffer (10 mM Tris pH 8.0, 1 mM
EDTA, 25 mM NaCl,). The sample was placed in a thermocycler for 30 min at 37°C
followed by 2 min incubation at 95°C. It was then centrifuged and the supernatant was kept
as genomic DNA and stored at 4°C.
The PCR reaction was carried out in a 50 µL volume using Phusion® high-fidelity DNA
polymerase (Biolabs) with the following parameters: 2 min at 98°C followed by 32 cycles of
10 s at 98°C, 30 s at 58°C and 1 min at 72°C and a final extension of 10 min at 72°C.

39
2.7.1 DNA Sequencing
PCR products were purified using a QIAquick Gel Extraction Kit (QIAGEN) and were
subsequently checked by running on a 1% w/v agarose gel. The purified PCR product was
then sent, with appropriate primers, to GATC Biotech (London) for sequencing (see
Appendix V).
2.8 Salivary gland dissection and polytene chromosome squashing
2.8.1 Salivary gland dissection
D. melanogaster larvae were grown at 18⁰C in bottles containing dry yeast. To obtain well-
squashed polytene chromosomes, larvae must be healthy. Salivary glands were dissected
from wandering third instar larvae. Larvae were collected from the bottles and transferred
into a dissecting glass dish filled with water which was placed on ice for 5 min for washing
purposes and for the larvae to be put to sleep. Larvae were then dissected using sharp
tweezers in 20 μl of solution A or the dissection buffer (100 μl 10x Buffer A, 100 μl 10% v/v
Triton X-100, 800 μl distilled water; buffer A (1X): 15 mM HEPES pH 7.4, 60 mM KCl, 15
mM NaCl, 1.5 mM spermine, 1.5 mM spermidine). For the fixation, salivary glands were
kept for 1 min in 20 μl of solution B or the fixative (100 μl 10x Buffer A, 100 μl 10% v/v
Triton X-100, 250μl 4% v/v formaldehyde, 550μl distilled water). Salivary glands were
further washed for a few seconds in 20 μl of solution G (500 μl glacial Acetic acid, 250 μl 4%
v/v formaldehyde and 250 μl distilled water) and then transferred to a siliconized glass
coverslip containing 13 μl of solution G and incubated for a further 3 min. After that, the
microscopic slide was gently put on top of the coverslip. It was also necessary to ensure that
solution G was evenly spread between the slide and the coverslip.
40
2.8.2 Squashing
Salivary glands were first broken by tapping a few times on top of the coverslip with a blunt
tip of a brush, dissecting needle or a similar implement. A piece of folded tissue paper was
placed on top of the coverslip and then pressed using the thumb on a flat surface. The
spreading of the chromosomes was checked under a phase contrast microscope. If
satisfactory, the position of the coverslip was lightly marked with a diamond pencil on both
sides of the coverslip and the slide was frozen by dipping into liquid nitrogen for 60 seconds.
The coverslip was then quickly removed from the slide using a razor blade and put in a
Coplin jar filled with 95% v/v EtOH and stored at -20°C. It could be used for
immunostaining the following day.
2.8.3 Immunostaining
Slides with chromosome spreads were washed twice in a Coplin jar with 1X TBST (150 mM
NaCl, 10 mM Tris-Cl pH 7.0-7.5, 0.05% v/v Tween). Each washing was performed at room
temperature for 10 min. Slides were then transferred to a Coplin jar filled with blocking
solution (TBS, 10% v/v Fetal Bovine Serum (FBS) and 0.05% w/v sodium azide (NaN3) and
kept at room temperature for 30 min. Primary antibody was diluted in blocking solution
(typically 1:100 dilution, depending on the antibody) and, as such, was used for
immunostaining. A 20 μl drop of diluted antibody was placed on the coverslip and the slide
with the chromosome was carefully placed on top of the drop, making sure that no air
bubbles were formed between the slide and the coverslip. Slides were then placed in a humid
chamber saturated with TBS and incubated overnight at 4⁰C.
41
Slides were removed from the chamber the following day and submerged into a beaker
containing TBST in order to detach the coverslip from the slide without breaking the
chromosomes. Slides were then washed twice with TBST at room temperature for 10 min.
Secondary antibody staining was carried out in the same way as primary antibody but the
dilution was typically 1: 250, as detailed in figures legend. The incubation with secondary
antibody was performed in a humid chamber for 1 h at room temperature. In order to stain
DNA, slides were first washed with TBST containing 0.1 μg/ml 4-6-diamidino-2-phenyl
indol (DAPI, from Sigma-Aldrich) which was followed by a second wash in TBST for 10
min. Slides were subsequently dried at room temperature for around 20 min, covered with
aluminium foil to protect the secondary antibody-fluorophore from light. Once the slides
were dried, they were mounted using a single drop of fluorescence Antifade medium
(PromoFluor, Promokine) which was placed on a coverslip and carefully fitted on the slide
allowing it to settle by capillary force. Slides could be either viewed immediately using a
fluorescence microscope or stored at 4⁰C for future use.
2.8.4 Fluorouridine (FU) labelling of polytene chromosome nascent RNA
Salivary glands were dissected in M3 media and incubated with 2mM 5-fluorouridine (FU,
Sigma-Aldrich) at room temperature for 15 min. The cell membrane was then permeabilized
by transferring the glands to solution A containing 1% v/v Triton X-100 and incubated at a
room temperature for 2 min. Glands were subsequently transferred to solution A containing
0.1% v/v Triton X-100 and incubated at room temperature for 10 min either with or without
1µg/µl ribonuclease (RNAse, Invitrogen) treatment. All glands were then fixed in solution B
for 1 min and squashed in solution G as described above. Immunostaining was carried out by
following the protocol explained above.

42
2.8.5 Salivary gland RNase treatment
Salivary glands were dissected in Solution A containing 1% v/v Triton X-100 and kept at
room temperature for 2 min. Glands were then transferred to a 50 µl of solution A with 0.1%
v/v Triton and incubated at room temperature for a further 10 min either with or without 1µg/
µl RNAse (Invitrogen). Glands were then fixed in solution B for 1 min and squashed in
solution G. Immunostaining was carried out as described above.
2.8.6 Acid-free polytene chromosome squashing
To preserve the green fluorescent protein (GFP) signal, polytene chromosome squashing was
carried out in 50% v/v glycerol instead of in acetic acid since the latter could destroy
fluorescent signals. Salivary glands were routinely dissected in PBS and fixed in PBS
containing 4% v/v formaldehyde (Agar Scientific) for 1 min. The glands were transferred to a
50 µl of 50% v/v glycerol containing DAPI (0.1µg/ml) and incubated at room temperature for
30 min. The salivary glands were squashed in a slide containing 20-30 μl of 50% v/v glycerol
and DAPI (0.1µg/ml) (Johansen et al., 2009).
2.8.7 Salivary glands heat shock induction
To induce heat shock protein genes on polytene chromosomes, larvae were placed in a
standard fly food vial and immersed in a water bath at 37⁰C for 45 min to just below the rim
of the vial. Larvae were dissected in solution A and processed following the standard
immunostaining protocol.

43
2.8.8 Salivary glands ecdysone treatment protocol
Incubation with 20-hydroxyecdysone (Sigma-Aldrich) was used to express ecdysone-
regulated genes in polytene chromosomes. Salivary glands were dissected in M3 media and
incubated with 1µM ecdysone at room temperature for different time intervals (15 min, 30
min, 1 h and 2 h). Salivary glands were then incubated for 1 min in solution A , followed by
fixation for further 1 min in solution B and both squashing, immunostaining was carried out
using the explained protocol in section 2.8.1-2.8.3.
2.8.9 Antibodies
Antibodies against the EJC proteins - MAGO, Y14 and eIF4AIII - were all rabbit IgG
generated by our collaborator Dr. Marco Blanchet (Stower Institute of Medical Research,
USA). A 1:100 dilution was used per incubation. Primary antibodies against fluorouridine,
Sm proteins and FLAG-tagged EJC proteins were mouse anti-BrdU (Sigma-Aldrich, 1:200
dilution), mouse anti-Y12 (Thermo Fisher Scientific, 1:100 dilution) and anti-FLAG M2
(Sigma-Aldrich, 1: 200 dilution) respectively. The secondary antibody used for the detection
of the EJC primary antibodies was either Cyanine 3 (Cy3) conjugated goat anti-rabbit IgG
(1:250 dilution), or fluorescein isothiocyanate (FITC) conjugated goat anti-rabbit IgG (1:200
dilution). Secondary antibodies against Sm proteins, fluorouridine and FLAG tagged EJC
proteins were detected by Alexa Fluor 647 conjugated goat anti-mouse IgG (Invitrogen,
1:200 dilution). The primary antibody against RNA Pol II was mouse anti-Pol II H5
(Covance, 1:250 dilution) which was subsequently detected by Cyanine 3 (Cy3) conjugated
goat anti-mouse IgM (1:250 dilution). All the secondary antibodies were from Jackson
Immuno Research Technologies and Life Technologies.

44
2.8.10 Fluorescence microscopy
A Nikon Eclipse Ti epifluorescence microscope was used to view the stained polytene
chromosomes using a 40X objective dry lens while the images were captured with an ORCA-
R2 camera (Hamamatsu Photonics).
2.9 Whole salivary glands immunostaining
Larvae were grown at 18°C in a glass bottle containing dry yeast to get well-fed larvae with
big salivary glands. Larvae were dissected in M3 insect media and 4 to 5 pairs of glands were
used for each experiment. All glands were fixed in a PBS solution containing 4% v/v
formaldehyde (from 10% EM grade, Polyscience) and incubated on ice for 30 min. After
fixation, salivary glands were washed with 0.3% v/v Triton in PBS three times for 10 min
each at RT. All glands were then transferred to blocking solution (10% v/v FBS and 0.3% v/v
Triton in 1X PBS) at room temperature for 1 h. After blocking glands were incubated with
primary antibody (dilution depending on the antibody used) in a blocking solution overnight
at 4°C. The following day glands were washed in PBS with 0.3% v/v Triton three times, 10
min each, at room temperature. Glands were subsequently incubated with the appropriate
secondary antibody (dilution depending on the antibody used) in blocking solution at room
temperature for 2 h. Glands were washed again for 10 min in a PBS solution containing 0.3%
v/v Triton, followed by staining with 0.1µg/ml of DAPI in the washing solution at room
temperature for another 20 min. Glands were then incubated in the washing solution for 10
min and then transferred to 50 µl of 50% v/v glycerol and incubated for 10 min at room
temperature. All the glands were mounted in Antifade media (PromoFluor, Promokine) and
viewed using a Leica SP2-AOBS confocal microscope. Images were further processed with
ImageJ software (http://imagej.nih.gov/ij/).

45
2.10 Puromycin labelling of nascent peptides on polytene chromosomes
2.10.1 Polytene chromosome squashing and ribo-puromycylation
Optimization of puromycin labelling was carried out in two-steps. In the first step, salivary
glands were dissected from 3rd instar larvae in M3 insect medium and kept in fresh media for
up to 10 min. Salivary glands were then incubated with 50 µg/ml puromycin and 100 µg/ml
emetine in M3 media at room temperature for 15 min. After labelling, glands were washed
three times for 5 min each in ice cold PBS with 100 µg/ml emetine. In the second
optimization step, 10 µg/ml actinomycin D was added in both the labelling and the washing
buffers. Salivary glands were then incubated in solution A with 100 µM aurintricarboxylic
acid (ATA) and EDTA-free Complete Protease Inhibitor Cocktail (Roche) at room
temperature for 2 min. Glands were then fixed for approximately 1 min in solution B and
subsequently squashed in solution G. Slides were stored at 4°C in 95% v/v ethanol.
2.10.2 Immunostaining and antibody
Before immunostaining, slides were washed twice in TBS (150 mM NaCl, 10 mM Tris-Cl pH
7.0-7.5, 0.05% v/v Tween) for 10 min. Slides were incubated in a TBS blocking solution
containing 10% v/v Fetal Bovine Serum (FBS) and 0.05% w/v sodium azide (NaN3) at room
temperature for 30-60 min. All chromosome spreads were stained with 0.1 µg/ml DAPI for
20 min. The antibody used was an Alexa 488-conjugated 2A4 monoclonal antibody (from Dr.
John Yewdell, NIH, USA) (David et al., 2012) and was diluted 1:200 in blocking buffer. The
slides were mounted with a drop of fluorescence Antifade medium (PromoFluor, Promokine).
Stained polytene chromosomes were viewed using an epifluorescence Nikon microscope with
a 40X objective lens and images were captured using a CCD camera.

46
2.11 Incorporation of puromycin in whole salivary glands of D. melanogaster
2.11.1 Puromycin and emetine labelling
Salivary glands from 3rd instar larvae were dissected in M3 media. Glands were incubated in
M3 media either containing both 50 μg/mL puromycin and 100 μg/mL emetine or 50 μg/mL
puromycin only. The incubation was at room temperature for 15 min and followed by three 5
min washes in ice cold PBS containing 100 μg/mL emetine. This was followed by a 1 min
incubation of a pair of glands in emetine (100 μg/mL), 60 mM KCl, 15 mM NaCl, 15 mM
HEPES pH 7.4, 1.5 mM spermine, 1.5 mM spermidine, 100 μM aurintricarboxylic acids
(ATA), 1% v/v Triton X-100, and EDTA-free Complete Protease Inhibitor Cocktail (Roche)
at room temperature.
As a control, glands were pre-incubated with 2µM harringtonine in M3 media at room
temperature for 15 min, before the previously explained puromycin/emetine treatment. All
subsequent steps were carried out as above.
2.11.2 Immunostaining
After labelling, salivary glands were fixed in a PBS solution containing 4% v/v formaldehyde
for 30 min on ice. Glands were then washed twice in PBS containing 0.3% v/v Triton X-100
for 10 min each at room temperature. Salivary glands were then incubated with 10% v/v FBS
in PBS and 0.3% v/v Triton X-100 for 1 h at room temperature which was followed by
incubation with the Alexa 488 conjugated 2A4 monoclonal antibody (1:200 dilution) at 4°C
overnight. Glands were subsequently washed in PBS containing 0.3% v/v Triton X-100 and
0.1 µg/ml DAPI at room temperature for 20 min. A further wash without DAPI was carried
out at room temperature for another 10 min and glands were mounted on the slide with anti-
fade media. Sample was either viewed immediately or stored at 4°C.

47
2.11.3 Confocal microscopy/image processing
A Leica confocal inverted microscope (DMIRE2) with a 40X and 63X oil objective lenses
was used to view glands and images were captured using Leica Confocal Software Suite.
2.12 Genetics
D. melanogaster was used in all of the above experiments. Fly stocks were kept in standard
fly food plastic or glass vials with dry yeast. Fly stocks were maintained either at 18°C or
25°C depending on the required experimental purpose. Fly stocks kept at 18°C were normally
transferred to fresh vials after 28 days, while those at 25°C stock were transferred every 14
days.
2.12.1 Virgin collection
To collect virgin female flies, fly vials were emptied in the evening and kept at 18°C. Virgin
female flies were collected the following morning, vials were kept at 25°C and virgins were
collected as they emerged throughout the day. Virgin females were identified by the presence
of meconium in the gut. The lower temperature (18°C) delays the emergence of flies. Virgin
females were kept at 18°C until required.
2.12.2 Setting up crosses
To set up a cross, four virgin females were typically crossed with two males in glass vials with
freshly sprinkled dry yeast. The vials were kept at 25°C for two days and then transferred to
fresh fly foods vials. To get well-fed larvae with big salivary glands, vials were kept at 18°C.
Third instar larvae could then be dissected on the 10th day after egg laying.

48
2.12.3 GAL4/UAS expression system
The GAL4/UAS system is one of the most well-known systems used in Drosophila which
provides tissue-specific transgene expression. The yeast transcription activator, Gal4, binds to
yeast upstream activating sequences (UAS) and induces transcription of corresponding genes
(Duffy, 2002). Gal4 serves as a driver in this system and acts on any gene flanked by the
UAS sequence. To express UAS-regulated transgenes in specific tissue/cells, the UAS line
was crossed with a specific Gal4 driver line.
2.12.4 Generation of a fly strain expressing both LacI-GFP and MCP-RFP
To produce LacI-GFP and MCP-RFP on the same transgenic flies, a genetic cross was set up
as following: flies strain with MCP-RFP y[1] w[67c23]; P{w[+mC]=Hsp83-MCP-
RFP}12a/TM3, Sb[1] on the 3rd chromosome and strain with lacI-GFP 6(4:1)/ Cyo
hsp83.GFP-Lac I on the 2nd chromosome were crossed using standard genetics protocols
(Figure 2.2). In the G0 cross, a homozygous red eyed male with [Cyo-Hsp83. GFP-Lac I]
(see Appendix III) on the 2nd chromosome (cross a) and P W[+mc]= Hsp83-Mcp RFP (see
Appendix III) on the 3rd chromosome (cross b) were crossed with double balancer virgin
females. Red eye males from the F1 (a) progeny, with IF and TM6B markers, were crossed
with red-eye virgin females with Cyo and MKRS of the F1(b) progeny. Then F2 flies with
the indicated genotypes were crossed to produce F3 flies homozygous for both inserts, which
were selected for the absence of both Cyo and TM6B dominant markers. The strain was
initially verified by observing the larvae on fluorescence microscope and by inspecting the
presence of GFP and RFP fluorescence in the salivary glands of 3rd instar larvae.
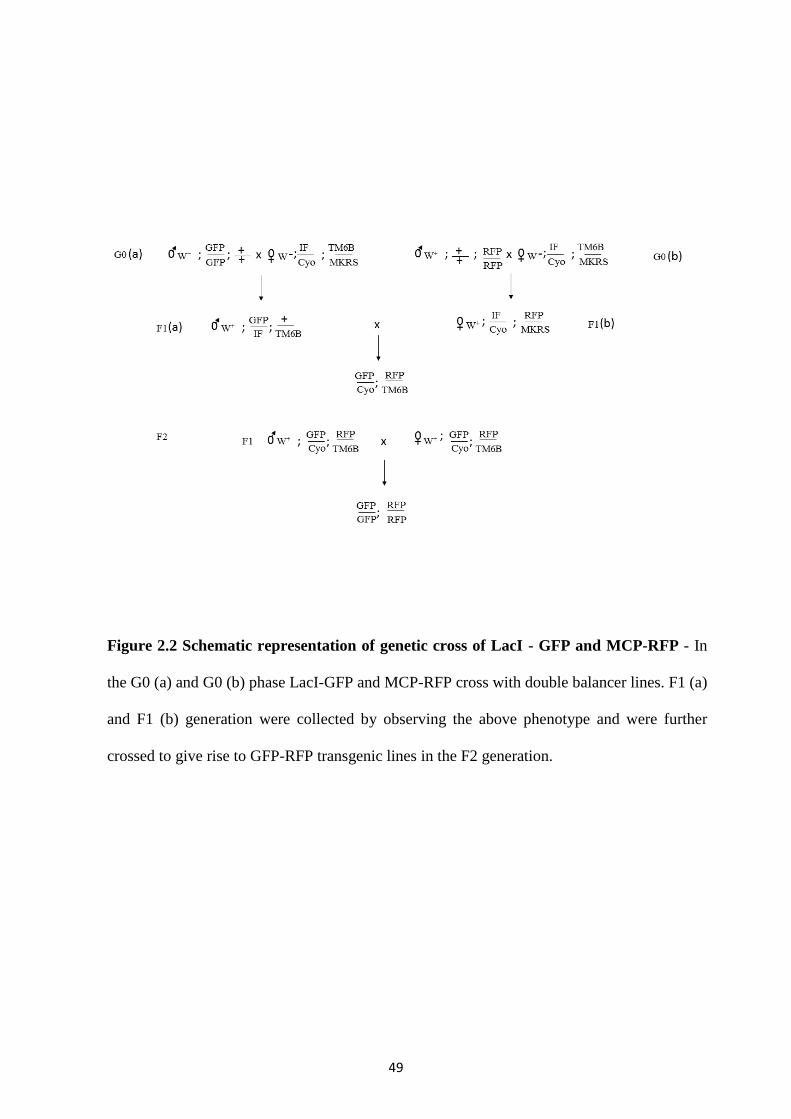
49
Figure 2.2 Schematic representation of genetic cross of LacI - GFP and MCP-RFP - In
the G0 (a) and G0 (b) phase LacI-GFP and MCP-RFP cross with double balancer lines. F1 (a)
and F1 (b) generation were collected by observing the above phenotype and were further
crossed to give rise to GFP-RFP transgenic lines in the F2 generation.
50
2.13 Parameters used to select target epitopes for UPF1 and UPF2
Abmart SEAL technology was used to produce the monoclonal antibody against UPF1 and
UPF2 protein (Figure 2.3). The protein amino acid sequence for UPF1 and UPF2 were given
in Table 2.1 and 2.2. Abmart Bioinformatics tools and algorithm antigen software were used
to design the protein secondary structure and potential epitopes. Following is the most
important parameter considered in algorithm to design the epitopes
1. Secondary structure-Loop/helix/sheet
2. Special region- N-terminal, C-terminal, signal peptide, Trans-membrane, Solvent
accessibility.
3. Blast- Query species and Mouse
4. Amino Acid property- Antigenic enhancement amino acid Flexibility
5. Evolution- Positive selection, Discrimination
6. Specificity- Protein specificity, Region specificity

51
Figure 2.3 Abmart SEAL technology for antibody production
Abmart designs potential epitopes by using specific algorithm antigen software. The potential
epitopes then integrated into the Abmart expression vector to produce recombinant antigen,
subsequently the antigen then used for immunization in mice. This image was taken from
Abmart
(http://www2.abmart.com/index.php?&controller=SealPerformanceLibrariesTechnology).

52
Table 2.1
MSVDTYAPSSALSFLDMDDNELLPGADTQPTQYDYRDFTMPSTSQSQTQNDQLEIAQRCSAGDSHPRLASITNDL
ADLQFEEEDDEPGSSYVKELPPHACKYCGIHDPATVVMCNNCRKWFCNGRGSTSGSHIINHLVRAKHREVTLHGE
GPLGETILECYSCGVRNVFVLGFIPAKADSVVVLLCRQPCAAQNSLKDMNWDQEQWKPLIADRCFLAWLVKQPSE
QGQLRARQISAAQINKLEELWKENIEATFQDLEKPGIDSEPAHVLLRYEDGYQYEKTFGPLVRLEAEYDQKLKES
ATQENIEVRWDVGLNKKTIAYFTLAKTDSDMKLMHGDELRLHYVGELYNPWSEIGHVIKVPDNFGDDVGLELKSS
TNAPVKCTSNFTVDFIWKCTSFDRMTRALCKFAIDRNSVSNFIYSRLLGHGRADSNDEVLFRGPQPKLFSAPHLP
DLNRSQVYAVKHALQRPLSLIQGPPGTGKTVTSATIVYQLVKLHGGTVLVCAPSNTAVDQLTEKIHRTNLKVVRV
CAKSREAIDSPVSFLALHNQIRNMETNSELKKLQQLKDETGELSSADEKRYRNLKRAAENQLLEAADVICCTCVG
AGDGRLSRVKFTSILIDESMQSTEPECMVPVVLGAKQLILVGDHCQLGPVVMCKKAARAGLSQSLFERLVVLGIR
PFRLEVQYRMHPELSQFPSNFFYEGSLQNGVCAEDRRLKLDFPWPQPERPMFFLVTQGQEEIAGSGTSFLNRTEA
ANVEKITTRFLKAGIKPEQIGIITPYEGQRAYLVQYMQYQGSLHSRLYQEIEIASVDAFQGREKDIIIMSCVRSN
ERQGIGFLNDPRRLNVALTRAKFGIIIVGNPKVLAKQQLWNHLLNFYKDRKVLVEGSLNNLKESLIHFQKPKKLV
NSMNIGAHFMSTIIADAKEVMVPGSIYDRSGGYGQGRQMVGQSMNGGQYGGSGGGPYGNSPLGYGTPSSNSMVGF
GLGNGGNGAAGGNNNFGGAGPSWAAAHLHHDSIGYISNEHGAAALGNMPVPVGMFMNMSNIPPRFYNQHQQAIMA
VKQNRAIQQQTGNFSPGNSGPGVTGVGVGRSATPGGNKKTNKLGKSRVTGGGTGGAPLTQGSSVCNAAPYSQHPM
PLSLQMTQPSGFALSQQPELSQDFGQISQMDGLLSQDVAFNASGERSLNQFSQPY
Table 2.2
MLANDSATTDSEVSTPPSSRKDLADGVAEGDNDNDIDTGDTDANADEDVDAAAAIALEAEEREELQQFISELREK
IESKRQLRLQNSTIELPGEEYFAKLDSNLKKNTAFVKKLKLFTATQLDGLLREISALNLSKYISEICAALVEAKL
KMTDVPAVVTLASRLHCTYADFDVHFLEAWQKALNIKATEKIGNPSKLRVDLRLFAELVSSGVIQMKPGLAQLGV
VLVHLIALDKDDHSNFSIILSFCRHCGEEYAGLVPQKMQQLATKYGVEVPKSDFLTADKQLNLRTMLKGYFKALC
KHVLAEQAELMNMTKNIRRTMECKGEISTEKREKCELMQAGFDKLLASAQSLSELLGEPLPELAKESEGCNPGTV
IDNMLDSASFGVLDPWGDEETRAFYTDLPDLRQFLPNFSAPKVDLETLEEPSELTEEAIDANLDAEMDLDDPPST
TSDTTPENPIEEQPTTPVAAAEDLKPQKMGNALMELGRQQQQQSQLNQNPIQIQNQMRQQFDGFLVNLFNCVNKE
LIDSAAIEFLLNFNTKHQRKKLTRTIFSVQRTRLDILPYLSRFVAIVHMCNTDVATDLAELLRKEFKWHIHKKNQ
LNIETKLKIVRFIGELVKFGLFKKFDALGCLKMLLRDFQHHQIEMACAFVEVTGVYLYNCRDARLLMNVFLDQML
RLKTATAMDSRHAAQIESVYYLVKPPESSKREPMVRPAMHEYIRYLIFEELCKQNVDRCIKMLRRIDWQDPETNC
YAIKCLSKAYLLRFQLIRCLADLVSGLSSYQPRAVTIVIDNVFEDIRAGLEIHSPRMAQRRIAMAKYLGEMYNYK
LVESTNILNTLYSIISLGVSNDQNVVSPLDPPDSLFRLKLACMLLDTCAPYFTSQATRKKLDYFLVFFQHYYWFK
KSHPVFSKTENTSDLFPILMDHTYRDCLLNVRPKLKIYKSLEQAKAAIDHLQEKLYPQLKTTNNAQDPSLGTISE
ISEIDEGGTDEDSGSSNDQRERQVSGQEQDQSNDWTENEAEPPLPPLPPPEKSKEDLEFEQLYEKMTTDSYQERL
KEPIKATAKDIPVPMMARLQKKSYDQITGAQTIGPGINNMSQISKSVPNQDGTPGSPGADSPDGNGKSGGGVGGS
DVGAAGAAGASGATSVPFVLMVRGHKGGKQQFKSFVAPSDSHLATNLKRQEQMIREEKEKVKRLTLNITERIEEE
DYQESLMPPQHRNFTQSYYQKPNKHKFKHQKGAPDADLIFH
Table 2.1 & 2.2 Represents the amino acid sequence of UPF1 and UPF2 used to produce
potential epitope against the target protein, source (FlyBase ID FBgn0030354 and
FBgn0029992).

53
2.13.1 Step wise Antibody production from Abmart
The selected Protein immunogen was over-expressed in E. coli, and Ni-affinity
chromatography was used to further purify the immunogen. Purified immunogen were then
immunized to three 8 to 12-week old laboratories- bred strain of house mouse (BALB/C
mice, female). After immunization, the mouse that shows the desired immune-response were
selected for hybridoma production. To produce the hybridoma, SP2/0 myeloma cells fused
with selected mouse spleen cells. Next both cell mixtures were diluted, and hypoxanthine-
aminopterin-thymidine (HAT) were used to grow the clone from single parent cells on
microtitre wells. Secreted antibodies were then assayed by enzyme - linked immunosorbent
assay (ELISA) based on their binding affinity towards antigen from different clones. Once
the desired clone selected, the hybridoma cells were injected into the peritoneal cavity of
mice. These produced tumors in mice after 10-14 days of injection and these tumors filled
with an antibody-rich fluid called ascites fluid. These ascites fluids were then used for
screening the best antibody. Once the desired clone was chosen, the Protein A/G affinity
chromatography used to purify further the antibody.
2.14 Statistical analysis
Analysis of variance (ANOVA) one-way test was used to check the mean values among the
RNAi treatment groups with the control group. Statistical significance calculated with Power
of performed test with alpha = 0.050: 1.000. P< 0.05 indicates difference is statistically
significant, whereas, P>0.05 denotes the difference is due to random sampling variability;
there is not a statistically significant difference.
54
Chapter 3
3.0 EJC components associate with transcription sites on Drosophila polytene
chromosomes
3.1 Summary or Introduction
The Exon Junction Complex (EJC) is a multi-protein complex that binds to the mRNA after
splicing in the nucleus, and is one of the best characterised components of messenger
ribonucleoprotein particles (mRNPs). Binding of the EJC assists with the passage of an
mRNA through the nuclear pore to the cytoplasm, where it determines the fate of mosts
mRNAs. To date, most evidence stipulates that this complex has a significant role in
downstream events. EJC has a crucial role in NMD, where it contributes to recognition and
degradation of mRNAs containing premature translation termination codons (PTCs) in the
cytoplasm of mammalian cells. In addition, this complex also has a prime role in enhancing
translation and localization of the mRNA (Mohr et al., 2001; Nott et al., 2004). However,
more recent studies show that this complex is required for the splicing of genes that contain
long introns, and loss of this complex results in abnormally spliced transcripts (Ashton-
Beaucage et al., 2010; Ruiz-Echevarria et al., 1998). Since splicing is typically a co-
transcriptional event, I aimed to visualize the recruitment of EJC proteins at transcription
sites on Drosophila melanogaster polytene chromosomes, providing a unique system to
visualize transcription, pre-mRNA processing and associated factors. I used indirect
immunostaining to localize three proteins that constitute the core of the EJC. Here I report
that association of these proteins with gene loci is transcription dependent, but surprisingly,
RNA independent. Notably, their association with both intron-containing and intron-less
genes, arguing against current predictions that the EJC binds only spliced mRNAs or intron

55
containing pre-mRNAs. To further characterise the role of EJC proteins at transcription sites,
I carried out chromatin immunoprecipitation, followed by high-throughput sequencing (ChIP-
seq), of the EJC proteins and found that the core EJC component Y14 accumulates at
transcription start sites. I also showed experimental evidence that Y14 and MAGO might be
involved in regulating transcription of ecdysone inducible genes.

56
3.2 Results
3.2.1 The core EJC proteins are abundant in both nucleus and cytoplasm
The core EJC proteins, Y14, MAGO, and eIF4AIII, are present in both the nucleus and
cytoplasm of cells across organisms and cell types. This feature is apparent in salivary glands,
which are composed of large cells with polytenic nuclei, providing a good cell model to
visualize the subcellular localization of the proteins (Hochstrasser and Sedat, 1987).
Immunostaining of whole salivary glands show that all three EJC proteins are present in both
the nucleus and cytoplasm (Figure 3.1 A). While the signal appears more intense in the
nucleus, particularly around the chromosomes, a strong signal is visible in the cytoplasm,
although not in the vesicles, which are abundant at this stage of larval development, prior to
the peak of secretion of glue protein (Biyasheva et al., 2001). Moreover, knockdown of Y14
and MAGO in salivary glands significantly reduced the signal compared to control glands
(Figure 3.1 B). The knockdown experiment was carried out by crossing fkh-Gal4 lines with
Y14 RNAi and MAGO RNAi lines, described later in this chapter. These findings suggest
that antibodies are specific against the Drosophila endogenous Y14 and MAGO. In addition,
specificity of these antibodies was also checked in S2 cell extracts by Western blotting. From
the western blot, all antibodies show a single band corresponding to endogenous proteins,
with minimal cross-reactivity (Figure 3.1 C). These antibodies were raised in rabbit and
affinity purified by our collaborator Dr. Marco Blanchette (Stowers Institute for Medical
Research, USA). To provide a more quantitative estimate of the levels of EJC proteins in the
nucleus compared to cytoplasm, I assayed the three proteins by Western blotting of nuclear
and cytoplasmic fractions of Drosophila S2 cells. I found these proteins to be equally
distributed between the two compartments (Figure 3.1 D). As the volume of the cytoplasm is
larger, the proteins will be more concentrated in the nucleus of these cells.

57

58
Figure 3.1 Subcellular localization of EJC proteins in salivary glands
(A) Indirect immunostaining of whole salivary glands with anti-Y14, anti-MAGO and anti-
eIF4AIII antibodies, and detected with Cy3 conjugated (red signal) secondary antibody,
showed a signal in both the nucleus and cytoplasm. Glands were counterstained with DAPI
(middle panels), and rightmost panels show the merged channels of Cy3 and DAPI. (B) Y14
RNAi (S-305, ID-36585, see Appendix III) and MAGO RNAi (S-252,ID-28132, see
Appendix III) lines were crossed with fkh-Gal4, to express dsRNA against the endogenous
Y14 and MAGO in salivary glands, and stained with anti-Y14 and anti-MAGO antibodies.
(C) Western blot of whole S2 cell extract, immunoblotted with Y14 (lane 3, 19.01 kDa),
MAGO (lane 2, 17.31 kDa) and eIF4AIII (lane 1, 45.65 kDa). (*) denotes might be the

59
degradation product of eIF4AIII in lane 1 and isoform of Y14 at lane 3. (D) Distribution of
Y14, MAGO and eIF4AIII in the nuclear fraction (lane 1) cytoplasmic fraction (lane 2) of S2
cells and of whole cell lysate (lane 3), detected with anti-Y14, anti-MAGO and anti-eIF4AIII
via Western blot.

60
3.2.2 Visualization of EJC components at polytene chromosome transcription sites
The polytene chromosomes of Drosophila melanogaster are expanded interphase
chromosomes, each locus containing around a thousand copies of each gene, therefore
providing an effective system to analyse the association of individual proteins with sites of
transcription and nascent pre-mRNA (Hochstrasser and Sedat, 1987; Matunis et al., 1993).
Pre-mRNA splicing is typically co-transcriptional in Drosophila (Khodor et al., 2012); so I
used the polytene chromosomes to gain insights into why the EJC seems to associate only
with a subset of transcripts in Drosophila (Sauliere et al., 2010). I performed indirect
immunostaining with antibodies for the three EJC core proteins, Y14, MAGO, and eIF4AII.
All three antibodies predominantly stain the interbands of the polytene chromosome, which
are decondensed segments containing one or more actively transcribed gene loci (Figure 3.2
A). The signals from all three EJC proteins colocalize with that of hyperphosphorylated RNA
polymerase II (Pol IISer2
) (Figure 3.2 B), which is a marker of active transcription elongation
(O'Brien et al., 1994). As expected from the observation that Y14 and MAGO form a stable
heterodimer in vitro (Lau et al., 2003), the staining patterns of Y14 and MAGO are very
similar; this is most apparent at the cytological regions 58E, 56E, 50C and 53D which can be
mapped using the DAPI banding pattern (further evidence that Y14 and MAGO colocalize
will be show further below). However, as exemplified by position 60E, other sites show
intense eIF4AIII signals yet Y14 and MAGO signals are either absent or very faint (Figure
3.2 A). This difference in staining pattern is more apparent by comparison to parallel Pol
IISer2
immunostaining; eIF4AIII is observed at every Pol II transcription site, but the Y14 and
MAGO signals are either absent or weak at intense Pol IISer2
sites (Figure 3.2 B, indicated by
arrows). In contrast, at some other sites I detected relatively strong EJC protein signals but
weak Pol IISer2
(Figure 3.2 B, indicated by lines).

61

62
Figure 3.2 EJC core components are at transcription sites of polytene chromosomes
(A) Indirect immunostaining of chromosome squashes with anti-eIF4AIII (top panel), anti-
Y14 (middle panel) and anti-MAGO (bottom panel) primary antibodies, subsequently
detected using a Cy3-conjugated (red signal) secondary antibody. The yellow arrows indicate
the positions of the most apparent interbands in all channels, while the white line shows the
position of a highly intense eIF4AIII signal that is faint in Y14 and MAGO staining. The
middle panels show DAPI (blue) to mark DNA, whereas the top right channels are the
merged images of DAPI and Cy3.
(B) Double immunostaining was performed with antibodies against each of the three EJC
components and against hyperphosphorylated RNA Pol IISer2
(H5). EJC proteins were
detected with a FITC-conjugated secondary antibody (green) while Pol II was detected with a
Cy3-conjugated secondary antibody (red signal). White arrows indicate the position of a
strong Pol IISer2
signal but weak EJC signals, whereas the yellow line shows a strong EJC but
weak Pol II signal. All images were counterstained with DAPI to show the DNA. Images
were captured using an epifluorescence microscope with a 40X objective.
63
3.2.3 Colocalization confirms Y14 and MAGO might form a heterodimer at same
transcription sites
As shown above, immunostaining of polytene chromosomes gives similar banding patterns
for both Y14 and MAGO, consistent with the proteins forming a stable heterodimer. To
directly investigate the extent of Y14 and MAGO colocalization at the chromosomes, and in
general to characterise more in detail the association of EJC proteins with transcription sites,
I made use of transgenic fly lines encoding Y14 and eIF4AIII, double tagged at their C-
termini with 2x FLAG and 2x HA epitopes (these strains were generated by our collaborator
Dr Marco Blanchette). The transgenes are under the control the UAS promoter, so can be
expressed in salivary glands by crossing them with the forkhead-Gal4 driver, which is highly
expressed salivary glands (Henderson and Andrew, 2000). Western blotting of salivary gland
extracts shows that the double-tagged Y14 and eIF4AIII proteins migrate as predominantly a
single band of the expected size (Figure 3.3 A & B). These tagged proteins appear to be
functional, since immunostaining revealed a chromosomal banding pattern very similar to
that of endogenous Y14 and eIF4AIII (Figure 3.3 C). Specifically, both FLAG-tagged Y14
and endogenous Y14 give the same pattern on chromosomal sites when I carried out double
immunostaining with antibodies against the FlAG-tagged Y14 and endogenous Y14 (Figure
3.4 A). The same approach was also used for FlAG-tagged eIF4AIII and endogenous
eIF4AIII (Figure 3.4 B). Next, to directly assess the extent of co-localization of Y14 and
MAGO, I crossed the FLAG-tagged transgenic lines with the forkhead-Gal4 driver, dissected
salivary glands from mid-3rd
instar larvae and stained the polytene chromosome with anti-
FLAG and anti- MAGO to detect tagged-Y14, and endogenous MAGO. The immunostaining
signals of the two proteins show complete colocalization along the chromosomes and in the
nucleolus (Figure 3.5). Chromosomes were also stained with DAPI and the co-localization

64
signal was comparable in the merged channel at transcribed gene loci. The above results
strongly indicate that Y14 and MAGO might form a constitutive heterodimer at transcription
sites, consistent with observations made in previous in vitro studies.

65

66
Figure 3.3 FLAG-tagged EJC protein shows identical signal patterns throughout the
polytene chromosome. (A) & (B) Western blot of salivary glands from eIF4AIII FLAG/HA-
tagged (S-259, see Appendix III) and Y14 FLAG/HA-tagged (S-253, see Appendix III)
transgenic lines and immunoblotted with anti-FLAG M2 and anti-HA antibodies. Lane 1(A):
HA-tagged eIF4AIII (50.15 kDa), lane 2: FLAG-tagged eIF4AIII (50.15 kDa) and lane 3
used as a negative control. Lane 1(B): FLAG-tagged Y14 (24 kDa), lane 3: HA-tagged Y14
(24 kDa) and lane 2 and 4 used as a negative control. (C) FLAG/HA-tagged Y14 and
FLAG/HA-tagged eIF4AIII transgenic lines were crossed with an fkh-Gal4 driver (see
Appendix III) and immunostained with an anti-FLAG M2 antibody (leftmost panels). A Cy3-
conjugated (red signal) secondary antibody was used to detect FLAG-Y14 (top panel) and
FLAG-eIF4AIII (bottom panel). The middle panels show DAPI (blue) staining to mark DNA,
whereas the right channels are the merged images of DAPI and Cy3. The images were taken
under a standard epifluorescence microscope with a 40X objective lens. (*) denotes
nonspecific band.

67
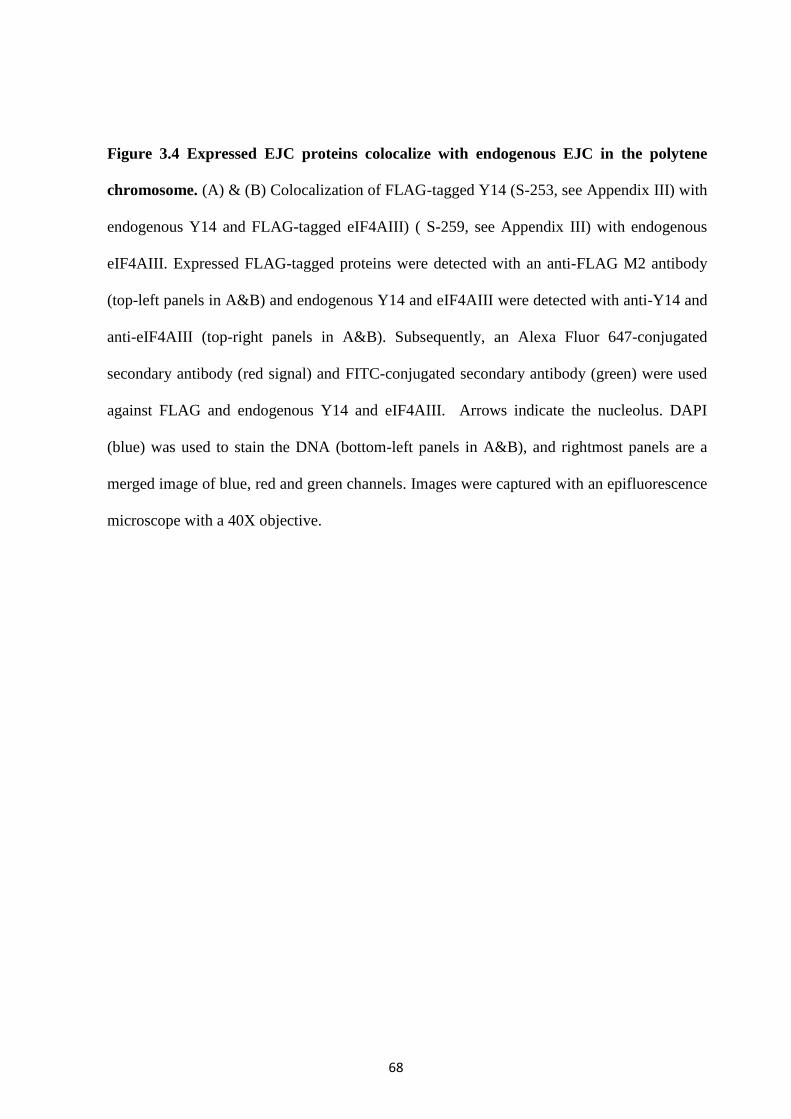
68
Figure 3.4 Expressed EJC proteins colocalize with endogenous EJC in the polytene
chromosome. (A) & (B) Colocalization of FLAG-tagged Y14 (S-253, see Appendix III) with
endogenous Y14 and FLAG-tagged eIF4AIII) ( S-259, see Appendix III) with endogenous
eIF4AIII. Expressed FLAG-tagged proteins were detected with an anti-FLAG M2 antibody
(top-left panels in A&B) and endogenous Y14 and eIF4AIII were detected with anti-Y14 and
anti-eIF4AIII (top-right panels in A&B). Subsequently, an Alexa Fluor 647-conjugated
secondary antibody (red signal) and FITC-conjugated secondary antibody (green) were used
against FLAG and endogenous Y14 and eIF4AIII. Arrows indicate the nucleolus. DAPI
(blue) was used to stain the DNA (bottom-left panels in A&B), and rightmost panels are a
merged image of blue, red and green channels. Images were captured with an epifluorescence
microscope with a 40X objective.

69
Figure 3.5 Y14 and MAGO localize at same transcription sites.
Double immunostaining with an anti-FLAG antibody to detect expressed FLAG-tagged Y14
(top-left) (S-253, see Appendix III) and anti-MAGO to detect endogenous MAGO (top-
right). Subsequently, an Alexa Fluor 647 conjugated secondary antibody and a FITC-
conjugated secondary antibody were used to detect FLAG-tagged Y14 (in red) and
endogenous MAGO (green). The yellow arrows indicate MAGO and FLAG-tagged Y14
signals in the nucleolus. The chromosome was also stained with DAPI (bottom-left panel);
the colocalization signals more apparent in the merged channels (bottom-right). Images were
visualized using an epifluorescence microscope with a 40X objective.

70
3.2.4 Association of Y14 and MAGO with transcription sites differs from that of
eIF4AIII
The EJC component eIF4AIII is thought to be the nucleating component of the complex. The
protein is the first to be recruited at a splice junction by its direct interaction with the
spliceosomal protein CWC22. Current models envisage that Y14 and MAGO bind eIF4AIII
at the exon junction upon the latter dissociating from CWC22 (Barbosa et al., 2012;
Steckelberg et al., 2012). The banding pattern of eIF4AIII at polytene chromosomes is
different from that of Y14-MAGO. As shown above (Figure 3.2 B), the most apparent
difference is that while eIF4AIII is at essentially every Pol II transcription site, there are
many sites at which Y14 and MAGO signals are either absent or very faint, compared to both
eIF4AIII and Pol II. To investigate this unexpected observation further, I performed a double
immunostaining for endogenous Y14 and FLAG-tagged eIF4AIII using the transgenic line
described above. These experiments clearly demonstrate that Y14 (and by inference, MAGO)
are absent from sites in which a very strong eIF4AIII signal is detected (Figure 3.6). These
results suggest that the association of Y14/MAGO at transcription sites is not directly linked
to that eIF4AIII. The results indicate that the EJC may not be recruited at many active
transcription sites, even though eIF4AIII is.

71
Figure 3.6 Association of eIF4AIII poorly correlates with Y14
Double immunostaining with an antibody against FLAG to detect expressed FLAG-tagged
eIF4AIII (top-left) (S-259, see Appendix III) and anti-Y14 to detect endogenous Y14 (top-
right) in polytene chromosomes. An Alexa Fluor 647-conjugated secondary antibody was
used to detect FLAG-tagged eIF4AIII (in red) and a FITC-conjugated secondary antibody
(green) was used against endogenous Y14. The white arrow indicates the nucleolus. Yellow
arrows highlight locations where there is a positive FLAG-tagged eIF4AIII but where the
Y14 signal absent. Chromosomes were also stained with DAPI (bottom-left panel), and the

72
bottom-right panel is a merged image of the DAPI, red and green channels. Images were
captured using an epifluorescence microscope with a 40X objective.

73
3.2.5 Knockdown of the core EJC component eIF4AIII affects the development of
Drosophila salivary glands in vivo
In order to study the mechanism of EJC recruitment at transcription sites, I used an in vivo
approach to knockdown each EJC components (Y14, MAGO and eIF4AIII) in salivary
glands. To knockdown these proteins we obtained Y14 and eIF4AIII RNAi lines from
Bloomington (see Appendix III) and a MAGO RNAi (see Appendix III) from Vienna. These
RNAi lines were all under the control of the GAL4/UAS system, therefore, a forkhead-Gal4
driver was used to express dsRNA against the target protein in salivary glands. The RNAi
lines were crossed with forkhead-Gal4 lines and salivary glands were dissected from mid-3rd
instar larvae. Knockdown of Y14 and MAGO does not have any obvious phenotypic effect in
salivary glands compared to control condition (Figure 3.7 A). However, knockdown of
eIF4AIII makes the glands significantly smaller in size compared to the Y14 and MAGO
knockdowns. Additionally, in a parallel study, in which the nucampholin (ncm) gene was
knocked down, a similar phenotype was observed in salivary glands (Figure 3.7 A).
Drosophila NCM is a homologue of human pre-mRNA splicing factor CWC22, which
interacts with eIF4AIII during early stages of splicing (Alexandrov et al., 2012; Barbosa et
al., 2012). Although it is not yet clear whether CWC22 and eIF4AIII are recruited as a
heterodimer during splicing, the observation that knockdown of both ncm and eIF4AIII give
a similar phenotype suggests that eIF4AIII possibly has a role in splicing in conjugation with
CWC22. Additionally, these studies also indicate that eIF4AIII has an independent role in
salivary gland development and functions beyond the EJC complex. A similar observation
was reported in mice, where knockdown of MAGO reduced both body and brain size by

74
regulating neural stem cell division (Silver et al., 2010). These findings demonstrate that the
EJC core components function independently, besides have a role in post transcriptional
events of mRNA. The knockdown efficiency of both Y14 and MAGO were confirmed in
salivary glands by Western blot (Figure 3.7 B) and was found to be comparable to that in S2
cells (shown below).

75

76
Figure 3.7 eIF4AIII is required for salivary gland development in Drosophila
(A) Y14, MAGO, eIF4AIII and NCM were selectively knocked down in salivary glands
using RNAi lines. RNAi lines received from Bloomington include Y14 RNAi (ID-36585, S-
305) and eIF4AIII RNAi (ID-32444, S-307) while MAGO RNAi (ID-28132, S-252) and
NCM RNAi (S-314, ID-17304) (See Appendix III for all RNAi lines) lines were from
Vienna. Each of these RNAi lines was expressed in salivary glands by crossing with the fkh-
Gal4 driver. Knockdown of eIF4AIII and NCM makes the gland significantly small (bottom
right panel VIII &X)) compared to the control wild-type (top right), Y14 RNAi and MAGO
RNAi. Yellow arrows show salivary gland size, while the white arrow indicates the fat body
upon knockdown of NCM (bottom right panel, X). However, there were no such changes
observed in 3rd
instar larvae size (left panels). (B) Western blot analysis to check the
knockdown efficiency of Y14 and MAGO in the salivary gland. Lanes 1 and 2 show
immunoblotting with Y14 and lanes 3 and 4 show immunoblotting with MAGO. Knockdown
efficiency compares with the control (lanes 2 and 4) and tubulin was used as a reference
control.

77
3.2.6 Y14 is required for the association of MAGO with transcription sites in vivo
While eIF4AIII knockdown makes glands too small for preparing chromosome squashes,
neither RNAi of Y14 nor MAGO hinders larval development or polytenization, therefore it
was possible to directly assess whether knockdown of Y14 affects recruitment of MAGO at
transcription sites, and whether either of them is involved in eIF4AIII chromosomal
association. To address this issue, I first analysed Y14 RNAi lines crossed with forkhead-
Gal4 lines and salivary glands dissected from mid-3rd
instar larvae. Staining with a Y14
antibody shows drastically reduced the Y14 signal from the chromosomal sites, (Figure 3.8
A). The MAGO signal however, was completely gone from both chromosomes and the
nucleolus. Notably, knockdown of Y14 has no effect on the association of eIF4AIII with
transcription sites, as signals are still present at transcriptional loci (Figure 3.8 A). The results
from these data suggest that Y14 is required for the recruitment of MAGO at actively
transcribed gene loci, but that Y14 is not required for eIF4AIII chromosomal association.
Secondly, I analysed the effect of MAGO knockdown of the association of Y14. Consistent
with Western blotting results (Figure 3.7B), the MAGO signal is drastically reduced (Figure
3.8 B); however, that of Y14 was only partially reduced at the chromosomes, and was very
intense in the nucleolus (Figure 3.8 B). MAGO is therefore not necessary for Y14 association
with transcription sites. The partial reduction in the Y14 signal might be the result of
destabilization of the protein rather than MAGO being required for recruitment and
association with the chromosomes. As observed earlier for Y14, MAGO knockdown does not
affect eIF4AIII association with transcription sites (Figure 3.8 B).
78
79
Figure 3.8 Y14 recruitment does not require MAGO but MAGO recruitment does
require Y14
(A) Y14 RNAi lines from Bloomington (ID-36585, S-305), were crossed with an fkh-Gal4
driver to knockdown Y14 in salivary glands which were subsequently immunostained with
Y14 (top-left) MAGO (middle-left) and eIF4AIII (bottom-left). A Cy3-conjugated (red
signal) secondary antibody was used to detect EJC proteins. An arrow (in yellow) indicates a
strong Y14 signal in the nucleolus (top-left panel). Y14 knockdown eliminates the MAGO
signal from transcription sites, whereas there was no effect on the eIF4AIII signal. All images
were also stained with DAPI, and the rightmost panels are the merged images of DAPI and
Cy3 signals. (B) In a similar way, MAGO RNAi lines from Vienna (ID-28132, S-252) were
used to knockdown MAGO in salivary glands which were subsequently stained with MAGO
(top-left), Y14 (middle-left) and eIF4AIII (bottom-left). These proteins were again detected
with Cy3-conjugated (red signal) secondary antibody. MAGO knockdown partially
eliminates the Y14 signal, and this was more apparent in the magnified inserts of the main
image (indicated by the box) in the merged channels. All slides were counterstained with
DAPI and merged images are shown in the rightmost panels. The images were taken under a
standard epifluorescence microscope.

80
3.2.7 Dimerization stabilizes Y14 and MAGO
The results shown above, as well as published data, suggest that Y14 and MAGO form a
heterodimer, but why this heterodimer is important for these two proteins is poorly
understood. To further investigate the role of Y14 and MAGO heterodimerization, I
selectively knocked down the core EJC components Y14, MAGO and eIF4AIII, in
Drosophila S2 cells. Knockdown efficiency was verified by both Western blotting and q-RT-
PCR. A significant level of knockdown was achieved for Y14, and was almost complete for
MAGO. However, the knockdown level of eIF4AIII was less compared to Y14 and MAGO
(Figure 3.9 A). Notably, Y14 knockdown also drastically reduces MAGO expression, as
determined by the observation that the MAGO signal was completely gone when carrying out
Western blotting (Figure 3.9 B). In the same way I investigated the effect of knocking down
MAGO and then blotting for Y14, however, the signal for Y14 although reduced, was not
depleted completely (Figure 3.9 C). In both cases, eIF4AIII was affected to a lesser extent
compared to Y14 and MAGO. This raises the possibility that Y14 might affect MAGO
transcript levels. To evaluate this possibility, I checked the transcript levels of both Y14 and
MAGO knockdowns in S2 cells. The result was that knockdown of Y14 does not affect
transcript levels of MAGO and neither does knockdown of MAGO affect those of Y14
(Figure 3.9 D & E). These results therefore suggest that Y14 and MAGO heterodimerization
is required for the stability of this complex in vivo.

81
82
Figure 3.9 Y14 and MAGO dimerization is required for the stability of this complex
A) Y14, MAGO and eIF4AIII were selectively knocked down in S2 cells by expressing
dsRNA against the endogenous proteins. Knockdown efficiency was checked by Western
blot with antibodies against eIF4AIII (lanes 1 and 2), MAGO (lanes 3 and 4) and Y14 (lanes
5 and 6). (B) Western blot to check the protein levels of MAGO upon knockdown of
eIF4AIII (lane 1), Y14 (lane 2) and in control S2 cells (lane 3). (C) Western blot to check the
protein levels of Y14 upon knockdown of eIF4AIII (lane 1), MAGO (lane 2) and in control
S2 cells (lane 3). Tubulin was used as a reference control in all of the above experiments. (D)
& (E) qRT-PCR to check transcript levels of Y14 and MAGO in S2 cells upon knockdown of
Y14 and MAGO. The fold enrichment method was used for calculation and normalized to
reference control RpL32 See Appendix II (S 78 to S 81) for the Y14 and MAGO primer
pairs.
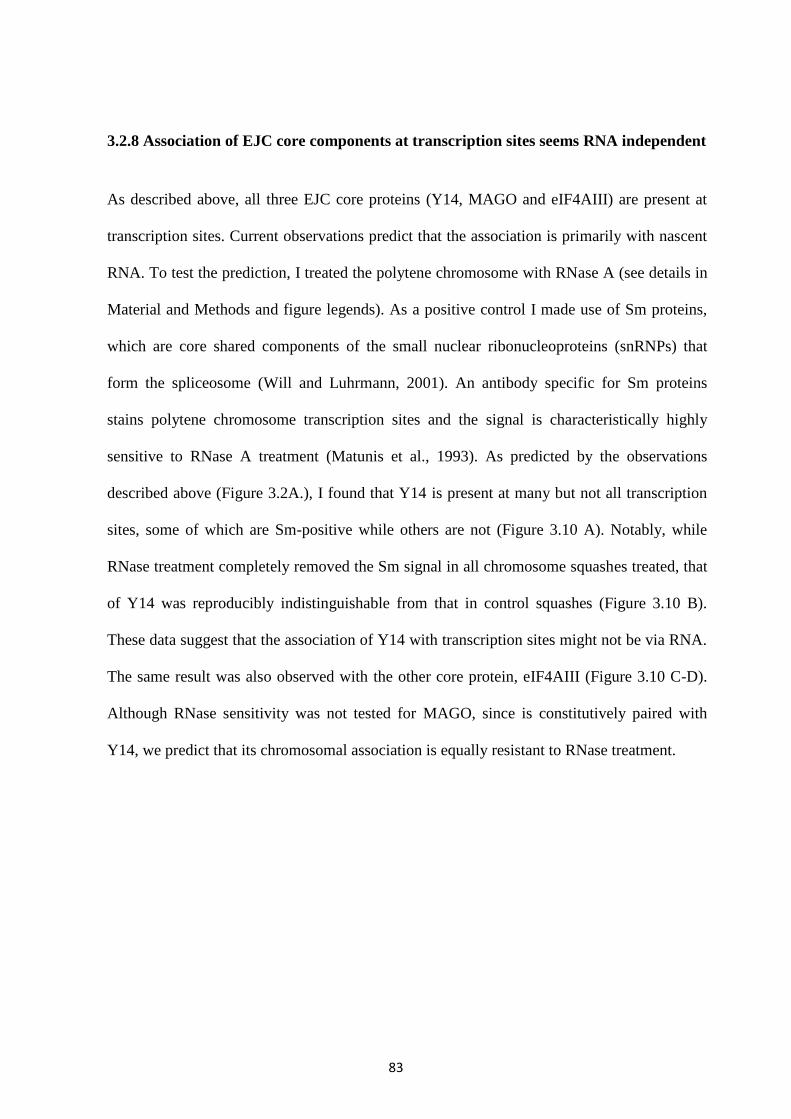
83
3.2.8 Association of EJC core components at transcription sites seems RNA independent
As described above, all three EJC core proteins (Y14, MAGO and eIF4AIII) are present at
transcription sites. Current observations predict that the association is primarily with nascent
RNA. To test the prediction, I treated the polytene chromosome with RNase A (see details in
Material and Methods and figure legends). As a positive control I made use of Sm proteins,
which are core shared components of the small nuclear ribonucleoproteins (snRNPs) that
form the spliceosome (Will and Luhrmann, 2001). An antibody specific for Sm proteins
stains polytene chromosome transcription sites and the signal is characteristically highly
sensitive to RNase A treatment (Matunis et al., 1993). As predicted by the observations
described above (Figure 3.2A.), I found that Y14 is present at many but not all transcription
sites, some of which are Sm-positive while others are not (Figure 3.10 A). Notably, while
RNase treatment completely removed the Sm signal in all chromosome squashes treated, that
of Y14 was reproducibly indistinguishable from that in control squashes (Figure 3.10 B).
These data suggest that the association of Y14 with transcription sites might not be via RNA.
The same result was also observed with the other core protein, eIF4AIII (Figure 3.10 C-D).
Although RNase sensitivity was not tested for MAGO, since is constitutively paired with
Y14, we predict that its chromosomal association is equally resistant to RNase treatment.

84
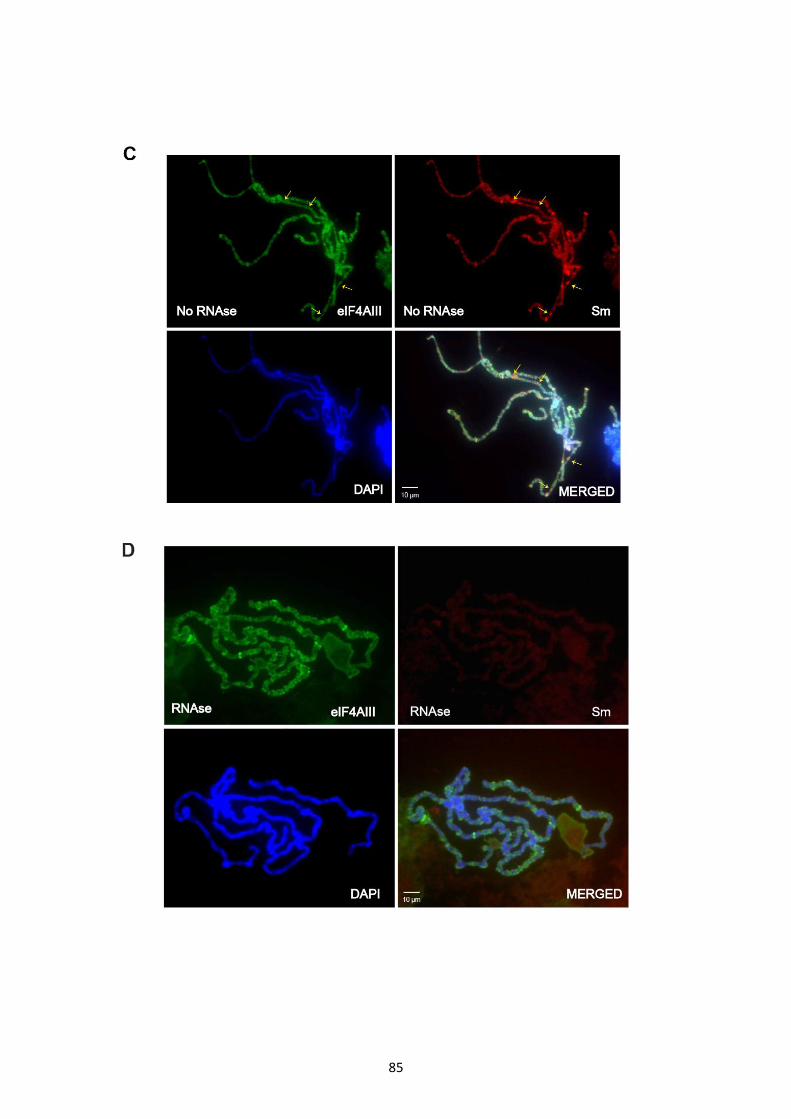
85

86
Figure 3.10 Association of EJC proteins is RNA-independent (A) Top panel indicates
double immunostaining with anti-Y14 and anti-Y12 (Sm) and (C) anti-eIF4AIII and anti-Y12
in the polytene chromosome shows the Y14, eIF4AIII and Sm signals to be present at most
transcription sites in the absence of RNase. Subsequently, anti-Y14, anti-eIF4AIII and anti-
Y12 were detected with a FITC-conjugated secondary antibody (green) and an Alexa Fluor
647-conjugated secondary antibody (red signal). Arrows indicate sites where the Sm signal
did not colocalize with Y14 and eIF4AIII. Bottom (B) and (D) panel shows that following
treatment with 1 µg/µl RNase A, the Y14, and eIF4AIII signals persist, whereas the Sm
signal is absent from transcription sites. All samples were also counter stained with DAPI
(blue) and the rightmost bottom panels show the merged images of DAPI, red and green
channels. Images were taken using a standard epifluorescence microscope with a 40X
objective lens.
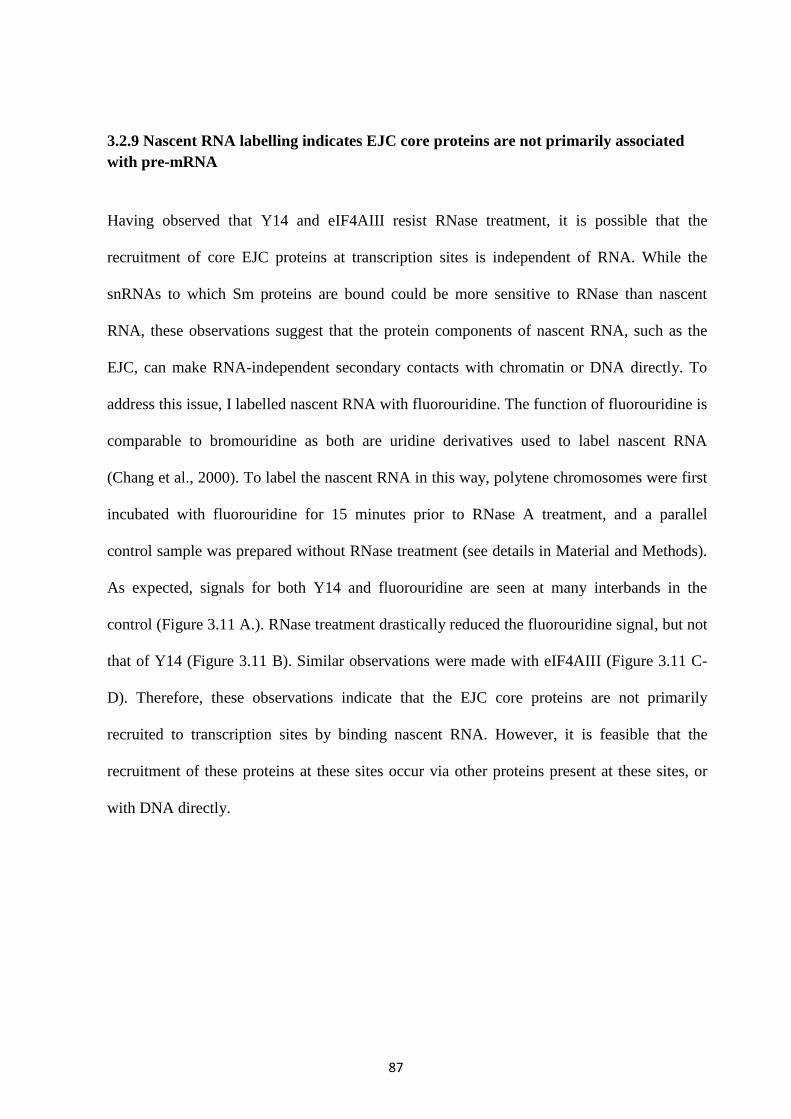
87
3.2.9 Nascent RNA labelling indicates EJC core proteins are not primarily associated
with pre-mRNA
Having observed that Y14 and eIF4AIII resist RNase treatment, it is possible that the
recruitment of core EJC proteins at transcription sites is independent of RNA. While the
snRNAs to which Sm proteins are bound could be more sensitive to RNase than nascent
RNA, these observations suggest that the protein components of nascent RNA, such as the
EJC, can make RNA-independent secondary contacts with chromatin or DNA directly. To
address this issue, I labelled nascent RNA with fluorouridine. The function of fluorouridine is
comparable to bromouridine as both are uridine derivatives used to label nascent RNA
(Chang et al., 2000). To label the nascent RNA in this way, polytene chromosomes were first
incubated with fluorouridine for 15 minutes prior to RNase A treatment, and a parallel
control sample was prepared without RNase treatment (see details in Material and Methods).
As expected, signals for both Y14 and fluorouridine are seen at many interbands in the
control (Figure 3.11 A.). RNase treatment drastically reduced the fluorouridine signal, but not
that of Y14 (Figure 3.11 B). Similar observations were made with eIF4AIII (Figure 3.11 C-
D). Therefore, these observations indicate that the EJC core proteins are not primarily
recruited to transcription sites by binding nascent RNA. However, it is feasible that the
recruitment of these proteins at these sites occur via other proteins present at these sites, or
with DNA directly.

88
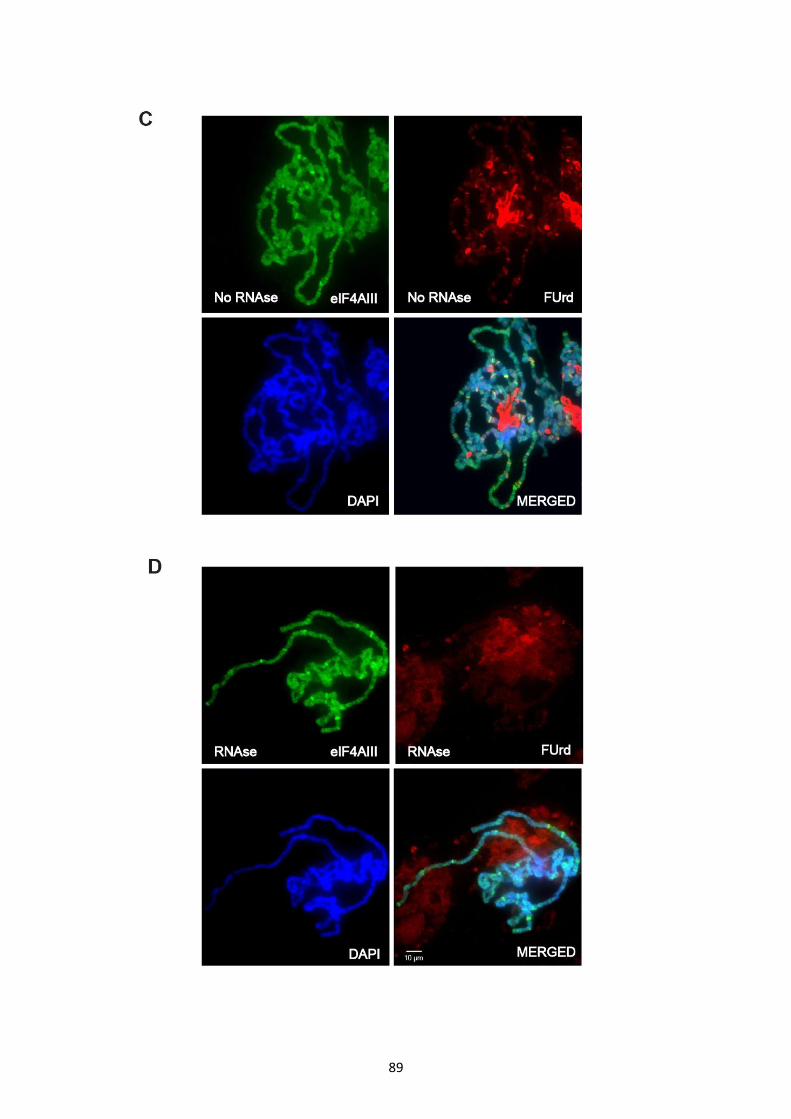
89

90
Figure 3.11 FUrd labelling indicates EJC proteins is not associated with nascent mRNA
(A) Top panel shows double immunostaining with anti-Y14 and anti-BrdU and (C) anti-
eIF4AIII and anti-BrdU in the polytene chromosome. The Y14, eIF4AIII and FUrd signals
are present at most transcription sites in the absence of RNase. Anti-Y14, anti-eIF4AIII and
anti-BrdU were detected with a FITC-conjugated secondary antibody (green) and Alexa
Fluor 647-conjugated secondary antibody (red signal). Bottom (B) and (D) panel shows that
following treatment with 1 µg/µl RNase A, the Y14 and eIF4AIII signals persist, whereas
FUrd signal has gone from transcription sites, seen more clearly in merged channels. All the
images were also prepared with DAPI to indicate DNA. Images were captured with an
epifluorescence microscope with a 40X objective.
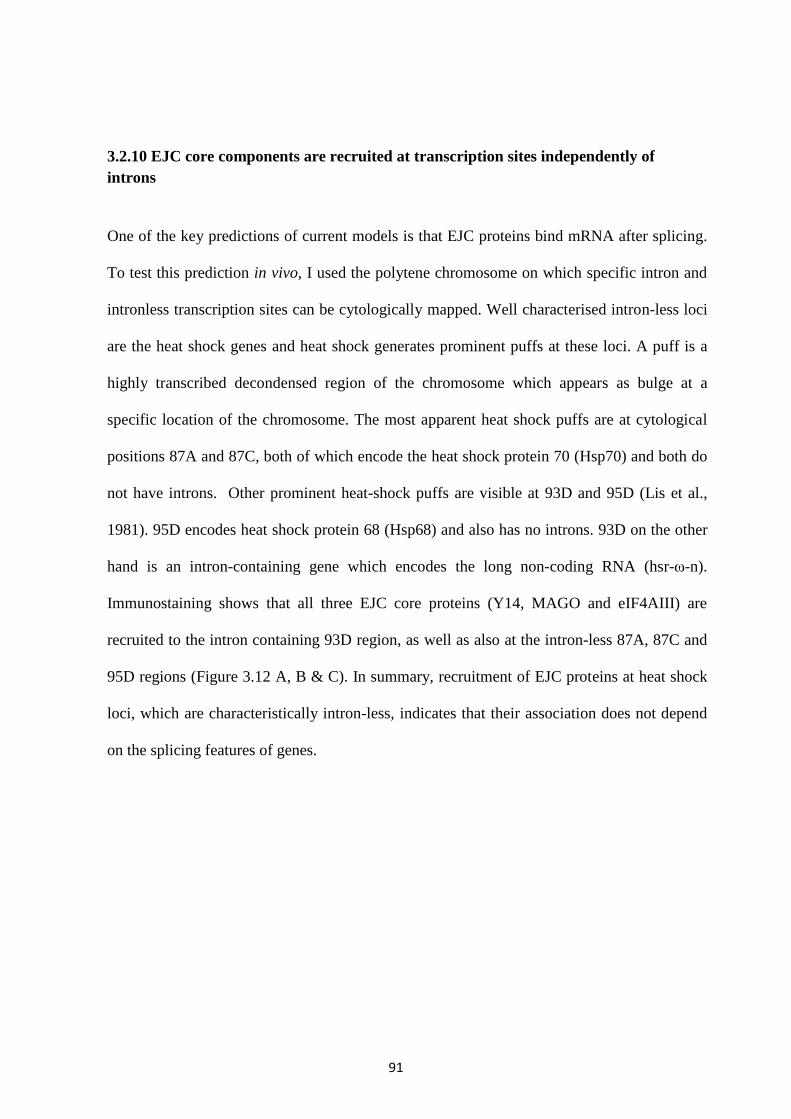
91
3.2.10 EJC core components are recruited at transcription sites independently of
introns
One of the key predictions of current models is that EJC proteins bind mRNA after splicing.
To test this prediction in vivo, I used the polytene chromosome on which specific intron and
intronless transcription sites can be cytologically mapped. Well characterised intron-less loci
are the heat shock genes and heat shock generates prominent puffs at these loci. A puff is a
highly transcribed decondensed region of the chromosome which appears as bulge at a
specific location of the chromosome. The most apparent heat shock puffs are at cytological
positions 87A and 87C, both of which encode the heat shock protein 70 (Hsp70) and both do
not have introns. Other prominent heat-shock puffs are visible at 93D and 95D (Lis et al.,
1981). 95D encodes heat shock protein 68 (Hsp68) and also has no introns. 93D on the other
hand is an intron-containing gene which encodes the long non-coding RNA (hsr-ω-n).
Immunostaining shows that all three EJC core proteins (Y14, MAGO and eIF4AIII) are
recruited to the intron containing 93D region, as well as also at the intron-less 87A, 87C and
95D regions (Figure 3.12 A, B & C). In summary, recruitment of EJC proteins at heat shock
loci, which are characteristically intron-less, indicates that their association does not depend
on the splicing features of genes.

92
93
Figure 3.12 EJC proteins are recruited to both intron-containing and intron-less genes.
(A) Larvae were heat shocked at 37⁰C for 45 minutes and squashed polytene chromosomes
were immunostained with anti-Y14 and hyperphosphorylated RNA Pol IISer2
(H5). Y14 was
subsequently detected with a FITC-conjugated secondary antibody (top-right panel, green
signal) and Pol II with a Cy3-conjugated secondary antibody (top-left panel, red signal).
Arrows (yellow) indicate recruitment of Y14 and Pol IISer2
at the heat shock loci 87A & 87C,
93D, and 95D respectively. (B) & (C) Immunostaining with MAGO and eIF4AIII shows a
similar pattern of recruitment at all mentioned heat shock loci. All samples were also stained
with DAPI (blue) and the colocalization signal is more apparent in the merged channels of
blue, green and red. Images were captured by an epifluorescence microscope with a 40X
objective.
94
3.2.11 Transcription dependent recruitment of EJC components at ecdysone induced
puffs
To assess further the transcription dependence of the EJC association with chromosomal loci,
I studied the association of EJC proteins with two well-known puffs, 74EF and 75B, at which
transcription is induced by ecdysone. Ecdysone is a Drosophila moulting hormone produced
from prothoracic glands of these insects, and has a role in metamorphosis by inducing
transcription of specific genes (Truman and Riddiford, 2002). Ecdysone directly induces
transcription of 74EF and 75B, which are two of the longest Drosophila genes at 60 kb and
108 kb respectively (Burtis et al., 1990; Segraves and Hogness, 1990). Both genes have very
long introns, the largest intron for 74EF is about 30 Kb and for 75B is 60 Kb. As a
consequence, it takes about 60 minutes for 74EF and 90 minutes for 75B to complete
transcription at the estimated rate of 1.1kb/minute and for the first mature mRNA to be
produced (LeMaire and Thummel, 1990). The presence of very long introns provides a good
model for studying the recruitment of the EJC at these gene loci. Salivary glands were
dissected from mid-3rd
instar larvae and treated with ecdysone for 1 hr before fixation.
Immunostaining was carried out with EJC core components and the same squash was also
stained for Pol IISer2
. A clear enrichment in the signal was observed at both the 74EF and 75B
loci for all three EJC proteins, which colocalizes well with Pol IISer2
(Figure 3.13 A).
Notably, the signal intensity for the EJC core proteins at the 75B locus is higher compared to
74EF. This might suggest that EJC recruitment at these two loci behaves differently. Binding
of EJC proteins at both 74EF and 75B puffs further indicates that their recruitment is
transcription-dependent. As predicted from an earlier study, the association of the EJC occurs
after splicing, therefore recruitment of EJC proteins at these loci does not confirm whether

95
this recruitment occurs at the beginning of transcription with Pol IISer2
. As mentioned earlier,
genes at both of these loci contain a very long intron, therefore, they take a longer time to
produce the first mature mRNA. To further address the possibility of whether there is delay in
the recruitment of Y14 at these loci I performed a time course ecdysone treatment in parallel
with RNA Pol IISer2
. Prior to adding ecdysone, there was no Y14 recruitment at either loci,
however, after 15 min the Y14 signal accumulates at the 75B locus and a very weak signal is
seen at the 74EF loci, in parallel with Pol IISer2
(Figure 3.13 B). After 30 minutes, 1 h and 2
h, the enrichment of Y14 increases at both loci, but particularly at 75B. The results of the
above observations suggest that the recruitment of Y14 occurs as early as after 15 min
ecdysone treatment, before splicing is completed.

96

97
Figure 3.13 EJC proteins recruitment is transcription dependent
(A) Salivary glands were treated with 1µM ecdysone for 1 h, the squashed polytene
chromosome was immunostained with anti-Y14, anti-MAGO and anti-eIF4AIII, which were
subsequently detected using a Cy3-conjugated secondary antibody (red). Arrows indicate
recruitment of all three EJC proteins (left panels) on the ecdysone induced 74EF and 75B
puffs. Middle panels show the DAPI images (blue), and right panels are the merged red and
blue channels. (B) Time interval recruitment of Y14 (left panel) and Pol IISer2
(right panels)
on ecdysone-induced puffs (74EF and 75B) with a no ecdysone control in the top panels. Y14
was detected with a FITC-conjugated secondary antibody (green signal) and Pol IISer2
with a
Cy3-conjugated secondary antibody (red signal). The images were taken under a standard
epifluorescence microscope with a 40X objective lens.

98
3.2.12 Y14/MAGO might regulate expression of ecdysone induced genes
Having observed that EJC proteins associate with the 75B and 74EF puffs upon ecdysone
induction, the question remained as to what their function was at these sites. To investigate
further, I knocked down both Y14 and MAGO by RNAi in S2 cells. As previously shown,
knockdown is efficient as both transcript and protein levels are drastically reduced (Figure
3.9). In this later experiments we also observed EJC recruitment at the BR-C puff, upon
ecdysone treatment (Figure 3.14 A). BR-C is a protein-coding gene with a long intron.
Transcription of all three genes is rapidly induced upon ecdysone treatment in S2 cells; the
induction reaches its highest peak after 2 h incubation (optimization data not shown). I
observed that upon knockdown of either Y14 or MAGO, the transcript levels of 75B and BR-
C were significantly increased compared to control S2 cells upon ecdysone induction (Figure
3.14 C). Notably, the level of this enhanced induction seems to correlate negatively with the
level of of Y14 and MAGO at the gene, this is most apparent at 75B, which is the more
affected than 74EF, yet shows higher levels of Y14 and MAGO. The data therefore suggest
that the Y14/MAGO heterodimer might act as a transcriptional repressor specifically of the
75B gene.
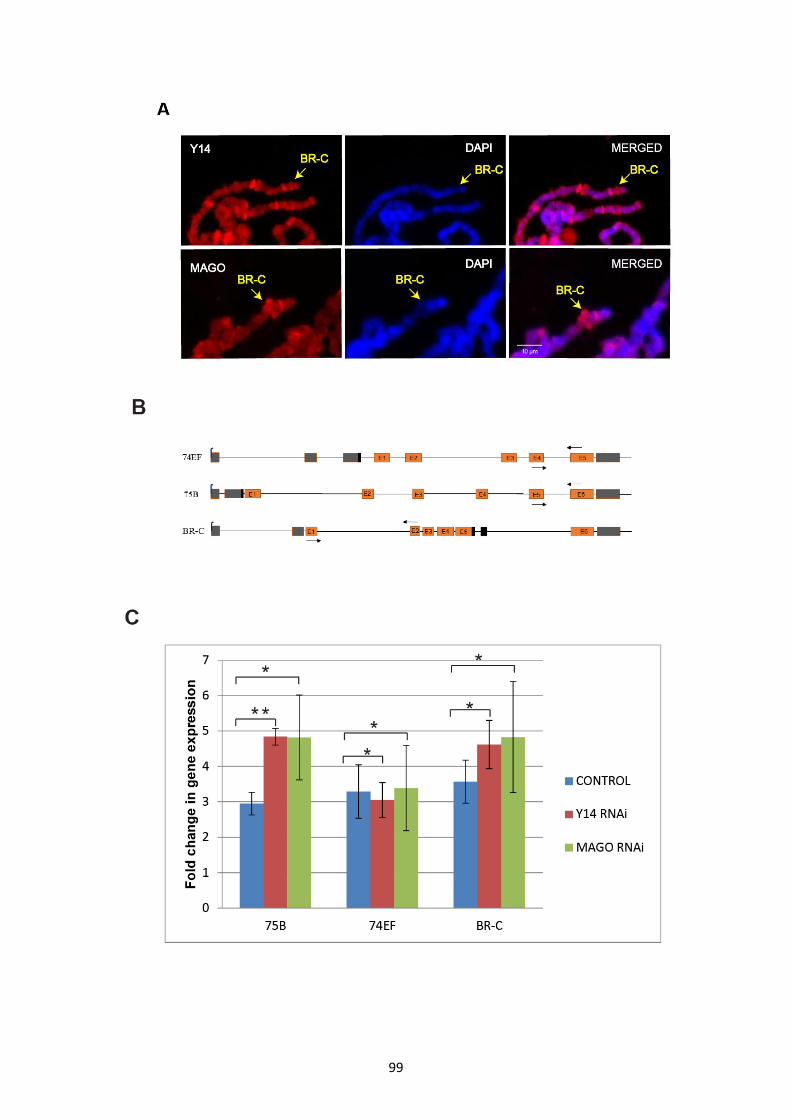
99
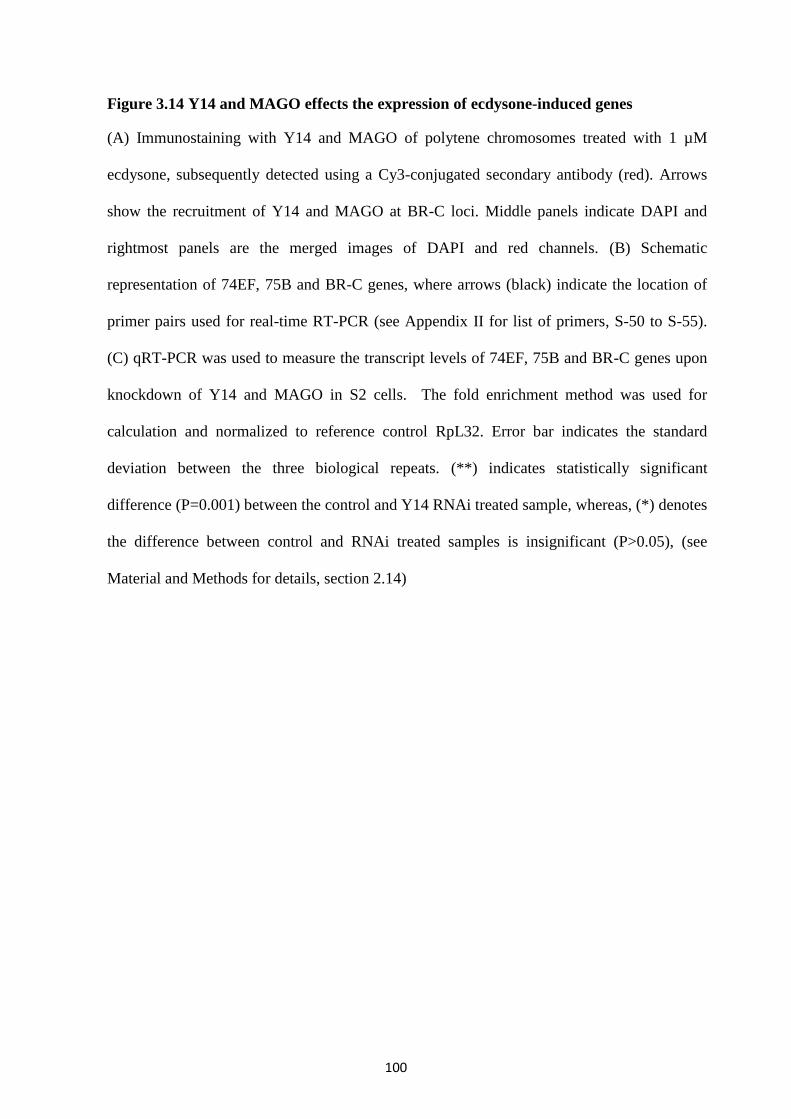
100
Figure 3.14 Y14 and MAGO effects the expression of ecdysone-induced genes
(A) Immunostaining with Y14 and MAGO of polytene chromosomes treated with 1 µM
ecdysone, subsequently detected using a Cy3-conjugated secondary antibody (red). Arrows
show the recruitment of Y14 and MAGO at BR-C loci. Middle panels indicate DAPI and
rightmost panels are the merged images of DAPI and red channels. (B) Schematic
representation of 74EF, 75B and BR-C genes, where arrows (black) indicate the location of
primer pairs used for real-time RT-PCR (see Appendix II for list of primers, S-50 to S-55).
(C) qRT-PCR was used to measure the transcript levels of 74EF, 75B and BR-C genes upon
knockdown of Y14 and MAGO in S2 cells. The fold enrichment method was used for
calculation and normalized to reference control RpL32. Error bar indicates the standard
deviation between the three biological repeats. (**) indicates statistically significant
difference (P=0.001) between the control and Y14 RNAi treated sample, whereas, (*) denotes
the difference between control and RNAi treated samples is insignificant (P>0.05), (see
Material and Methods for details, section 2.14)
101
3.2.13 ChIP-seq data indicates recruitment of Y14 predominantly at transcription start
sites
To gain more detailed information on the distribution of the EJC throughout the genome, I
carried out chromatin immunoprecipitation (ChIP) followed by high-throughput DNA
sequencing (ChIP-seq). ChIP-seq is a widely used advanced technique to analyse the
interaction between protein and DNA and is followed by DNA sequencing to map the
binding sites of protein throughout the genomic region. ChIP experiments were performed
with Drosophila S2 cells. Before performing ChIP, I optimized sonication conditions of the
samples (see Material and Methods). ChIP experiments were carried out for all three EJC
core factors, Y14, MAGO and eIF4AIII. However, only the Y14 antibody performed well
and produced informative sequencing data (the sequencing and its analysis was carried out in
collaboration with Dr. Paul Badenhorst at the Institute of Biomedical Research (IBR), and
Aditi Kanhere in our school here at University of Birmingham, UK. Unexpectedly, ChIP-seq
analysis revealed enrichment at transcription start sites (Figure 3.15 A & B). Similar
analysis, using the Cis-regulatory Element Annotation System (CEAS) also shows that Y14
associates particularly at the promoter region of the gene (Figure 3.15 C & D). As an
example, the enrichment at the TSS is apparent at the super sex comb gene (sxc) (Figure 3.15
E). This data might explain why the Y14 signal at the chromosomes is resistant to RNase
treatment; Y14 might be recruited to transcription sites directly or indirectly via an
interaction with either DNA or DNA associated proteins. This analysis identified a list of
putative Y14 associated genes, which includes both protein-coding and other RNA coding
genes. Notably, the protein associates with intron-less genes (see Appendix VIII), consistent
with the pattern on the polytene chromosomes which showed that Y14, similarly to the other
two EJC proteins, associates also with intron-less heat shock genes.

102
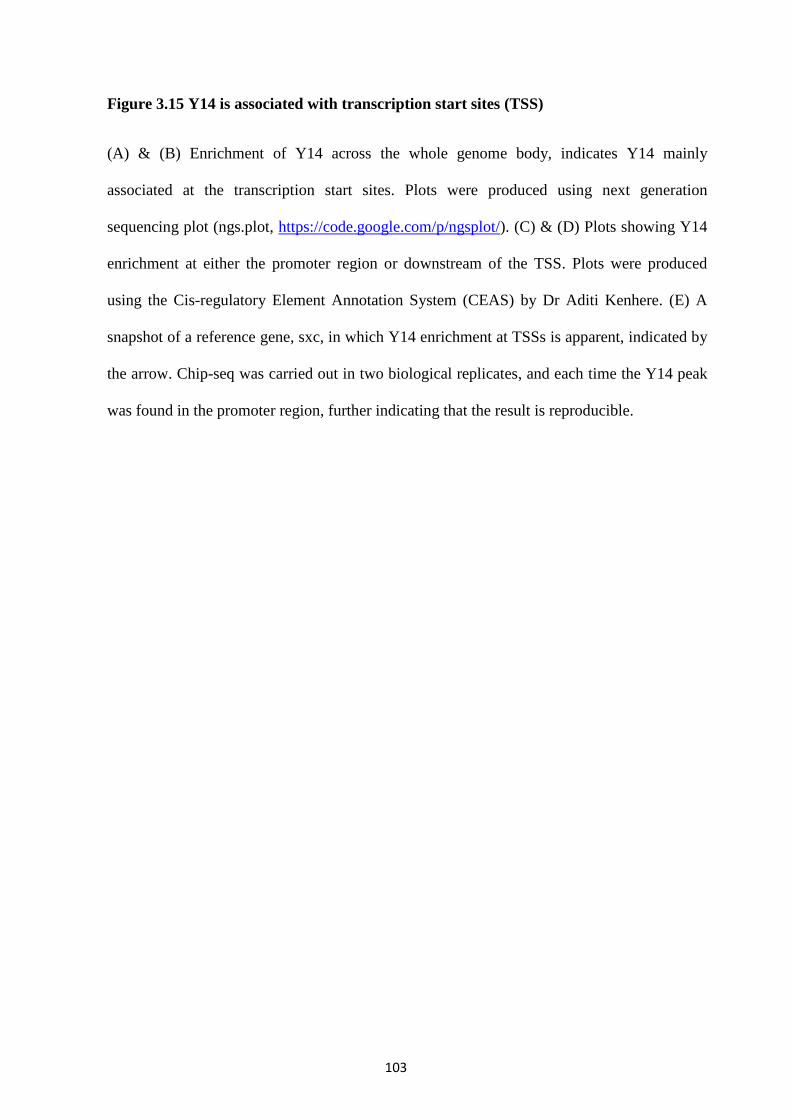
103
Figure 3.15 Y14 is associated with transcription start sites (TSS)
(A) & (B) Enrichment of Y14 across the whole genome body, indicates Y14 mainly
associated at the transcription start sites. Plots were produced using next generation
sequencing plot (ngs.plot, https://code.google.com/p/ngsplot/). (C) & (D) Plots showing Y14
enrichment at either the promoter region or downstream of the TSS. Plots were produced
using the Cis-regulatory Element Annotation System (CEAS) by Dr Aditi Kenhere. (E) A
snapshot of a reference gene, sxc, in which Y14 enrichment at TSSs is apparent, indicated by
the arrow. Chip-seq was carried out in two biological replicates, and each time the Y14 peak
was found in the promoter region, further indicating that the result is reproducible.

104
3.3 Discussion
Based on the contemporary model, the association of the EJC at spliced junction occurs
simultaneously with splicing. Pre-mRNA splicing is typically co-transcriptional in
Drosophila (Khodor et al., 2012); I therefore took advantage of the polytene chromosomes to
gain insights into why the EJC seems to associate only with a subset of transcripts in
Drosophila (Sauliere et al., 2010). The core EJC proteins Y14, MAGO, and eIF4AII localize
mostly to the nucleus in mammalian cells (Baguet et al., 2007; Custodio et al., 2004; The
Human Protein Atlas - www.proteinatlas.org). In Drosophila, the proteins also appear to be
mostly nuclear in the cells analysed, however, as demonstrated by the oskar mRNA
localization studies cited earlier, in the oocyte they are most abundant within the cytoplasm.
I reported here that the EJC proteins are present in both the nucleus and the cytoplasm in
salivary glands. Quantitative estimation to compare the nuclear and cytoplasmic levels of all
three EJC proteins in Drosophila S2 cells found the proteins to be equally distributed
between the two compartments. To assess their distribution in the nucleus more directly, I
carried out indirect immunostaining and report that the core EJC proteins Y14, MAGO and
eIF4AIII associate with transcription sites of the Drosophila polytene chromosome. This
localization with transcription sites is confirmed by double-immunostaining of the EJC
proteins and PolISer2
. This association with transcription sites was also observed using
transgenic flies expressing tagged version of these proteins. My observation shows a
complete overlap of the Y14 and MAGO signals, consistent with these proteins forming a
stable heterodimer in vitro (Lau et al., 2003). The Y14 and MAGO signals are expected to
match that of eIF4AIII at transcription sites, however, I found the distribution of eIF4AIII
poorly correlates with that of Y14 and MAGO. This difference in staining pattern is more

105
apparent with parallel PolISer2
immunostaining, in which eIF4AIII is well colocalized with
PolISer2
, whereas, Y14 and MAGO signals are either absent or weak at intense PolISer2
sites.
Specifically, double immunostaining of tagged eIF4AIII and endogenous Y14 further verified
that there are sites at which the eIF4AIII signal is strong but Y14 is absent. Knockdown of
Y14 also completely eliminated MAGO from transcription sites, while MAGO knockdown
only partially reduced Y14. This suggests that Y14 can be recruited at transcription sites
independently of MAGO. Y14 or MAGO knockdown does not have visible phenotypic
effects, however, knockdown of eIF4AIII drastically impairs the growth of glands. This
observation indicates that eIF4AIII might have additional roles, which are independent of
EJC assembly. The observation that, after RNase treatment, EJC signals remain at
transcription sites, suggests that EJC proteins might indirectly contact chromatin or DNA-
associated proteins. An unexpected finding is the recruitment of all EJC proteins at heat
shock gene loci (87A & 87C). An association of EJC components at these loci further
concludes that their association does not depend on the intronic features of genes, as these
genes do not have introns. Moreover, EJC recruitment was also observed at other heat shock
loci, for instance at 95D, which encodes heat shock protein 68 (Hsp68) and also has no
introns, and the 93D region that encodes non-protein coding gene hsr-ω-n (Lakhotia and
Tapadia, 1998). Similar observations were made with ChIP-seq of Y14, which showed that
this protein associates with genes both with or without introns. This latter analysis also
showed a preferential association with transcription start sites, suggestive of a role for Y14 at
the promoter. My observations contradict previous conclusions that EJC association is
splicing-dependent in Drosophila. Additionally, I show evidence that Y14/MAGO
knockdown affects expression of ecdysone inducible genes, suggesting a role for these
proteins in transcription.
106
Chapter 4
4.0 Visualization of ribosomes, translation and the NMD factor UPF1 at transcription
sites
4.1 Summary
Evidence from past indicates that NMD may occur in the nucleus. NMD is a strictly
translation dependent process, and the ribosome is the only cell component capable of
reading the mRNA coding sequence and allowing recognition of a premature translation
termination codon (PTC). Therefore, ribosomes may be functional in the nucleus. Here I
describe a side project of my PhD in which I aimed to visualize ribosomal proteins and
ribosome activity at transcription sites of the polytene chromosomes, following a strategy
similar to that used for EJC proteins (Chapter 3). Firstly, to investigate whether ribosomal
proteins are present at transcription sites, I used several transgenic Drosophila lines, that
endogenously express yellow fluorescent protein (YFP)-tagged ribosomal proteins, to analyse
their sub-cellular localization. This analysis confirmed that ribosomal proteins (RPs)
accumulate in both the cytoplasm and the nucleus, and associate with transcription sites on
polytene chromosomes, which was consistent with that previously reported (Brogna et al.,
2002). Identification of RPs at transcription sites is not sufficient to distinguish between fully
assembled translating ribosomes and ribosomal proteins undertaking translation-unrelated
functions. To differentiate between the two, I applied the ribopuromycylation (RPM)
technique recently described for mammalian cells, which allows visualisation of translation
(David et al., 2012). By using this technique, I found evidence of ribosomal activity at
transcription sites on Drosophila polytene chromosomes. These findings indicate that nascent
RNAs are translated, suggesting that there is a link between ribosomal scanning and RNA
processing. This observation is consistent with the view that NMD may occur co-

107
transcriptionally. To assess this hypothesis directly, we used antibodies against endogenous
UPF1, a key NMD factor, to determine its presence on the polytene chromosomes. Notably, I
found that UPF1 associates with majority of transcription sites. In summary, the data provide
evidence that both ribosomes and UPF1 are at transcription sites. These observations are
consistent with the view that NMD is initiated at transcription sites.

108
4.2 Results
4.2.1 Characterization of YFP tagged ribosomal protein expression in salivary glands
Transgenic lines carrying YFP tagged ribosomal proteins used in this study were received
from Drosophila Genomics and Genetic Resources (DGGR), Kyoto Stock Centre (see
Appendix III) (www.dgrc.kit.ac.jp). These trap lines carry the YFP coding region inserted
into an intron of an endogenous gene, thus keeping the endogenous promoter activity (Morin
et al., 2001). The YFP trapping cassette was inserted using a construct based on the
piggyback transposable element and it was flanked by splice acceptor (SA) and donor sites
(SD)(Figure 4.1A) (More details can be found at
http://kyotofly.kit.jp/stocks/documents/CPTI.html). These constructs produce chimeric
proteins in which YFP is added at variable positions of the trapped protein, therefore
providing a potentially good system to target proteins in tissues. Detailed information about
each fly line and their source is given in Table 4.1, while a schematic diagram of each
construct has been shown in Figure 4.1.
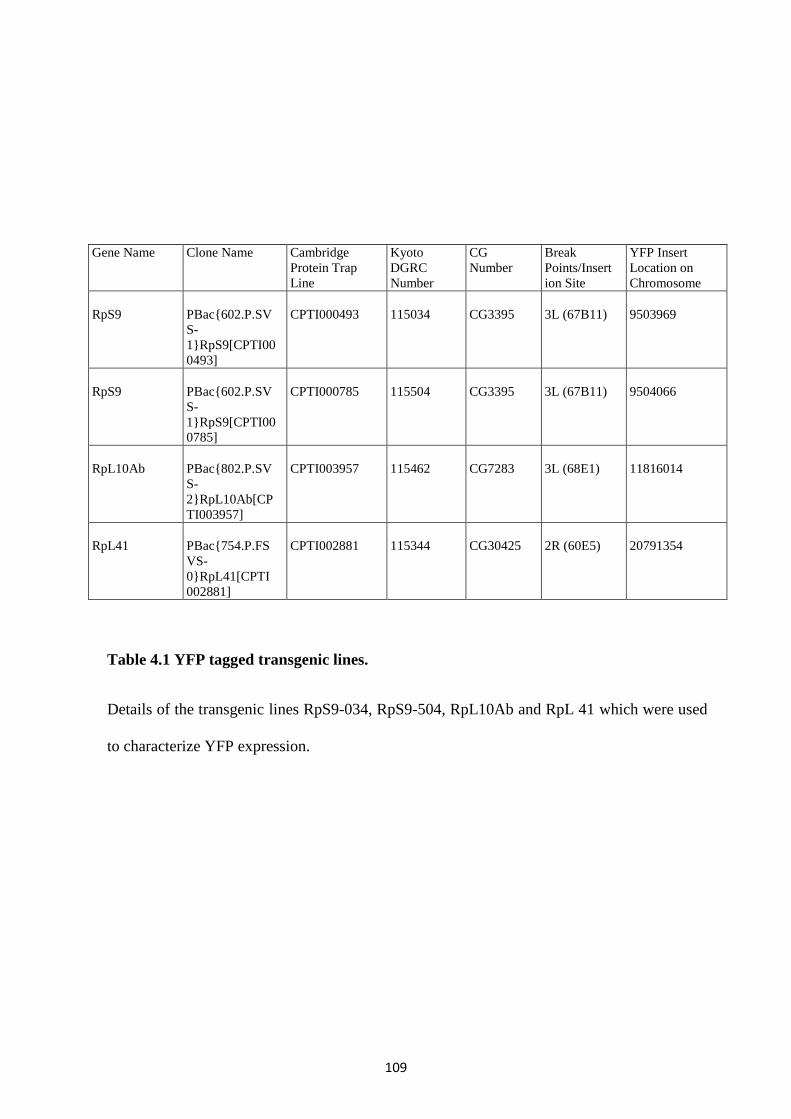
109
Gene Name Clone Name Cambridge
Protein Trap
Line
Kyoto
DGRC
Number
CG
Number
Break
Points/Insert
ion Site
YFP Insert
Location on
Chromosome
RpS9
PBac{602.P.SV
S-
1}RpS9[CPTI00
0493]
CPTI000493
115034
CG3395
3L (67B11)
9503969
RpS9
PBac{602.P.SV
S-
1}RpS9[CPTI00
0785]
CPTI000785
115504
CG3395
3L (67B11)
9504066
RpL10Ab
PBac{802.P.SV
S-
2}RpL10Ab[CP
TI003957]
CPTI003957
115462
CG7283
3L (68E1)
11816014
RpL41
PBac{754.P.FS
VS-
0}RpL41[CPTI
002881]
CPTI002881
115344
CG30425
2R (60E5)
20791354
Table 4.1 YFP tagged transgenic lines.
Details of the transgenic lines RpS9-034, RpS9-504, RpL10Ab and RpL 41 which were used
to characterize YFP expression.

110
Figure 4.1 Schematic representation of YFP tagged ribosomal proteins.
(A) Schematic of the principle of the YFP protein trap strategy in which the YFP coding
sequence, flanked by acceptor (SA) and donor (SD) splice sites, gets randomly inserted into
an intron. (B) A simplified representation of different tagged RpL41, RpL10Ab, RpS9 034,
and RpS9 504 proteins which are expressed from their endogenous promoter. Black line
indicates an intron, whereas boxes represent exons. Length of each gene and location is
indicated by the nucleotide base number (source flyBase).

111
4.2.2 Confirmation of the transgene inserts of each fly strain
To validate the transgenic lines by PCR, primers were designed to amplify part of the YFP
sequence and downstream exons (Figure 4.2 A). This work was done in collaboration with
Sarah Taylor (a Masters student in our lab). Fly genomic DNA was used as a template and
PCR products were visualised by agarose gel electrophoresis (Figure 4.2 B). PCR of RpL41-
YFP and RpL10Ab-YFP produced the right size fragment of 189 bases and 1393 bases
respectively, confirming the right constructs. However, line 034 of RpS9-YFP produced a
larger fragment than expected which was 740 bases and no PCR products were amplified for
line 504 of RpS9-YFP, suggesting the latter does not carry the desired construct (4.2 B).
Having confirmed the fragment size by PCR, we also further verified the tagging construct of
RpL41-YFP and RpL10Ab-YFP and RpS9-YFP (034) by DNA sequencing. Corresponding
PCR fragments were gel purified and sent to GATC Biotech Ltd (London) for sequencing.
The sequence was also matched with a BLAST search for all transgene constructs
(http://blast.ncbi.nlm.nih.gov/Blast.cgi) (see Appendix V). Confirmation of the constructs
suggests that fluorescence observed in immunostaining comes from the YFP tagged proteins.

112
Figure 4.2 Confirmation of transgene constructs by gel electrophoresis. (A)
Representation of primer location within the each construct. (B) PCR products were run in

113
1% agarose gel. Lane 1 indicates 1kb DNA ladder whereas lanes 2 and 3 show PCR products
of RpL41-YFP and RpL10Ab-YFP. Lanes 4 and 5 represent PCR products of RpS9 034-YFP
and RpS9 504-YFP.

114
4.2.3 Localization of ribosomal proteins in whole salivary glands
I visualized YFP tagged ribosomal proteins in the salivary glands of 3rd instar larvae.
Microscopy imaging of RpL41-YFP shows a strong YFP signal in the nucleus, particularly
intense in the nucleolus, and a relatively weaker signal in the cytoplasm. Instead, RpL10Ab–
YFP, as expected for a RP shows a strong signal in both the cytoplasm and the nucleolus, but
a weak signal in the rest of the nucleus. The RpS9-YFP (034) lines show a signal mostly in
the cytoplasm with no apparent nucleolar signal. The second RpS9-YFP (504) line produced
no fluorescent signal above background (Figure 4.3 A). After these initial results, I focused
on better characterizing the subcellular localization of RpL41 as it shows an unexpectedly
strong signal in the nucleus. RpL41 is a very small protein (only 25 amino acid) that it is
associated with the intersubunit surface of the 80S (Klinge et al., 2012). In Drosophila, the
RpL41 gene is present as a single copy in the genome and is essential for viability (Marygold
et al., 2007). Confocal imaging of RpL41-YFP confirmed that the signal is most concentrated
in the nucleus, particularly in the nucleolus (Figure 4.3 B). We published these observations
along with similar data, which show that other fluorescently tagged ribosomal proteins also
accumulate in the nucleus and are present at transcription sites of the polytene chromosome
(Rugjee et al., 2013).

115
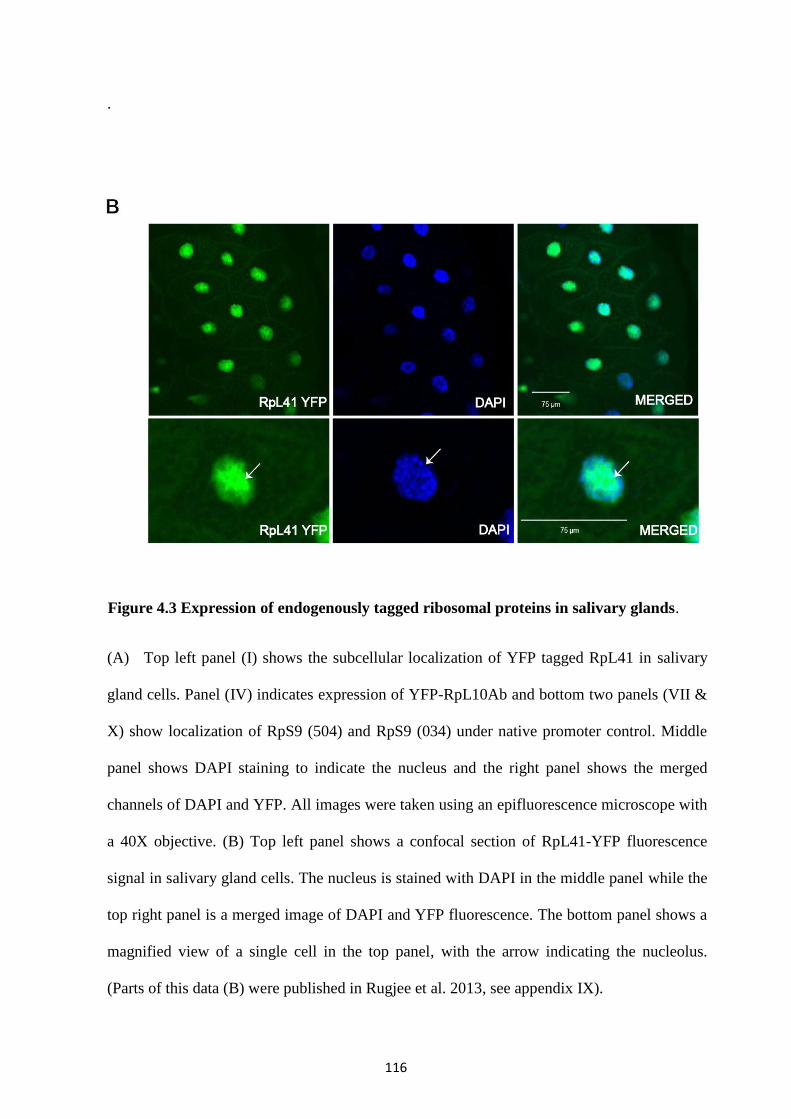
116
.
Figure 4.3 Expression of endogenously tagged ribosomal proteins in salivary glands.
(A) Top left panel (I) shows the subcellular localization of YFP tagged RpL41 in salivary
gland cells. Panel (IV) indicates expression of YFP-RpL10Ab and bottom two panels (VII &
X) show localization of RpS9 (504) and RpS9 (034) under native promoter control. Middle
panel shows DAPI staining to indicate the nucleus and the right panel shows the merged
channels of DAPI and YFP. All images were taken using an epifluorescence microscope with
a 40X objective. (B) Top left panel shows a confocal section of RpL41-YFP fluorescence
signal in salivary gland cells. The nucleus is stained with DAPI in the middle panel while the
top right panel is a merged image of DAPI and YFP fluorescence. The bottom panel shows a
magnified view of a single cell in the top panel, with the arrow indicating the nucleolus.
(Parts of this data (B) were published in Rugjee et al. 2013, see appendix IX).
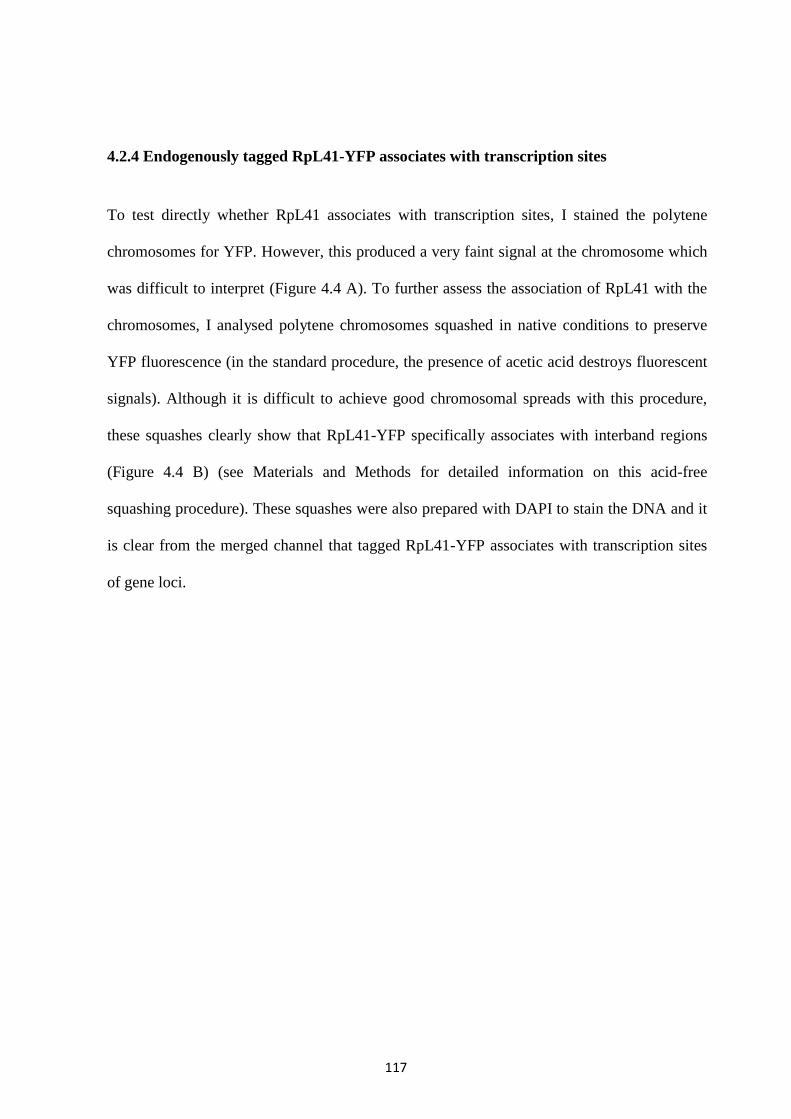
117
4.2.4 Endogenously tagged RpL41-YFP associates with transcription sites
To test directly whether RpL41 associates with transcription sites, I stained the polytene
chromosomes for YFP. However, this produced a very faint signal at the chromosome which
was difficult to interpret (Figure 4.4 A). To further assess the association of RpL41 with the
chromosomes, I analysed polytene chromosomes squashed in native conditions to preserve
YFP fluorescence (in the standard procedure, the presence of acetic acid destroys fluorescent
signals). Although it is difficult to achieve good chromosomal spreads with this procedure,
these squashes clearly show that RpL41-YFP specifically associates with interband regions
(Figure 4.4 B) (see Materials and Methods for detailed information on this acid-free
squashing procedure). These squashes were also prepared with DAPI to stain the DNA and it
is clear from the merged channel that tagged RpL41-YFP associates with transcription sites
of gene loci.

118
Figure 4.4 Tagged RpL41 associates with transcription sites of the polytene chromosome
Top row (A) shows a polytene chromosome from a strain expressing RpL41-YFP, indirectly
immunostained with an anti-GFP primary antibody, which was subsequently detected with a
Cy3-conjugated secondary antibody. DAPI staining is shown in the middle panel, while the top
right panel is a merged image of Cy3 and DAPI. (B) A polytene chromosome under native
conditions shows the YFP fluorescence signal corresponding to YFP-RpL41 in the top left
panels, whereas the bottom left panel is a merged image of the YFP and DAPI channels. The
top rightmost panel is a magnified view of the box indicated in the main image; lines denote
the fluorescence signals in the interband positions and that of DAPI in the bottom right panels.
(Parts of this figure (B) were published in Rugjee et al. 2013, see appendix IX)

119
4.2.5 Ribopuromycylation allows visualisation of translation sites in vivo
To assess whether translating ribosomes are present in the nucleus in Drosophila, I utilised a
new technique known as ribopuromycylation (RPM), which was first used to detect
translation sites in mammalian cells (David et al., 2012) (Figure 4.5). Puromycin is an
aminonucleoside antibiotic, mainly derived from the Streptomyces alboniger bacterium and is
an analog of the 3' end of an aminoacylated tRNA (Yarmolinsky and Haba, 1959).
Puromycin enters the A site of the translating ribosome and is incorporated into the newly
synthesized peptide chain, causing its premature release (Tscherne and Pestka, 1975). It was
reported by David and Collaborators (2012) that elongation inhibitors such as emetine or
cycloheximide (CHX) prevent the release of puromycylated peptide chains, which remain
bound to the ribosome. An antibody specific to puromycin can thus be used to detect the
translating ribosome in both fixed and permeabilized cells (David et al., 2012). The RPM
technique was successfully applied by David and Collaborators (2012) to visualize translating
ribosomes, which notably were seen both in the cytoplasm and in the nucleolus of
mammalian cells (David et al., 2012).

120
Figure 4.5 Schematic of the RPM procedure
Polysomes were immobilized on mRNAs by one of two elongation inhibitors, CHX or
emetine. Puromycin was added, which is then incorporated into nascent polypeptide chains
and subsequently detected by anti-PMY mAb. This figure is a modified from David and
Collaborators (2012).

121
4.2.6 Puromycylation observed in salivary glands and S2 cells
To test the feasibility of the puromycylation technique, I used both salivary glands and S2
cells, which were treated with puromycin alone, or in combination with translation elongation
inhibitors and other translation inhibitors, as described for mammalian cells (David et al.,
2012). My Western blotting results clearly indicate that puromycin incorporation was
observed in both S2 cells and salivary glands, in either the presence or absence of translation
inhibitors drugs, but no signal was observed in the absence of puromycin, which further
indicates the specificity of the antibody in Drosophila (Figure 4.6). Moreover, in the
presence of translation initiation inhibitors such as harringtonine or anisomycin, puromycin
incorporation was significantly reduced compared to the untreated samples, which is as
expected and as shown by David et al. (2012). However, treatment with emetine reduces
puromycylation in both S2 cells and salivary glands, suggesting that the drug can partially
inhibit puromycylation in these cell types (Figure 4.6, lanes 1 and 2).
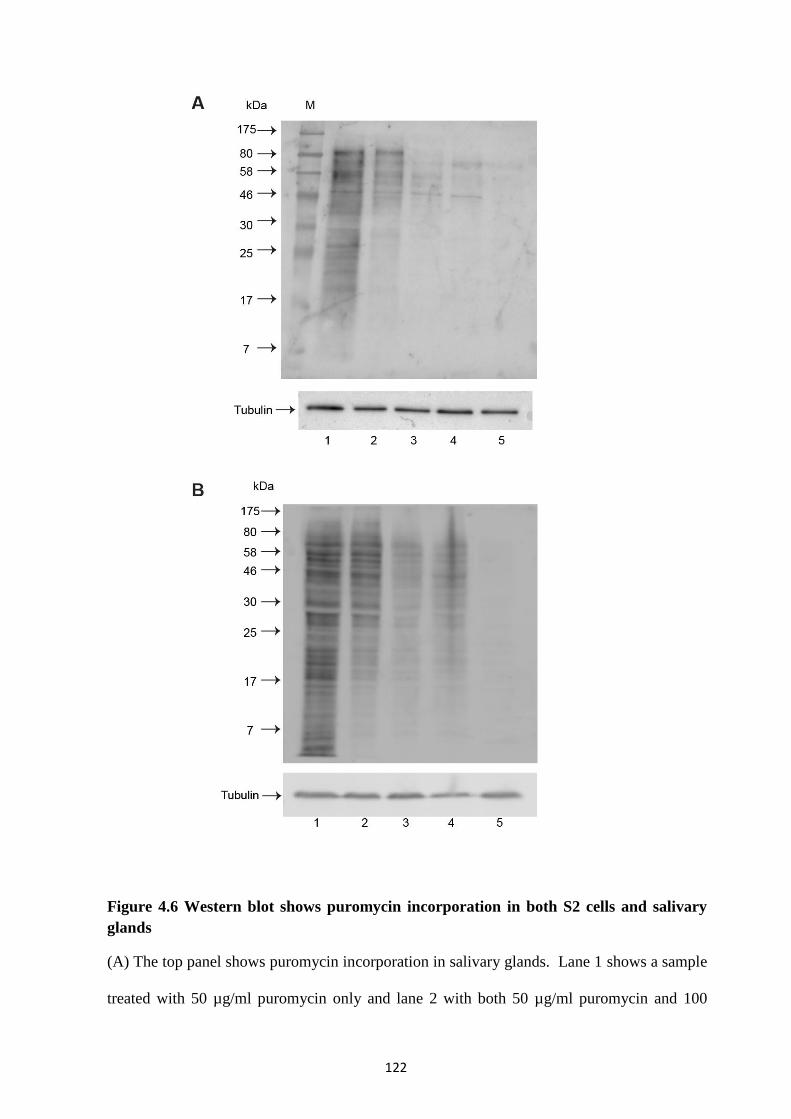
122
Figure 4.6 Western blot shows puromycin incorporation in both S2 cells and salivary
glands
(A) The top panel shows puromycin incorporation in salivary glands. Lane 1 shows a sample
treated with 50 µg/ml puromycin only and lane 2 with both 50 µg/ml puromycin and 100

123
µg/ml emetine. Lanes 3 and 4 were pretreated with 2µm harringtonine and 20 µg/ml
anisomycin followed by puromycin. Lane 5 represents a no drug control to check the
specificity of the antibody. (B) Bottom panel: the same drug treatments were used in S2 cell
extracts (see Materials and Methods for details). The same membrane was also re-probed
with tubulin which was used as a loading control for both Western blots. (This figure were
published in Al-jubran et al. 2013, see appendix IX).

124
4.2.7 Puromycin incorporation in intact whole salivary glands
To assess whether the RPM technique can be used to detect translating ribosomes in vivo,
intact salivary glands were dissected from mid-3rd instar larvae and pre-treated with different
drug combinations as in S2 cells. The results suggest that puromycylation occurs both in the
cytoplasm and in the nucleus (Figure 4.7 A). In the larger cells of the lobe, puromycylation is
also observed around the chromosomes. The signal is also apparent in the nucleolus,
particularly in the smaller cells that make the proximal portion of the gland. (Figure 4.7 B).
Notably, the relative signal intensity of the nucleus and nucleolus is higher after treatment
with emetine, consistent with RPM reporting translation sites. Glands pretreated with the
translation initiation inhibitor harringtonine, showed drastically reduced puromycylation,
consistent with the Western blot results (Figure 4.6).

125

126
Figure 4.7 Puromycylation in intact whole salivary glands
The first panel, Figure (A), shows a confocal image of salivary glands treated with puromycin
and emetine and subsequently immunostained with an Alexa 488 conjugated 2A4
monoclonal antibody. Arrows indicate puromycin incorporation in the nucleolus. The middle
panel shows glands treated with puromycin only and the last panel demonstrates pre-
incubation with harringtonine followed by puromycin and emetine incubation. (B) Figure
shows a magnified image of salivary gland cells treated with puromycin and emetine, where
arrows indicate a ring-like structure around the nucleolus. All glands were also
counterstained with DAPI to visualize the nucleus. The right panels show a merged image of
the DAPI and the green channel. All images were taken with a Leica confocal microscope
with a 63X oil immersion lens. (This figure were published in Al-jubran et al. 2013, see
appendix IX).

127
4.2.8 Incorporation of puromycin at polytene chromosome transcription sites
To address the issue whether ribosomes are present at transcription sites, I applied the RPM
technique to the polytene chromosomes (see Material and Methods). Puromycin
incorporation was detected at the chromosomes and particularly in the interband regions
(Figure 4.8 A). Although a faint signal was also observed in the band region (transcriptionally
inactive region of chromatin) this was mostly weak compared to the interband
(transcriptionally active region of gene). Moreover, the signal was particularly intense at
specific interbands (indicated by the arrow in Figure 4.8 A., magnified insets). The signal
appears to be specific at these sites, as in the absence of puromycin there was no such signal
(shown below). Also I noted that treatment of the glands with aurintricarboxylic acid (ATA),
an RNase inhibitor, significantly increased the intensity of the signal at interband regions (see
Materials and Methods). In addition, pre-treatment of the glands with the DNA intercalating
drug actinomycin D, significantly intensifies the signal at interband regions particularly at
transcription puffs (highly active in transcription) (Figure 4.8 B). Furthermore, a weak
puromycin signal was also observed around the nucleolus. To further test whether the signal
is translation dependent, polytene chromosomes were pre-incubated with the translation
initiation inhibitor harringtonine. Upon treatment with this inhibitor, the puromycin
incorporation signal appears to be drastically reduced at interband regions (Figure 4.9). These
results indicate that puromycin incorporation is translation dependent and is consistent with
that observed in salivary glands and S2 cells in Western blotting. As mentioned above, the
signal is RNase-sensitive: the addition of RNase inhibitors increases the puromycin signal
and adding RNase completely abolishes it at the interband or puffs (Figure 4.9). The RPM

128
method provides evidence for the recruitment of actively translating ribosomes at
transcription sites on Drosophila polytene chromosomes.

129

130
Figure 4.8 Puromycin incorporation on transcription sites of Drosophila polytene
chromosomes
(A) Top panels show salivary glands pre-incubated with 50 µg/ml puromycin and100 µg/ml
emetine. White arrow indicates puromycin signal at the interband position. (B) Glands were
incubated with 100 µg/ml emetine, 50 µg/ml puromycin and 10 µg/ml actinomycin D (Act D)
(see Materials and Methods for details). Direct immunostaining with an Alexa488-conjugated
anti-puromycin antibody shows puromycin signal all over the chromosome, particularly
intense at the interband position. Bottom panels show a magnified section indicated by a
white square from the panel above, with strong puromycin signal indicated by the white
arrow at interband loci. (This figure were published in Al-jubran et al. 2013, see appendix
IX).

131
Figure 4.9 Puromycin signal is translation dependent
Immunostaining of chromosomes was performed as above. Top panel shows, 2 µM
harringtonine was added for 30 minutes prior to incubation with puromycin, emetine and Act
D. In the middle panel, 100 µg/ml RNase A was added to the first squashing step, prior to
fixation, and the sample was incubated for 2 minutes at room temperature. Puromycin was
omitted in the control (bottom panel), in which only faint background fluorescence can be
detected. (This figure were published in Al-jubran et al. 2013, see appendix IX).

132
4.2.9 Generation of monoclonal antibodies against UPF1 and UPF2 of Drosophila
To produce the antibodies against the UPF1 and UPF2, protein amino acid sequences were
retrieved from FlyBase (Table 2.1 & 2.2, see Material and Methods, section 2.13) and
specific regions were selected by the company Abmart. Abmart uses its patented technology,
Abmart Seal, which involves cloning of the selected epitopes into a specific vector to produce
a recombinant protein incorporating several antigens. This is used for immunization of mice
that then develop an immune response against the desired peptide, which is followed by
production of hybridoma clones (a detailed description of the Abmart SEAL technology is
given in Material and Methods, section 2.13). Twelve epitope sequences were selected for
both UPF1 and UPF2 (Table 4.2 & 4.3 and Figure 4.10 & 4.11)
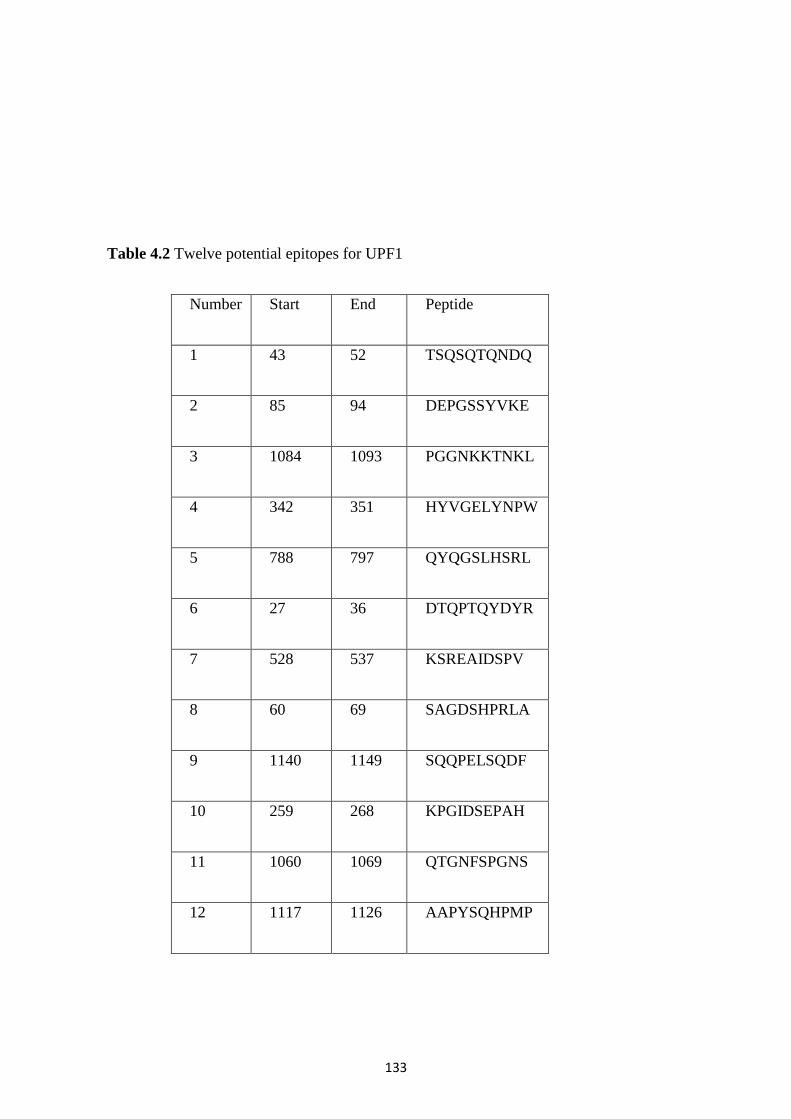
133
Table 4.2 Twelve potential epitopes for UPF1
Number Start End Peptide
1 43 52 TSQSQTQNDQ
2 85 94 DEPGSSYVKE
3 1084 1093 PGGNKKTNKL
4 342 351 HYVGELYNPW
5 788 797 QYQGSLHSRL
6 27 36 DTQPTQYDYR
7 528 537 KSREAIDSPV
8 60 69 SAGDSHPRLA
9 1140 1149 SQQPELSQDF
10 259 268 KPGIDSEPAH
11 1060 1069 QTGNFSPGNS
12 1117 1126 AAPYSQHPMP

134
Figure 4.10 Prediction analysis of the UPF1 protein
This graph gives an overall view of the protein structure and the location of the selected
peptides. The x-axis indicates the amino acids number in the protein, and y-axis is the value
of the algorithm where the higher score indicates the higher probability of generation of the
antibody against that epitope. The scores of each 10mer epitope are plotted with a grey line.
Selected epitopes are highlighted in blue on the graph. Hydrophobic residues are shown using
red bars under the x-axis. This graph was taken from Abmart.

135
Table 4.3 Twelve potential epitopes for UPF2
Number Start End Peptide
1 1 10 MLANDSATTD
2 29 38 EGDNDNDIDT
3 13 22 VSTPPSSRKD
4 1220 1229 QKPNKHKFKH
5 445 454 DDPPSTTSDT
6 960 969 KTTNNAQDPS
7 703 712 SSKREPMVRP
8 999 1008 VSGQEQDQSN
9 461 470 EEQPTTPVAA
10 903 912 HPVFSKTENT
11 1098 1107 PNQDGTPGSP
12 980 989 DEGGTDEDSG
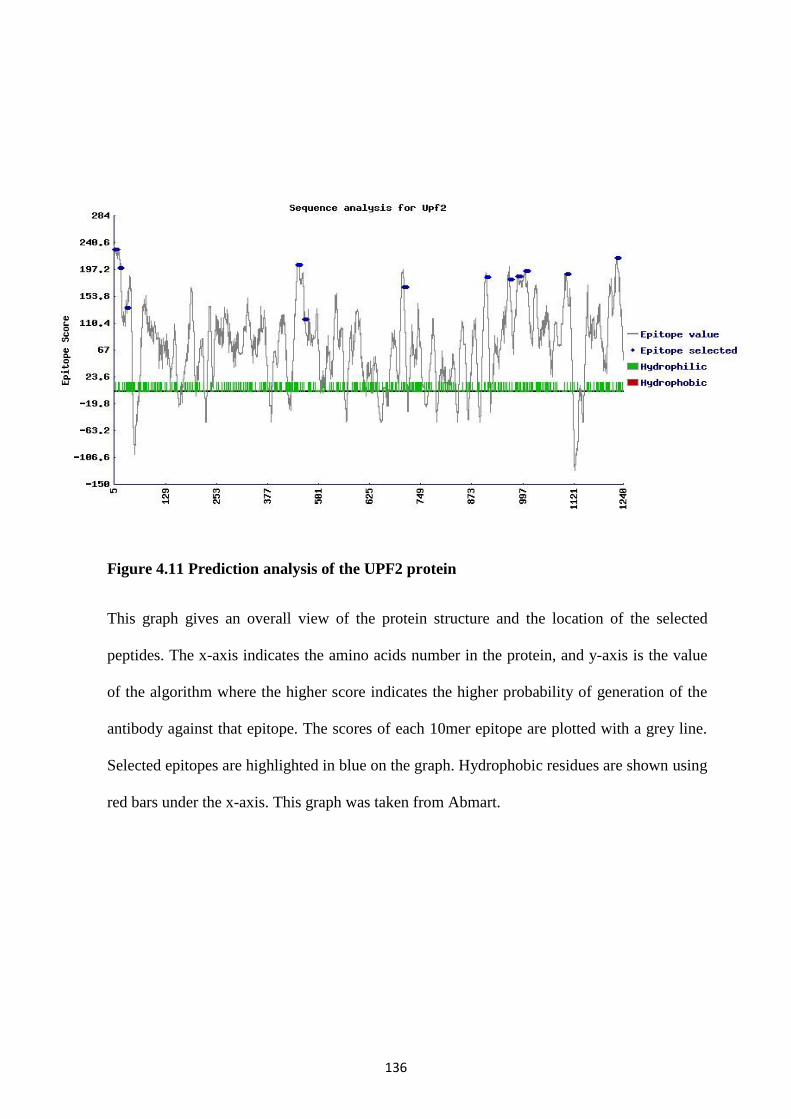
136
Figure 4.11 Prediction analysis of the UPF2 protein
This graph gives an overall view of the protein structure and the location of the selected
peptides. The x-axis indicates the amino acids number in the protein, and y-axis is the value
of the algorithm where the higher score indicates the higher probability of generation of the
antibody against that epitope. The scores of each 10mer epitope are plotted with a grey line.
Selected epitopes are highlighted in blue on the graph. Hydrophobic residues are shown using
red bars under the x-axis. This graph was taken from Abmart.
137
4.2.10 Western blot analysis of UPF1 ascites identified three potential clones specific for
UPF1
18 UPF1 hydridoma clones were received from Abmart (see Appendix VII for a list of all
ascites and clone ID numbers) and we tested them for their specificity against UPF1 by
Western blotting of Drosophila S2 cell extracts. The results showed a band of the expected
size with several of the antibody clones, however, most of them also showed nonspecific
bands. I chose three clones that showed minimal cross-reactivity with other proteins (Figure
4.12). These three clones were renamed based on the Western blot lane number: UPF1-1 (ID-
10108-1-1M1/1C13-2_121113, epitope peptide 2, see table 4.2), UPF1-3 (ID-10108-1-
7M1/7D17-11_121114, epitope peptide 12, Table 4.2) and UPF1-16 (ID-10108-1-
7M1/7B12-12_121120, epitope peptide 10, Table 4.2). Based on these initial Western blot
data, we (Dr. Brogna) requested Abmart to purify the above three monoclonal antibodies for
further testing. Unfortunately, I was unable to detect any band of the correct molecular size
for the UPF2 protein from any of the UPF2 ascites in the Western blot (see Appendix VI for
details). UPF2 antibody production project was therefore terminated at this stage.

138

139
Figure 4.12 Western blotting of S2 cell extracts with different UPF1 hybridoma clones
(A) S2 cell extracts were immunoblotted with UPF1-1 to UPF1-8 ascites, in which two
potential clones, UPF1-1 and UPF1-3 (lanes 1 & 3, marked by asterisk), identified by a band
of the right molecular size (129.94 kDa) with no background signal, indicating the specificity
against endogenous UPF1. Lanes are labelled with each UPF1 ascite’s ID clone number. (B)
Western blot of UPF1-9 to UPF1-18 ascites. Only UPF1-16 (lane 16, marked by asterisk)
shows a band of the correct molecular size, corresponding to endogenous UPF1, although
with some background signal of other molecular sizes.

140
4.2.11 Validation of potential UPF1 monoclonal antibodies
To further confirm that the three UPF1 antibodies we have selected can specifically detect the
correct protein, I expressed GFP-tagged UPF1 in S2 cells (see Appendix IV) and assayed
whole cell lysates by Western blotting. As expected, two bands were detected, one
corresponding to endogenous UPF1 and the other to UPF1-GFP. All three UPF1 antibodies
gave similar results. The top band corresponds to GFP-tagged UPF1 and the lower band is
specific to endogenous UPF1 (Figure 4.13). The data thus show that all three monoclonal
antibodies recognize endogenous UPF1 with minimal cross-reactivity.
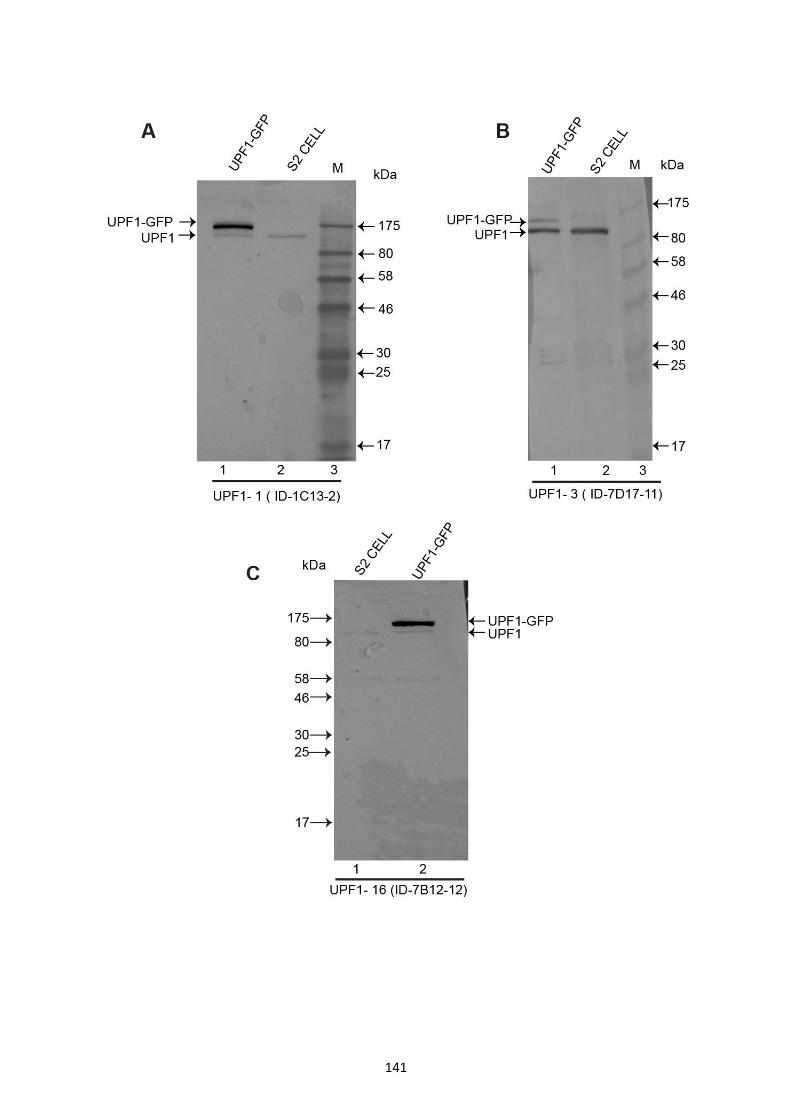
141

142
Figure 4.13 Western blot analysis shows that UPF1 ascites detect both endogenous
UPF1 and GFP-tagged UPF1
(A) S2 cells were transfected with UPF1-GFP and immunoblotted with UPF1-1 ascites in
parallel with a control S2 cell extract. Lane 1 shows detection of both the expressed UPF1-
GFP (156.94 kDa) (top) and endogenous UPF1 (bottom), whereas in lane 2 only endogenous
UPF1 is detected. (B) and (C) UPF1-3 and UPF1-16 ascites were immunoblotted in a similar
way, and both UPF1-GFP and endogenous UPF1 (lane 1 of (B) and lane 2 of (C)) were
detected in the transfected extract, but only endogenous UPF1 was detected in the control S2
cell extract (lane 2 of (B) and lane 1 of (C)).
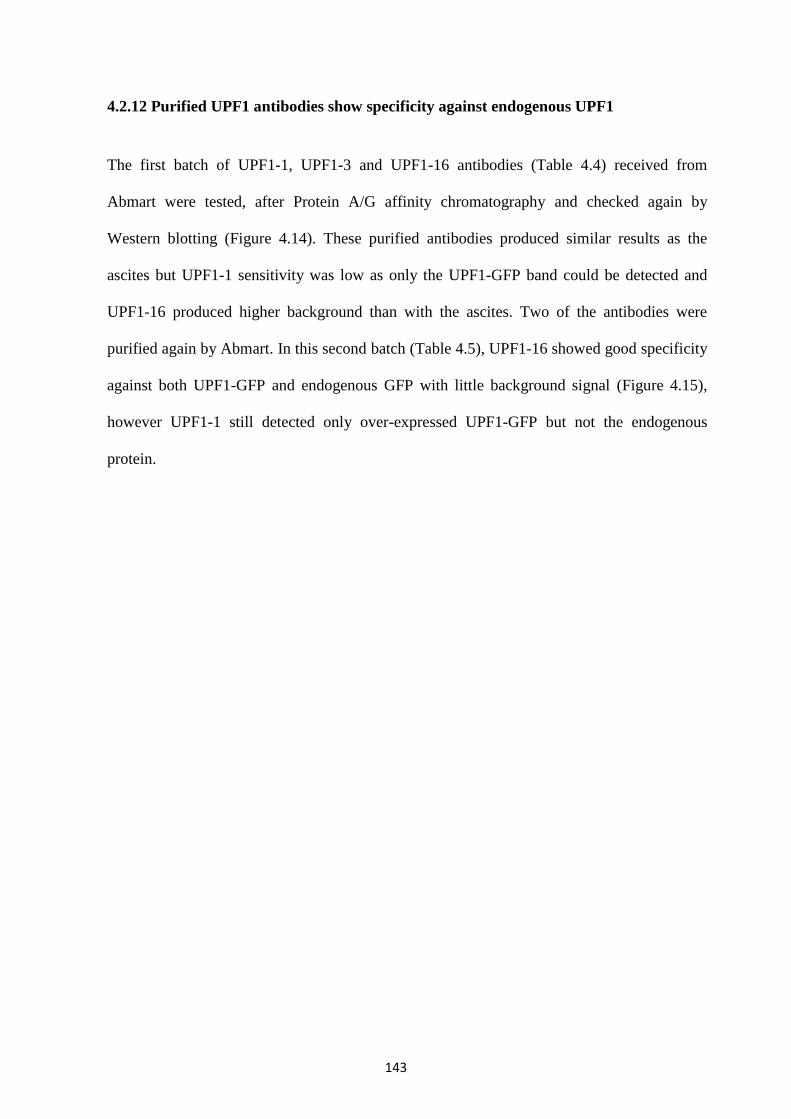
143
4.2.12 Purified UPF1 antibodies show specificity against endogenous UPF1
The first batch of UPF1-1, UPF1-3 and UPF1-16 antibodies (Table 4.4) received from
Abmart were tested, after Protein A/G affinity chromatography and checked again by
Western blotting (Figure 4.14). These purified antibodies produced similar results as the
ascites but UPF1-1 sensitivity was low as only the UPF1-GFP band could be detected and
UPF1-16 produced higher background than with the ascites. Two of the antibodies were
purified again by Abmart. In this second batch (Table 4.5), UPF1-16 showed good specificity
against both UPF1-GFP and endogenous GFP with little background signal (Figure 4.15),
however UPF1-1 still detected only over-expressed UPF1-GFP but not the endogenous
protein.

144
Table 4.4 First batch of purified UPF1 antibodies
Project
ID
Target
protein
Product
name
Epitope peptide Ig types Antibody
type
Company
14476-1 UPF1-1
10108-1-
1M1/1C13-
2_130510
DEPGSSYVKE Mouse IgG
Monoclonal
Powder Abmart
Inc
14476-1 UPF1-3
10108-1-
7M1/7D17-
11_130619
AAPYSQHPMP Mouse IgG
Monoclonal
Powder Abmart
Inc
14476-1 UPF1-
16
10108-1-
7M1/7B12-
12_121120
KPGIDSEPAH Mouse IgG
Monoclonal
Powder Abmart
Inc

145
Figure 4.14 Western blot analysis of the first batch of purified UPF1 antibody detected
endogenous UPF1 as well as GFP-tagged UPF1
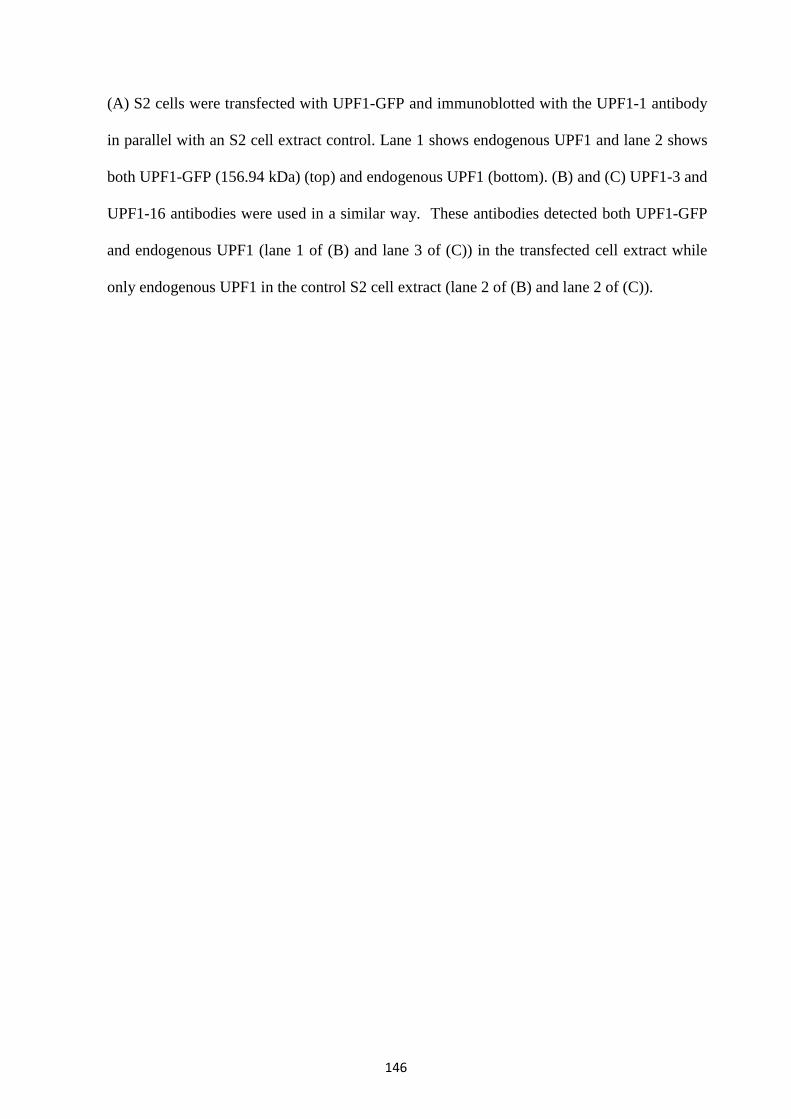
146
(A) S2 cells were transfected with UPF1-GFP and immunoblotted with the UPF1-1 antibody
in parallel with an S2 cell extract control. Lane 1 shows endogenous UPF1 and lane 2 shows
both UPF1-GFP (156.94 kDa) (top) and endogenous UPF1 (bottom). (B) and (C) UPF1-3 and
UPF1-16 antibodies were used in a similar way. These antibodies detected both UPF1-GFP
and endogenous UPF1 (lane 1 of (B) and lane 3 of (C)) in the transfected cell extract while
only endogenous UPF1 in the control S2 cell extract (lane 2 of (B) and lane 2 of (C)).
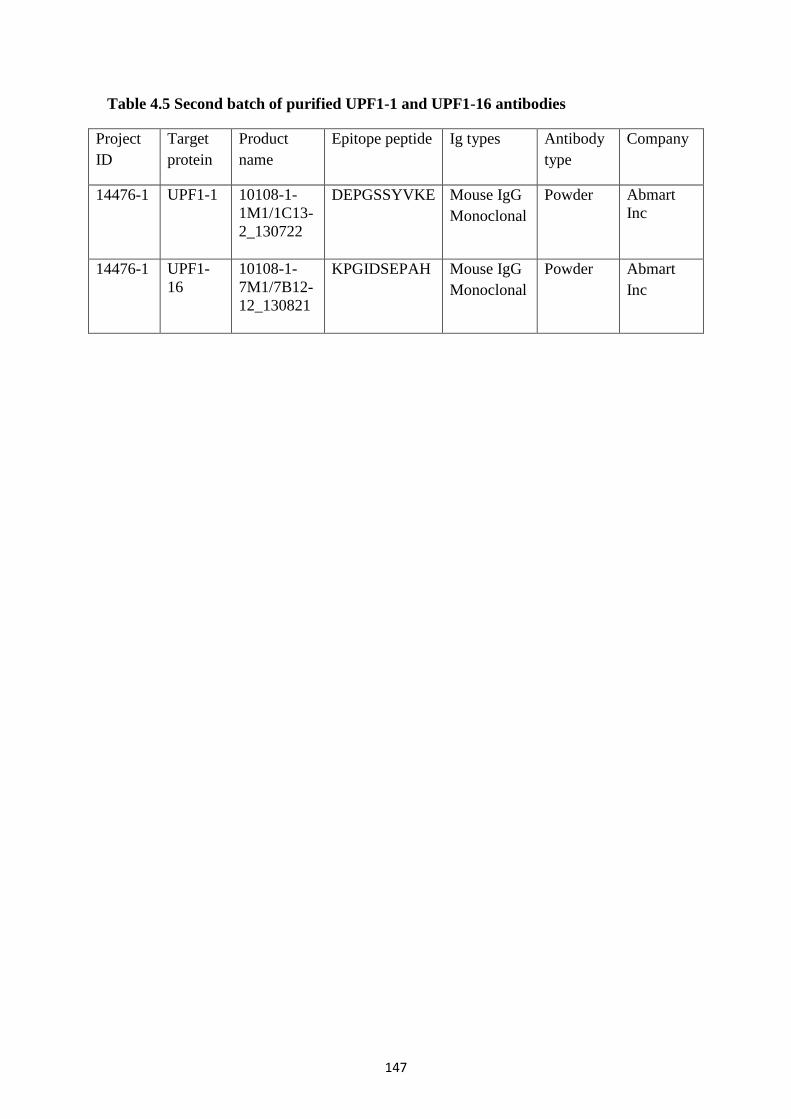
147
Table 4.5 Second batch of purified UPF1-1 and UPF1-16 antibodies
Project
ID
Target
protein
Product
name
Epitope peptide Ig types Antibody
type
Company
14476-1 UPF1-1
10108-1-
1M1/1C13-
2_130722
DEPGSSYVKE Mouse IgG
Monoclonal
Powder Abmart
Inc
14476-1 UPF1-
16
10108-1-
7M1/7B12-
12_130821
KPGIDSEPAH Mouse IgG
Monoclonal
Powder Abmart
Inc

148
Figure 4.15 Western blot analysis of the second batch of purified UPF1 antibodies
showed detection of both endogenous UPF1 and UPF1-GFP
(A) S2 cells were transfected with UPF1-GFP and immunoblotted with UPF1-1 and UPF1-16
antibodies in parallel with a control S2 cell extract. The Western blot with UPF1-16 antibody
showed detection of both endogenous UPF1 and UPF1-GFP in lane 1, while only endogenous
UPF1 in lane 2 (control). Immunoblot with UPF1-1 antibody detected UPF1-GFP in lane 3
but was unable to detect endogenous UPF1 in both lanes 3 and 4 (control).

149
4.2.13 UPF1 associates with most of the transcription sites of polytene chromosomes
The core NMD factor UPF1 not only functions in the cytoplasm to degrade PTC-containing
mRNAs, but also has a nuclear role in telomere maintenance and cell cycle progression in
mammalian cells. Here, I used a similar approach to that used for investigation of EJC
proteins, to visualize UPF1 at transcription sites, using the antibodies we developed. To
visualize the UPF1 protein at transcription sites, indirect immunostaining was carried out
with all three available antibodies: UPF1-1, UPF1-3, and UPF1-16. Staining with the UPF1-3
and UPF1-16 antibodies showed a clear signal at polytene chromosomes (Figure 4.16). The
signal is more specific to interband loci (transcriptionally active regions). Notably, the UPF1
signal was present at most of the transcription sites and counterstaining with DAPI showed a
weak signal at the interbands. Both the UPF1-3 and UPF1-16 antibodies show similar
patterns. Unfortunately, UPF1-1 did not show a clear signal around the chromosome (data
not shown). The data from these results suggest that UPF1 associates with transcription sites
of the polytene chromosome. I proceeded with using UPF1-3 and UPF1-16 for further
experiments.

150
Figure 4.16 UPF1 associated with transcription sites of Drosophila polytene
chromosome.
(A) Indirect immunostaining with the UPF1-16 antibody shows UPF1 recruitment at
interband positions (top panel in red). The arrow indicates the nucleolus. DAPI is used to
stain the banded regions of the chromosome (middle panel). The UPF1 signal is much clearer
in the merged channel (right panel). (B) Indirect immunostaining with the UPF1-3 antibody,
shows a similar pattern at interband regions as UPF1-16. Middle panel shows DAPI staining
while the right panel is the merged image. UPF1 is detected using a Cy3 conjugated

151
secondary antibody. Micrographs were taken using an epifluorescence microscope with a
40X objective.
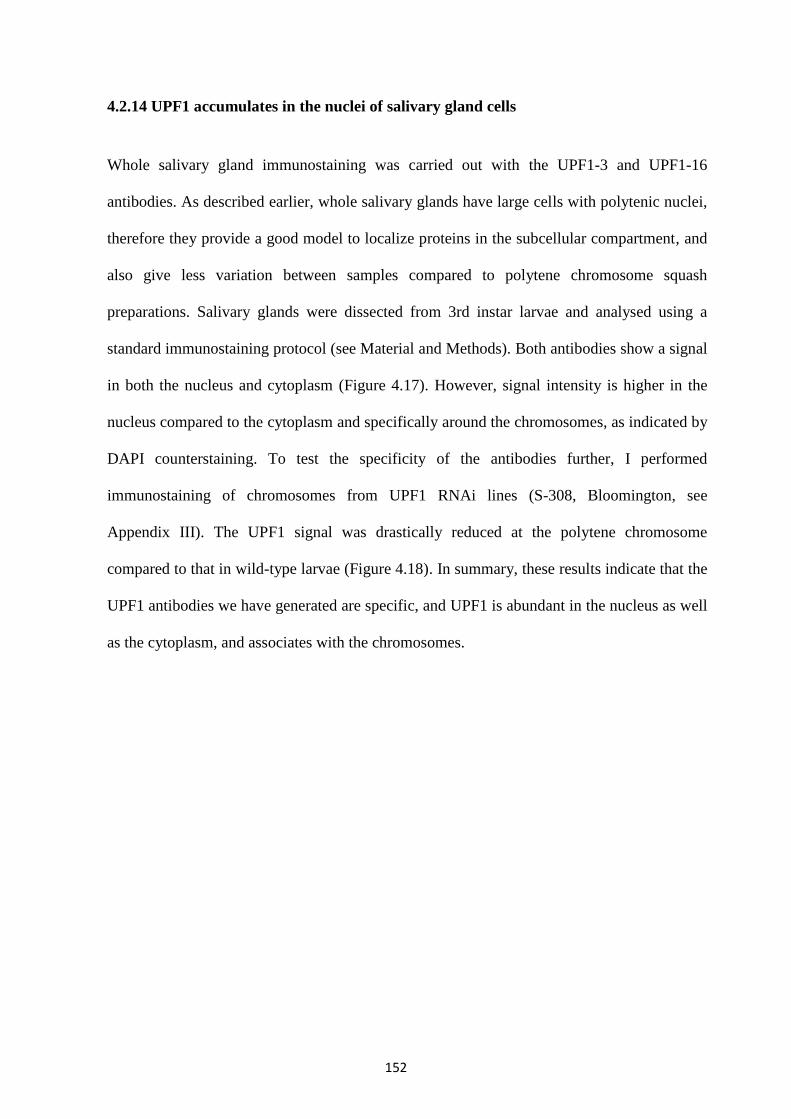
152
4.2.14 UPF1 accumulates in the nuclei of salivary gland cells
Whole salivary gland immunostaining was carried out with the UPF1-3 and UPF1-16
antibodies. As described earlier, whole salivary glands have large cells with polytenic nuclei,
therefore they provide a good model to localize proteins in the subcellular compartment, and
also give less variation between samples compared to polytene chromosome squash
preparations. Salivary glands were dissected from 3rd instar larvae and analysed using a
standard immunostaining protocol (see Material and Methods). Both antibodies show a signal
in both the nucleus and cytoplasm (Figure 4.17). However, signal intensity is higher in the
nucleus compared to the cytoplasm and specifically around the chromosomes, as indicated by
DAPI counterstaining. To test the specificity of the antibodies further, I performed
immunostaining of chromosomes from UPF1 RNAi lines (S-308, Bloomington, see
Appendix III). The UPF1 signal was drastically reduced at the polytene chromosome
compared to that in wild-type larvae (Figure 4.18). In summary, these results indicate that the
UPF1 antibodies we have generated are specific, and UPF1 is abundant in the nucleus as well
as the cytoplasm, and associates with the chromosomes.
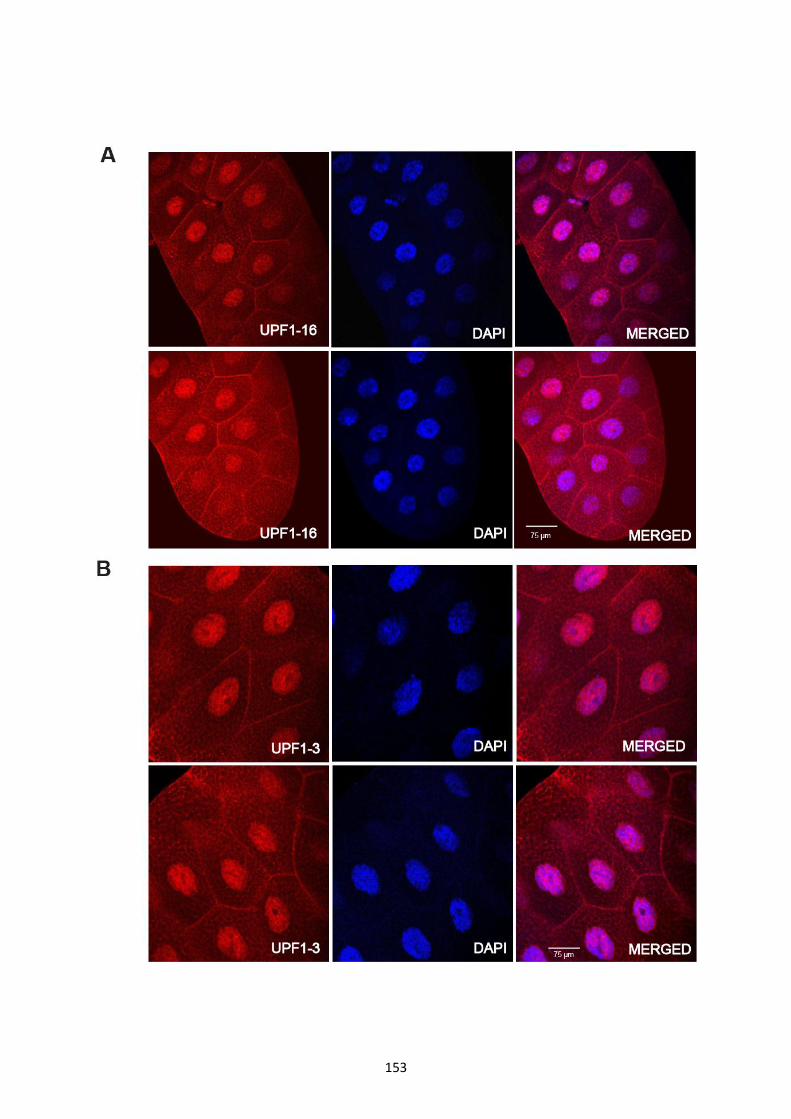
153

154
Figure 4.17 Visualization of UPF1 in whole salivary glands
(A) Confocal image of whole salivary glands stained with UPF1-16 showed a UPF1 signal in
both the cytoplasm and the nucleus. The signal is much more intense in the nucleus compared
to the cytoplasm, as also observed in the polytene chromosomes. The middle panel shows
DAPI staining while the right panel is the merged image. (B) A similar signalling pattern was
also observed by staining with the UPF1-3 antibody. Cy3 conjugated secondary antibody was
used to detect UPF1.
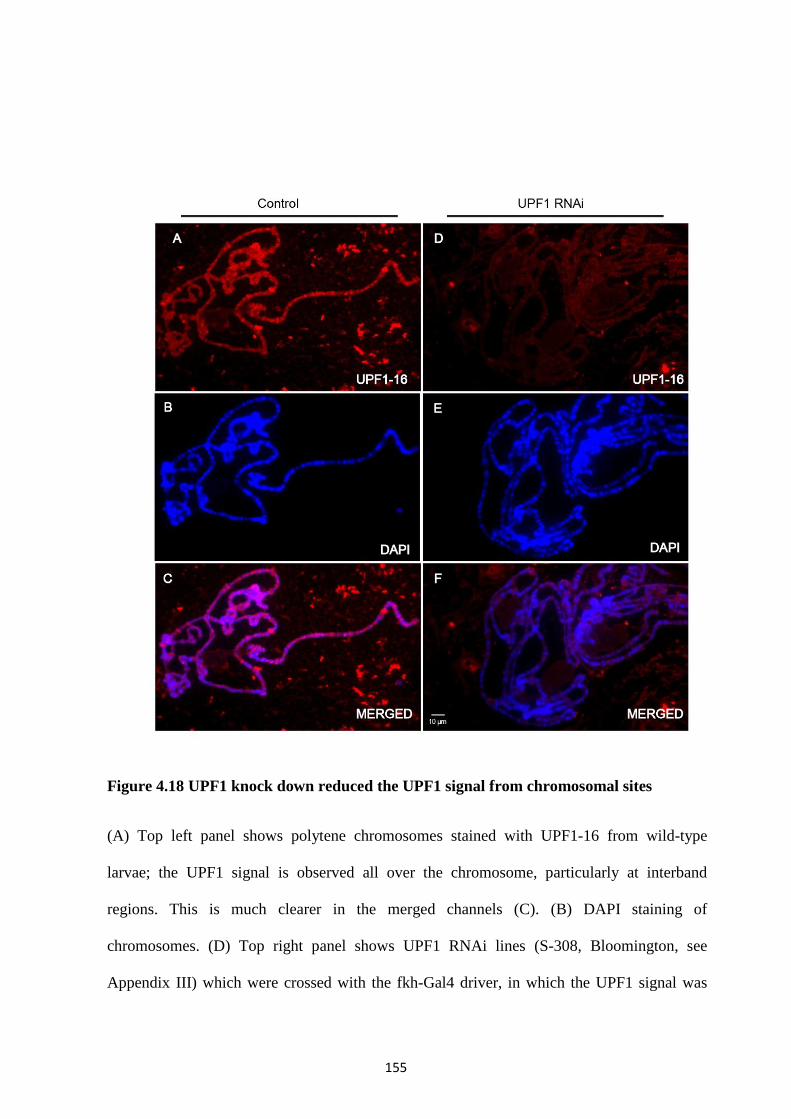
155
Figure 4.18 UPF1 knock down reduced the UPF1 signal from chromosomal sites
(A) Top left panel shows polytene chromosomes stained with UPF1-16 from wild-type
larvae; the UPF1 signal is observed all over the chromosome, particularly at interband
regions. This is much clearer in the merged channels (C). (B) DAPI staining of
chromosomes. (D) Top right panel shows UPF1 RNAi lines (S-308, Bloomington, see
Appendix III) which were crossed with the fkh-Gal4 driver, in which the UPF1 signal was

156
reduced from the chromosomal sites. (E) Middle panels show DAPI staining. (F) The UPF1
signal is more evident in the merged channel.
157
4.3 Discussion
Observations from the NMD field indicate that premature translation termination codons
(PTCs) can be recognised while the transcript is still in the nucleus. NMD is a translation
dependent process, and ribosomes are the only machinery able to scan the mRNA to
recognize the PTC. If NMD were to take place in the nucleus, the expectation is that
functional ribosomes and NMD factors will also be present in order for this scanning and
PTC recognition to take place. Ribosomal proteins constitute an essential part of the ribosome
and are also important for viability of all cell types. Therefore, I decided that a good starting
point would be to localize tagged ribosomal proteins and their recruitment at transcription
sites of the Drosophila polytene chromosome. Consistent with this view, here I report that
analysis of several yellow fluorescent protein (YFP) -tagged ribosomal protein transgenic
Drosophila lines, indicates that ribosomal proteins (RPs) accumulate in both the cytoplasm
and the nucleus, specifically YFP-tagged RpL41. Moreover, the association of YFP-tagged
RpL41 at transcription sites on polytene chromosomes further confirms their presence at
these sites, which is consistent with that previously reported (Brogna et al., 2002). This result
is also consistent with our report that several other fluorescently tagged ribosomal proteins
are present at transcription sites in Drosophila polytene chromosomes (Rugjee et al., 2013).
Although, it possible that the tagged ribosomal proteins observed are in a free state, and not
incorporated into ribosomal subunits, my observations support the earlier conclusion that RPs
might be recruited in the form of complexes at transcription sites (Brogna et al., 2002). The
accumulation of YFP-tagged RpL41 in the nucleus, with the characteristic of nucleolar
enrichment, and presence at transcription sites imply that these tagged RPs can be
incorporated into ribosomes.

158
To assess whether there are translating ribosomes at these sites more directly, I applied the
recently developed ribopuromycylation technique (David et al., 2012). The results of these
experiments show puromycin incorporation at interband positions of highly transcribed
regions of Drosophila polytene chromosomes. The puromycin signal seems to be
transcription dependent, as RNase treatment depletes most of the signal from these
transcription sites. In addition, puromycylation was also observed in intact salivary glands,
mainly in the cytoplasm and nucleolus of smaller cells, and puromycylated peptides were
observed around the chromosomes in larger cells. As reported earlier, following treatment
with translation inhibitor drugs such as harringtonine, the signal appears to be drastically
reduced, which suggests that the puromycin signal is translation-dependent, as previously
concluded in mammalian cells by David et al 2012. These observations further suggest the
presence of functional 80S ribosomes at these sites, providing additional evidence to support
the possibility that PTC recognition can occur while the transcript is still nascent and that
NMD may occur at the sites of transcription on newly synthesized mRNAs. Moreover, the
observation that UPF1 is present at most of the transcription sites further strengthens the
argument that NMD can occur in the nucleus. Future studies will have to investigate this
further, and also test the alternative possibility that UPF1 is performing some other functions
at transcription sites which could be unrelated to NMD. In addition, the antibodies we
produced can be used for other experiments aimed at understanding how these protein
function at the transcription sites.

159
Chapter 5
5.0 Visualization of co-transcriptional pre-mRNA splicing on polytene chromosomes of
salivary glands
5.1 Summary
As reviewed in the Introduction, the coupling between transcription and pre-mRNA splicing
is an essential step of gene expression. Co-transcriptional splicing is the process in which
introns are spliced out of the nascent pre-mRNA that is still attached to the RNA polymerase.
This coupling between transcription and pre-mRNA splicing is important in splice site
selection. Here I describe the development of an experimental system that allows
visualization of pre-mRNA splicing and mRNP assembly directly at transcription sites. This
system uses reporter constructs based on the medfly Ceratitis capitata Adh gene, which is
evolutionarily distantly related to Drosophila melanogaster. The first reporter construct
(which was available in the Dr. Brogna lab) produces an mRNA carrying one or more repeats
of the sequence-specific RNA binding sites for protein (MS2) sequence in the 3’ UTR, which
can be visualised by co-expression of fluorescently-tagged MS2 coat protein (MCP) that
binds to the MS2 sequence with high specificity (Weil et al., 2010). The construct, denoted
Adh-MS2 (Figure 5.1) (S-118, see Appendix III) is regulated by an ecdysone response
element (ERE) in the promoter which enables its expression to be induced in the presence of
ecdysone. Ecdysone is a steroidal prohormone whose increase in concentration induces the
expression of protein coding genes. Moreover, this construct is also flanked by lac operator
(lacO) repeats at the 5’end; the addition of the lacO repeats allows visualization of the locus

160
in cells expressing lac repressor tagged with GFP. A similar reporter construct was used to
visualise spliced mRNA in which MS2 sequence was split between the 3’ end of exon 1 and
the 5’ end of exon 2 which was denoted as Adh-split-MS2 (Figure 5.3).
Figure 5.1 Schematic representation of Adh-MS2 reporter constructs. Reporter
construct consists of two coding sequences (exons) of the medfly alcohol dehydrogenase
(Adh) gene separated by an intron and flanked by 3’UTR containing MS2 binding sites. The
promoter is regulated by an ecdysone response element (ERE) which is flanked by lacO
repeats at the 5’ side.
161
5.2 Result
5.2.1 Visualization of nascent RNA in Drosophila salivary glands
To test whether the approach I described above would allow visualisation of nascent mRNA,
I crossed different available strains expressing MCP-GFP (Appendix III) with flies carrying
the reporter construct Adh-MS2. As expected, I observed that MCP-GFP clearly generates a
strong green fluorescence signal in correspondence to a specific interband, which most
probably corresponds to the nascent mRNA of the Adh-MS2 transgene (Figure 5.2).
Although the GFP signal is visible throughout the nucleus, as a result of background
fluorescence, the signal is much stronger in correspondence to a specific interband. This
observation indicates that this reporter can be further used to visualise specific nascent RNAs
and its associated proteins.

162
Figure 5.2 Visualisation of a specific reporter nascent RNA in the nuclei of salivary
glands Left panel shows images of salivary glands from larval progeny of a cross between
the reporter Adh-MS2 (S-118, see Appendix III) and the MCP GFP line flies (S-240, ID
7278, see Appendix III). GFP signal is visualized as a single dot in the nucleus. The signal is
more apparent in the magnified insets of the original image (marked with a white box) in the
right panels. Arrow indicates specific chromosomal position with an intense GFP signal.
However, GFP also accumulates all over the cell and its signal is stronger in the nucleolus
(white arrow). Glands were counterstained with DAPI to stain DNA (middle panel). Bottom
panels show merged channel of both GFP and DAPI. Images were taken using an
epifluorescence microscope equipped with a 40X objective.

163
5.2.2 Versatile gene reporter constructs allow visualisation of splicing
Having demonstrated that the above system allows visualisation of nascent RNA, I wanted to
test whether it’s feasible to specifically visualize spliced mRNA. To visualize spliced mRNA
I used a transgenic line (Dr. Brogna lab, unpublished) carrying the Adh-split-MS2 construct
(Figure 5.3), in which MS2 binding site was split between the end of the first and the
beginning of the second exon. Therefore, a functional MS2 binding site is formed only upon
ligation of the two exons, which can be visualized by co-expressing GFP or RFP-tagged
MS2, as mentioned above. Additionally, the split Adh-MS2 reporter construct is flanked by
ERE promoter at 5’ UTR. This system is therefore expected to be effective in visualizing pre-
mRNA splicing, fluorescently-tagged protein associated with the nascent pre-mRNA and
mRNA.

164
Figure 5.3 Simplified representation of the split Adh-MS2 reporter construct. The
construct consists of Adh coding sequence split into two exons - each exon is flanked with
two halves of the MS2 binding site. The Promoter is regulated by an ecdysone response
element (pERE) at the 5’UTR which is further flanked by 8x lacO repeats.
165
5.2.3 Visualization of pre-mRNA splicing in nuclei of Drosophila salivary glands
To visualize splicing, I examined different Drosophila lines carrying the split-Adh1-MS2
construct (see Appendix III) at different chromosomal locations. I selected the best one by
crossing them with MCP-GFP lines and inspecting which cross had the most defined GFP
signal at the transgenic locus. The best Adh-split-MS2 line was then crossed again with the
MCP-GFP line and salivary glands from 3rd instar larvae were used for in vivo imaging.
Firstly, I examined glands which were not exposed to ecdysone in which, therefore, the
expression of the reporter was not expected. In these glands, only background MCP-GFP
signal was observed all over the cell, with particularly high intensity in the nucleolus (Figure
5.4). Several glands were inspected but no specific chromosomal signal could be detected.
Salivary glands were then treated with 1µM ecdysone for 2.30 h prior to dissection to induce
expression. After ecdysone treatment, a strong signal was observed in correspondence to a
single chromosomal band (Figure 5.4). As demonstrated by the DAPI counterstaining, the
signal is located at an interband on the chromosome. These observations suggest that this
signal is due to the presence of a nascent spliced mRNA at this locus. Thus, this system
allows visualisation of co-transcriptional splicing and studying selective docking of proteins
onto a nascent spliced mRNA.

166
Figure 5.4 Visualisation of co-transcriptional splicing. Adh-split-MS2 line (S-90, see
Appendix III) was crossed with MCP GFP Line (S-240. ID 7278, see Appendix III). The top
left panel shows that there is no prominent chromosomal signal in the absence of ecdysone.
Treatment with ecdysone (bottom panels) results in a prominent band at the chromosomes
(arrow) which is shown clearer in the magnified inset showing a single nucleus. Another
gland is viewed in the bottom right panel, which was similarly treated with ecdysone, as the
one on the left. All images were captured by an epifluorescence microscope with a 40X
objective.

167
5.2.4 Transgene visualisation using lacI-GFP
To facilitate visualization of specific mRNPs in intact nuclei without the need of
chromosome spreading, lacO repeats were added to the reporter gene as described above. To
verify the system, I combined lacI-GFP and MCP-RFP in order to be able to distinguish the
locus and the mRNA signal, respectively (see Materials and Methods). Subsequently, I
crossed the combined lines (lacI-GFP and MCP-RFP) with the one harbouring Adh-MS2
construct. The best line for MCP-RFP among four (see Appendix III), were selected by their
crossing with the Adh-MS2 reporter line. The salivary glands were inspected as before and
the line which produced the strongest MCP-RFP signal, in correspondence to a single
interband (which is more apparent upon ecdysone treatment and most probably corresponds
to the nascent mRNA of the transgene) was selected (Figure 5.5 A). Similarly, the best lacI-
GFP (among three lines, see Appendix III) lines were selected after crossing with Adh-ERE
reporters carrying lacO repeats flanking the transcribed region and the promoter (see
Appendix III). The lacI-GFP lines are regulated by the heat shock promoter. Therefore,
experiments were carried out with or without previous heat shock treatment. In the absence of
heat shock, the signal is apparent at the transgene position (Figure 5.5 B, arrow). Upon heat
shock, the signal becomes more prominent (Figure 5.5 C). The signal clearly located in the
nucleus. These experiments demonstrated that the best lacI-GFP line is S-206, while the best
MCP-RFP line is S-245 (Appendix III).

168

169
Figure 5.5 Visualisation of the transgene using lacI-GFP. (A) Visualization of the Adh-MS2
locus in salivary glands of flies expressing MCP-RFP (S-245, ID-9939, Appendix III). Top left
panel shows weak RFP signal in the nuclei of glands which were not incubated with ecdysone.
Bottom panels show stronger RFP signal in glands incubated with ecdysone. RFP signal at the
putative transgene locus is indicated by the arrow. (B) Control glands in which transgenes were
carrying several lacO repeats (S-133, Appendix III) are visualised by crossing with lacI-GFP
(S-206, Appendix III) without previously being heat shocked. (C) The same as in B except
larvae were heat shocked prior dissection. Middle panels show DAPI staining, while right
panel represents merged channel with DAPI. Micrographs were taken using an epifluorescence
microscope with a 40X objective.

170
5.2.5 Simultaneous visualisation of nascent RNP and transgenic locus
To verify that the MCP-RFP, reporting the nascent RNA, and lacI-GFP signal, reporting the
Adh-MS2 transgene, are indeed co-localising, the strain carrying both lacI-GFP and MCP-
RFP was crossed with the Adh-MS2 reporter carrying strain (Figure 5.1). As expected, the
prominent RFP and GFP signals co-localize in the nucleus (Figure 5.6, arrows). These results
confirm that MS2-RNA signal we detect is in fact at the transgene. Although both GFP and
RFP fluorescence is visible throughout the nucleus, the signal is much stronger in
correspondence to a single band. In summary, the results obtained so far make me confident
that this system can be successfully used to investigate the docking of proteins on the spliced
transcript as well as pre-mRNA processing in vivo.

171

172
Figure 5.6 Simultaneous visualization of the nascent RNA and the transgene locus
Visualisation of both the transgene locus (the Adh-MS2 locus) and its nascent mRNA. LacI-
GFP signal corresponds to the locus (carrying lacO repeats), while MCP-RFP binds to the MS2
repeats in the 3’UTR, therefore, MCP-RFP signal corresponds to the nascent RNA. Both GFP
and RFP signals are detected at the same chromosomal site, denoted by an arrow. DAPI
staining was also carried out in all samples in order to stain DNA. All images were taken using
an epifluorescence microscope with a 40X objective.

173
5.3 Discussion
The physical coupling between transcription and pre-mRNA splicing has been shown to be
important for accurate pre-mRNA splicing. The Pol II CTD may act as a platform for the
localization of the splicing machinery near to the nascent transcript, as well as in helping define
exons among intron sequences by exon tethering (Maniatis and Reed, 2002; Morris and
Greenleaf, 2000). Here I reported that the MS2-GFP system is the most common in vivo
approach to visualizing splicing and localization of mRNA in the cell. This system is based on
the tethering of reporter mRNA with the MS2 sequence which is recognized by the GFP-
tagged MS2 coat protein. Therefore, it is feasible that reporter mRNA can be visualized in the
cell by simultaneously expression of the MS2 coat protein tagged with either RFP or GFP
(Martin et al., 2013; Querido and Chartrand, 2008). The transgenic construct I used allows
detection of specific RNAs, and visualization of DNA loci. The observation from the first
study, based on this principle, shows a strong, clear GFP signal in the nucleus, which
corresponds to the (Adh-MS2) reporter. Although, by using this system also produced some
background fluorescence, but the GFP signal is much stronger in corresponding of a single
fluorescent dot. Therefore, this system allows visualization of nascent mRNA in the cell. The
latter split Adh-MS2 reporter is more complex as it relies on pre-mRNA splicing of the reporter
mRNA which produces a functional MS2 site only after splicing. Observation from my data
indicates that it is feasible to visualize spliced mRNA, as a GFP signal was produced in the
nucleus, corresponding to the split Adh-MS2 reporter. Therefore, this construct provides an
effective model to visualize splicing and spliced mRNA at the same sites. A key feature of all
our reporter genes is that they are flanked by lacO repeats, which allows precise identification
of the locus. Moreover, the reporter gene is also under the control of the ERE promoter, in
which the signal becomes more apparent by treatment with ecdysone. To further verify the
174
GFP or RFP signal corresponds with the transgenic reporter locus would be required for
independent identify the position the Adh-MS2 transgene in the intact nucleus, independent of
the mRNP signal. To allow this, here I also produced a homozygous transgenic line, that
expresses both lacI-GFP and MS2 coat protein MCP-RFP. The MCP-RFP will bind to the MS2
site of the reporter mRNA, which produces the red fluorescence signal, and lacI-GFP will bind
to the LacO repeats corresponding to the locus of Adh-MS2 reporter to give the green
fluorescent signal. As expected, observations of both RFP signals and GFP signals in the
nucleus suggest that the MS2-RNA signal corresponds to the transgenic construct. Based on
the above results, here I visualized co-transcriptional splicing in Drosophila for the first time.
By using this system, future studies should be able to investigate in detail how pre-mRNA
decoration is affected by splicing signals. Unfortunately, due to time constraints, this last stage
of the project could not be initiated, nor I could use this system to visualize how EJC proteins
are recruited at transcription sites and nascent transcripts, or investigate the dependence of this
recruitment on splicing features, such as the presence of introns or intron length. However, the
procedure to complete the experiment may involve using both transgenic lines (intron-
containing and intron-less) and crosses with lacI-GFP lines (described above), then performing
the double immunostaining in the polytene chromosome. The antibody against GFP will
recognize the locus of the reporter transgene an antibody against the endogenous EJC protein
allow us to detect whether the EJC signal is exactly at the same location as the GFP signal. If
the EJC were to bind the transgene, this could provide further evidence that EJC recruitment is
not only splicing-dependent, but also splicing independent.

175
Chapter 6
6.0 Discussion and Conclusion
6.1 Association of eIF4AIII at transcription sites distinct to that of Y14 and MAGO
Current models predict that the EJC binds an mRNA straight after pre-mRNA splicing
(Kataoka et al., 2000; Le Hir et al., 2000a; Le Hir et al., 2000b). The EJC is best known for its
role in NMD, but studies in yeast and Drosophila have concluded that it was not required for
this process. However, EJC proteins are essential for survival in Drosophila and was known to
be involved in mRNA localization. I wanted to understand how it performed this role and since
it is a predominantly co-transcriptional process, I considered that a good starting point would
be to visualise its recruitment at transcription sites of the Drosophila polytene chromosome. I
also wanted to assess whether there are specific features of genes that promote EJC assembly.
My data indicate that the EJC core components Y14, MAGO and eIF4AIII are in fact present
at most transcription sites. Although in mammalian cells EJC core components are localized
primarily in the nucleus (Baguet et al., 2007; Custodio et al., 2004), in Drosophila, these
proteins seem to be equally distributed between the nucleus and the cytoplasm, as observed
from nuclear and cytoplasmic fractionation of S2 cells. Thus the abundance of these proteins
in the cytoplasm is in agreement with an earlier observation that EJC proteins, particularly
the Y14/MAGO heterodimer, are required for localization of oskar mRNA during embryonic
development in Drosophila (Hachet and Ephrussi, 2001). It was reported that Y14/MAGO
formed a tight heterodimer, therefore these two proteins are expected to colocalize at the
same position on the chromosome. As I have demonstrated from chromosome mapping, both
Y14 and MAGO are in fact co-localized precisely at the same loci; this observation is further

176
verified by co-localization of Flag-Y14 with endogenous MAGO and is consistent with the
earlier observation that these two protein form heterodimer. However, recruitment of
eIF4AIII poorly correlates with Y14 and MAGO, as most of the transcription sites associated
with eIF4AIII and this observation most apparent upon colocalization with active Poll II
(PolISer2
) – the antibody (H5) recognises the Ser2 hyperphosporylated CTD of the largest Pol
II subunit, a marker of transcription elongation (Buratowski, 2009; O'Brien et al., 1994).
Additionally, the observation that flag-tagged eIF4AIII is present at most transcription sites,
and was not co-localized with Y14/MAGO, suggests that EJC assembly may not be a
constitutive process in Drosophila. All previous studies reported that EJCs assemble on
maturing mRNAs during splicing, however, it was not clear how it makes contact with the
spliceosome. However, it was recently suggested that one splicing factor, CWC22, interacts
directly with eIF4AIII via its MIF4AG domain, which allows for the splicing-dependent
assembly of EJCs (Alexandrov et al., 2012; Barbosa et al., 2012). Therefore, this raises the
possibility that most of the transcription sites are associated with eIF4AIII and that this
association is independent of Y14 and MAGO.
6.1.1 MAGO is not essential for Y14 association with transcription sites
Although knockdown of eIF4AIII impairs the development of salivary glands and polytene
chromosomes could not be prepared from them, knockdown of either Y14 or MAGO does not
have any phenotypic effects, allowing me to further investigate these proteins in this tissue.
Interestingly, analysis of these glands indicates that Y14 does not require MAGO to associate
with the transcription sites, however, MAGO knockdown reduced that of Y14 at the
chromosomes. Although the Y14 signal was apparently reduced at the chromosomes, however,
the staining pattern around the chromosome remain the same with typical interband staining as
in wild type. This observation indicates an independent function of Y14 that does not require

177
MAGO to associate with the transcription sites. However, the reduced intensity of the Y14
signal might solely be the result of the destabilization of the protein in the absence of MAGO.
Additionally, it was recently reported that Y14 also functions as an inhibitor of mRNA
decapping factor Dcp2 and modulates P body formation (Chuang et al., 2013). These
observations are in further agreement with an earlier study that suggested Y14 functions in an
independent manner that does not involve MAGO. To gain more detailed information about the
role of their heterodimerization, I selectively knocked down Y14, MAGO and eIF4AIII in
Drosophila S2 cells. Notably, and consistent with what was observed with the chromosome
squashes, Y14 knockdown remarkably reduces MAGO recruitment and conversely, MAGO
knockdown, reduces Y14, although not completely. In both cases, eIF4AIII was not visibly
affected by either Y14 or MAGO knockdown, as is consistent with the polytene chromosome
staining. This observation suggests that Y14 and MAGO heterodimerization is required for the
stability of both proteins in vivo. However, Y14/MAGO heterodimerization stabilizes both
proteins, arguing that their function is coupled.
6.1.2 The association of the EJC with transcription sites is splicing independent
All current models predict that the EJC is at transcription sites because it binds to nascent
mRNA or pre-mRNA (Custodio et al., 2004; Le Hir et al., 2000a). Notably, I found that
following treatment with RNase, the EJC signal remain at transcription sites while the signals
from Sm proteins and fluorouridine labelled nascent mRNA were completely diminished.
Therefore, these observations suggest that the EJC core proteins possibly are not recruited to
transcription sites by binding to nascent RNA, but might make RNA-independent secondary
contacts with chromatin or DNA directly. To address EJC binding at transcription sites more
specifically, we carried out ChIP followed by high throughput sequencing (ChIP-seq). ChIP-
seq of Y14 indicates that this protein mostly associates with transcription start sites and the
178
promoter region. These observations suggest that Y14, either individually or as a part of the
EJC, may have a specific role at the promoter region. Moreover, It has been reported by yeast
two-hybrid screening that Y14 directly interact with signal transducer and activator of
transcription 3 (STAT3) (Ohbayashi et al., 2008). STAT3 belongs to STAT protein family and
function as a transcription factor. Therefore, enrichment of Y14 at promoter region might
indicate their function related to transcription sites. It was recently reported that core EJC
factors of the interact with SR proteins (Singh et al., 2012) particularly SRSF2, which is a part
of the 7SK, a complex which activates transcription by binding promoter–proximal nascent
RNA (Ji et al., 2013).
So far, the pre-mRNA splicing is the only process that drives EJC with spliced mRNA.
However, the recent finding concludes the function of pre-EJC that control the splicing of
mapk and other long intron-containing genes which suggest that this complex has also a
nuclear function (Ashton-Beaucage et al., 2010). It has been also proposed that knockdown of
these proteins cause alternative splicing changes in mammalian cells (Wang et al., 2014).
Therefore, these observations further raise the question of how does EJC core regulate splicing,
given that it is deposited only after splicing? My data indicate that EJC core components are
recruited to both intron-containing and intron-less genes. This is most apparent by the analysis
of heat-shock puffs, which clearly show recruitment of EJC components at the intronless gene
loci, 87A and 87C (encoding Hsp70), as well as at 93D which encodes the intron-containing,
non-protein coding gene hsr-ω-n (Lakhotia and Tapadia, 1998). The Y14 ChIP-seq assay also
shows enrichment independent of whether a gene has introns or not. The result from this study
suggests that splicing is not a pre-requisite for binding of the EJC to transcription sites. Instead,
my preliminary observations suggest a transcriptional role for EJC proteins. I observed that
upon knockdown of Y14 and MAGO in S2 cells, the transcript levels of specific ecdysone
inducible genes (75B) was significantly increased compared to the control. This raises the

179
possibility that Y14/MAGO might be function as transcriptional repressors of ecdysone-
induced genes.
6.1.3 Nuclear translation visualized at transcription sites
Although the EJC is not essential for NMD in Drosophila, it has recently been reported that
some introns are able to trigger EJC dependent NMD in Drosophila (Sauliere et al., 2010).
This observation is the first indication that EJC might have a role in NMD in Drosophila as
well. Although NMD is a general phenomenon of cytoplasmic events, there is substantial
evidence indicating that PTC recognition occurs on mRNAs while they are still in the
nucleus. Observing that most transcription sites are associated with EJC, I applied a similar
approach to visualize translation associated factors, ribosomal proteins, ribosomes and NMD
factors at the same sites, since the ribosome is the only machinery able to scan the mRNA for
a PTC during translation.
Ribosomal proteins, together with rRNA make up the large molecular machine that serves as
the site of protein synthesis. Earlier evidence indicates that at least 20 RPs and rRNAs bind to
transcription sites of Drosophila polytene chromosomes (Brogna et al., 2002). Analysis of
several Drosophila endogenously YFP tagged ribosomal proteins, particularly RpL41, show
strong accumulation both in the cytoplasm and nucleus. Additionally, native polytene
chromosome staining further confirmed their association at transcription sites. This
observation is consistent with the fact that fluorescently tagged ribosomal proteins are present
at transcription sites in Drosophila polytene chromosomes (Rugjee et al., 2013). However, it
was earlier reported that RPs have extra-ribosomal functions and some of the RPs regulate
their own expression by binding to their pre-mRNA or promoters (Warner and McIntosh,
2009). Therefore, observations of ribosomal proteins at transcription sites does not

180
necessarily confirm their presence as a complete ribosomal subunit at these sites. However, it
might be that they are recruited at these sites as a complex, possibly ribosomal subunits, as
previously proposed (Brogna et al., 2002; De et al., 2011). Additionally, it was recently
reported in yeast that it is possible that these RPs are in ribosomal subunits or other
ribosomal-like complexes (De et al., 2011).
To resolve the issue of whether there are functional ribosomes at transcription sites, I applied
the ribopuromycylation technique (RPM) that was successfully developed to visualize
puromycylated nascent peptides in HeLa cells (David et al., 2012). My observation that
puromycin is incorporated at most transcription sites on the polytene chromosome along with
other data we have published, strongly indicates the presence of translating 80S in the
nucleolus and at transcription sites (Al-Jubran et al., 2013), it has been argued that
puromycylation is an indicator of peptidyl transferase activity, but not necessarily of translation
(Dahlberg and Lund, 2012). Whether RPM can be used to visualise translation needs to be
further investigated.
6.1.4 UPF1 recruitment at transcription sites indicates possible nuclear function
Consistent with the view that translating ribosomes are present at transcription sites, in a
parallel project during my PhD, I found that the NMD factor UPF1 binds to such sites. There
is both direct and indirect evidence showing that proteins involved in NMD are at
transcription sites. Additionally, whole salivary gland staining shows signal both in the
cytoplasm and nucleus. Based on the current NMD model, unlike UPF3, UPF1 is a
cytoplasmic protein and key component of NMD factor. However, from my data, association
of UPF1 at the transcription sites might indicate possible nuclear function. This includes the
observation that nonsense mutation are linked to abnormal polyadenylation of Adh pre-
mRNA in Drosophila (Brogna, 1999). Earlier studies also proposed that NMD thus occurs in

181
the nuclear fraction, or that the scanning of mRNAs occur while they are still associated with
the nucleus before entering into the cytoplasm (Maquat and Carmichael, 2001; Urlaub et al.,
1989). A recent study in mammalian cells also reported enrichment of the NMD factor UPF1
at transcription sites, further supporting the possibility of NMD occurring at the
chromosomes. However, the association of UPF1 with these sites does not necessarily
indicate the occurrence of NMD and therefore that translation is occurring there. There could
be another function which is unrelated to NMD. Moreover, it has been also reported that
UPF1 has a role in the replication of telomeres, which consequently aids in the stability of the
genome (Azzalin, 2012). Therefore, it will be interesting to determine whether UPF1
recruitment at transcription sites occurs either with nascent RNA, DNA or with other
proteins. This is an aspect that should be investigated further in the future to better understand
the function of UPF1 at the chromosomes.
6.1.5 Transgenic reporter constructs provide an effective model to visualize splicing
The association of the EJC at transcription sites does not depend on the specific features of
genes (intron-containing and intron-less), allowing me to further investigate its splicing
independent association by using transgenic reporter constructs. In chapter five, I have
described the experimental system that allows visualization of splicing at the transcription
sites of Drosophila polytene chromosome. I have demonstrated that Adh-MS2 and a split
Adh-MS2 reporter construct containing tagged with MS2 sequence and subsequently crossing
with MCP-GFP or MCP-RFP lines is a preferable method to visualize nascent mRNA and
splicing cotranscriptionally. Further, I also described a system that can be used to confirm
that spliced or nascent MS2-mRNA corresponds to the transgenic reporter construct. MS2-
GFP system considered as an appropriate method to localize and detect the reporter mRNA in
182
the cell and was successfully applied before (Querido and Chartrand, 2008). However, due to
time constraints, this last stage of the project could not be completed. Future works involve
crossing the lacI GFP transgenic lines with both intron containing (Adh-MS2) and intron-less
transgenic reporters (available in Dr. Brogna lab). In parallel, staining of EJC proteins will
allow further investigation of the mechanism of splicing-independent EJC deposition.
However, this system can also be used in the future to investigate how pre-mRNP decoration
is affected by splicing signals or how EJC protein recruitment is affected due to specific
features of genes such as long or short introns.
6.2 Conclusion
My data demonstrate that EJC proteins, particularly eIF4AIII, associate with most of the
transcription sites. However, the association was observed at both intron-containing and
intron-less genes on polytene chromosomes. The binding patterns of Y14 and MAGO are
similar, yet apparently different from that of eIF4AIII. Additionally, the association of EJC
proteins with transcription sites seems to be RNase-insensitive, and that of Y14/MAGO
shows no correlation with splicing markers or with nascent RNA. Chromatin
immunoprecipitation coupled with high-throughput sequencing (ChIP-seq) indicates that the
association of EJC protein peaks at transcription start sites in Drosophila cells. These
observations are inconsistent both with constitutive splicing-dependent EJC deposition and
with eIF4AII forming a stable complex with Y14 and MAGO in Drosophila; instead they
suggest that eIF4AIII and Y14/MAGO have separate splicing-independent roles at
transcription sites. Consistent with this prediction, RNAi of Y14/MAGO altered transcription
induction of ecdysone responsive genes. My study also demonstrates that there are ribosomal
proteins and functional ribosome at transcription sites, which further indicates translation

183
might be occurring at these sites. Although it is not clear yet whether translation at this sites
produces functional proteins, will be an interesting question to investigate in future. I also
observed that UPF1 is recruited at most of the transcription sites, suggesting that NMD can
occur co-transcriptionally. Moreover, the MS2-GFP system I have described also can be used
to study further splicing independent recruitment of EJC protein at transcription sites.

184
References
Abruzzi, K.C., Lacadie, S., and Rosbash, M. (2004). Biochemical analysis of TREX complex
recruitment to intronless and intron-containing yeast genes. EMBO J 23, 2620-2631.
Adelman, K., and Lis, J.T. (2012). Promoter-proximal pausing of RNA polymerase II:
emerging roles in metazoans. Nature reviews Genetics 13, 720-731.
Al-Jubran, K., Wen, J., Abdullahi, A., Roy Chaudhury, S., Li, M., Ramanathan, P., Matina,
A., De, S., Piechocki, K., Rugjee, K.N., et al. (2013). Visualization of the joining of
ribosomal subunits reveals the presence of 80S ribosomes in the nucleus. RNA 19, 1669-
1683.
Alexander, R.D., Innocente, S.A., Barrass, J.D., and Beggs, J.D. (2010). Splicing-dependent
RNA polymerase pausing in yeast. Molecular cell 40, 582-593.
Alexandrov, A., Colognori, D., Shu, M.D., and Steitz, J.A. (2012). Human spliceosomal
protein CWC22 plays a role in coupling splicing to exon junction complex deposition and
nonsense-mediated decay. Proc Natl Acad Sci U S A 109, 21313-21318.
Amrani, N., Ganesan, R., Kervestin, S., Mangus, D.A., Ghosh, S., and Jacobson, A. (2004).
A faux 3'-UTR promotes aberrant termination and triggers nonsense-mediated mRNA decay.
Nature 432, 112-118.
Ashton-Beaucage, D., Udell, C.M., Lavoie, H., Baril, C., Lefrancois, M., Chagnon, P.,
Gendron, P., Caron-Lizotte, O., Bonneil, E., Thibault, P., et al. (2010). The exon junction
complex controls the splicing of MAPK and other long intron-containing transcripts in
Drosophila. Cell 143, 251-262.
Azzalin, C.M. (2012). UPF1: a leader at the end of chromosomes. Nucleus 3, 16-21.
Baguet, A., Degot, S., Cougot, N., Bertrand, E., Chenard, M.P., Wendling, C., Kessler, P., Le
Hir, H., Rio, M.C., and Tomasetto, C. (2007). The exon-junction-complex-component
metastatic lymph node 51 functions in stress-granule assembly. J Cell Sci 120, 2774-2784.
Ballut, L., Marchadier, B., Baguet, A., Tomasetto, C., Seraphin, B., and Le Hir, H. (2005).
The exon junction core complex is locked onto RNA by inhibition of eIF4AIII ATPase
activity. Nat Struct Mol Biol 12, 861-869.
Barbosa, I., Haque, N., Fiorini, F., Barrandon, C., Tomasetto, C., Blanchette, M., and Le Hir,
H. (2012). Human CWC22 escorts the helicase eIF4AIII to spliceosomes and promotes exon
junction complex assembly. Nature structural & molecular biology 19, 983-990.
Beelman, C.A., and Parker, R. (1995). Degradation of mRNA in eukaryotes. Cell 81, 179-
183.
Behm-Ansmant, I., Branlant, C., and Motorin, Y. (2007). The Saccharomyces cerevisiae Pus2
protein encoded by YGL063w ORF is a mitochondrial tRNA:Psi27/28-synthase. Rna 13,
1641-1647.

185
Belgrader, P., Cheng, J., Zhou, X., Stephenson, L.S., and Maquat, L.E. (1994). Mammalian
nonsense codons can be cis effectors of nuclear mRNA half-life. Molecular and cellular
biology 14, 8219-8228.
Berget, S.M., Moore, C., and Sharp, P.A. (2000). Spliced segments at the 5' terminus of
adenovirus 2 late mRNA. 1977. Rev Med Virol 10, 356-362; discussion 355-356.
Bessonov, S., Anokhina, M., Krasauskas, A., Golas, M.M., Sander, B., Will, C.L., Urlaub,
H., Stark, H., and Luhrmann, R. (2010). Characterization of purified human Bact
spliceosomal complexes reveals compositional and morphological changes during
spliceosome activation and first step catalysis. Rna 16, 2384-2403.
Beyer, A.L., and Osheim, Y.N. (1988). Splice site selection, rate of splicing, and alternative
splicing on nascent transcripts. Genes & development 2, 754-765.
Biyasheva, A., Do, T.V., Lu, Y., Vaskova, M., and Andres, A.J. (2001). Glue secretion in the
Drosophila salivary gland: a model for steroid-regulated exocytosis. Developmental biology
231, 234-251.
Bono, F., Cook, A.G., Grunwald, M., Ebert, J., and Conti, E. (2010). Nuclear import
mechanism of the EJC component Mago-Y14 revealed by structural studies of importin 13.
Molecular cell 37, 211-222.
Bono, F., Ebert, J., Lorentzen, E., and Conti, E. (2006). The crystal structure of the exon
junction complex reveals how it maintains a stable grip on mRNA. Cell 126, 713-725.
Bono, F., and Gehring, N.H. (2011). Assembly, disassembly and recycling: the dynamics of
exon junction complexes. RNA biology 8, 24-29.
Brodsky, A.S., and Silver, P.A. (2000). Pre-mRNA processing factors are required for
nuclear export. Rna 6, 1737-1749.
Brogna, S. (1999). Nonsense mutations in the alcohol dehydrogenase gene of Drosophila
melanogaster correlate with an abnormal 3' end processing of the corresponding pre-mRNA.
Rna 5, 562-573.
Brogna, S., Sato, T.A., and Rosbash, M. (2002). Ribosome components are associated with
sites of transcription. Mol Cell 10, 93-104.
Buratowski, S. (2009). Progression through the RNA polymerase II CTD cycle. Molecular
cell 36, 541-546.
Burtis, K.C., Thummel, C.S., Jones, C.W., Karim, F.D., and Hogness, D.S. (1990). The
Drosophila 74EF early puff contains E74, a complex ecdysone-inducible gene that encodes
two ets-related proteins. Cell 61, 85-99.
Carrillo Oesterreich, F., Bieberstein, N., and Neugebauer, K.M. (2011). Pause locally, splice
globally. Trends in cell biology 21, 328-335.
Carrillo Oesterreich, F., Preibisch, S., and Neugebauer, K.M. (2010). Global analysis of
nascent RNA reveals transcriptional pausing in terminal exons. Mol Cell, 4, 571-581.

186
Carter, M.S., Li, S., and Wilkinson, M.F. (1996). A splicing-dependent regulatory mechanism
that detects translation signals. EMBO J 15, 5965-5975.
Chang, J.C., and Kan, Y.W. (1979). beta 0 thalassemia, a nonsense mutation in man.
Proceedings of the National Academy of Sciences of the United States of America 76, 2886-
2889.
Chang, W.Y., Winegarden, N.A., Paraiso, J.P., Stevens, M.L., and Westwood, J.T. (2000).
Visualization of nascent transcripts on Drosophila polytene chromosomes using BrUTP
incorporation. BioTechniques 29, 934-936.
Chang, Y.F., Imam, J.S., and Wilkinson, M.F. (2007). The nonsense-mediated decay RNA
surveillance pathway. Annu Rev Biochem 76, 51-74.
Chuang, T.W., Chang, W.L., Lee, K.M., and Tarn, W.Y. (2013). The RNA-binding protein
Y14 inhibits mRNA decapping and modulates processing body formation. Mol Biol Cell 24,
1-13.
Colgan, D.F., and Manley, J.L. (1997). Mechanism and regulation of mRNA
polyadenylation. Genes & development 11, 2755-2766.
Conti, E., and Izaurralde, E. (2005). Nonsense-mediated mRNA decay: molecular insights
and mechanistic variations across species. Current opinion in cell biology 17, 316-325.
Cui, Y., Hagan, K.W., Zhang, S., and Peltz, S.W. (1995). Identification and characterization
of genes that are required for the accelerated degradation of mRNAs containing a premature
translational termination codon. Genes & development 9, 423-436.
Cummins, C.M., Gaber, R.F., Culbertson, M.R., Mann, R., and Fink, G.R. (1980). Frameshift
suppression in Saccharomyces cerevisiae. III. Isolation and genetic properties of group III
suppressors. Genetics 95, 855-879.
Custodio, N., Carvalho, C., Condado, I., Antoniou, M., Blencowe, B.J., and Carmo-Fonseca,
M. (2004). In vivo recruitment of exon junction complex proteins to transcription sites in
mammalian cell nuclei. RNA 10, 622-633.
Dahlberg, J., and Lund, E. (2012). Nuclear translation or nuclear peptidyl transferase?
Nucleus 3, 320-321.
Das, R., Dufu, K., Romney, B., Feldt, M., Elenko, M., and Reed, R. (2006). Functional
coupling of RNAP II transcription to spliceosome assembly. Genes & development 20, 1100-
1109.
David, A., Dolan, B.P., Hickman, H.D., Knowlton, J.J., Clavarino, G., Pierre, P., Bennink,
J.R., and Yewdell, J.W. (2012). Nuclear translation visualized by ribosome-bound nascent
chain puromycylation. The Journal of cell biology 197, 45-57.
de la Mata, M., Lafaille, C., and Kornblihtt, A.R. (2010). First come, first served revisited:
factors affecting the same alternative splicing event have different effects on the relative rates
of intron removal. Rna 16, 904-912.
187
De, S., Varsally, W., Falciani, F., and Brogna, S. (2011). Ribosomal proteins' association
with transcription sites peaks at tRNA genes in Schizosaccharomyces pombe. Rna 17, 1713-
1726.
de Turris, V., Nicholson, P., Orozco, R.Z., Singer, R.H., and Muhlemann, O. (2011).
Cotranscriptional effect of a premature termination codon revealed by live-cell imaging. Rna
17, 2094-2107.
Degot, S., Le Hir, H., Alpy, F., Kedinger, V., Stoll, I., Wendling, C., Seraphin, B., Rio, M.C.,
and Tomasetto, C. (2004). Association of the breast cancer protein MLN51 with the exon
junction complex via its speckle localizer and RNA binding module. J Biol Chem 279,
33702-33715.
Duffy, J.B. (2002). GAL4 system in Drosophila: a fly geneticist's Swiss army knife. Genesis
34, 1-15.
Fribourg, S., Gatfield, D., Izaurralde, E., and Conti, E. (2003). A novel mode of RBD-protein
recognition in the Y14-Mago complex. Nature structural biology 10, 433-439.
Gatfield, D., Unterholzner, L., Ciccarelli, F.D., Bork, P., and Izaurralde, E. (2003). Nonsense-
mediated mRNA decay in Drosophila: at the intersection of the yeast and mammalian
pathways. EMBO J 22, 3960-3970.
Gehring, N.H., Lamprinaki, S., Kulozik, A.E., and Hentze, M.W. (2009). Disassembly of
exon junction complexes by PYM. Cell 137, 536-548.
Ghosh, S., Obrdlik, A., Marchand, V., and Ephrussi, A. (2014). The EJC binding and
dissociating activity of PYM is regulated in Drosophila. PLoS genetics 10, e1004455.
Gornemann, J., Kotovic, K.M., Hujer, K., and Neugebauer, K.M. (2005). Cotranscriptional
spliceosome assembly occurs in a stepwise fashion and requires the cap binding complex.
Molecular cell 19, 53-63.
Hachet, O., and Ephrussi, A. (2001). Drosophila Y14 shuttles to the posterior of the oocyte
and is required for oskar mRNA transport. Current biology : CB 11, 1666-1674.
Hall, S.L., and Padgett, R.A. (1996). Requirement of U12 snRNA for in vivo splicing of a
minor class of eukaryotic nuclear pre-mRNA introns. Science 271, 1716-1718
Hayashi, R., Handler, D., Ish-Horowicz, D., and Brennecke, J. (2014). The exon junction
complex is required for definition and excision of neighboring introns in Drosophila. Genes
& development 28, 1772-1785.
Henderson, K.D., and Andrew, D.J. (2000). Regulation and function of Scr, exd, and hth in
the Drosophila salivary gland. Developmental biology 217, 362-374.
Hochstrasser, M., and Sedat, J.W. (1987). Three-dimensional organization of Drosophila
melanogaster interphase nuclei. I. Tissue-specific aspects of polytene nuclear architecture.
The Journal of cell biology 104, 1455-1470.
Hui, J. (2009). Regulation of mammalian pre-mRNA splicing. Sci China C Life Sci 52, 253-
260.
188
Iborra, F.J., Jackson, D.A., and Cook, P.R. (2001). Coupled transcription and translation
within nuclei of mammalian cells. Science 293, 1139-1142.
Ishigaki, Y., Li, X., Serin, G., and Maquat, L.E. (2001). Evidence for a pioneer round of
mRNA translation: mRNAs subject to nonsense-mediated decay in mammalian cells are
bound by CBP80 and CBP20. Cell 106, 607-617.
Ji, X., Zhou, Y., Pandit, S., Huang, J., Li, H., Lin, C.Y., Xiao, R., Burge, C.B., and Fu, X.D.
(2013). SR proteins collaborate with 7SK and promoter-associated nascent RNA to release
paused polymerase. Cell 153, 855-868.
Johansen, K.M., Cai, W., Deng, H., Bao, X., Zhang, W., Girton, J., and Johansen, J. (2009).
Polytene chromosome squash methods for studying transcription and epigenetic chromatin
modification in Drosophila using antibodies. Methods 48, 387-397.
Kadener, S., Cramer, P., Nogues, G., Cazalla, D., de la Mata, M., Fededa, J.P., Werbajh, S.E.,
Srebrow, A., and Kornblihtt, A.R. (2001). Antagonistic effects of T-Ag and VP16 reveal a
role for RNA pol II elongation on alternative splicing. EMBO J 20, 5759-5768.
Kataoka, N., Yong, J., Kim, V.N., Velazquez, F., Perkinson, R.A., Wang, F., and Dreyfuss,
G. (2000). Pre-mRNA splicing imprints mRNA in the nucleus with a novel RNA-binding
protein that persists in the cytoplasm. Mol Cell 6, 673-682.
Khodor, Y.L., Menet, J.S., Tolan, M., and Rosbash, M. (2012). Cotranscriptional splicing
efficiency differs dramatically between Drosophila and mouse. Rna 18, 2174-2186.
Khodor, Y.L., Rodriguez, J., Abruzzi, K.C., Tang, C.H., Marr, M.T., 2nd, and Rosbash, M.
(2011). Nascent-seq indicates widespread cotranscriptional pre-mRNA splicing in
Drosophila. Genes & development 25, 2502-2512.
Kim, V.N., Kataoka, N., and Dreyfuss, G. (2001). Role of the nonsense-mediated decay
factor hUpf3 in the splicing-dependent exon-exon junction complex. Science 293, 1832-
1836.
Klinge, S., Voigts-Hoffmann, F., Leibundgut, M., and Ban, N. (2012). Atomic structures of
the eukaryotic ribosome. Trends Biochem Sci 37, 189-198.
Lakhotia, S.C., and Tapadia, M.G. (1998). Genetic mapping of the amide response element(s)
of the hsr omega locus of Drosophila melanogaster. Chromosoma 107, 127-135.
Lau, C.K., Diem, M.D., Dreyfuss, G., and Van Duyne, G.D. (2003). Structure of the Y14-
Magoh core of the exon junction complex. Current biology : CB 13, 933-941.
Le Hir, H., Gatfield, D., Izaurralde, E., and Moore, M.J. (2001). The exon-exon junction
complex provides a binding platform for factors involved in mRNA export and nonsense-
mediated mRNA decay. EMBO J 20, 4987-4997.
Le Hir, H., Izaurralde, E., Maquat, L.E., and Moore, M.J. (2000a). The spliceosome deposits
multiple proteins 20-24 nucleotides upstream of mRNA exon-exon junctions. EMBO J 19,
6860-6869.

189
Le Hir, H., Moore, M.J., and Maquat, L.E. (2000b). Pre-mRNA splicing alters mRNP
composition: evidence for stable association of proteins at exon-exon junctions. Genes &
development 14, 1098-1108.
Leeds, P., Peltz, S.W., Jacobson, A., and Culbertson, M.R. (1991). The product of the yeast
UPF1 gene is required for rapid turnover of mRNAs containing a premature translational
termination codon. Genes & development 5, 2303-2314.
Leeds, P., Wood, J.M., Lee, B.S., and Culbertson, M.R. (1992). Gene products that promote
mRNA turnover in Saccharomyces cerevisiae. Molecular and cellular biology 12, 2165-2177.
Lejeune, F., Ishigaki, Y., Li, X., and Maquat, L.E. (2002). The exon junction complex is
detected on CBP80-bound but not eIF4E-bound mRNA in mammalian cells: dynamics of
mRNP remodeling. EMBO J 21, 3536-3545.
LeMaire, M.F., and Thummel, C.S. (1990). Splicing precedes polyadenylation during
Drosophila E74A transcription. Molecular and cellular biology 10, 6059-6063.
Lin, S., and Fu, X.D. (2007). SR proteins and related factors in alternative splicing. Advances
in experimental medicine and biology 623, 107-122.
Lis, J.T., Neckameyer, W., Dubensky, R., and Costlow, N. (1981). Cloning and
characterization of nine heat-shock-induced mRNAs of Drosophila melanogaster. Gene 15,
67-80.
Macchi, P., Kroening, S., Palacios, I.M., Baldassa, S., Grunewald, B., Ambrosino, C.,
Goetze, B., Lupas, A., St Johnston, D., and Kiebler, M. (2003). Barentsz, a new component
of the Staufen-containing ribonucleoprotein particles in mammalian cells, interacts with
Staufen in an RNA-dependent manner. The Journal of neuroscience : the official journal of
the Society for Neuroscience 23, 5778-5788.
Maniatis, T., and Reed, R. (2002). An extensive network of coupling among gene expression
machines. Nature 416, 499-506.
Maquat, L.E., and Carmichael, G.G. (2001). Quality control of mRNA function. Cell 104,
173-176.
Maquat, L.E., Tarn, W.Y., and Isken, O. (2010). The pioneer round of translation: features
and functions. Cell 142, 368-374.
Martin, R.M., Rino, J., Carvalho, C., Kirchhausen, T., and Carmo-Fonseca, M. (2013). Live-
cell visualization of pre-mRNA splicing with single-molecule sensitivity. Cell reports 4,
1144-1155.
Marygold, S.J., Roote, J., Reuter, G., Lambertsson, A., Ashburner, M., Millburn, G.H.,
Harrison, P.M., Yu, Z., Kenmochi, N., Kaufman, T.C., et al. (2007). The ribosomal protein
genes and Minute loci of Drosophila melanogaster. Genome Biol 8, R216.
Matsumoto, K., Wassarman, K.M., and Wolffe, A.P. (1998). Nuclear history of a pre-mRNA
determines the translational activity of cytoplasmic mRNA. EMBO J 17, 2107-2121.

190
Matunis, E.L., Matunis, M.J., and Dreyfuss, G. (1993). Association of individual hnRNP
proteins and snRNPs with nascent transcripts. The Journal of cell biology 121, 219-228.
McCracken, S., Fong, N., Yankulov, K., Ballantyne, S., Pan, G., Greenblatt, J., Patterson,
S.D., Wickens, M., and Bentley, D.L. (1997). The C-terminal domain of RNA polymerase II
couples mRNA processing to transcription. Nature 385, 357-361.
Mohr, S.E., Dillon, S.T., and Boswell, R.E. (2001). The RNA-binding protein Tsunagi
interacts with Mago Nashi to establish polarity and localize oskar mRNA during Drosophila
oogenesis. Genes Dev 15, 2886-2899.
Morin, X., Daneman, R., Zavortink, M., and Chia, W. (2001). A protein trap strategy to
detect GFP-tagged proteins expressed from their endogenous loci in Drosophila. Proc Natl
Acad Sci U S A 98, 15050-15055.
Morris, D.P., and Greenleaf, A.L. (2000). The splicing factor, Prp40, binds the
phosphorylated carboxyl-terminal domain of RNA polymerase II. J Biol Chem 275, 39935-
39943.
Muhlemann, O., Eberle, A.B., Stalder, L., and Zamudio Orozco, R. (2008). Recognition and
elimination of nonsense mRNA. Biochim Biophys Acta 1779, 538-549.
Nathanson, L., Xia, T., and Deutscher, M.P. (2003). Nuclear protein synthesis: a re-
evaluation. Rna 9, 9-13.
Neugebauer, K.M. (2002). On the importance of being co-transcriptional. J Cell Sci 115,
3865-3871.
Nilsen, T.W. (2003). The spliceosome: the most complex macromolecular machine in the
cell? Bioessays 25, 1147-1149.
Nott, A., Le Hir, H., and Moore, M.J. (2004). Splicing enhances translation in mammalian
cells: an additional function of the exon junction complex. Genes Dev 18, 210-222.
O'Brien, T., Hardin, S., Greenleaf, A., and Lis, J.T. (1994). Phosphorylation of RNA
polymerase II C-terminal domain and transcriptional elongation. Nature 370, 75-77.
Ohbayashi, N., Taira, N., Kawakami, S., Togi, S., Sato, N., Ikeda, O., Kamitani, S.,
Muromoto, R., Sekine, Y., and Matsuda, T. (2008). An RNA biding protein, Y14 interacts
with and modulates STAT3 activation. Biochem Biophys Res Commun 372, 475-479.
Palacios, I.M., Gatfield, D., St Johnston, D., and Izaurralde, E. (2004). An eIF4AIII-
containing complex required for mRNA localization and nonsense-mediated mRNA decay.
Nature 427, 753-757.
Parma, D.H., Bennett, P.E., Jr., and Boswell, R.E. (2007). Mago Nashi and Tsunagi/Y14,
respectively, regulate Drosophila germline stem cell differentiation and oocyte specification.
Developmental biology 308, 507-519.

191
Perales, R., and Bentley, D. (2009). "Cotranscriptionality": the transcription elongation
complex as a nexus for nuclear transactions. Molecular cell 36, 178-191.
Perlick, H.A., Medghalchi, S.M., Spencer, F.A., Kendzior, R.J., Jr., and Dietz, H.C. (1996).
Mammalian orthologues of a yeast regulator of nonsense transcript stability. Proceedings of
the National Academy of Sciences of the United States of America 93, 10928-10932.
Peterlin, B.M., and Price, D.H. (2006). Controlling the elongation phase of transcription with
P-TEFb. Molecular cell 23, 297-305.
Phatnani, H.P., and Greenleaf, A.L. (2006). Phosphorylation and functions of the RNA
polymerase II CTD. Genes & development 20, 2922-2936.
Proshkin, S., Rahmouni, A.R., Mironov, A., and Nudler, E. (2010). Cooperation between
translating ribosomes and RNA polymerase in transcription elongation. Science 328, 504-
508.
Querido, E., and Chartrand, P. (2008). Using fluorescent proteins to study mRNA trafficking
in living cells. Methods Cell Biol 85, 273-292.
Roignant, J.Y., and Treisman, J.E. (2010). Exon junction complex subunits are required to
splice Drosophila MAP kinase, a large heterochromatic gene. Cell 143, 238-250.
Rugjee, K.N., Roy Chaudhury, S., Al-Jubran, K., Ramanathan, P., Matina, T., Wen, J., and
Brogna, S. (2013). Fluorescent protein tagging confirms the presence of ribosomal proteins at
Drosophila polytene chromosomes. PeerJ 1, e15.
Ruiz-Echevarria, M.J., Gonzalez, C.I., and Peltz, S.W. (1998). Identifying the right stop:
determining how the surveillance complex recognizes and degrades an aberrant mRNA.
EMBO J 17, 575-589.
Sauliere, J., Haque, N., Harms, S., Barbosa, I., Blanchette, M., and Le Hir, H. (2010). The
exon junction complex differentially marks spliced junctions. Nature structural & molecular
biology 17, 1269-1271.
Sauliere, J., Murigneux, V., Wang, Z., Marquenet, E., Barbosa, I., Le Tonqueze, O., Audic,
Y., Paillard, L., Roest Crollius, H., and Le Hir, H. (2012). CLIP-seq of eIF4AIII reveals
transcriptome-wide mapping of the human exon junction complex. Nature structural &
molecular biology 19, 1124-1131.
Schmid, M., and Jensen, T.H. (2010). Nuclear quality control of RNA polymerase II
transcripts. Wiley interdisciplinary reviews RNA 1, 474-485.
Schneider, I. (1972). Cell lines derived from late embryonic stages of Drosophila
melanogaster. Journal of embryology and experimental morphology 27, 353-365.
Schroder, P.A., and Moore, M.J. (2005). Association of ribosomal proteins with nascent
transcripts in S. cerevisiae. Rna 11, 1521-1529.

192
Segraves, W.A., and Hogness, D.S. (1990). The E75 ecdysone-inducible gene responsible for
the 75B early puff in Drosophila encodes two new members of the steroid receptor
superfamily. Genes & development 4, 204-219.
Sharma, S., Kohlstaedt, L.A., Damianov, A., Rio, D.C., and Black, D.L. (2008).
Polypyrimidine tract binding protein controls the transition from exon definition to an intron
defined spliceosome. Nature structural & molecular biology 15, 183-191.
Shatkin, A.J., and Manley, J.L. (2000). The ends of the affair: capping and polyadenylation.
Nature structural biology 7, 838-842.
Shibuya, T., Tange, T.O., Sonenberg, N., and Moore, M.J. (2004). eIF4AIII binds spliced
mRNA in the exon junction complex and is essential for nonsense-mediated decay. Nature
structural & molecular biology 11, 346-351.
Shuman, S. (2001). Structure, mechanism, and evolution of the mRNA capping apparatus.
Prog Nucleic Acid Res Mol Biol 66, 1-40.
Silver, D.L., Watkins-Chow, D.E., Schreck, K.C., Pierfelice, T.J., Larson, D.M., Burnetti,
A.J., Liaw, H.J., Myung, K., Walsh, C.A., Gaiano, N., et al. (2010). The exon junction
complex component Magoh controls brain size by regulating neural stem cell division.
Nature neuroscience 13, 551-558.
Singh, G., Kucukural, A., Cenik, C., Leszyk, J.D., Shaffer, S.A., Weng, Z., and Moore, M.J.
(2012). The cellular EJC interactome reveals higher-order mRNP structure and an EJC-SR
protein nexus. Cell 151, 750-764.
Steckelberg, A.L., Boehm, V., Gromadzka, A.M., and Gehring, N.H. (2012). CWC22
connects pre-mRNA splicing and exon junction complex assembly. Cell reports 2, 454-461.
Su, A.A., and Randau, L. (2011). A-to-I and C-to-U editing within transfer RNAs.
Biochemistry (Mosc) 76, 932-937.
Tange, T.O., Nott, A., and Moore, M.J. (2004). The ever-increasing complexities of the exon
junction complex. Current opinion in cell biology 16, 279-284.
Truman, J.W., and Riddiford, L.M. (2002). Endocrine insights into the evolution of
metamorphosis in insects. Annu Rev Entomol 47, 467-500.
Tscherne, J.S., and Pestka, S. (1975). Inhibition of protein synthesis in intact HeLa cells.
Antimicrob Agents Chemother 8, 479-487.
Urlaub, G., Mitchell, P.J., Ciudad, C.J., and Chasin, L.A. (1989). Nonsense mutations in the
dihydrofolate reductase gene affect RNA processing. Mol Cell Biol 9, 2868-2880.
Wang, J., Chang, Y.F., Hamilton, J.I., and Wilkinson, M.F. (2002). Nonsense-associated
altered splicing: a frame-dependent response distinct from nonsense-mediated decay.
Molecular cell 10, 951-957.
Wang, Z., Murigneux, V., and Le Hir, H. (2014). Transcriptome-wide modulation of splicing
by the exon junction complex. Genome Biol 15, 551

193
Warner, J.R., and McIntosh, K.B. (2009). How common are extraribosomal functions of
ribosomal proteins? Mol Cell 34, 3-11.
Weil, T.T., Parton, R.M., and Davis, I. (2010). Making the message clear: visualizing mRNA
localization. Trends Cell Biol 20, 380-390.
Wilkinson, M.F., and Shyu, A.B. (2002). RNA surveillance by nuclear scanning? Nat Cell
Biol 4, E144-147.
Will, C.L., and Luhrmann, R. (2001). Spliceosomal UsnRNP biogenesis, structure and
function. Curr Opin Cell Biol 13, 290-301.
Yarmolinsky, M.B., and Haba, G.L. (1959). Inhibition by Puromycin of Amino Acid
Incorporation into Protein. Proc Natl Acad Sci U S A 45, 1721-1729.
Zhang, J., Sun, X., Qian, Y., LaDuca, J.P., and Maquat, L.E. (1998). At least one intron is
required for the nonsense-mediated decay of triosephosphate isomerase mRNA: a possible
link between nuclear splicing and cytoplasmic translation. Molecular and cellular biology 18,
5272-5283.
Zhou, Z., Licklider, L.J., Gygi, S.P., and Reed, R. (2002). Comprehensive proteomic analysis
of the human spliceosome. Nature 419, 182-185.
194
Appendices
Appendix I
Protocol for ChIP
1. Grow the S2 cells in a complete medium for two days to get a 10x106 cells.
2. Started with 10x106 S2 cells.
3. Mix, and add formaldehyde (10%) to 1% v/v final concentration.
4. Incubate at 25⁰C for 15 minutes.
5. Add glycine to 125mM and mix incubate 5 min at 25°C.
6. Centrifuge 3000 rpm/ 835 g (Eppendorf) 5 min at 4°C in a benchtop centrifuge
7. Remove supernatant.
8. Resuspend in 500 µl of 1X PBS + 1X Protease inhibitors (Roche EDTA free mini protease
inhibitor).
9. Repeat 2X.
10. Remove supernatant and store as cell pellet at -80⁰C.
11. The day before the ChIP prepare antibody coated Dynal beads (Protein-G for rabbit IgG).
Resuspend beads by gentle vortexing. Per ChIP prepares 40 µl of beads. Split into two tubes,
25 µl for ChIP (+Ab) and 15 µl for pre-absorb (-Ab). Wash beads in a low-bind tube 4x with
1 ml of 1XPBS, 5mg/ml BSA. Wash the beads in a magnetic rack by moving 6 times each.
Pull-down beads using magnetic rack and discard supernatant completely.
12. After the final wash resuspend the beads in 500 all of 1XPBS, 5mg/ml BSA. Leave
Pre-absorb (-Ab) beads as its. To antibody coated beads add at least 2 µg of antibody.
13. Incubate ChIP (+Ab), and pre-absorb (-Ab) beads overnight at 4⁰C on a

195
Rotator.
14. On the day of the ChIP. Thaw cells on ice. Resuspend cell pellets in 100 µl
Of SDS Lysis Buffer. Sonicate at high intensity for 12 min with 15 Sec on/off.
15. Dilute sample to 1 ml using ChIP dilution buffer.
16. Centrifuge at 13000 rpm/ 15682 g (Eppendorf) for 10 minutes in a microcentrifuge at
18°C (NB. SDS will precipitate at 4⁰C) to the pellet insoluble material.
17. Remove supernatant to a fresh DNA lobind tube.
18. While sonication is being performed, wash ChIP (+Ab), and pre-absorb (-Ab) beads.
Pellet in a magnetic rack and wash with 1 ml of 1XPBS, 5mg/ml BSA 4 times to remove
unbound antibody. During the wash mix it properly by vortex and spin briefly. Resuspend
beads finally in 40 µl of 1 ml of 1XPBS, 5mg/ml BSA.
19. Pre-absorb (-Ab) beads slurry resuspend in a 25 µl of 1 ml of 1XPBS, 5mg/ml BSA. And
add to the soluble chromatin prepared in 17.
20. Incubate 15 min at R.T by using a rotating rotator.
21. Spin briefly and Pellet beads using magnetic rack and transfer cleared supernatant to a
fresh lobind tube.
22. Remove 100 µl of soluble chromatin from 21 to use as input sample. Reserve in a lobind
tube in -20°C.
23. To remaining chromatin add 40 µl ChIP (+Ab) bead slurry from step 18.
24. Incubate 2.30 hrs at room temperature, on a rotator to form immune complexes on beads.
25. Spin briefly and Pull-down beads on magnetic rack and discard supernatant.
26. Wash 5 minutes each on rotating rotor at R.T with 1 ml of the following. During the wash
mix it properly by vortex and spin briefly. Wash the beads in a magnetic rack by moving 6
times each and discard the supernatant.
26.1 Low salt wash-1x

196
26.2 High salt wash-1x
26.3 LiCl wash-1x
27. Then wash twice with 1 ml of TE buffer.
28. Elute protein-DNA complexes by two washes with 75 µl of freshly prepared
1% v/v SDS 0.1M NaHC03 solution. Vortex, spin and then incubate at RT in a rotating rotor
for 15 min. Spin briefly and put on magnetic rack, transfer the supernatant on to new lobind
tubes. Repeat the above process again with 75 µl of elution buffer so the total volume at the
end 150 µl.
29. Combine the elutes.
30. To the input DNA reserved in step 22 add 50 µl of elution buffer (28) to make an equal
volume with chip sample (150 µl).
31. Add protease K to all samples (2 µl of 50 mg/ml) including input and Chip sample and
incubate at 65⁰C on the dry heat block overnight to digest protein and reverse crosslinks.
32. The following morning purifies DNA using AMPure XP beads (both the input and chip
sample). Basically add 1.8volumes of AMPure XP bead slurry to DNA. Mix it properly by
vortexing. Allow Bind for 10 minutes in rotating rotor at RT, spin briefly and then pellet
beads in a magnetic rack and discard the supernatant. Wash 3X with 300 µl of freshly
prepared 70% v/v ethanol, each time vortex, spin it puts on magnetic rack and rotate 6 times
and discard the supernatant. After the final wash, spin it again and put on a magnetic rack to
make sure there is no ethanol. Air-dry in the magnetic stand until the beads are dry and show
visible cracking. Elute DNA using 30 µl of 10 mM Tris (8.0). Transfer elute 3 times into new
lobind tubes by placing in magnetic rack to remove magnetic beads completely.
33. Use DNA in SOLiD library preparation procedure.

197
Standard Protocol for Salivary glands squashing and immunostaining
1. D. melaonogaster larvae were grown at 18⁰C in bottles containing dry yeast.
2. Larvae were collected from bottles and placed in a dissecting glass dish filled with water to
wash and put them on ice to sleep for 5 minutes.
3. Larvae were then dissected in a dissection buffer of 20μl solutions A, using sharp tweezers.
For the fixation, salivary glands were transferred in a 20μl of solution B and kept for 1
minute.
4. Salivary glands were washed in 20μl solutions G for a few seconds and then transfer to
siliconized glass coverslip containing 13μl solutions G. Glands were allowed to incubate in
solution G for 3 minutes.
5. After that frozen end microscopic slide touch on the top of the coverslip and make sure that
liquid evenly spread throughout the coverslip and slide.
6. Salivary glands were first spread with the blunt tip of the brush by tapping a few times on
top of the coverslip. After that folded tissue paper kept on top of coverslip and squashed
vertically using the thumb.
7. Check the spreading of the polytene chromosome by placing under the phase contrast
microscope.
8. The position of the coverslip marked by diamond pencil on both sides of the coverslip and
the sample were freeze on the slide by dipping into liquid nitrogen for 60 seconds.
198
9. Coverslip were removed from the slide using a razor blade and then put in a coplin jar
filled with 95% ethanol and stored at -20°C for next day immunostaining.
10. Next day polytene chromosome spread slides were first washed in a coplin jar with 1X
TBST (150 Mm NaCl, 10 mM Tris-Cl pH 7.0-7.5, 0.05% v/v Tween) two times for 10
minutes each at room temperature.
11.Slides were transferred in a coplin jar filled with blocking solution TBS, 10% Fetal
Bovine Serum (FBS) and 0.05% v/w sodium azide (NaN3) for 30 minutes at room
temperature.
12. Primary antibody diluted (1: 100, depend on the concentration of antibody) with blocking
solution and proceed for immunostaining.
13. 20μl drops of diluted antibody put on the coverslip and the slides were touch on top of the
drop carefully make sure there was no air bubbles between the slide and coverslip.
14. Humid chamber was made by TBS and slides were then placed in a humid chamber and
incubate overnight at 4⁰C.
15. Next day morning slides were removed from the chamber and placed in a beaker with
TBST to displace the coverslip from slide. Slides were then washed with TBST two times 10
minutes each at room temperature.
16. Secondary antibody staining was carried out in a same way as primary antibody but the
dilution of secondary antibody was (1: 250) with blocking solution and incubated at room
temperature for 1 hour in a humid chamber.
17. Slides were first washed with TBST containing DAPI (1: 10,000 dilutions) 0.1 μg /ml to
stain DNA followed by a second wash with TBST for 10 minutes.

199
18. Slides were dried in a room temperature about 20 minutes, and covered with aluminium
foil to protect from light.
19. Once the slides were dried out, a drop of mountaining medium were places on the
coverslip and carefully touch with the dried slides on top of mountaining medium.
20. Slides were now ready to examine in fluorescence microscope or kept at 4⁰C.

200
Appendix II
List of Primers
Code Name Sequence
S38
Y14
RNAi F
TTAATACGACTCACTATAGGGGAGACG
ATGTGTTGGACATTGACA
S39 Y14
RNAi R
TTAATACGACTCACTATAGGGGAGAGA
CGCTTTTCGGACTTTTT
S40 MAGO
RNAi F
TTAATACGACTCACTATAGGGGAGACA
CGGAGGACTTTTACCTAC
S41 MAGO
RNAi R
TTAATACGACTCACTATAGGGGAGAAT
ATGGGCTTGATCTTGAAATG
S42
eIF4AIII
RNAi F
TTAATACGACTCACTATAGGGGAGAGA
CGAATTGACACTGGAAGG
S43 eIF4AIII
RNAi R
TTAATACGACTCACTATAGGGGAGAAG
AATATTAGTTTAGATCAAGTCAG
S50 74EF
Sense
TGGTGCAGGGAATGATAGCCATTG
S51
74EF
Anti-
sense
GGGCACCTTTCTGCATCCGAATTT
S52 75B
Sense
TCGCATCACCTGGCCATTTAGACA
S53 75B
Anti-
Sense
CTGTGAGTTCACCAAGGAGAAGGT
S54
BR-C
Sense
TCTTAAGGAAGGACTGCAGGGACT
S55
BR-C
Anti-
Sense
AGATGGACGACACACAGCACTTCT
S 78 Y14 left
ATTGACAATGCGGAGGAGTTCGAGG
S 79 Y14
Right
CGGTGCTTCGCCTTTTCCTTCAG
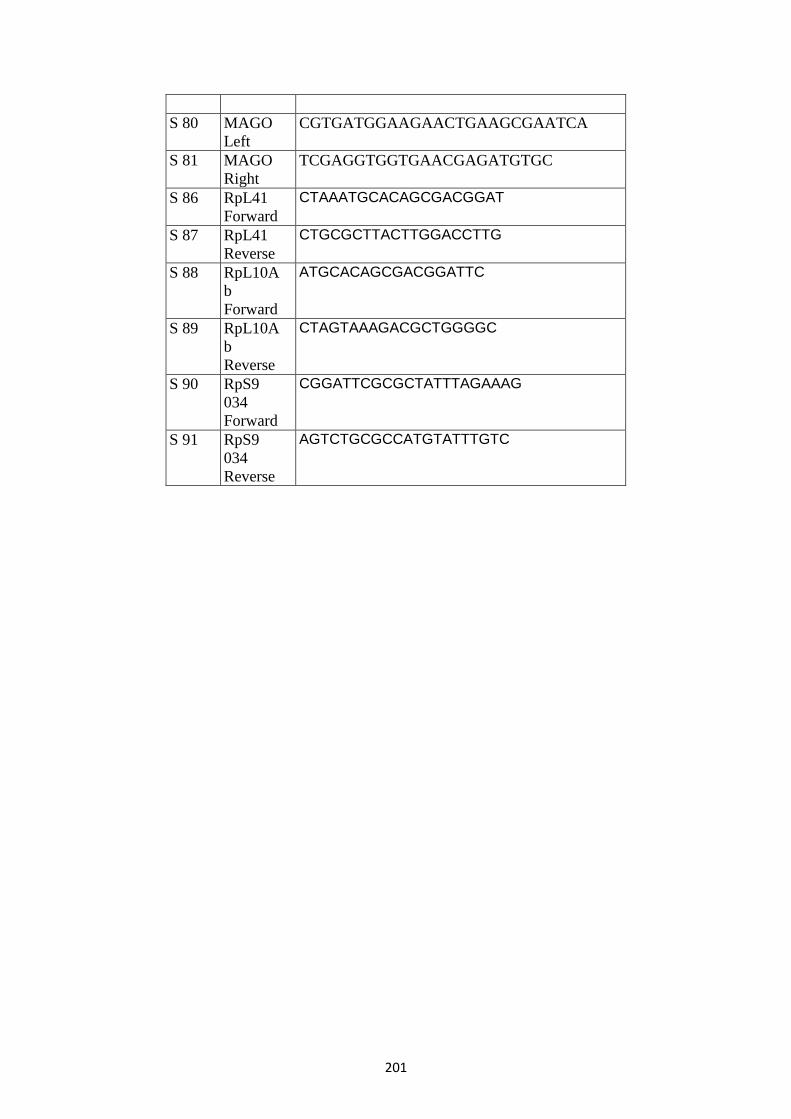
201
S 80
MAGO
Left
CGTGATGGAAGAACTGAAGCGAATCA
S 81
MAGO
Right
TCGAGGTGGTGAACGAGATGTGC
S 86 RpL41
Forward
CTAAATGCACAGCGACGGAT
S 87 RpL41
Reverse
CTGCGCTTACTTGGACCTTG
S 88 RpL10A
b
Forward
ATGCACAGCGACGGATTC
S 89 RpL10A
b
Reverse
CTAGTAAAGACGCTGGGGC
S 90 RpS9
034
Forward
CGGATTCGCGCTATTTAGAAAG
S 91 RpS9
034
Reverse
AGTCTGCGCCATGTATTTGTC

202
Appendix III
List of Fly stocks
ID name Lines Origin
FKH- GAL4 Fork head -GAL4 Brogna Lab
Double Balancer stock
w+; IF; MKRS
Cyo; TM6B
Hidalgo Lab
S-240
MCP-GFP , ID-7278
P{w[+mC]=Hsp83-MCP-
GFP}11, y[1] w[*]
Bloomington Drosophila
Stock Center
S-241
MCP-GFP ID-7279
y[1] w[*]; P{w[+mC]=Hsp83-
MCP-GFP}5A
Bloomington Drosophila
Stock Center
S-242
MCP-GFP ID-7280
y[1] w[*]; P{w[+mC]=Hsp83-
MCP-GFP}3
Bloomington Drosophila
Stock Center
S-243
MCP-RFP ID-27418
y[1] w[*]; P{w[+mC]=UAS-
MCP-RFP}8A
Bloomington Drosophila
Stock Center
S-244
MCP-RFP ID-27419
y[1] w[*]; P{w[+mC]=UAS-
MCP-RFP}12A
Bloomington Drosophila
Stock Center
S-245
MCP-RFP ID-9939
y[1] w[67c23];
P{w[+mC]=Hsp83-MCP-
RFP}12a/TM3, Sb[1]
Bloomington Drosophila
Stock Center
S-246
MCP-RFP ID-9940
y[1] w[67c23];
P{w[+mC]=Hsp83-MCP-
RFP}4a/CyO
Bloomington Drosophila
Stock Center
S-247
RpS9 ID-115034
w[1118]; PBac{602.P.SVS-
1}RpS9[CPTI000493]
DGRC, Kyoto stock
centre
S-249
RPpL41 ID-115344
w[1118]; PBac{754.P.FSVS-
0}RpL41[CPTI002881]
DGRC, Kyoto stock
centre

203
S-250
RpL10Ab ID-115462
w[1118]; PBac{802.P.SVS-
2}RpL10Ab[CPTI003957]
DGRC, Kyoto stock
centre
S-251
RpS9 ID-115504
w[1118]; PBac{602.P.SVS-
1}RpS9[CPTI000785]
DGRC, Kyoto stock
centre
S-253
pUAST-Y14/TM3
8069-14.2- pUAST-Y14/TM3 C-
terminal 2X HA and 2X Flag tag
Marco Blanchette
S-254
pUAST-Y14/TM3
8069-14.3- pUAST-Y14/TM3 C-
terminal 2X HA and 2X Flag tag
Marco Blanchette
S-259
pUAST-eIF4AIII/TM3
8069-13.4- pUAST-
eIF4AIII/TM3 C-terminal 2X
HA and 2X Flag tag
Marco Blanchette
S-260
pUAST-eIF4AIII/TM3
8069-13.5- pUAST-
eIF4AIII/TM3 C-terminal 2X
HA and 2X Flag tag
Marco Blanchette
S-308
Upf1 RNAi
y[1] v[1]; P{y[+t7.7]
v[+t1.8]=TRiP.GL01485}attP2
Bloomington Drosophila
Stock Center
(FBgn0030354)
S-310
Y14 RNAi, ID-36024
(w1118; P{GD14025}v36024)
VDRC RNAi stock centre
S-311
eIF4AIII RNAi, ID-
108580
(P{KK101462}VIE-260B )
VDRC RNAi stock centre
S-252
Mago RNAi, ID-
28132
w[1118]; P{GD12556}v28132
VDRC RNAi stock centre
S-305
Y14 RNAi, ID-36585
y[1] sc[*] v[1]; P{y[+t7.7]
v[+t1.8]=TRiP.GL00545}attP2
Bloomington Drosophila
Stock Center
S-306
Mago RNAi, ID-35453
y[1] sc[*] v[1]; P{y[+t7.7]
v[+t1.8]=TRiP.GL00378}attP2
Bloomington Drosophila
Stock Center
S-307
eIF4AIII RNAi, ID-
32444
y[1] sc[*] v[1]; P{y[+t7.7]
v[+t1.8]=TRiP.HMS00442}attP2
Bloomington Drosophila
Stock Center
S-308 UPF1 RNAi, ID
43144
y[1] v[1]; P{y[+t7.7] v[+t1.8]=TRiP.GL01485}attP2
Bloomington Drosophila

204
Stock Center
lac O (S-133) P [W+= Lac O repeat] (E2)
Brogna Lab
lac I-GFP (S-205) 6(4.1)/CyO hsp83::Gfp-lacI J.Vasquez
Lac I-GFP (S-206) 6(4:1)/ Cyo hsp83.GFP-lac I J.Vasquez
MIN-4 (S-118) ERE-Adh1-MS2 Brogna Lab
Split MS2 (S-90) ERE-Adh1-split MS2 (K15-M7) Brogna Lab

205
Appendix IV
List of plasmid
Name Description Origin
UPF1-GFP (B 306) pAGW.N-termGFP.UPF1 Brogna lab
FLAG/HA-Y14 pUAST-attB-Y14-2XHF Marco Blanchette
FLAG/HA-eIF4AIII pUAST-attB-eIF4A3-2XHF Marco Blanchette

206
Appendix V
DNA sequencing and BLAT search were matched with tagging construct of RpL41-YFP
and RpL10Ab-YFP and RpS9-YFP (034)
RpL41 (DNA sequence)
ANCATATTTCNGAATGCATGCGTCAATTTTACGCAGACTATCTTTCTAGGGTTAAACGCGAGTGAA
CAACAACTAACAGTGATTTTTATCGTTTGCAGTGGCGTAAGAAGCGTATGCGTAGGTTGAAGCGTA
AGCGCAGAAAGATGCGTGCAAGGTCCAAGTAAGCGCAG
BLAST

207
RpL10Ab (DNA sequence)
GCATGCGNCATTTTACGCAGACTATCTTTCTAGGGTTAATATGTAAAAGAAAGCAACTAAACATTG
GGTACATTAATGAAATTTGAATTCTAAGCGATCCTGTGATCAGTGGCAATCAGAAACCAGCTTTTT
AGACCTTTTCCATGTCCATATCAGTTTGGAAATGATTGCAAAAGAAAAACGTGGTTTTATGTGCCA
AATAAGCAACTAATATGTGGGCTGCCTTCATTTGCGCATTAGTCCGACAGTCAAAAAAAGATAAA
CAGCCAATGCTTGCAGTGTTCATTTGCCTTCCATTTGTTTGATAATTGGTTCAATCTTGCAGGTCGA
AGGTTTCGCGTGATACGCTGTATGAGGGCGTCAATGGACTCCTGGAGGCTTCGGCGAAGAAGAAG
CGCGGCTTCCTCGAGACGGTGGAACTGCAGATCGGCCTGAAGAACTACGATCCCCAGAAGGACAA
GCGTTTCTCCGGCACCGTCAAGTACGTTGGCTAAGTCACCTGCGCACGTGCTTGGATAGAAGCTCC
CATGGGAGTTGAGTTCATCACGTCATCAGGTAGTCGAGGACATGTGGCTGTCACATCTCGACGGAC
CTGCACTCAGGGTCTTTAAAATTTGAGTAGGTCTCCAGCAATGGACACCGAACCCCCATTTTCTTA
ATAACTATGAAAACGTGCTCCTCTGAGAGCCTTGTAAGTTTTCCATGAGGCCCCACTTATATCTAC
ATCTATTTGAATCCACAAAGCACTGGCTAATTTATGGTTACTTTCTTGTCATCCCACAGGTTGAAGC
ACATTCCTCGTCCCAAGATGAAGGTGTGCATCCTTGGCGATCAGCAGCATTGCGACGAAGCCAAG
GCCAACAACGTCGACNTCATGGATGCCGAGGCTCTGAAGAAGCTGAACAAGAACAAGAAGCTGGT
GAAGAAGCTGGCCAAGTCCTATGATGCCTTCCTGGCCTCTGAGTCGCTGATCAAGCAGATTCCTCG
TTTGCTTGGCCCTGGCTTGAACAAGGCCGGCAAGTTCCCTGCCCTGCTGTCGCATCAGGAGTCTAT
GATTGGCAAGATCGANGNGGTTAAGTCGACCATCAAGTTCCAGATGAANAAGGTGCTCTGCCTGT
CCGTCGCCGTCGGCCACGTTGGCATGAAGTCCGANNANCTTGCCCAAAACGTCAACTTGTCGATCA
ACTTCTTNGGTGTCCCNTT
BLAST

208
RpS9 (034) (DNA sequence)
GCGTCATTTNANGCAGACTATCTTTCTAGGGTTAAATGTCTAGACAGTATGTATATGCGAAGGAAG
TTCGACTGCATAATCCAATTAGTTGCCCTGACCTGATGAACTGTATTAAAAAATATATTCTGACAC
TTCTTGTCTGATAAAATACGTTGACGTTAACAAATACACACTGAAGAGAATTCTTCGCTAGAACTA
GCGATTGCATTTTGAAACTTCCATTGATTGTGTACCCATTTTACCCACAGGTAATGCCCTGCTGCGC
CGTCTGGTCCGTATCGGTGTCCTGGACGAGTCCCGCATGAAGCTCGATTACGTGCTGGGTCTGAAG
ATTGAGGACTTCTTGGAGCGTCGTCTGCAGACGCAGGTGTTCAAGCTGGGACTTGCCAAGTCCATC
CATCATGCTCGCGTCCTGATCCGTCAGCGTCACATTCGGTAAATATCGCTTGGACAGGCGACAACA
TCGTCGCCAGGCTCTCTCAGATATAAACTCTGTTCTGTTCAGTAAGACCACTTGGGAGTCGAACAG
GCGCCAATGCTTGTACCGACTCTCAACGTCTGTAGATTGCGCATGTGACTCCGTTCACACCAATCG
AAAATGCAAAATGCCCGCCTAGCGTAAGTTGCACTGAACGTTTTTTGTTGAACCCAACATACATAG
CAGCCACCATTCCGATGGTTATCATAAAGCAGAGCTTAACTAATCCAAATATGGTGTTCTTCTTCC
GTTTGTTTTCACAGTGTCCGCAAGCAGGTGGTCAACATCCCGTCGTTCGTCGTGCGCCTGGACTCCC
AGAAGCACATCGACTTCTCCCTGAAGTCGCCCTTCGGCGGCGGCCGTCCCGGTCGCGTCAAGAGG
AAGAACCTGAAGAAGAACCAGGGCGGTGGCGGTGGAGCTGCTGAAGAGGAGGAGGACTAAGCAG
TGGTAGCCAGCTGTAGCCAAGACAA
BLAST
209
Appendix VI
None of the UPF2 monoclonal antibodies could recognize UPF2 protein by Western
blotting
The 15 ascites samples corresponding to hybridoma against the 12 UPF2 epitopes (see
Appendix VII (B) for the list of all ascites and clone ID number) were tested by Western
blotting as before. Unlike for the UPF1 antibodies, none of the ascites samples detected a
band of the size expected for UPF2, and some give extensive background (see figure below).
All clones were renamed to distinguish from each other like UPF1 based on their lane
number in Western blot from UPF2-1 to UPF2-15. It was therefore decided not to proceed
with UPF2 with further purification or testing.

210
Western blot of S2 cell extract to test the specificity of each clone correspond to
endogenous UPF2
(A) & (B) S2 cell extract immunoblot with UPF2-1 to UPF2-15 ascites, in which none of the
clones able to detect the right molecular size (140.08 kDa) against the endogenous UPF2. All
the ascites shows much background signal in the Western blot.
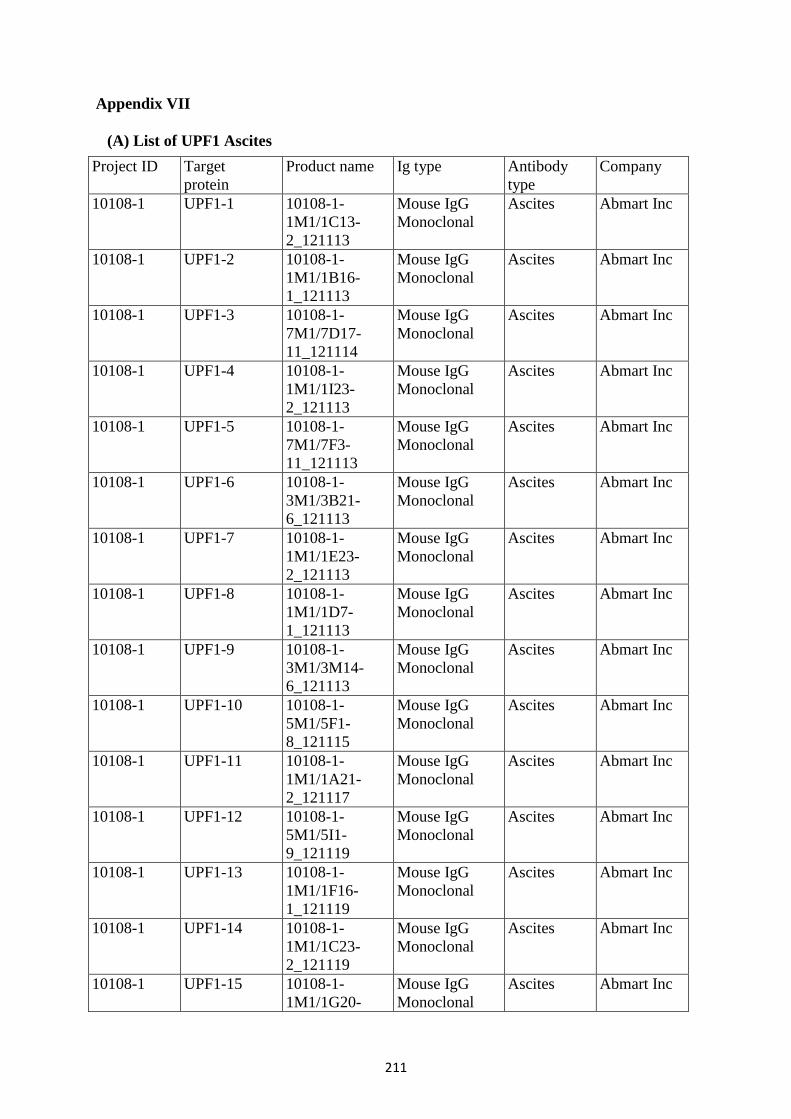
211
Appendix VII
(A) List of UPF1 Ascites
Project ID Target
protein
Product name Ig type Antibody
type
Company
10108-1 UPF1-1 10108-1-
1M1/1C13-
2_121113
Mouse IgG
Monoclonal
Ascites Abmart Inc
10108-1 UPF1-2 10108-1-
1M1/1B16-
1_121113
Mouse IgG
Monoclonal
Ascites Abmart Inc
10108-1 UPF1-3 10108-1-
7M1/7D17-
11_121114
Mouse IgG
Monoclonal
Ascites Abmart Inc
10108-1 UPF1-4 10108-1-
1M1/1I23-
2_121113
Mouse IgG
Monoclonal
Ascites Abmart Inc
10108-1 UPF1-5 10108-1-
7M1/7F3-
11_121113
Mouse IgG
Monoclonal
Ascites Abmart Inc
10108-1 UPF1-6 10108-1-
3M1/3B21-
6_121113
Mouse IgG
Monoclonal
Ascites Abmart Inc
10108-1 UPF1-7 10108-1-
1M1/1E23-
2_121113
Mouse IgG
Monoclonal
Ascites Abmart Inc
10108-1 UPF1-8 10108-1-
1M1/1D7-
1_121113
Mouse IgG
Monoclonal
Ascites Abmart Inc
10108-1 UPF1-9 10108-1-
3M1/3M14-
6_121113
Mouse IgG
Monoclonal
Ascites Abmart Inc
10108-1 UPF1-10 10108-1-
5M1/5F1-
8_121115
Mouse IgG
Monoclonal
Ascites Abmart Inc
10108-1 UPF1-11 10108-1-
1M1/1A21-
2_121117
Mouse IgG
Monoclonal
Ascites Abmart Inc
10108-1 UPF1-12 10108-1-
5M1/5I1-
9_121119
Mouse IgG
Monoclonal
Ascites Abmart Inc
10108-1 UPF1-13 10108-1-
1M1/1F16-
1_121119
Mouse IgG
Monoclonal
Ascites Abmart Inc
10108-1 UPF1-14 10108-1-
1M1/1C23-
2_121119
Mouse IgG
Monoclonal
Ascites Abmart Inc
10108-1 UPF1-15 10108-1-
1M1/1G20-
Mouse IgG
Monoclonal
Ascites Abmart Inc

212
1_121119
10108-1 UPF1-16 10108-1-
7M1/7B12-
12_121120
Mouse IgG
Monoclonal
Ascites Abmart Inc
10108-1 UPF1-17 10108-1-
3M1/3E22-
5_121120
Mouse IgG
Monoclonal
Ascites Abmart Inc
10108-1 UPF1-18 10108-1-
7M1/7I4-
11_121129
Mouse IgG
Monoclonal
Ascites Abmart Inc

213
(B) List of UPF2 Ascites
Project ID Target
protein
Product name Ig type Antibody
type
Company
10109-1 UPF2-1 10109-1-
1M1/1D4-
2_121113
Mouse IgG
Monoclonal
Ascites Abmart Inc
10109-1 UPF2-2 10109-1-
7M1/7K13-
12_121113
Mouse IgG
Monoclonal
Ascites Abmart Inc
10109-1 UPF2-3 10109-1-
5M1/5J4-
9_121113
Mouse IgG
Monoclonal
Ascites Abmart Inc
10109-1 UPF2-4 10109-1-
5M1/5N18-
7_121113
Mouse IgG
Monoclonal
Ascites Abmart Inc
10109-1 UPF2-5 10109-1-
7M1/7M2-
12_121114
Mouse IgG
Monoclonal
Ascites Abmart Inc
10109-1 UPF2-6 10109-1-
7M1/7K5-
12_121114
Mouse IgG
Monoclonal
Ascites Abmart Inc
10109-1 UPF2-7 10109-1-
5M1/5A5-
8_121113
Mouse IgG
Monoclonal
Ascites Abmart Inc
10109-1 UPF2-8 10109-1-
7M1/7E12-
11_121113
Mouse IgG
Monoclonal
Ascites Abmart Inc
10109-1 UPF2-9 10109-1-
7M1/7O6-
11_121115
Mouse IgG
Monoclonal
Ascites Abmart Inc
10109-1 UPF2-10 10109-1-
1M1/1M14-
2_121115
Mouse IgG
Monoclonal
Ascites Abmart Inc
10109-1 UPF2-11 10109-1-
1M1/1P22-
2_121119
Mouse IgG
Monoclonal
Ascites Abmart Inc
10109-1 UPF2-12 10109-1-
7M1/7H1-
12_121119
Mouse IgG
Monoclonal
Ascites Abmart Inc
10109-1 UPF2-13 10109-1-
7M1/7H21-
12_121120
Mouse IgG
Monoclonal
Ascites Abmart Inc
10109-1 UPF2-14 10109-1- Mouse IgG Ascites Abmart Inc

214
5M1/5H2-
8_121123
Monoclonal
10109-1 UPF2-15 10109-1-
1M1/1K7-
2_121202
Mouse IgG
Monoclonal
Ascites Abmart Inc

215
Appendix VIII
Y14 ChIP-seq genes list (top 20 based on their Wig peak height)
flanking genes within 300bp upstream
and downstream
wig peak height
MED30|Rev1 704
klar|klar|CG17180 492
roX1|roX1 468
bocksbeutel|bocksbeutel|CG8312 462
Kul 456
S|ast|S 400
Bsg|Bsg|Bsg|Bsg 400
eEF1delta|eEF1delta 385
Vti1 383
CG8498 382
vlc|vlc|vlc|vlc|vlc 378
CG33967 371
RpL23A 363
mad2 361
CG16903|Unc-76|Unc-76 356
RpL15|RpL15|RpL15|RpL15 337
CG34200 335
cue|Psa|Psa|Psa|Psa|Psa 330
RpL3|CG6693|RpL3|RpL3 330
Appendix IX
Published articles
1. Rugjee, K.N., Roy Chaudhury, S., Al-Jubran, K., Ramanathan, P., Matina, T., Wen, J., and
Brogna, S. (2013). Fluorescent protein tagging confirms the presence of ribosomal proteins at
Drosophila polytene chromosomes. PeerJ 1, e15.
2. Al-Jubran, K., Wen, J., Abdullahi, A., Roy Chaudhury, S., Li, M., Ramanathan, P.,
Matina, A., De, S., Piechocki, K., Rugjee, K.N., et al. (2013). Visualization of the joining of
ribosomal subunits reveals the presence of 80S ribosomes in the nucleus. RNA 19, 1669-
1683.

216