visualization for science: splotch, paraviewand huge data · visualization for science: splotch,...
TRANSCRIPT
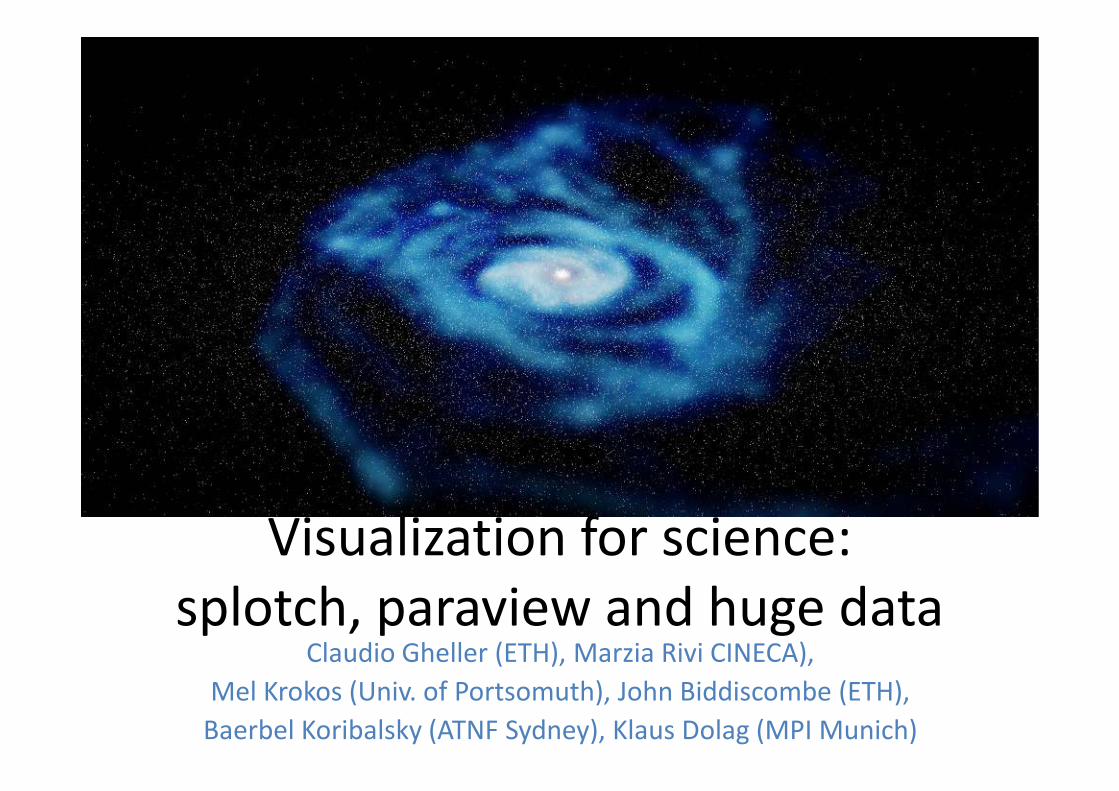
Visualization for science:
splotch, paraview and huge dataClaudio Gheller (ETH), Marzia Rivi CINECA),
Mel Krokos (Univ. of Portsomuth), John Biddiscombe (ETH),
Baerbel Koribalsky (ATNF Sydney), Klaus Dolag (MPI Munich)

The data tsunami
• Experiments, observations, numerical applications produce huge
amount of data: the data volume approx. doubles each year,
leading to the “Data Tsunami/Deluge/Avalanche…”
• This data must be properly stored and managed.
• Furthermore, the data must be accessible and proper tools for its
exploration, processing and analysis should be available.
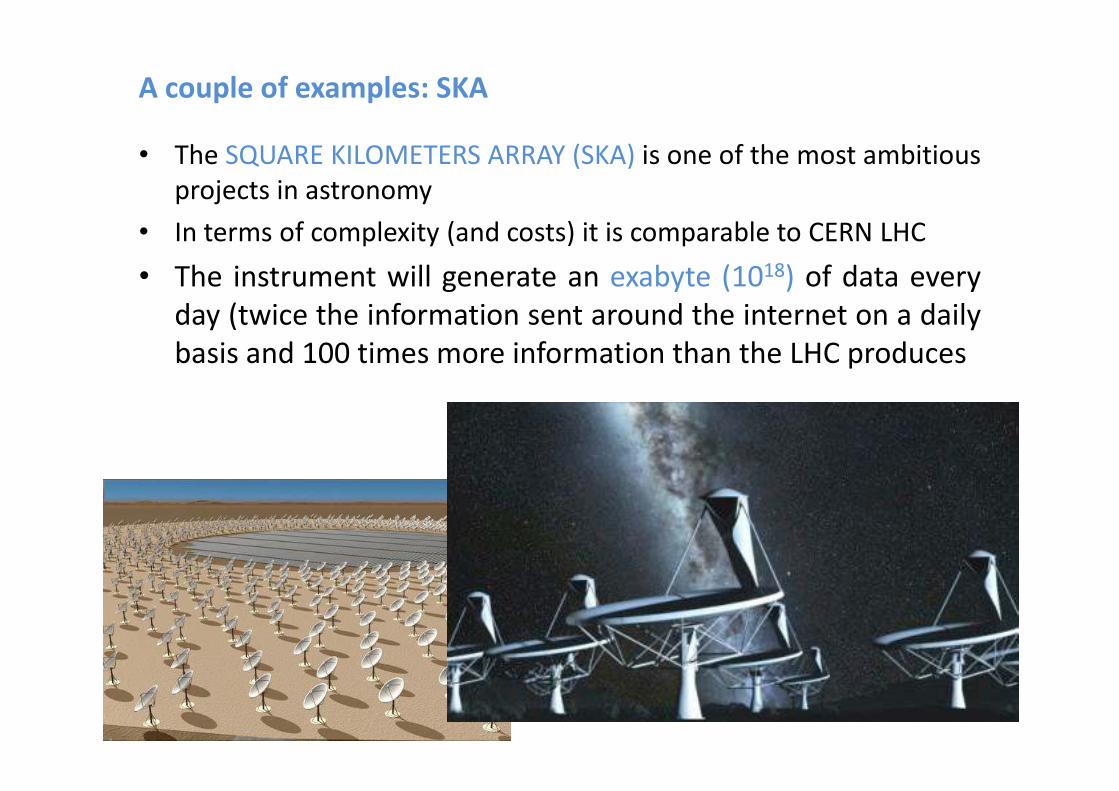
A couple of examples: SKA
• The SQUARE KILOMETERS ARRAY (SKA) is one of the most ambitious
projects in astronomy
• In terms of complexity (and costs) it is comparable to CERN LHC
• The instrument will generate an exabyte (1018) of data every
day (twice the information sent around the internet on a daily
basis and 100 times more information than the LHC produces
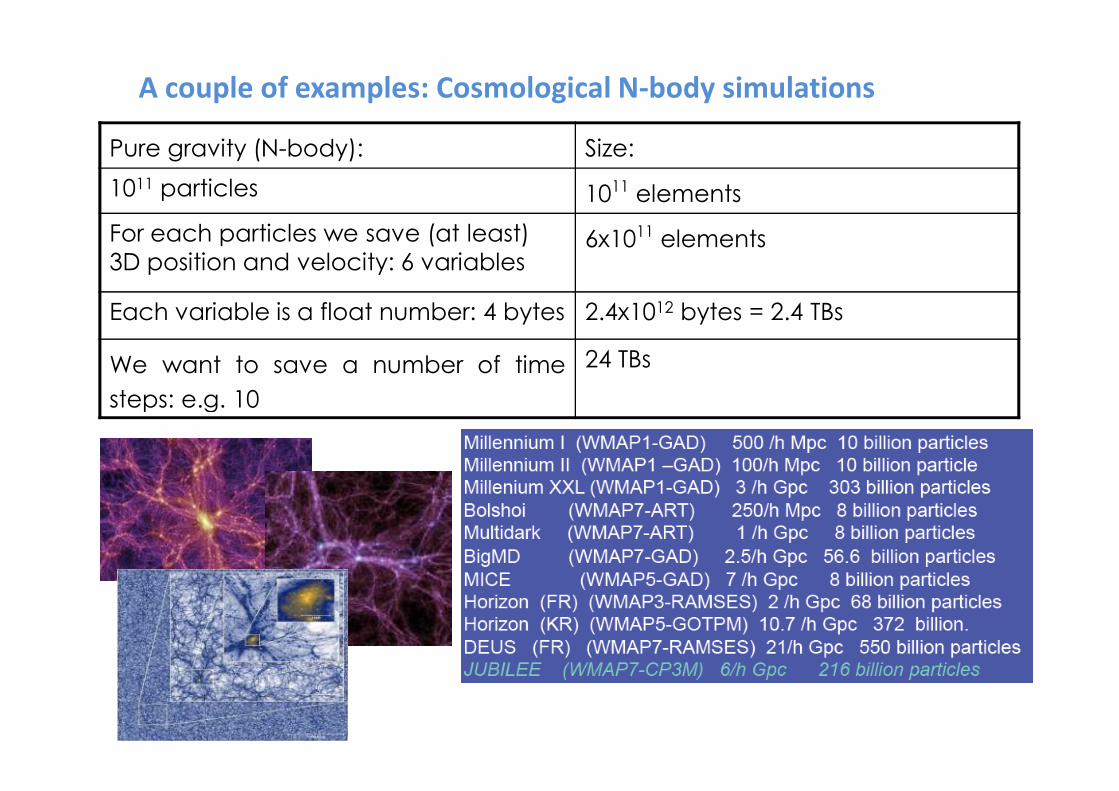
A couple of examples: Cosmological N-body simulations
Pure gravity (N-body): Size:
1011 particles 1011 elements
For each particles we save (at least)
3D position and velocity: 6 variables6x1011 elements
Each variable is a float number: 4 bytes 2.4x1012 bytes = 2.4 TBs
We want to save a number of time
steps: e.g. 10
24 TBs
steps: e.g. 10
What to do with this data…
Various different tools offer powerful instrument for automatically
analyzing large volumes of data, for classification, association,
clustering, etc. (e.g. data mining or statistical tools)
In general, data analysis is characterized by accurate and sophisticated
(i.e. complex and computationally expensive) algorithms which often
scale as N2 or even N3 (non-linear behavior) and that are not or cannot
be optimized/parallelized (not suitable for HPC system)
But an extremely accurate approach is not always necessary…
…visualization…
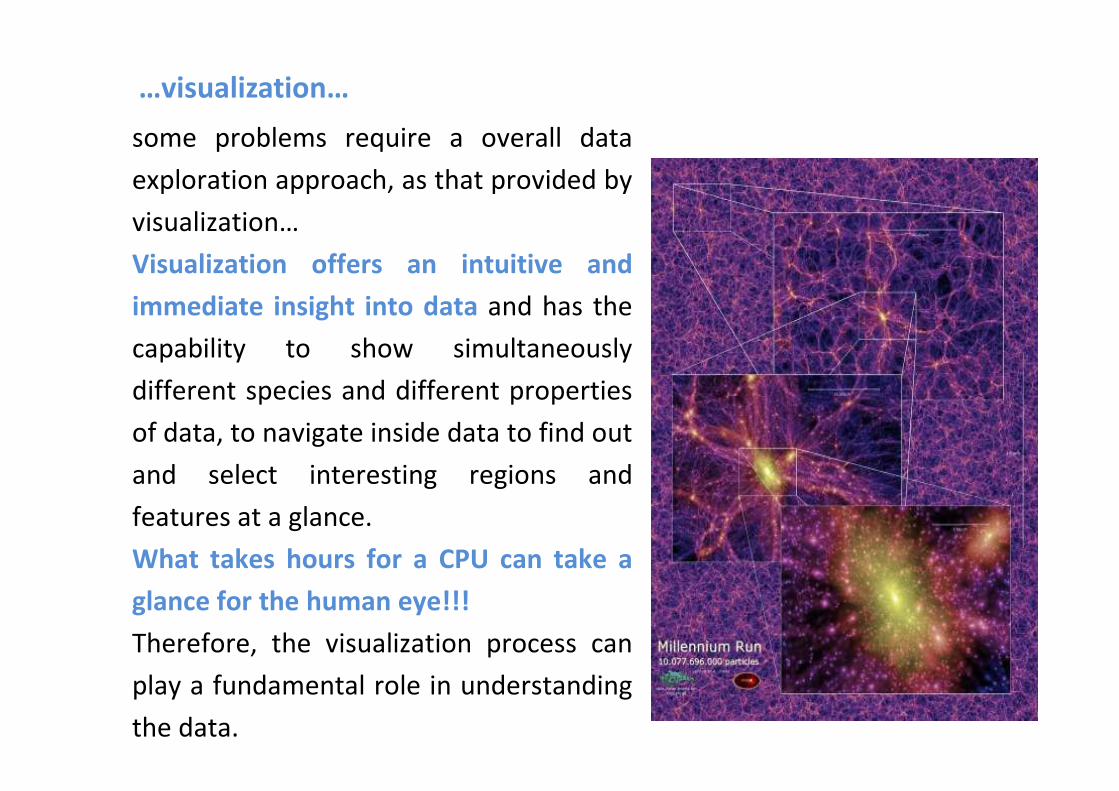
some problems require a overall data
exploration approach, as that provided by
visualization…
Visualization offers an intuitive and
immediate insight into data and has the
capability to show simultaneously
different species and different propertiesdifferent species and different properties
of data, to navigate inside data to find out
and select interesting regions and
features at a glance.
What takes hours for a CPU can take a
glance for the human eye!!!
Therefore, the visualization process can
play a fundamental role in understanding
the data.
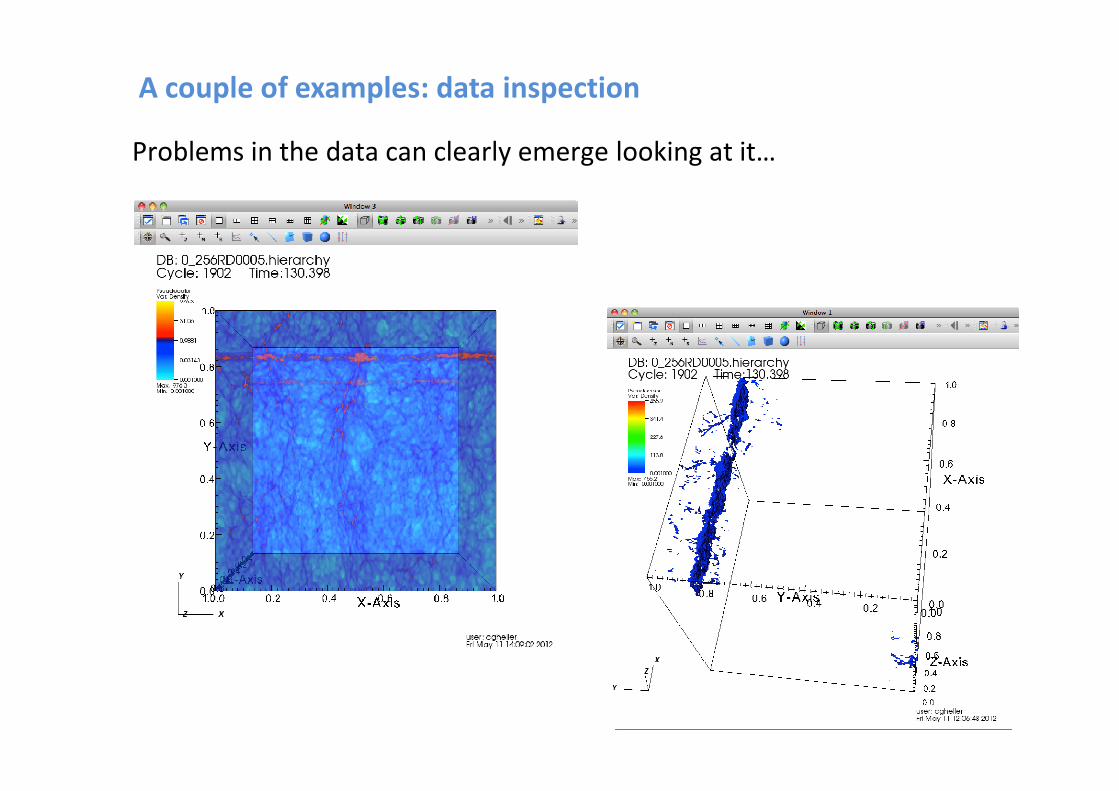
A couple of examples: data inspection
Problems in the data can clearly emerge looking at it…

A couple of examples: find interesting objects/features
Search for
simulations with
Lambda>0.7
I like this one
It’s too large !!!
Let’s select a sub-
region!!!
Metadata
Binary data file
region!!!
Data is too large!!!Extract a sub region… it is still
large
Perform the analysis on-site
Finally I have a jpeg… cannot be
too large!!!

Visualization tools
Many products are available for graphics and visualization, even
free/open source. However, not so many are designed for SCIENTIFIC
visualization.
We need them first of all to
• Be suitable for scientific data (e.g. sophisticated modeling is seldom
necessary, efficient volume rendering or iso-volume/surface
technique are much more effective)technique are much more effective)
• Be able to handle terabytes of data in reasonable times (this rules
out ANY PC, 32 bit software and promotes high performance
computers, multicore, multinode, multiGPU)
Other, relevant features are:
• Be user-friendly possibly with simple but effective GUIs
• Support client-server approach, to avoid data movement
• Produce nice and accurate images
Splotch as our rendering engine
• Our main focus is on huge datasets (giga to tera bytes – and
beyond…) that cannot be visualized interactively and/or using
“standard” visualization facilities.
• We want to use HPC resources, exploiting hybrid architectures that
allow to load and process data in an acceptable time.
• Sort of “brute force approach”, specialized on POINT LIKE data
sources (like particle distributions…)sources (like particle distributions…)
• “Splotch: Visualizing Cosmological Simulations.” K.Dolag, M. Reinecke,
C.Gheller, S. Imboden, 2008, New Journal of Physics, Volume 10, Issue 12.
• High-performance astrophysical visualization using Splotch. Jin, Zhefan;
Krokos, Mel; Rivi, Marzia; Gheller, Claudio; Dolag, Klaus; Reinecke, Martin,
2010, Procedia Computer Science, Volume 1, Issue 1, May 2010, Pages
1775-1784, ICCS 2010
Why Point like data
• An important class of astrophysical simulations use a point like
(particles) discretization of the evolving fluid (N-body and SPH
simuations)
• This numerical approach is used in simulations of the large scale
structure of the universe, evolution of galaxy clusters, galactic
dynamics, star clusters, formation of planetary systems
• With this approach each particle has a specific position and velocity
and is characterized by various properties (mass, temperature,
With this approach each particle has a specific position and velocity
and is characterized by various properties (mass, temperature,
pressure, entropy, metallicty…..) depending on the kind of object
we are looking at
• Particles dynamics is solved with different approaches, all
dominated by gravitational forces
• Only a few rendering algorithms have been developed to visualize
effectively point like data (most of them focusing on grid based
data)
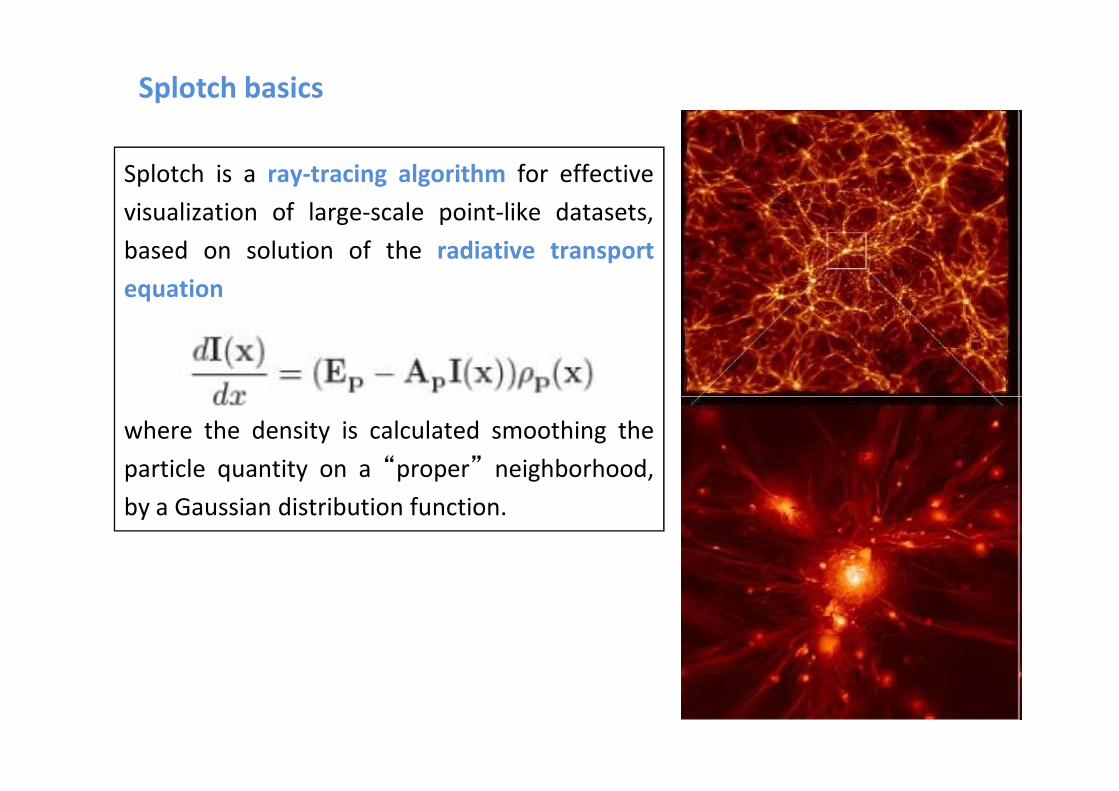
Splotch basics
Splotch is a ray-tracing algorithm for effective
visualization of large-scale point-like datasets,
based on solution of the radiative transport
equation
where the density is calculated smoothing the
particle quantity on a “proper” neighborhood,
by a Gaussian distribution function.
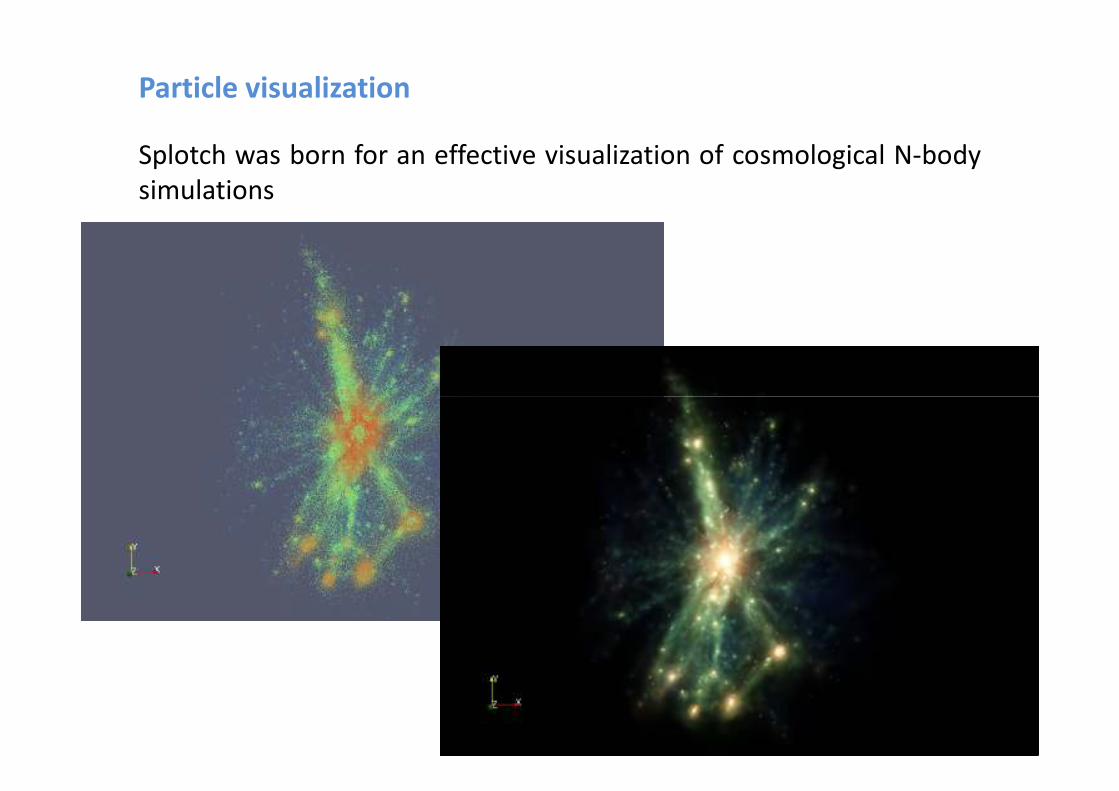
Particle visualization
Splotch was born for an effective visualization of cosmological N-body
simulations
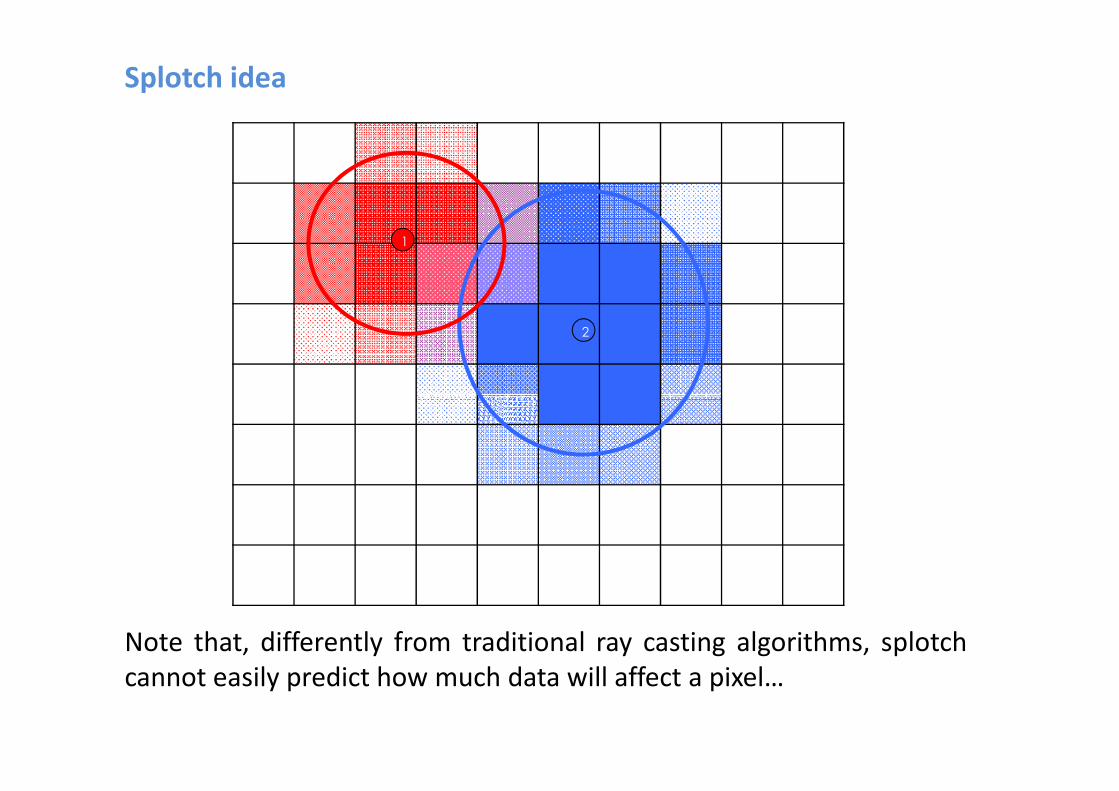
Splotch idea
2
1
Note that, differently from traditional ray casting algorithms, splotch
cannot easily predict how much data will affect a pixel…

Splotch in a nutshell
Basic Splotch steps:
1. Read data
2. Process (normalization, logs…) data
3. Set the point of view (roto-translation) and prospective projection
in the xy-plane
4. Color (associate a color to each particle)
5. Render (solve radiative transfert equation producing partial image)5. Render (solve radiative transfert equation producing partial image)
6. Save final image (tga, jpeg)
C++ code, completely self contained (no need for external libraries –
except those for parallelization)
Specific care spent to high performance and memory usage.
No configure procedure available… Set Makefile by hands… Supports
many compilers (GNU, CRAY, PGI…)
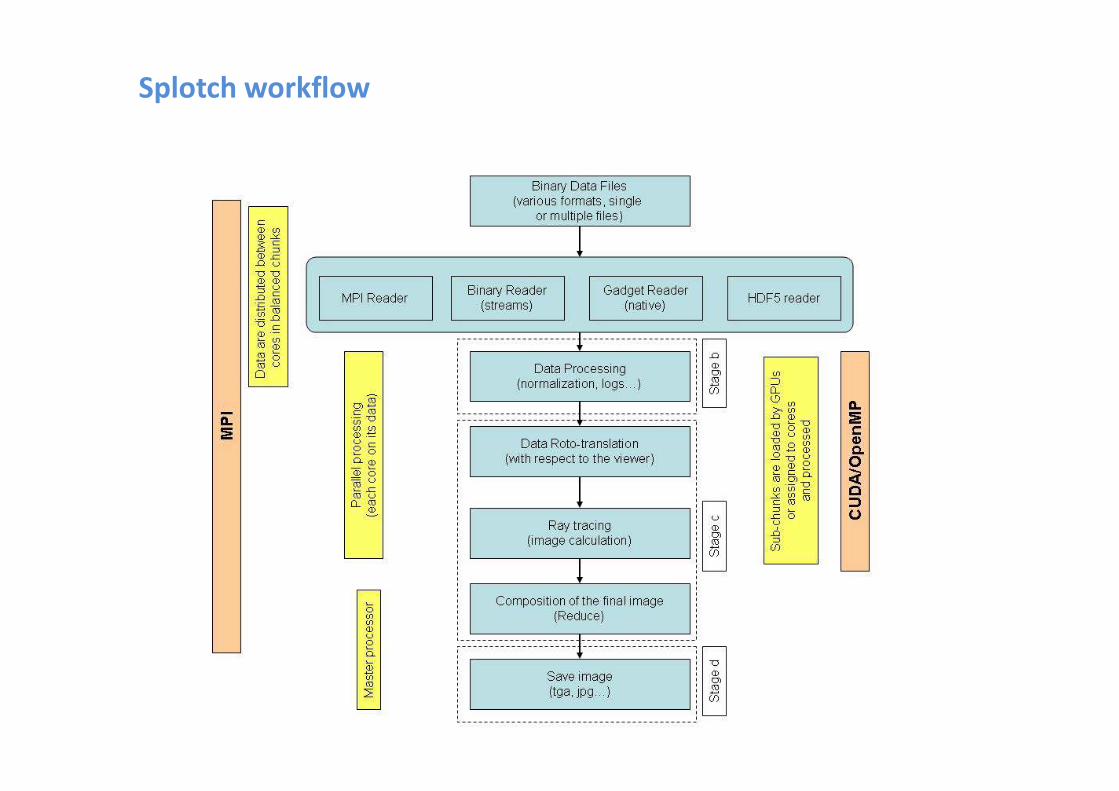
Splotch workflow

Splotch in parallel: 1, MPI implementation

Splotch in parallel: 2, OpenMP implementation
Splotch in parallel: 3, CUDA implementation
The CUDA approach consists in moving as many data as possible on
the GPU and let the GPU make the integration. Copy back the final
image to the CPU and save it in a file
Issues
1. each particle influences different number of screen pixels,1. each particle influences different number of screen pixels,
therefore unbalanced granularity can compromise execution times
during rendering phase;
2. each particle access “randomly” the image, therefore possible
concurrent access to the same pixel may occur.
Solutions
This is still work in progress. A first GPU version was implemented but
with poor performances. Refactoring will be completed in the next
weeks
Running Splotch
Currently splotch is a command line application. Therefore to run it:
> Splotch.exe parameter_file.par
The parameter_file is contains ALL the settings needed by splotch
It contains different classes of parameters:
• Data file related parameters (filename, file type, possibly file data
structure)structure)
• Variables related parameters (brightness, smoothing length, data
type…)
• Scene related parameter (camera position, look-at direction,
orientation…)
• Image related parameters (filename, resolution…)
Some practice is required to get a working parameter file
Several examples…….

Splotch Evolution: pv-splotch
• ParaView plugin for splotch
• the rendering engine added to ParaView
• It can work both stand-alone and client-server, exploiting the pv
parallel servers installed on TODI and EIGER systems at CSCS (or
wherever else…)
• At the moment MPI and OpenMP enabled (performances and• At the moment MPI and OpenMP enabled (performances and
scalability however are not as good as the stand-alone version).
GPU will be exploited as soon as we have an efficient CUDA
version.

USE CASE:
3D Reconstruction and visualization 3D Reconstruction and visualization
of real galaxies
Rationale (1)
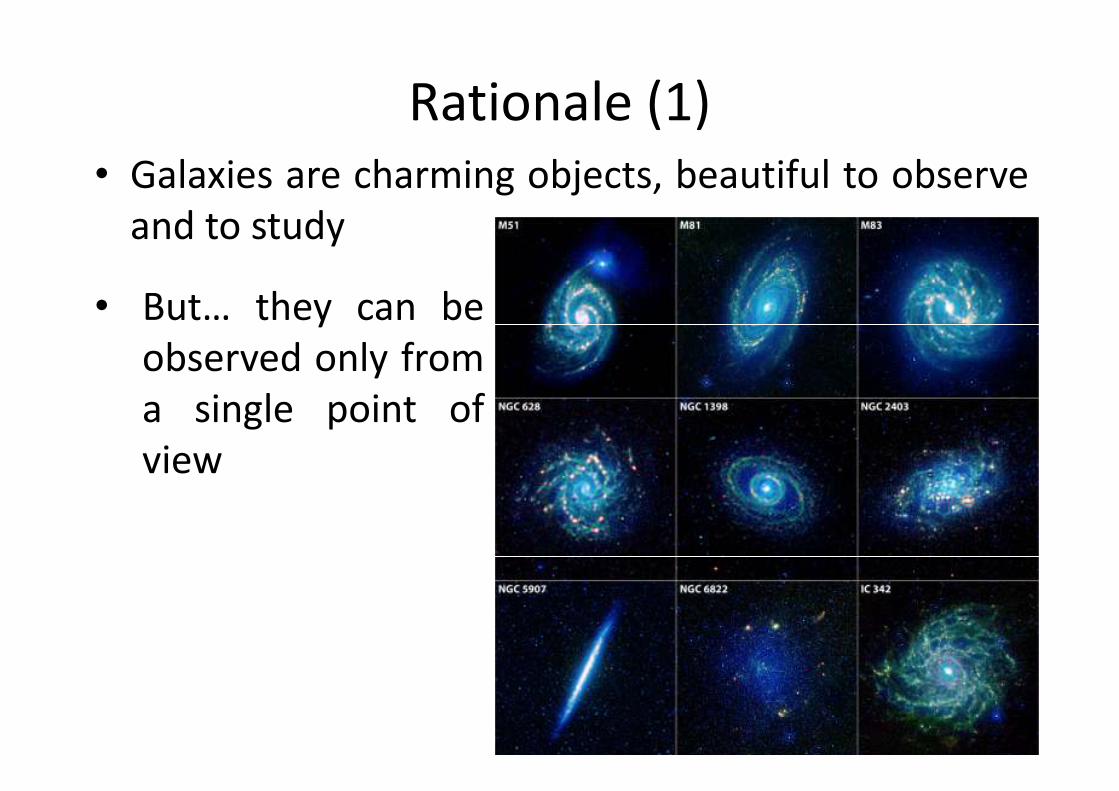
• Galaxies are charming objects, beautiful to observe
and to study
• But… they can be
observed only from
a single point ofa single point of
view

Rationale (2)
• High resolution images are
now available
• Different images/data provide
information on their 3Dinformation on their 3D
structure and their physics
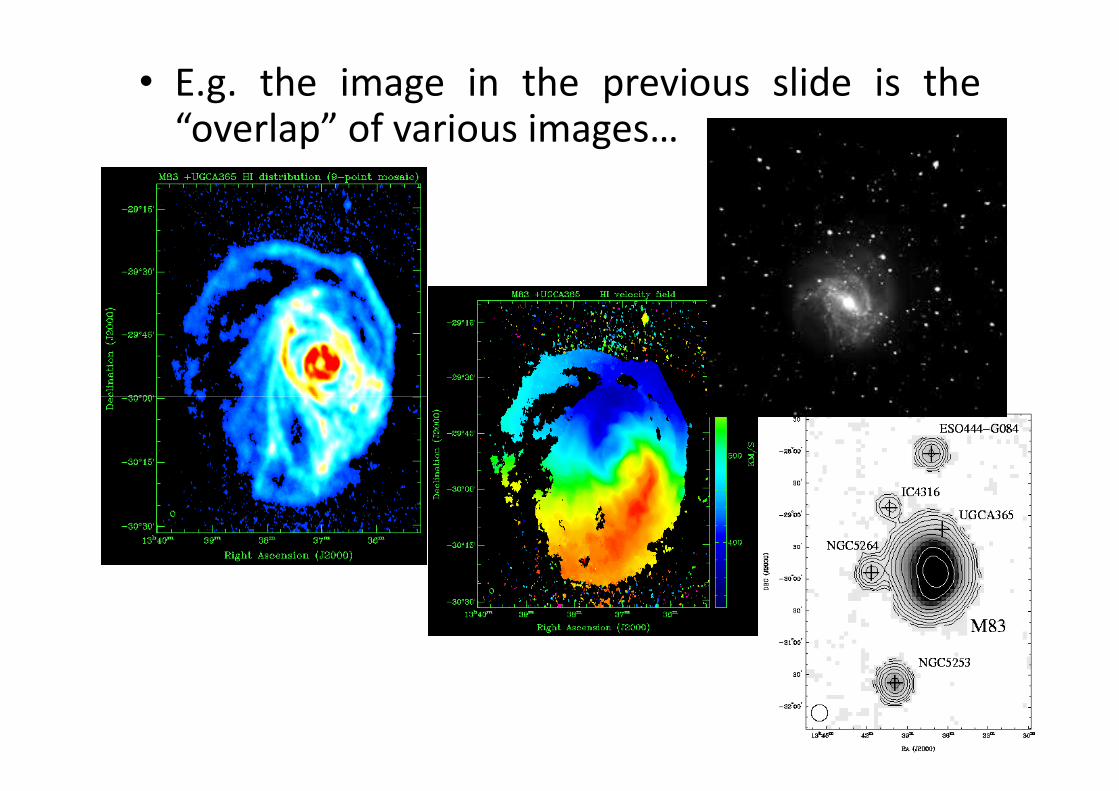
• E.g. the image in the previous slide is the“overlap” of various images…
Toward 3D
• In order to “move around” a galaxy, its 3D
shape must be modeled
• This is a complex task, especially for dwarf
galaxiesgalaxies
• For our purposes a certain extent of
approximation is acceptable
• The process consists in a few steps
Step 1: Image processing
• Each image (different wavelengths, differentinstruments…) comes as a FITS file
• The FITS image is processed first by a specificimage processing tool (like Aladin) for centering,rescaling and filteringrescaling and filtering
• Fine filtering is performed through a “custom” IDLscript
• The IDL scripts assign also colors (according to anarbitrary color table)
• Finally it saves the resulting images in the binaryinput files for the following step

Step 2.1: 3D modeling
Generated images are used to create the 3D
distribution, according to the following steps:
1. for each “bright” (i.e. belonging to the object)
pixel a particle (seed) is created with coordinatespixel a particle (seed) is created with coordinates
(x,y) equal to the coordinates of the pixel;
2. Third coordinate (z) is generated according to
physical information out of a proper gaussian
distribution
Step 2.2: 3D modeling
4. Around each seed a cloud of secondary points is
generated to fill the volume. These points have
coordinates generated randomly (but properly)
around the seeds
5. Each particle has assigned an intensity (function of5. Each particle has assigned an intensity (function of
the pixel intensity and of the number of particles) a
color (color of the pixel in which the particle falls)
and a radius (model arbitrary parameter), that
defines the region of influence of that particle.
Further properties (e.g. mass) will be assigned in the
future.
6. Data is saved in a file with Gadget or HDF5 formats
Data visualization
• Dealing with particle based datasets we need
a tool effective for particles
• Dealing with large datasets, we need a tool
able to cope with themable to cope with them
• We are using the “Splotch” code

Further steps
• Many different things can be done:
• Extend the galaxy models catalogue to more and moreobjects
• Improve the description of the galaxies with moreparameter (e.g. absolute z positions to reproduce tiltingand folding)and folding)
• Introduce the dynamics, using the galaxy models as initialconditions for cosmological and galaxy formation codes(like pkdgrav or gadget or ramses)
• Introduce realistic spatial coordinates to place the objects(just done)
• Move toward interactivity (where GPUs become essential!)and GUIs (almost done)
• ……………………..