visual triggering - ferret · level and then positions that cross-over point at the trigger ......
TRANSCRIPT
Capturing and finding the right characteristic of a complex signal can require hours of collecting and sorting through thousands of acquisitions for the event of interest. Defining a trigger that isolates the desired event and shows data only when the event occurs will speed up this process.
The optional Visual Trigger for the MSO/DPO5000, DPO7000C, and DPO/DSA/MSO70000C/D Series oscilloscopes makes the identification of the desired waveform events quick and easy by scanning through all analog waveform acquisitions and comparing them to on-screen areas or geometric shapes. This technical brief discusses some common challenges with capturing events of interest within complex signals and how to overcome them using the capabilities of Visual Trigger.
Visual TriggeringTechnical Brief

Technical Brief
www.tektronix.com/oscilloscopes2
Basic Oscilloscope TriggeringOscilloscopes contain specialized a hardware circuit called a trigger which allows predictable acquisition and display of time-correlated signals. The trigger makes repetitive waveforms appear stationary by displaying the same portion of the input signal at the same horizontal position on the oscilloscope display.
Edge triggering is the simplest trigger mode, which identifies a portion of the signal that crosses a specified threshold level and then positions that cross-over point at the trigger point on the display. Advanced trigger modes – including runt, glitch, pulse width, timeout, transition, pattern, state, setup/hold violation, window, communication, serial pattern, or sequences of these events – allow specification of more complex signal characteristics.
However, even the most advanced oscilloscope trigger hardware can only identify a limited number of signal characteristics, and those characteristics must be specified with numerical values such as voltage levels or pulse widths. Oscilloscopes are visual devices and many users would like to graphically interact with the instrument, especially when working with complex signals.
Some oscilloscopes allow the user to draw a “box” on the display (with a mouse or touch-screen) to define an area for graphical zoom, histogram analysis, or measurement gating. The Visual Trigger option extends this capability to allow graphical definition of trigger criteria.

www.tektronix.com/oscilloscopes 3
Visual Triggering
Visual TriggerVisual Trigger makes the identification of the desired waveform events quick and easy by scanning through all acquired analog waveforms and graphically comparing them to geometric shapes on the display. By discarding acquired waveforms which do not meet the graphical definition, Visual Triggering extends the oscilloscope’s trigger capabilities beyond the traditional hardware trigger system.
Although Visual Trigger is similar in appearance to mask testing, where acquired waveforms are graphically compared to mask regions on the display, there is an important difference. Visual Trigger actually discards waveforms which do not conform to the specified shape, so only conforming waveforms can be displayed, measured, and saved to a reference.
The Visual Trigger process always begins with setting up the oscilloscope’s hardware trigger system to acquire the waveforms in Normal trigger mode. The trigger can be as simple as an edge trigger or as complex as a multi-state, parallel, serial, or video trigger. This trigger setup is graphically represented in the Visual Trigger control window in Figure 1, showing a hardware serial trigger followed by Visual Trigger.
Up to eight Visual Trigger areas can be created using a mouse or touchscreen, and a variety of shapes (triangles, rectangles, hexagons, or trapezoids) can be used to specify the desired trigger behavior. Once shapes are created on the oscilloscope's display or graticule, they can be re-positioned, re-sized, and/or edited interactively to create ideal trigger conditions (Figure 2).
Figure 2. Customizing Visual Trigger Shapes.
Figure 1. Visual Trigger control window.
Technical Brief
www.tektronix.com/oscilloscopes4
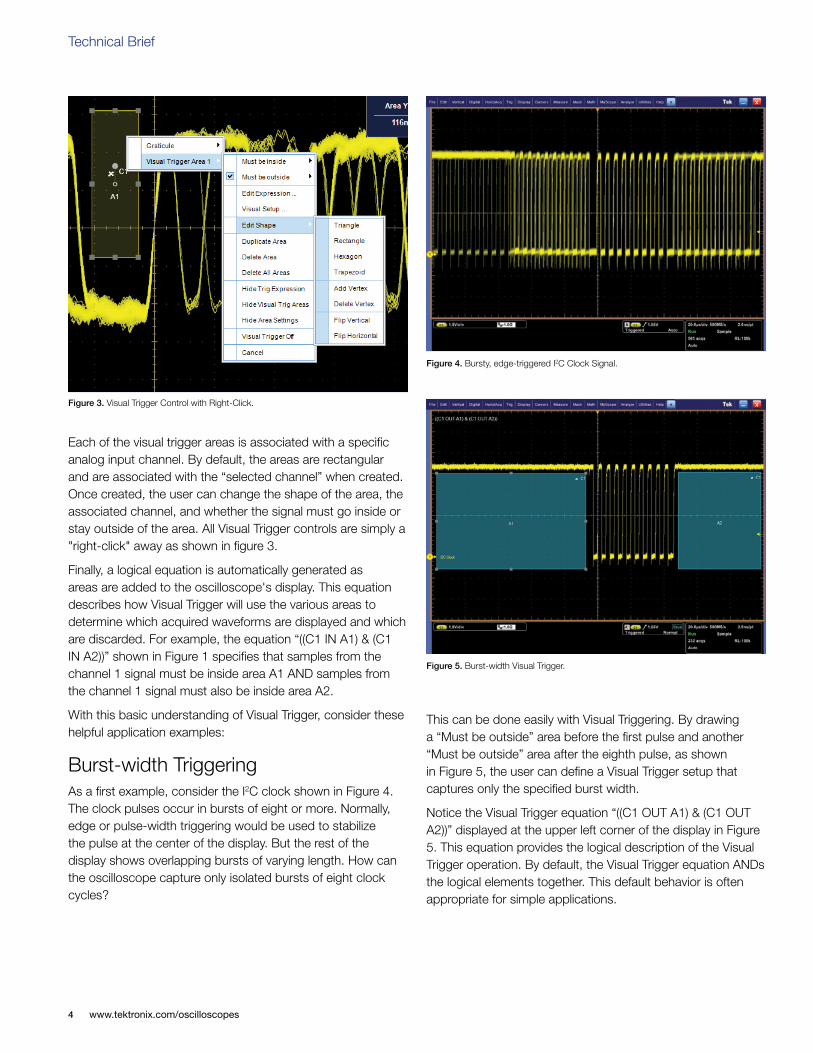
Each of the visual trigger areas is associated with a specific analog input channel. By default, the areas are rectangular and are associated with the “selected channel” when created. Once created, the user can change the shape of the area, the associated channel, and whether the signal must go inside or stay outside of the area. All Visual Trigger controls are simply a "right-click" away as shown in figure 3.
Finally, a logical equation is automatically generated as areas are added to the oscilloscope's display. This equation describes how Visual Trigger will use the various areas to determine which acquired waveforms are displayed and which are discarded. For example, the equation “((C1 IN A1) & (C1 IN A2))” shown in Figure 1 specifies that samples from the channel 1 signal must be inside area A1 AND samples from the channel 1 signal must also be inside area A2.
With this basic understanding of Visual Trigger, consider these helpful application examples:
Burst-width TriggeringAs a first example, consider the I2C clock shown in Figure 4. The clock pulses occur in bursts of eight or more. Normally, edge or pulse-width triggering would be used to stabilize the pulse at the center of the display. But the rest of the display shows overlapping bursts of varying length. How can the oscilloscope capture only isolated bursts of eight clock cycles?
This can be done easily with Visual Triggering. By drawing a “Must be outside” area before the first pulse and another “Must be outside” area after the eighth pulse, as shown in Figure 5, the user can define a Visual Trigger setup that captures only the specified burst width.
Notice the Visual Trigger equation “((C1 OUT A1) & (C1 OUT A2))” displayed at the upper left corner of the display in Figure 5. This equation provides the logical description of the Visual Trigger operation. By default, the Visual Trigger equation ANDs the logical elements together. This default behavior is often appropriate for simple applications.
Figure 3. Visual Trigger Control with Right-Click.
Figure 4. Bursty, edge-triggered I2C Clock Signal.
Figure 5. Burst-width Visual Trigger.

www.tektronix.com/oscilloscopes 5
Visual Triggering
Customized Serial TriggeringVisual Trigger qualifies the trigger setup by specifying up to eight different areas, with each area having up to 48 vertices each, and associating each area with any of the oscilloscope’s analog input signals. In this example, again with an I2C signal, area 1 provides framing for the serial signal by requiring the clock (yellow channel 1 signal) to be idle for an extended period of time. Then the remaining seven areas are used to specify the serial data pattern (cyan channel 2 signal).
In the example shown in Figure 6, the digital pattern is 101 0100, sampled at the rising edge of the clock signal. The horizontal positions of the areas for the data pattern can be adjusted to correspond to the valid setup and hold timing around the clock edges, and the vertical sizes and positions of the areas can be adjusted to correspond to valid high and low logic levels. As the size and position of each area are adjusted, the voltage and time values for each side of the rectangle are displayed to assist in precise placement.
Boolean Logic Trigger QualificationSome applications require the Visual Trigger logic to be more complex than simply ANDing together the results of all of the Visual Trigger areas.
In the following example, after framing the signal, the oscilloscope can be setup to trigger whenever either of the the two-bit serial data patterns “01” OR “10” occur. This could be expressed as:
(((C2 OUT A2) & (C2 IN A3)) | ((C2 IN A2) & (C2 OUT A3)))
using the logical OR (‘|’) function, or it can be simplified to:
((C2 IN A2) ^ (C2 IN A3))
using the logical XOR (‘^’) function.
Figure 7 shows the simplified logic equation in the Visual Trigger Qualification Expression Editor. Figure 8 shows the resulting capture of the two-bit serial pattern 10.
Figure 6. Serial triggering on the 101 0100 I2C serial data pattern.
Figure 8. Visual Trigger capture of the 10 serial data pattern.
Figure 7. Using the qualification expression editor to specify Visual Trigger logic.
Technical Brief
www.tektronix.com/oscilloscopes6
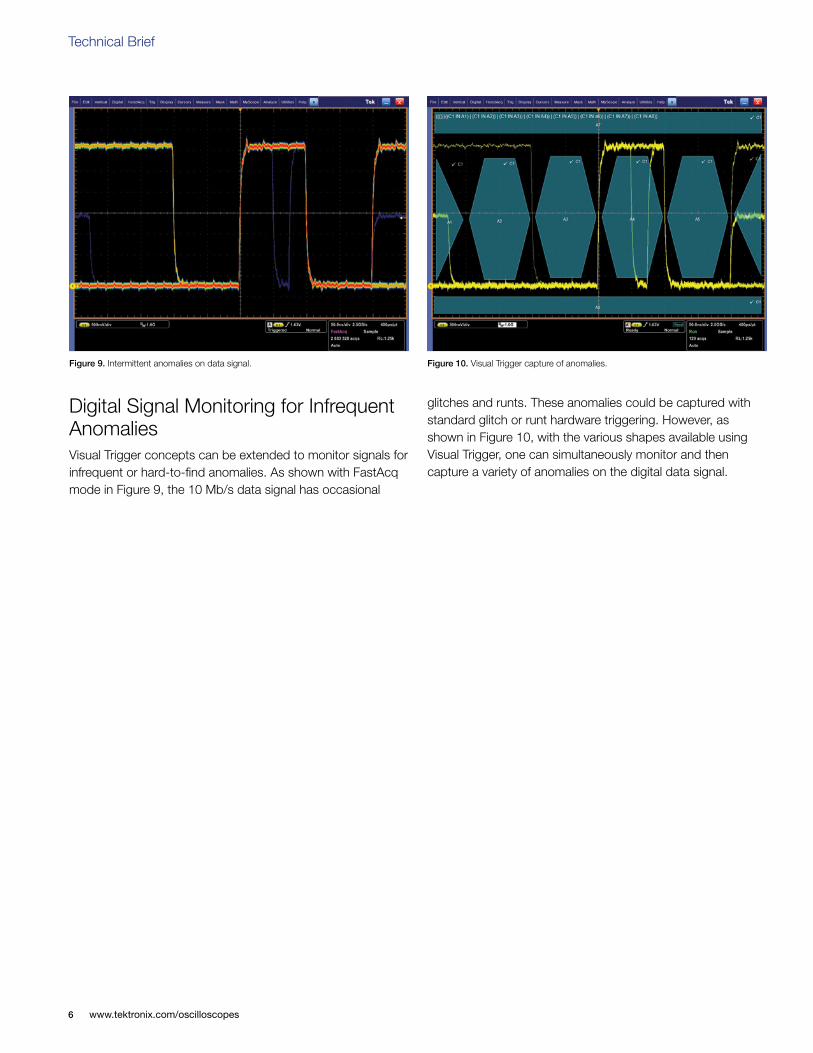
Digital Signal Monitoring for Infrequent AnomaliesVisual Trigger concepts can be extended to monitor signals for infrequent or hard-to-find anomalies. As shown with FastAcq mode in Figure 9, the 10 Mb/s data signal has occasional
glitches and runts. These anomalies could be captured with standard glitch or runt hardware triggering. However, as shown in Figure 10, with the various shapes available using Visual Trigger, one can simultaneously monitor and then capture a variety of anomalies on the digital data signal.
Figure 9. Intermittent anomalies on data signal. Figure 10. Visual Trigger capture of anomalies.
www.tektronix.com/oscilloscopes 7
Visual Triggering
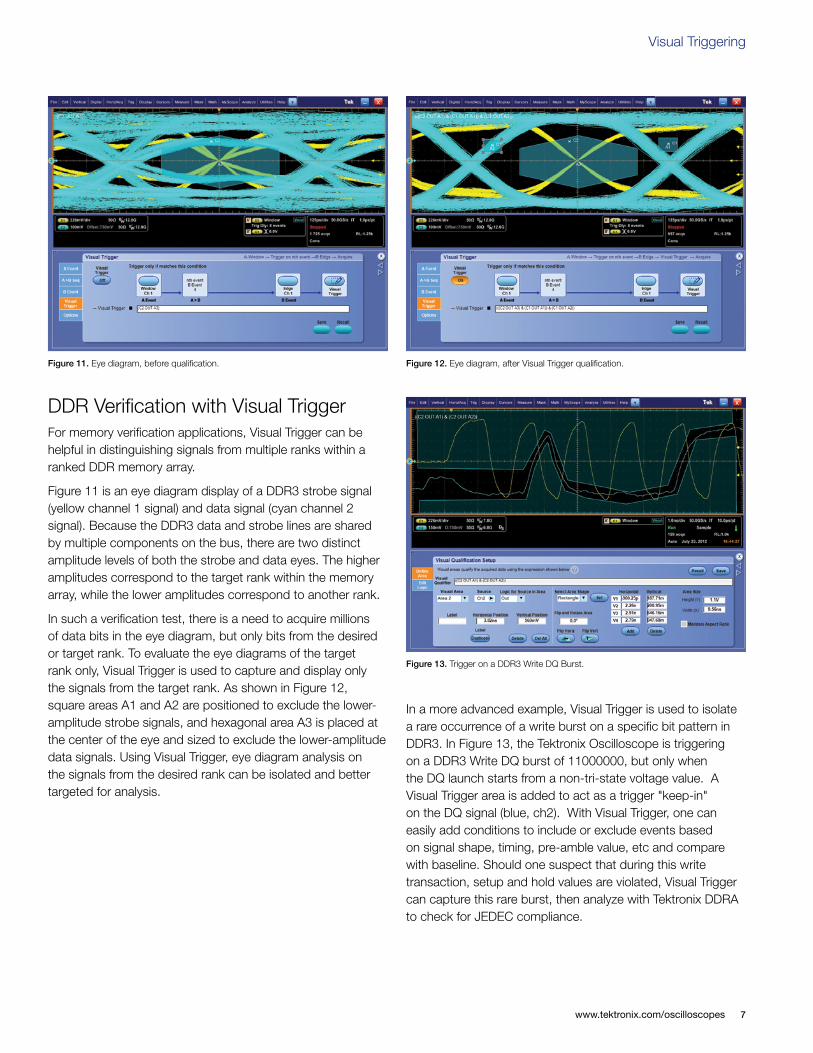
DDR Verification with Visual TriggerFor memory verification applications, Visual Trigger can be helpful in distinguishing signals from multiple ranks within a ranked DDR memory array.
Figure 11 is an eye diagram display of a DDR3 strobe signal (yellow channel 1 signal) and data signal (cyan channel 2 signal). Because the DDR3 data and strobe lines are shared by multiple components on the bus, there are two distinct amplitude levels of both the strobe and data eyes. The higher amplitudes correspond to the target rank within the memory array, while the lower amplitudes correspond to another rank.
In such a verification test, there is a need to acquire millions of data bits in the eye diagram, but only bits from the desired or target rank. To evaluate the eye diagrams of the target rank only, Visual Trigger is used to capture and display only the signals from the target rank. As shown in Figure 12, square areas A1 and A2 are positioned to exclude the lower-amplitude strobe signals, and hexagonal area A3 is placed at the center of the eye and sized to exclude the lower-amplitude data signals. Using Visual Trigger, eye diagram analysis on the signals from the desired rank can be isolated and better targeted for analysis.
In a more advanced example, Visual Trigger is used to isolate a rare occurrence of a write burst on a specific bit pattern in DDR3. In Figure 13, the Tektronix Oscilloscope is triggering on a DDR3 Write DQ burst of 11000000, but only when the DQ launch starts from a non-tri-state voltage value. A Visual Trigger area is added to act as a trigger "keep-in" on the DQ signal (blue, ch2). With Visual Trigger, one can easily add conditions to include or exclude events based on signal shape, timing, pre-amble value, etc and compare with baseline. Should one suspect that during this write transaction, setup and hold values are violated, Visual Trigger can capture this rare burst, then analyze with Tektronix DDRA to check for JEDEC compliance.
Figure 11. Eye diagram, before qualification. Figure 12. Eye diagram, after Visual Trigger qualification.
Figure 13. Trigger on a DDR3 Write DQ Burst.

Contact Tektronix:ASEAN / Australasia (65) 6356 3900
Austria* 00800 2255 4835
Balkans, Israel, South Africa and other ISE Countries +41 52 675 3777
Belgium* 00800 2255 4835
Brazil +55 (11) 3759 7627
Canada 1 (800) 833-9200
Central East Europe and the Baltics +41 52 675 3777
Central Europe & Greece +41 52 675 3777
Denmark +45 80 88 1401
Finland +41 52 675 3777
France* 00800 2255 4835
Germany* 00800 2255 4835
Hong Kong 400-820-5835
India 000-800-650-1835
Italy* 00800 2255 4835
Japan 81 (3) 6714-3010
Luxembourg +41 52 675 3777
Mexico, Central/South America & Caribbean 52 (55) 56 04 50 90
Middle East, Asia and North Africa +41 52 675 3777
The Netherlands* 00800 2255 4835
Norway 800 16098
People’s Republic of China 400-820-5835
Poland +41 52 675 3777
Portugal 80 08 12370
Republic of Korea 001-800-8255-2835
Russia & CIS +7 (495) 7484900
South Africa +27 11 206 8360
Spain* 00800 2255 4835
Sweden* 00800 2255 4835
Switzerland* 00800 2255 4835
Taiwan 886 (2) 2722-9622
United Kingdom & Ireland* 00800 2255 4835
USA 1 (800) 833-9200
* If the European phone number above is not accessible, please call +41 52 675 3777
Contact List Updated 10 February 2011
For Further InformationTektronix maintains a comprehensive, constantly expanding collection of application notes, technical briefs and other resources to help engineers working on the cutting edge of technology. Please visit www.tektronix.com
Copyright © 2012, Tektronix. All rights reserved. Tektronix products are covered by U.S. and foreign patents, issued and pending. Information in this publication supersedes that in all previously published material. Specification and price change privileges reserved. TEKTRONIX and TEK are registered trademarks of Tektronix, Inc. All other trade names referenced are the service marks, trademarks or registered trademarks of their respective companies.
08/12 EA/WWW 48W-27803-1
ConclusionVisual Trigger extends the Tektronix oscilloscope’s triggering capabilities beyond the hardware trigger system, enabling easy and efficient definition and capture of important events in complex signals. By automatically capturing only the most important signal events, hours of capturing and manually searching through acquisitions for the right signal can be reduced to seconds or minutes, and debug and analysis efforts can be spent on those few critical events.