visual sensory system
DESCRIPTION
Visual Sensory System. Human Factors Psychology Dr. Steve. Properties of Light. Light is an electromagnetic wave Amplitude perceived as brightness Wavelength (nm) perceived as hue. Amplitude. Wavelength. Physical Measures of Light. Luminous Flux – energy of source (units of candela) - PowerPoint PPT PresentationTRANSCRIPT

Visual Sensory Visual Sensory SystemSystem
Human Factors PsychologyHuman Factors Psychology
Dr. SteveDr. Steve

Properties of LightProperties of Light
Wavelength
Am
plitu
de
Light is an electromagnetic waveAmplitude perceived as brightnessWavelength (nm) perceived as hue

Physical Measures of LightPhysical Measures of Light
Luminous Flux – energy of source (units of candela)
Illuminance – amount of energy that strikes surface of object (foot candle or lux)
Luminance – amount of energy reflecting off the surface of an object (foot lambert)
Reflectance – ratio of luminance/illuminance
Brightness – perceived intensity

Anatomy of the EyeAnatomy of the Eye
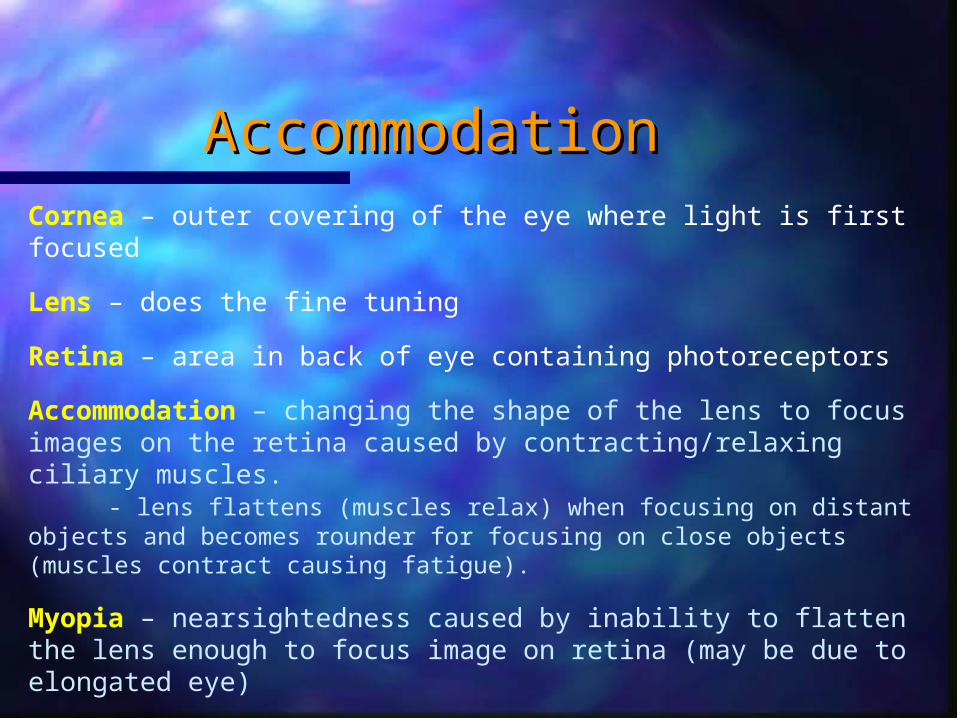
AccommodationAccommodationCornea – outer covering of the eye where light is first focused
Lens – does the fine tuning
Retina – area in back of eye containing photoreceptors
Accommodation – changing the shape of the lens to focus images on the retina caused by contracting/relaxing ciliary muscles. - lens flattens (muscles relax) when focusing on distant objects and becomes rounder for focusing on close objects (muscles contract causing fatigue).
Myopia – nearsightedness caused by inability to flatten the lens enough to focus image on retina (may be due to elongated eye)
Presbyopia – farsightedness that occurs naturally with age as the lens becomes less flexible.

Color VisionColor Vision
CIE Color SpaceCIE Color Space– 2-D representation of 3-D color space2-D representation of 3-D color space
– HuesHues moremore saturatedsaturated (pure) at rim,(pure) at rim, diluted toward the center (white)diluted toward the center (white)
– X axis – X axis – long wavelengthslong wavelengths ( (redred))
– Y axis – Y axis – medium wavelengthsmedium wavelengths ( (greengreen))
– All colors represented by x,y coordinatesAll colors represented by x,y coordinates
– Center is white – combo of all Center is white – combo of all wavelengths wavelengths
Color VisionColor Vision
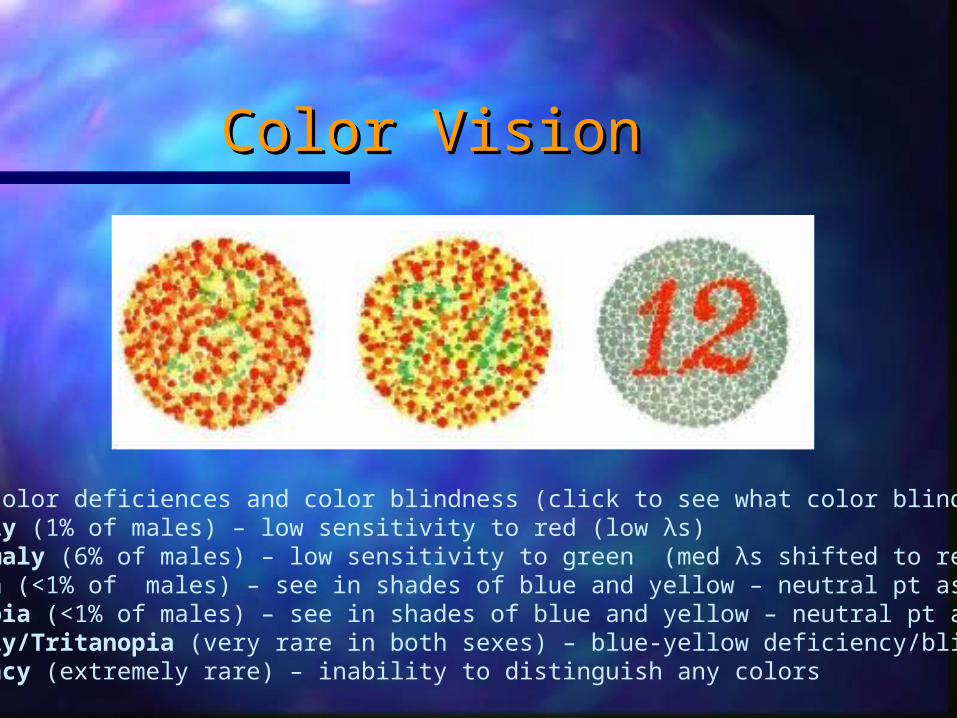
Types of color deficiences and color blindness (click to see what color blind see)Protanomaly (1% of males) – low sensitivity to red (low λs)Deuteranomaly (6% of males) – low sensitivity to green (med λs shifted to red)Protanopia (<1% of males) – see in shades of blue and yellow – neutral pt as greyDeuteranopia (<1% of males) – see in shades of blue and yellow – neutral pt as greyTritanomaly/Tritanopia (very rare in both sexes) – blue-yellow deficiency/blindnessMonochromacy (extremely rare) – inability to distinguish any colors

PhotoreceptorsPhotoreceptorsRods – sensitive to dim light (night vision)
- found mostly in periphery
- why can see a dim star better if look a few degrees to one side
Cones – sensitive to color (daylight vision) - concentrated in fovea - provides fine detail
light

Color VisionColor VisionTrichromatic TheoryTrichromatic Theory
Trichromatic Color Theory – color perception is determined by ratio of activity in three different cone mechanisms with different spectral sensitivities (like R B G monitors)White curves indicate sensitivity of three types of cones (color vision);Black curve indicates sensitivity of rods (night-time vision)
Sen
sitiv
ity
Wavelength (nm)

Purkinje ShiftPurkinje Shift
-Purkinje shift – as we switch from cone to rod vision (day to night), shorter wavelengths appear brighter (green objects appear brighter, red objects appear darker).
- (Human Factors application: How does the Purkinje shift play a role in the design of fire trucks?)

Color VisionColor VisionOpponent Process TheoryOpponent Process Theory
Hering’s Opponent Process Theory: Eye contains antagonistic responses to 3 pairs of colors

Color VisionColor VisionOpponent Process TheoryOpponent Process Theory
Stare at center of the flag for 30 sec. Then look at blank white surface. What do you see? How does this support the opponent process theory?

Dark AdaptationDark Adaptation
(Human Factors application: why are red lights used in cockpits and darkrooms?)- because rods are insensitive to longer wavelengths (red) the eyes “think” they are in the dark already allowing user to dark adapt more quickly)
-Takes about 30 minutes to dark adapt, but just a few minutes to light adapt

Visual AcuityVisual Acuity
20/20 Vision – a person can see from 20 feet what a person with “normal” vision can see from 20 feet
20/40 Vision – a person can see from 20 feet what a person with “normal” vision can see from 40 feet
Snellen Eye Chart

Contrast and VisibilityContrast and Visibility
ContrastContrast VisibilityVisibility Black on grayBlack on gray
IlluminationIllumination Contrast Contrast SensitivitySensitivity
Reading map Reading map in poor lightin poor light
PolarityPolarity Black on whiteBlack on white ViewgraphsViewgraphs
Spatial FrequencySpatial Frequency Optimum CS Optimum CS at 3 C/Dat 3 C/D
Font sizesFont sizes
Visual Visual AccommodationAccommodation
CSCS Night drivingNight driving
MotionMotion CSCS Traffic signsTraffic signs
Variable Effect Example
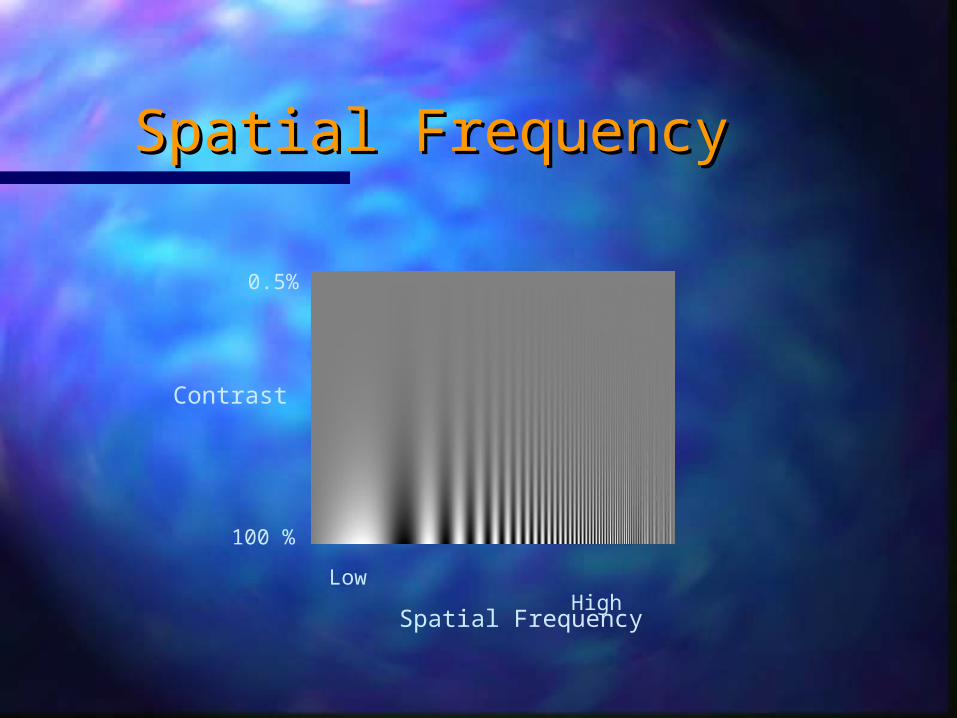
Spatial FrequencySpatial Frequency
Spatial Frequency
Low High
100 %
0.5%
Contrast

Reading TextReading Text
Megaflicks Video
Contrast, Spatial Frequency (Font Size) and Font Style must be considered in the display of text for optimum legibility(Human Factors Application: While the green background provides good contrast and the font size is highly legible, the font style does not allow for visual separation of letters.)

Top-Down vs. Bottom-UpTop-Down vs. Bottom-UpProcessingProcessing
Perception
Experience• knowledge• expectations• desires
Stimulus World• Five senses
Top-Down
Bottom-Up
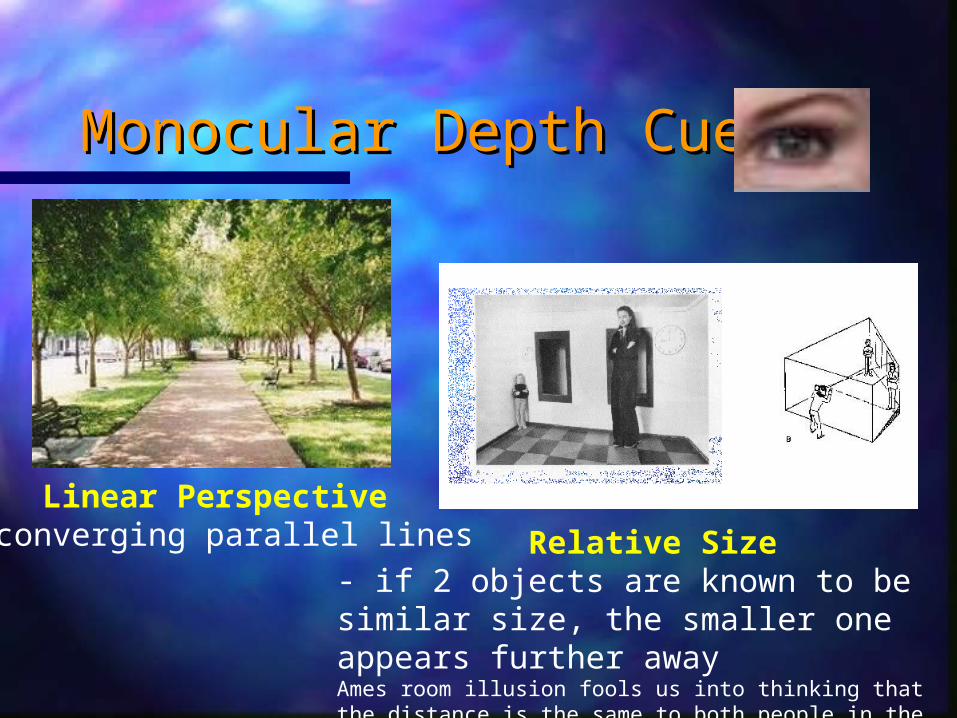
Monocular Depth CuesMonocular Depth Cues
Linear Perspective- converging parallel lines Relative Size
- if 2 objects are known to be similar size, the smaller one appears further awayAmes room illusion fools us into thinking that the distance is the same to both people in the photo, therefore their size must be different.

Monocular Depth CuesMonocular Depth Cues
Interposition- Nearer objects obscure the
view of further objects
Light & Shading- 3-D objects cast shadows and shade on opposite side of illumination source, and reflections on same side

Monocular Depth CuesMonocular Depth Cues
Textual Gradients- Texture appears more fine
with increasing distance
Aerial Perspective- Objects in the distance
appear hazy or bluish

Monocular Depth CuesMonocular Depth Cues
Motion Parallax- As perceiver moves, objects in foreground
appear to move by faster than objects in background
Cool Examples of Monocular Depth Cues

Binocular CuesBinocular Cues
Convergence- Eyes rotate inward as
object gets closer
Retinal Disparity- Slightly different image to each
eye, brain combines them

Retinal Disparity (3D T-Retinal Disparity (3D T-Rex)Rex)
Click for more anaglyphs:
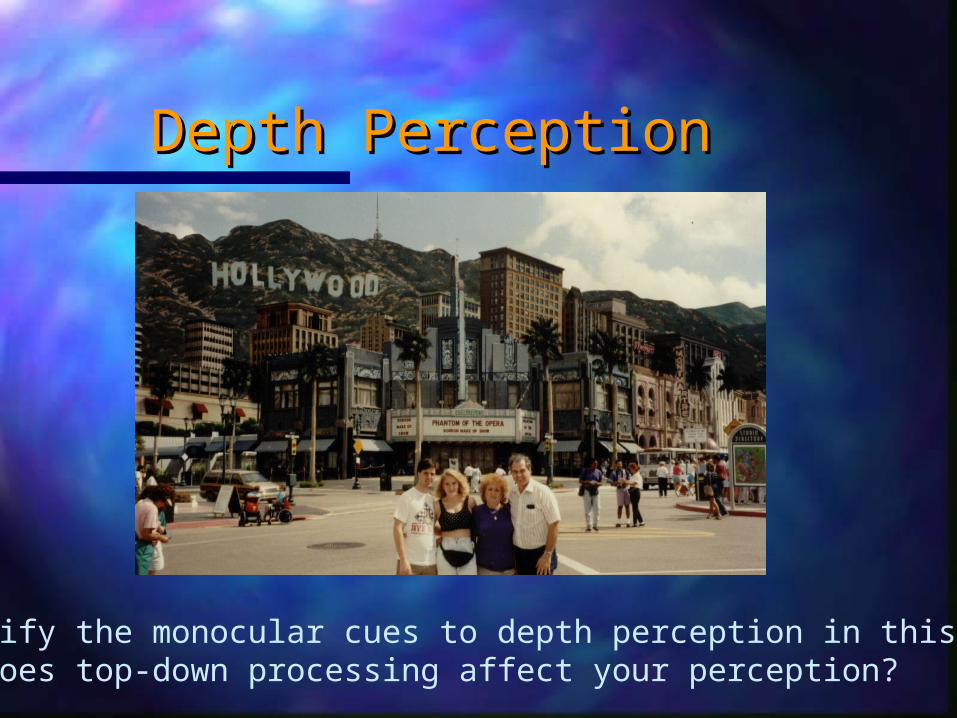
Depth PerceptionDepth Perception
Identify the monocular cues to depth perception in this photo.How does top-down processing affect your perception?

Visual SearchVisual Search
O O O O O O O O O O O X O O O O O X O O O O O OO O O O O O X OO O O O O O O O O O O O X O O O
Q Q Q Q Q Q Q QQ Q O Q Q Q Q QQ Q Q Q Q Q O QQ Q Q Q Q Q Q QQ Q Q O Q Q Q QQ Q Q Q O Q Q Q
Search time: T = (N x I) / 2I = inspection time per objectN = total number of objects
Pop-out Effect- conspicuities
Serial Search Parallel Search
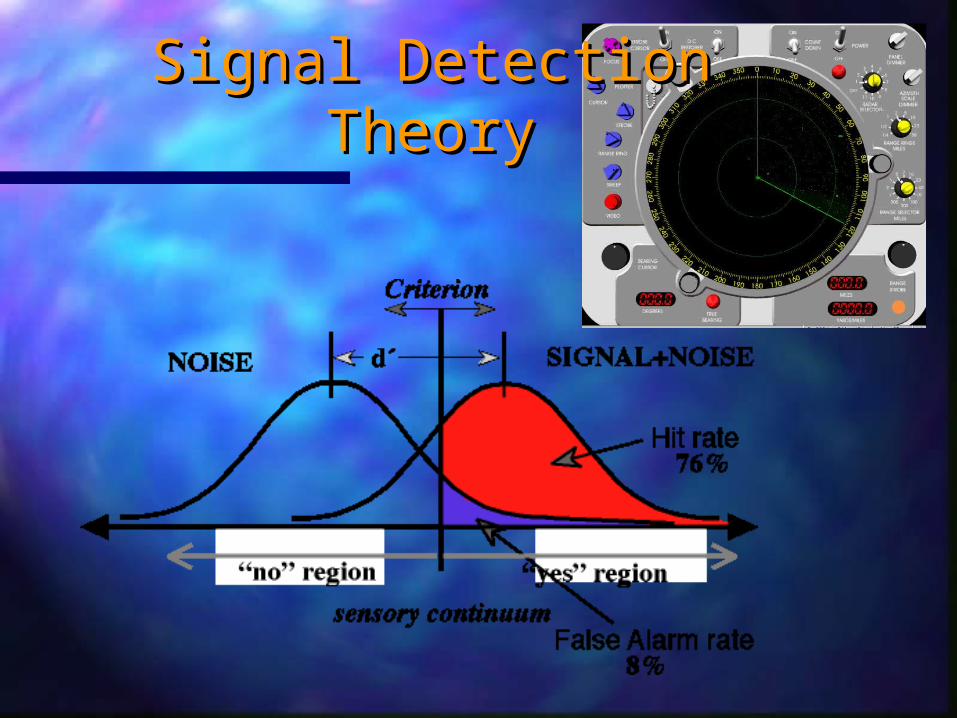
Signal Detection TheorySignal Detection Theory
Signal Detection TheorySignal Detection Theory
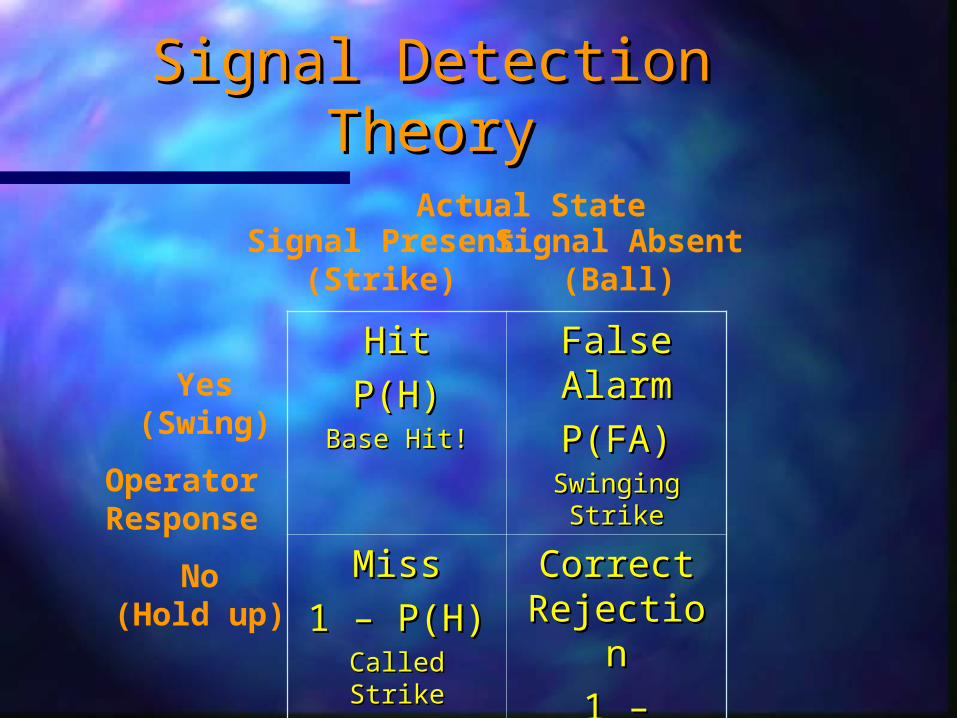
HitHit
P(H)P(H)Base Hit!Base Hit!
False False AlarmAlarm
P(FA)P(FA)Swinging Swinging
StrikeStrike
MissMiss
1 – P(H)1 – P(H)Called StrikeCalled Strike
Correct Correct RejectionRejection
1 – P(FA)1 – P(FA)BallBall
Actual StateSignal Present
(Strike)Signal Absent
(Ball)
OperatorResponse
Yes(Swing)
No(Hold up)

Signal Detection TheorySignal Detection Theory
Receiver Operating Characteristic Curve
1.0
00 1.0P(FA)
P(H)
Zero S
ensitivi
ty (d
’ = 0)
Mod
erat
e Sen
sitivi
ty (d
’ = 2
)
High Sensit
ivity
(d’ =
4)
SDT Homework
z table

SDT ApplicationSDT Application
Think of some situation to which you can apply signal detection theory. 1. What do each of the outcomes (hit, miss, false alarm, correct rejection) mean in the context you are thinking about? What are their consequences? 2. How great do you think d' (the sensitivity) is in this situation (is there a lot or little overlap between the 'signal' and 'noise' curves)? How might we change d' in this situation? 3. What might cause people to adopt a certain b (the criterion) in this situation? Is a risky or a conservative criterion preferable? How might we change b in this situation? 4. What might be a consequence of examining the situation using signal detection theory rather than simply monitoring with one standard assessment measure (hits, false alarms...)?
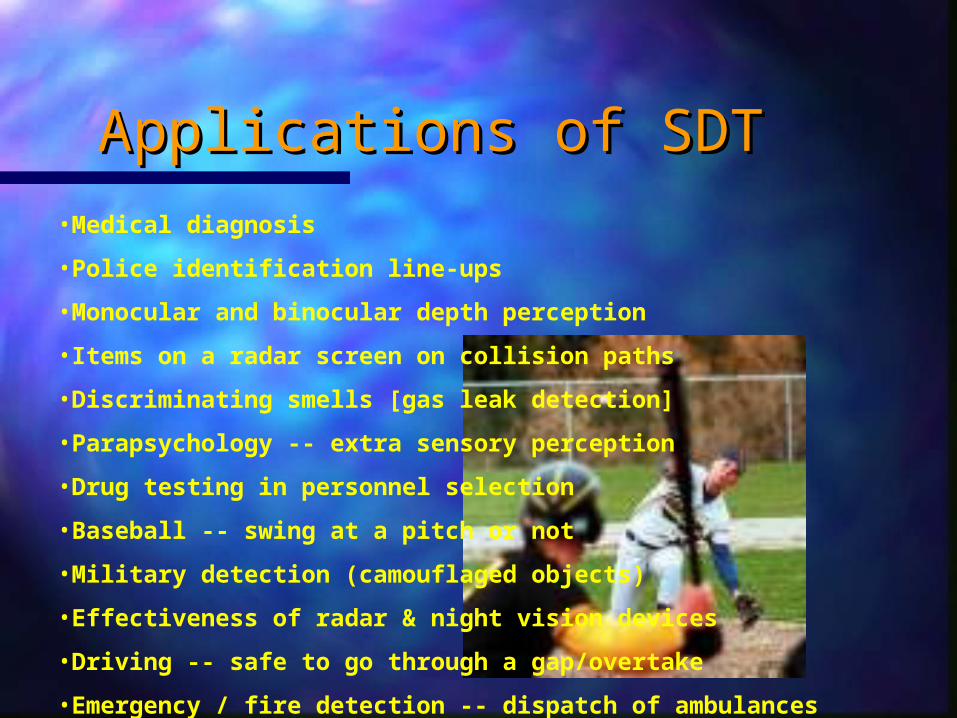
Applications of SDTApplications of SDT•Medical diagnosis
•Police identification line-ups
•Monocular and binocular depth perception
•Items on a radar screen on collision paths
•Discriminating smells [gas leak detection]
•Parapsychology -- extra sensory perception
•Drug testing in personnel selection
•Baseball -- swing at a pitch or not
•Military detection (camouflaged objects)
•Effectiveness of radar & night vision devices
•Driving -- safe to go through a gap/overtake
•Emergency / fire detection -- dispatch of ambulances