visual comparison for information...
TRANSCRIPT

Preprint: Copy contains subtle differences with final publisher’s version
Visual Comparison for Information Visualization
Michael Gleicher∗ Danielle Albers † Rick Walker ‡ Ilir Jusufi §
Charles D. Hansen ¶ Jonathan C. Roberts‖
August 31, 2011
Abstract
Data analysis often involves the comparison of complex objects. With the ever increasing amountsand complexity of data, the demand for systems to help with these comparisons is also growing. In-creasingly, information visualization tools support such comparisons explicitly, beyond simply allowinga viewer to examine each object individually. In this paper, we argue that the design of informationvisualizations of complex objects can, and should, be studied in general, that is independently of whatthose objects are. As a first step in developing this general understanding of comparison, we proposea general taxonomy of visual designs for comparison that groups designs into three basic categories,which can be combined. To clarify the taxonomy and validate its completeness, we provide a survey ofwork in information visualization related to comparison. Although we find a great diversity of systemsand approaches, we find that all designs are assembled from the building blocks of juxtaposition, super-position, and explicit encodings. This initial exploration shows the power of our model, and suggestsfuture challenges in developing a general understanding of comparative visualization and facilitating thedevelopment of more comparative visualization tools.
1 Introduction
Scientists, engineers, and analysts work with increasingly large and complex data sets. Visualization toolsare essential to understanding, analyzing and communicating data. Information visualization with complexdata often involves comparison. Comparison tasks appear across many domains such as biology, networkanalysis, organic chemistry, medical physiology and homeland security and types of data objects includinggraphs, tabular data and surfaces.
While visualization has traditionally focused on tools for examining individual objects, the past few yearshave seen an increasing number of systems explicitly designed to address comparison tasks. For example,successful systems have been demonstrated for comparing large phylogenic trees [101], module relation-ships within large software systems [68], genetic sequences [107] and other complex data objects. Thesesystems show the value in developing tools that explicitly support comparison tasks.
Example systems show the potential of, and challenges for, comparative visualization for information visu-alization. However, they offer only limited assistance in trying to provide comparative visualization more∗Department of Computer Sciences, University of Wisconsin - Madison, [email protected]†Department of Computer Sciences, University of Wisconsin - Madison ,[email protected]‡School of Computer Science, Bangor University, [email protected]§School of Computer Science, Physics and Mathematics, Linnaeus University, Vaxjo, Sweden, [email protected]¶School of Computing and SCI Institute, University of Utah, [email protected]‖School of Computer Science, Bangor University, [email protected]
1

Preprint: Copy contains subtle differences with final publisher’s version
broadly: each new scenario seems to require a specific custom solution, with little guidance available toinform the design for other applications. To date, however, there has been little discussion of the generalissues common to comparison tasks.
Our premise is that there are issues common to comparison, independent of what is being compared. Devel-oping an understanding of comparison in general will facilitate the development of future comparison tools.As a first step in this direction, this paper presents a taxonomy of visual designs for comparison that applyacross the range of application domains and data types. By providing a simple map of the space of designs,our model can help in understanding the patterns common in the comparison of complex objects.
Specifically, we propose a taxonomy that divides the space of comparative designs into three general cat-egories, based on how the relationships between the related parts of different objects are encoded. Thesethree categories – juxtaposition (showing different objects separately), superposition (overlaying objects inthe same space) and explicit encoding of relationships – will be introduced in Section 2. This taxonomyis independent of the objects being compared: we see examples of all design categories for many differentapplications and data types. However, the categories do seem to have issues, tradeoffs and solutions thatapply across domains.
Our model grew out of the Dagstuhl Workshop “Information Visualization” [81]. The three-way taxonomywas suggested as part of a broader model of generalized comparison by the first author. The Dagsthul “work-ing group” discussion focused on developing this model, including noting its similarities to taxonomies inrelated areas (such as coordinated multiple views [112]). The idea that such a simple model could ade-quately capture the space was surprising. Therefore, to validate the model, we have conducted a surveyaimed at finding the diversity of comparison solutions across information visualization. This survey notonly confirms that the model covers the range of designs in a meaningful way, but has also helped us refinethe model without increasing its complexity. The survey also helps illustrate the model.
This paper provides a taxonomy for mapping the design space of comparative visualizations. We do notsuggest that one category of designs is superior to another: on the contrary, we find that each strategy hasstrengths and weaknesses. The map of the design space can serve to understand trade-offs in selectingan approach for a new design. We provide a survey of information visualization systems designed forcomparison of complex objects to elucidate and confirm this model. However, our primary conclusion isthat a better understanding of comparison will be valuable in developing specific visualization solutions.
1.1 Problem and Scope
Our focus in this paper is on the comparison of complex objects of similar form. Although comparisonmight apply at any level of complexity, it is most useful and important as the objects being considered growmore complex. For instance, a single bar chart might be considered as a juxtaposition comparison, in whicha user must compare the length of adjacent bars. However, we focus on problems such as comparing twoseparate graphs or sequences as the issues of comparison become more pronounced. Similarly, problemsof information fusion, where different types of data must be registered together, may also utilize relatedprinciples. We also place these out of the scope of this article.
Complexity comes in many forms. Generally, it involves objects with many subparts, such as graphs orsequences. The complexity comes not only from the size (the number of subparts) but also the abstractnessof the information (such as connectedness in graphs) and the subtleness of the patterns within the data.
Visualizing a single complex object can be difficult. However, when performing a comparison additionalissues arise. For example, the viewer needs to find connections both within and between objects. Therelationships may be complex themselves – multidimensional and multiscale. New perceptual issues canarise, as we will mention later.
2

Preprint: Copy contains subtle differences with final publisher’s version
A key challenge in comparison is dealing with scalability. The comparison problems scales in both thecomplexity of the objects and the number of objects to compare. In our survey, we see systems that comparejust two complex objects, such as the AC Plagiarism Detection System [52], Mizbee [96], the SemanticGraph Visualizer [8], COMBO [43] and SHERLOCK [146], or a larger number of objects, such as ParallelSets [13], ETE [69], HNMap [93], The Information Mural [74] and ActiviTree [144].
1.2 How to Compare Objects?
Given that comparing complex objects is difficult, we can ask how visualization systems can provide supportto make it easier. One strategy is to remove the complexity by abstracting it away, turning complex objectsinto simpler ones that are easier to compare. This strategy has been applied in comparative visualizationsystems either by abstracting the objects themselves, for example Amenta and Klinger [7] abstract trees aspoints in a low dimensional space, or by abstracting the relationships between them, and Holten [67] useshierarchical edge bundling to portray the relationships between trees. Note that abstraction is orthogonal tothe problem of comparison: after simplification, objects still need to be compared.
Another alternative is that a viewer can be provided with no explicit support for making the comparisonbetween objects. In such a situation the viewer must examine each object separately. They may look atobjects sequentially, or they might use separate windows side-by-side (or even use separate machines).Either way, the viewer must rely on his or her memory to make the comparison. Visualizations explicitlydesigned to aid with comparison seek to reduce this memory effort.
Our focus in this paper is on visualizations designed to support comparison. Our observation is that whilethere is a very diverse array of designs supporting a wide range of situations (e.g. varying data types andtasks), these designs all seem to combine three basic elements: juxtaposition, superposition, and explicitencoding. We have limited our scope in this paper to focus on this taxonomy of visual design strategies.
1.3 Related Work
To our knowledge, the only work in the information visualization community that explicitly explore therange of comparison solutions is Graham and Kennedy’s survey of comparison for the specific data type oftrees [56]. While many of the general issues come up in their survey, their focus is on the various visualencodings of trees and is therefore specific to this data type. Our taxonomy is orthogonal to theirs, andcould serve as a tool for understanding the different encodings they consider. Although there are numerousother taxonomies proposed in the literature, none of these consider the issues of comparison. Taxonomiesof tasks [6], data types [114, 145] and algorithms [134] all provide ways of looking at different aspects ofvisualizations, and could be combined with our views of comparison strategies.
The broader visualization community also considers comparison. A few works consider comparing com-parison strategies. Notably, a three-way taxonomy of comparison has been proposed by Pang and col-leagues [121, 141]. This taxonomy considers the degree of abstraction of the data done before comparison,and provides a complimentary space to our taxonomy. Other surveys explore designs for applying specificstrategies to specific problems, notably work on visual encodings for flow visualizations that enable super-position designs [139]. While we believe our taxonomy is valuable to visualization applications beyondinformation visualization, we focus on information visualization here.
Our categories are not unprecedented. For example, Roberts [111] uses similar categories (separate, overlay,fusion) to categorize the types of views in multiple-view coordination systems.
3

Preprint: Copy contains subtle differences with final publisher’s version
0
2
4
6
0
2
4
6
Sensor X
Sensor Y
a) Juxtaposition
0
2
4
6
8
Sensor X
Sensor Y
b) Superposition
X-Y
-3
-2
-1
0
1
2
3
c) Explicit Encoding:Difference
Sensor X
Se
nso
r Y
0
5
10
15
20
25
30
35
d) Explicit Encoding: TimeWarp
Figure 1: A simple example of comparative visualizations: comparing two time series. For example, the data might represent mea-surements from two sensors (X and Y) taken over time. The three basic approaches for comparative visualization are (a) juxtaposition,(b) superposition, (c,d) explicit encoding of relationships. Two new representations from fusion are shown: (c) signal subtraction and(d) a time alignment curve, such as produced by dynamic time warping.
2 A Taxonomy of Comparative Designs
Our key observation is that the range of visual designs for explicitly assisting with comparison fall intothree categories. Juxtaposition (or separation) designs present each object separately (i.e. next to eachother, in either time or space). Superposition (or overlay) designs present multiple objects in the samecoordinate system (i.e. on top of one another). A third category of design is explicit representation ofthe relationships that directly encodes connections between objects visually. A simple example of thesecategories is shown in Figure 1.
Juxtaposition designs place objects separately in either time or space. Such designs rely on the viewer’smemory to make the connections between objects. However, with proper design, juxtapositions can help theuser shift their attention between objects or see patterns between elements. Tufte calls spatial juxtapositiondesigns small multiples and suggests that “comparison must take place within the eyespan” [138]. Morediscussion follows in Section 3.2 below.
Superposition designs overlay multiple objects, presenting them at the same place and time. Figure 1(b)shows two co-located lines that are visually distinguished by color.
Explicit encodings compute the relationships between objects and provide visual encoding of the relation-ships. Figure 1(c) shows the subtraction of the two objects, and Figure 1(d) shows a time warp alignment.
The three categories can be distinguished by the principal mechanism used to make connections betweenobjects: juxtaposition uses the viewer’s memory, superposition uses the visual system and explicit encodingsuse computation to determine the relationships. The three categories can also be distinguished by how thecorrespondences between parts are encoded: in juxtaposition, they are not; in superposition, proximity isused to encode connections; and explicit encodings use some other visual encodings.
We feel these three categories are fundamental: they provide the building blocks that all comparisons canassemble. However, the three designs may be combined to create hybrid ones that use elements of two cat-egories. We have not encountered a hybrid of all three, though it may be possible. Therefore, although ourtaxonomy might contain seven different categories (juxtaposition, superposition, explicit encodings, jux-taposition+explicit encodings, superposition+explicit encodings, juxtaposition+superposition, and all threecombined), we consider only three basic categories and three hybrid categories. Figure 2 illustrates all ofthe categories, including some of the key variants of each, on a simple example of comparing a network viaa node-link diagram.
The hybrid categories are important as they provide designs that mix the basic design elements to addressissues in any particular one. However, they are different from the primary categories as they do not introduce
4

Preprint: Copy contains subtle differences with final publisher’s version
a) Naıve Juxtaposition(each network laid outindependently)
b) Juxtaposition (usingsimilar layouts to aidcomparison)
c) Superposition (in thesame space)
d) Explicit Encoding:Replacement (upper:union graph, lower:intersection graph)
e) Explicit Encoding:Additive (members ofthe intersection shownadded to one of thegraphs)
f) Juxtaposition +Superposition
g) Juxtaposition +Explicit Encodings:Using view coordinationto highlightcorrespondences
h) Juxtaposition +Explicit Encoding:Additive (intersectionsadded)
i) Juxtaposition +Explicit Encoding:Abstraction (cliquesshown over juxtaposedviews)
j) Superposition +Explicit Encoding:Overlay encoding
k) Superposition +Explicit Encoding: Ab-straction+superposition(cliques shown oversuperimposed view)
Figure 2: Two networks (illustrated as node-link diagrams) are compared using designs of the six categories, with some of the majortypes in categories shown. These designs are meant as an illustration to define the category/type, not as being representative of asuccessful strategy for comparing two small networks.
5

Preprint: Copy contains subtle differences with final publisher’s version
any new mechanisms. Juxtaposition may be coupled with explicit encodings, for example to use viewcoordination to highlight corresponding parts or to draw connections to emphasize them. Superpositiondesigns are sometimes combined with explicit encodings to overcome clutter: for example showing graphdifferences on a union graph. The combination of juxtaposition and superposition is uncommon.
The three primary categories and three hybrid categories form a map of the space of comparative designs,visualized in Figure 3. While some visualization systems may contain multiple displays, and thereforemultiple designs, we have found that most, if not all, comparative designs fall into one of these six places.
We emphasize that our taxonomy is focused on the visual design for comparison of complex objects. Thatis not to say there are not other ways to approach comparison, for example by using analytic or statisticalmethods to make the comparisons and then potentially using more standard visual designs to portray theseresults. Similarly, there are many interaction techniques that are used to help with comparison. Theseare also closely related to the designs we consider. For example, multiple-view coordination interactionis often used to enhance visual comparison designs, for example to allow for interactive highlighting ofcorresponding selected parts in juxtaposed views. Such interactions usually have a visual component, forexample the highlighting, that do appear in our taxonomy (e.g. as explicit encodings).
Although there are many possible ways to map the space of comparative visualizations, we believe that ourtaxonomy is useful for a number of reasons. Foremost, it categorizes the space of designs in a manner thatallows related methods to be grouped by design, so that we can better generalize the constraints and advan-tages of each form. Common issues and solutions can be transferred between similar designs even when theunderlying data or domain are quite different. The design categories also bring a connection with the percep-tual/cognitive resources that people use in comparison: juxtaposition relies on memory to hold the multipleitems and make connections; superposition may make comparison more efficient by keeping informationin spatially local correspondence; explicit encodings parallel more analytic comparison where new modelsare constructed. The taxonomy also seems to be complete (it covers all designs we have encountered), andrelatively clean (most designs clearly fall in one category).
2.1 Other Factors in Comparative Designs
Our focus in this paper is on the taxonomy of visual strategies for comparison that emerged from theDagstuhl workshop. However, some other methods are worth mention as they dovetail with visual strategies.
Interaction techniques are an invaluable tool in augmenting visual comparison, and have been applied inmany ways to address issues in comparative designs. Common interaction paradigms to assist comparisoninclude brushing and linking to make connections between related components, interactive rearrangementand alignment to reorder objects to allow for easier comparison, and view control mechanisms specializedto facilitate comparison (such as the guaranteed visibility mechanisms of TreeJuxtaposer [101]). The utilityof interaction applies across the space of visual designs.
Analytical and statistical tools provide not only an alternative to visual comparison, but can also serve tocomplement it and enhance visual designs. Automatic comparison tools, such as alignment or distance met-rics, provide some information that relate complex objects. Sometimes, such methods serve as a data reduc-tion providing a new visualization problem in interpreting the automated comparisons. In other instances,automated comparisons can be used to facilitate more detailed visual analysis. For example, registration canbe used to remove inconsequential differences so that mental alignment of basic forms need not be done bethe viewer, or may provide indications of the relationships, such as providing matching landmark points tohelp connect between objects.
The perceptual and cognitive science communities have considered the question of visual comparison for awhile (see [46]). Recent results suggest that some kinds of comparisons are easy, whereas others are more
6

Preprint: Copy contains subtle differences with final publisher’s version
difficult. For example, translated copies are easy to compare [87], but texture, orientation, scale, space,and time may complicate comparison [10, 86, 141]. This is in part because visual comparison happensat different semantic and cognitive levels [72, 121]. It is naıve to call the difficulties in seeing differences“change blindness” as it is really a more complex set of phenomena [108] that relate to limitations in themechanisms of perception [49]. Recent studies have shown that difficulties in detecting change can occureven when the change takes place in a visually persistent image [99, 125, 126].
Animation, or temporally changing images, is a fundamental tool for many different types of visual compar-ison. As it is used in many different ways to facilitate comparison, it interacts with our taxonomy in multipleways. The most straightforward use of animation is the serial display of the objects to be compared. In termsof our taxonomy, we would consider this a juxtaposition in time as it predominantly requires the use of theviewer’s memory and attention shifts to make connections between objects. The issues around “changeblindness” discussed above influence the effectiveness of such a strategy. The parallels between spatial andtemporal juxtaposition can also be seen in time-lapse imagery, a technique popularized over a century agoby Muybridge’s photography. Keefe et al [79] explore the interchange animation and spatial juxtaposition:they combine animation and small multiples displays in the study of dynamic data.
A related use of animation for comparison is to alternate the display of two aligned objects, such that thedifferences “blink.” Such blink comparison is a form superposition design as it places objects to be comparedin the same space so that differences can be detected as low-level visual features (i.e. blinking).
Another use of animation is to help illustrate the connections between objects to be compared, for exampleby showing animated transitions. While there is evidence that transitions can be helpful in understanding theconnections between complex objects [63], the underlying perceptual mechanisms suggest that the approachmay not scale well [5, 50, 51]. Such use of animation is considered an explicit encoding in our taxonomy,and might either serve by itself, or to enhance a juxtaposed or superimposed design (i.e. as a design thatwould fall into a hybrid category such as juxtaposition+explicit encoding).
3 A Survey of Comparison Visualizations
In this section, we survey a number of representative systems from the information visualization literature,the designs of which explicitly support the comparison of complex objects. Rather than trying to identifyall systems that support comparison, we seek instead to show the diversity of application domains and datatypes, and to show that the diversity of designs is mapped by our taxonomy.
The design space provides three primary categories (juxtaposition, superposition, and explicit representa-tion). Each pairing of these categories creates a meaningful category in its own right, yielding a total of sixcategories. In our survey, all comparative visualization designs fall into one of these categories. We willnote some outliers, systems with classifications that emphasize the boundaries of the categories, but we havefound such examples reinforce, rather than blur, the distinctions.
An overall map of the design space is shown in Figure 3. This triangular scatterplot shows where each designfalls into the categorization and allows the demographics of designs to emerge. Although the popularity ofdifferent designs may be an artifact of our sparse sampling of examples, we feel the major trends can beexplained.
After a discussion of our survey methodology, the following subsections describe each category.
3.1 Survey Methodology
In order to understand the diversity of designs for the comparison of complex objects, we conducted a surveyof the information visualization literature and identified over 110 references that we felt included designsfor the comparison of complex objects. We note that this leads to more designs than systems, as many
7

Preprint: Copy contains subtle differences with final publisher’s version
Figure 3: The design space provides three primary categories (juxtaposition, superposition, and explicit representation) with the threeintermediary categories. The visualization is taken from our database of systems that we have researched. Our database includesa number of representative systems from the Information Visualization literature whose designs explicitly support the comparison ofcomplex objects, which demonstrates the diversity of the systems.
systems include several designs of different types (e.g. in providing multiple views). The overall result isthat each design does appear to fall into a single category (including the three basic categories and the hybridcategories). Some systems may appear in multiple categories, as they contain multiple designs, each fallinginto a different category.
A list of systems surveyed is listed in the appendix of this paper. In total, 111 systems, and 173 designs wereconsidered (again, many systems included multiple designs). Space concerns preclude us from discussingeach system, and the comparisons they contain, adequately. Instead, we provide a companion website (http://graphics.cs.wisc.edu/Vis/CompIV) for this paper that contains a full list of the var-ious systems and comparison designs we have surveyed, along with a brief explanation of how each wascategorized. By providing this table as a companion website, we are able to provide adequate descriptionsof each system, allow for sorting or filtering by various criteria, provide dynamic visualizations of the data,and provide the opportunity to have the survey grow as we become aware of more systems.
While this survey is not exhaustive, we feel that it is sufficiently comprehensive to give an idea of howthe design space is populated. In addition to choosing a selective sampling of exemplary systems, we havealso systematically scanned the past four years of information visualization conference proceedings. Whilesome important examples are undoubtedly missing, the sampling is large enough for emerging patterns tobe considered informative and not just artifacts of sampling error.
Our selection criteria was based on whether we felt that a system (or a design within a system) was explicitlyintended to help with the comparison of some form of complex object. This criteria causes us to excludesome categories of tools. For example, we do not include toolkits that might be used in assembling specificvisualization designs. Similarly, we do not include general purpose visualization tools for looking at (poten-tially large quantities) of simpler objects, such as Tableau (http://www.tableausoftware.com//),
8

Preprint: Copy contains subtle differences with final publisher’s version
JMP (http://www.jmp.com/), or Spotfire (http://spotfire.tibco.com/). To place suchgeneral tools or toolkits would require examining a particular way in which they are used to perform com-parison for a particular kind of complex object. Although such tools and toolkits may certainly be usedto realize a wide variety of comparative designs, their flexibility does not provide insight on designs forcomparison, as we seek to explore in this survey.
The criteria for “complex” objects is, admittedly, ad hoc. However, rather than trying to define a clearboundary of what is, and is not, a visual comparison of complex object, we simply have aimed to includeenough examples to see the diversity in comparison designs. This has caused to to exclude some systemsthat compare less complex objects, but also to omit systems that compare complex objects by applyinganalysis that reduces the complexity of the objects, such as dimensionality reduction, and then uses standardmethods for the visualization of collections of simpler objects. Although the use of analysis to allow standardvisualization approaches to be applied for the comparison of complex objects is a common and importantapproach, we have chosen to focus on the use of visual designs that directly compare complex objects. Whileour design framework may apply to basic visualization approaches for collections of simple objects, such asgraphs, scatterplots, and parallel coordinate views, we are not sure if it would provide any new insights onthem.
The primary focus of our survey is to show the diversity of comparative designs, therefore we have usedour six categories (three basic designs and their combinations) as the primary organization. However, itis useful to simultaneously categorize systems in other ways to show the diversity of applications of eachdesign type. For example, one might categorize systems by their application domain (such as genetics orsocial connections), data type (such as networks or sequences) or some other categorization proposed in thevisualization community (such as the visual form categories of Bertin [14] and Lohse et al. [91]).
Although there are many ways to categorize such a survey, we feel that organization by comparative design isa useful one. Systems within each category are diverse, spanning different data types and problem domains,yet face similar problems and often can use similar solutions. In the following sections, we use a fewrepresentative examples to illustrate the categories, and refer to the companion website and tables for moreexamples.
3.2 Juxtaposition
Juxtaposition designs show the objects to be compared separately. This separation can occur either in time,or in space. The key element in a juxtaposition design is that individual objects are shown independently.Many examples of systems incorporating juxtaposition designs are given in the companion web site.
Juxtaposition usually occurs in space (placing different views next to each other). This is sometimes referredto as a small multiples design [137], and depending on their appearance they can be named dual-views [102]or side-by-side views [85]. Juxtaposition in time, a form of animation, was discussed earlier. Juxtapositionsin space or time share similar issues in they rely on memory for comparison, although this may be augmentedby pre-attentive pattern or motion perception.
At the surface, juxtaposition designs are easy to implement as they require little changes to what is requiredto draw the individual objects. They can be applied to any visual representation. Juxtaposition worksbest when visual processing can easily match objects, allowing for repeated patterns and differences to benoticed. While perceptual science suggests certain kinds of changes are easier to factor [33, 104, 109, 118,119,124,125], the design of good small multiples displays is an art [137]. In principle, scaling juxtapositionto larger numbers of objects to compare is straightforward, as the independent displays simply must bereplicated, however such designs may not scale well perceptually.
One of the earliest demonstrations of juxtaposition is shown by the English Hexapla New Testament [135].
9

Preprint: Copy contains subtle differences with final publisher’s version
Figure 4: Sequence Surveyor [2, 3] uses juxtaposition to compare aligned genomic sequences. Each row represents the sequenceof genes of an organism. Homologs (groups of matching genes) are assigned the same color. Colors are assigned based on theposition of genes in the reference genome (indicated by the green rectangle). In such a juxtaposition design, each object (here a rowrepresenting a genome) is displayed independently: the viewer must make the connections between objects. In contrast, Figure 7shows similar data in a design where the connections are explicitly encoded.
Here six English translations of the Bible are located in parallel columns, additionally with the Greek trans-lation at the top. Such a display requires the viewer to identify differences. Because difference finding iseasy to automate, computational tools rarely use pure juxtaposition displays. For instance, the UNIX tooldiff was developed in the early 1970s [70] and outputs line-by-line difference of two files. This representa-tion would be considered an explicit encoding, as it shows the relationships (differences) between texts. Inpractice, visual tools for file comparison usually combine the two: visual difference utilities often explicitlyshow the differences, but in the context of the files themselves, often with side-by-side views. Subsequentsections discuss such explicit encoding designs and their combinations. Juxtaposition does appear in textcomparison systems. For example, SHERLOCK [146] compares two submissions side-by-side and onlinetools such as Turnitin [131] demonstrate where files are copied from each other, from items already storedin a repository and from Internet sites. Other web-browsing tools demonstrate Juxtaposition capability, suchas WebForager [17] where several web-pages are in a virtual space to allow the user to choose where tobrowse.
A key challenge in juxtaposition designs is that because the objects are separated, it may be difficult fora viewer to see the relationships between them. Pure juxtaposition designs arguably rely on the naturalability to see pattern in repeated objects, which can be helped through careful design and placing the objectssufficiently close together [137]. For example, Sequence Surveyor [2, 3], shown in Figure 4, attempts touse perceptual principles to design juxtaposed views that enable pattern finding. However, designs oftenattempt to assist a viewer with making these connections, leading to the hybrid categories (below) that blendjuxtaposition with another strategy. For instance, many of the later textual difference tools include someexplicit coordination and are thus found in the Juxtaposition/Explicit Encodings Section 3.6.
3.3 Superposition
Superposition designs show the objects to be compared in the same space. Such designs can be referred toas overlay designs as they usually involve overlaying one object over another. This might be as simple asmaking one object be semi-transparent (such as the X-ray lens of Shaw et al. [120]), or even allowing oneobject to partially obscure another (as the two graphs in Figure 1b). Usually, the different objects are shownin a symmetric, but slightly different way (in Figure1b, each time series is shown as a line, but with differentcolors). As with juxtaposition designs, the display of the objects are independent although, sometimes,
10

Preprint: Copy contains subtle differences with final publisher’s version
Figure 5: Jianu et al. [75] present an example of superimposition. In (a), protein interactions of a specific condition are superimposedover the canonical model. In (b), the data is superimposed over a user-constructed model. By showing data in the same space, therelated parts are related visually. Used with permission.
small adjustments may be made to improve clarity and avoid occlusions.
One important element of superposition design is a sense of ‘the same space’. For some representations,such as maps or charts with axes, the spaces in which objects are embedded are clear and can be madeequivalent. For other data types, defining a common spatialization so that multiple objects can be placed ‘inthe same space’ can be more challenging. An example of a spatialization created to allow for superpositionis the comparison of networks depicted as node-link graphs by laying out the union graph, and then showingeach network depicted on the same layout. An early example of using the union graph for layout is theGEVOL [25] system, that shows each frame in an animated sequence using this consistent layout, whileJianu et al. [75] superimpose proteomic networks and pathway data on a single view, as shown in Figure 5.
Another important element in superposition designs is to show several objects in the same space. This isparticularly difficult when the data is dense (such as an image). The simplest solution, making the imagessemi-transparent (i.e. blending), has issues with clutter, inter-dependence, and scaling beyond a very smallnumber (usually 2 or 3). Methods such as color weaving [60] and attribute blocks [98] offer alternative toblending based on alternating samples from different images. Malik et al. [92] provide an extension of thisbasic approach: considering achieving superimposed images for comparisons at different scales, and largernumbers of images to be overlaid. An example is shown in Figure 6.
More generally, superposition may use computation to find a common spatialization (e.g., an alignment orregistration) between data objects, but this differs from the hybrid superposition / explicit encoding category(section 3.4) because these processes are not encoded visually, but rather used to define the space in whichthe objects themselves are shown.
Superposition is commonly used for situations in which either the spatialization is a key component of thedata or the comparison or where different objects being compared are similar enough to one another thatthey can be viewed on the same plane for the purpose of detecting similarity and difference between objects.Superposition is very common in chart-style visualizations in the form of overlaying value sets onto the sameset of axes. Additionally, maps frequently superimpose different levels of data on a cartographic framework(such as illustrated by Wood et al. [150]). Similarly, diagrams may be compared using superposition in
11

Preprint: Copy contains subtle differences with final publisher’s version
Figure 6: Multi-image view of the voltage dataset series of Malik et al. [92]. This design addresses the problem of multi-way superpo-sition by breaking the space into hexagonal regions. Each region depicts data from the different series, as indicated by the key in thelower left. Used with permission.
order to view the similarity between different processes on the same plane. The space-filling complexity ofnetworks and images makes effective use of superposition challenging.
3.4 Explicit Encoding
The explicit encoding category includes design where the relationships between objects are shown explicitlyby providing a visual encoding of them. Such a design, by definition, requires that the relationships betweenobjects are known. This requires some pre-supposed sense of what relationships may be of interest, andsome mechanism to compute them explicitly. In contrast, other basic designs do not need to know therelationships between objects: the objects are shown directly, and the viewer finds the relationships. Theuse of explicit encoding provides a tradeoff: on one hand, it uses computation to find relationships, sparingthe viewer of that effort; on the other hand, it requires knowing what relationships to look for and having amechanism for finding them so that they can be presented.
Pure explicit encoding designs visually encode only the relationships between objects. The objects them-selves are not visualized: but rather, a new object determined (usually computed) as the relationship betweenthe original objects is presented visually. We might think of such designs as a replacement of the originalobjects with the new object that represents the relationships.
Pure explicit encoding designs always have a two step process where first the relationships among objectsare computed, and then these relationships are depicted. Simple examples of the first step include findingsimilarities and differences, for example computing the difference between two series or the intersectionof two sets or graphs. The resulting relationships may have the same type as the original data (e.g., thedifference between two time series is also a time series), or it might have a different form (e.g., a sequencealignment is different than a sequence). Several notable examples of purely explicit designs are given in thecompanion web site.
12
Preprint: Copy contains subtle differences with final publisher’s version
One issue in purely explicit encoding designs is that the relationships are removed from the context of theoriginal objects. This can be an advantage if the goal of the visualization is to focus on these relationships.However, it can be difficult for a viewer to connect these relationships back to the objects themselves. Also,the things other than the relationships that have been found will not be made visible to the viewer, so theyhave less chances of finding them. This can happen for relationship types different than what what hasbeen computed, or in cases where the comparison computations are imperfect or sparse (e.g., connectionsbetween sparse points may not provide much information about the connections of point in between).
Decontextualization is one reason why purely explicit encoding designs are rarely used alone. Explicitencodings are often combined with other displays, either in a multiple view system, or in hybrid approaches.The classic example is text comparison, such as the Unix diff tool which shows changed lines from files,with little context to show where these lines come from. More modern, visual tools provide more context.
Another example of combating decontextualization is Mizbee [96] explicitly displays the synteny relation-ships between two genomes, the overview chromosome is displayed around the reference and chromosomesof interest are draw in the loop of the reference. Matching regions are delineated by curves and the informa-tion is coordinated to additional visualization displays including a parallel axis plot.
In order to combat decontextualization, an explicit encoding of the representation may be superimposedon top of a visualization encoding of the objects, or may be shown next to a visualization of the objects(e.g., the views are juxtaposed). Note that in these cases, we are not necessarily using juxtaposition orsuperposition as a comparative visualization design. For example, in an additive design, explicit encodingof the relationships between an object and others are superimposed on a view of the object itself. Examplesof the additive strategy to combat decontexualization include synteny (gene matching) genetic sequenceviewers, such as Mizbee [96] and Mauve [31] (Figure 7). Connections between sequences are explicitlyshown with a representation of the sequences. However, the connections cannot be seen from the sequencerepresentation alone. For this reason, we still categorize additive designs in the explicit encoding category.In contrast, hybrid designs use superposition (or juxtaposition) to show the relations between objects as wellas having relationships shown explicitly.
Comparison by explicit representation is most commonly used when the relationships between objects arethe subject of the comparison. Networks frequently use additive representation in comparison throughlinks in node-link diagrams. Flow data across geographic regions is another common example of explicitrepresentations in maps.
3.5 Juxtaposition combined with Superposition
The hybrid of juxtaposition and superposition designs has the contradiction that objects being compared areboth shown in separate spaces as well as in the same space. Many information visualization systems combinejuxtaposition and superposition views, however, these displays are separate (although possibly linked). Suchsystems are more a statement of the value of both design types, rather than showing a true hybrid design.For example FromDaDy [71] uses superposition to show an overview comparing a large number of flighttrajectories, and then uses a juxtaposition to show details of smaller subsets of this overview. Mixes ofsuperposition and juxtaposition are also common in creating comparisons of comparisons.
One exception to this contradiction occurs when visualizations are composed in more than two dimensions.This scenario allows for superposition in two dimensions and juxtaposition in the rest. While visualizationin more than two dimensions raises perceptual concerns, tools like the 2.5D related metabolic pathwayvisualization [15] (Figure 8 leverage projection to conduct comparison using this type of hybrid design.
As discussed earlier, animating by showing a sequence of views to compare can have elements of bothjuxtaposition and superposition.
13

Preprint: Copy contains subtle differences with final publisher’s version
Figure 7: Mauve [31] uses an additive explicit encoding design to compare conservation trends over a set of aligned genomicsequences. Subsequences (contigs) not conserved by the reference are removed, while matching contigs are explicitly linked. If theselinks are removed, the conservation patterns are no longer visible. Used with permission.
3.6 Juxtaposition combined with Explicit Encoding
The combination of juxtaposition and explicit encoding includes designs that show multiple objects to becompared separately while explicitly showing specific relations that have been computed. This combinationof techniques is particularly valuable because each technique can address some of the shortcomings inthe other. Explicit encodings can help the user make the connections between juxtaposed views, and thejuxtaposed views can give context for the encoded relationships. A number of examples of this combinationof mechanisms are given in the companion web site.
One key subcategory of juxtaposition/explicit encoding hybrid designs is coordinated multiple views brush-ing, especially coordinated brushing (linked highlighting). Such designs assist users in connecting betweenjuxtaposed objects by showing corresponding parts when one is selected.
Another category of juxtaposition/explicit encoding hybrid designs are additive, where linkages are shownvisually overlaid over a juxtaposed view. For example, in sequence comparison visualizations, arrows linkcorresponding blocks between juxtaposed representations of the different sequences. Textual differencetools provide an example of juxtaposition and explicit encoding. Vdiff [11] is shown in Figure 9 shows lines
14

Preprint: Copy contains subtle differences with final publisher’s version
Figure 8: 2.5D proteomic network comparison [15] uses extra dimensions to simultaneously use juxtaposition and superpositionfor network comparison. Manipulating the viewing perspective changes how much each comparison technique is used. Used withpermission.
connecting text elements to denote items of text that have been inserted, unchanged or deleted. Other toolssuch as ItLv [100] displays changes of text as bars that are aligned on a timeline.
One type of such a juxtaposition/explicit encoding approach displays two networks independently. Addi-tionally, it computes a merged graph and shows it in the middle of the two graphs being compared. Thecolor coding is used to identify differences and similarities in the merged graph [8]. Color coding is used inanother approach where constraint layout techniques are used to compare a number of networks. Similar el-ements (nodes) of the network are drawn in the same level to facilitate process of identifying the similarities,while color coding is used to denote the differences [117].
A final category of juxtaposition/explicit encoding hybrid designs uses abstraction of each object in orderto create a more effective juxtaposition. For example, networks may be displayed as juxtaposed node-linkdiagrams with the common arcs highlighted in all.
3.7 Superposition combined with Explicit Encoding
The combination of superposition and explicit encoding of relationships between objects includes designsthat show multiple objects within the same coordinate system (for example, as transparent overlays on top
15
Preprint: Copy contains subtle differences with final publisher’s version
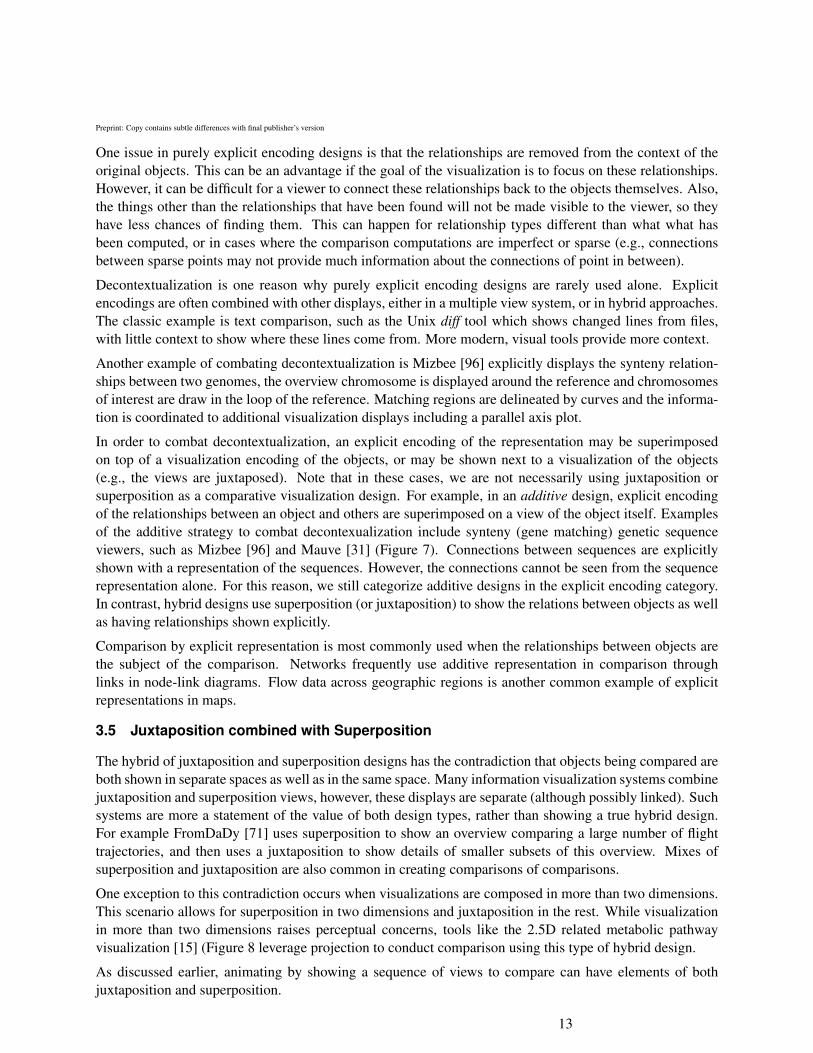
Figure 9: Vdiff [11] demonstrates explicit encoding combined with juxtaposition. Files are shown juxtaposed to provide the viewerwith context, and specific relationships are shown through the use of lines to highlight insertion, similarity and emission. Used withpermission.
of one another) but also make use explicit visual representations of the connections between objects.
The combination of superposition and explicit encodings may be redundant, or even in conflict. Super-position already encodes relationships between objects by spatial proximity. This provides little space forexplicitly encoding relationships (since the related objects are already proximal). However, encoding therelationships by both proximity and some explicit visual representation can be useful, for example to em-phasize the connections by the redundancy, or to show multiple types of relationships. A table of exampledesigns using superposition/explicit encoding designs is provided in the companion web site.
One type of superposition/explicit design uses the explicit encodings to emphasize patterns in the overlaidviews, often to help manage the clutter created when complex objects are superimposed. For instance, themultifield graph technique [115] superposes a pair of data sets and then derives a flow volume from thefusion of the superposition.
Another subcategory of superposition/explicit design involves the abstraction of complex objects into a su-perposition view and explicitly encoding the relationships between these objects. For example, DataMeadow[41] uses this technique as comparison between different objects. Comparison is first conducted by creatinga parallel-coordinate style DataRose for different collections of objects filtered over either a standard queryor fusion filter. These DataRose objects are then connected using links to show relationships between theirrespective objects. Topographic BGPlay [29] (Figure 10) inverts this approach and overlays a topographicmap of ISP prefix locations on top of ISP data networks, managing network layout to correspond to thetopography of the overlying map.
Superposition/explicit designs are frequently used in situations where a summarization of an object or groupof objects can be represented using a superpositioned visual glyph, such as a star plot. Networks frequentlymake use of this technique by blending node-link data with superposition representations of data points atthe nodes. Images can also make use of these techniques by relying on superposition for the spatializa-tion of object data and overlaying glyphs representing the data at particular points. Maps can use heatmapoverlay for superposition encodings and explicitly represent flow across geographic regions using additiveencodings. However, diagrams do not frequently use these techniques as the spatialization of the data-points is predefined in a manner such that its overlay corresponds to the relationships within the data, thuseliminating the need to explicitly encode the relationships.
16

Preprint: Copy contains subtle differences with final publisher’s version
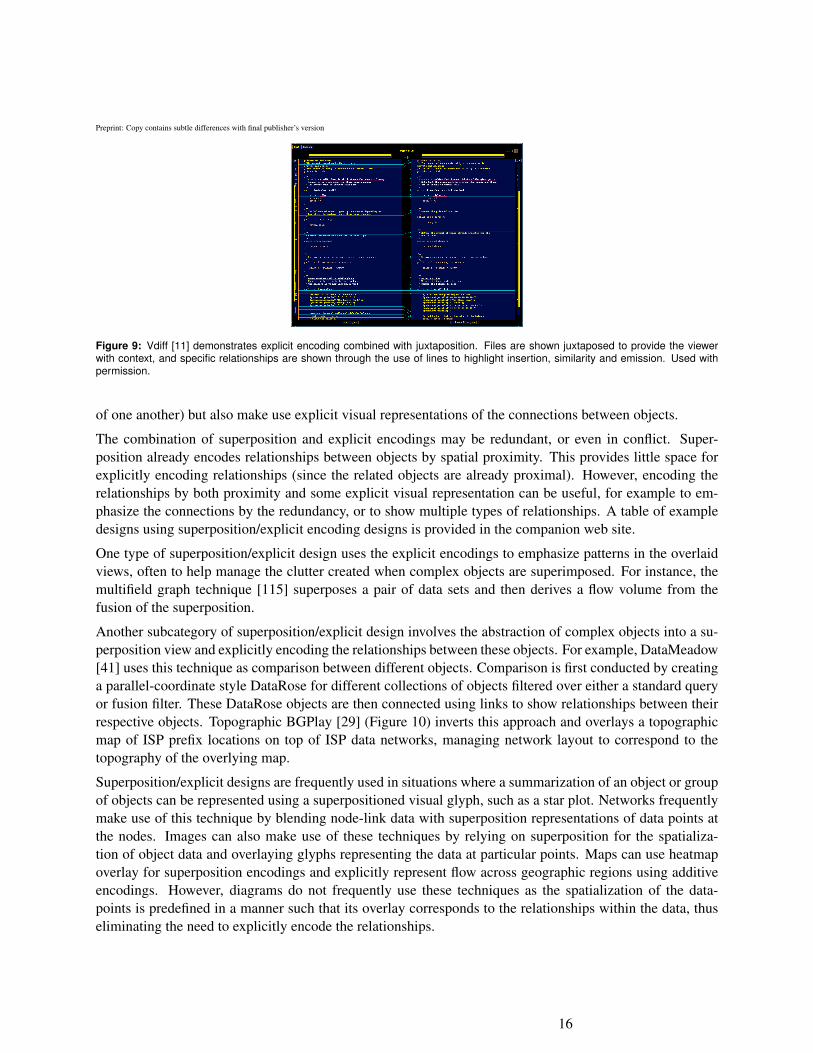
Figure 10: Topographic BGPlay [29] uses explicit encoding and superposition to visualize ISP prefix data. Relationships between theprefixes are shown as a network, while an overlying topographic map encodes region information for the ISPs. Used with permission.
4 Conclusion
The wide range of existing systems shows the importance of visual comparison. However, while this broadrange of tools has a great diversity in the kinds of data, application domain, and designs used to show com-parisons, all of these designs are built from the three primary building blocks: juxtaposition, superposition,and explicit encodings.
While there are plenty of successful examples of comparative designs of varying types, there are few guide-lines to help choosing between strategies when creating a design for a new problem. It is tempting to seekthe superiority of one approach over another, but in reality it seems that each has its tradeoffs. Juxtapositionsare simple to create and can be scaled naively, but place too much of the comparative burden on a viewer’smemory. Superpositions better allow the viewer to use their perceptual system rather than memory, buthave issues with clutter and scalability. Explicit encodings can offload the burden of comparison from theviewer, but require the relationships between objects to be known and must address issues of decontextual-ization. Developing a better understanding of these tradeoffs seems valuable for helping guide design: thesesimplified statements do not capture the complexity of the perceptual, cognitive, or design issues.
Hybrid designs seem to offer the best mechanism toward managing the tradeoffs: each type of hybrid iscapable of addressing issues in the blocks from which it is built by bringing in advantages of its compo-nents. However, hybrid designs also bring issues such as complexity and clutter. There is clearly a set ofdesign issues and principles that needs to be developed. The tradeoff between design complexity and taskperformance needs to be better understood.
The concept of comparative tasks should also be better understood. Comparison is not a single task, butrather, a range of tasks that a viewer may need to perform given a number of related objects. Many basictasks can be enumerated, such as finding similarities, differences and trends, spotting outliers, or determiningcausality of changes. However, a complete taxonomy of such tasks, and their implications for visualizationsthat support them, is an open question.
The survey of existing solutions show that the issues of visual comparison have been addressed in a widevariety of ways. There is no single right answer, but rather, a wide range of ways to assemble the basic
17

Preprint: Copy contains subtle differences with final publisher’s version
elements depending on the specific needs of the problem. The range of existing solutions provides a largerepertoire of useful design elements. However, there are many basic design problems for which good so-lutions are not known, such as the superposition of many objects, or assisting a user in tracking a complexset of correspondences. Some of these basic elements begin to run into some very basic perceptual andcognitive limits [49].
Researchers who are faced with the challenge to develop novel visual depictions will benefit from a betterunderstanding of comparative designs, especially when faced with the challenges of new datasets. Scala-bility is a key challenge: new comparison problems bring more items to compare, more complexity in theitems to compare. Many of the existing approaches scale poorly. New problems also bring more diversityin the kinds of data, but also the kinds of relationships viewers may seek to understand in the data. A betterunderstanding of the design space, to facilitate new designs, will be valuable in addressing these new needs.We believe that by breaking visual comparison into basic elements, we will be able to generalize successfuldesign patterns, including coupling them with interaction and analysis.
Even some very basic design issues have many open questions. For example, layout in juxtaposed viewsis fundamental, but not well-explored. One common issue in juxtaposed views is that order matters. Eventhough the choice of how the various views are ordered may be arbitrary, it has significant effects on how thearray of sub-displays are perceived and how comparisons can be made. Different arrangements may makesome comparisons easier or harder. While the ability to use arrangement to emphasize some aspects of thedata has been explored in some systems, such as the work of Slingsby et al. [127], we are far from having afull understanding of the issues in ordering and layout for juxtaposed views.
By focusing on the common elements of how visual comparison is performed, independent of the data typesor domains, we can gain insight on comparison in general, as well as find ways to transfer designs betweenapplications. While our survey is not encyclopedic, it provides numerous examples that point to commonchallenges, as well as common solutions. In our own work, this has already lead to cross-fertilizationbetween domains (e.g., applying ideas from genomic sequence comparison to literary scholarship [2,3]), aswell as inspiring us to focus on problems we see as central (e.g., the perceptual issues in juxtaposed designs).
Our survey introduces one new way of looking at comparison: the basic forms of the visual design. We be-lieve that there are other ways to explore comparison in general (e.g. without regard to the specifics of whatis being compared). Our initial taxonomy based on design strategy shows the potential for general consid-eration of comparison. We are exploring other ways to look at comparison across the range of applications,in addition to exploiting the lessons of our initial understanding.
As the amount of data available grows, the need for comparative tools will also grow. There have beenmany successes at developing visual tools that support comparison. In this paper, we have tried to beginthe process of learning from the examples to develop general principles that will facilitate the design offuture tools. The taxonomy of basic design types provides a way to see commonality across the diversity ofapplications, suggesting a number of directions for future research.
Acknowledgements
We thank the members of the working group at the Dagstuhl seminar for their help in developing the taxon-omy and for their encouragement in exploring it.
Gleicher and Albers were supported in part by NSF awards IIS-0946598 and CMMI-0941013. Albers wassupported in part by the BACTER training program DoE Genomics:GTL and SciDAC Programs (DE-FG02-04ER25627). Hansen was supported in part by NSF OCI-0906379, National Nuclear Security Administra-tion through DOE Research Grant DE-NA0000740, King Abdullah University of Science and TechnologyAward No. KUS-C1-016-04, and DOE VACET SciDAC. Walker and Roberts were supported in part by the
18

Preprint: Copy contains subtle differences with final publisher’s version
Research Institute of Visual Computing, which is funded by the Welsh Assembly Government as the firstOne Wales national research centre.
References
[1] C. Ahlberg. Spotfire. ACM SIGMOD Record, 25(4):25–29, Dec. 1996.
[2] D. Albers, C. Dewey, and M. Gleicher. Sequence Surveyor: Leveraging Overview for ScalableGenomic Alignment Visualization. IEEE Transactions on Visualization and Computer Graphics,2011. Accepted, to appear.
[3] D. Albers, C. Dewey, and M. Gleicher. Sequence surveyor: Scalable multiple sequence alignmentoverview visualization. In VIZBI Workshop on Visualizing Biological Data, March 2011. VIZBIWorkshop on Visualizing Biological Data Poster Session.
[4] J. Almagro-Garcia, M. Manske, C. Carret, S. Campino, S. Auburn, B. L. Macinnis, G. Maslen,A. Pain, C. I. Newbold, D. P. Kwiatkowski, and T. G. Clark. SnoopCGH: software for visualiz-ing comparative genomic hybridization data. Bioinformatics (Oxford, England), 25(20):2732–2733,October 2009.
[5] G. A. Alvarez and S. L. Franconeri. How many objects can you track? evidence for a resource-limitedtracking mechanism. Journal of Vision, 7(13):1–10, 2007.
[6] R. Amar and J. Stasko. Best paper: A knowledge task-based framework for design and evaluationof information visualizations. In IEEE Symposium on Information Visualization, pages 143–150,Washington, DC, USA, 2004. IEEE Computer Society.
[7] N. Amenta and J. Klingner. Case study: Visualizing sets of evolutionary trees. In Proceedings of theIEEE Symposium on Information Visualization, INFOVIS ’02, pages 71–74, Washington, DC, USA,2002. IEEE Computer Society.
[8] K. Andrews, M. Wohlfahrt, and G. Wurzinger. Visual graph comparison. In Proceedings of the 200913th International Conference Information Visualisation, pages 62–67, Washington, DC, USA, 2009.IEEE Computer Society.
[9] D. Archambault, T. Munzner, and D. Auber. Smashing peacocks further: Drawing quasi-trees frombiconnected components. IEEE Transactions on Visualization and Computer Graphics, 12:813–820,September 2006.
[10] A. Bair and D. House. Grid with a view: Optimal texturing for perception of layered surface shape.IEEE Transactions on Visualization and Computer Graphics, 13(6):1656–1663, Nov.-Dec. 2007.
[11] Barnes, D.J. and Russell, M.T. and Wheadon, M.C. Developing and adapting UNIX tools for work-stations. In Proceedings European Unix Users Group, pages 321–333, Canterbury, UK, 1988. Com-puting Laboratory, The University of Kent.
[12] A. Barsky, T. Munzner, J. Gardy, and R. Kincaid. Cerebral: Visualizing multiple experimental condi-tions on a graph with biological context. IEEE Transactions on Visualization and Computer Graphics,14:1253–1260, November 2008.
[13] F. Bendix, R. Kosara, and H. Hauser. Parallel sets: visual analysis of categorical data. In IEEESymposium on Information Visualization, 2005, pages 133–140, Piscataway, NJ, USA, 2005. IEEEEducational Activities Department.
19

Preprint: Copy contains subtle differences with final publisher’s version
[14] J. Bertin. Semiology of Graphics. The University of Wisconsin Press, 1983.
[15] U. Brandes, T. Dwyer, and F. Schreiber. Visualizing related metabolic pathways in two and a halfdimensions. In Graph Drawing, pages 111–122, Berlin / Heidelberg, Germany, 2003. Springer.
[16] S. P. Callahan, J. Freire, E. Santos, C. E. Scheidegger, C. T. Silva, and H. T. Vo. Vistrails: visualizationmeets data management. In Proceedings of the 2006 ACM SIGMOD international conference onManagement of data, SIGMOD ’06, pages 745–747, New York, NY, USA, 2006. ACM.
[17] S. K. Card, G. G. Robertson, and W. York. The webbook and the web forager: an informationworkspace for the world-wide web. In Proceedings of the SIGCHI conference on Human Factors inComputing Systems: Common Ground, CHI ’96, pages 111–117., New York, NY, USA, 1996. ACM.
[18] T. J. Carver, K. M. Rutherford, M. Berriman, M.-A. Rajandream, B. G. Barrell, and J. Parkhill. ACT:the Artemis comparison tool. Bioinformatics (Oxford, England), 21(16):3422–3423, 2005.
[19] R. Chang, G. Wessel, R. Kosara, E. Sauda, and W. Ribarsky. Legible cities: Focus-dependent multi-resolution visualization of urban relationships. IEEE Transactions on Visualization and ComputerGraphics, 13:1169–1175, November 2007.
[20] J. Chen, A. M. MacEachren, and D. J. Peuquet. Constructing overview + detail dendrogram-matrixviews. IEEE Transactions on Visualization and Computer Graphics, 15:889–896, November 2009.
[21] Y. Chen, L. Wang, M. Dong, and J. Hua. Exemplar-based visualization of large document corpus(infovis2009-1115). IEEE Transactions on Visualization and Computer Graphics, 15:1161–1168,November 2009.
[22] F. Chevenet, C. Brun, A.-L. Banuls, B. Jacq, and R. Christen. Treedyn: towards dynamic graphicsand annotations for analyses of trees. BMC Bioinformatics, 7(1):439–448, 2006.
[23] K. Church and J. Helfman. Dotplot: A program for exploring self-similarity in millions of lines oftext and code. Journal of Computational and Graphical Statistics, 2(2):153–174, 1993.
[24] E. Clarkson, K. Desai, and J. Foley. Resultmaps: Visualization for search interfaces. IEEE Transac-tions on Visualization and Computer Graphics, 15:1057–1064, November 2009.
[25] C. Collberg, S. Kobourov, J. Nagra, J. Pitts, and K. Wampler. A system for graph-based visualizationof the evolution of software. In Proceedings of the 2003 ACM symposium on Software visualization,SoftVis ’03, pages 77–86, 212, New York, NY, USA, 2003. ACM.
[26] C. Collins and S. Carpendale. Vislink: Revealing relationships amongst visualizations. IEEE Trans-actions on Visualization and Computer Graphics, 13:1192–1199, November 2007.
[27] C. Collins, G. Penn, and S. Carpendale. Bubble sets: Revealing set relations with isocontours overexisting visualizations. IEEE Transactions on Visualization and Computer Graphics, 15:1009–1016,November 2009.
[28] C. Collins, F. Viegas, and M. Wattenberg. Parallel tag clouds to explore and analyze faceted textcorpora. In IEEE Symposium on Visual Analytics Science and Technology, pages 91–98, Washington,DC, USA, 2009. IEEE.
[29] P. F. Cortese, G. Di Battista, A. Moneta, M. Patrignani, and M. Pizzonia. Topographic visualizationof prefix propagation in the internet. IEEE Transactions on Visualization and Computer Graphics,12:725–732, September 2006.
20

Preprint: Copy contains subtle differences with final publisher’s version
[30] M. Crampes, J. de Oliveira-Kumar, S. Ranwez, and J. Villerd. Visualizing social photos on a hassediagram for eliciting relations and indexing new photos. IEEE Transactions on Visualization andComputer Graphics, 15:985–992, November 2009.
[31] A. C. E. Darling, B. Mau, F. R. Blattner, and N. T. Perna. Mauve: multiple alignment of conservedgenomic sequence with rearrangements. Genome Res, 14(7):1394–1403, Jul 2004.
[32] E. Deines, M. Bertram, J. Mohring, J. Jegorovs, F. Michel, H. Hagen, and G. M. Nielson. Compar-ative visualization for wave-based and geometric acoustics. IEEE Transactions on Visualization andComputer Graphics, 12(5):1173–1180, 2006.
[33] G. DiGirolamo and D. Hintzman. First impressions are lasting impressions: A primacy effect inmemory for repetitions. PSYCHONOMIC BULLETIN AND REVIEW, 4:121–124, 1997.
[34] M. Dork, S. Carpendale, C. Collins, and C. Williamson. Visgets: Coordinated visualizations for web-based information exploration and discovery. IEEE Transactions on Visualization and ComputerGraphics, 14:1205–1212, November 2008.
[35] D. Dorling, A. Barford, and M. Newman. WORLDMAPPER: the world as you’ve never seen itbefore. IEEE Transactions on Visualization and Computer Graphics, 12(5):757–64, 2006.
[36] C. Duran, Z. Boskovic, M. Imelfort, J. Batley, N. A. Hamilton, and D. Edwards. CMap3D: a 3Dvisualization tool for comparative genetic maps. Bioinformatics (Oxford, England), 26(2):273–274,January 2010.
[37] T. Dwyer, S.-H. Hong, D. Koschutzki, F. Schreiber, and K. Xu. Visual analysis of network centralities.In Proceedings of the 2006 Asia-Pacific Symposium on Information Visualisation - Volume 60, APVis’06, pages 189–197, Darlinghurst, Australia, Australia, 2006. Australian Computer Society, Inc.
[38] J. Dykes and C. Brunsdon. Geographically weighted visualization: Interactive graphics for scale-varying exploratory analysis. IEEE Transactions on Visualization and Computer Graphics, 13:1161–1168, November 2007.
[39] S. G. Eick. Visualizing multi-dimensional data. ACM SIGGRAPH Computer Graphics, 34(1):61,Feb. 2000.
[40] N. Elmqvist, P. Dragicevic, and J.-D. Fekete. Rolling the dice: Multidimensional visual explorationusing scatterplot matrix navigation. IEEE Transactions on Visualization and Computer Graphics,14(6):1539–1548, 2008.
[41] N. Elmqvist, J. Stasko, and P. Tsigas. DataMeadow: A Visual Canvas for Analysis of Large-ScaleMultivariate Data. In IEEE Symposium on Visual Analytics Science and Technology, pages 187–194.IEEE, Oct. 2007.
[42] N. Elmqvist and P. Tsigas. Causality visualization using animated growing polygons. In IEEE Sym-posium on Information Visualization 2003, volume 2003, pages 189–196, Washington, DC, USA,2003. IEEE Computer Society.
[43] R. Engels, T. Yu, C. Burge, J. P. Mesirov, D. DeCaprio, and J. E. Galagan. Combo: a whole genomecomparative browser. Bioinformatics (Oxford, England), 22(14):1782–1783, 2006.
[44] C. Erten, S. G. Kobourov, V. Le, and A. Navabi. Simultaneous graph drawing: Layout algorithmsand visualization schemes. In 11th Symposium on Graph Drawing (GD, pages 437–449, Berlin /Heidelberg, Germany, 2003. Springer.
21

Preprint: Copy contains subtle differences with final publisher’s version
[45] A. Esteban-Marcos, A. E. Darling, and M. A. Ragan. Seevolution: visualizing chromosome evolution.Bioinformatics (Oxford, England), 25(7):960–961, April 2009.
[46] B. Farell. “same” - “different” judgements: A review of current controversies in perceptual compari-son. Psychological Bulletin, 98:419–456, 1985.
[47] M. W. E. J. Fiers, H. van de Wetering, T. H. J. M. Peeters, J. J. van Wijk, and J.-P. Nap. DNAVis:interactive visualization of comparative genome annotations. Bioinformatics (Oxford, England),22(3):354–355, 2006.
[48] D. Fisher. Hotmap: Looking at geographic attention. IEEE Transactions on Visualization and Com-puter Graphics, 13:1184–1191, November 2007.
[49] S. L. Franconeri. The nature and status of visual resources. In D. Resiberg, editor, The OxfordHandbook of Cognitive Psychology. Oxford University Press, New York, NY, USA, 2011.
[50] S. L. Franconeri, S. Jonathan, and J. M. Scimeca. Tracking multiple objects is limited only by objectspacing, not speed, time, or capacity. Psychological Science, 2010.
[51] S. L. Franconeri, J. Lin, Z. W. Pylyshyn, B. Fisher, and J. T. Enns. Multiple object tracking is limitedby crowding, but not speed. Psychonomic Bulletin and Review, 15(4):802–808, 2008.
[52] M. Freire. Visualizing program similarity in the ac plagiarism detection system. In Proceedings ofthe Working Conference on Advanced Visual Interfaces, AVI ’08, pages 404–407, New York, NY,USA, 2008. ACM.
[53] M. Freire, C. Plaisant, B. Shneiderman, and J. Golbeck. ManyNets: an interface for multiple networkanalysis and visualization. In Proceedings of the 28th international conference on Human factors incomputing systems, pages 213–222, New York, NY, USA, 2010. ACM.
[54] Y.-H. Fua, M. O. Ward, and E. A. Rundensteiner. Hierarchical parallel coordinates for exploration oflarge datasets. In Proceedings of the conference on Visualization ’99: celebrating ten years, VIS ’99,pages 43–50, Los Alamitos, CA, USA, 1999. IEEE Computer Society Press.
[55] M. Graham and J. Kennedy. Exploring multiple trees through dag representations. IEEE Transactionson Visualization and Computer Graphics, 13:1294–1301, November 2007.
[56] M. Graham and J. Kennedy. A survey of multiple tree visualisation. Information Visualization,9:235–252, December 2009.
[57] J. R. Grant and P. Stothard. The CGView Server: a comparative genomics tool for circular genomes.Nucleic Acids Research, 36(suppl 2):W181–W184, 2008.
[58] P. Groth, B. Weiss, H.-D. Pohlenz, and U. Leser. Mining phenotypes for gene function prediction.BMC Bioinformatics, 9(1):136–150, 2008.
[59] D. Guo. Flow mapping and multivariate visualization of large spatial interaction data. IEEE Trans-actions on Visualization and Computer Graphics, 15:1041–1048, November 2009.
[60] H. Hagh-Shenas, S. Kim, V. Interrante, and C. Healey. Weaving versus blending: a quantitative as-sessment of the information carrying capacities of two alternative methods for conveying multivariatedata with color. IEEE Transactions on Visualization and Computer Graphics, 13(6):1270 –1277, nov2007.
22
Preprint: Copy contains subtle differences with final publisher’s version
[61] S. Havre, E. Hetzler, K. Perrine, E. Jurrus, and N. Miller. Interactive visualization of multiple queryresults. In Proceedings of the IEEE Symposium on Information Visualization 2001 (INFOVIS’01),pages 105–112, Washington, DC, USA, 2001. IEEE Computer Society.
[62] J. Heer, J. Mackinlay, C. Stolte, and M. Agrawala. Graphical histories for visualization: Support-ing analysis, communication, and evaluation. IEEE Transactions on Visualization and ComputerGraphics, 14:1189–1196, November 2008.
[63] J. Heer and G. Robertson. Animated transitions in statistical data graphics. IEEE Transactions onVisualization and Computer Graphics, 13(6):1240–1247, Nov.-Dec. 2007.
[64] N. Henry and J.-D. Fekete. Matrixexplorer: a dual-representation system to explore social networks.IEEE Transactions on Visualization and Computer Graphics, 12:677–684, September 2006.
[65] N. Henry, J.-D. Fekete, and M. J. McGuffin. Nodetrix: a hybrid visualization of social networks.IEEE Transactions on Visualization and Computer Graphics, 13:1302–1309, November 2007.
[66] U. Hinrichs, H. Schmidt, and S. Carpendale. Emdialog: Bringing information visualization into themuseum. IEEE Transactions on Visualization and Computer Graphics, 14:1181–1188, November2008.
[67] D. Holten. Hierarchical edge bundles: Visualization of adjacency relations in hierarchical data. IEEETransactions on Visualization and Computer Graphics, 12:741–748, September 2006.
[68] D. Holten and J. J. van Wijk. Visual comparison of hierarchically organized data. Computer GraphicsForum, 27:759–766(8), May 2008.
[69] J. Huerta-Cepas, J. Dopazo, and T. Gabaldon. Ete: a python environment for tree exploration. BMCBioinformatics, 11(1):24–30, 2010.
[70] J. W. Hunt and M. D. McIlroy. An algorithm for differential file comparison. Technical Report 41,Computing Science Technical Report, Bell Laboratories, 1976.
[71] C. Hurter, B. Tissoires, and S. Conversy. Fromdady: Spreading aircraft trajectories across viewsto support iterative queries. IEEE Transactions on Visualization and Computer Graphics, 15:1017–1024, November 2009.
[72] J.-S. Hyun, E. K. Woodman, G. F.and Vogel, A. Hollingworth, and S. J. Luck. The comparison ofvisual working memory representations with perceptual inputs. Journal of Experimental Psychology:Human Perception and Performance, 35:1140–1160, 2009.
[73] Y. Ivanov, C. Wren, A. Sorokin, and I. Kaur. Visualizing the history of living spaces. IEEE Transac-tions on Visualization and Computer Graphics, 13(6):1153–1160, 2007.
[74] D. Jerding and J. Stasko. The information mural: a technique for displaying and navigating largeinformation spaces. In Proceedings of Visualization 1995 Conference, pages 43–50, Washington,DC, USA, 1995. IEEE Computer Society.
[75] R. Jianu, K. Yu, L. Cao, V. Nguyen, A. R. Salomon, and D. H. Laidlaw. Visual integration ofquantitative proteomic data, pathways, and protein interactions. IEEE Transactions on Visualizationand Computer Graphics, 16(4):609–620, 2010.
23

Preprint: Copy contains subtle differences with final publisher’s version
[76] H. Jin and H. Cho. Visualization of whole genome alignment with LOD representation. In T. Nishita,Q. Peng, and H.-P. Seidel, editors, Advances in Computer Graphics, volume 4035 of Lecture Notesin Computer Science, pages 502–509. Springer, Berlin / Heidelberg, Germany, 2006.
[77] N. Kadaba, P. Irani, and J. Leboe. Visualizing causal semantics using animations. IEEE Transactionson Visualization and Computer Graphics, 13(6):1254–1261, 2007.
[78] Y. Kawahara, R. Sakate, A. Matsuya, K. Murakami, Y. Sato, H. Zhang, T. Gojobori, T. Itoh, andT. Imanishi. G-compass: a web-based comparative genome browser between human and other verte-brate genomes. Bioinformatics (Oxford, England), 25(24):3321–3322, 2009.
[79] D. F. Keefe, M. Ewert, W. Ribarsky, and R. Chang. Interactive coordinated multiple-view visual-ization of biomechanical motion data. IEEE Transactions on Visualization and Computer Graphics,15(6):1383–1390, 2008.
[80] D. A. Keim and H.-P. Kriegel. VisDB: database exploration using multidimensional visualization.IEEE Computer Graphics and Applications, 14(5):40–49, 1994.
[81] A. Kerren, C. Plaisant, and J. T. Stasko. Information visualization. In Schloss Dagstuhl Workshop,Dagstuhl, Germany, June 2010. Schloss Dagstuhl - Leibniz-Zentrum fuer Informatik, Germany.
[82] P. Kidwell, G. Lebanon, and W. S. Cleveland. Visualizing incomplete and partially ranked data. IEEETransactions on Visualization and Computer Graphics, 14(6):1356–1363, 2008.
[83] B. Kim, B. Lee, S. Knoblach, E. Hoffman, and J. Seo. GeneShelf: a web-based visual interface forlarge gene expression time-series data repositories. IEEE Transactions on Visualization and Com-puter Graphics, 15(6):905–912, 2009.
[84] G. Kumar and M. Garland. Visual exploration of complex time-varying graphs. IEEE Transactionson Visualization and Computer Graphics, 12(5):805–812, 2006.
[85] H. Lam, T. Munzner, and R. Kincaid. Overview use in multiple visual information resolution inter-faces. IEEE Transactions on Visualization and Computer Graphics, 13(6):1278–1285, 2007.
[86] A. Larsen and C. Bundesen. Size scaling in visual pattern recognition. Journal of ExperimentalPsychology: Human Perception and Performance, 4(1):1–20, 1978.
[87] A. Larsen and C. Bundesen. Effects of spatial separation in visual pattern matching: Evidence on therole of mental translation. Journal of Experimental Psychology: Human Perception and Performance,24(3):719–731, 1998.
[88] D. Lee, J.-H. Choi, M. M. Dalkilic, and S. Kim. COMPAM :visualization of combining pairwisealignments for multiple genomes. Bioinformatics (Oxford, England), 22(2):242–244, 2006.
[89] Z. Liu, J. Stasko, and T. Sullivan. SellTrend: inter-attribute visual analysis of temporal transactiondata. IEEE Transactions on Visualization and Computer Graphics, 15(6):1025–1032, November2009.
[90] M. Livny, R. Ramakrishnan, K. Beyer, G. Chen, D. Donjerkovic, S. Lawande, J. Myllymaki, andK. Wenger. DEVise. ACM SIGMOD Record, 26(2):301–312, June 1997.
[91] G. L. Lohse, K. Biolsi, N. Walker, and H. H. Rueter. A classification of visual representations.Communications of ACM, 37(12):36–49, 1994.
24
Preprint: Copy contains subtle differences with final publisher’s version
[92] M. M. Malik, C. Heinzl, and M. E. Groller. Comparative visualization for parameter studies of datasetseries. IEEE Transactions on Visualization and Computer Graphics, 16(5):829–840, Sept. 2010.
[93] F. Mansmann, D. A. Keim, S. C. North, B. Rexroad, and D. Sheleheda. Visual analysis of networktraffic for resource planning, interactive monitoring, and interpretation of security threats. IEEETransactions on Visualization and Computer Graphics, 13(6):1105–1112, 2007.
[94] Y. Mao, J. Dillon, and G. Lebanon. Sequential document visualization. IEEE Transactions on Visu-alization and Computer Graphics, 13(6):1208–1215, 2007.
[95] A. Mehler, Y. Bao, X. Li, Y. Wang, and S. Skiena. Spatial analysis of news sources. IEEE Transac-tions on Visualization and Computer Graphics, 12(5):765–771, 2006.
[96] M. Meyer, T. Munzner, and H. Pfister. Mizbee: A multiscale synteny browser. IEEE Transactions onVisualization and Computer Graphics, 15(6):897–904, Nov.–Dec. 2009.
[97] M. Meyer, B. Wong, M. Styczynski, T. Munzner, and H. Pfister. Pathline: A Tool For ComparativeFunctional Genomics. In EuroVis ’10 Joint Eurographics - IEEE VGTC Symposium on Visualization,volume 29, pages 1043–1052, 2010.
[98] J. R. Miller. Attribute blocks: Visualizing multiple continuously defined attributes. IEEE ComputerGraphics and Applications, 27:57–69, 2007.
[99] S. R. Mitroff, D. Simons, and S. Franconeri. The siren song of implicit change detection. Journal ofExperimental Psychology: Human Perception and Performance, 28(4):798–815, 2002.
[100] C. Monroy, R. Kochumman, R. Furuta, and E. Urbina. Interactive timeline viewer (itlv): A tool tovisualize variants among documents. In Lecture Notes in Computer Science, pages 39–49, London,UK, 2002. Springer-Verlag.
[101] T. Munzner, F. Guimbretiere, S. Tasiran, L. Zhang, and Y. Zhou. Treejuxtaposer: scalable tree com-parison using focus+context with guaranteed visibility. ACM Trans. Graph., 22(3):453–462, 2003.
[102] G. M. Namata, B. Staats, L. Getoor, and B. Shneiderman. A dual-view approach to interactivenetwork visualization. In Proceedings of the 16th ACM conference on Conference on Informationand Knowledge Management, CIKM ’07, pages 939–942, New York, NY, USA, 2007. ACM.
[103] M. Novotny and H. Hauser. Outlier-preserving focus+context visualization in parallel coordinates.IEEE Transactions on Visualization and Computer Graphics, 12(5):893–900, 2006.
[104] L. Nowell, E. Hetzler, and T. Tanasse. Change blindness in information visualization: A case study. InINFOVIS ’01: Proceedings of the IEEE Symposium on Information Visualization 2001 (INFOVIS’01),page 15, Washington, DC, USA, 2001. IEEE Computer Society.
[105] M. Ogawa and K.-L. Ma. Code Swarm: a Design Study in Organic Software Visualization. IEEETransactions on Visualization and Computer Graphics, 15(6):1097–104, 2009.
[106] F. V. Paulovich and R. Minghim. HiPP: a novel hierarchical point placement strategy and its applica-tion to the exploration of document collections. IEEE Transactions on Visualization and ComputerGraphics, 14(6):1229–1236, 2008.
[107] J. B. Procter, J. Thompson, I. Letunic, C. Creevey, F. Jossinet, and G. J. Barton. Visualization ofmultiple alignments, phylogenies and gene family evolution. Nature Methods, 7(3 Suppl):S16–25,Mar. 2010.
25

Preprint: Copy contains subtle differences with final publisher’s version
[108] R. A. Rensink. Change detection. Annual Review of Psychology, 53(1):245–277, 2002.
[109] R. A. Rensink, J. K. ORegan, and J. J. Clark. On the failure to detect changes in scenes across briefinterruptions. Visual Cognition, 7(1/2/3):127–145, 2000.
[110] R. L. Ribler and M. Abrams. Using visualization to detect plagiarism in computer science classes. InProceedings of the IEEE Symposium on Information Vizualization 2000, INFOVIS ’00, pages 173–177, Washington, DC, USA, 2000. IEEE Computer Society.
[111] J. C. Roberts. Exploratory visualization with multiple linked views. In A. MacEachren, M.-J. Kraak,and J. Dykes, editors, Exploring Geovisualization, pages 149–170. Amsterdam: Elseviers, December2004.
[112] J. C. Roberts. State of the art: Coordinated & multiple views in exploratory visualization. In CMV ’07:Proceedings of the Fifth International Conference on Coordinated and Multiple Views in ExploratoryVisualization, pages 61–71, Washington, DC, USA, 2007. IEEE Computer Society.
[113] G. Robertson, R. Fernandez, D. Fisher, B. Lee, and J. Stasko. Effectiveness of animation in trendvisualization. IEEE Transactions on Visualization and Computer Graphics, 14(6):1325–32, 2008.
[114] S. F. Roth and J. Mattis. Data characterization for intelligent graphics presentation. In Proceedingsof the SIGCHI conference on Human Factors in Computing Systems: Empowering People, CHI ’90,pages 193–200, New York, NY, USA, 1990. ACM.
[115] N. Sauber, H. Theisel, and H.-P. Seidel. Multifield-graphs: an approach to visualizing correlations inmultifield scalar data. IEEE Transactions on Visualization and Computer Graphics, 12(5):917–924,2006.
[116] C. Schmid and H. Hinterberger. Comparative multivariate visualization across conceptually differentgraphic displays. In Seventh International Working Conference on Scientific and Statistical DatabaseManagement, pages 42–51, Washington, DC, USA, 1994. IEEE Computer Society.
[117] F. Schreiber. Visual comparison of metabolic pathways. J. Vis. Lang. Comput., 14(4):327–340, 2003.
[118] K. C. Scott-Brown, M. R. Baker, and H. S. Orbach. Comparison blindness. Visual Cognition, 7(1 -3):253–267, 2000.
[119] K. Shapiro. Change Blindness: Theory or Paradigm? Visual Cognition, 7(1):83–91, 2000.
[120] C. D. Shaw, J. A. Hall, D. S. Ebert, and D. A. Roberts. Interactive lens visualization techniques. InProceedings of the conference on Visualization ’99: Celebrating Ten Years, VIS ’99, pages 155–160,Los Alamitos, CA, USA, 1999. IEEE Computer Society Press.
[121] Q. Shen, A. Pang, and S. Uselton. Data level comparison of wind tunnel and computational fluiddynamics data. In Visualization ’98. Proceedings, pages 415–418, Los Alamitos, CA, USA, Oct.1998. IEEE Computer Society Press.
[122] Z. Shen, K.-L. Ma, and T. Eliassi-Rad. Visual analysis of large heterogeneous social networks bysemantic and structural abstraction. IEEE Transactions on Visualization and Computer Graphics,12(6):1427–1439, 2006.
[123] B. Shneiderman and A. Aris. Network visualization by semantic substrates. IEEE Transactions onVisualization and Computer Graphics, 12(5):733–740, 2006.
26

Preprint: Copy contains subtle differences with final publisher’s version
[124] D. Simons and D. Levin. Change blindness. Trends in Cognitive Sciences, 1(7):261–267, 1997.
[125] D. J. Simons, S. L. Franconeri, and R. L. Reimer. Change blindness in the absence of a visualdisruption. Perception, 29:1143–1154, 2000.
[126] D. J. Simons, S. R. Mitroff, and S. L. Franconeri. Implicit and explicit representations in sceneperception. In M. A. Peterson and G. Rhodes, editors, Perception of Faces, Objects, and Scenes:Analytic and Holistic Processes (Advances in Visual Cognition), pages 335–355. Oxford UniversityPress, New York, NY, USA, 2003.
[127] A. Slingsby, J. Dykes, and J. Wood. Configuring hierarchical layouts to address research questions.Visualization and Computer Graphics, IEEE Transactions on, 15(6):977 –984, Nov. 2009.
[128] G. Smith, M. Czerwinski, B. Meyers, D. Robbins, G. Robertson, and D. S. Tan. FacetMap: A scal-able search and browse visualization. IEEE Transactions on Visualization and Computer Graphics,12(5):797–804, 2006.
[129] C. Stolte and P. Hanrahan. Polaris: a system for query, analysis and visualization of multi-dimensionalrelational databases. In IEEE Symposium on Information Visualization 2000, pages 5–14, Washing-ton, DC, USA, 2000. IEEE Computer Society.
[130] H. Strobelt, D. Oelke, C. Rohrdantz, A. Stoffel, D. a. Keim, and O. Deussen. Document cards: a toptrumps visualization for documents. IEEE Transactions on Visualization and Computer Graphics,15(6):1145–1152, 2009.
[131] W. Sutherland-Smith and R. Carr. Turnitin. com: Teachers’ perspectives of antiplagiarism softwarein raising issues of educational integrity. Journal of University Teaching and Learning Practice,2(3):94–101, 2005.
[132] E. Suvanaphen and J. C. Roberts. Textual difference visualization of multiple search results utilizingdetail in context. In Proceedings of the Theory and Practice of Computer Graphics 2004, pages 2–8,Washington, DC, USA, 2004. IEEE Computer Society.
[133] D. Tan, G. Smith, B. Lee, and G. Robertson. AdaptiviTree: adaptive tree visualization for tournament-style brackets. IEEE Transactions on Visualization and Computer Graphics, 13(6):1113–1120, 2007.
[134] M. Tory and T. Moller. Rethinking visualization: A high-level taxonomy. In IEEE Symposium onInformation Visualization, pages 151 –158, Washington, DC, USA, 2004. IEEE Computer Society.
[135] S. P. Tregelles, editor. English Hexapla New Testament. Samuel Bagster and Sons, London, UK,1841.
[136] Y. Tu and H.-W. Shen. Visualizing changes of hierarchical data using treemaps. IEEE Transactionson Visualization and Computer Graphics, 13(6):1286–1293, 2007.
[137] E. R. Tufte. Envisioning Information. Graphics Press, Cheshire, CT, 1990.
[138] E. R. Tufte. Beautiful Evidence. Graphics Press, Cheshire, CT, 2006.
[139] T. Urness, V. Interrante, E. Longmire, I. Marusic, S. O’Neill, and T. Jones. Strategies for the vi-sualization of multiple 2d vector fields. IEEE Computer Graphics and Applications, 26(4):74–82,July-Aug. 2006.
27

Preprint: Copy contains subtle differences with final publisher’s version
[140] F. van Ham, M. Wattenberg, and F. B. Viegas. Mapping text with phrase nets. IEEE Transactions onVisualization and Computer Graphics, 15(6):1169–76, 2009.
[141] V. Verma and A. Pang. Comparative flow visualization. IEEE Transactions on Visualization andComputer Graphics, 10(6):609–624, 2004.
[142] F. B. Viegas, M. Wattenberg, and J. Feinberg. Participatory visualization with Wordle. IEEE Trans-actions on Visualization and Computer Graphics, 15(6):1137–1144, 2009.
[143] R. Vliegen, J. V. Wijk, and E. V. Der. Visualizing business data with generalized treemaps. IEEETransactions on Visualization and Computer Graphics, 20387:789–796, 2006.
[144] K. Vrotsou, J. Johansson, and M. Cooper. ActiviTree: interactive visual exploration of sequences inevent-based data using graph similarity. IEEE Transactions on Visualization and Computer Graphics,15(6):945–952, 2009.
[145] S. Wehrend and C. Lewis. A problem-oriented classification of visualization techniques. In VIS ’90:Proceedings of the 1st conference on Visualization ’90, pages 139–143, Los Alamitos, CA, USA,1990. IEEE Computer Society Press.
[146] D. White and M. Joy. Sentence-based natural language plagiarism detection. Journal on EducationalResources in Computing, 4(4):2–22, 2004.
[147] L. Wilkinson, A. Anand, and R. Grossman. Graph-theoretic scagnostics. In IEEE Symposium onInformation Visualization, 2005, pages 157–164, Washington, DC, USA, 2005. IEEE Computer So-ciety.
[148] W. Willett, J. Heer, and M. Agrawala. Scented widgets: improving navigation cues with embeddedvisualizations. IEEE Transactions on Visualization and Computer Graphics, 13(6):1129–1136, 2007.
[149] WinDiff Tool, Microsoft SDK Tools. http://msdn.microsoft.com/en-us/library/aa242739(v=vs.60).aspx. Visited October 2010.
[150] J. Wood, J. Dykes, A. Slingsby, and K. Clarke. Interactive visual exploration of a large spatio-temporal dataset: reflections on a geovisualization mashup. IEEE Transactions on Visualization andComputer Graphics, 13(6):1176–1183, 2007.
[151] J. Woodring and H.-W. Shen. Multi-variate, time varying, and comparative visualization with con-textual cues. IEEE Transactions on Visualization and Computer Graphics, 12(5):909–916, Sept.-Oct.2006.
[152] X. Yuan, P. Guo, H. Xiao, H. Zhou, and H. Qu. Scattering points in parallel coordinates. IEEETransactions on Visualization and Computer Graphics, 15(6):1001–1008, 2009.
28

Preprint: Copy contains subtle differences with final publisher’s version
A Appendix: Systems Considered
We show here a list of systems considered in producing our taxonomy. Further details are available on theassociated web site (http://graphics.cs.wisc.edu/Vis/CompIV).
2 1/2 D Related MetabolicPathways [15]
Ac plagiarism detection system [52] Acoustic Visualization [32] ACT [18]
ActiviTree [144] AdaptiviTree [133] AlignScope [76] Animated Causal Diagrams [77]
Bubble Sets [27] Cerebral [12] CGView Server [57] CMap3D [36]
code swarm [105] COMBO [43] COMPAM [88] Composite Categorical Patterngram(CCP) [110]
Contrast Treemaps [136] DAG Tree ComparisonVisualization [55]
DataMeadow [41] Dendogram-Matrix Views [20]
DEVise [90] diff [70] DNAVis [47] Document Cards [130]
Dotplot [23] DynaVis [63] Edge Explorer [92] EMDialog [66]
English Hexapla NewTestament [135]
ETE [69] Exemplar-based Visualization [21] Explorer [64]
FacetMap [128] FlowMap [59] FromDaDy [71] G-compass [78]
Generalized Tree Maps [143] GeneShelf [83] Geographically WeightedInteractive Graphics [38]
Geovisualization Mashup [150]
GEVOL [25] Graphical Histories [62] Growing Polygons [42] Heat Maps for Incomplete andPartially Ranked Data [82]
Hierarchical Edge Bundles [67] Hierarchical Structuring of DenseGraphs via Stratification [84]
HiPP [106] HNMap [93]
Hotmap [48] Integrated Proteomic DataVisualization [75]
ItLv [100] Layout Constraint Graphs [117]
Lydia [95] ManyNets [53] Mauve [31] MERL forensic surveillancesystem [73]
Mizbee [96] Motion VisualizationFramework [79]
Multi-dimensional data cubevisualization [39]
Multi-image view [92]
Multi-variate, Time-varying andComparative Visualization with
Contextual Cues [151]
Multifield-Graphs [115] Multiple VIR Interfaces [85] Network CentralitiesVisualization [37]
NodeTrix [65] NVSS [123] OntoVis [122] Outlier-Preserving ParallelCoordinates [103]
Parallel Sets [13] Parallel Tag Clouds [28] Pathline [97] Phenoclustering [58]
PhotoMap [30] Phrase Nets [140] Polaris [129] ResultMap [24]
Scatterplot Matrix [40] Scented Widgets [148] Seevolution [45] SellTrend [89]
Semantic Graph Visualiser(SGV) [8]
Sequential DocumentVisualization [94]
SES [132] SHERLOCK [146]
Simultaneous Graph DrawingAlgorithms [44]
SnoopCGH [4] Sockeye [11] SPARKLER [61]
SPF Tree Visualizations [9] Spotfire [1] SPPC [152] The Information Mural [74]
Topographic Maps for BGPlay [29] Tree Set Visualization [7] TreeDyn [22] Trendalyzer [113]
Trendalyzer and two staticvariants [113]
Tukey scagnostics [147] Turnitin [131] UrbanVis [19]
Vdiff [11] VisDB [80] VisGets [34] VisLink [26]
VisTrails [16] VisuLab [116] WinDiff [149] Wordle [142]
WorldMapper [35] X-ray lens [120] XmdvTool [54]
29