visual analytics for investigative analysis and ... · visual analytics for investigative analysis...
TRANSCRIPT
Visual Analytics for Investigative Analysis and Exploration of Document Collections
John Stasko
Information Interfaces Research Group
School of Interactive Computing
Georgia Institute of Technology
Sept. 11, 2009
Data Explosion
• Society is more complex
– There simply is more “stuff”
• Computers, internet and web give people access to an incredible amount of data
– news, sports, financial, purchases, etc...
2
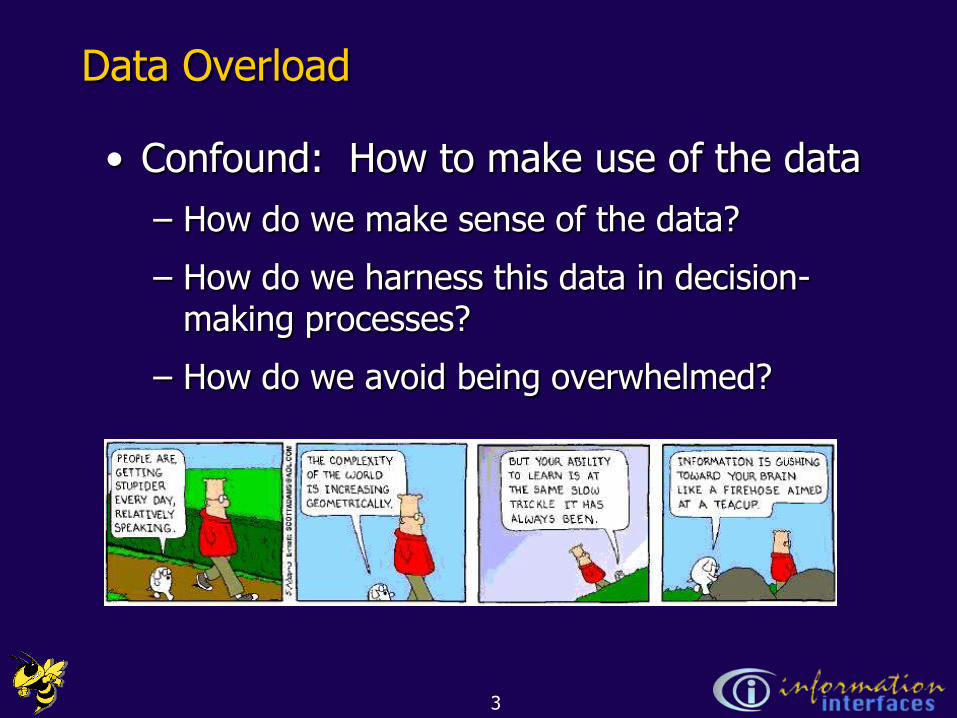
Data Overload
• Confound: How to make use of the data
– How do we make sense of the data?
– How do we harness this data in decision-making processes?
– How do we avoid being overwhelmed?
3
Premise of my Work
• Visualization of data helps people understand it better
4
Visualization
• Often thought of as process of creating a graphic or an image
• Really is a cognitive process
– Form a mental image of something
– Internalize an understanding
• “The purpose of visualization is insight, not pictures”
– Insight: discovery, decision making, explanation, analysis, exploration, learning
5
Main Idea
• Visuals help us think
– Provide a frame of reference, a temporary storage area
• Cognition Perception
• Pattern matching
• External cognition aid
– Role of external world in thinking and reason
Larkin & Simon ‟87Card, Mackinlay, Shneiderman „98
6
When to Apply?
• Many other techniques for data analysis
– Data mining, DB queries, machine learning…
• Visualization most useful in exploratory data analysis
– Don‟t know what you‟re looking for
– Don‟t have a priori questions
– Want to know what questions to ask
7
Some quick (static) examples…
8
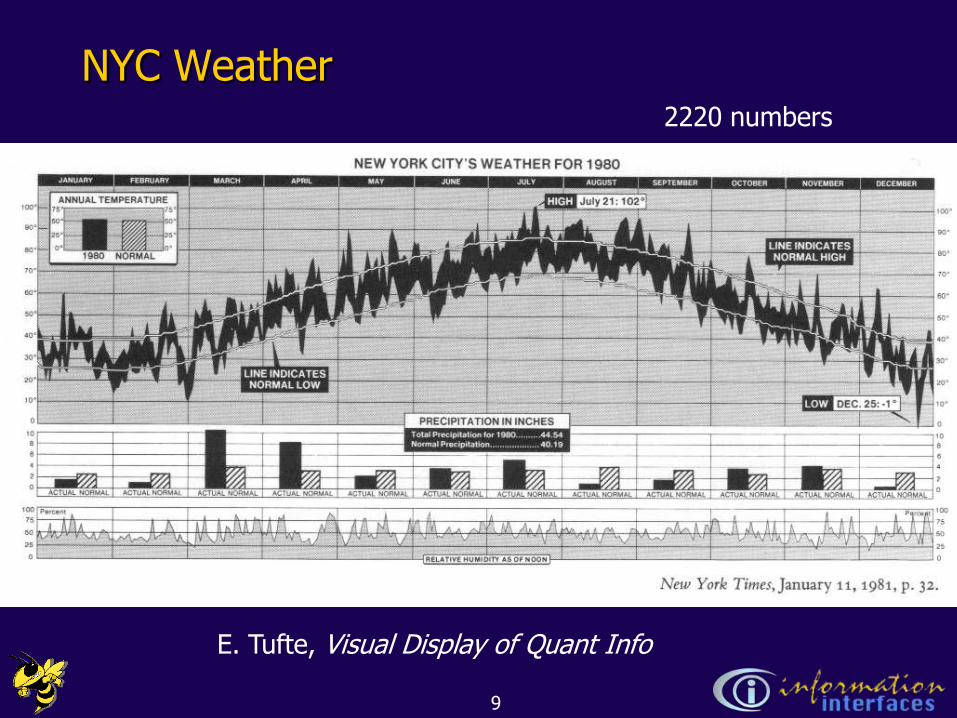
NYC Weather2220 numbers
E. Tufte, Visual Display of Quant Info
9
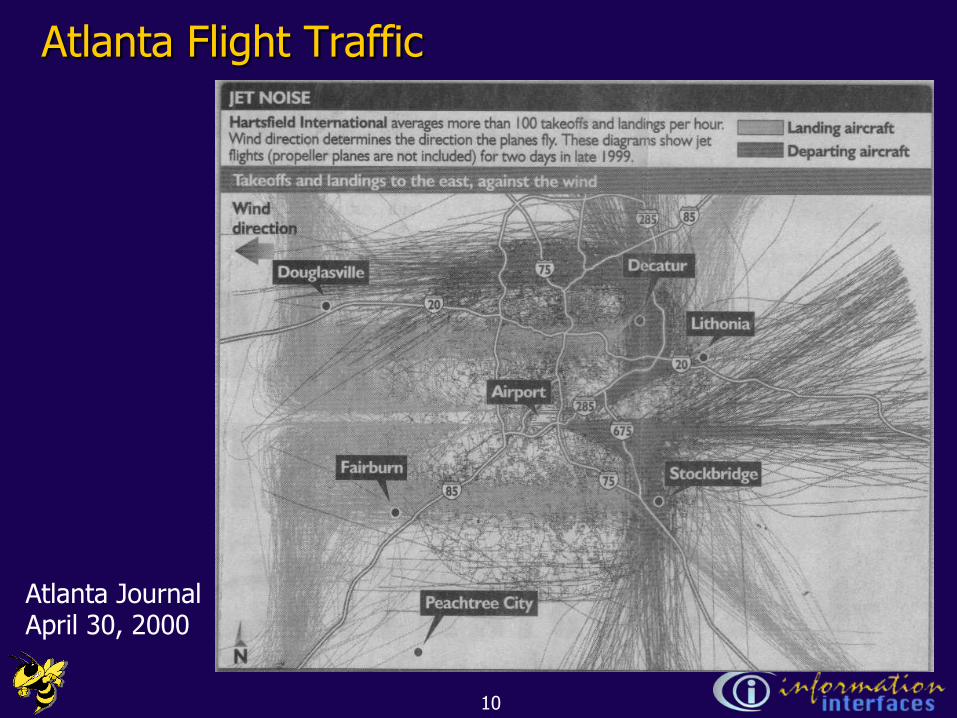
Atlanta Flight Traffic
Atlanta JournalApril 30, 2000
10
Reinforce my point with two examples
11
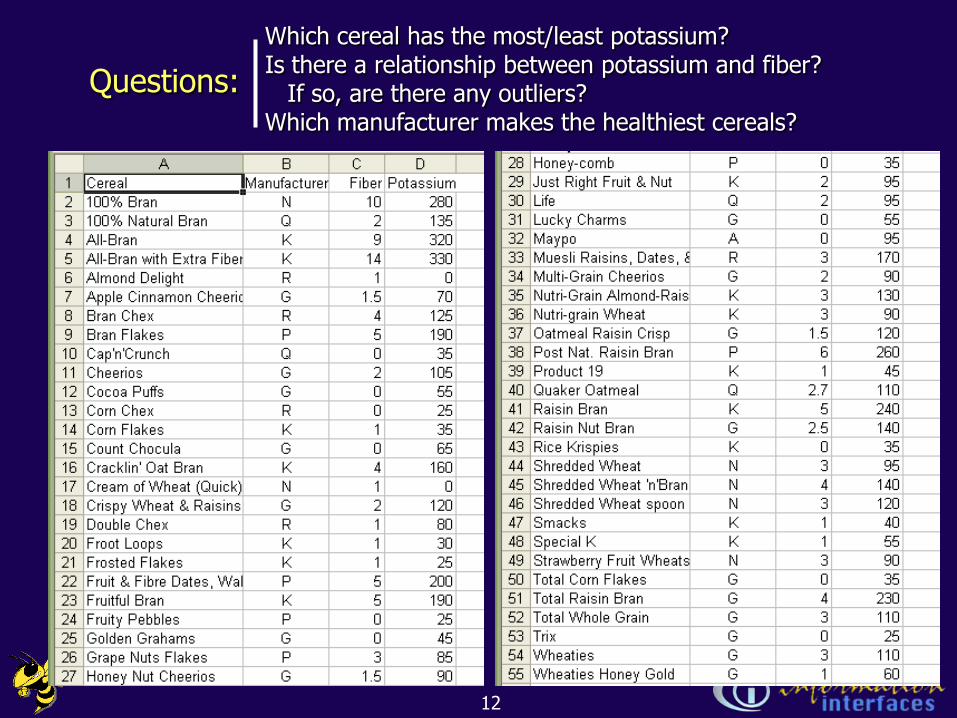
Which cereal has the most/least potassium?Is there a relationship between potassium and fiber?
If so, are there any outliers?Which manufacturer makes the healthiest cereals?
Questions:
12
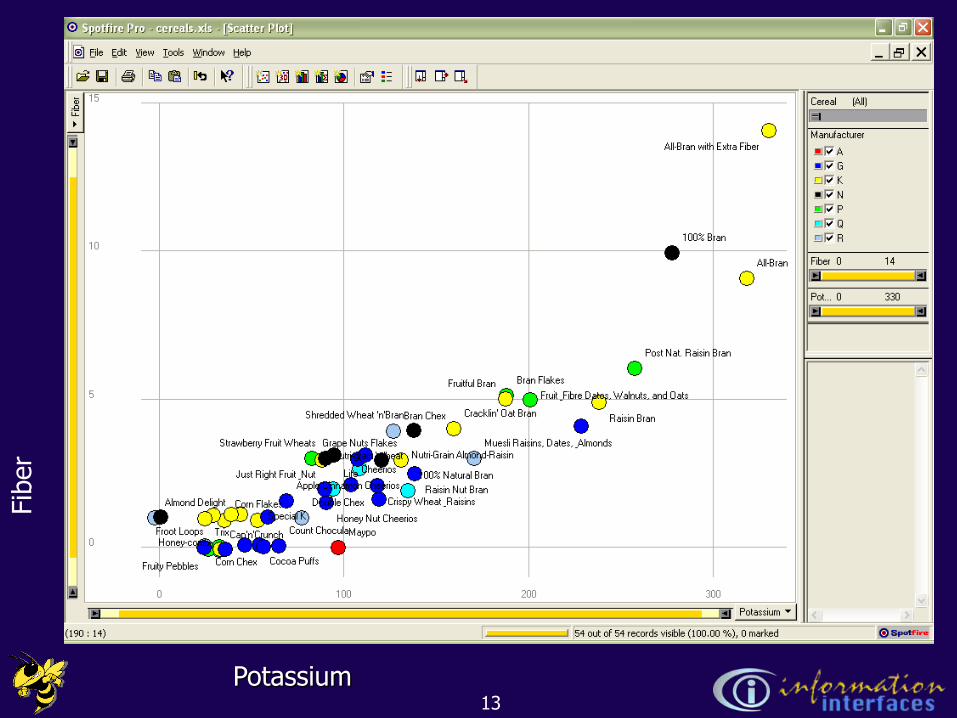
Potassium
Fib
er
13
Even Tougher?
• What if you could only see one cereal‟s data at a time? (e.g. some websites)
• What if I read the data to you?
14
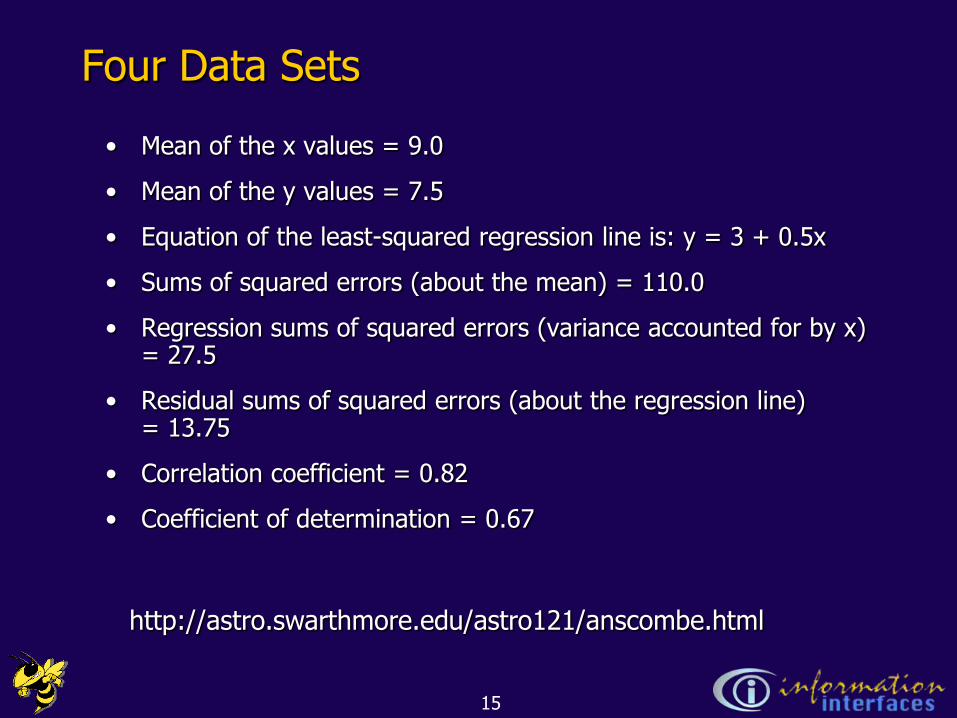
Four Data Sets
• Mean of the x values = 9.0
• Mean of the y values = 7.5
• Equation of the least-squared regression line is: y = 3 + 0.5x
• Sums of squared errors (about the mean) = 110.0
• Regression sums of squared errors (variance accounted for by x) = 27.5
• Residual sums of squared errors (about the regression line) = 13.75
• Correlation coefficient = 0.82
• Coefficient of determination = 0.67
http://astro.swarthmore.edu/astro121/anscombe.html
15
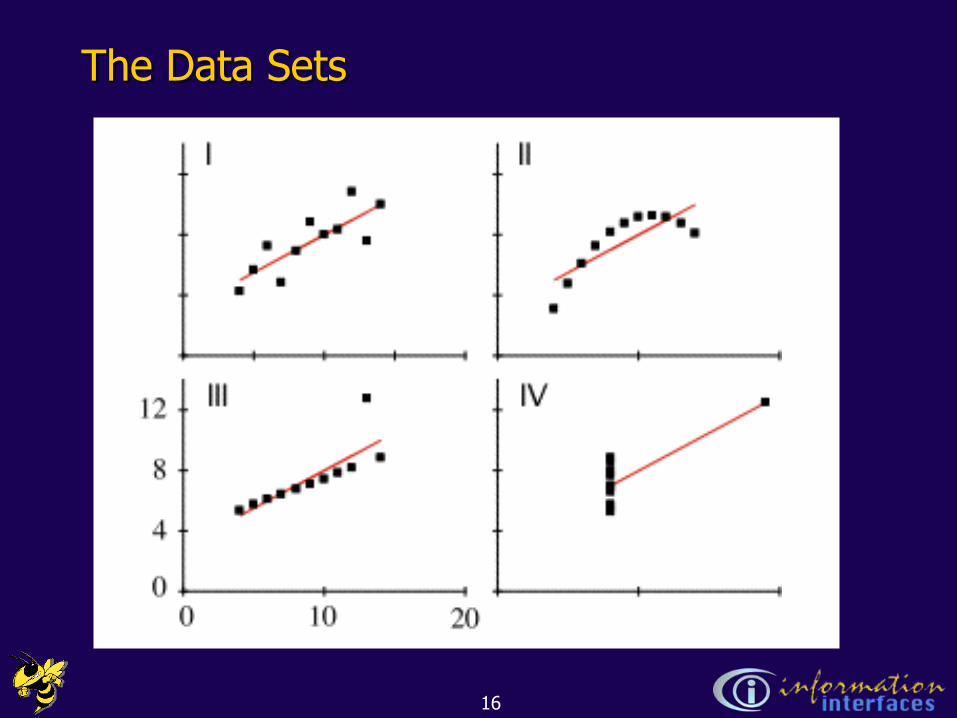
The Data Sets
16
Two Related Disciplines
• Information Visualization
• Visual Analytics
17
Information Visualization
• Using interactive computer visualizations to represent and communicate abstract data
– Statistics, databases, software, …
• Area emerged approximately 1990
18
Information Visualization
• Recent research trends
– InfoVis for the Masses
– Challenges of evaluation
– Interaction is crucial
19
Visual Analytics
• Informal: Using visual representations to help make decisions
• Formal: The science of analytical reasoning facilitated by interactive visual interfaces
• InfoVis++
• Area emerged approximately 2005
20
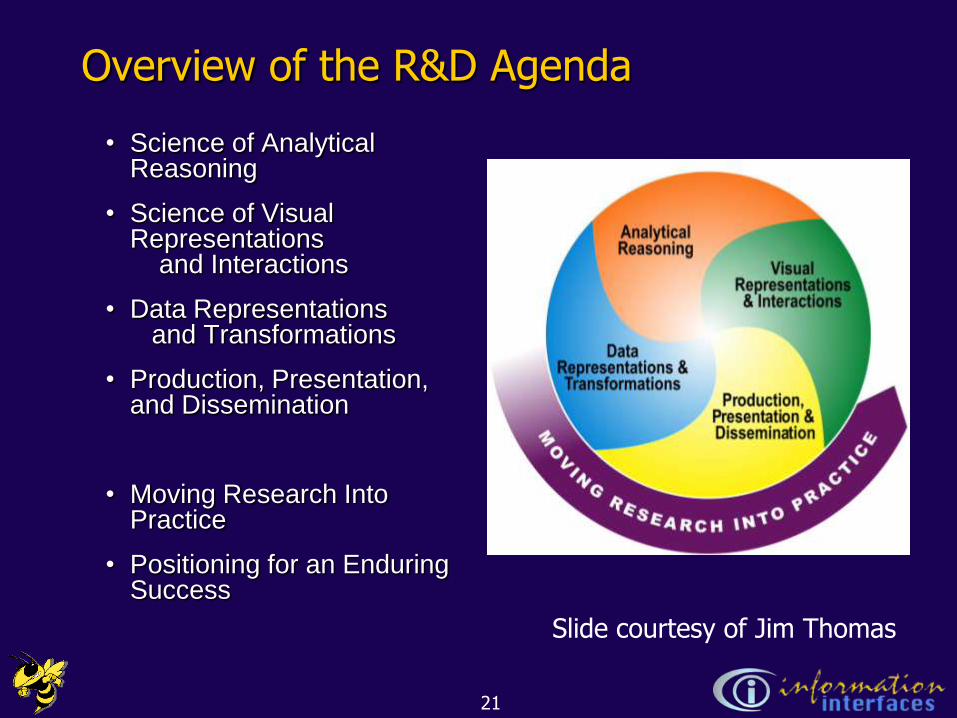
Overview of the R&D Agenda
• Science of Analytical Reasoning
• Science of Visual Representations
and Interactions
• Data Representations and Transformations
• Production, Presentation, and Dissemination
• Moving Research Into Practice
• Positioning for an Enduring Success
Slide courtesy of Jim Thomas
21
Visual Analytics: Beyond InfoVis
• Statistics, data representation and statistical graphics
• Geospatial and Temporal Sciences
• Applied Mathematics
• Knowledge representation, management and discovery
• Ontology, semantics, NLP, extraction, synthesis, …
• Cognitive and Perceptual Sciences
• Comunications: Capture, Illustrate and present a message
• Decision sciences
Slide courtesy of Jim Thomas
22
Sensemaking
“A motivated , continuous effort to understandconnections (which can be among people,places, and events) in order to anticipatetheir trajectories and act effectively.”
– Klein, Moon and Hoffman
23
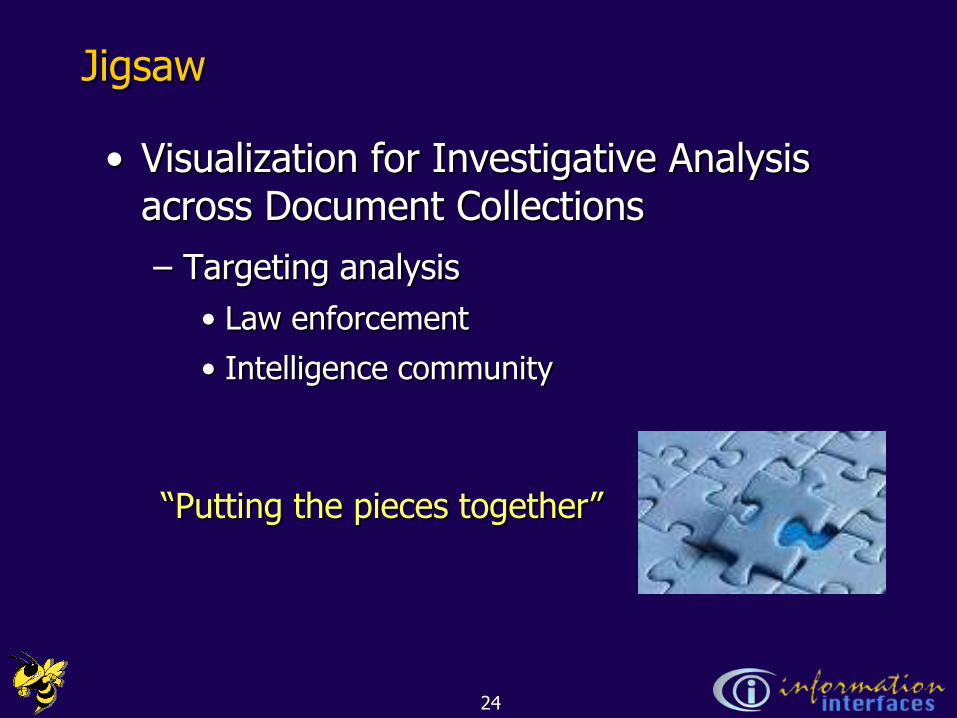
Jigsaw
• Visualization for Investigative Analysis across Document Collections
– Targeting analysis
• Law enforcement
• Intelligence community
“Putting the pieces together”
24
The Jigsaw Team
Current:Carsten Görg, Youn-ah Kang, ZhichengLiu, Jaegul Choo, Alex Humesky, Hrishikesh Mantri, Vasili Pantazopoulos
Alumni:
Gennadiy Stepanov, Sarah Williams, Meekal Bajaj, Mohit Jain, Neel Parekh, Roger Pincombe, Kanupriyah Singhal, Xin Sun
25
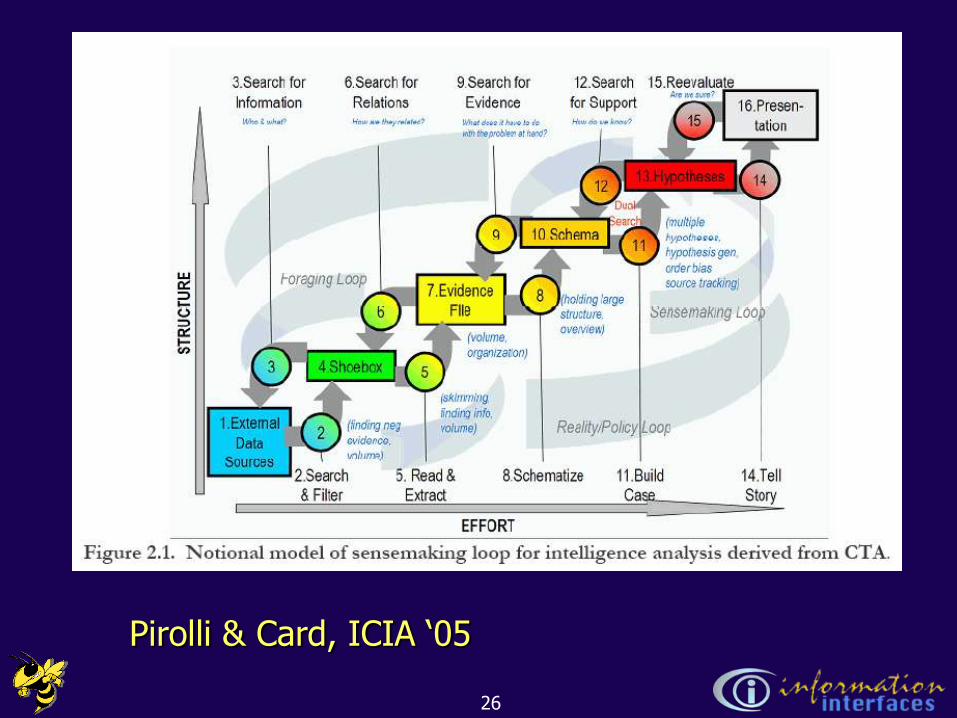
Pirolli & Card, ICIA „05
26
Pain Points
• Cost structure of scanning and selecting items for further attention
• Analysts‟ span of attention for evidence and hypotheses
27
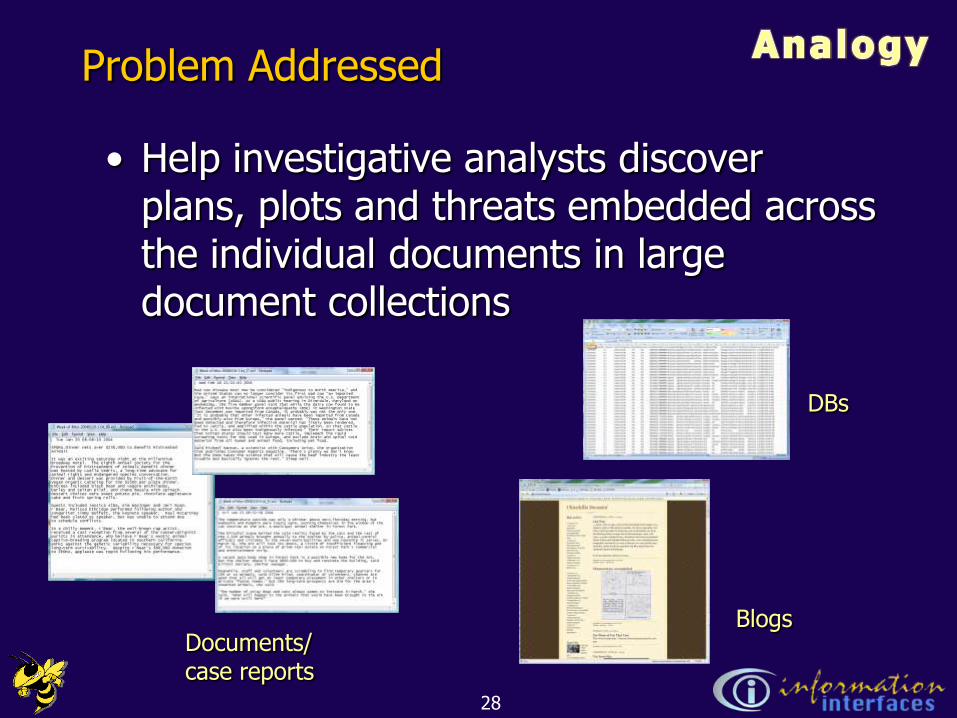
Problem Addressed
• Help investigative analysts discover plans, plots and threats embedded across the individual documents in large document collections
Documents/case reports
Blogs
DBs
28
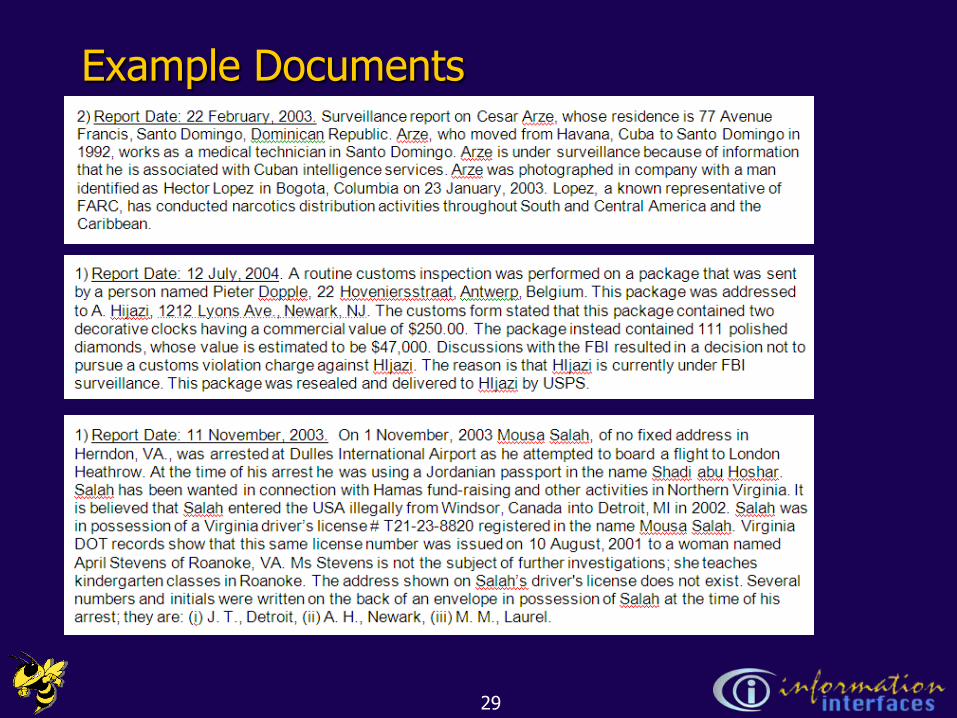
Example Documents
29
Our Focus
• Entities within the documents
– Person, place, organization, phone number, date, license plate, etc.
• Thesis: A plot/threat within the documents will involve a set of entities in coordination
30
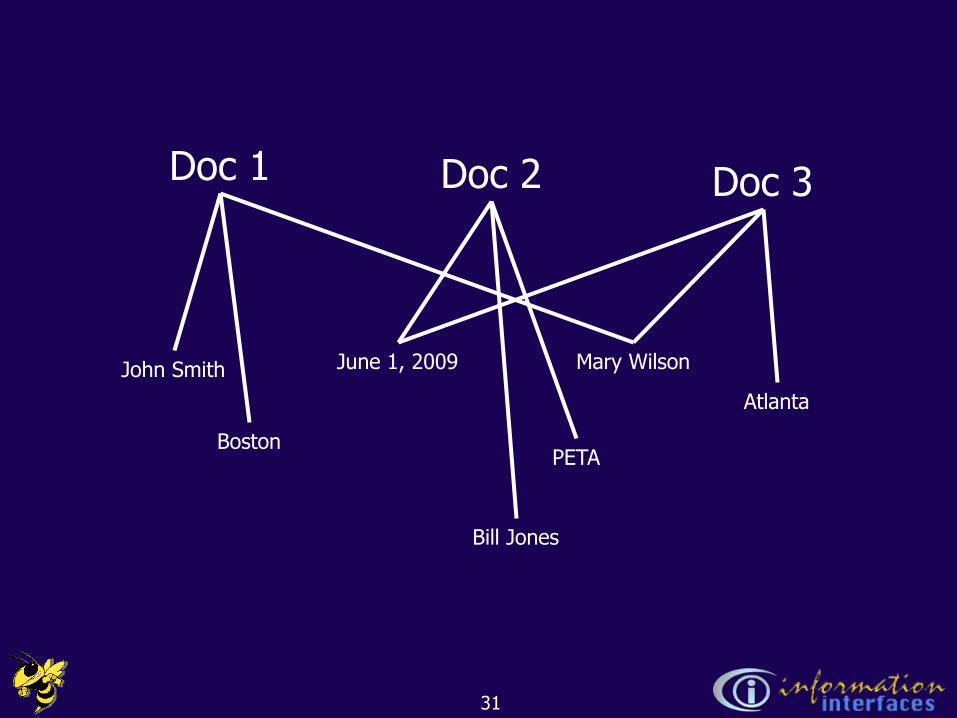
Doc 1 Doc 2 Doc 3
John Smith June 1, 2009
Atlanta
PETABoston
Mary Wilson
Bill Jones
31
Entity Identification
• Must identify and extract entities from plain text documents
– Crucial for our work
• Not our main research focus –
Collaborate with or use tools from others
32
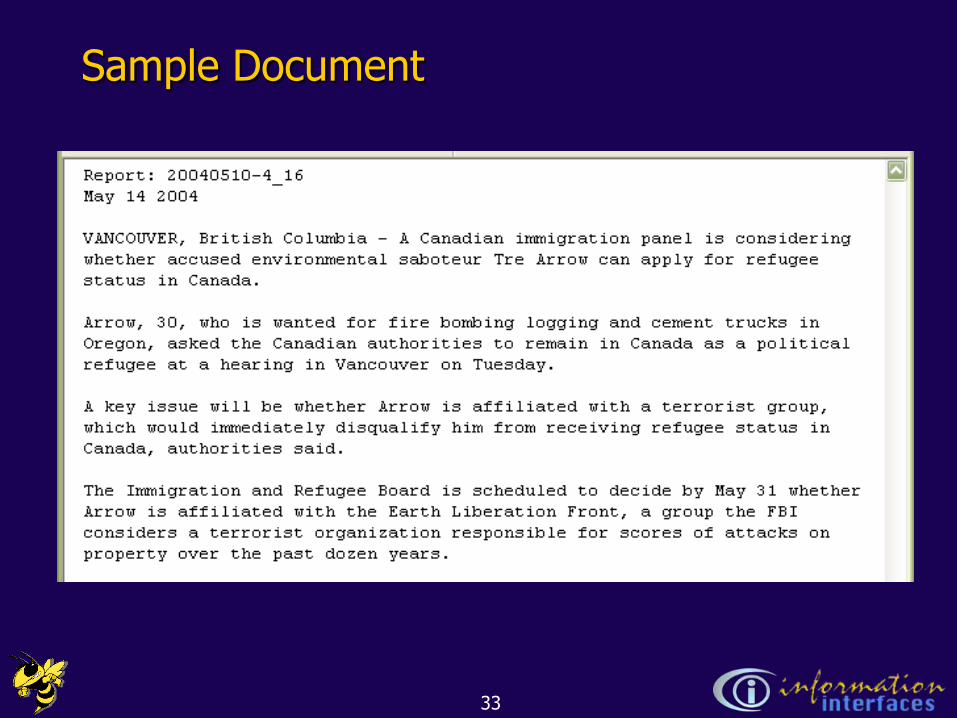
Sample Document
33
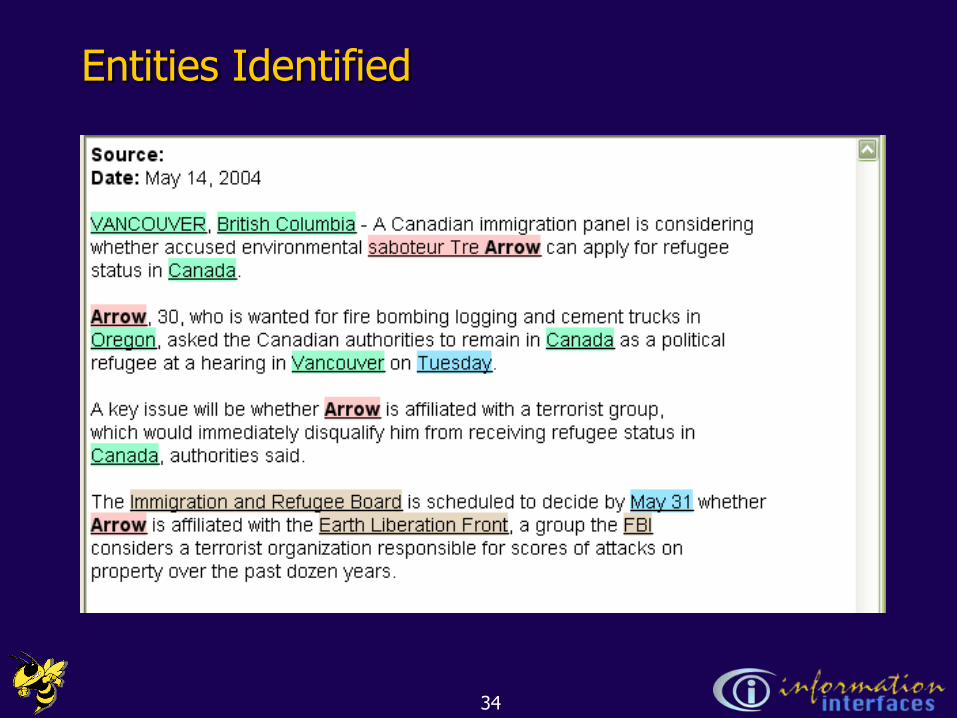
Entities Identified
34
Connections
• Entities relate/connect to each other to make a larger “story”
• Connection definition:
– Two entities are connected if they appear in a document together
– The more documents they appear in together, the stronger the connection
35
Jigsaw
• Multiple visualizations (views) of documents, entities, & their connections
• Views are highly interactive and coordinated
• User actions generate eventsthat are transmitted to and (possibly) reflected in other views
36
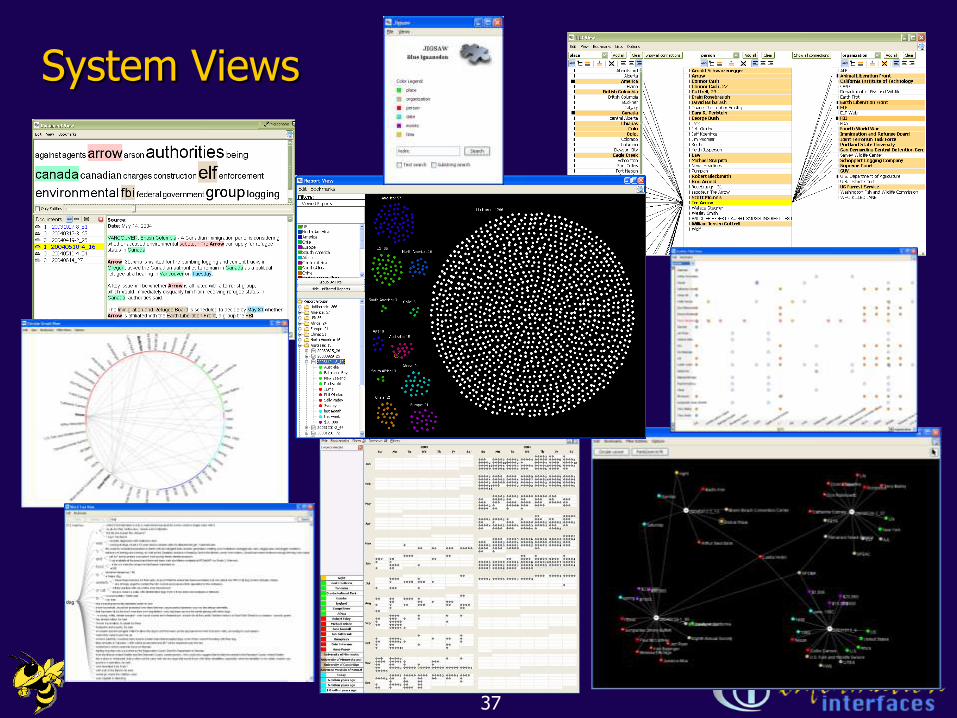
System Views
37
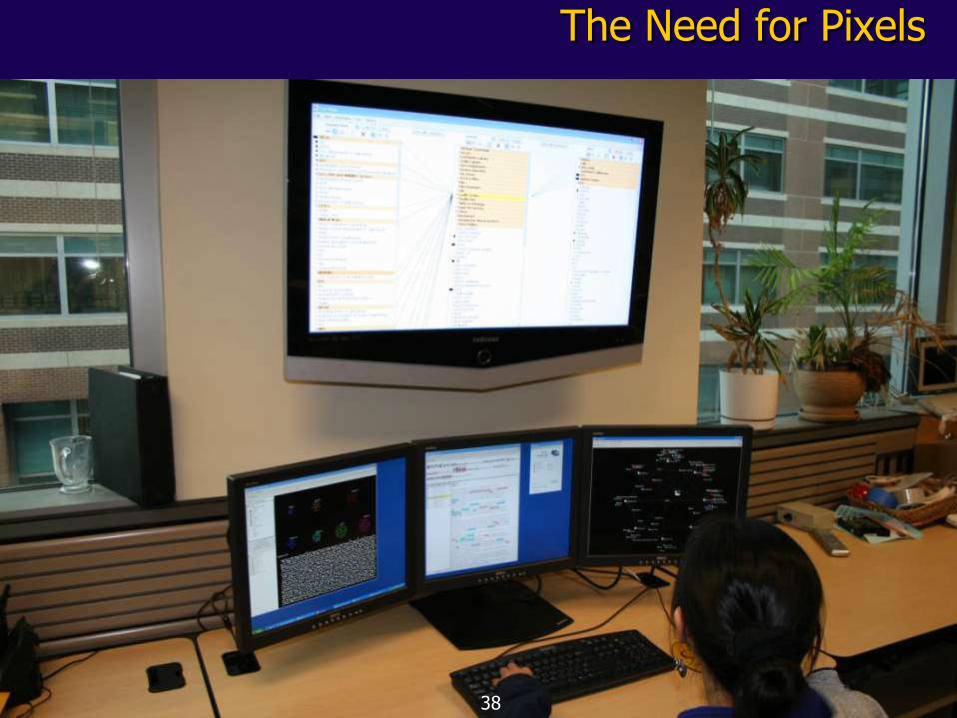
The Need for Pixels
38
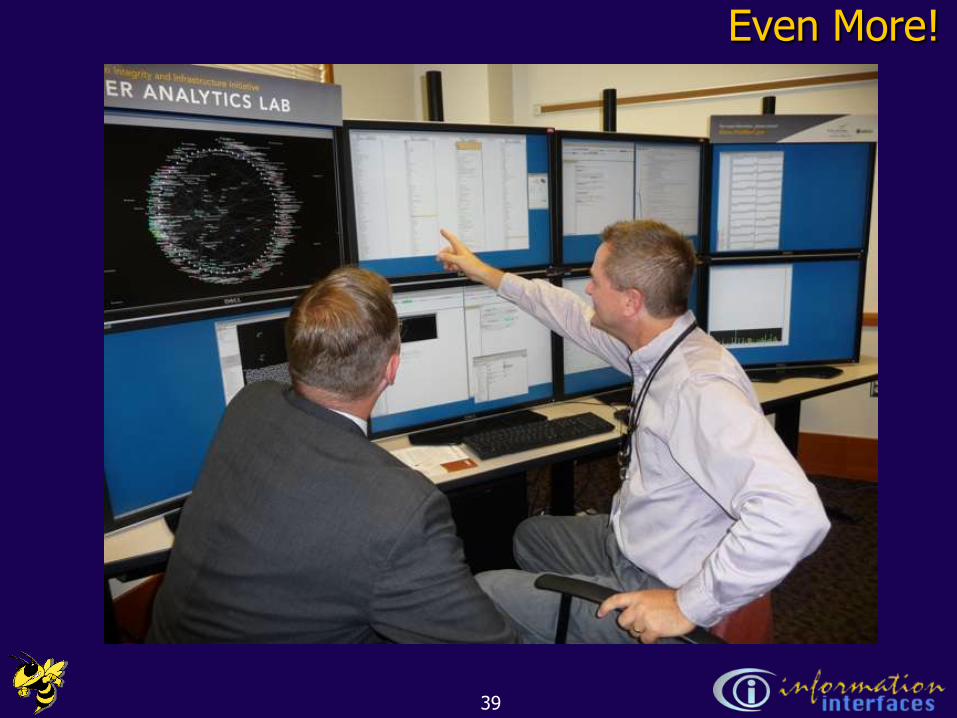
Even More!
39
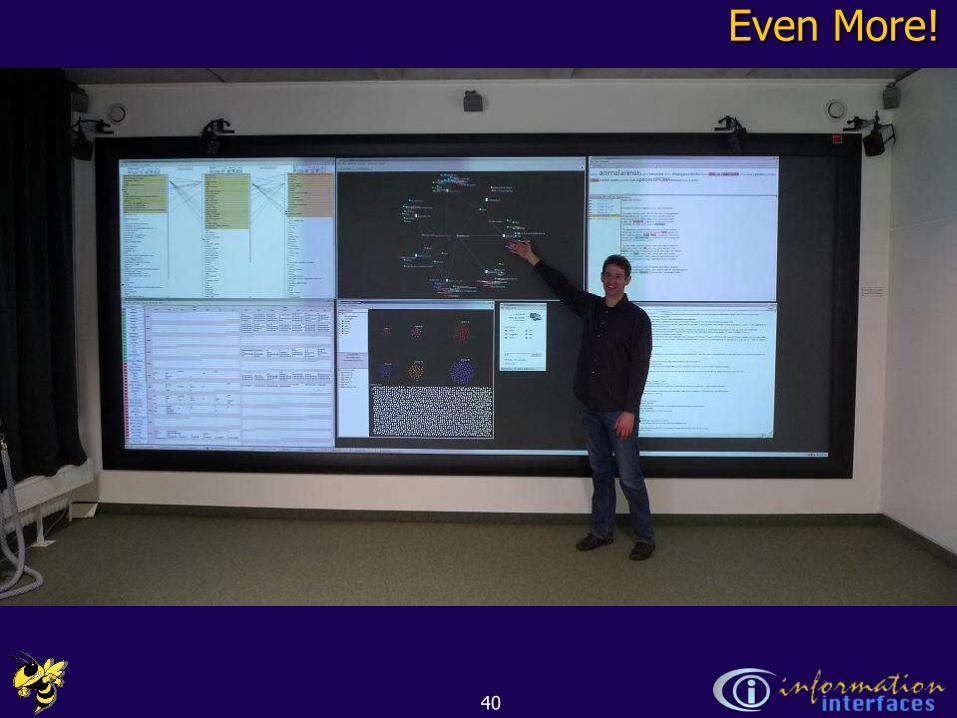
Even More!
40
Demo
41
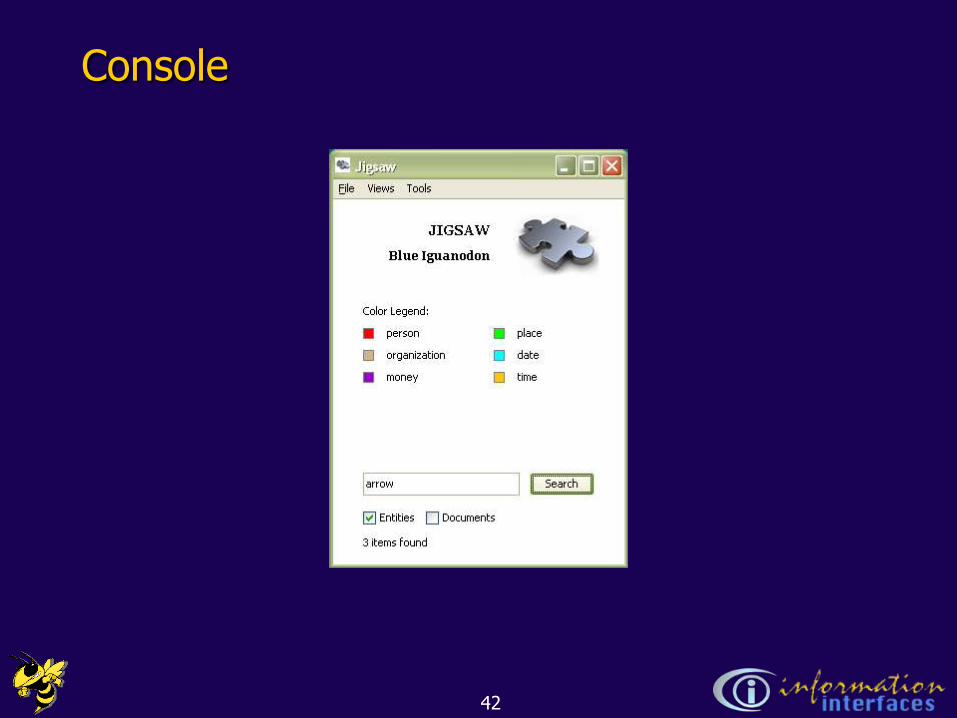
Console
42
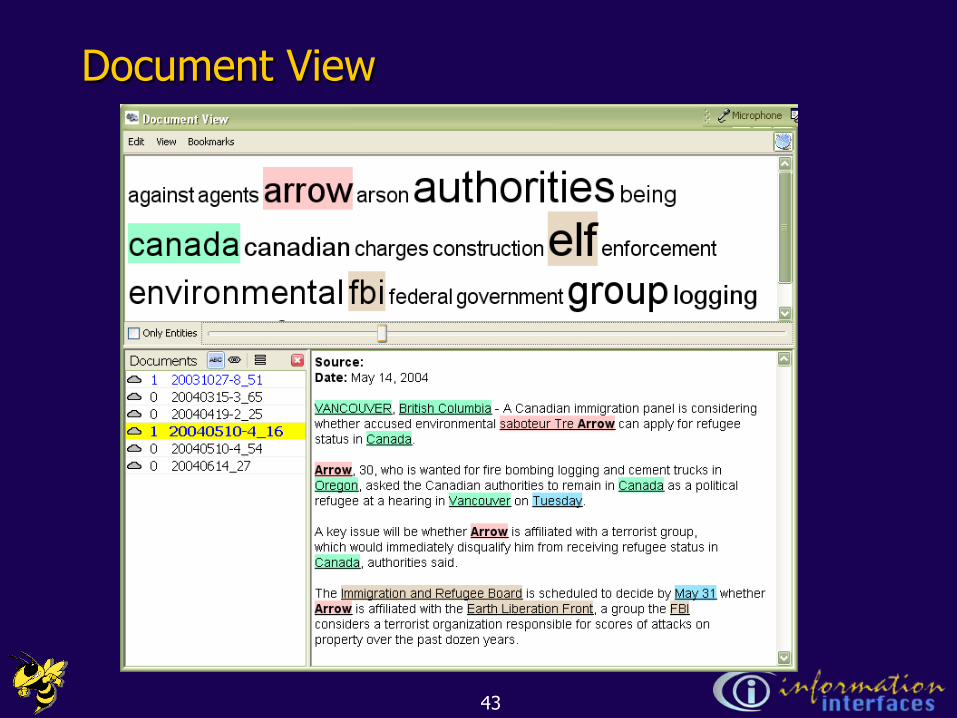
Document View
43
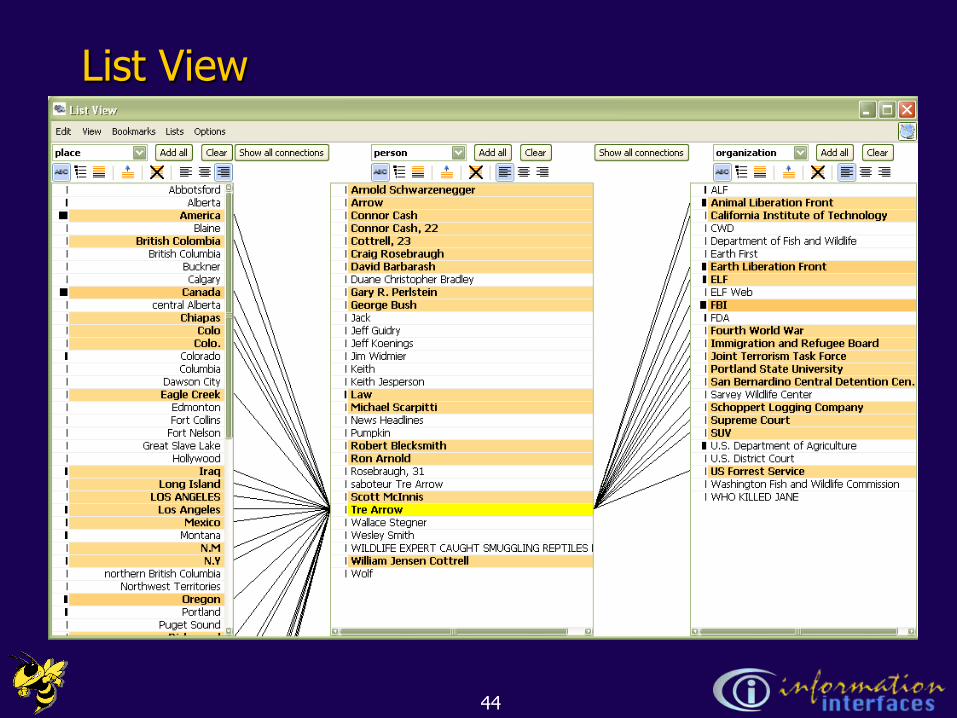
List View
44
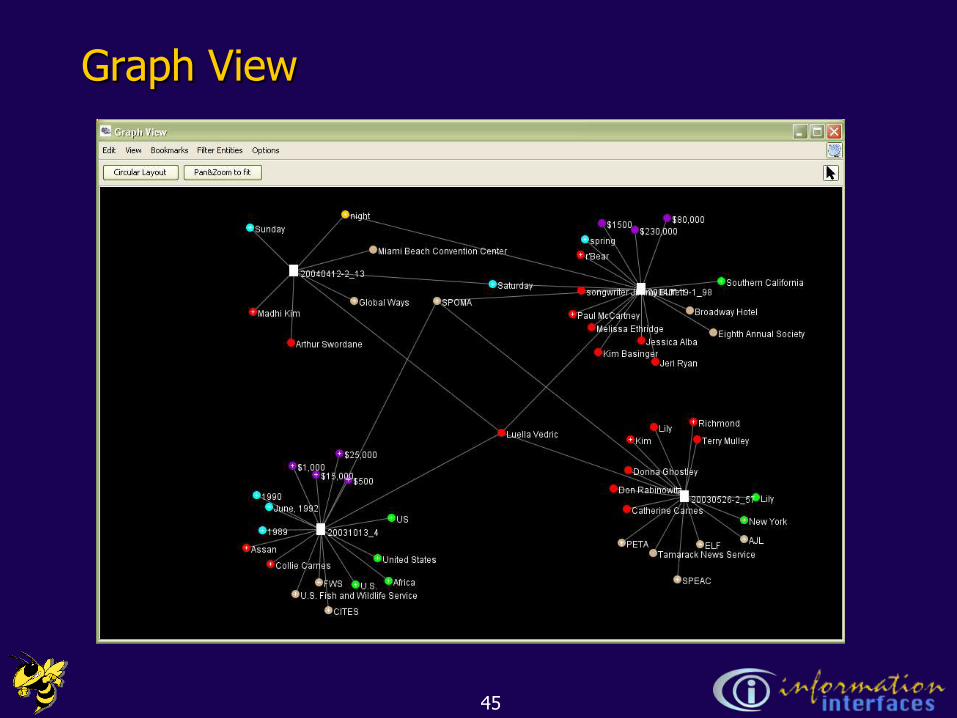
Graph View
45
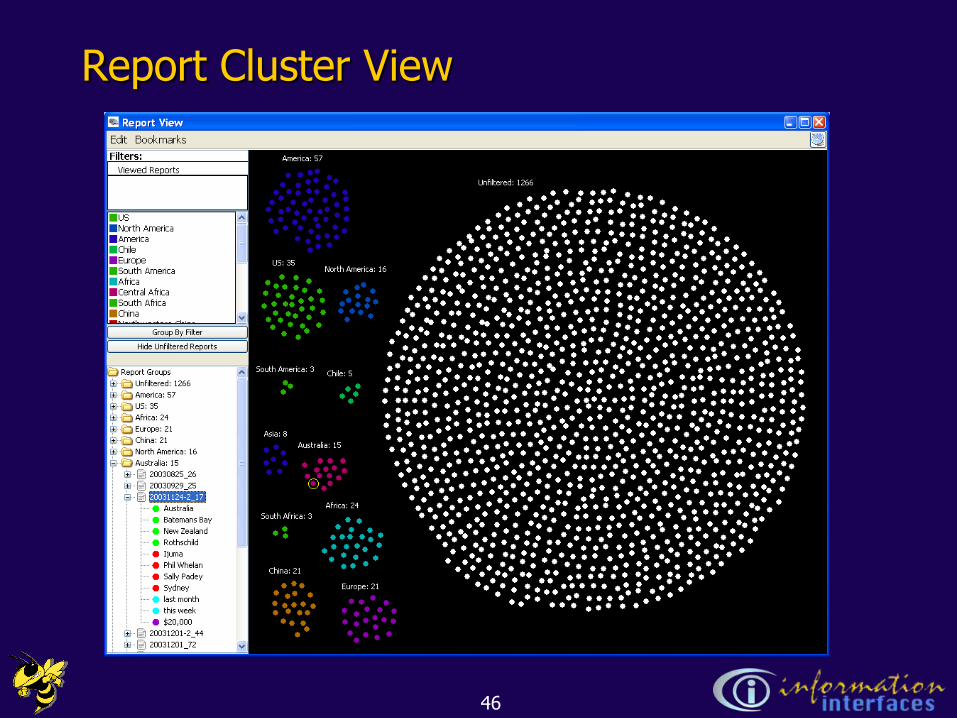
Report Cluster View
46
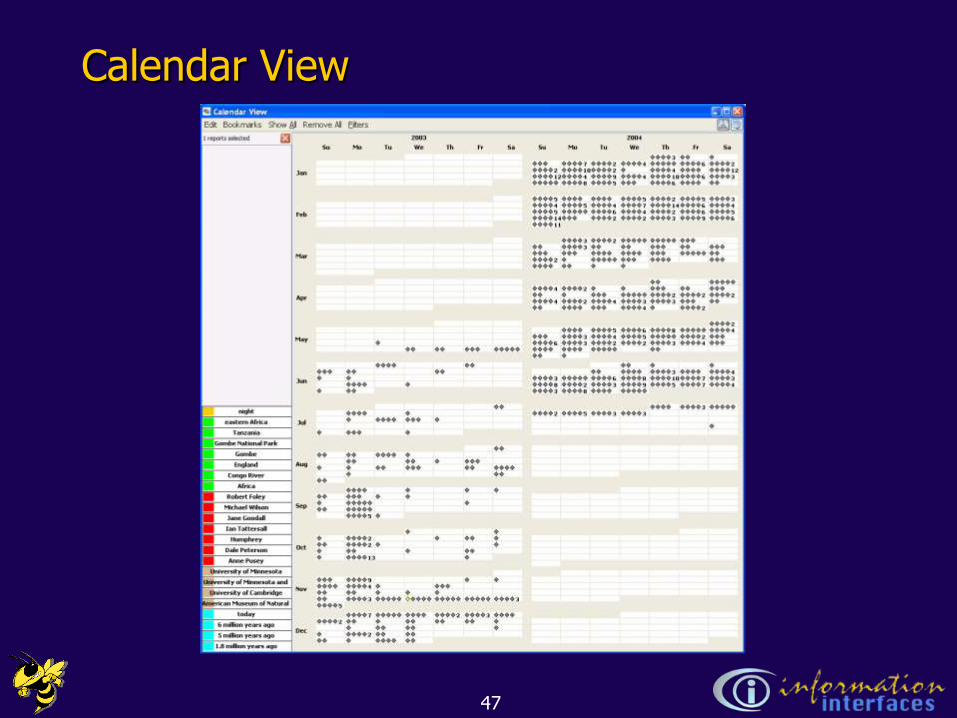
Calendar View
47
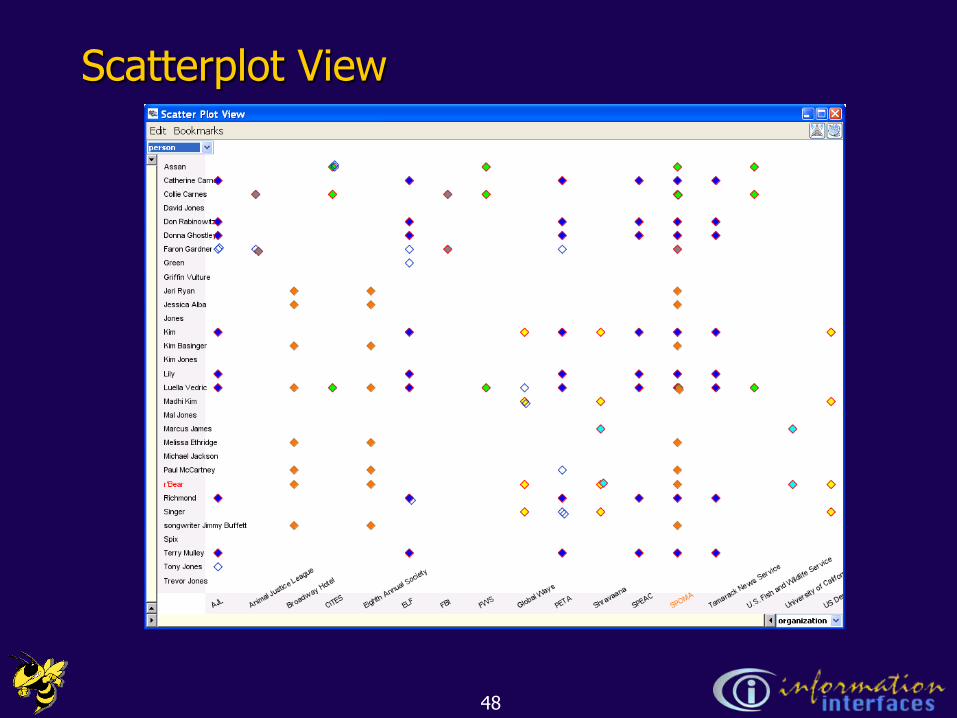
Scatterplot View
48
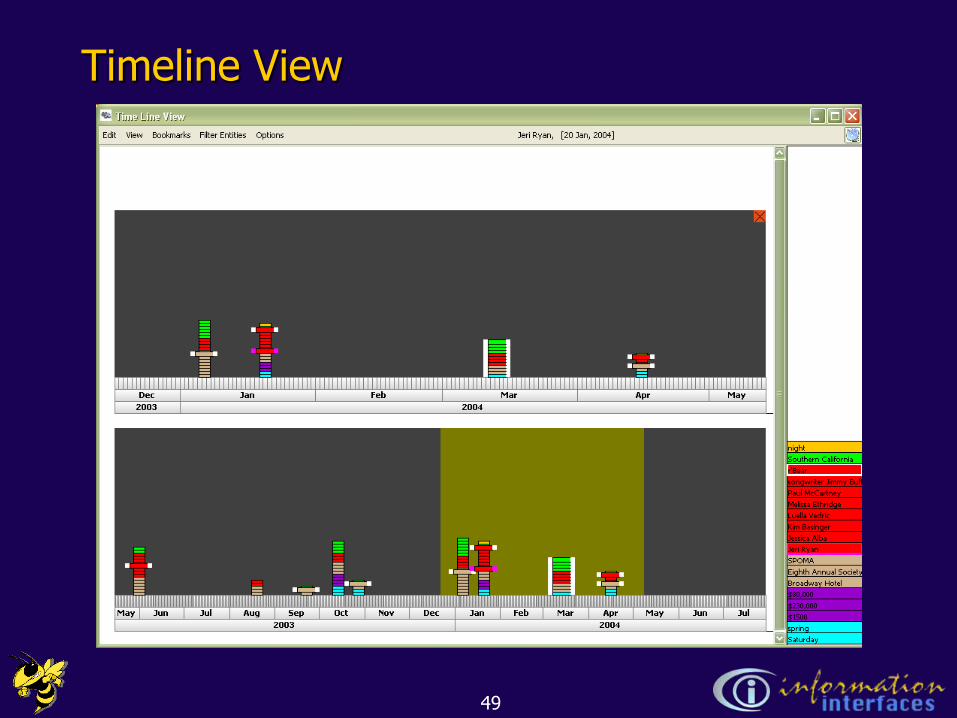
Timeline View
49
Related Work
• GeoTime, TRIST, & SANDBOX: Oculus
• Analyst‟s Notebook: i2
• KANI, Prospekt: PNNL
• WebTAS: ISS Inc.
• CorpusView & Entity Workspace: PARC
50
What It Does & Does Not Provide
• Is not a “theme” view
• Is a visual index onto documents and entities
• Must read the reports!
51
Contributions
• Individual view representations and interactions – focus on entity connections
• Advocacy/illustration of using multiple views and large screen space
• Relatively simple UI interactions
• Synthesis into a working system providing investigative analysis capabilities
52
NewDevelopments
53
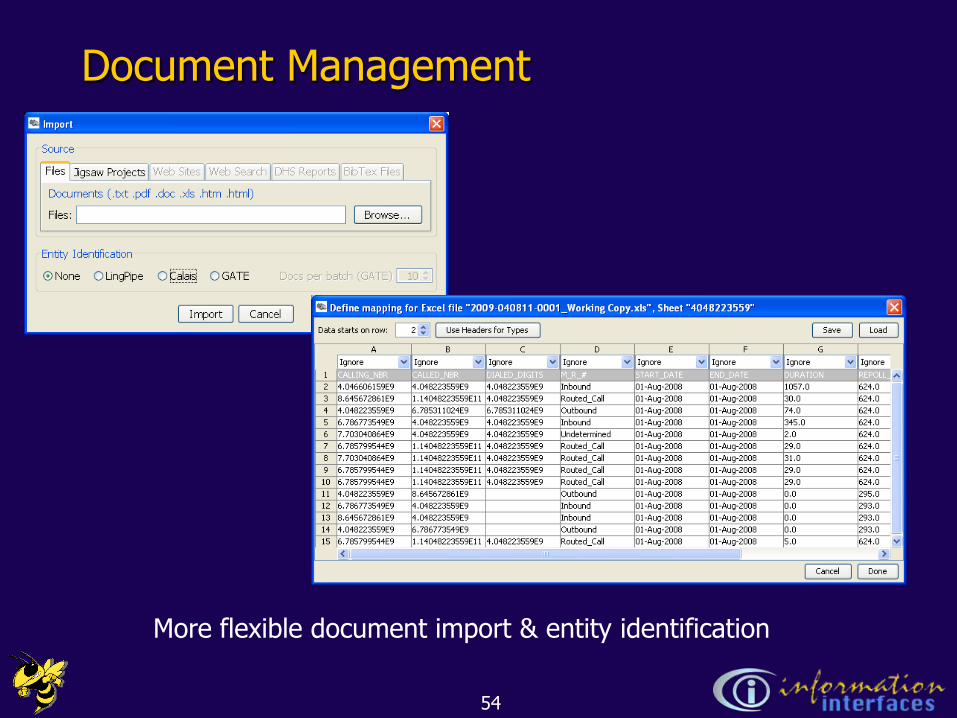
Document Management
More flexible document import & entity identification
54
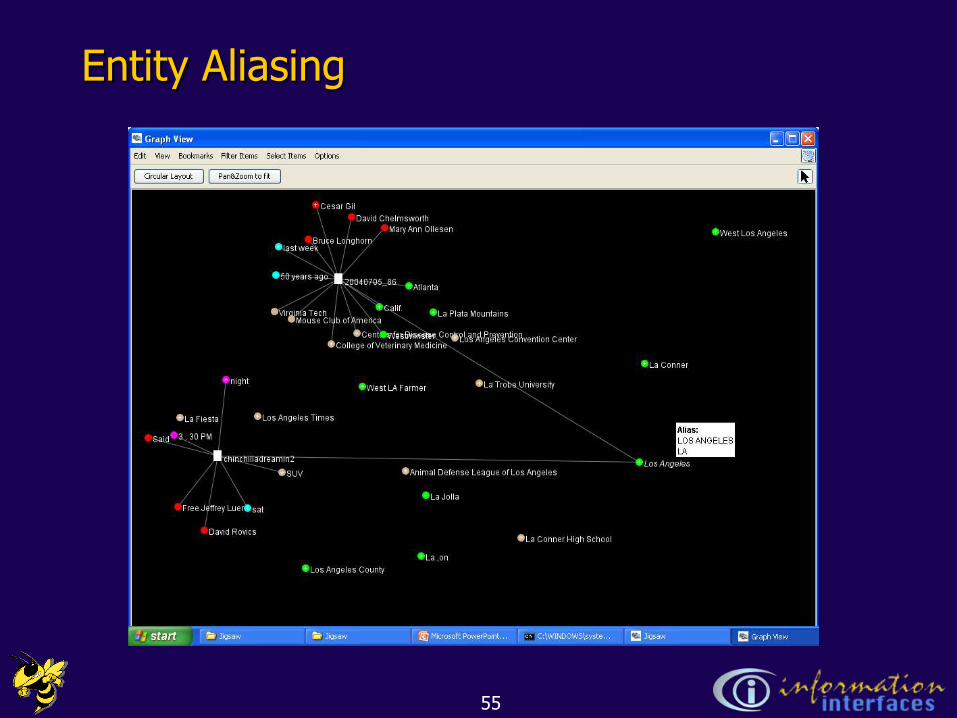
Entity Aliasing
55
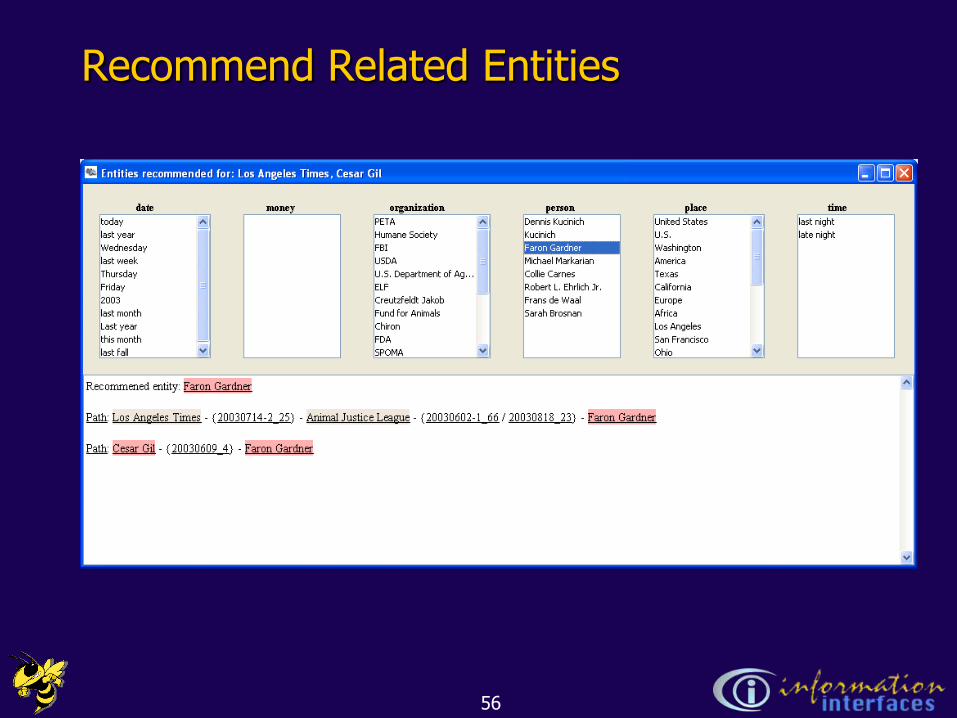
Recommend Related Entities
56
Amplifying Automated Analysis
• Auto-summarization
• Analyst can ask “What‟s similar?” or “What‟s different?”
• Can the system suggest hypotheses about the data?
– Difficult problem, in general
57
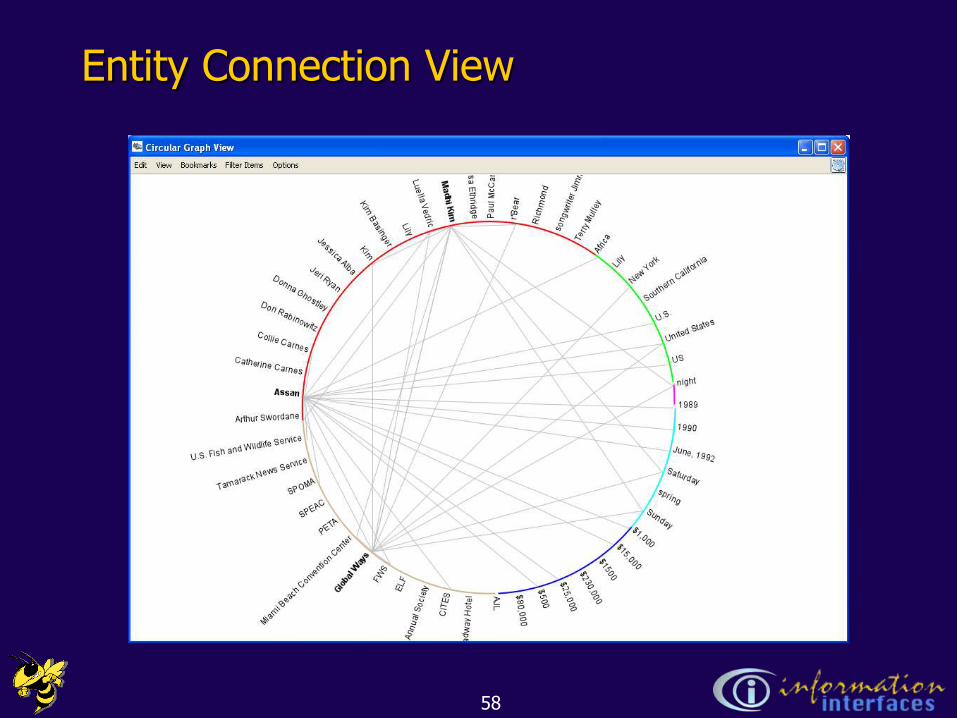
Entity Connection View
58
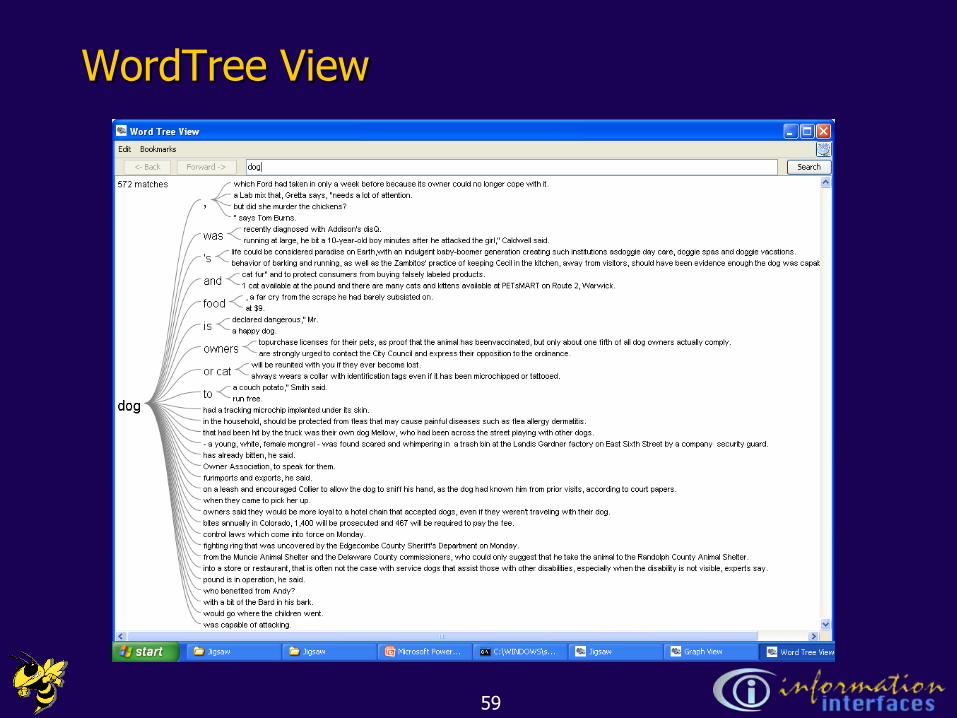
WordTree View
59
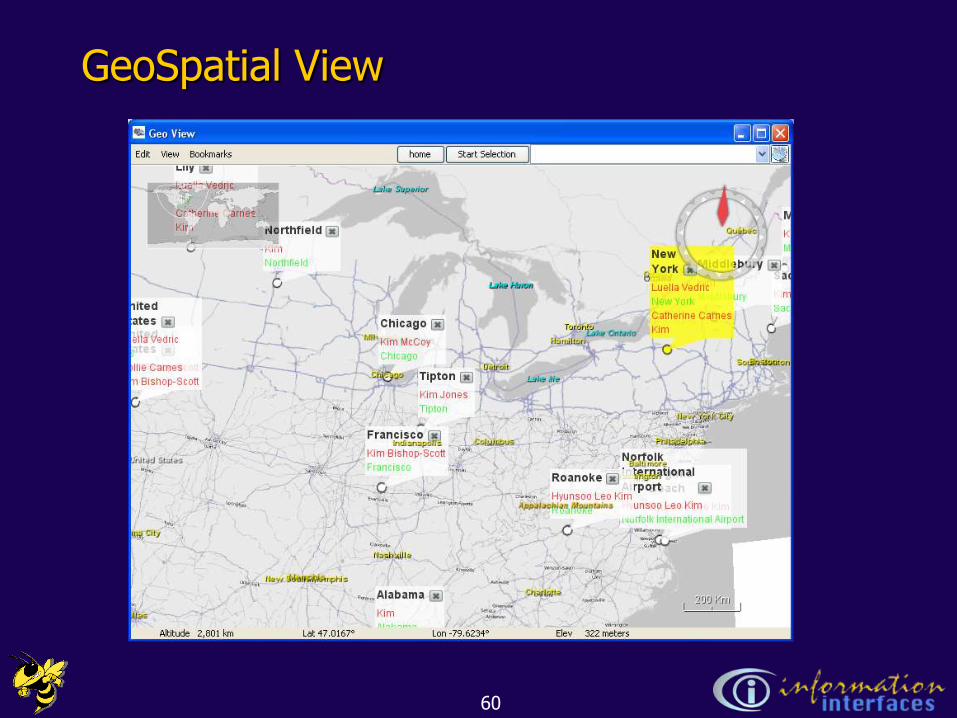
GeoSpatial View
60
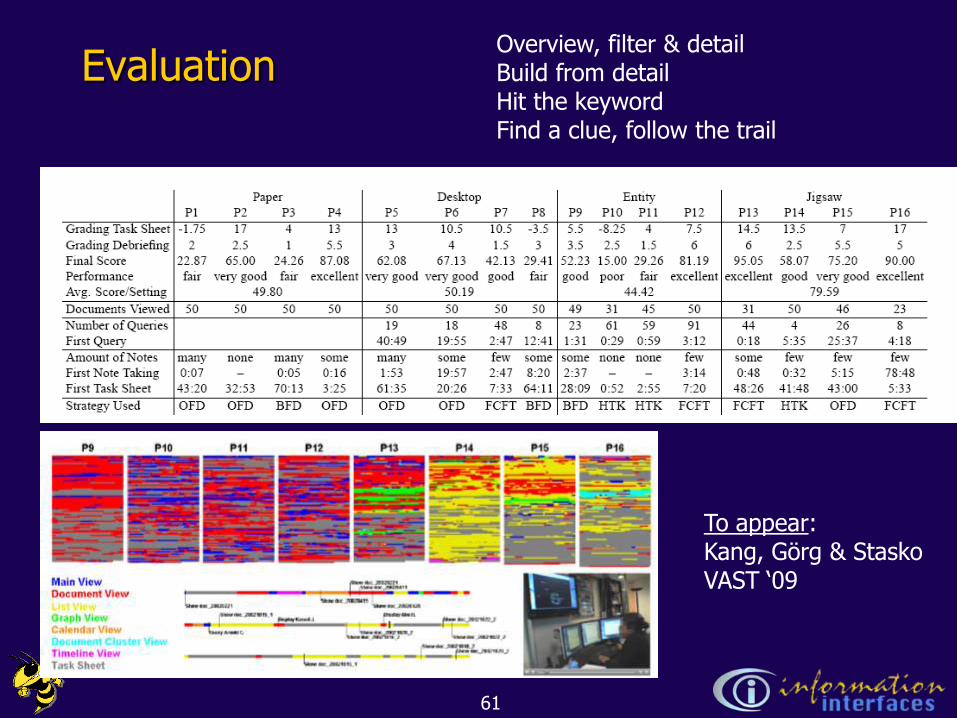
EvaluationOverview, filter & detailBuild from detailHit the keywordFind a clue, follow the trail
To appear:Kang, Görg & StaskoVAST „09
61
Key Focus
• Transitioning to real (field) use
• Bundle the system into a package for download and use
• Available upon request
• Work in progress…
62

WAJAC Use
"Recently, the Washington Joint Analytical Center (WAJAC) assisted a local police department in analyzing 345 incident reports pertaining to graffiti. Jigsaw was an invaluable tool when it came to examining reports. Without the use of Jigsaw, examining reports would have been tedious and time consuming, and connections between entities may not have been seen.
The local police department was very impressed with Jigsaw and stated that the program will become very useful in tracking graffiti activity, and possibly other criminal activity.
WAJAC uses Jigsaw on a continuous basis to examine information in our intelligence database. Jigsaw is also used to analyze incidents relating to the security of the Washington State Ferry System. It provides a searchable database and quick analytical tool for tracking potential threats to the largest ferry transportation system in the U.S."
CHAD R MELTONCriminal Intelligence AnalystWAJAC/FBI-FIG
63

Cold Case
• Worked on an active police cold case
• About 1000 documents
– Scanned and OCR‟ed
• Some pluses and minuses
64
New Domains
• Bioinformatics & genomics
– Many, many articles about a gene --- How do they connect and relate?
• Entity-Entity relationships now matter more
• Air traffic statutes: US – Europe
• Legal e-discovery
• …
65

Issues/Questions/Reflections
• Where do I start?
• All those views!
• Entity Identification, entity identification, entity identification, entity identification…
• Straightforward UIs matter!
66
Future Work
• “Thinking” view (evidence marshalling)
• Investigative history browser
• Amplified computational analysis
• Entity connection types
• Representing reliability & uncertainty
67
Reflections on Document Analysis
• Definitely can generalize out from investigative analysis
• Visual analytics can really help
• Issues…
68
Document Analysis Issues
• 1. Understand the task & use
– Intelligence analysis
• Identify the threat
• Understand a situation
– Others?
69
Document Analysis Issues
• 2. Need more text & linguistics analysis
– Leverage computational linguistics
• E.g., sentiment analysis
– Collaborate with colleagues who are experts in this area
70
Document Analysis Issues
• 3. Handle dynamic collections of documents
– Static collection vs. document stream
– Adapt to document feeds & crawling/trolling
71
Document Analysis Issues
• 4. Help analysts manage the investigative state better
– Helping analysts resume and return to earlier points
– What else do they really want to do?
72
Document Analysis Issues
• 5. Include many types of documents
– Blogs, spreadsheets, press releases, Twitter, Wikipedia, patents, academic papers, …
– Can each‟s structure/form be exploited?
– Important to understand what an analyst would want to do with each
73
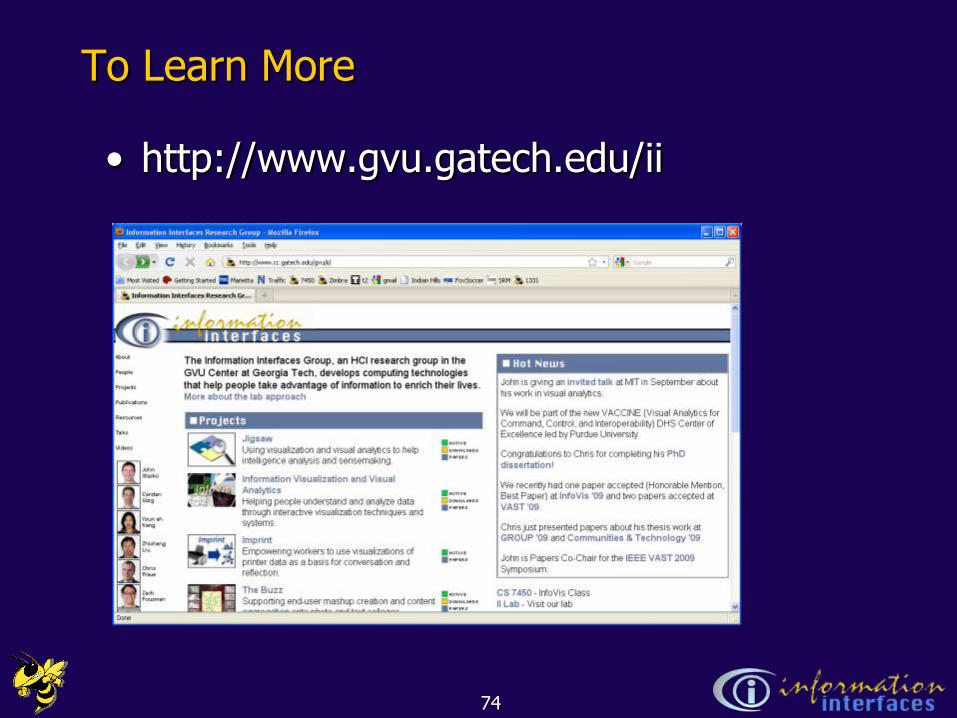
To Learn More
• http://www.gvu.gatech.edu/ii
74
Acknowledgments
• Work conducted as part of the Southeastern Regional Visualization and Analytics Center, supported by DHS and NVAC and the new DHS Center of Excellence in Command, Control & Interoperability (VACCINE Center)
• Supported by NSF IIS-0414667, CCF-0808863 (FODAVA lead), NSF IIS-0915788
75
End
• Thanks for your attention!
• Questions?
76