visible-light photocatalytic mechanism of bisphenol-a on ... · visible-light photocatalytic...
TRANSCRIPT
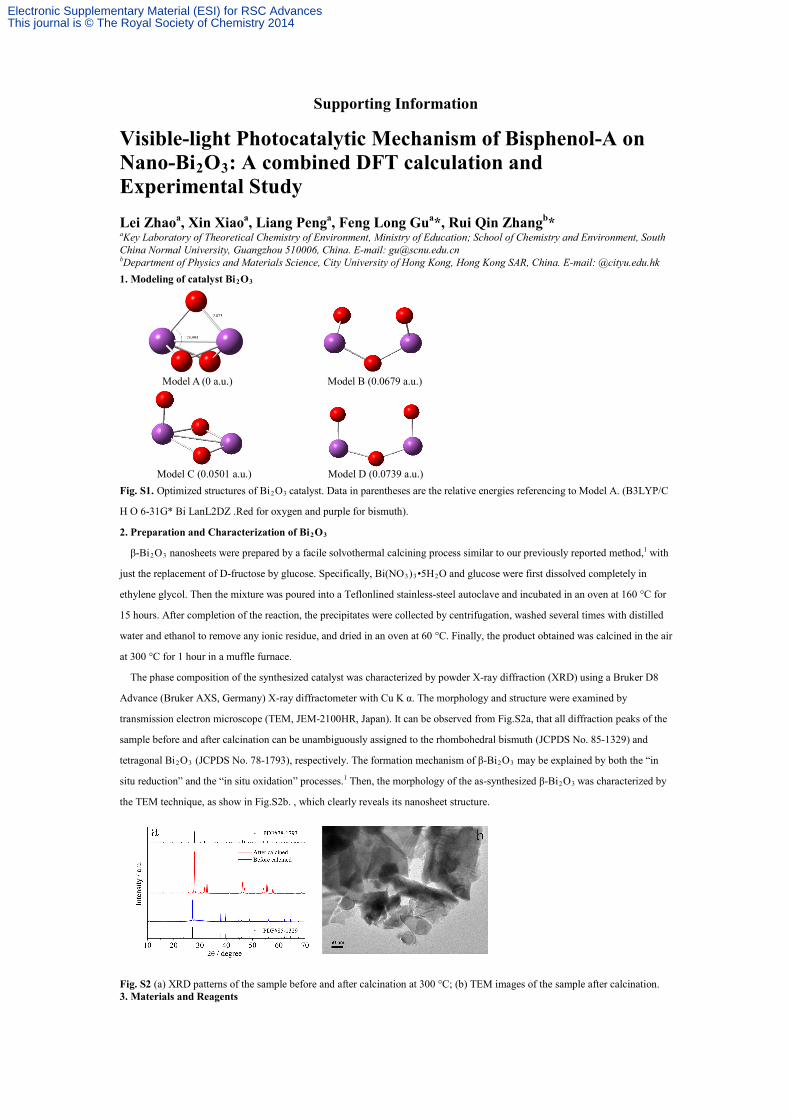
Supporting Information Visible-light Photocatalytic Mechanism of Bisphenol-A on Nano-Bi2O3: A combined DFT calculation and Experimental Study Lei Zhaoa, Xin Xiaoa, Liang Penga, Feng Long Gua*, Rui Qin Zhangb* aKey Laboratory of Theoretical Chemistry of Environment, Ministry of Education; School of Chemistry and Environment, South China Normal University, Guangzhou 510006, China. E-mail: [email protected] bDepartment of Physics and Materials Science, City University of Hong Kong, Hong Kong SAR, China. E-mail: @cityu.edu.hk 1. Modeling of catalyst Bi2O3
Model A (0 a.u.) Model B (0.0679 a.u.)
Model C (0.0501 a.u.) Model D (0.0739 a.u.)
Fig. S1. Optimized structures of Bi2O3 catalyst. Data in parentheses are the relative energies referencing to Model A. (B3LYP/C
H O 6-31G* Bi LanL2DZ .Red for oxygen and purple for bismuth).
2. Preparation and Characterization of Bi2O3
β-Bi2O3 nanosheets were prepared by a facile solvothermal calcining process similar to our previously reported method,1 with
just the replacement of D-fructose by glucose. Specifically, Bi(NO3)3•5H2O and glucose were first dissolved completely in
ethylene glycol. Then the mixture was poured into a Teflonlined stainless-steel autoclave and incubated in an oven at 160 °C for
15 hours. After completion of the reaction, the precipitates were collected by centrifugation, washed several times with distilled
water and ethanol to remove any ionic residue, and dried in an oven at 60 °C. Finally, the product obtained was calcined in the air
at 300 °C for 1 hour in a muffle furnace.
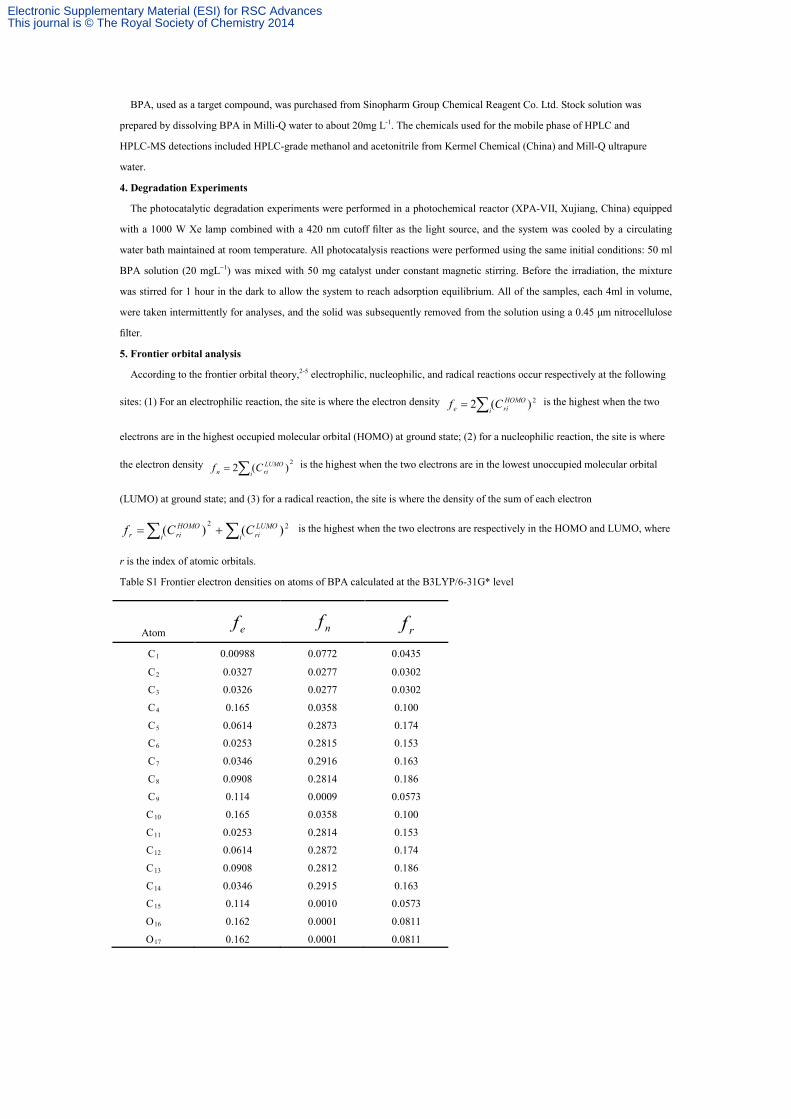
The phase composition of the synthesized catalyst was characterized by powder X-ray diffraction (XRD) using a Bruker D8
Advance (Bruker AXS, Germany) X-ray diffractometer with Cu K α. The morphology and structure were examined by
transmission electron microscope (TEM, JEM-2100HR, Japan). It can be observed from Fig.S2a, that all diffraction peaks of the
sample before and after calcination can be unambiguously assigned to the rhombohedral bismuth (JCPDS No. 85-1329) and
tetragonal Bi2O3 (JCPDS No. 78-1793), respectively. The formation mechanism of β-Bi2O3 may be explained by both the “in
situ reduction” and the “in situ oxidation” processes.1 Then, the morphology of the as-synthesized β-Bi2O3 was characterized by
the TEM technique, as show in Fig.S2b. , which clearly reveals its nanosheet structure.
Fig. S2 (a) XRD patterns of the sample before and after calcination at 300 °C; (b) TEM images of the sample after calcination. 3. Materials and Reagents
Electronic Supplementary Material (ESI) for RSC AdvancesThis journal is © The Royal Society of Chemistry 2014
BPA, used as a target compound, was purchased from Sinopharm Group Chemical Reagent Co. Ltd. Stock solution was
prepared by dissolving BPA in Milli-Q water to about 20mg L-1. The chemicals used for the mobile phase of HPLC and
HPLC-MS detections included HPLC-grade methanol and acetonitrile from Kermel Chemical (China) and Mill-Q ultrapure
water.
4. Degradation Experiments
The photocatalytic degradation experiments were performed in a photochemical reactor (XPA-VII, Xujiang, China) equipped
with a 1000 W Xe lamp combined with a 420 nm cutoff filter as the light source, and the system was cooled by a circulating
water bath maintained at room temperature. All photocatalysis reactions were performed using the same initial conditions: 50 ml
BPA solution (20 mgL−1) was mixed with 50 mg catalyst under constant magnetic stirring. Before the irradiation, the mixture
was stirred for 1 hour in the dark to allow the system to reach adsorption equilibrium. All of the samples, each 4ml in volume,
were taken intermittently for analyses, and the solid was subsequently removed from the solution using a 0.45 μm nitrocellulose
filter.
5. Frontier orbital analysis
According to the frontier orbital theory,2-5 electrophilic, nucleophilic, and radical reactions occur respectively at the following
sites: (1) For an electrophilic reaction, the site is where the electron density 2)(2∑=i
HOMOrie Cf is the highest when the two
electrons are in the highest occupied molecular orbital (HOMO) at ground state; (2) for a nucleophilic reaction, the site is where
the electron density 2)(2∑=i
LUMOrin Cf is the highest when the two electrons are in the lowest unoccupied molecular orbital
(LUMO) at ground state; and (3) for a radical reaction, the site is where the density of the sum of each electron
∑∑ +=i
LUMOrii
HOMOrir CCf 22 )()( is the highest when the two electrons are respectively in the HOMO and LUMO, where
r is the index of atomic orbitals.
Table S1 Frontier electron densities on atoms of BPA calculated at the B3LYP/6-31G* level
Atom ef nf rf
C1 0.00988 0.0772 0.0435
C2 0.0327 0.0277 0.0302
C3 0.0326 0.0277 0.0302
C4 0.165 0.0358 0.100
C5 0.0614 0.2873 0.174
C6 0.0253 0.2815 0.153
C7 0.0346 0.2916 0.163
C8 0.0908 0.2814 0.186
C9 0.114 0.0009 0.0573
C10 0.165 0.0358 0.100
C11 0.0253 0.2814 0.153
C12 0.0614 0.2872 0.174
C13 0.0908 0.2812 0.186
C14 0.0346 0.2915 0.163
C15 0.114 0.0010 0.0573
O16 0.162 0.0001 0.0811
O17 0.162 0.0001 0.0811
Electronic Supplementary Material (ESI) for RSC AdvancesThis journal is © The Royal Society of Chemistry 2014
6. Table S2 Total energy (a.u.) in gaseous phase and aqueous phase.
Gaseous
phase
Sum of electronic
and thermal Free
Energies
Aqueous
phase
Sum of electronic
and thermal Free
Energies
△E
(Aqueous-
Gaseous)
R1 -967.742242 R1 -967.839565 -0.097
TS1 -967.730243 TS1 -967.820792 -0.091
IM1 -967.742182 IM1 -967.82694 -0.085
TS2 -967.741875 TS2 -967.825167 -0.083
IM2 -967.785585 IM2 -967.864088 -0.079
R2 -619.792068 R2 -619.813863 -0.022
TS3-1 -619.768886 TS3-1 -619.796484 -0.028
TS3-2 -619.765423 TS3-2 -619.789343 -0.024
P1 -619.787136 P1 -619.81526 -0.028
R3 -653.628146 R3 -653.704132 -0.076
TS4 -653.619956 TS4 -653.692816 -0.073
P2 -653.624833 P2 -653.702302 -0.077
R4 -650.812201 R4 -650.904411 -0.092
TS5 -650.788518 TS5 -650.869877 -0.081
IM3 -650.792784 IM3 -650.88459 -0.092
TS6 -650.758196 TS6 -650.841401 -0.083
P3 -650.905712 IM4 -650.937741
P3 -650.985674 -0.080
R5 -611.267250 R5 -611.336095 -0.069
TS7 -611.230381 TS7 -611.309052 -0.079
IM5 -611.237418 IM5 -611.317597 -0.080
TS8 -611.206139 TS8 -611.280133 -0.074
P4 -611.342889 P4 -611.420291 -0.077
R6 -764.779260 R6 -764.852958 -0.074
TS9 -764.761213 TS9 -764.8404 -0.079
P5 -764.825701 P5 -764.894584 -0.069
Reference
1 X. Xiao, R. P. Hu, C. Liu, C. L. Xing, C. Qian, X. X. Zuo, J. M. Nan and L. S. Wang, Appl. Catal. B-Environ., 2013, 140-141,
433-443.
2 B. D. Lee, M. Iso and M. Hosomi, Chemosphere, 2001, 42, 431-435.
3 Y. Ohko, K. I. Iuchi, C. Niwa, T. Tatsuma, T. Nakashima, T. Iguchi, Y. Kubota and A. Fujishima, Environ. Sci. Technol., 2002,
36, 4175-4181.
4 K. Fukui, T. Yonezawa and H. Shingu, J. Chem. Phys.,1952, 20, 722.
5 R. G. Parr and W. Yang, J. Am. Chem. Soc., 1984, 106, 4049-4050.
Electronic Supplementary Material (ESI) for RSC AdvancesThis journal is © The Royal Society of Chemistry 2014