visibility bias in the transmission of consumption norms ... · pdf filevisibility bias in the...
TRANSCRIPT
October 16, 2015
Visibility Bias in the Transmission of Consumption Norms
and Undersaving
Bing Han∗
David Hirshleifer∗∗
We study how bias in the social transmission process affects contagion of time pref-erence norms. In the model, consumption is more salient than non-consumption. Thisvisibility bias causes people to perceive that others are consuming heavily and to infer thata high discount rate is normative. The transmission of norms for high discounting increasesconsumption and the equilibrium interest rate. Information asymmetry about the wealthof others dilutes the inference from high observed consumption that the discount rate ishigh. In consequence, in contrast with the Veblen wealth-signaling approach, informationasymmetry about wealth reduces overconsumption. The visibility bias approach offers anovel explanation for the dramatic drop in the savings rate in the US and several othercountries in the last thirty years. In contrast with other approaches, the visibility biasapproach implies that relatively simple policy interventions can ameliorate undersaving.
∗Rotman School of Management, University of Toronto∗∗Merage School of Business, UC Irvine
We thank Martin Cherkes, Marco Cipriani, Andreas Fuster, Giacomo de Giorgi, Marias-sunta Giannetti, Luigi Guiso (the AEA discussant), Robert Korajczyk, Theresa Kuchler(the Miami Behavioral Finance Conference discussant) Chris Malloy (the NBER discus-sant), Timothy McQuade, Peter Reiss, Siew Hong Teoh, Bernie Yeung, Youqing Zhou,participants at the Amerian Economics Association meetings in Boston, National Bureauof Economic Research Behavioral Finance Working Group meeting at UCSD, the OSUAlumni Conference at Ohio State University, the Miami Behavioral Finance Conference atthe University of Miami; and seminar participants at the Guanghua School of Management,Peking University; Southwest University of Finance and Economics; Hong Kong Polytech-nic University; Cheung Kong Graduate School of Business; London Business School; Na-tional University of Singapore; New York Federal Reserve Board; and Graduate School ofBusiness, Stanford University for very helpful comments; and Lin Sun and Qiguang Wangfor very helpful comments and research assistance.

1 Introduction
In acquiring attitudes, people are heavily influenced by their cultural milieu, and by inter-
actions with other individuals. We would expect such influence to be stronger when it is
hard to form a clear assessment through introspection. For example, several authors have
argued that people find it hard to decide how heavily to discount the future in making
savings decisions (e.g., Akerlof and Shiller (2009)). People may lack relevant information,
or be unwilling to process publicly available information such as mortality tables and health
statistics.
So people can’t be sure what stream of satisfaction will actually result from a consump-
tion/savings rule chosen today.1 Similarly, it is hard for people to forecast how long they
will live; most people do not process the public but technical information about mortality
tables that would permit an informed forecast. The same point applies to forecasting future
health in old age, and to how much ones health and housing and recreation expenditures
of different types are likely to change.
This suggests that people may ‘grasp at straws’ by relying on noisy cues, including the
behavior of others. A great deal of evidence suggests that people do make basic mistakes
and rely on noisy cues in their savings decisions (see, e.g., Samuelson and Zeckhauser (1988),
Shefrin and Thaler (1988), Madrian and Shea (2001), Beshears et al. (2008), Benhassine
et al. (2013)). There is also considerable evidence that social interactions affect several
dimensions of consumption and saving choices, sometimes in dysfunctional ways (see Duflo
and Saez (2002, 2003)), Hong, Kubik, and Stein (2004), Brown et al. (2008), Kaustia and
Knupfer (2012)), Georgarakos, Haliassos, and Pasini (2014), and the evidence reviewed in
Hirshleifer and Teoh (2009)).
The effects of social interactions involve more than just rational information transmis-
sion, as they include contagion of behaviors about which there is ample public information
(participating in the stock market), and there is transmission of trading in individual stocks,
an activity which individual investors are not, on average, good at.2 Surprisingly, however,
1Allen and Carroll (2001) point out that “...the consumer cannot directly perceive the value functionassociated with a given consumption rule, but instead must evaluate the consumption rule by living withit for long enough to get a good idea of its performance. . . . it takes a very large amount of experience . . .to get an accurate sense of how good or bad that rule is.”
2In an experimental consumption/savings setting, social interaction caused subjects to deviate morefrom the optimal consumption path over time (Carbone and Duffy (2013)).
1

there has been little formal modeling of how social learning processes affect consumption
choices over time.
In our model, social learning about the time preferences of others is biased by the
fact that consumption is more salient than non-consumption. For example, a boat parked
in a neighbor’s driveway draws more attention than the absence of a boat. Similarly,
it is more noticeable when a friend or acquaintance wears designer apparel or reports
taking an expensive trip than when not, or acquires an unusual or interesting product as
compared with not doing so. We call the greater salience of potential consumption events
that occur rather than do not occur visibility bias. In addition, we assume that people do
not adequately adjust for the selection bias in favor of noticing the consumption rather than
nonconsumption events of others. (Such neglect of selection bias is implied, for example,
by the representativeness heuristic of Kahneman and Tversky (1972).) This results in
overestimation of others’ consumption expenditures.
These key premises of our model—that consumption activities are more salient to others
than nonconsumption; and that people do not adequately adjust for the selection bias in
their attention toward consumption—are motivated by the psychology of attention and
salience. There is extensive evidence that occurrences are more salient and easier to process
than nonoccurrences (e.g., Neisser (1963), Healy (1981), and the review of Hearst (1991)).
Occurrences provide sensory or cognitive cues that trigger attention. In the absence of
such triggers, an individual will only react if (as is usually not the case) the individual was
actively monitoring for a possible absence. This is why the famous phrase in the Sherlock
Holmes story about “The dog that did not bark” is memorable; it is only the brilliant
detective who recognizes the importance of the absence of an event.
Visibility bias in our model causes a bias in the social transmission of information. It is
not inherently an error. For example, being prone to noticing a neighbor’s new car rather
than the old one need not signify any cognitive failure. There may be good reasons to
allocate attention to occurrences (or more generally, to salient events). However, failing to
adjust appropriately for this selection bias in attention/observation is a mistake that biases
inferences.
An opportunity cost is a non-occurrence of a benefit that would be received under
an alternative course of action. Most people seem to underweight opportunity costs in
making economic judgments. Economics instructors are well aware that the opportunity
cost concept is something that students only master with effort, if at all. Another example
of underweighting nonoccurrences relative to occurrences is omission bias, the tendency
of people to dislike and disapprove of actions that can result in adverse consequences, as
2

compared with refraining from taking actions, when refraining can also result in adverse
consequences. A classic example is an irrational reluctance to vaccinate (Ritov and Baron
1990).
There is evidence from both psychology, experimental economics, and field studies that
observers do not fully discount for data selection biases, a phenomenon called selection
neglect (see, e.g., Nisbett and Ross (1980) and Brenner, Koehler, and Tversky (1996)).3
Adjusting for selection bias requires time, attention, and effort. So owing to limited cog-
nitive resources, selection neglect is natural. Selection bias is especially hard for people to
correct for because adjustment requires attending to the non-occurrences that shape a sam-
ple. The evidence mentioned above that people underweight non-occurrences is therefore
consistent with the low salience of non-occurrences together with selection neglect.
According to the availability heuristic, people overestimate the frequency of events
that come to mind more easily, such as events that are highly memorable and salient.
For example, people overestimate the frequency of shark attacks because such attacks
are vivid and heavily reported in the media relative to other causes of death such as
auto accident. The combination of visibility bias and selection neglect in our model can
explain the availability heuristic of Kahneman and Tversky (1973), so overestimation of
consumption in the model can be viewed as a consequence of this heuristic.
Visibility bias makes consumption more available than non-consumption for later re-
trieval and cognitive processing. In consequence, people infer high consumption and low
savings rates by others, and conclude that a high discount rate is appropriate. Observers
in our model therefore increase their own subjective discount rates accordingly, which in-
creases actual consumption.
Consistent with our premises of visibility bias and selection neglect, consumption ac-
tivity is more salient than non-consumption in experiments in the field. As the study of
(Frederick 2012) concludes, “purchasing and consumption are more conspicuous than for-
bearance and thrift.” Consistent with the model’s implication that this results in overesti-
mation of others’ consumption, in Frederick’s study this salience results in overestimation
by observers of how much other individuals value certain consumer products. He explains
the difference in salience between consumption and non-consumption vividly: “Customers
in the queue at Starbucks are more visible than those hidden away in their offices unwilling
3People often naively accept sample data at face value (Fiedler 2008). Mutual fund families advertisetheir better-performing funds; in the experimental laboratory both novice investors and financial profes-sionals misinterpret fund performance owing to selection neglect (Koehler and Mercer 2009). Auctionbidders in economic experiments tend to suffer from a winner’s curse (neglect of the selection bias inherentin winning), and hence tend to lose money on average Parlour, Prasnikar, and Rajan (2007).
3

to spend $4 on coffee. We are repeatedly exposed to commercials of people enthusiasti-
cally gulping soda and gyrating to their iPods, but the large segment of nonusers is not so
memorably depicted.”
Also consistent with visibility bias, people are influenced in car purchases decisions by
the purchases of others (Grinblatt, Keloharju, and Ikaheimo (2008), Kuhn et al. (2011),
Shemesh and Zapatero (2011)) most strongly in areas where commuting patterns make the
automobile purchase choices of others more visible (McShane, Bradlow, and Berger 2012).
In the model, overestimation of the consumption of others is self-reinforcing, as each
individual becomes an overconsuming model for others. So misperceptions of consumption
norms can result in severe undersaving in society as a whole. A corollary of this reluctance
of individuals to save is a higher equilibrium interest rate. Each individual ends up viewing
the discount rates of others as higher than his own. This comes from overestimation of
others’ discount rate, and the fact that each individual shifts only partially in the direction
of the perceived norm.
Such a mismatch between beliefs and social reality, wherein everyone individually rejects
a norm (in this case, a norm of high discount rates), yet believes that others embrace it,
is called pluralistic ignorance (Katz and Allport 1931). For example, social psychology
studies find that college students overestimate how much other students engage in and
approve of heavy alcohol use (Prentice and Miller 1993) and uncommitted or unprotected
sexual practices (Lambert, Kahn, and Apple 2003). These studies argue that pluralistic
ignorance encourages such behaviors. In our model it is overconsumption that is promoted
by pluralistic ignorance.
This feature of our model can also help explain why parents, social observers, and
religious leaders tend to preach in favor of thrift, and to criticize the now-focused consumer
culture. To the extent that society is subject to pluralistic ignorance, people believe that
others have an unduly high discount rate. Moral authorities will therefore believe that they
can improve matters by using their influence against current consumption.
There are notable differences in savings rates across countries and ethnic groups which
are not well-explained by traditional economic models (Bosworth 1993), and evidence that
language, a cultural trait, affects time preference and savings rates (Chen 2013).4 An
implication of the visibility bias approach to time preference is that relatively modest
4Carroll, Rhee, and Rhee (1994) do not find an effect of culture on savings. The authors describe this asa tentative conclusion owing to data limitations. In contrast, using a similar methodology, Carroll, Rhee,and Rhee (1999) conclude that there are cultural effects, but that these effects do not explain patterns incross-country differences in savings rates.
4

differences in inherent discount rates can be amplified through social influence. This can
help explain the extremity of inter-group differences.
Advertising and media biases can further reinforce overconsumption. Advertisers have
an incentive to depict consumers using their products heavily (as implicitly alluded to
in the quotation from Frederick above). News media serve their clientele by highlighting
interesting consumption of high-end products or of consumption events (consider, e.g.,
the “Travel” section of newspapers). These further contribute to the higher visibility of
consumption than nonconsumption. Of course, there is advertising of financial products as
well. But it is much easier to vividly depict individuals consuming heavily at restaurants
or exotic locations than to depict individuals saving heavily.
The occurrence versus non-occurrence distinction that we focus upon is not the only
source of differences in the salience of different consumption behaviors. For example, infor-
mation that is more action-relevant tends to be more salient. Extreme outcomes also tend
to be more salient. Other things equal, this will cause observers to notice especially when
others have either unusually low or unusually high consumption, with no clear overall bias
toward either over- nor under- estimation of others’ consumption. Such effects (which we
do not model) would basically be orthogonal to those we focus on. Our model does not
require such effects; our focus is on an attentional bias—neglect of nonoccurrences—that
has a clearcut directional implication for under- versus over- consumption.
Personal saving rates in the U.S. have declined dramatically since the 1980s, from 10%
in the early 1980s to a low of about 3% in 2007, while national debt has increased. A similar
trend has occurred in many OECD countries, with ratios of household debt to disposable
income often reaching well over 100% (e.g., OECD (2014)). Economists have long struggled
to explain this drop, but it remains a puzzle (Parker 1999; Guidolin and Jeunesse 2007).
Parker (1999) concludes that “Each of the major current theories of the decline in the U.S.
saving rate fails on its own to match significant aspects of the macroeconomic or household
data.” Guidolin and Jeunesse (2007) argue that factors such as greater capital mobility,
new financial instruments, and aging populations do not suffice to explain the phenomenon,
and conclude: “The recent decline of the U.S. private saving rate remains a puzzle.”
The savings decline presents a challenge to behavioral as well as rational models, since it
is not obvious why psychological traits would shift over time toward greater impatience. The
visibility bias approach offers a novel explanation for this longstanding puzzle. The model
is driven by observation of the consumption of others; greater observability of consumption
intensifies the overconsumption effect. The drop in costs of long-distance communication,
and then the rise of the internet, greatly increased the ability of individuals to observe oth-
5

ers’ consumption, as people are able to phone, e-mail, blog, and report on social networks
about their consumption experiences. It is indeed very common for people, in communicat-
ing on electronic networks, to report on such activities as travelling, eating out, and recent
product purchases. Such observation is the driving force behind overconsumption in our
model. Of course, the effects we model are far from the only drivers of savings rates, but it
seems valuable to have a possible explanation for the large and anomalous drop in saving.
A plausible alternative theory of overconsumption and undersaving is that people are
present-biased (i.e., subject to hyperbolic discounting, Laibson (1997)). Present bias is a
preference effect, whereas visibility bias approach is based on belief updating. Also, present
bias is an individual-level bias, whereas the visibility bias approach is based upon social
observation and/or interaction. The visibility bias approach therefore has the distinctive
implications that the intensity of social interactions and shifts in the technology for observ-
ing the consumption of others affect the extent of overconsumption. It also implies that
population level characteristics such as wealth dispersion matter, in contrast with pure
individual-level biases such as present bias.
Another appealing approach to overconsumption is based on Veblen effects (Cole,
Mailath, and Postlewaite (1995), Bagwell and Bernheim (1996), Corneo and Jeanne (1997),
Charles, Hurst, and Roussanov (2009)), wherein people overconsume to signal high wealth
to others. In wealth signaling models, beliefs are rational, whereas the visibility bias ap-
proach is based upon biased inferences. The visibility approach has distinct empirical
implications as well. For example, if all wealths were equal, Veblen effects would be elimi-
nated, but the effects in our approach still apply. So in a visibility bias approach we expect
to see overconsumption even within peer groups with low wealth inequality.
More generally (as discussed in Section 5), an intuitive implication of the Veblen ap-
proach is that the incentive to signal is stronger when observers face greater information
asymmetry about the wealth of others, as occurs with high wealth dispersion. This must
happen on average, in the sense that there is no overconsumption motivated by wealth
signaling when there is zero wealth dispersion, and positive overconsumption when there
is wealth signaling owing to positive wealth dispersion.
In contrast, in the visibility bias approach, greater information asymmetry dilutes the
inference that can be drawn from (perceived) high consumption of others that their dis-
count rates are high. In consequence, under high information asymmetry about wealth,
equilibrium consumption is lower, the opposite of the Veblen-style prediction. We discuss
some recent tests of the distinctive empirical implications of the visibility bias theory.
A third approach is based on investors deriving utility as a function of the consumptions
6

of other investors (e.g., Abel (1990), Campbell and Cochrane (1999)), potentially resulting
in overconsumption (Dupor and Liu 2003).5 This is a preference approach, as contrasted
with our belief-based approach, which offers several distinctive implications.6
A further distinctive empirical and policy implication of the visibility bias approach
is that exposing pluralistic ignorance by disclosing and saliently emphasizing information
about the actual consumption or consumption attitudes of others will reduce overconsump-
tion. That a relatively cheap and simple policy intervention can ameliorate the undersavings
problem is a distinctive implication of the visibility bias approach. Overconsumption in
this approach derives from mistaken beliefs about others that can potentially be corrected.
In contrast, the present bias approach is not based on social observation, and the other two
approaches are based upon rational beliefs.
2 The Basic Model
We first consider the effects of visibility bias in learning about the consumption of others
with no uncertainty or production.
2.1 Optimal Consumption of Individuals
There are two consumption dates. At date 0, the individual chooses how much to consume
and how much to borrow or lend at the riskfree interest rate r. Each individual i solves
maxci0,ci1
U(ci0) + δiU(ci1)
subject to the intertemporal budget constraint
ci0 +ci1
1 + r= yi0 +
yi11 + r
, (1)
where the yi’s are endowed levels of the consumption good at the two dates.7 The first
order condition is
u′(ci0) = δi(1 + r)u′(ci1). (2)
5In DeMarzo, Kaniel, and Kremer (2004, 2008) ‘keeping up with the Joneses’ effects can arise in settingswith conventional preferences.
6Our model also provides a possible motivation for the assumption of external habit formation (utilityinteractions) in asset pricing models. This is usually viewed as being for tractability, but something akinto this arises naturally in our setting because of social influence in consumption.
7The subjective discount factor δi should be distinguished from the subjective discount rate, which canbe defined as (1/δi)−1. It is common to refer to discount rates in intuitive discussions; we do so at severalpoints in the paper.
7

For most of the paper we assume logarithmic utility, U(c) = log(c). Then optimal con-
sumptions ci0 and ci1 satisfyci1ci0
= δi(1 + r). (3)
Define wealth as
Wi = yi0 +yi1
1 + r.
Combining (3) with the budget constraint (1) gives the individual’s optimal consumption
ci0 =Wi
1 + δi, (4)
so heavier subjective discounting (lower δ) causes current consumption to increase.8
In the rest of this section, our focus is on the determination of date 0 consumption ci0.
For ease of notation, we omit the time subscript 0.
2.2 Visibility Bias and Learning About Others’ Consumption
Suppose that there are N potential publicly observable consumption activities. Let the
consumption intensity c be the propensity to engage in each of the N available consumption
activities, where the probability that individual i undertakes any given activity is increasing
in c. For any given activity, the probability that it is engaged in is p(c) = c/κ, where 0 ≤c ≤ κ. Each activity costs K = κ/N , κ > 0. (Having a different multiplied constant here
would not qualitatively affect the results.) So the total expected consumption expenditure
is
Np(c)K = c, (5)
which is independent ofN . In other words, we allow the number of activities to grow and the
cost per activity to shrink correspondingly so that the expected cost remains unchanged. As
N become large, the expenditure on consumption is close to its expectation c almost surely.
We therefore refer to c henceforth as ‘consumption’ rather than ‘consumption intensity.’
An individual randomly selects a target individual to observe, draws a sample of these
potential consumption activities, and observes whether the target did or did not undertake
each. (In the basic model, we will assume identical individuals, so that it would make
no difference if an individual were to observe a sample from several targets.) Crucially,
observation is tilted toward those activities in which consumption did occur. This derives
from what we call visibility bias, the tendency to notice and recall occurrences rather than
8Although r enters implicitly through wealth, it does not enter directly in this log utility setting owingto the cancellation of income and substitution effects as r varies (for given value of endowments).
8

non-occurrences. We view the event of engaging in a consumption activity as generally
more salient to others than the event of not doing so.
One reason that consumption activities are highly visible is that many are social, such
as eating at restaurants, wearing stylish clothing to work or parties, and travelling. Fur-
thermore, physical shopping for consumption goods is itself a social activity. Both physical
and electronic shopping and product evaluation are also engaging topics of conversation. In
contrast, saving is often a private activity between an individual and his bank, brokerage,
or retirement account software. There are exceptions of course, such as investment clubs,
but overall, consumption tends to be more observable and salient to others than is saving.9
In particular, the probability that the observer samples any given potential activity is
qC if the individual did undertake the consumption activity and qN if the individual did
not, where qC > qN .10 The intensity of visibility bias is captured by τdef= qC/qN > 1.
Letting f(c) be the fraction of the activities sampled by the observer in which consump-
tion occurs, the expected fraction is therefore
E[f(c)] =p(c)qC
p(c)qC + [1− p(c)]qN(6)
=p(c)τ
p(c)τ + [1− p(c)]> p(c). (7)
The numerator in the first line is the probability that in any given activity consumption
occurs and is detected, and the denominator is the probability that anything is detected—
either consumption or non-consumption.
In the model, the observer fails to discount fully for the selection bias in observation, so
the observer uses f(c) to evaluate the frequency of the target’s consumption activities. So
visibility bias causes the observer to overestimate the fraction of the time that the target
engages in consumption activity. As N , the number of activities observed, becomes large,
limN→∞E[f(c)] = f(c), so that the fraction of activities sampled in which consumption
occurs, as given by (6), is nonstochastic.
9Two other comparisons are of interest. Retirement savings has very low visibility to others, so ourapproach suggests that people will underestimate such saving. Buying a house is highly visible. We viewthis as another example of the higher visibility of engaging in a consumption activity than not doing so.When an individual buys a house there is a shift to a higher rate of consumption of housing services. Also,a house’s stream of housing services is usually financed by a mortage, resulting in a major increase inindebtedness for the purpose of consumption, part of which occurs in the short-term.
10We refer to the observer as observing a biased sample of target activities. However, the algebra ofthe updating process in the model can equally be interpreted as reflecting a setting in which observersdraw unbiased random samples of observations, but where there is a bias in the ability to retrieve differentobservations for cognitive processing and the formation of beliefs.
9

The observer inverts from the consumption activity fraction given in (6) to infer the
target’s total consumption. When the true consumption of others is c, the inferred con-
sumption is
c = h(c)def= p−1(f(c)) =
cqCκ
cqC + (κ− c)qN=
cκ
c+ (κ− c)/τ> c. (8)
So owing to visibility bias, observers overestimate others’ consumption levels, and the
amount of overestimation increases with visibility bias, ∂h(c)/∂τ > 0.
2.3 Updating Discount Rates Based Upon Observation of Others
Let ci denote individual i’s inference about the level of others’ consumptions, and suppose
that all individuals have the same wealth, Wi = W for all i. Then by (4), the time
preference parameter δi inferred by i satisfies
ci =W
1 + δi,
so
δi(ci) =W
ci− 1. (9)
Let δ∗ be the common inherent time preference parameter for all individuals. (In a
review of literature in consumer psychology, Simonson (2008) argues that preferences do
have an ‘inherent’ core as well as constructed aspects.) After learning about others’ con-
sumption and time preference, the individual updates his own time preference parameter
to δi by taking a weighted average of his inherent time preference, δ∗, and the inferred time
preference of others, δi:
δi = g(δi) ≡ (1− γ)δ∗ + γδi, (10)
where 0 ≤ γ < 1, and where γ depends on the degree of social interactiveness/observability.
This updating rule is based on the idea that an individual who thinks that others are
consuming heavily infers that consuming heavily is a good idea.
This can be viewed as a reduced form for a setting in which individuals acquire informa-
tion from others about the return on saving. For example, an individual may be learning
from others (not necessarily rationally) about the probability of dying at a young age or
about how consumption needs will change in retirement. This emphasizes that the driving
force of our model is a bias in information processing rather than a direct preference effect
in favor of early consumption.
10

Alternatively, the inference could be moralistic, i.e., learning about whether being a
good person demands providing for the future—recall Aesop’s fable of the ant and the
grasshopper. Akerlof (2007) emphasizes that moral attitudes affect consumption decisions;
under the moralistic interpretation of our model, such attitudes are influenced by the
perceived consumption of others.
We refrain from imposing a rational-expectations-like condition that an individual un-
derstands that others share the individual’s time preferences. Also, we do not think of
individuals as even recognizing the distinction between others’ inherent and actual time
preferences. Each individual simply updates based upon inferences about the actual time
preferences of others. Such simplified reasoning, wherein an observer fails to take into
account fully the thought processes of other individuals, is broadly consistent with mod-
els and experimental studies of limited cognition about the thought processes of others
(e.g., Hirshleifer and Teoh (2003), Camerer, Ho, and Chong (2004) and Eyster and Rabin
(2005)).11
Also, our model captures conformism by assuming that observation of others causes
people to update their discount factors. An alternative approach would be based on a direct
preference for consuming to match the consumption timing of others. Such a keeping-up-
with-the-Joneses’ approach, however, potentially generates multiple equilibria with early
or late consumption, whereas our approach predicts a specific direction, overconsumption.
The updating rule (10), together with (4), implies that individual i selects a current
consumption level of
ci =W
1 + g(δi). (11)
2.4 The Symmetric Equilibrium
Assume that all individuals have identical utility functions, inherent discount factors, and
consumption endowments. We seek a symmetric equilbrium, i.e., a fixed point in consump-
tion and discount factor, for given wealth W and model parameters: 0 < δ∗ < 1 (inherent
11Even if an observer were to distinguish between actual and inherent discount rates and conform to theinferred inherent rate, effects of the type we focus on would arise in a setting that reflects the fundamentalattribution error from social psychology. This is the tendency of observers to unduly attribute the behaviorof others to inherent personal characteristics rather than to environmental circumstances (Nisbett and Ross(1980)). In the current context, this would mean attributing a target individual’s high consumption toa high inherent discount rate rather than to the target individual merely conforming to the perceivedconsumption levels of others. An observer who is subject to the fundamental attribution error will inferthat the inherent discount rate of others is high, and update his own discount rate accordingly. (Thisargument does, however, require that the observer not understand that everyone has the same inherentdiscount rate.)
11

discount factor), γ (weight on the inferred discount factor of others) and τ , intensity of
visibility bias.
We define (symmetric) equilibrium as follows.
Definition of Equilibrium In an equilibrium, for all i, ci = c, δi = δ satisfy:
(1 + g(δ))c = W (12)
(1 + δ)h(c) = W, (13)
with the functions g and h defined as
g(δ)def= (1− γ)δ∗ + γδ,
and
h(c)def= p−1(f(c)).
In this definition of equilibrium, (12) is the requirement that the individual optimize
based upon the individual’s updated discount rate as in (11), and (13) is the requirement
that the individual draws inferences about others’ discount rates recognizing that others
are optimizing in their consumption choices, i.e., follow the solution as given in (4) with δi
replaced with δ.
This is an equilibrium in the sense that individuals are satisfied given their observations
of others and the exogenous interest rate. But we have not yet imposed market clearing to
determine prices.
Consistent with intuition, in this setting visibility bias causes overconsumption.
Proposition 1 In a setting with exogenous interest rate and with visibility bias, under log
utility and the other assumptions of the model:
1. There exists a unique symmetric equilibrium.
2. The consumption level c is higher than that without visibility bias.
3. The amount of overconsumption increases with visibility bias (τ) and with social in-
teractiveness/observability (γ).
Proof: From (13), δ = W/h(c)− 1. Substituting this into (12), equilibrium consumption
c satisfies
[1 + (1− γ)δ∗] c+ γ
(W
h(c)− 1
)c = W. (14)
12
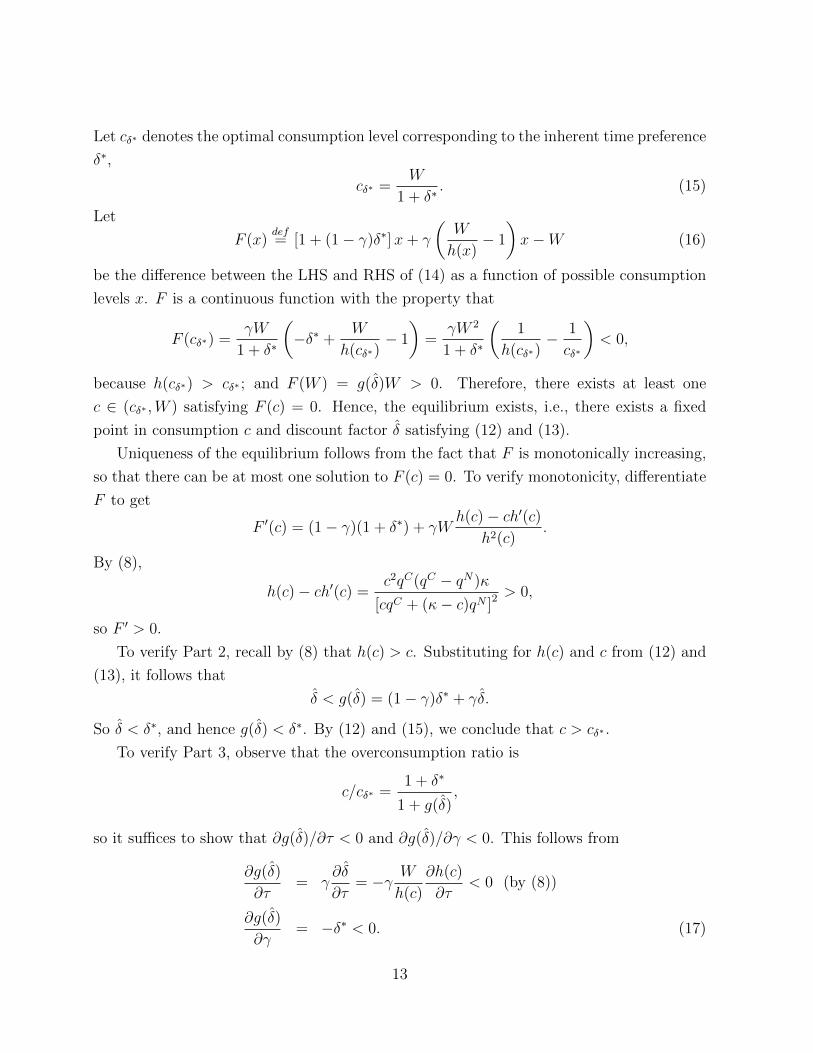
Let cδ∗ denotes the optimal consumption level corresponding to the inherent time preference
δ∗,
cδ∗ =W
1 + δ∗. (15)
Let
F (x)def= [1 + (1− γ)δ∗]x+ γ
(W
h(x)− 1
)x−W (16)
be the difference between the LHS and RHS of (14) as a function of possible consumption
levels x. F is a continuous function with the property that
F (cδ∗) =γW
1 + δ∗
(−δ∗ +
W
h(cδ∗)− 1
)=
γW 2
1 + δ∗
(1
h(cδ∗)− 1
cδ∗
)< 0,
because h(cδ∗) > cδ∗ ; and F (W ) = g(δ)W > 0. Therefore, there exists at least one
c ∈ (cδ∗ ,W ) satisfying F (c) = 0. Hence, the equilibrium exists, i.e., there exists a fixed
point in consumption c and discount factor δ satisfying (12) and (13).
Uniqueness of the equilibrium follows from the fact that F is monotonically increasing,
so that there can be at most one solution to F (c) = 0. To verify monotonicity, differentiate
F to get
F ′(c) = (1− γ)(1 + δ∗) + γWh(c)− ch′(c)
h2(c).
By (8),
h(c)− ch′(c) =c2qC(qC − qN)κ
[cqC + (κ− c)qN ]2> 0,
so F ′ > 0.
To verify Part 2, recall by (8) that h(c) > c. Substituting for h(c) and c from (12) and
(13), it follows that
δ < g(δ) = (1− γ)δ∗ + γδ.
So δ < δ∗, and hence g(δ) < δ∗. By (12) and (15), we conclude that c > cδ∗ .
To verify Part 3, observe that the overconsumption ratio is
c/cδ∗ =1 + δ∗
1 + g(δ),
so it suffices to show that ∂g(δ)/∂τ < 0 and ∂g(δ)/∂γ < 0. This follows from
∂g(δ)
∂τ= γ
∂δ
∂τ= −γ W
h(c)
∂h(c)
∂τ< 0 (by (8))
∂g(δ)
∂γ= −δ∗ < 0. (17)
13

‖Intuitively, owing to visibility bias in what is observed, and neglect of sample size/use of
the availability heuristic in assessing frequences, people overestimate others’ consumption,
and therefore overestimate others’ discount rates. Based on a misperception that the social
norm is less thrifty than it really is, people update their own time preferences toward
current consumption.
As discussed in the introduction, personal saving rates have plunged in the U.S. and
several other OECD countries over the last 30 years. Existing rational and behavioral
theories do not seem to fully explain this phenomenon. Parts 2 and 3 of Proposition 1
provide a possible explanation.
First, greater observability of the consumption of others, as reflected in γ, intensifies
the effects of visibility bias. Decreasing costs of long-distance telephone service, and sub-
sequently the rise of the internet, drastically reduced the cost of conveying information
about personal consumption activities to others. There has been a dramatic increase in
electronic communications by such means as phone, email, blogging, and social networking
(especially Facebook) about personal consumption activities. The activities that are note-
worthy to report on very often involve expensive purchases, as with eating out or travelling.
Indeed, many social networking and review sites are organized around consumption activi-
ties, such as Yelp.12 In-person observation of nearby individuals or close friends may often
include even nonconsumption activities, whereas electronic reports tend to select especially
strongly for consumption activities. So the rise in modern communications is reflected in
our model as an increase in τ , as in Part 3.
The assumption that individuals are identical, yet misperceive the attitudes of others, is
stark. However, similar findings would apply in settings with heterogeneous discount rates.
Furthermore, as mentioned earlier, such mismatches between own beliefs and social reality
capture the empirical phenomenon of pluralistic ignorance, wherein everyone individually
rejects a norm, yet believe that others favor it.
The social influence parameter γ is identical across individuals. With diverse γ’s, we
conjecture that individuals with greater susceptibility to social influence will overconsume
more than those with lower γ. Such individuals update their preferences more in the
direction of their overestimated perception of the consumption norm. It is evident that
12Hirsh (2015) provides evidence suggesting that the drop in savings rates was caused by increasingpopulation-level extraversion in many countries. This explanation is compatible with our approach, sincegreater sociability causes greater observation of others’ consumption. However, even in the absence ofshifts in population-level psychological traits, our model can explain the drop in the savings rates byimprovements in electronic communication technologies.
14

this is true for the special case in which γ is identical for almost everyone.
Result 1 For given social influence parameter γ of other investors, an individual with zero
mass with parameter γ′ consumes more than others if and only if γ′ > γ, and less than
others if and only if γ′ < γ. This individual’s consumption is increasing with γ′.
This implication that individuals with greater susceptibility to social influence will
overconsume more is empirically testable.
The comparative statics on varying endowments are intuitive. Details are provided in
the appendix. Under homothetic preference (such as log utility), visibility bias increases
the marginal propensity to consume from current income. Visibility bias and resulting
misperceptions of social norms cause the individual’s current consumption c0 to be more
sensitive to changes in income than without visibility bias, because higher wealth tends
to increase both current and future consumption. With homothetic preferences, the ratio
between the two is constant. Social influence and visibility bias in our setting increase
the ratio of current to future consumption, and therefore also the marginal propensity to
consume out of income (or wealth).
2.5 The Equilibrium Interest Rate
The reasoning so far focuses on individual decisions with the riskfree rate r taken as given.
We next solve for r by clearing the bond market. Intuitively, since visibility bias in social
observation results in too low a time discount factor (δ), the equilibrium interest rate (r)
is too high.
In a pure exchange economy, people can’t all consume more today. The pro-consumption
effects of visibility bias on δ are offset by a corresponding rise in r, so that the representative
individual consumes the (exogenous) per capita income (although each individual thinks
that his neighbors consume more than himself). In Section 4, allowing for intertemporal
production reinstates the result that visibility bias increases current consumption, as indi-
viduals are able to satisfy their amplified preferences for current consumption by investing
less.
From the optimization condition (3) and the budget constraint (1), the optimal con-
sumption of the representative individual at date 0 satisfies
c0(1 + δ) = y0 +y1
1 + r.
In the symmetric equilibrium, each individual perceives that others use a time discount
parameter δ, and updates his own discount factor to g(δ) = (1 − γ)δ∗ + γδ. By (12),
15

equilibrium satisfies
c0(1 + g(δ)) = y0 +y1
1 + r. (18)
Since individuals are identical, in equilibrium the interest rate r zeroes out borrowing and
lending. This implies that c∗0 = y0, so by (18),
1 + r =y1
y0g(δ). (19)
Comparing to the case without visibility bias, where equilibrium interest rate satisifies (19)
with g(δ) replaced by δ∗, it is evident that visibility bias raises the equilibrium interest rate
because g(δ) < δ∗ (equation (??)).
Proposition 2 Under pure exchange and log utility, the equilibrium riskfree interest rate
is higher when individuals are subject to visibility bias in social observation than when they
are not.
This also implies that even if individuals are potentially subject to visibility bias, if its
effects are eliminated owing to an absence of social interactions or social observation, the
interest rate is lower.
3 General Utility Function and Income Uncertainty
In the model of Section 2, there is no uncertainty, and we assumed log utility. We now
show that visibility bias causes overconsumption in a setting with uncertainty about future
income and with an arbitrary increasing concave utility function U(c). We examine this
issue in a partial equilibrium with exogenous interest rate r.
With y1 uncertain at date 0, each individual solves
maxc0
U(c0) + δE[U(c1)]
subject to the intertemporal budget constraint
c0 +c1
1 + r= y0 +
y1
1 + r. (20)
Optimal consumption satisfies
u′(c0) = δ(1 + r)E[u′(c1)]. (21)
Differentiating both sides of (21) with respect to δ gives
u′′(c0)∂c0
∂δ= (1 + r)E[u′(c1)] + δ(1 + r)E[u′′(c1)]
∂c1
∂δ. (22)
16

The budget constraint (1) implies that
∂c1
∂δ= −(1 + r)
∂c0
∂δ.
Substituting this into (22) yields
{u′′(c0) + δ(1 + r)2E[u′′(c1)]
} ∂c0
∂δ= (1 + r)E[u′(c1)]. (23)
The RHS of (23) is positive because u′ > 0; the coefficient on ∂c0/∂δ on the LHS is
negative because u′′ < 0. Hence, even under general risk averse preference and uncertain
future income, it remains the case that as an individual becomes more impatient (δ becomes
smaller), he consumes more today:dc0
dδ< 0. (24)
It is then straightforward to show that the optimal consumption c0 with biased social
transmission is higher than the case without visibility bias, because in the former case, the
individual uses an updated discount factor g(δ) that is lower than the discount factor δ∗ that
obtains without visibility bias. So visibility bias and social influence increases equilibrium
consumption.
Proposition 3 In a setting with general von-Neumann Morgenstern risk averse utility,
uncertain future income y1, and an exogenous interest rate, visibility bias increases con-
sumption relative to a setting with no visibility bias.
4 The Model with Production
We have shown in a setting with interest rate exogenously fixed that visibility bias increases
consumption; and, in a pure exchange equilibrium setting, that visibility bias increases the
interest rate, where equilibrium consumption is fixed by the market clearing condition at
endowed consumption.
We now extend the basic model to allow for productive transformation between current
and future consumption. In addition to the riskfree asset, individuals can invest some of
their savings in a production technology which produces Y1 units of future consumption
goods using I units of investment. At date 0, each individual chooses the level of con-
sumption (c0), allocates a positive or negative amount to riskfree bonds (b) and to real
investment (I). Each individual is endowed with exogenous incomes y0 and y1 at the two
dates.
17

Individual i solves the optimization problem
maxc0,c1
U(c0) + δU(c1)
subject to the technological constraint
Y1 = H(I)def= AIα, 0 < α < 1, (25)
and the budget constraints
c0 = y0 − I − b (26)
c1 = Y1 + y1 + b(1 + r). (27)
The optimization can be done over two controls c0 and b. Once these two are chosen,
by (26), the initial investment in the production technology is
I = y0 − c0 − b.
Together with (25) and (27), this implies that the date 1 consumption is
c1 = H(y0 − c0 − b) + y1 + b(1 + r). (28)
Substituting (28) into the objective function L = U(c0) + δU(c1) of the maximization
problem, we obtain the first order conditions with respect to c0 and b:
∂L
∂c0
= U ′(c0)− δU ′(c1)H(I) = 0 (29)
∂L
∂b= δU ′(c1)[−H ′(I) + 1 + r] = 0. (30)
Equation (30) and the definition of H(I) = A(I)α imply that
αAIα−1 = 1 + r, or (31)
I =
(1 + r
αA
) 1α−1
. (32)
The log utility function U(c) = log(c) and (29) imply that
c1 = δH ′(I)c0 = δ(1 + r)c0. (33)
By (26), it follows that
c0 + b = y0 −(
1 + r
αA
) 1α−1
= y0 − I. (34)
18

By (27) and (33),
δc0 =y1 +H(I)
1 + r+ b. (35)
We can solve for date 0 optimal consumption c0 and allocation to riskfree asset b from
(34) and (35). Let W be the individual’s wealth, defined as the discounted value of the sum
of present and future endowment y’s and of production of future consumption Y = H(I),
net of expenditure on investment:
W = y0 +y1 +H(I)
1 + r− I.
Adding (34) and (35), and cancelling b from both sides gives
c0 =W
1 + δ. (36)
By (34) and (36), the optimal bond investment is
b =δ
1 + δ(y0 − I)− 1
1 + δ
y1 +H(I)
1 + r. (37)
In equilibrium, the bond market clears, b = 0, so the equilibrium interest rate satisfies
1 + r =y1 +H(I)
δ(y0 − I). (38)
Corresponding to this interest rate, the optimal consumption is c0 = y0 − I. Since a log
utility investor will never consume a negative amount, the equilibrium condition that b = 0
implies that I < y0.
Combining (32) and (38), the equilibrium level of investment I satisfies
G(I; δ) = 0, (39)
where the function G is defined as
G(I; δ)def= AIα(1 + αδ)− αδAy0I
α−1 + y1. (40)
Differentiating shows that
∂G
∂δ= αAIα−1(I − y0) < 0 (41)
∂G
∂I= αAIα−2[(1 + αδ)I − (α− 1)δy0] > 0, (42)
because I < y0 and 0 < α < 1. To see that this implies a solution for I within its support
(0, y0), observe that limI→0G(I; δ) = −∞, that G(y0; δ) > 0, and that ∂G/∂I > 0.
19

By (41), (42), and the implicit function theorem, ∂I/∂δ > 0. Since, by (??), visibility
bias reduces δ, the equilibrium investment I is lower, and hence the consumption level
c0 = y0 − I is higher.
Let equilibrium be defined by each individual’s date 0 consumption c0 and his inference
of others’ time preference δ satisfying
(1 + g(δ))c0 = W (43)
(1 + δ)h(c0) = W, (44)
with the function g given by
g(δ)def= (1− γ)δ∗ + γδ,
and the inferred consumption of others h(c) by
h(c)def= p−1(f(c)).
Here owing to visibility bias h(c) > c.
The following proposition summarizes these results.
Proposition 4 In an equilibrium setting with log utility, visibility bias and intertemporal
production:
(1) There exists a unique symmetric equilibrium. At date 0 all individuals invest
I =
(1 + r
αA
) 1α−1
.
Each individual invests b in the riskfree asset at date 0, where
b =g(δ)
1 + g(δ)(y0 − I)− 1
1 + g(δ)
y1 + AIα
1 + r,
and where the riskfree rate r is
1 + r =y1 + A(I)α
g(δ)(y0 − I).
(2) With visibility bias, the equilibrium consumption level c0 is higher, and investment I is
lower, than in the absence of visibility bias.
So as in the basic setting with exogenous interest rate of Subsection 2.4, visibility
bias increases consumption, and as in the equilibrium analysis of Subsection 2.5 (in which
the pure exchange setting precluded an effect on equilibrium consumption), visibility bias
increases the interest rate. Here visibility bias also decreases saving and real investment.
20

5 Information Asymmetry
We now generalize to allow for wealth dispersion in the population, and for individuals
not knowing the wealths of others. Intuitively, the inference an observer draws about the
discount rate of others based on observation of another’s consumption is weaker if the
observer does not know the target’s wealth, owing to conflation between the possibilities
that the discount rate is high or that wealth is high. Wealth dispersion therefore reduces
equilibrium overconsumption. This contrasts sharply with the Veblen wealth-signaling
approach, in which it is precisely the fact that there is uncertainty about wealth that
causes overconsumption to serve as a signal.
To model information asymmetry, we assume that each individual, as an observer, has a
nondegenerate prior distribution over the common actual discount rate of others. As in the
earlier sections, the setup reflects pluralistic ignorance; an observer does not understand
that everyone is essentially similar to the observer with respect to discount rate. This
creates an opening for visibility bias and the availability heuristic to influence perceptions.
We grant individuals enough rationality to understand that when they see high con-
sumption, this could come from either a high discount rate or high wealth. As a simple
benchmark to highlight the effects of visibility bias, we assume that people have correct
prior beliefs about the joint distribution of others’ wealths and their actual discount rate.
People update from this correct prior to an incorrect posterior about these variables.
As in the earlier sections, observers draw inferences about others’ actual discount rate,
not their inherent discount rate. Observers views others’ actual discount rate as normative,
and update their own discount rates in the direction of their inferences. However, here even
after observing others an individual does not feel sure about others’ discount rate, so the
individual updates in the direction of the conditional expected discount rate of others.
We return to the pure exchange setting of Section 2, except that we allow for wealth
dispersion. Let fδ(δ) be the prior probability density that each individual has about the
common actual discount factor of others. All observers share this prior about possible
targets of observation, and this density matches the true underlying density. Similarly,
let gW (W ) be the prior density for individuals’ wealths (independently distributed across
targets of observation). Wealth and actual discount factors are independently distributed,
and everyone correctly perceives this to be the case. An observer makes observations of a
single target; since the wealth distribution is identical across individuals, we omit subscripts
identifying which target.
For notational simplicity we now omit hats for variables indicating individual percep-
21

tions. By (4) and independence of δ and W , an observer who infers that a target’s con-
sumption is c for sure updates his belief about δ to
fδ(δ|c) =fδ,c(δ, c)
fc(c)
=fδ(δ)gW ((1 + δ)c)∫
δfδ(δ)gW ((1 + δ)c)dδ
. (45)
Assume that δ ∼ U [0, 1] and W ∼ U [1 − K, 2 + K], where 0 ≤ K ≤ 1. K measures
the amount of wealth dispersion. In the numerator of the RHS of (45), fδ(δ) = 1 on the
support of δ, and otherwise is zero. gW ((1 + δ)c) = 1 iff (1 + δ)c ∈ [1 − K, 2 + K], and
otherwise is zero.
The condition that W ≥ 1−K implies that (1 + δ)c ≥ 1−K, so
δ ≥ max
(0,
1−Kc− 1
)def= δ. (46)
The condition that W ≤ 2 +K implies that (1 + δ)c ≤ 2 +K, so
δ ≤ min
(2 +K
c− 1, 1
)def= δ. (47)
We can therefore calculate the expected discount factor as perceived by an observer who
believes he has observed another individual with consumption c, as
E[δ|c] =
∫δ≤δ≤δ δ(1 + δ)dδ∫δ≤δ≤δ(1 + δ)dδ
. (48)
In this calculation, the 1 + δ terms come from the fact that the g density is a function of
(1 + δ)c.
We consider three cases.
Case 1: 0 < c < 1−K.
Then the range of the integrals becomes δ ∈ [1−Kc− 1, 1], so
E[δ|c] =
∫ 11−Kc−1δ(1 + δ)dδ∫ 1
1−Kc−1
(1 + δ)dδ
=1
3
(1 +
2(1−K)2
2c2 + (1−K)c
). (49)
It is evident from this expression that inferred time preference parameter decreases with
observed consumption of others. We will compare the amount of updating about others’
22

time preference based on observed consumption c as measured by the sensitivity of in-
ferred time preference parameter to c, dE[δ|c]/dc, when there is wealth dispersion to the
benchmark case when there is no wealth dispersion. It is straightforward to show that the
absolute value of this sensitivity dE[δ|c]/dc decreases with the amount of wealth dispersion
K, anddE[δ|c]dc
|K=0 = − 2(4c+ 1)
3c2(2c+ 1)2. (50)
Case 2: 1−K < c < 1 + K2
, which implies that δ = 0 and δ = 1. In this case, E[δ|c] = 59,
so the inferred discount rate of the others does not vary with the observed consumption
activities.
Case 3: 1 + K2< c < 2 +K, which implies δ = 2+K
c− 1, δ = 0, so
E[δ|c] =
∫ 2+Kc−1
0δ(1 + δ)dδ∫ 2+K
c−1
0(1 + δ)dδ
=8 + 8K + 2K2
6c+ 3c2− 1
3. (51)
Again, the inferred time preference parameter E[δ|c] decreases with observed consumption
of others, the absolute value of the sensitivity dE[δ|c]/dc decreases with the amount of
wealth dispersion K, anddE[δ|c]dc
|K=0 = − 16(1 + c)
3c2(c+ 2)2. (52)
As a benchmark for comparison, suppose that there is no wealth dispersion, and that
the known level of wealth W is equal to the expected value of wealth in the model with
wealth dispersion, W = 1.5. In the model without wealth dispersion, by (4), the inferred
value of δ is
δ(c) =W
c− 1 =
3
2c− 1, (53)
so
δ′(c) = −3
2c−2. (54)
It is straightforward to show by direct comparison that in all three cases,
δ′(c) <dE[δ|c]dc
≤ 0. (55)
In other words, with wealth dispersion, the discount factor that the observer perceives about
the target of observation does not decrease as rapidly with perceived target consumption
as in the model without wealth dispersion.
23

Proposition 5 In the numerical example of Section 5, comparing the setting with wealth
dispersion with a setting with constant wealth equal to the expected wealth in the uncertainty
setting, an observer’s perception of the target’s discount factor is less sensitive to perceived
target consumption than when there is no wealth dispersion.
Empirically, Proposition 5 predicts that savings rates increase with wealth dispersion.
This contrasts with the argument in the keeping-up-with-the-Joneses literature that such
dispersion causes the poor to overconsume in emulation of the wealthy. This is also the
opposite of what is expected based upon Veblen wealth-signaling considerations. In the
Veblen approach to overconsumption, people consume more in order to signal the level
of wealth to others (Bagwell and Bernheim (1996), Corneo and Jeanne (1997)). Greater
information asymmetry about wealth intensifies the effect, by increasing the potential im-
provement in wealth perceptions that can be achieved by signaling. This is reflected, for
example, in the finding of Charles, Hurst, and Roussanov (2009) that an increase in wealth
dispersion that takes the form of a reduction in the lower support of wealth results in
greater signaling.13
For example, in the limiting case of no information asymmetry, the Veblen effect would
disappear and people would consume only for their direct utility benefits. More generally,
in a simple setting in which the upper bound of the support of the wealth distribution
becomes higher, then the range of possible equilibrium consumption signal levels is higher,
so there will be more overconsumption on average.
Empirically, Jin, Li, and Wu (2011) find that greater income inequality is associated with
lower consumption and with greater investment in education, in survey evidence from Chi-
nese urban households, where income inequality is measured within age groups by province.
Similarly, using high geographical resolution 2001-12 data, Coibion et al. (2014) provide
strong evidence that low-income households in high-inequality U.S. locations accumulated
13A more detailed intuition is that when dispersion increases, the lower support of the wealth distributiondecreases, so the signalling schedule starts increasing from an earlier beginning (a lower wealth level),raising the signaling schedule for any given wealth level. In their Veblen-style model, Charles, Hurst, andRoussanov (2009) show that an increase in the dispersion of the wealth distribution that derives from areduction in the lower support (making the poorest poorer) causes greater conspicuous consumption. Theirexplanation is essentially the same: “The intuition is that as poorer people are added to a population,persons of every level of income must now signal more to distinguish themselves from those immediatelypoorer, because those people are themselves now compelled to spend more to distinguish themselves frompersons who are even poorer still.” However, Charles, Hurst, and Roussanov (2009) show that the effectof a more general increase in wealth dispersion is ambiguous. What we expect to apply quite generally inVeblen-style models is that wealth-signaling through consumption vanishes when wealth dispersion is zero.So such models reflect a general tendency for greater wealth dispersion to induce greater overconsumption,though not necessarily monotonically.
24

less debt (relative to income) than their counterparts in lower-inequality locations. These
findings are consistent with the visibility bias approach, in contrast with the implication
of wealth-signaling via consumption, or with the idea that low income individuals borrow
and consume more in order to try to keep up with high income households.
Our approach also implies contagion in consumption across individuals with different
wealths. Using state-level survey data, Bertrand and Morse (2013) document that increased
income of the top quintile or decile in the income distribution is associated with more
consumption by less wealthy individuals. In our approach, when the wealths of others are
imperfectly observable, such contagion in consumption occurs because individuals who see
high consumption of others attribute this in part to a high discount rate rather than high
wealth. The authors further find that non-rich households’ consumption of more visible
goods and services is especially responsive to increases in top-end wealth, consistent with
visibility bias effects of the type that we model. However, contagion in consumption is
also implied by some versions of the Veblen and keeping-up-with-the-Joneses approaches
to overconsumption.
Several studies report that wealth dispersion has increased in the United States since
the 1980s (Piketty and Saez (2003), Goldin and Katz (2007), and Autor, Katz and Kearney
(2008), but see also Card and DiNardo 2002 and Lemieux (2006)). Given an increase in
wealth dispersion, all else equal, Proposition 5 counterfactually implies a rising savings
rate. However, all else was not equal. we believe that a much more important shift
(from the standpoint of the effects in our model) has been the dramatic transformation of
electronic communications and social networks. As discussed as discussed in Section 2, this
has increased the visibility of the consumption activities of others (both absolutely, and
relative to non-consumption), which implies greater overconsumption in our model.
The effects of wealth dispersion here derive from the unobservability of others’ wealths
rather than dispersion per se. The model therefore predicts that when the wealth of neigh-
bors is harder to observe directly, there is less overconsumption.
6 Concluding Remarks
We examine how social influence endogenously shapes time preferences. In our model,
consumption is more salient than non-consumption, resulting in greater observation and
cognitive encoding of others’ consumption activities. This visibility bias makes episodes of
high consumption by others more salient and easier to retrieve from memory than episodes
of low consumption. So owing to neglect of selection bias (and a well-known manifestation
25

of it, the availability heuristic), people infer that low saving is normative and increase their
own discount rates accordingly. This effect is self-reinforcing at the social level, resulting
in overconsumption and high interest rates. The model therefore results in pluralistic
ignorance about the time preferences of others; each person thinks that the others have a
higher discount rate. This ignorance in equilibrium has adverse consequences for resource
allocation.
The visibility bias approach offers a simple explanation for one of the most puzzling
and important stylized facts about household finance: the dramatic drop in personal saving
rates in the U.S. and many other OECD countries over the last 30 years. In the model,
greater observability of the consumption of others intensifies the effects of visibility bias,
and therefore increases overconsumption. We argue that the decline in the last thirty
years in costs of long-distance telephone service, and subsequently the rise of the inter-
net, dramatically increased the extent to which people convey information about personal
consumption activities to others by phone, email, blogging, and social networking. This
is because consumption activities such as travel, dining out, or buying a car tend to be
relatively noteworthy to report upon.
In contrast with the present bias (hyperbolic discounting) theory of overconsumption,
the effects here are induced by social observation and interaction. Our approach can there-
fore be distinguished from present bias using proxies for sociability and observability, such
as urban versus rural, and survey questions about sociability (see, e.g., Hong, Kubik, and
Stein (2004), Brown et al. (2008), Christelis, Georgarakos, and Haliassos (2011), and Geor-
garakos and Pasini (2011)). Our approach also offers predictions about how population-level
characteristics such as wealth variance affect consumption.
The effect of wealth dispersion in our model contrasts with the implications of the
Veblen and keeping-up-with-the-Joneses approaches. In at least some versions of the latter
approach, wealth dispersion encourages the poor to consume more in emulation of the
wealthy. The Veblen wealth-signaling approach, broadly implies greater overconsumption
when there is greater information asymmetry about the wealth of others (as occurs with
high wealth dispersion). In our setting greater information asymmetry dilutes the inference
from high observed consumption that the discount rate of others is high. In consequence,
equilibrium consumption is lower, the opposite prediction. The visibility bias approach also
helps explain high variation in savings rates across countries and ethnic groups, because
even modest differences in inherent discount rates can be amplified through social influence.
In contrast with the signaling and preference-based approaches, our biased-belief-based
approach implies that a cheap and easy policy intervention will substantially increase sav-
26
ing. This is to provide—in highly salient form—accurate information about how much
peers save, or their attitudes toward consumption. This implication about the beneficial
effects of salient disclosure could be tested in the field. Indeed, there is evidence discussed
earlier supporting this implication in a specialized setting, the decision of college students
of how much to drink.
In addition to providing insight about undersaving in general, the social interaction
approach to consumption/saving norms potentially can contribute to our understanding of
the dynamics of consumption as well. For example, suppose that there are lags between
people observing others and updating their own consumption plans, or lags between their
consumption plans and actual consumption. If there are shocks to the system that en-
courage high or low spending, then the response lags can create momentum in shifts in
consumption and consumption norms. This can potentially cause patterns of overshooting
and correction, which would provide a possible basis for an overconsumption theory of local
consumption booms and business cycles.
More generally, our approach to understanding the evolution of consumption and saving
attitudes is based upon misperception of norms—pluralistic ignorance. This approach is
potentially applicable to various other settings, which suggests a rich direction for future
research.
27
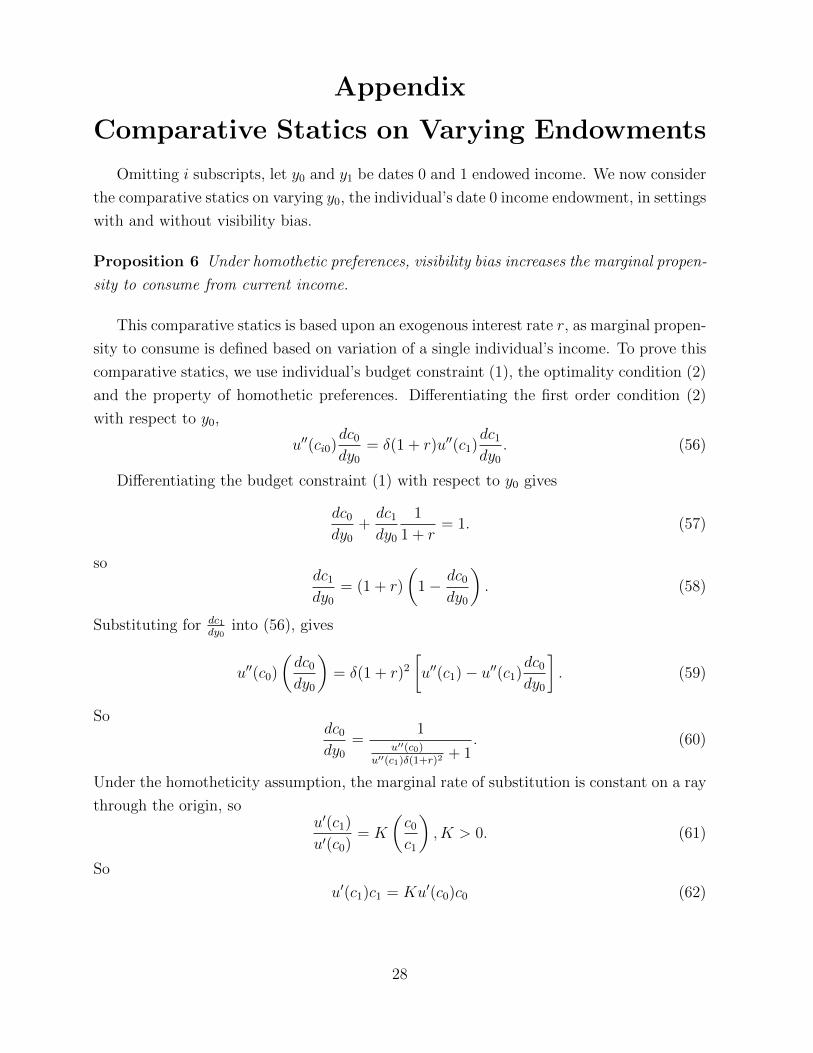
Appendix
Comparative Statics on Varying Endowments
Omitting i subscripts, let y0 and y1 be dates 0 and 1 endowed income. We now consider
the comparative statics on varying y0, the individual’s date 0 income endowment, in settings
with and without visibility bias.
Proposition 6 Under homothetic preferences, visibility bias increases the marginal propen-
sity to consume from current income.
This comparative statics is based upon an exogenous interest rate r, as marginal propen-
sity to consume is defined based on variation of a single individual’s income. To prove this
comparative statics, we use individual’s budget constraint (1), the optimality condition (2)
and the property of homothetic preferences. Differentiating the first order condition (2)
with respect to y0,
u′′(ci0)dc0
dy0
= δ(1 + r)u′′(c1)dc1
dy0
. (56)
Differentiating the budget constraint (1) with respect to y0 gives
dc0
dy0
+dc1
dy0
1
1 + r= 1. (57)
sodc1
dy0
= (1 + r)
(1− dc0
dy0
). (58)
Substituting for dc1dy0
into (56), gives
u′′(c0)
(dc0
dy0
)= δ(1 + r)2
[u′′(c1)− u′′(c1)
dc0
dy0
]. (59)
Sodc0
dy0
=1
u′′(c0)u′′(c1)δ(1+r)2
+ 1. (60)
Under the homotheticity assumption, the marginal rate of substitution is constant on a ray
through the origin, sou′(c1)
u′(c0)= K
(c0
c1
), K > 0. (61)
So
u′(c1)c1 = Ku′(c0)c0 (62)
28

Partially differentiating with respect to c1, c0 gives
u′′(c1)c1 + u′(c1) = 0 (63)
u′′(c0)c0 + u′(c0) = 0. (64)
It follows from (61), (63) and (64) that
u′′(c1)
u′′(c0)= K
(c0
c1
)2
. (65)
Sodc0
dy0
=1(
c1c0
)2 [1
Kδ(1+r)2+ 1] > 0. (66)
As for the social effect on the marginal propensity to consume, differentiating with respect
to γ,
sign
(dc0dy0
dγ
)= sign
(c0c1
)2
dγ
= sign
(dc0
dγ
)> 0. (67)
29
References
Abel, A. B., 1990, Asset prices under habit formation and catching up with the Joneses,American Economic Review 80, 38–42.
Akerlof, G. A., 2007, The missing motivation in macroeconomics, American EconomicReview 97.
Akerlof, G. A. and R. J. Shiller, 2009, Animal Spirits: How Human Psychology Drivesthe Economy and Why it Matters for Global Capitalism (Princeton University Press,Princeton, NJ).
Allen, T. W. and C. D. Carroll, 2001, Individual learning about consumption, Macroe-conomic Dynamics 5, 255–271.
Bagwell, L. S. and B. D. Bernheim, 1996, Veblen effects in a theory of conspicuousconsumption, American Economic Review 86, 349–373.
Benhassine, N., F. Devoto, E. Duflo, and P. D. amd Victor Pouliquen, 2013, Turning ashove into a nudge? A ”labeled cash transfer” for education, NBER working paperNO.19227, World Bank.
Bertrand, M. and A. Morse, 2013, Trickle-down consumption, Working paper, Universityof Chicago.
Beshears, J., J. Choi, D. Laibson, and B. Madrian, 2008,. The importance of defaultoptions for retirement saving outcomes: Evidence from the USA, . In S. J. Kay andT. Sinha, eds., Lessons from Pension Reform in the Americas, Chapter 3, pp. 59–87.(Oxford University Press, Oxford).
Bosworth, B. P., 1993, Saving and Investment in a Global Economy (Brookings Institu-tion Press, Washington, D.C.).
Brenner, L. A., D. J. Koehler, and A. Tversky, 1996, On the evaluation of one-sidedevidence, Journal of Behavioral Decision Making 9, 59–70.
Brown, J. R., Z. Ivkovich, P. A. Smith, and S. Weisbenner, 2008, Neighbors matter:Causal community effects and stock market participation, Journal of Finance 63,1509–1531.
Camerer, C. F., T.-H. Ho, and J.-K. Chong, 2004, A cognitive hierarchy model of games,Quarterly Journal of Economics 119, 861–898.
Campbell, J. Y. and J. H. Cochrane, 1999, By force of habit: A consumption-basedexplanation of aggregate stock market behavior, Journal of Political Economy 107,205–251.
Carbone, E. and J. Duffy, 2013, Lifecycle consumption plans, social learning and externalhabits: Experimental evidence, Working paper, University of Pittsburgh.
Carroll, C. D., B.-K. Rhee, and C. Rhee, 1994, Are there cultural effects on saving?Some cross-sectional evidence, Quarterly Journal of Economics 109, 685–699.
30
Carroll, C. D., B.-K. Rhee, and C. Rhee, 1999, Does cultural origin affect saving be-havior? Evidence from immigrants, Economic Development and Cultural Change 48,33–50.
Charles, K. K., E. Hurst, and N. Roussanov, 2009, Conspicuous consumption and race,Quarterly Journal of Economics 124, 425–467.
Chen, M. K., 2013, The efect of language on economic behavior: Evidence from savingsrates, health behaviors, and retirement assets, The American Economic Review 103,690–731.
Christelis, D., D. Georgarakos, and M. Haliassos, 2011, Stockholding: Participation,location, and spillovers, Journal of Banking & Finance 35, 1918–1930.
Coibion, O., Y. Gorodnichenko, M. Kudlyak, and J. Mondragon, 2014, Does greaterinequality lead to more household borrowing? new evidence from household data,NBER Working Paper No. 19850.
Cole, H. L., G. J. Mailath, and A. Postlewaite, 1995, Incorporating concern for relativewealth into economic models, Quarterly Review, Federal Reserve Bank of Minneapo-lis 19, 12–21.
Corneo, G. and O. Jeanne, 1997, Conspicuous consumption, snobbism and conformism,Journal of Public Economics 66, 55–71.
DeMarzo, P., R. Kaniel, and I. Kremer, 2008, Relative wealth concerns and financialbubbles, Review of Financial Studies 21, 19–50.
Demarzo, P. M., R. Kaniel, and I. Kremer, 2004, Diversification as a public good: Com-munity effects in portfolio choice, Journal of Finance 59, 1677–1716.
Duflo, E. and E. Saez, 2002, Participation and investment decisions in a retirement plan:The influence of colleagues’ choices, Journal of Public Economics 85, 121–148.
Duflo, E. and E. Saez, 2003, The role of information and social interactions in retire-ment plan decisions: Evidence from a randomized experiment, Quarterly Journal ofEconomics 118, 815–842.
Eyster, E. and M. Rabin, 2005, Cursed equilibrium, Econometrica 73, 1623–1672.
Fiedler, K., 2008, The ultimate sampling dilemma in experience-based decision making,Journal of Experimental Psychology: Learning, Memory, and Cognition 34, 186–203.
Frederick, S., 2012, Overestimating others’ willingness to pay, Journal of ConsumerResearch 39, 1–21.
Georgarakos, D., M. Haliassos, and G. Pasini, 2014, Household debt and social interac-tions, Review of Financial Studies 27, 1404–1433.
Georgarakos, D. and G. Pasini, 2011, Trust, sociability, and stock market participation,Review of Finance 15, 693–725.
Grinblatt, M., M. Keloharju, and S. Ikaheimo, 2008, Social influence and consump-tion: Evidence from the automobile purchases of neighbors, Review of Economicsand Statistics 90, 735–753.
31

Guidolin, M. and E. L. Jeunesse, 2007, The decline in the u.s. personal saving ratel is itreal or is it a puzzle, Federal Reserve Bank of St. Louis Review 89, 491–514.
Healy, A. F., 1981, The effects of visual similarity on proofreading for misspellings,Memory and Cognition 9, 453–460.
Hearst, E., 1991, Psychology and nothing, American Scientist 79, 432–443.
Hirsh, J., 2015, Extraverted populations have lower savings rate, Personality and Indi-vidual Differences 81.
Hirshleifer, D. and S. H. Teoh, 2003, Limited attention, information disclosure, andfinancial reporting, Journal of Accounting & Economics 36, 337–386.
Hirshleifer, D. and S. H. Teoh, 2009,. Thought and behavior contagion in capital markets,. In T. Hens and K. Schenk-Hoppe, eds., Handbook Of Financial Markets: DynamicsAnd Evolution, Handbooks in Finance, Chapter 1, pp. 1–46. (North-Holland, Ams-terdam, The Netherlands).
Hong, H. G., J. D. Kubik, and J. C. Stein, 2004, Social interaction and stock marketparticipation, Journal of Finance 59, 137–163.
Jin, Y., H. Li, and B. Wu, 2011, Income inequality, consumption, and social-statusseeking, Journal of Comparative Economics 39, 191–204.
Kahneman, D. and A. Tversky, 1972, Subjective probability: A judgment of representa-tiveness, Cognitive Psychology 3, 430–454.
Kahneman, D. and A. Tversky, 1973, On the psychology of prediction, PsychologicalReview 80, 237–25l.
Katz, D. and F. H. Allport, 1931, Students’ Attitudes: A Report of the Syracuse Univer-sity Reaction Study (Craftsman Press, Syracuse, NY).
Kaustia, M. and S. Knupfer, 2012, Peer performance and stock market entry, Journal ofFinancial Economics 104, 321–338.
Koehler, J. J. and M. Mercer, 2009, Selection neglect in mutual fund advertisements,Management Science 55, 1107–1121.
Kuhn, P., P. Kooreman, A. Soetevent, and A. Kapteyn, 2011, The effects of lotteryprizes on winners and their neighbors: Evidence from the Dutch Postcode Lottery,American Economic Review 101, 2226–2247.
Laibson, D., 1997, Golden eggs and hyperbolic discounting, Quarterly Journal of Eco-nomics 112, 443–477.
Lambert, T. A., A. S. Kahn, and K. J. Apple, 2003, Pluralistic ignorance and hookingup, Journal of Sex Research 40, 129–133.
Madrian, B. and D. Shea, 2001, The power of suggestion: Inertia in 401(k) participationand savings behavior, Quarterly Journal of Economics 116, 1149–1187.
McShane, B. B., E. T. Bradlow, and J. Berger, 2012, Visual influence and social groups,Journal of Marketing Research 49, 854–871.
32

Neisser, U., 1963, Decision-time without reaction-time: Experiments in visual scanning,American Journal of Psychology 76, 376–385.
Nisbett, R. and L. Ross, 1980, Human Inference: Strategies and Shortcomings of SocialJudgment (Prentice-Hall, Englewood Cliffs, NJ).
OECD, 2014, Oecd factbook 2014: Economic, environmental and social statistics, OECDPublishing .
Parker, J., 1999, Spendthrift in america? on two decades of decline in the u.s. savingrate, NBER Macroeconomics Annual 14.
Parlour, C. A., V. Prasnikar, and U. Rajan, 2007, Compensating for the winner’s curse:Experimental evidence, Games and Economic Behavior 60, 339–356.
Prentice, D. A. and D. T. Miller, 1993, Pluralistic ignorance and alcohol use on campus:Some consequences of misperceiving the social norm, Journal of Personality andSocial Psychology 64, 243–256.
Ritov, I. and J. Baron, 1990, Reluctance to vaccinate: Omission bias and ambiguity,Journal of Behavioral Decision Making 3, 263–277.
Samuelson, W. and R. Zeckhauser, 1988, Status-quo bias in decision making, Journal ofRisk and Uncertainty 1, 7–59.
Shefrin, H. M. and R. H. Thaler, 1988, The behavioral life-cycle hypothesis, EconomicInquiry 26, 609–643.
Shemesh, J. and F. Zapatero, 2011, Thou shalt not covet thy (suburban) neighbor’s car,Working paper, University of Melbourne.
Simonson, I., 2008, Will I like a medium pillow? Another look at constructed andinherent preferences, Journal of Consumer Psychology 18, 155–169.
33