visfacet: facet visualization module for modern library …ceur-ws.org/vol-1311/paper9.pdf · ·...
TRANSCRIPT
VISFACET: Facet Visualization Module for ModernLibrary Catalogues
Miriam Allalouf,1 Dalia Mendelsson,2 and Evgeniy Mishustin1
1Azrieli College of Engineering, Jerusalem2The Hebrew University of Jerusalem
Abstract. The “next-generation” catalogues of academic libraries provide a dis-covery layer that contains faceted classification and search features and suggestedtopics selected by their rankings. To improve the discovery process, this paperdemonstrates an interactive faceted visualization box, termed VisFacet, that ex-tends the catalog interface and allows users to narrow or broaden their searchresults filtered by suggested topics or facets in an interactive manner. The Vis-Facet software visualization module was integrated into and contributed to theVuFind open source software system. VuFind is a development portal that en-ables libraries to customize their own catalogue interfaces and discovery layer.Thus, extending VuFind with VisFacet provides all catalogues using VuFind attheir system’s core with the benefit of having an infographic interactive searchbox. We will describe the challenges encountered during the development of theVisFacet project, including the user discovery satisfaction questionnaire results.
1 IntroductionThe traditional academic library catalogue enables end users to search for andfind requested information. With the development of the Internet, and the intro-duction of Google as a major player in the information retrieval arena, the searchpatterns began to change. The Google-like search method influenced the way thatlibrary catalogues are being developed to offer a similar user experience [1], [2].Traditional library catalogues were designed for the tasks of searching, identify-ing, selecting, and accessing information. The information retrieval is based onpredefined indexes. The user had to be familiar with the specific fields involved inthe information retrieval process. For example, users were expected to know howto construct complex search queries, utilize subject searching, and apply Booleansearch operators [3]. Over time, the catalogue did change and a new generationof catalogues became more popular in academic libraries. The breakthrough ofproviding web-based online public access to library collections and resourcesdid not require changes in the Integrated Library Systems’ (ILS) core. The newconcept was developed only at the presentation layer of the Online Public Ac-cess Catalogue (OPAC). Additional indexing at the presentation layer providedthe essential discovery infrastructure to the “next-generation” catalogues. Nowa-days, libraries’ next-generation catalogues offer academic resources based on theadvances of the information retrieval technologies; they are trying to meet thereaders’ new expectations and enhance their experience by making library cata-logues more user friendly, intuitive, and visually attractive [4]. The new discov-ery systems contain predictive search features (such as “Did you mean?”); userprofile-aware content, such as tags, ratings, reviews, and comments; and a facetedclassification.The faceted classification feature that classifies items into multiple independentcategorization schemes (or facets) is a topic from library science that has become
popular in information computing [5]. In this important approach, the informationretrieval system allows the assignment of an object to multiple attributes, thusenabling the classification to be ordered in multiple ways, rather than in a single,predetermined order. For example, a collection of books might be classified usingan Author facet, a Region facet, an Era facet, and so on. The Region facet consistsof clusters of records from the list, each of which is associated with a region-related keyword. Performing a search of the catalogue, the system presents, alongwith the usual search engine results page (SERP), different predefined facets. Byclicking on them, the user can narrow his search and refine the results set. All thesuggested information is presented to users in textual format in several separatedfields of the SERP. Using faceted navigation with suggested topics has proven tobe one possible way of enhancing the user’s navigation and exploration, but withthe growing numbers of library materials, and users who demand easy access andhigh-performance systems, there is still a need for further development.Information visualization is an emerging component in many scientific researchareas such as digital libraries, data mining, and financial data analysis. Mercunand Zumer in [6] discuss the demonstrated importance of visual information inlibrary catalogue presentations, particularly in simple visualizations such as tagclouds, time sliders for refining search, featured cover displays of new acquisi-tions, recently borrowed items, bookshelf display, and vocabularies such as “wordcloud” in Aquabrowser [7]. In our opinion the next-generation catalogue, beingan exploratory tool designed for discovery, must add the potential of informa-tion visualization for exploratory faceted search visualization to their capabili-ties. This paper describes the VisFacet plug-in framework we have designed anddeveloped. VisFacet is an interactive, faceted search and navigation visualizationsystem. It uses a book’s existing metadata information to provide an intuitivelyunderstood and visually attractive graph of facets. It appears within and extendsthe SERP. The VisFacet software modules have been integrated into the VuFindsystem. There is currently no next-generation catalogue that integrates a visual-ized and interactive faceted search.VuFind (www.vufind.org) is an open source, next-generation library resourceportal that enables the development of a customized, faceted navigation system.VuFind provides a full set of modules to produce a customized cataloging sys-tem layer in which libraries can implement all the features they want, modify theexisting modules to best fit their needs, and add new modules to extend their re-source offerings. The Library Authority of the Hebrew University customized theVuFind system modules and built the HUfind next-generation catalogue. HUfindhas been in production since 2012. Our VisFacet framework extends the VuFindsystem’s capabilities with the visualization feature, and all catalogues that useVuFind at their system’s core (such as HUfind) can benefit from VisFacet. More-over, today there are several development platforms for modern cataloging oflibrary systems, and none of them has a faceted visualization framework such aswe are suggesting. VisFacet makes three main contributions:
1. It adds the visualized, interactive search capabilities of the facets to theVuFind system. The view includes objects filtered by a variety of similartopics and by facets such as Era and Region.
2. It adds a broadened search capability to the visualized view, which is a com-pletely new feature.
3. It contributes the code to the VuFind open source project.

2 Related WorksIn chapters thirteen and fourteen of their book [8], Shneiderman et al. providea comprehensive survey of human-computer interaction in general, particularlyin the context of information visualization for information search and retrieval.Latest trends in the information technology arena show that visualized representa-tion of the suggested topics, where the user can see the relations between clustersdrawn graphically and click on them, is more understandable and intuitive [9],[10], [6]. There are several works that explore data visualization as a way to en-hance the digital library results page. ResultMaps [11] is a treemap-based searchvisualization system, developed as an extension to digital libraries. It uses hierar-chical subject classification to map each repository document into a treemap andhighlight items that correspond to the current query. ResultMaps works very wellfor small repositories consisting of hundreds to thousands of records, but does notscale well, since the interface quickly becomes unreadable with the growth of therepository. FacetMap [12] is another visualization approach to faceted navigationsystems that enables the visualization by interacting with large databases. Thoughit is limited to the Windows operating system rather than the web. AquaBrowser[7] is a commercial next-generation library catalogue that provides its own dataretrieval algorithms and unique features to satisfy the end user’s high require-ments. The “Discover” feature gives a similar visualization look to our VisFacet.It does not provide a narrow faceted-search capability: it performs a new searcheach time a user clicks on it. Tiara [13] is a text visualization system that was builtto aid users in exploring and analyzing large text collections: given a user query,Tiara provides rich graphic interactions with informative and powerful visual textsummaries. Thai et al. [14] suggest a new visual ordering of faceted visualizationin which a matrix-based multidimensional visualization is used for modeling therelations between documents. There is a tight correlation between the informationformat, type of analysis the information requires, and the visualization design.
3 VisFacet FrameworkThe aim of this research was to enrich the discovery layer of the catalogue with aninteractive side-box that presents the facets of the search results graphically. Fig.1 presents the current textual view as provided by the VuFind package. The termfor the search in this example is the word “king.” The area above a set of resultspresents a list of Suggested Topics that were found in the records addressingthe term “king,” such as “history” and “kings and rulers.” The area on the rightprovides us with the facets—namely, the books taken from the left column filteredby a variety of subjects. For example, within the “Author” category we can see acluster that contains all the records (202) from the current set of search results thatappear to be written by William Shakespeare. Thus, the search system allows theuser to search from one search box and then narrow down the results by clickingon the various facets of the results.The VuFind information retrieval engine, as well as that of most modern librarycatalogues, uses the MARC records as the core for its search engine index schemaover the ILS core. MARC (MAchine-Readable Cataloging) is the de-facto stan-dard for the bibliographical records with metadata for each item (that is, book,journal, movie, and so on). The metadata are inserted as indexes in the VuFindinternal database, along with their associated metadata. Given a term to search,the catalogue’s search engine retrieves associated records from the search engine.At the same time, it retrieves a list of predefined facets (sometimes also called

Fig. 1. VuFind with VisFacet integrated.
clusters), each of which represents a logical conjunction of the current set of theresults filtered by several predefined fields. For example, the Topic field is repre-sented in the MARC records with the MARC code 650. If we choose to search forthe topic “history,” the results list will display the records where the topic field,represented by 6##, holds the value of a number of records that include the field6## with the word “history.” Choosing another subject like “second world war”will narrow the search, and all the resulting records that contain “history” but not“second world war” will be excluded from the current results list.
A visualized discovery box, which is intuitive, easy to interact with, and whichintegrates smoothly with web interfaces, is an essential addition to these evolv-ing software systems. However, current commercial companies and academic li-braries that develop tools for the customization of the discovery layer do not havethis capability. Thus, an additional aim of this research was to extend the com-plex, modern catalogue software package with visualization capabilities while re-taining its modularity and performance quality. Any visualization solution mustintegrate smoothly with the existing software architecture and be capable of usingthe retrieved information as any other other facet.

Our tool code was integrated into the VuFind open source system so that the Vis-Facet box is added to the user interface of the catalogue below the right facetssection of the SERP (Fig. 1). The location can be changed to above the facets,should the system administrator wish to configure it that way. Section 3.1 de-scribes the targets we addressed in the graphical design of VisFacet. In section3.2 we describe VisFacet’s modules and how they were integrated into VuFind.
Fig. 2. Enlarged view of Visfacet. The suggested topic “History” for the searched term “King” appears in the middle. The“History” topic occurs in the metadata topic field 4915 times.
3.1 Visual DesignIn the example presented in Fig. 2, the topic node that appears in the center of thestar-like graph is “History,” a topic suggested by the system because it appearsin the largest number of items that came up in a search for the keyword “king.”The rest of the topic nodes (in green), each representing a cluster of results, areconnected to it in descending order in a spiral form according to their grading. Erain orange and Region in blue are two additional facets of our visualization. Thecolor of each facet appears in the legend at the bottom. All the colors (includingbackground) and sizes are configurable and adjustable. To save space, only thefirst word in a term appears near the nodes in the graph. When a user selects anode (by brushing the mouse over it) the full topic of the current node appearsbelow the graph.Any click on one of the nodes in the graph will narrow (assuming the toggleat the top is on the Narrow position) the current search results list according tothe specific Topic, Era, or Region that was clicked. For example, clicking on the“France” Region facet will drop all records that do not contain France as their re-gion. The Narrow toggle that appears at the top of the box is on by default, whilethe Discovery toggle is dimmed. Clicking on any of the nodes when Discover ison will trigger a completely new query with the clicked topic as a keyword. Sinceall of those topics were retrieved from the search engine index, this “Discover”function will never lead to an empty results set. The graph is redrawn with each

search operation, whether text or graphic. Readers of this paper are welcome totry it at http://hufind.huji.ac.il/.The visualization of the suggested topics and the facets should help the end userdiscover a subtopic to focus on from a wide-area topic. To address this require-ment we have applied several dimensions to the two-dimensional layout of theinfographic box as follows:
1. Link-Node form: A star-like graph where the topics are connected with anexplicit link to the center that intuitively highlights the relation between thetopics.
2. Spiral form and order: Another dimension of connectivity arises from thefact that we have arranged all the topics in a spiral form, according to theirfrequency. For example, the topic History that occurs 4915 times in the re-sulting items appears in the middle of Fig. 2. It is closely connected with thekings and rulers node that occurs 2905 times in the resulting items. The othernodes appear in the spiral according to the number of occurrences that can beseen in the “Suggested Topics” box on the top of Fig. 1. The benefit of usinga spiral form is that it spreads the topics evenly across any stretched box tooptimize space usage as well as implicitly isolate the terms. Moreover, usersgain a sense of the importance of the topics through their closeness to thecenter and thus may navigate between them using the spiral route.To draw the spiral, we redesigned Vogel’s formulation [15] of Fermat’s Spi-ral [16] to fit our needs. The graphical objects are drawn within a canvaswith predefined width and length. For each object in the list, the algorithmcalculates its polar coordinates, which are composed of the angle and radiusrelative to the center of the graph.
3. Colors are used to distinguish among the categories, such as Era and Region.
Fig. 3. VuFind with VisFacet integrated.
3.2 System Design and ImplementationIncorporating a visualization tool into the VuFind system, which is a generic en-gine for building and customizing library catalogues, is a natural evolvement. TheVuFind system has complicated software engineering and many code lines. Eachpart of the system is implemented in a different programming language that isbest suited for its particular feature. Hence, the architecture and programminglanguages of VisFacet were selected and designed in terms of code coherencyand performance. The VuFind architecture, shown on the left side of Fig. 3, con-sists of an application core and two main layers. The data layer contains a searchengine index that can be distributed among several machines, or even different
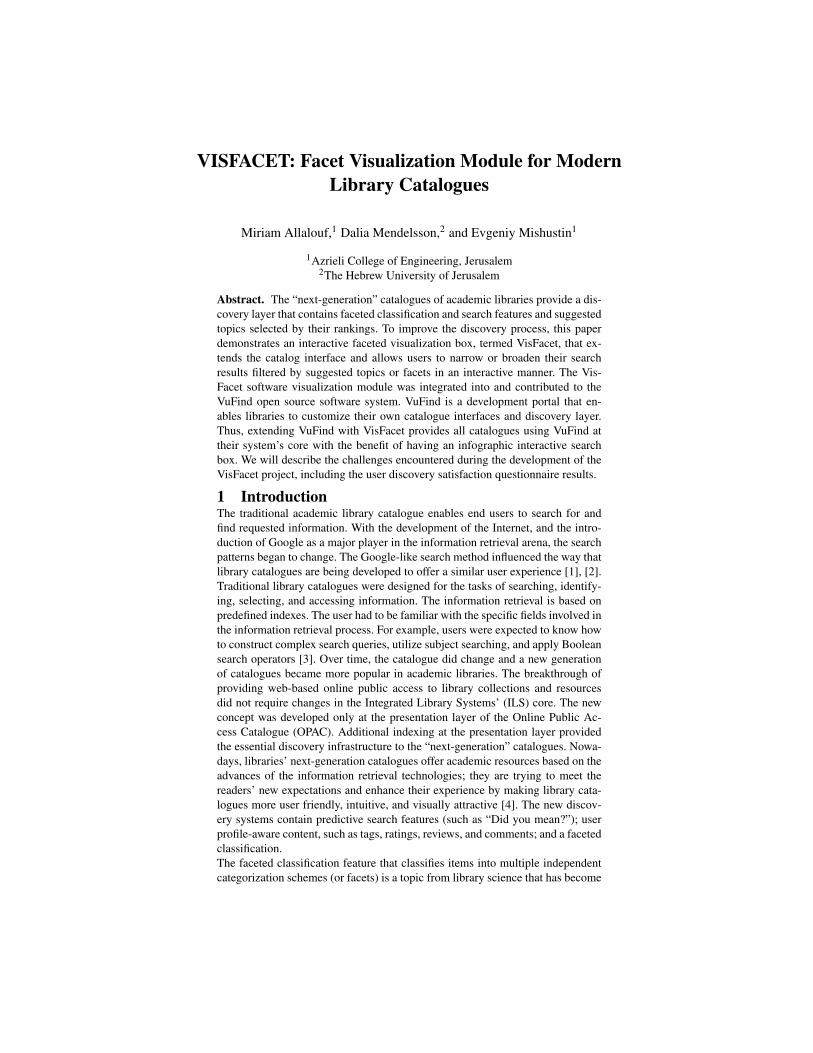
Q1 Text Search: Does the Region facet helped to focus on a location?Answer options: 1. very helpful 2. gave ideas 3. little help 4. no helpThe rates for the answers are 3, 2, 1, 0 respectively
Q2 Graphic Search: Does Suggested Topics help to discover a topic?Answer options: 1. very helpful 2. gave ideas 3. little help 4. no helpThe rates for the answers are 3, 2, 1, 0 respectively
Q3 Graphic Search: Does the Region Facet help to focus on a location?Answer options: 1. very helpful, 2. gave ideas, 3. little help 4. no helpThe rates for the answers are 3, 2, 1, 0 respectively
Q4 How many steps did it take to focus on a topic in each search type?Q5 Which search type better highlights the relationship between the Suggested
Topics in terms of their number of occurrences? Answer options: 1. Graphicis better than text 2. Text search is enough 3. The graphic search is goodonly when combined with Text search
Q6 Which discovery is best? 1. Text 2. Graphic 3. Combined search
Table 1. A questionnaire that was presented to both groups: librarians andstudents. Each question presented in this table is followed by the possible answers andthe rate for each option.
Fig. 4. Answers for questions 1-3 compared between the two groups. Each col-umn presents the average rate of the answers for Q1 (TextRegionScore), Q2 (Graphic-SuggTopScore) and Q3 (GraphicRegionScore). The flowers in the middle of each col-umn show the Q1, Q2, and Q3 standard deviations: 0.6, 0.94, and 0.91 for the students,and 0.53, 0.44, and 1.05 for the librarians.
libraries, and be updated daily. The application core that runs on the server sideand is responsible for bringing data from the data layer performs all the requiredprocessing and then passes it to the user interface layer. Finally, the user interfacelayer is responsible for arranging the data. The VisFacet visualization subsystemis divided into three main components, each incorporated into the appropriatelayer of the VuFind system, as can be seen in Fig. 3. The retrieval module, waswritten in PHP, retrieves the data from the search engine index. It obtains infor-mation about a user’s current search, performs its own internal processing, andthen returns all the required information needed to render suggestions. This in-formation is processed and organized for the visualization in the Glue UI modulethat runs in the browser on the client side and was written in Javascript. The GlueUI module binds its own functions to the visualization module and “listens” to in-teractions. The visualization module gets the organized data and translates it intothe visualization objects, which will be presented graphically in a web browser.We incorporated the Processing.js package (http://www.processingjs.org) that isused to create images, animations, and online interactions by using the visual pro-gramming language named Processing. It also converts the Processing code intoJavascript, thus allowing it to be run by any HTML5-compatible browser, includ-ing mobile browsers and current versions of Firefox, Safari, Chrome, Opera, andInternet Explorer. We implemented the visualization module including the spiralalgorithm, described in 3.1, in the Processing proprietary language. Behind thescenes, the Processing.js library compiles our code to pure JavaScript.
4 System Setup, User Study, and Evaluation ResultsThe VisFacet package was set up, integrated, and tested for two environmentalsystems: HUfind, which is a customized project based on VuFind, and VuFinditself. After it had passed HUJI library’s approval regarding the usage patternsand performance tests, it was added to the production version of HUfind in May2014. The site at http://hufind.huji.ac.il/ allows thousands of HUfind users to usea graphic search. Note that it is enabled only when using browsers other than In-ternet Explorer. To learn more about user satisfaction, we wrote a first-stage eval-uation questionnaire, which is described in this section. We designed the ques-tionnaire to measure the experiences of users wishing to discover a new researchtopic to focus on. The questionnaire was sent to two groups of users: (1) an un-dergraduate student group composed of 21 students, and (2) a group of librarianscomposed of 10 experienced librarians who are familiar with the HUfind cata-logue. The questionnaire itself consists of two search tasks: the Text search that
asks the user to search the suggested topics for the keyword journalists via theregular text interface and the Graphic search that requires the use of our info-graphic box. Each task requires the exploration of the Suggested Topics and theRegion facet in order to focus on a direction. The search experience is ques-tioned in each path with questions that appear in Table 1. The user is asked tocompare both experiences and determine whether she prefers one, the other, or acombination of the two.The columns in Fig. 4 present the average rate of the answers to Q1, Q2, and Q3,according to the group involved: librarians or students. On average, both groupspreferred the Text search over the Graphic search. The answers for the graphicevaluation were mainly gave some ideas or very little. The librarians, who areused to text searches, were more skeptical about the graphic visualization, whilethe students liked it more than the librarians. Some of them preferred the graphicvisualization, and therefore the standard deviation for their answers was higher.However, 16 students (76%) answered, in Q6, that they prefer having both typesof search. This shows that they are open to this direction but want an improveddisplay. We received the following two comments about VisFacet: (1) the searchis less user friendly because it requires brushing long words with the mouse tomake them fully visible, and (2) the importance of the order of nodes in the spiralform was not intuitively understood. We will relate to both problems in the nextversion. The number of steps taken by the student group in both types of searchwere very similar, 1.91 steps on average, with a standard deviation of 0.80-0.84.The number of steps taken by the librarians was 1.8 steps on average, which isslightly smaller than in the other group, and it was the same for both types ofsearch. Since the questionnaire is not a real discovery task, it is difficult to drawconclusions from this result. To gain greater benefit from VisFacet, we plan toprovide additional guidance for its use as well as monitor its use and find out howwe can improve it.
5 ConclusionWe have implemented a subsystem that adds an interactive visualized and facetedsearch to a modern catalogue. Because our subsystem is a new feature of VuFind,we have explored the existing system to understand its current state and find theappropriate solutions for our design. VisFacet is an initial suggestion for facetedvisualization that can be a real impetus for extending the visualization capabilitiesof modern library catalogues.
AcknowledgmentsWe thank Demian Katz, the founder and main developer of the VuFind system, for his ongoing help inenabling the smooth integration of VisFacet into VuFind. We also thank Edith Falk, the chief librarian ofthe Hebrew University for all her support in this project, and Eli Hayun, the programmer at the LibraryAuthority of HUJI for helping with the integration with HUfind. We thanks Nurit Baltiansky, MallyCohen, and Avi Allalouf for the discussions regarding the questionnaires.
References
[1] Emanuel, J.: Usability of the vufind next-generation online catalog. Infor-mation Technology and Libraries 30 (2011)
[2] Ramdeen, S., Hemminger, B.M.: A tale of two interfaces: How facets affectthe library catalog search. JASIST 63 (2012) 702–715
[3] Mercun, T., Zumer, M.: New generation of catalogues for the new generationof users: A comparison of six library catalogues. Program (2008)
[4] Tennant, R.: Lipstick on a pig. Library Journal 130 (2005)[5] Garfield, E.: A tribute to s.r. ranganathan, the father of indian library science.
Essays of an Information Scientist 7 (1984)[6] Mercun, T., Zumer, M.: Visualizing for explorations and discovery. In:
Libraries in the Digital Age. (2010) 104–115[7] Kaizer, J., Hodge, A.: Aquabrowser library: Search, discover, refine. Library
Hi Tech News (2005)[8] Shneiderman, B., Plaisant., C., Cohen, M., Jacobs, S. In: Designing the
User Interface: Strategies for Effective Human-Computer Interaction (5thEdition), Pearson Education (2014)
[9] Tergan, S.O., Keller, T. In: Knowledge and Information Visualization,Searching for Synergies. (2005)
[10] Thudt, A., Hinrichs, U., Carpendale, S.: The bohemian bookshelf: Support-ing serendipitous book discoveries through information visualization. In:Proceedings of the SIGCHI, ACM (2012)
[11] Clarkson, E., Desai, K., Foley, J.: Resultmaps: Visualization for searchinterfaces. IEEE Trans. on Visualization and Computer Graphics (2009)
[12] Smith, G., Czerwinski, M., Meyers, B., Robbins, D., Robertson, G., Tan,D.S.: Facetmap: A scalable search and browse visualization. IEEE Transac-tions on Visualization and Computer Graphics 15 (2006)
[13] Wei, F., Liu, S., Song, Y., Pan, S., Zhou, M.X., Qian, W., Shi, L., Tan, L.,Zhang, Q.: Tiara: A visual exploratory text analytic system. In: Proceedingsof the 16th ACM SIGKDD Conference, ACM (2010)
[14] Thai, V., Rouille, P.Y., Handschuh, S.: Visual abstraction and ordering infaceted browsing of text collections. ACM Trans. Intell. Syst. Techn. (2012)
[15] vogel h: A better way to construct the sunflower head. Mathematical Bio-sciences 44 (1979) 179–189
[16] spiral, F.: (http://en.wikipedia.org/wiki/fermat’s spiral)