viscosity water in clay systems1 - the clay … 8/8-1-170.pdf · viscosity of water in clay...
TRANSCRIPT
VISCOSITY O F WATER I N CLAY SYSTEMS1
by
PHILIP F. Low Agronomy Department, Purdue University, Lafayette, Indiana
ABSTRACT
A method was devised for obtaining the activation energy for the viscous flow of a fluid through a porous medium and the method was applied to the flow of wator through samples of Na-bentonite. The resulting activation energies were generally higher than the activation energy for the flow of pure water. The activation energy depended on the length of time the water was in contact with the clay and also on the particular sample. For any given sample, the water flow rate was negatively correlated with the activation energy, 51 accordance with theory.
To help interpret these results, data are presented on the tension of water in Na- bentonite suspensions at different intervals of time after stirring. The water tension was near zero immediately after stirring but increased gradually with time. Simultaneously the suspension gelled. Data also are presented on the specific volumes of water, the activation energies for ion movement, the diffusion coefficients of chloride salts and the unfrozen water at -5'C in Li-, Na- and K-bentonite. The activation energies for ion movement and the amounts of unfrozen water were positively correlated with the specific volumes of the water, whereas the diffusion coefficients of the chloride salts were negatively correlated with the specific volumes of the water. In each clay the specific volume of the water and the activation energy for ion movement were higher than those in normal water.
It is concluded that a water structure, which varies in extent with particle arrange- ment and the adsorbed cationic species, exists a t the surface of clay particles. This structure bestows a high viscosity to the adsorbed water.
INTRODUCTION Very little information is available on the viscosity of water in clay systems. That which is available has been obtained indirectly and requires much interpretation. Possibly the most direct information was provided by Rosenqvist (1955,1959), who measured the diffusion coefficients of deuterium oxide in clay systems a t different water contents. The diffusion coefficient in the pores of a water-saturated clay was only about 5 percent of that in pure water. The diffusion coefficients in the pores of clays containing 10 percent and 30 percent water corresponded to average water viscosities of 153 centipoises and 24 centipoises, respectively. To obtain the diffusion coeffi- cients of the deuterium oxide in the pores of the different clay systems, it was necessary to make assumptions relative to the geometry of the diffusion
1 Published as Journal Paper 1521, Purdue University Agricultural Experiment Station. Contribution from the Agronomy Department.
paths. Nevertheless, the results supported the conclusion that water has an unusually high viscosity in these systems. This conclusion was reached earlier by Macey (1942) who found that the conductivity of clays for nonpolar liquids was 104 to 106 times that for water. Even though clay packing would be different in nonpolar liquids than in water, it is doubtful that packing alone could account for the great differences in conductivity observed; the water viscosity must have been greater than that for pure water. Macey (1942) also found, as did Carman (1939), that none of the existing theories of water flow through porous media could be applied to clays without assuming that part of the water was immobile or had a high viscosity. And von Engelhardt and Tunn (1955) observed that the Darcy equation held for the flow of air, carbon tetrachloride and cyclohexane through sandstones containing clay, but not for water. They explained the invalidity of the Darcy equation for water by an interaction between the water and the clay which increased the viscosity of the water.
The authors cited above ascribed the apparent increase in viscosity near clay surfaces to interaction between these surfaces and the water. However, electroviscous effects (Elton and Hirschler, 1949) or counterelectro-osmotic effects (Michaels and Lin, 1955) might contribute to the viscosity increase. But i t is unlikely that these effects predominate (Henniker, 1952).
T H E O R Y The flow of fluids through porous media is described by Darcy's law, which
can be written Q = KAI. (1)
In this equation Q is the volume of fluid per unit time, K is the conductivity, A is the cross-sectional area and i is the pressure gradient. The equation can also be written
where k is the permeability, which depends on the geometry of the porous system, and 7 is the viscosity of the fluid.
For most fluids the relation between r ] , the viscosity, and T, the absolute temperature, is
r] = :B exp (b/T) (3) in which Band b are empirical constants. According to the theory of absolute reaction rates (Glasstone, Laidler and Eyring, 1941, pp. 477451),
and b = EIR.
Here, h is Planck's constant, N is Avogadro's number, V is the molar volume, AS* is the entropy of activation, R is the molar gas constant and E is the energy of activation. Alternatively, E may be regarded as the mutual potential energy of any two molecules a t the distance of closest approach (Andrade, 1934). We shall regard E as the energy of activation and consider it as being equal to the energy expended by a molecule in pushing back other molecules to form a hole and in breaking bonds with surrounding molecules so that it can move into t,he hole thus formed. Only those molecules with energy equal to or greater than the energy of activation are capable of movement. Hence, the jump of a moving molecule from one equilibrium position to the next may be regarded as equivalent to the passage of the molecule over a poten- tial energy barrier equal in magnitude to E.
Now let us combine (3) and (5) to give
If the right-hand aide of this equation is substituted for 7 in eq. (2) the result is
Taking the logarithm of both sides of (7), we have
Therefore, if the pressure gradient is kept constant, the energy of activation can be determined by plotting the logarithm of the flow rate against the reciprocal of the absolute temperature and determining the slope of the resulting line.
EXPERIMENTAL The Na-bentonite used in the viscosity study was the same as that
described in a previous paper (Low and Anderson, 1958). The other homo- ionic bentonites referred to in the discussion were prepared by the same procedure.
The viscosity apparatus is shown in Big. 1. A dry, powdered sample of clay is confined in the space A (diameter = 2.54 cm, height = 0.3 cm), between the stainless steel filters B and B'. A film of silica flour is glued to the walls of this cylinder with Armstrong's adhesive so that the clay, after wetting, will adhere to the walls. Filter B is set in a solid steel rim which is held securely between the shoulders of stainless steel cylinders C and C' when the cylinders ore screwed together. Teflon gaskets D and D' provide water- tight seals. Filter B' rests on the bottom of cylinder C'. These filters have a mean pore diameter of Bp. In the bottom of the cylinder are radial grooves leading to a central orifice which is connected by brass fittings and copper
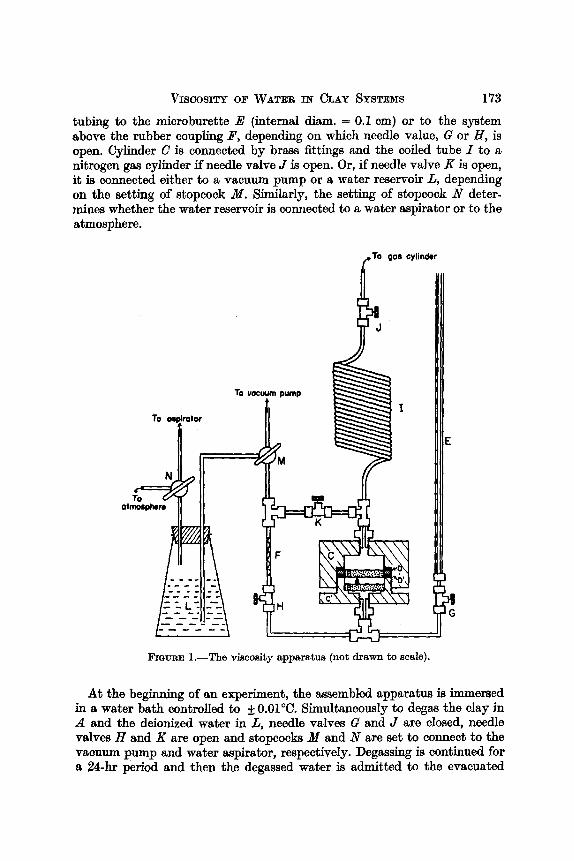
tubing to the microburette E (internal diam. = 0.1 cm) or to the system above the rubber coupling F, depending on which needle value, CJ or H, is open. Cylinder C is connected by brass fittings and the coiled tube 1 to a nitrogen gas cylinder if needle valve J is open. Or, if needle valve K is open, it is connected either to a vacuum pump or a water reservoir L, depending on the setting of stopcock M. Similarly, the setting of stopcock N deter- mines whether the water reservoir is connected to a water aspirator or to the atmosphere.
R G ~ E 1.-The viscosity apparatus (not drawn to scale).
At the beginning of an experiment, the assembled apparatus is immersed in a water bath controlled to 4 0.0l0C. Simultaneously to degas the clay in A and the deionized water in L, needle valves and J are closed, needle valves H and K are open and stopcocks M and N are set to connect to the vaouum pump and water aspirator, respectively. Degassing is continued for a 24-hr period and then the degassed water is admitted to the evacuated
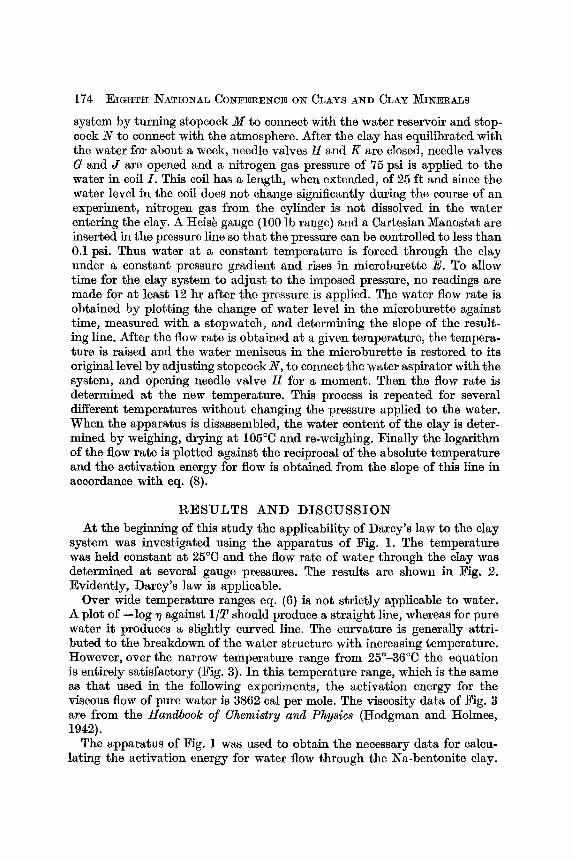
system by turning stopcock M to connect with the water reservoir and stop- cock N to connect with the atmosphere. After the clay has equilibrated with the water for about a week, needle valves H and K are closed, needle valves G and J are opened and a nitrogen gas pressure of 75 psi is applied to the water in coil I. This coil has a length, when extended, of 25 f t and since the water level in the coil does not change significantly during the course of an experiment, nitrogen gas from the cylinder is not dissolved in the water entering the clay. A Heisb gauge (100 lb range) and a Cartesian Manostat are inserted in the pressure line so that the pressure can be controlled to less than 0.1 psi. Thus water at a constant temperature is forced through the clay under a constant pressure gradient and rises in microburette E. To allow time for the clay system to adjust to the imposed pressure, no readings are made for a t least 12 hr after the pressure is applied. The water flow rate is obtained by plotting the change of water level in the microburette against time, measured with a stopwatch, and determining the slope of the result- ing line. After the flow rate is obtained a t a given temperature, the tempera- ture is raised and the water meniscus in the microburette is restored to its original level by adjusting stopcock N, to connect the water aspirator with the system, and opening needle valve H for a moment. Then the flow rate is determined a t the new temperature. This process is repeated for several different temperatures without changing the pressure applied to the water. When the apparatus is disassembled, the water content of the clay is deter- mined by weighing, drying a t 105OC and re-weighing. Finally the logarithm of the flow rate is plotted against the reciprocal of the absolute temperature and the activation energy for flow is obtained from the slope of this line in accordance with eq. (8).
RESULTS AND DISCUSSION At the beginning of this study the applicability of Darcy's law to the clay
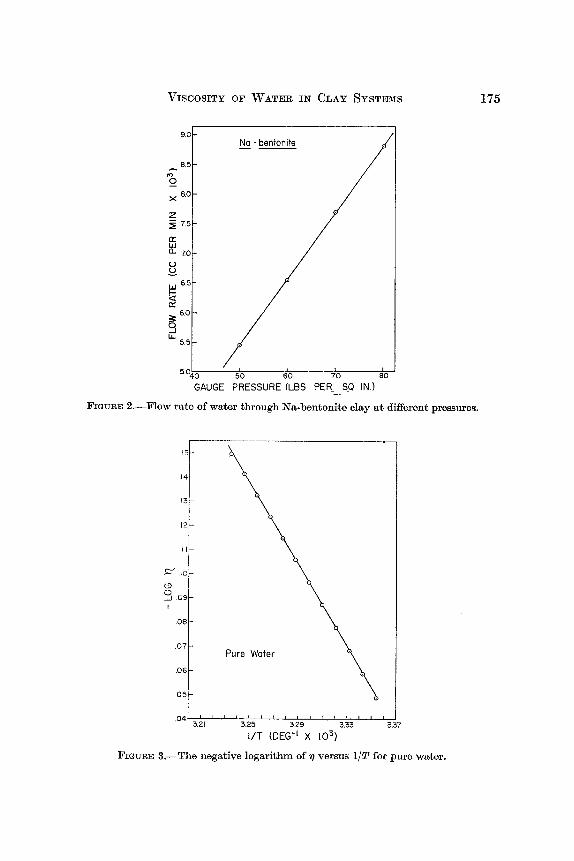
system was investigated using the apparatus of Big. 1. The temperature was held constant a t 25OC and the flow rate of water through the clay was determined a t several gauge pressures. The results are shown in Fig. 2. Evidently, Darcy's law is applicable.
Over wide temperature ranges eq. (6) is not strictly applicable to water. A plot of -log 7 against 1/T should produce a straight line, whereas for pure water it produces a slightly curved line. The curvature is generally attri- buted to the breakdown of the water structure with increasing temperature. However, over the narrow temperature range from 25'-36°C the equation is entirely satisfactory (Fig. 3). I n this temperature range, which is the same as that used in the following experiments, the activation energy for the viscous flow of pure water is 3862 cal per mole. The viscosity data of Fig. 3 are from the Handbook of Chemistry and Physics (Hodgman and Holmes, 1942).
The apparatus of Fig. 1 was used to obtain the necessary data for calcu- lating the activation energy for water flow through the ~a-bentonite clay.
GAUGE PRESSURE (LBS PER. S-Q IN.) -
F I ~ U R E 2.-Flow rate of water through Na-bentonite clay a t different pressurea.
FIGURE %-The negative logarithm of r ) versus 1/T for pure water.
Flow rates were obtained through each sample a t a gauge pressure of 75 psi and a t several temperatures within the range 25"-36°C. Then, in accordance with eq. (a), the logarithms of the flow rates were plotted against the recipro- cals of the corresponding absolute temperahres. Since common logarithms were used instead of natural logarithms, activation energies were obtained by multiplying the slopes of the lines by 2.303 R instead of R. Typical results are shown in Figs. 4, and 5.
,321 No- bentonite
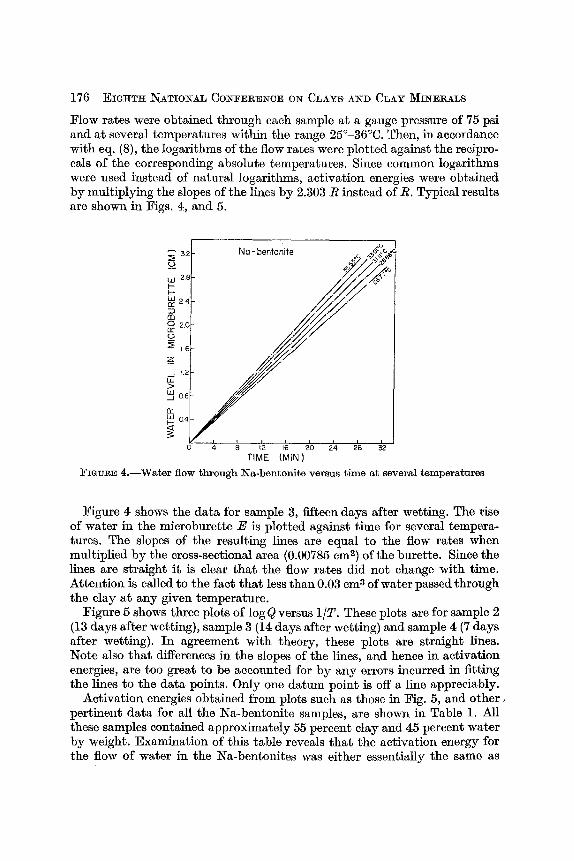
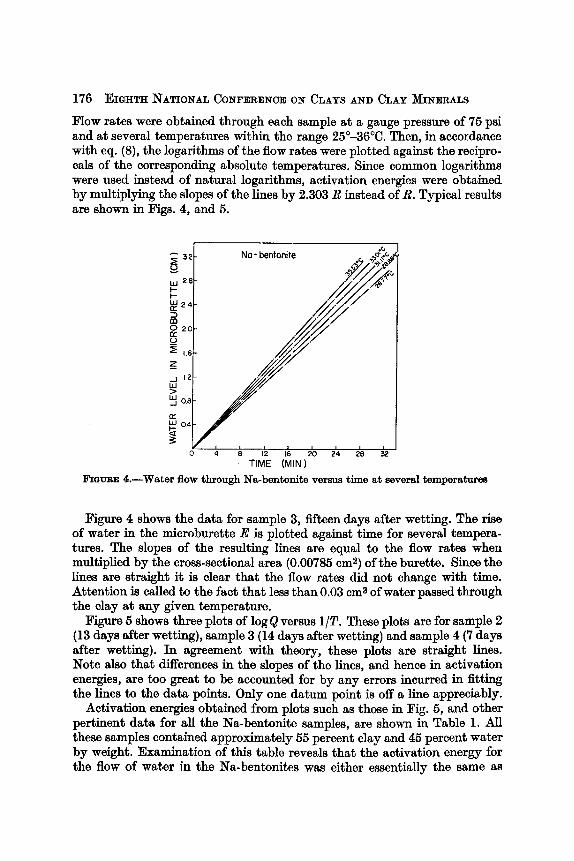
FIGURE 4.-Water flow through Na-bentonite versus time at several temperatures
Figure 4 shows the data for sample 3, fifteen days after wetting. The rise of water in the microburette E is plotted against time for several tempera- tures. The slopes of the resulting lines are equal to the flow rates when multiplied by the cross-sectional area (0.00785 cm2) of the burette. Since the lines are straight i t is clear that the flow rates did not change with time. Attention is called to the fact that less than 0.03 cm3 of water passed through the clay a t any given temperature.
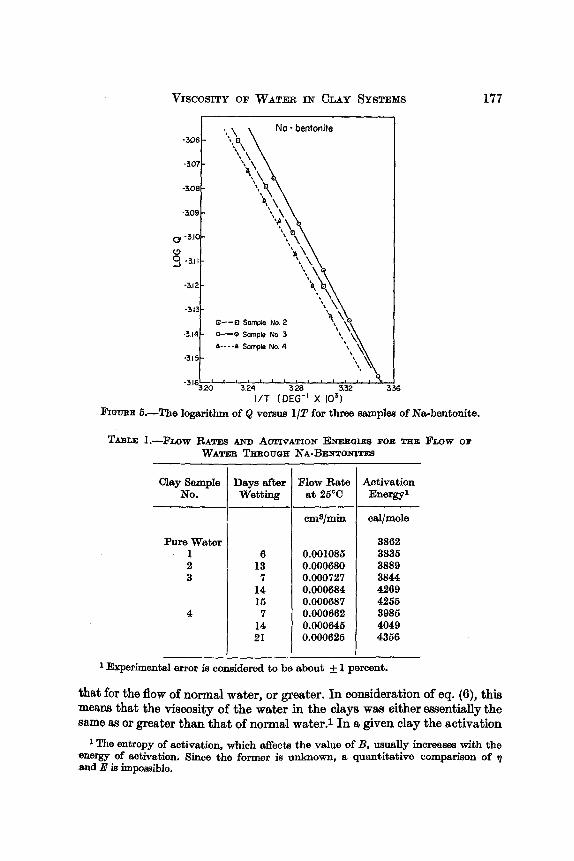
Figure 5 shows three plots of log Q versus 1IT. These plots are for sample 2 (13 days after wetting), sample 3 (14 days after wetting) and sample 4 (7 days after wetting). In agreement with theory, these plots are straight lines. Note also that differences in the slopes of the lines, and hence in activation energies, are too great to be accounted for by any errors incurred in fitting the lines to the data points. Only one datum point is off a line appreciably.
Activation energies obtained from plots such as those in Fig. 5, and other, pertinent data for all the Na-bentonite samples, are shown in Table 1. All these samples contained approximately 55 percent clay and 45 percent water by weight. Examination of this table reveals that the activation energy for the flow of water in the Na-bentonites was either essentially the same as
VISCOSITY OF WATER IN CLAY SYSTEMS
No - bentonite
-308 -
.309 -
-312-
-313-
0--0 Somple No 2 3 14 - 0-0 Sample No 3
A----A Somple No 4 -315-
*3'632d " 3 h ' ' ' ' ' I ' " '
3 28 332 336 IIT ( D E G - I x 10')
6.-The logarithm of Q versua 1/T for three samples of Na-bentonite.
TABLE: I.-FLOW RATES U D AOTIVATION ENERGIES BOB THE FLOW 03' W A T ~ THROUUE NA-BENTONITES
Experimental error is considered to be about + 1 percent.
Clay Sample No.
Pure Water 1 2 3
4
that for the flow of normal water, or greater. In consideration of eq. (6), this means that the viscosity of the water in the clays was either essentially the same as or greater than that of normal wwater.1 In a given clay the activation
The entropy of activation, which &ects the value of B, usually increases with the 8nergy of activation. Since the former is unknown, a quantitative comparison of r )
and 8 is impossible.
Activation Energy1
cd/mole
3862 3836 3889 3844 4269 4255 3986 4049 4366
Days after Wetting
6 13 7
14 16 7
14 21
Flow Rate at 25%
cma/min
0.001086 0.000680 0.000727 0.000684 0.000687 0.000662 0.000646 0.000626
Flow rates were obtained through each sample at a gauge pressure of 75 psi and at several temperatures within the range 25'-36°C. Then, in accordance with eq. (8), the logarithms of the flow rates were plotted against the recipro- cals of the corresponding absolute temperatures. Since common logarithms were used instead of natural logarithms, activation energies were obtained by multiplying the slopes of the lines by 2.303 R instead of R. Typical results are shown in Figs. 4, and 5.
TIME (MINI
Elana~ 4.-Water flow through Na-bentonite versus time at several temperatures
Figure 4 shows the data for sample 3, fifteen days after wetting. The rise of water in the microburette E is plotted against time for several tempera- tures. The slopes of the resulting lines are equal to the flow rates when multiplied by the cross-sectional area (0.00785 cm2) of the burette. Since the lines are straight it is clear that the flow rates did not change with time. Attention is called to the fact that less than 0.03 cms of water passed through the clay a t any given temperature.
Figure 5 shows three plots of log & versus 1/T. These plots are for sample 2 (13 days after wetting), sample 3 (14 days after wetting) and sample 4 (7 days after wetting). I . agreement with theory, these plots are straight lines. Note also that differences in the slopes of the lines, and hence in activation energies, are too great to be accounted for by any errors incurred in fitting the lines to the data points. Only one datum point is off a line appreciably.
Activation energies obtained from plots such as those in Fig. 5, and other pertinent data for dl the Na-bentonite samples, are shown in Table 1. All these samples contained approximately 55 percent clay and 45 percent water by weight. Examination of this table reveals that the activation energy for the flow of water in the Na-bentonites was either essentially the same as
Now, it can be shown (Low and Anderson, 1958a) that the measured water tension is related to the partial molar free energy of the water in the sus- pension by the equation
where P and FO are the partial molar free energy of the water in the sus- pension and manometer, respectively, 6 is the partial molar volume of water in the suspension and rr is the tension. Hence, the partial molar free energy of water in the suspension decreased with time after stirring. Since clay particles are parallel to the stream lines in a stirred suspension (Marshall,
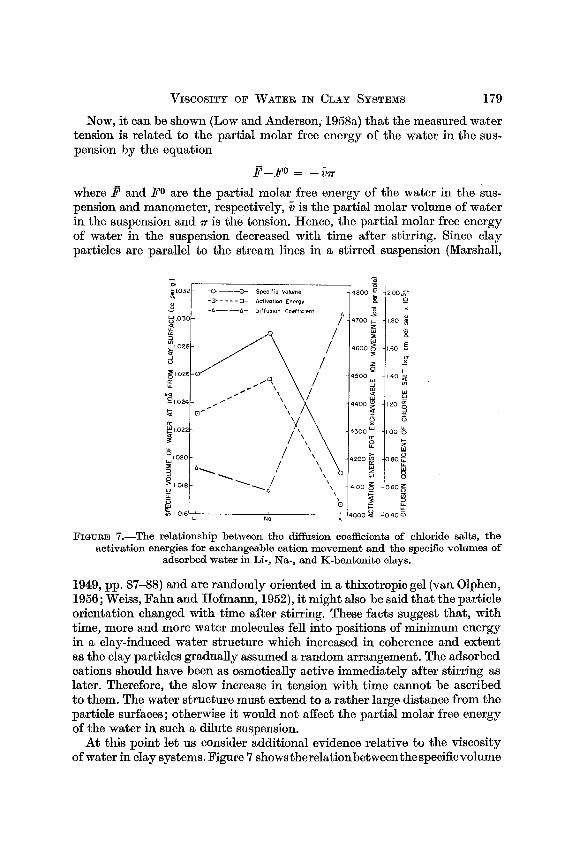
FIGURE 7.-The relationship between the diffusion coefficients of chloride salts, the activation energies for exchangeable cation movement and the specific volumes of
adsorbed water in Li-, Na-, and K-bentonite clays.
1949, pp. 87-88) and are randomly oriented in a thixotropic gel (van Olphen, 1956; Weiss, Fahn and Hofmann, 1952), it might also be said that the particle orientation changed with time after stirring. These facts suggest that, with time, more and more water molecules fell into positions of minimum energy in a clay-induced water structure which increased in coherence and extent as the clay particles gradually assumed a random arrangement. The adsorbed cations should have been as osmotically active immediately after stirring as later. Therefore, the slow increase in tension with time cannot be ascribed to them. The water structure must extend to a rather large distance from the particle surfaces; otherwise it would not affect the partial molar free energy of the water in such a dilute suspension.
At this point let us consider additional evidence relative to the viscosity of water in clay systems. Figure 7 showstherelationbetweenthespecificvolume
of the adsorbed water, the activation energy for movement of the exchange- able cation and the diffusion coefficient of-the corresponding chloride sal t in Li-, Na- and K-bentonite. The specific volume data are from Anderson and Low (1958), the activation energy data are from Low (1958) and the diffusion data are from Dutt (1959). Undoubtedly, the water structures differ in extent in the three clays because the specific volumes of the water are dif- ferent. All the specific volumes are greater than that of normal water. Recognizing that water would be close-packed and have a low specific volume if it were not for the organizing effect of intermolecular forces with specific orientations, i t is reasonable to postulate that an increase in specific volume corresponds to an increase in the organization and coherence of the water structure. Accordingly, the viscosity of the water should be greatest in the Na-bentonite, intermediate in the Li-bentonite and least in the K- bentonite. This postulate is supported by the fact that the ionic activation energies, which would increase with an increase in the resistance encountered by the ions in moving through their environment, are directly correlated with the specific volumes of the water. The activation energy for each ion is higher than that for the same ion in pure water. Further, the diffusion coefficients of the chloride salts, which would decrease with an increase in the resistance encountered by the ions in moving through their environment, are negatively correlated with the specific vo1;mes of the water. Hence, i t appears that the viscosity of water in clay systems plays an important role in the movement of ions in these systems.
More information on the effect of Li-, Na-, and K-bentonite on water has been obtained by J. H. Kolaian in our laboratory. He froze pastes of these clays, containing 65 percent water and 35 percent clay, to a temperature of -5.0°C and then plunged the frozen pastes into a calorimeter containing carbon tetrachloride a t room temperature. From the heat capacity of the calorimeter. the specific heats and masses of its contents. the latent heat of
L
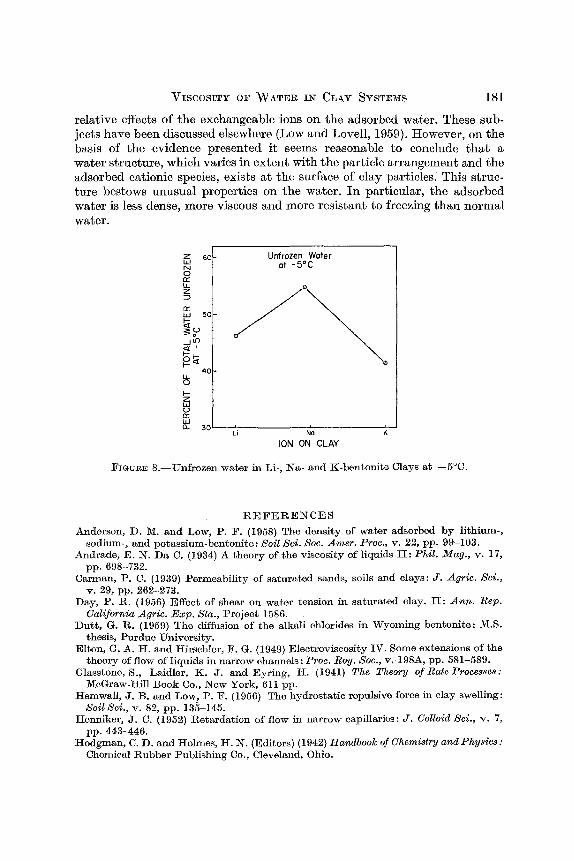
fusion of ice and the observed temperature change, he was able to calculate the unfrozen water. The unfrozen water in the different clays is shown in Fig. 8.
A striking fact about the results in Fig. 8 is that the effects of the three homoionic clays in preventing freezing are in the same relative order as their effects on other water properties. The exchange capacity of these clays was 0.9 meq per g. Therefore the exchangeable ion concentration of the unfrozen water in the clays was not nearly sufficient to prevent freezing a t -5.0°C. In view of this fact and the correspondence between the data in Figs. 7 and 8, i t is concluded that a water structure exists on these clays which resists rearrangement into ice. Such a water structure should have ahigher viscosity than normal water. And, because unfrozen water increases with swelling (Hemwall and Low, 1956) it can be assumed that the water of high viscosity becomes more extensive with increasing interparticle distance.
No consideration has been given in this paper to the nature of the clay- water interaction. Nor has any attention been devoted to the reasons for the
relative effects of the exchangeable ions on the adsorbed water. These sub- jects have been discussed elsewhere (Low and Lovell, 1959). However, on the basis of the evidence presented it seems reasonable to conclude that a water structure, which varies in extent with the particle arrangement and the adsorbed cationic species, exists at the surface of clay particles. This struc- ture bestows unusual properties on the water. I n particular, the adsorbed water is less dense, more viscous and more resistant to freezing than normal water.
ION ON CLAY
FIGURE 8.-Unfrozen water in Li-, Na- and K-bentonite Clays at -5'C.
R E F E R E N C E S
Anderson, D. M. and Low, P. F. (1958) The density of water adsorbed by lithium-, sodium-, and potassium-bentonite: Soil Sci. Soc. Amer. Proc., v. 22, pp. 99-103.
Andrade, E. N. Da C. (1934) A theory of the viscosity of liquids 11: Phil. Mag., v. 17, pp. 698-732.
Carman, P. C. (1939) Permeability of saturated sands, soils and clays: S. Agric. Sci., V. 29, pp. 262-273.
Day, P. R. (1956) Effect of shear on water tension in satnratsd clay. 11: Ann. Rep. Calqornia Agric. Exp. Sta., Project 1586.
Dutt, G. R. (1959) The diffusion of the alkali chlorides in Wyoming bentonite: M.S. thesis, Purdue University.
Elton, G. A. H. and Hirschler, F. G. (1949) Electroviscosity IV. Some extensions of the theory of flow of liquids in narrow channels: Proc. Roy. SOL, V. 198A, pp. 581-589.
Glasstone, S., Laidler, K. J. and Eyring, H. (1941) The Theory of RateProcesses: McGraw-Hill Roolc Co., New York, 611 pp.
Hemwall, J. B. and Low, P. P. (1956) The hydrostatic repulsive force in clay swelling: Soil Sci., v. 82, pp. 135-145.
Henniker, J. C. (1952) Retardation of flow in narrow capillaries: J. Colloid Sci., v. 7, pp. 443-446.
Hodgman, C. D. and Holmes, H. N. (Editors) (1942) Handbook of Chemistry and Physics: Chemical Rubber Publishing Co., Cleveland, Ohio.
Low, P. F. (1958) The apparent mobilities of exchangeable alkali metal cations in bentonite-water systems: Soil Sci. Soc. Amer. Proc., v. 22, pp. 395-398.
Low, P. F. and Anderson, D. M. (1958) The partial specific volume of water in bentonite suspensions: Soil Sci. Soc. Amer. Proc., v. 22, pp. 22-24.
Low, P. F. and Anderson, D. M. (1958a) Osmotic pressure equations for determining thermodynamic properties of soil water: Soil Sci., v. 86, pp. 251-253.
Low, P. F. and Lovell, C. W. (1959) The factor of moisture in frost action: in Highway Research Board Bulletin 225, Natl. Acad. Sci.-Natl. Res. Council Pub., in press.
Macey, H. H. (1942) Clay-water relationships and the internal mechanism of drying: Trans. Ceram. Soc., v. 41, pp. 73-121.
Marshall, C. E . (1949) The Colloid Chemistry of the Silicate Minerals: Academic Press Inc., New York, 195 pp.
Michaels, A. S. and Lin, C. S. (1955) Effects of counterelectro-osmosis and sodium ion exchange on permeability of kaolinite: Industr. Engng. Chem., v. 47, pp. 1249-1253.
Rosenqvist, I. Th. (1955) Investigations in the clay-electrolyte-water system: Norwe- gian Gfeotechnical Institute, Pub. 9.
Rosenqvist, I. Th. (1959) Physico-chemical properties of soils : soil water systems : J. Soil Mechanics and Foundations Division, Amer. Soc. Civil Eng., v. 85, no. SM2, pp. 31-53.
van Olphen, H. (1956) Forces between suspended bentonite particles: in Clays and Clay Minerals, Natl. Acad. Sci.-Natl. Res. Council pub. 456, pp. 204-224.
Von Engelhardt, W. and Tunn, W. L. M. (Translated by Witherspoon, P. A.) (1955) The flow of fluids through sandstones : Illinois State Geol. Survey, Circular 194, pp. 1-16.
Weiss, Armin, Fahn, R. and Hofmann, U. (1952) Nachweis der Geriiststruktur in thixo- tropen Gelen: Naturwiss., v. 39, pp. 351-352.