viscose production - impact from alkaliresistance and ...525277/fulltext01.pdfviscose production –...
TRANSCRIPT

Viscose production – impact from alkali resistance (R18) and hemicellulose content in dissolving cellulose on the processability and quality of viscose
Sara Hellström
Degree Project in Engineering Chemistry, 30 hp Report passed: March 2012 Supervisors: Maria Wallenius, Domsjö Fabriker AB Solomon Tesfalidet, Umeå University

I
Abstract
In this study the influence of variations in alkali resistance (R18) of cellulose on the quality of the viscose product in terms of carbohydrate content have been examined. The dissolution pattern of hemicellulose in the first steps of the viscose process with different running parameters has been determined. Furthermore the correlation between R18 and hemicellulose content has been studied. Mercerization and pressing was performed in a viscose micro plant at MoRe Research with varying process settings using samples with different R18 and known carbohydrate content. The carbohydrate content was thereafter determined in both the deducted lye and in the alkali cellulose in order to study the dissolution pattern of hemicellulose. A comparison was made in terms of carbohydrate content between speciality celluloses with varying R18 for determining the correlation between the variables. The study showed a clear influence from R18 on the amount of hemicellulose continuing in the viscose process after the pressing. Variations in NaOH-concentration in the mercerization and the press factor in pressing have also a significant effect on the dissolution of hemicellulose while the temperature in mercerization did not have a distinguishable impact. Finally the study also indicated a linear relationship between R18 and the hemicellulose content in speciality cellulose from Domsjö Fabriker.
II
Sammanfattning (Abstract in Swedish)
I denna studie har effekter från variationer i alkaliresistans (R18) i cellulosa på kvalitet på viskosprodukten i form av kolhydratinnehåll undersökts. Upplösningsmönstret hos hemicellulosa under de första stegen i viskosprocessen vid olika processparametrar har bestämts. Dessutom har korrelationen mellan alkaliresistans och hemicellulosainnehåll studerats. Mercerisering och pressning utfördes i en viskospilot på MoRe Research med olika processinställningar och med prov med varierande R18 samt känt kolhydratinnehåll. Kolhydratinnehållet bestämdes sedan i både den avdragna luten samt i alkalicelluosan för att studera upplösningsmönstret för hemicellulosan. En jämförelse med avseende på kolhydratinnehåll mellan specialcellulosor med varierande R18-värden gjordes för att bestämma korrelationen mellan dessa variabler. Studien visade på en tydlig inverkan från R18 på mängden hemicellulosa som fortsätter vidare i viskosprocessen efter pressningen. Variationer i NaOH-koncentrationen i merceriseringen och pressfaktorn vid pressningen visade sig också ha en signifikant effekt på upplösningen av hemicellulosa, medan temperaturen i merceriseringen inte har någon märkbar inverkan. Slutligen visade studien också på ett linjärt samband mellan R18 och hemicellulosahalten i specialcellulosa från Domsjö Fabriker.
III
Abbreviations
R18: The alkali resistance of cellulose in 18 % NaOH.
R10: The alkali resistance of cellulose in 10 % NaOH. S18: The alkali solubility of cellulose in 18 % NaOH. S10: The alkali solubility of cellulose in 10 % NaOH. Cellulose I: Naturally existing cellulose. Cellulose II: Synthetically formed cellulose. α-cellulose: Pure cellulose which can not be dissolved in a concentrated sodium
hydroxide solution. β-cellulose: Carbohydrates, sugars and short cellulose chains which can be
dissolved in a concentrated sodium hydroxide solution and then be regenerated in an acidic environment.
γ-cellulose: Components which are dissolved in a concentrated sodium hydroxide
solution but neither regenerate in acidic, nor in alkali conditions. Mainly consists of highly degraded hemicellulose in terms of monosaccharides such as mannose or xylose.
Barking: The removal of bark from wood. Spent cooking liquor: The chemicals that are left after digestion of wood chips. Green liqueur: Dissolved rest chemicals from digestion after removal of water and
burnable compounds. Lye: Sodium Hydroxide, NaOH. Press factor: A measure of the cellulose and caustic content in the pulp after the
pressing step in the viscose process. The press factor is calculated by dividing the weight of the cake after pressing with the weight of the original dry cellulose.
DOE: Design of Experiments MLR: Multiple Linear Regressions MVA: Multivariate data Analysis PLS: Partial least squares projections to latent structures
IV
Table of content Abstract .................................................................................................................................................................... I Sammanfattning (Abstract in Swedish)...................................................................................................................II Abbreviations ........................................................................................................................................................ III Table of content .................................................................................................................................................... IV 1. Introduction ...............................................................................................................................................- 1 -
1.1. Domsjö Fabriker AB........................................................................................................................- 1 - 1.2. Background ......................................................................................................................................- 1 - 1.3. Aim ..................................................................................................................................................- 2 - 1.4. Limitations .......................................................................................................................................- 2 - 1.5. How to solve the problem ................................................................................................................- 2 -
2. Theory .......................................................................................................................................................- 3 - 2.1. Cellulose ..........................................................................................................................................- 3 - 2.2. Hemicellulose ..................................................................................................................................- 4 - 2.3. Lignin...............................................................................................................................................- 5 - 2.4. The sulfite process ...........................................................................................................................- 5 - 2.5. The viscose process..........................................................................................................................- 7 -
2.5.1. Mercerization..........................................................................................................................- 7 - 2.5.2. Pressing ..................................................................................................................................- 7 - 2.5.3. Shredding................................................................................................................................- 7 - 2.5.4. Aging......................................................................................................................................- 7 - 2.5.5. Xanthation ..............................................................................................................................- 7 - 2.5.6. Dissolving...............................................................................................................................- 7 - 2.5.7. Ripening .................................................................................................................................- 7 - 2.5.8. Filtering ..................................................................................................................................- 8 - 2.5.9. Spinning..................................................................................................................................- 8 - 2.5.10. Stretching................................................................................................................................- 8 -
2.6. R10 and R18 ....................................................................................................................................- 8 - 2.7. Viscose Micro Plant, MoRe Research..............................................................................................- 9 - 2.8. Design of Experiments...................................................................................................................- 11 - 2.9. Multivariate data Analysis .............................................................................................................- 11 -
3. Material and methods ..............................................................................................................................- 12 - 3.1. The Project Process........................................................................................................................- 12 -
3.1.1. Repeatability.........................................................................................................................- 12 - 3.1.2. Correlation between R10, R18 and carbohydrate content ....................................................- 12 - 3.1.3. Determination of hemicellulose content ...............................................................................- 12 -
3.2. Design of Experiments...................................................................................................................- 13 - 3.3. Selection of samples.......................................................................................................................- 14 - 3.4. R18 and R10 ..................................................................................................................................- 17 - 3.5. Carbohydrate analysis ....................................................................................................................- 18 - 3.6. Calculations of carbohydrate content.............................................................................................- 18 - 3.7. Viscose Micro Plant, MoRe Research............................................................................................- 20 - 3.8. Multivariate data Analysis .............................................................................................................- 20 -
4. Results and discussion.............................................................................................................................- 20 - 4.1. Determination of hemicellulose content ........................................................................................- 20 - 4.2. Results from data analysis in MODDE and SIMCA......................................................................- 22 - 4.3. Repeatability ..................................................................................................................................- 27 - 4.4. Correlation between R10, R18 and hemicellulose content ............................................................- 28 -
5. Conclusions .............................................................................................................................................- 31 - 6. Complementary work ..............................................................................................................................- 32 - 7. Future work .............................................................................................................................................- 32 - 8. Acknowledgements .................................................................................................................................- 33 - References.........................................................................................................................................................- 34 - Appendix I ..............................................................................................................................................................A Appendix II .............................................................................................................................................................G


- 1 -
1. Introduction
1.1. Domsjö Fabriker AB The biorefinery Domsjö Fabriker AB in Örnsköldsvik is today one of many companies within the Aditya Birla Group, an Indian multinational group with companies in 28 different countries and with revenue of $ 35 billion. The group is the largest producer of viscose staple fibre with four cellulose mills and six viscose mills. The main products at Domsjö Fabriker are specialty cellulose, ethanol and lignosulfonate. As part of the biorefinery concept, that is to make use of all components in the tree and turn them into valuable products, the company also produces biogas, carbonic acid and bio energy as steam and resin from rest products in the main process. Specialty cellulose are used as thickening agent in food and paints, sausage casings, as filler in medical tablets but most of all in fashion and textile industry where specialty cellulose are the raw material for producing viscose [2].
1.2. Background The qualities of dissolving cellulose are important for the yield, but also for other properties of the final product when producing viscose. One quality parameter that the viscose manufacturers show great concern about is R18, which is the alkali resistance in 18 % NaOH, since the first step in the viscose process is an alkalisation of the cellulose. R18 is an important quality parameter since mainly hemicellulose is dissolved in 18 % alkali, and consequently the alkali resistance is considered within the business to be an indirect measurement of the hemicellulose content. Hemicellulose creates problem in the aging step in the viscose process when cellulose should be degraded by an oxidation with oxygen from the air. The hemicellulose is consuming oxygen when included in this step and thereby reduces the degradation of the cellulose molecules. Hemicellulose also deteriorates the strength of the final viscose product and thus reduces the quality, and can also cause discolouration in the final product. Low hemicellulose content instead reduces the yield. [21] This is why a controlled amount of hemicellulose is considered crucial in the viscose process. To be able to find an acceptable level the dissolution pattern of hemicellulose during different running parameters in the first steps of the viscose process needs to be examined. The study will reveal weather the incoming hemicellulose amount needs to be low to get a low hemicellulose content in the final viscose product, or if other process parameters in the first steps of the viscose process could be regulated in order to receive a lower amount of hemicellulose continuing in the process. Hemicellulose is partly removed in the dissolving process during the alkalisation in the bleaching step. Therefore hemicellulose content in the pulp is also a financial matter, since a large cost in the dissolving process comes from the NaOH used for this alkalisation. By showing that hemicellulose can be removed in the viscose process instead of in the dissolving process, Domsjö Fabriker could also reduce their costs in the manufacture of the cellulose by lowering the amounts NaOH used in the process [3]. A study performed by Anne-Christine Byström at MoRe Research did show that a removal of large amounts of hemicellulose in the alkalisation step during bleaching at
- 2 -
Domsjö Fabriker causes dissolution and removal of large amounts of cellulose as well. Consequently the removal of hemicellulose in the sulfite process affects the yield [34]. This is due to the fact that for most cellulose pulps mainly hemicellulose dissolve in 18 % NaOH while cellulose remains undissolved, but in cellulose pulps with low degree of polymerization, such as Domsjö Fabriker’s, cellulose with low molecular weight also dissolves [4]. A previous study made by K. Fischer and I. Schmidt indicated that hemicellulose and low molecular weight cellulose nearly equally influence the alkali solubility of the pulp [5]. Because of this, the correlation between R18 and hemicellulose content is not obvious, and therefore needs to be investigated.
1.3. Aim The main purpose of this master thesis was to reveal how variations in R18 influence the quality of the viscose product in terms of carbohydrate content. Another task was to determine the correlation between alkali resistance and hemicellulose content and to find out which carbohydrates that are dissolved and not dissolved during the first steps of the viscose process with different running parameters.
1.4. Limitations A restricted budget and the time limit are the main limitations for what could be accomplished in this project. The number of experiments performed were narrowed to be sufficient enough for extracting desired information from the results, but to be as few as possible to minimize the costs and to be contained within the time limit. The study is focused only on mercerization and pressing in the viscose process, as well as examining the influence of a restricted number of chosen factors. No optimization of the influential factors found in this study was made and the only response investigated was the carbohydrate content.
1.5. How to solve the problem Three samples with varying R18 were chosen. The first two steps in the process, mercerization and pressing, was performed using these three samples. The analyses were run with varying process settings, such as NaOH-concentration, temperature and pressing following a design. After the run the carbohydrate content in both the deducted lye and in the alkali cellulose was analysed. The dissolution pattern of the carbohydrate content was studied by comparing the carbohydrate content for the different settings as well as contents obtained before and after the first steps in the process. The correlation between the alkali resistance and carbohydrate content was examined by comparing the carbohydrate content in samples having the same quality and the same R18 value. The three samples with varying R18 used in the viscose micro plant were also analysed with respect to the carbohydrate content and included in the comparison.
- 3 -
2. Theory
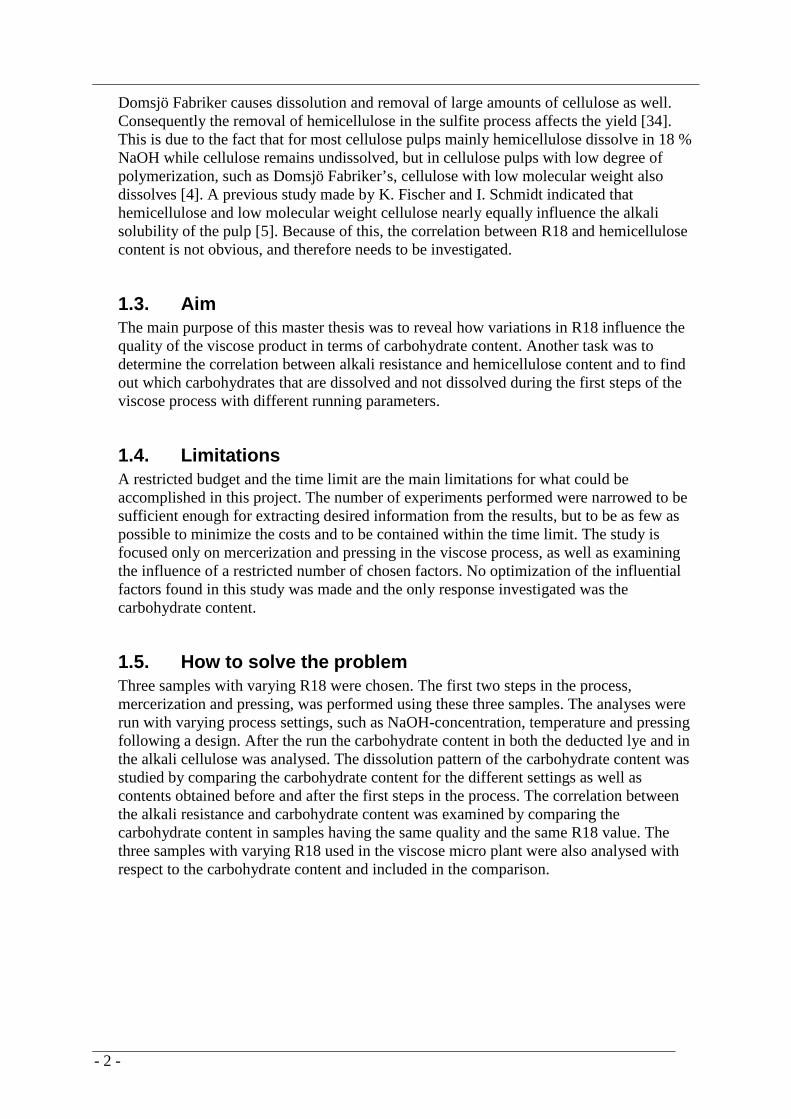
2.1. Cellulose Cellulose is the main component in wood. The raw material used at Domsjö Fabriker is pine and spruce representing softwood which contains approximately 42 % cellulose, 28 % hemicellulose, 27 % lignin and also some extractives [1]. Cellulose is a homopolysaccharide, a polymer composed by glucose units which are linked to long, linear chains were every other glucose unit is reversed 180 ° with respect to its neighbours (see figure 1). Each anhydroglucose unit in the cellulose chain has three hydroxyl groups, two secondary, located at carbon 2 and 3, which are more reactive than the primary and more thermodynamically stable carbon 6. These hydroxyl groups are participating in the derivatization of cellulose. The molecule can easily form intra and intermolecular hydrogen bonds and therefore aggregates with other cellulose molecules into microfibrils. Microfibrils aggregates and form fibrils which in their turn form cellulose fibres through hydrogen bonds. [6] Cellulose is normally insoluble in water and several organic solvents because of its polarity and hydrophobic interactions due to the amphiphilic nature of the molecule. The solubility of the molecule can hence be increased by using surface active additives which weaken the hydrophobic interactions within the cellulose molecule. [7]
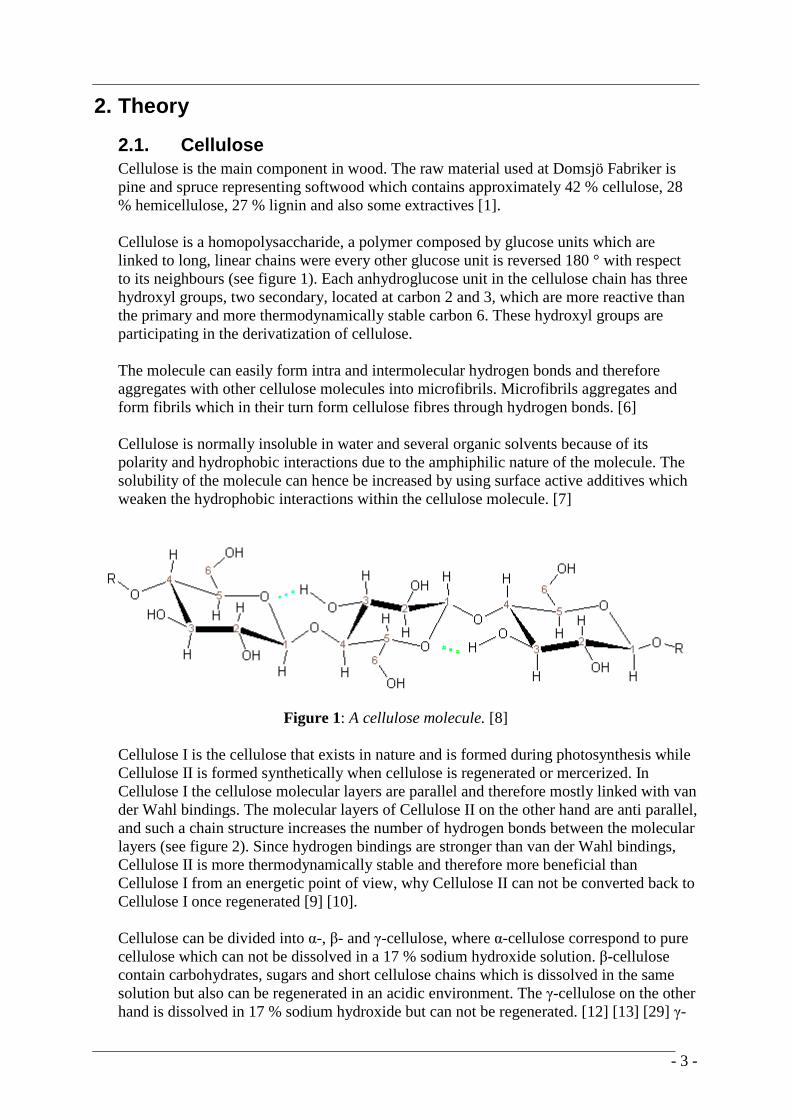
Figure 1: A cellulose molecule. [8] Cellulose I is the cellulose that exists in nature and is formed during photosynthesis while Cellulose II is formed synthetically when cellulose is regenerated or mercerized. In Cellulose I the cellulose molecular layers are parallel and therefore mostly linked with van der Wahl bindings. The molecular layers of Cellulose II on the other hand are anti parallel, and such a chain structure increases the number of hydrogen bonds between the molecular layers (see figure 2). Since hydrogen bindings are stronger than van der Wahl bindings, Cellulose II is more thermodynamically stable and therefore more beneficial than Cellulose I from an energetic point of view, why Cellulose II can not be converted back to Cellulose I once regenerated [9] [10]. Cellulose can be divided into α-, β- and γ-cellulose, where α-cellulose correspond to pure cellulose which can not be dissolved in a 17 % sodium hydroxide solution. β-cellulose contain carbohydrates, sugars and short cellulose chains which is dissolved in the same solution but also can be regenerated in an acidic environment. The γ-cellulose on the other hand is dissolved in 17 % sodium hydroxide but can not be regenerated. [12] [13] [29] γ-
- 4 -
cellulose mainly consists of highly degraded hemicellulose in terms of monosaccharides such as mannose or xylose [21].
Figure 2: Picture of Cellulose I (to the left) and Cellulose II (to the right). [11]
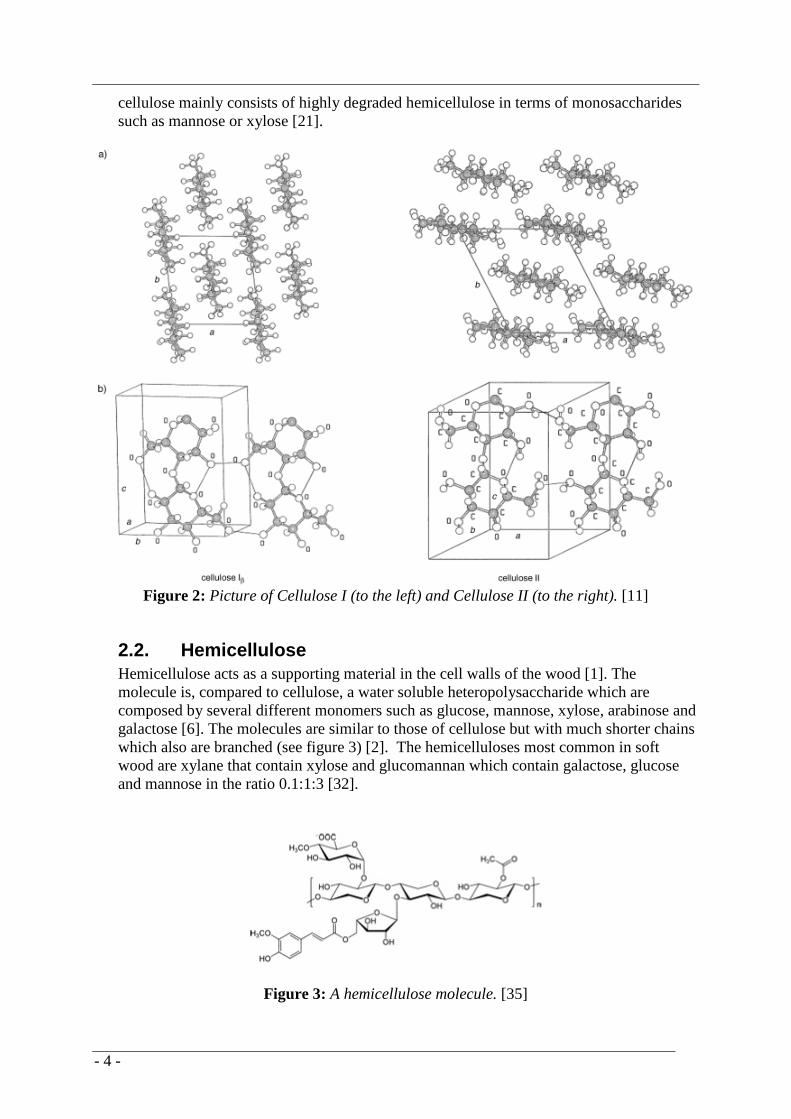
2.2. Hemicellulose Hemicellulose acts as a supporting material in the cell walls of the wood [1]. The molecule is, compared to cellulose, a water soluble heteropolysaccharide which are composed by several different monomers such as glucose, mannose, xylose, arabinose and galactose [6]. The molecules are similar to those of cellulose but with much shorter chains which also are branched (see figure 3) [2]. The hemicelluloses most common in soft wood are xylane that contain xylose and glucomannan which contain galactose, glucose and mannose in the ratio 0.1:1:3 [32].
Figure 3: A hemicellulose molecule. [35]
- 5 -
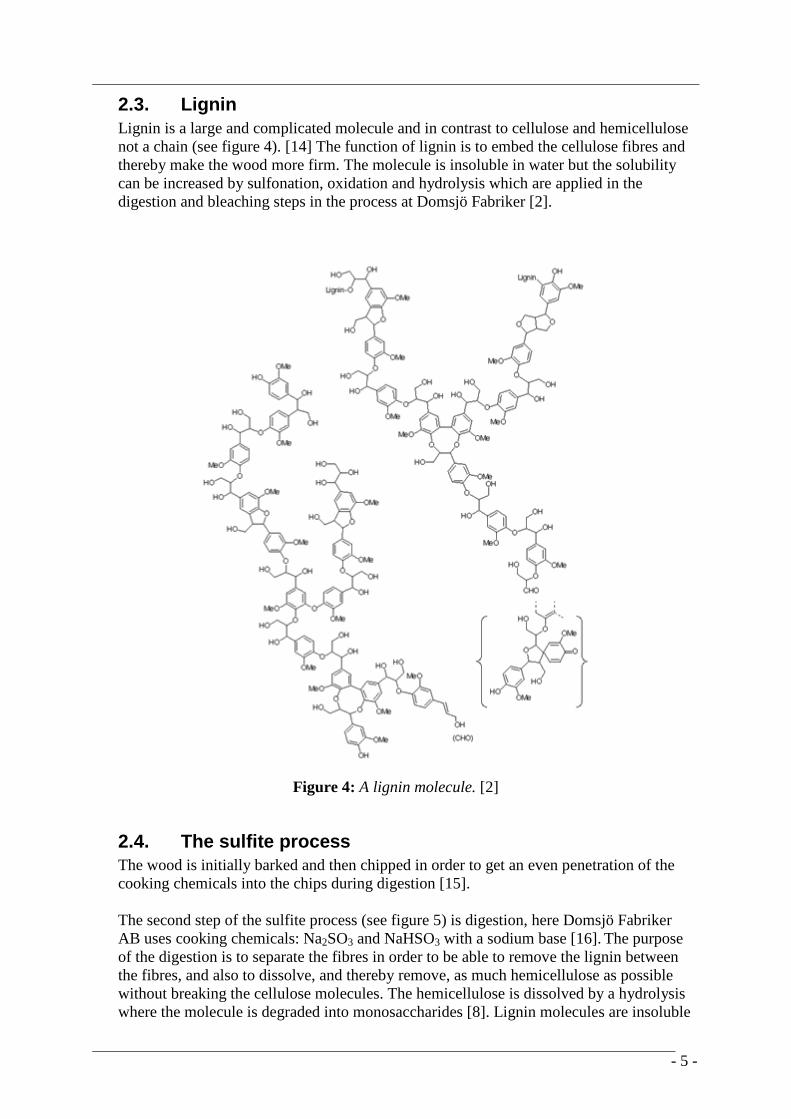
2.3. Lignin Lignin is a large and complicated molecule and in contrast to cellulose and hemicellulose not a chain (see figure 4). [14] The function of lignin is to embed the cellulose fibres and thereby make the wood more firm. The molecule is insoluble in water but the solubility can be increased by sulfonation, oxidation and hydrolysis which are applied in the digestion and bleaching steps in the process at Domsjö Fabriker [2].
Figure 4: A lignin molecule. [2]
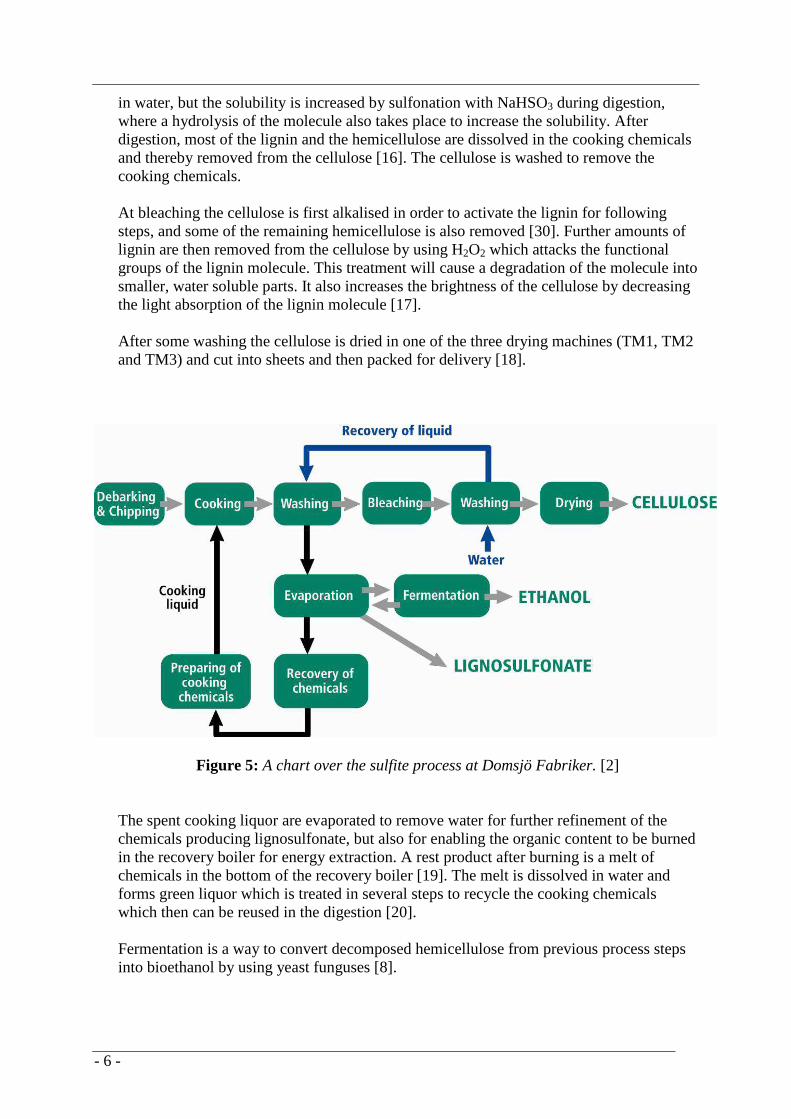
2.4. The sulfite process The wood is initially barked and then chipped in order to get an even penetration of the cooking chemicals into the chips during digestion [15]. The second step of the sulfite process (see figure 5) is digestion, here Domsjö Fabriker AB uses cooking chemicals: Na2SO3 and NaHSO3 with a sodium base [16]. The purpose of the digestion is to separate the fibres in order to be able to remove the lignin between the fibres, and also to dissolve, and thereby remove, as much hemicellulose as possible without breaking the cellulose molecules. The hemicellulose is dissolved by a hydrolysis where the molecule is degraded into monosaccharides [8]. Lignin molecules are insoluble
- 6 -
in water, but the solubility is increased by sulfonation with NaHSO3 during digestion, where a hydrolysis of the molecule also takes place to increase the solubility. After digestion, most of the lignin and the hemicellulose are dissolved in the cooking chemicals and thereby removed from the cellulose [16]. The cellulose is washed to remove the cooking chemicals.
At bleaching the cellulose is first alkalised in order to activate the lignin for following steps, and some of the remaining hemicellulose is also removed [30]. Further amounts of lignin are then removed from the cellulose by using H2O2 which attacks the functional groups of the lignin molecule. This treatment will cause a degradation of the molecule into smaller, water soluble parts. It also increases the brightness of the cellulose by decreasing the light absorption of the lignin molecule [17]. After some washing the cellulose is dried in one of the three drying machines (TM1, TM2 and TM3) and cut into sheets and then packed for delivery [18].
Figure 5: A chart over the sulfite process at Domsjö Fabriker. [2]
The spent cooking liquor are evaporated to remove water for further refinement of the chemicals producing lignosulfonate, but also for enabling the organic content to be burned in the recovery boiler for energy extraction. A rest product after burning is a melt of chemicals in the bottom of the recovery boiler [19]. The melt is dissolved in water and forms green liquor which is treated in several steps to recycle the cooking chemicals which then can be reused in the digestion [20].
Fermentation is a way to convert decomposed hemicellulose from previous process steps into bioethanol by using yeast funguses [8].
- 7 -
2.5. The viscose process
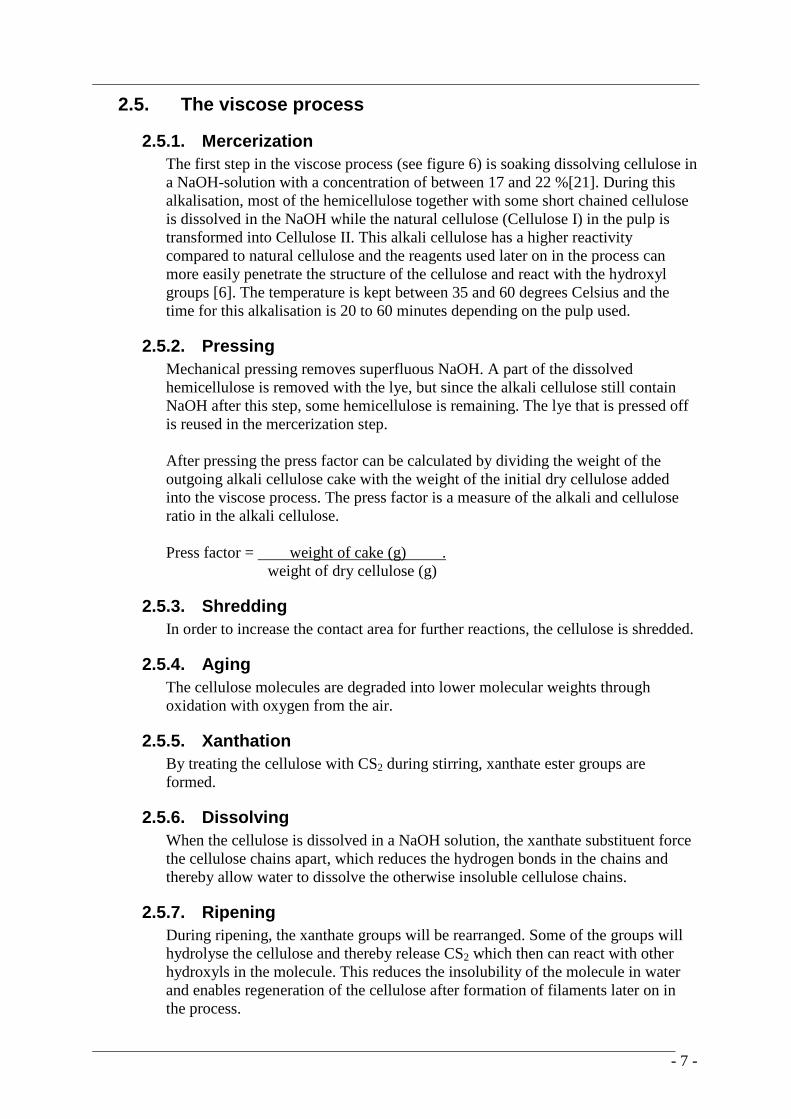
2.5.1. Mercerization The first step in the viscose process (see figure 6) is soaking dissolving cellulose in a NaOH-solution with a concentration of between 17 and 22 %[21]. During this alkalisation, most of the hemicellulose together with some short chained cellulose is dissolved in the NaOH while the natural cellulose (Cellulose I) in the pulp is transformed into Cellulose II. This alkali cellulose has a higher reactivity compared to natural cellulose and the reagents used later on in the process can more easily penetrate the structure of the cellulose and react with the hydroxyl groups [6]. The temperature is kept between 35 and 60 degrees Celsius and the time for this alkalisation is 20 to 60 minutes depending on the pulp used.
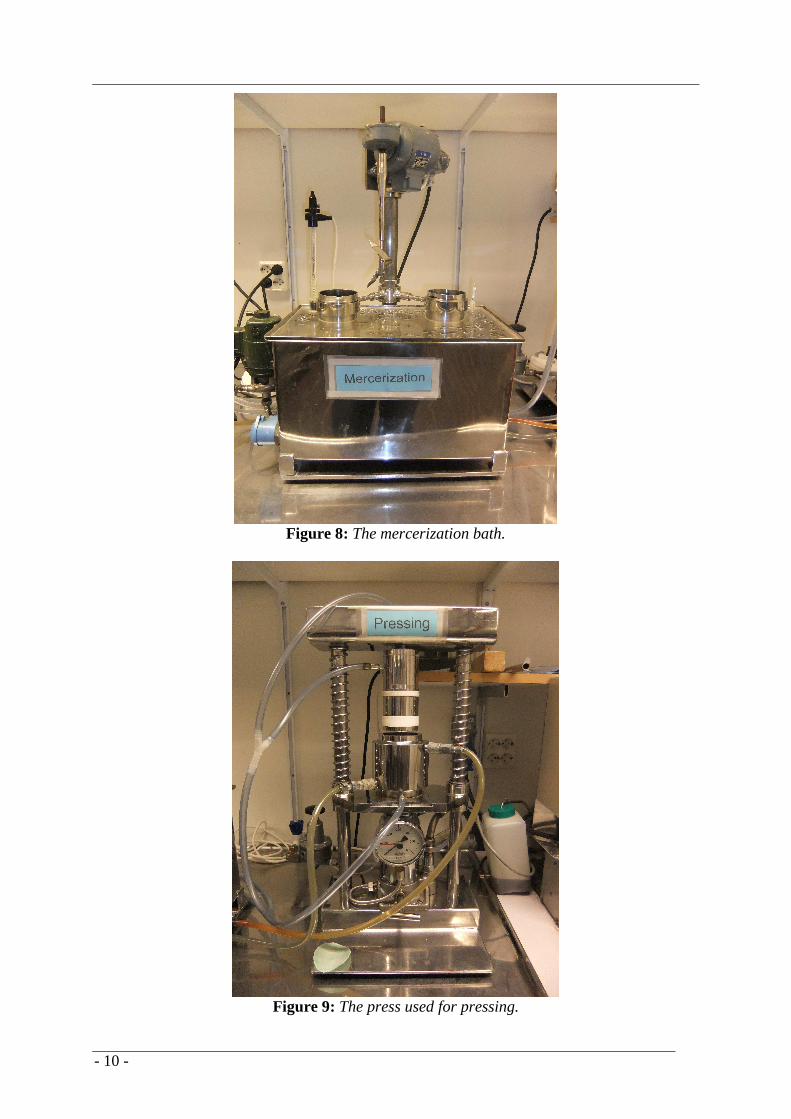
2.5.2. Pressing Mechanical pressing removes superfluous NaOH. A part of the dissolved hemicellulose is removed with the lye, but since the alkali cellulose still contain NaOH after this step, some hemicellulose is remaining. The lye that is pressed off is reused in the mercerization step. After pressing the press factor can be calculated by dividing the weight of the outgoing alkali cellulose cake with the weight of the initial dry cellulose added into the viscose process. The press factor is a measure of the alkali and cellulose ratio in the alkali cellulose. Press factor = weight of cake (g) . weight of dry cellulose (g)
2.5.3. Shredding In order to increase the contact area for further reactions, the cellulose is shredded.
2.5.4. Aging The cellulose molecules are degraded into lower molecular weights through oxidation with oxygen from the air.
2.5.5. Xanthation By treating the cellulose with CS2 during stirring, xanthate ester groups are formed.
2.5.6. Dissolving When the cellulose is dissolved in a NaOH solution, the xanthate substituent force the cellulose chains apart, which reduces the hydrogen bonds in the chains and thereby allow water to dissolve the otherwise insoluble cellulose chains.
2.5.7. Ripening During ripening, the xanthate groups will be rearranged. Some of the groups will hydrolyse the cellulose and thereby release CS2 which then can react with other hydroxyls in the molecule. This reduces the insolubility of the molecule in water and enables regeneration of the cellulose after formation of filaments later on in the process.

- 8 -
2.5.8. Filtering The viscose solution is filtered to remove solid particles that otherwise could clog the thrust nozzles in the next step of the process.
2.5.9. Spinning The viscose is pressed through a thrust nozzle which produces one fine filament of viscose per hole. When the viscose filament leaves the thrust nozzle it enters a bath with a solution of H2SO4, Na2SO4 and Zn2+. The Zink ions form a complex with the xanthate groups which cause the cellulose to spontaneously release one CS2 and thereby regenerate one hydroxyl group in the molecule and consequently regenerate the fibre.
2.5.10. Stretching While the cellulose chains still are relatively mobile, they are stretched in order to orient along the fibre axis [22] [23].
Figure 6: Schematic picture of the viscose process from Svenska Rayon AB, Vålberg, Sweden.
2.6. R10 and R18 Extensive resources and a lot of time are used in the cellulose industry to analyse R18. This analysis is performed twice a day at Domsjö Fabriker by the laboratory shift workers.

- 9 -
R18 is a measure of the alkali resistance of the speciality cellulose. The value indicates the magnitude of the insoluble fraction in the speciality cellulose when soaked in 18 % NaOH. The set point for R18 at Domsjö Fabriker is at 94,5 %, that is 94,5 % insoluble content in the speciality cellulose. [3] R10 is not a daily analysis at Domsjö Fabriker, but is also a measure of the alkali resistance of the speciality cellulose. But compared to R18, R10 gives the magnitude of the insoluble fraction when the cellulose is soaked in 10 % NaOH. In R18, mainly hemicellulose is dissolved, while in R10 mostly cellulose of low molecular weight, short chained cellulose, dissolves.
2.7. Viscose Micro Plant, MoRe Research MoRe Research in Örnsköldsvik possesses a viscose micro plant where viscose can be produced in small scale (see figure 7). Mercerization (see figure 8), pressing (see figure 9), shredding (see figure 10), aging, xanthation, dissolving and ripening can be performed in the micro plant. The transformation of the sample between the steps as well as many of the moments is performed manually. In every run 20 g of cellulose is used producing approximately 200 ml of viscose. A 10 % solution is similar to the yield obtained in a real viscose plant.
Figure 7: The first steps of the viscose micro plant.
- 10 -
Figure 8: The mercerization bath.
Figure 9: The press used for pressing.

- 11 -
Figure 10: The equipment for shredding.
2.8. Design of Experiments Design of Experiments (DOE) is used for choosing how to vary the factors of the experiments in order to maximize the amount of relevant information extracted from a limited number of experiments. By using DOE, the costs for experiments can be minimized without losing important information. One of the purposes for using DOE is Screening influencing factors, where dominating factors are identified and the appropriate ranges in which these factors should be further investigated is determined. In a Screening design many factors can be investigated over a fairly restricted number of experiments. In DOE, all the relevant factors are varied simultaneously and systematically, with a rectangular distribution of the experiments in the design space. Regression analysis is then used to, by examining the responses together with the input data, create a model which describes the relationship between changes in the factors and changes in the responses, and thereby determining which factors that are most influential on the response. [24]
2.9. Multivariate data Analysis Multivariate data Analysis (MVA) is a useful tool when having large amounts of data, including many variables as well as many measurements, and wanting to extract information from the raw data. The projection method “Partial least squares projections to
- 12 -
latent structures” (PLS) is used for linking the information in two data sets of variables, one with factors (called X) and one with responses (called Y). The data sets could contain several factors and several responses in PLS, and the method can also handle noisy, incomplete and collinear variables in the dataset and still making it possible to both model and predict responses [31].
3. Material and methods
3.1. The Project Process
3.1.1. Repeatability and accuracy In order to determine the repeatability and accuracy of the method of analyzing alkali resistance in cellulose (R18) as well as for the analyst, a sample with known R18 was analyzed with three replicates. The standard deviation was calculated from the obtained results.
3.1.2. Correlation between R10, R18 and carbohydrate content Three samples from different time points, but with nearly the same R18-value were analyzed both in alkali resistance (R10 and R18) but also in carbohydrate content. Three additional samples of Domsjö Cellulose, one with a high R18-value, one with low and one reference with the value exactly in between the two extremes, were analysed for determining R10, R18 and carbohydrate content. The correlation between R10, R18 and hemicellulose content were studied by comparing the results for the different samples.
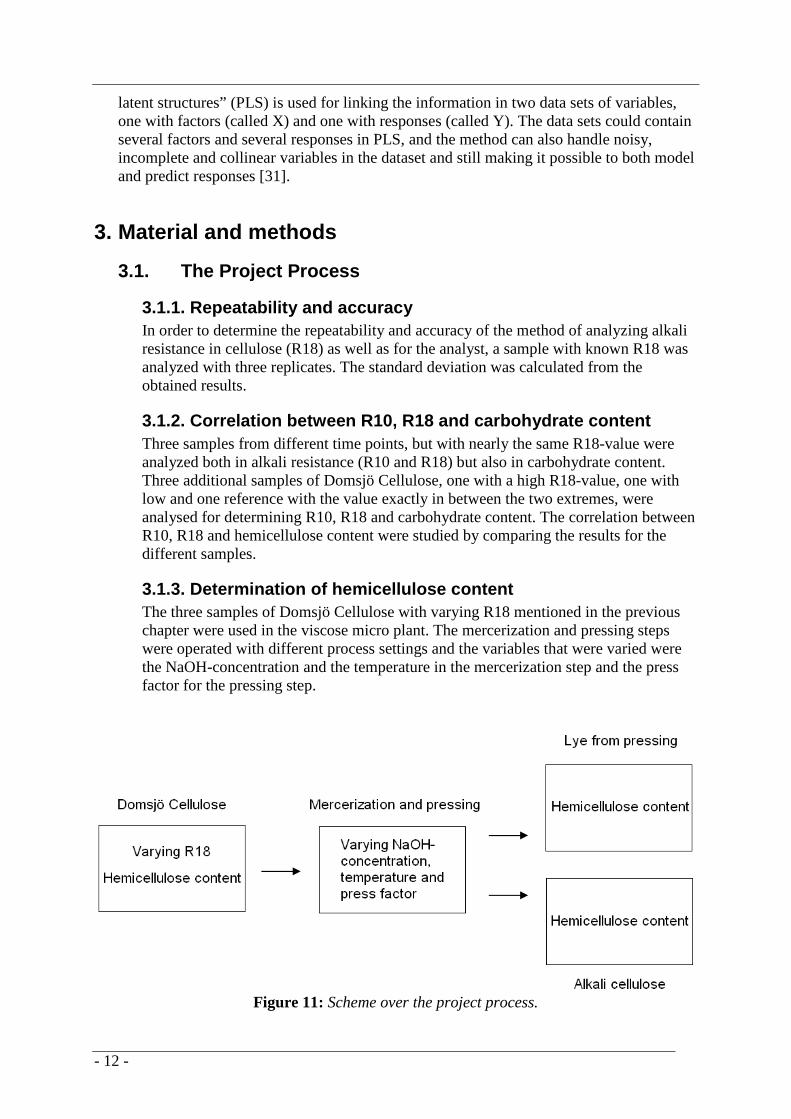
3.1.3. Determination of hemicellulose content The three samples of Domsjö Cellulose with varying R18 mentioned in the previous chapter were used in the viscose micro plant. The mercerization and pressing steps were operated with different process settings and the variables that were varied were the NaOH-concentration and the temperature in the mercerization step and the press factor for the pressing step.
Figure 11: Scheme over the project process.
- 13 -
The experimental objective selected for this experiment was screening, since the purpose was to determine which factors that has most influence on the response, to find possible interactions between the factors and to find their appropriate range. An experimental design was developed where the variables were varied in two levels and with three centre points. After each run in the viscose micro plant a carbohydrate analysis was made on both the alkali cellulose and the deducted lye from pressing. (See figure 11)
3.2. Design of Experiments Due to the defined budget, the time limit and a restricted access to the viscose micro plant only a limited number of experiments could be performed. Therefore an experimental design was constructed in MODDE to maximize the information extracted from the resulting data regarding correlations between the variables and the response. The variables that should be varied and screened were alkali resistance (R18), concentration of NaOH and temperature in the mercerization step, and the press factor during pressing. The aim was to find the factors which are influential to the carbohydrate content and for doing this a Screening was made. A Fractional Factorial design is the design most commonly used in Screening since it requires relatively few experiments but still can give information about the influence from an extensive amount of factors on the response including their proper ranges [33]. A Fractional Factorial design with 4 variables varied in two levels including three replicates in the centre point (see table 1) were constructed. The 24-1 Fractional Factorial design resulted in 11 runs in the viscose micro plant. The response that was analysed for all data sets was the carbohydrate content in the alkali cellulose and in the deducted lye from pressing. Three replicates were included to show the distribution of the results and thereby the trustworthiness of the design.
The levels of the factors were set to extreme values that could be fond in produced cellulose or be performed in the process in order to increase the possibility to get a noticeable impact on the response from every factor. A NaOH concentration of 18 % is the one most commonly used in the viscose process, why this was chosen as a reference point. The other two levels were chosen to be as extreme as possible but still within functioning running parameters, a concentration as low as 15 % is considered to give a pretty ineffective mercerization step but still lying within reasonable process parameters, to get a proper design the maximum concentration were set to 21 %. [21] The temperature in mercerization (C°) was chosen to be varied distinctly within normal process parameters (see table 1). The minimum value for the press factor (calculated by the equation shown in section 2.5.2) was chosen by pressing a test pulp, similar to the real samples, as much as possible in order to get the lowest possible press factor. The maximum value was chosen to be high enough for differing conveniently from the minimum value, but still corresponding to reasonable running conditions (see table 1). For R18 the high and low sample in the design corresponds to the extremes of previous production in the mill (see table 1).
- 14 -
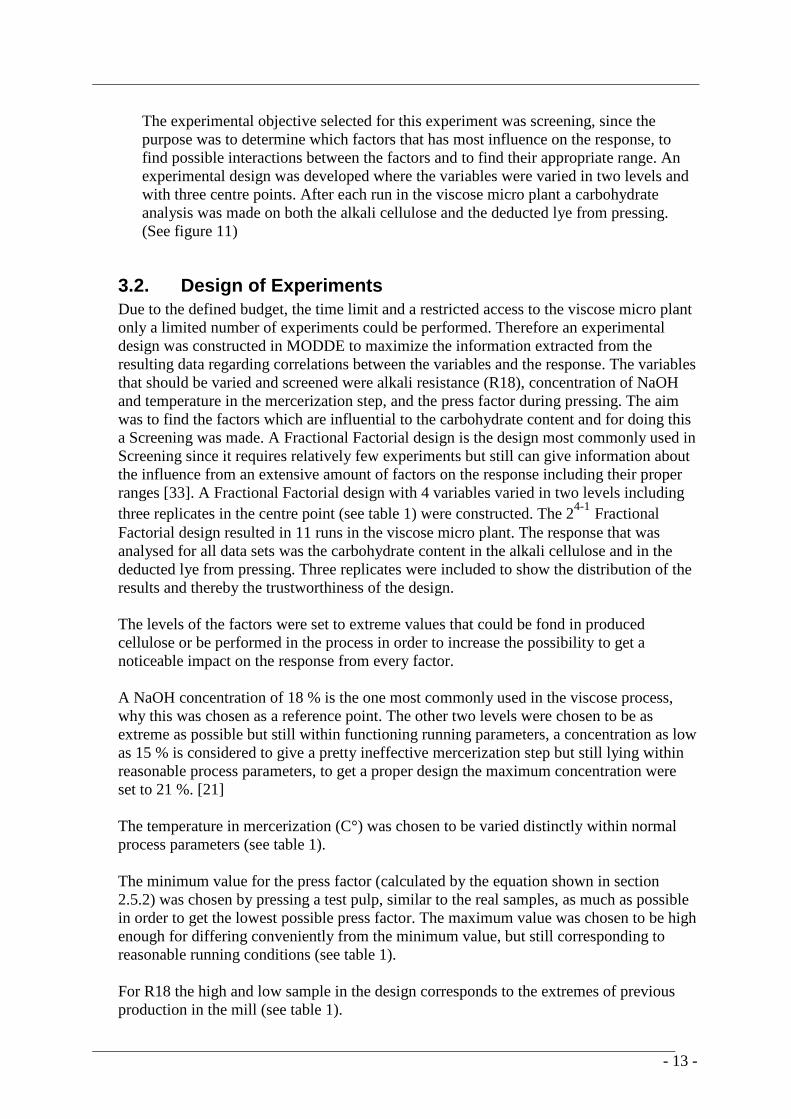
Table 1: The factors that were varied in the design and their different levels.
Unit - 0 + [NaOH] % (g/kg) 15 18 21
Temp. Merc. °C 30 40 50 Press factor 2.75 2.90 3.15
R18 % 93,6 94,6 95,5
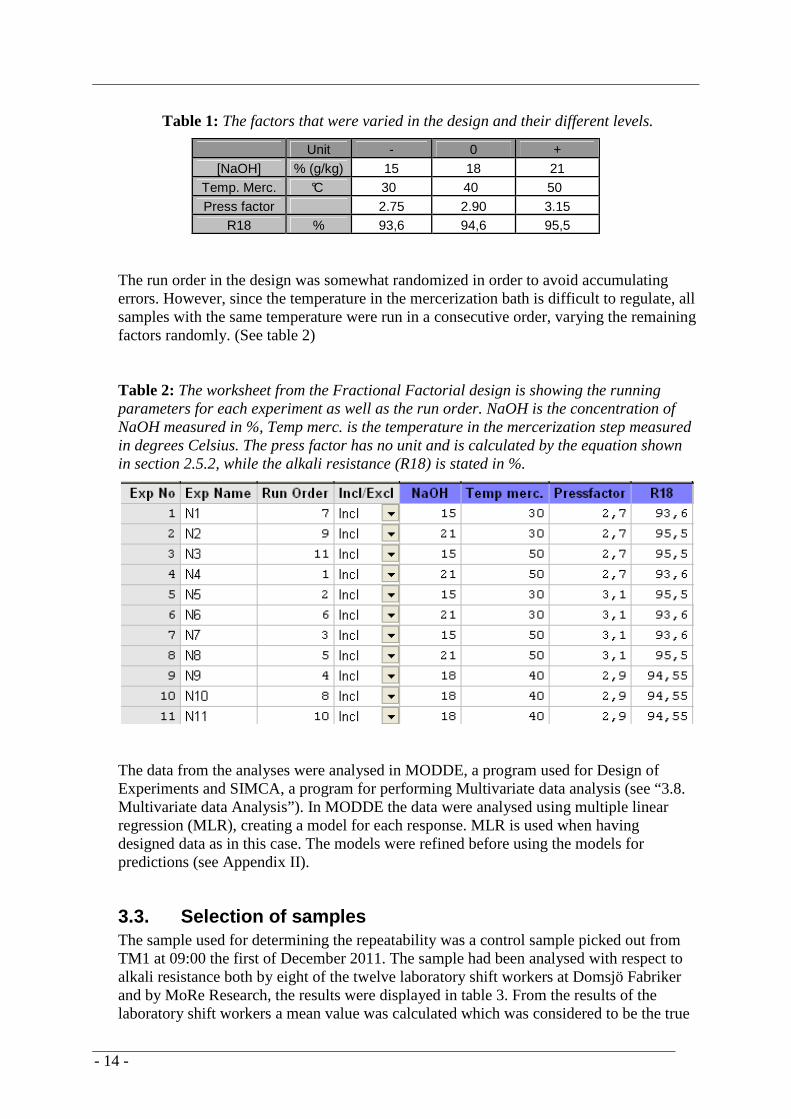
The run order in the design was somewhat randomized in order to avoid accumulating errors. However, since the temperature in the mercerization bath is difficult to regulate, all samples with the same temperature were run in a consecutive order, varying the remaining factors randomly. (See table 2) Table 2: The worksheet from the Fractional Factorial design is showing the running parameters for each experiment as well as the run order. NaOH is the concentration of NaOH measured in %, Temp merc. is the temperature in the mercerization step measured in degrees Celsius. The press factor has no unit and is calculated by the equation shown in section 2.5.2, while the alkali resistance (R18) is stated in %.
The data from the analyses were analysed in MODDE, a program used for Design of Experiments and SIMCA, a program for performing Multivariate data analysis (see “3.8. Multivariate data Analysis”). In MODDE the data were analysed using multiple linear regression (MLR), creating a model for each response. MLR is used when having designed data as in this case. The models were refined before using the models for predictions (see Appendix II).
3.3. Selection of samples The sample used for determining the repeatability was a control sample picked out from TM1 at 09:00 the first of December 2011. The sample had been analysed with respect to alkali resistance both by eight of the twelve laboratory shift workers at Domsjö Fabriker and by MoRe Research, the results were displayed in table 3. From the results of the laboratory shift workers a mean value was calculated which was considered to be the true
- 15 -
value. The result from MoRe Research was used for confirming the accuracy of the mean value. The results from the analyses performed in this project were compared with the true value and the result from MoRe Research in order to determine the accuracy. A deviation from the true value of 0.2 percent is considered to be acceptable for the laboratory shift workers in the daily analyses based on the standard deviation of the analysis and the fact that a difference of 0.2 percent represents an insignificant difference in alkali resistance. A difference of 0.2 percent was therefore also accepted for the analyst in this project.
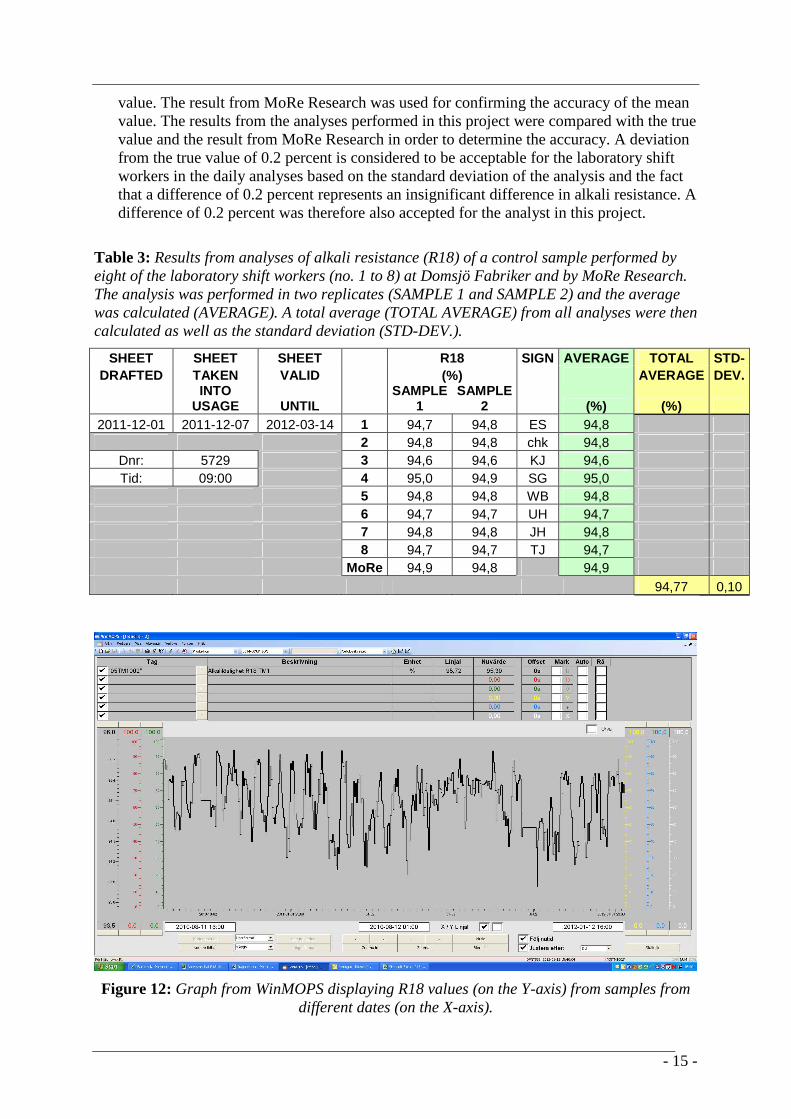
Table 3: Results from analyses of alkali resistance (R18) of a control sample performed by eight of the laboratory shift workers (no. 1 to 8) at Domsjö Fabriker and by MoRe Research. The analysis was performed in two replicates (SAMPLE 1 and SAMPLE 2) and the average was calculated (AVERAGE). A total average (TOTAL AVERAGE) from all analyses were then calculated as well as the standard deviation (STD-DEV.).
SHEET SHEET SHEET R18 SIGN AVERAGE TOTAL STD- DRAFTED TAKEN VALID (%) AVERAGE DEV.
INTO
USAGE UNTIL SAMPLE
1 SAMPLE
2 (%) (%) 2011-12-01 2011-12-07 2012-03-14 1 94,7 94,8 ES 94,8
2 94,8 94,8 chk 94,8 Dnr: 5729 3 94,6 94,6 KJ 94,6 Tid: 09:00 4 95,0 94,9 SG 95,0
5 94,8 94,8 WB 94,8 6 94,7 94,7 UH 94,7 7 94,8 94,8 JH 94,8 8 94,7 94,7 TJ 94,7 MoRe 94,9 94,8 94,9 94,77 0,10
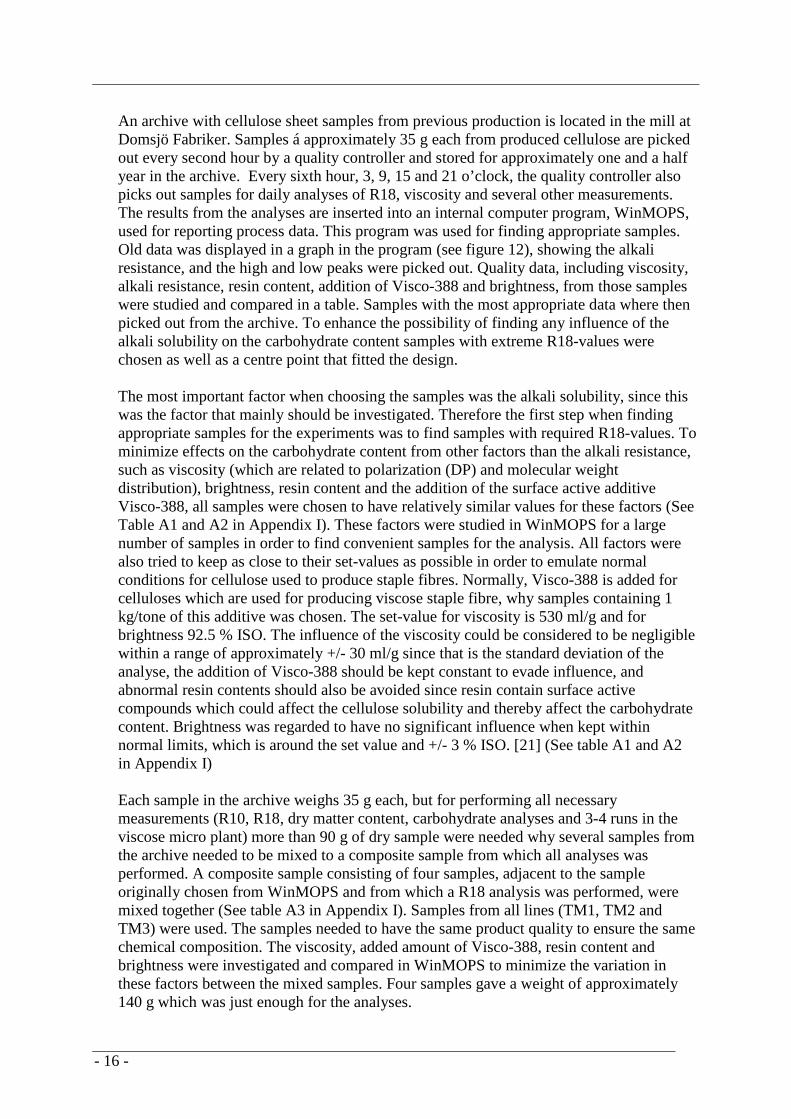
Figure 12: Graph from WinMOPS displaying R18 values (on the Y-axis) from samples from different dates (on the X-axis).
- 16 -
An archive with cellulose sheet samples from previous production is located in the mill at Domsjö Fabriker. Samples á approximately 35 g each from produced cellulose are picked out every second hour by a quality controller and stored for approximately one and a half year in the archive. Every sixth hour, 3, 9, 15 and 21 o’clock, the quality controller also picks out samples for daily analyses of R18, viscosity and several other measurements. The results from the analyses are inserted into an internal computer program, WinMOPS, used for reporting process data. This program was used for finding appropriate samples. Old data was displayed in a graph in the program (see figure 12), showing the alkali resistance, and the high and low peaks were picked out. Quality data, including viscosity, alkali resistance, resin content, addition of Visco-388 and brightness, from those samples were studied and compared in a table. Samples with the most appropriate data where then picked out from the archive. To enhance the possibility of finding any influence of the alkali solubility on the carbohydrate content samples with extreme R18-values were chosen as well as a centre point that fitted the design. The most important factor when choosing the samples was the alkali solubility, since this was the factor that mainly should be investigated. Therefore the first step when finding appropriate samples for the experiments was to find samples with required R18-values. To minimize effects on the carbohydrate content from other factors than the alkali resistance, such as viscosity (which are related to polarization (DP) and molecular weight distribution), brightness, resin content and the addition of the surface active additive Visco-388, all samples were chosen to have relatively similar values for these factors (See Table A1 and A2 in Appendix I). These factors were studied in WinMOPS for a large number of samples in order to find convenient samples for the analysis. All factors were also tried to keep as close to their set-values as possible in order to emulate normal conditions for cellulose used to produce staple fibres. Normally, Visco-388 is added for celluloses which are used for producing viscose staple fibre, why samples containing 1 kg/tone of this additive was chosen. The set-value for viscosity is 530 ml/g and for brightness 92.5 % ISO. The influence of the viscosity could be considered to be negligible within a range of approximately +/- 30 ml/g since that is the standard deviation of the analyse, the addition of Visco-388 should be kept constant to evade influence, and abnormal resin contents should also be avoided since resin contain surface active compounds which could affect the cellulose solubility and thereby affect the carbohydrate content. Brightness was regarded to have no significant influence when kept within normal limits, which is around the set value and +/- 3 % ISO. [21] (See table A1 and A2 in Appendix I) Each sample in the archive weighs 35 g each, but for performing all necessary measurements (R10, R18, dry matter content, carbohydrate analyses and 3-4 runs in the viscose micro plant) more than 90 g of dry sample were needed why several samples from the archive needed to be mixed to a composite sample from which all analyses was performed. A composite sample consisting of four samples, adjacent to the sample originally chosen from WinMOPS and from which a R18 analysis was performed, were mixed together (See table A3 in Appendix I). Samples from all lines (TM1, TM2 and TM3) were used. The samples needed to have the same product quality to ensure the same chemical composition. The viscosity, added amount of Visco-388, resin content and brightness were investigated and compared in WinMOPS to minimize the variation in these factors between the mixed samples. Four samples gave a weight of approximately 140 g which was just enough for the analyses.
- 17 -
The composite samples consist of samples of cellulose with same quality from both production lines in the mill and also from all three drying machines. The cellulose is stored in two different storing towers, called L6 and L7, before drying. The first and second production line receives cellulose from L7 which is shared between drying machine 1 and 2 (TM1 and TM2) while the third production line receives cellulose from L6 which goes to the third drying machine (TM3). The aim is to obtain identical chemical composition of the cellulose in L6 and L7, and consequently same chemical composition of the cellulose in all three drying machines. However, this is not always achievable. Dried cellulose that are considered to be waste are restored into the process in L6 and can consequently affect the composition, the same applies for uneven filling of the towers when there are level differences. But because of the large volumes of the towers, these cases most often have only marginal influence of the chemical composition [28]. To avoid differences between the samples included in the composite samples all convenient factors (R18, viscosity, resin content and addition of Visco-388) were investigated to ensure that they do not vary conveniently (See table A2 and A3 in Appendix I). But since some of the samples used are not analysed for these factors, the most adjacent samples were investigated to control that no radical changes have occurred within the time between the samples. Because of certain stiffness in the process, the conditions are assumed to not vary noticeably within a shorter matter of time.
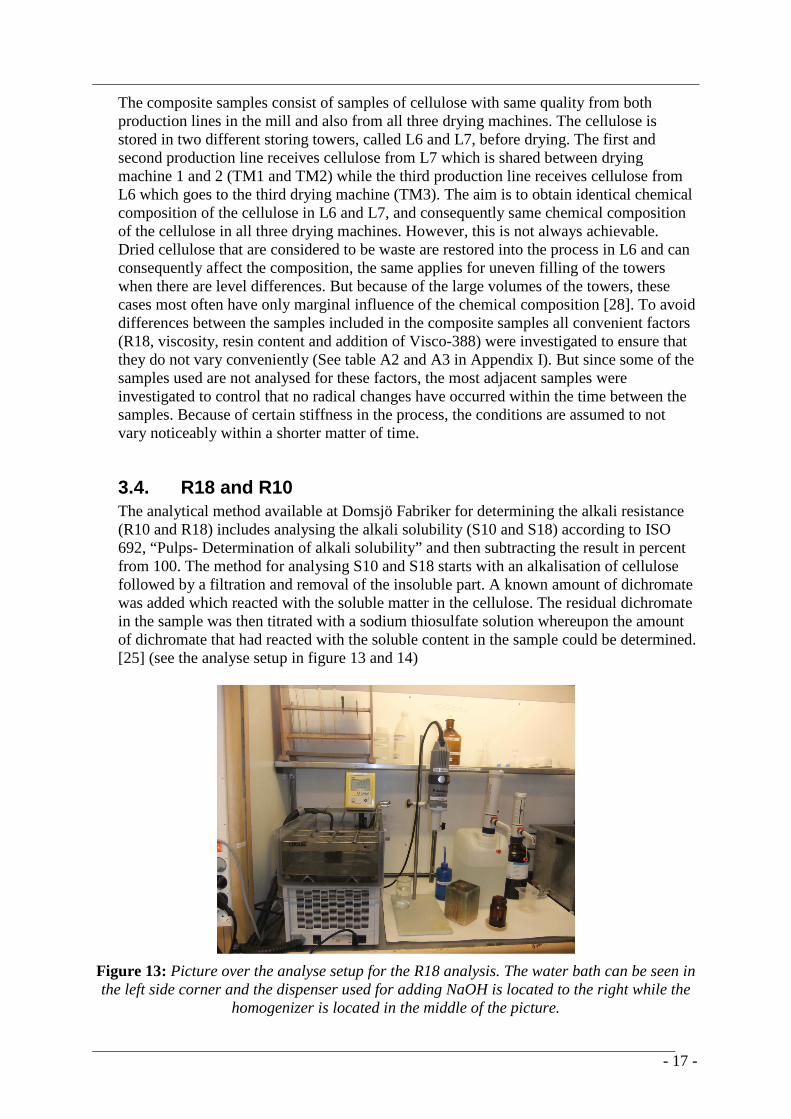
3.4. R18 and R10 The analytical method available at Domsjö Fabriker for determining the alkali resistance (R10 and R18) includes analysing the alkali solubility (S10 and S18) according to ISO 692, “Pulps- Determination of alkali solubility” and then subtracting the result in percent from 100. The method for analysing S10 and S18 starts with an alkalisation of cellulose followed by a filtration and removal of the insoluble part. A known amount of dichromate was added which reacted with the soluble matter in the cellulose. The residual dichromate in the sample was then titrated with a sodium thiosulfate solution whereupon the amount of dichromate that had reacted with the soluble content in the sample could be determined. [25] (see the analyse setup in figure 13 and 14)
Figure 13: Picture over the analyse setup for the R18 analysis. The water bath can be seen in the left side corner and the dispenser used for adding NaOH is located to the right while the
homogenizer is located in the middle of the picture.
- 18 -
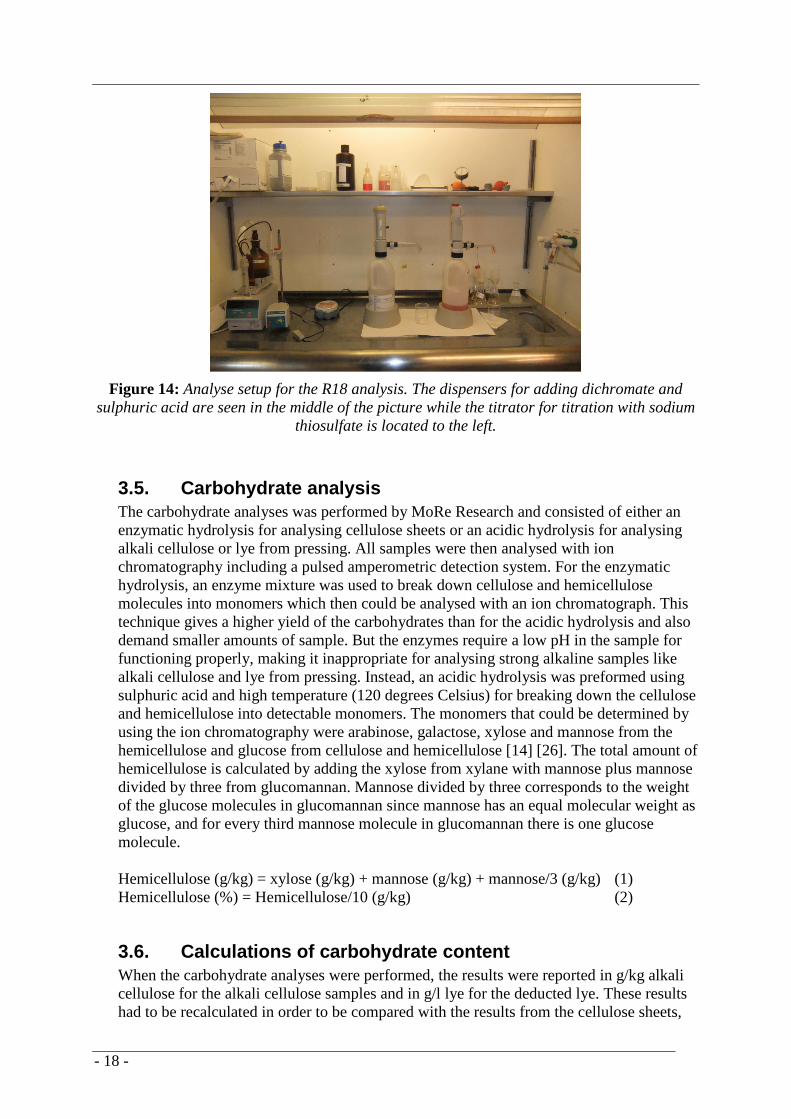
Figure 14: Analyse setup for the R18 analysis. The dispensers for adding dichromate and sulphuric acid are seen in the middle of the picture while the titrator for titration with sodium
thiosulfate is located to the left.
3.5. Carbohydrate analysis The carbohydrate analyses was performed by MoRe Research and consisted of either an enzymatic hydrolysis for analysing cellulose sheets or an acidic hydrolysis for analysing alkali cellulose or lye from pressing. All samples were then analysed with ion chromatography including a pulsed amperometric detection system. For the enzymatic hydrolysis, an enzyme mixture was used to break down cellulose and hemicellulose molecules into monomers which then could be analysed with an ion chromatograph. This technique gives a higher yield of the carbohydrates than for the acidic hydrolysis and also demand smaller amounts of sample. But the enzymes require a low pH in the sample for functioning properly, making it inappropriate for analysing strong alkaline samples like alkali cellulose and lye from pressing. Instead, an acidic hydrolysis was preformed using sulphuric acid and high temperature (120 degrees Celsius) for breaking down the cellulose and hemicellulose into detectable monomers. The monomers that could be determined by using the ion chromatography were arabinose, galactose, xylose and mannose from the hemicellulose and glucose from cellulose and hemicellulose [14] [26]. The total amount of hemicellulose is calculated by adding the xylose from xylane with mannose plus mannose divided by three from glucomannan. Mannose divided by three corresponds to the weight of the glucose molecules in glucomannan since mannose has an equal molecular weight as glucose, and for every third mannose molecule in glucomannan there is one glucose molecule. Hemicellulose (g/kg) = xylose (g/kg) + mannose (g/kg) + mannose/3 (g/kg) (1) Hemicellulose (%) = Hemicellulose/10 (g/kg) (2)
3.6. Calculations of carbohydrate content When the carbohydrate analyses were performed, the results were reported in g/kg alkali cellulose for the alkali cellulose samples and in g/l lye for the deducted lye. These results had to be recalculated in order to be compared with the results from the cellulose sheets,

- 19 -
which were reported in g/kg dry cellulose. The recalculated values are displayed in table 7 and for recalculation the following equations were used: X g xylose/kg alkali cellulose Y g xylose/l lye M g mannose/kg alkali cellulose N g mannose/l lye In the Viscose Micro Plant (see 3.7.) 20 g of dry cellulose were used as a sample which was alkalised in 668,2 ml lye. δ15 % NaOH = 1164 g/l δ18 % NaOH = 1197 g/l δ21 % NaOH = 1230 g/l The concentration of cellulose (mass %) in the mercerization step is dependent of the concentration (Z %) of the NaOH: [Cellulose]merc. = 20 g ⁄ (0, 6682 l × δZ % NaOH ) ×100, while the concentration of cellulose (mass %) in the pressed alkali cellulose is dependent of the press factor: [Cellulose]alk. cell. = 1000 g ⁄ (press factor × 1000 g) × 100 This means that 1000 g alkali cellulose contains: ( [Cellulose]alk. cell / 100) × 1000 = A g cellulose 1000 g - A g = B g lye And consequently, B g lye equals (B ⁄ δZ % NaOH ) ml lye. N.o. times the lye has been pressed off = ((100 − [Cellulose]merc ) ⁄ [Cellulose]merc. ) .
((100 − [Cellulose]alk. cell. ) ⁄ [Cellulose]alk. cell.
For the calculation of the amount of xylose the following equations are used: g xylose per kg alkali cellulose = X g ⁄ 0,345 kg = C g g xylose in the lye in the alkali cellulose = Y g × (655 ⁄ δZ % NaOH ) = D g g xylose in dry cellulose = C − D g xylose in deducted lye = N.o. times the lye has been pressed off × Y
- 20 -
Total amount of xylose in the sample = g xylose in dry cellulose + g xylose in deducted lye
For the calculation of the amount of mannose the following equations are used: g mannose per kg alkali cellulose = M g ⁄ 0,345 kg = E g g mannose in the lye in the alkali cellulose = N g × (655 ⁄ δZ % NaOH ) = F g g mannose in dry cellulose = E − F g mannose in deducted lye = N.o. times the lye has been pressed off × N Total amount of mannose in the sample = g mannose in dry cellulose + g mannose in deducted lye
3.7. Viscose Micro Plant, MoRe Research In order to determine the carbohydrate content in the viscose, the first of the steps in the viscose micro plant, mercerization and pressing, was performed varying NaOH-concentration, and temperature in mercerization and press factor. The cellulose was also shredded for a shorter period of time in order to homogenise the sample. The carbohydrate content was then analysed both in the in-going cellulose, in the produced alkali cellulose and in the lye from the pressing. [26] The duration time for each step was set to “regular” run times for cellulose from Domsjö Fabriker, by doing this the result from this analyse was somewhat comparable to previous run samples in the viscose power plant. The duration time for mercerization was set to 20 minutes, pressing approximately 5 minutes and shredding for around 10 to 15 minutes.
3.8. Multivariate data Analysis The raw data from the carbohydrate analyses were included in a PLS model in SIMCA were R18, NaOH-concentration, Temperature in mercerization, Press factor and the hemicellulose content in the ingoing samples were chosen as factors, while the xylose, mannose and total hemicellulose content in the deducted lye, in the pressed alkali cellulose and the total amount hemicellulose left unsolved in the cellulose were used as responses. The models were validated and then used for analysing the influence of the factors on the responses as well as the correlations between different factors in a Loading bi-plot.
4. Results and discussion
4.1. Determination of hemicellulose content Different methods were used for analysing the carbohydrate content depending on the sample. An enzymatic hydrolysis was performed when analysing cellulose sheets and an acidic hydrolysis was used for analysing alkali cellulose or lye from pressing. The two
- 21 -
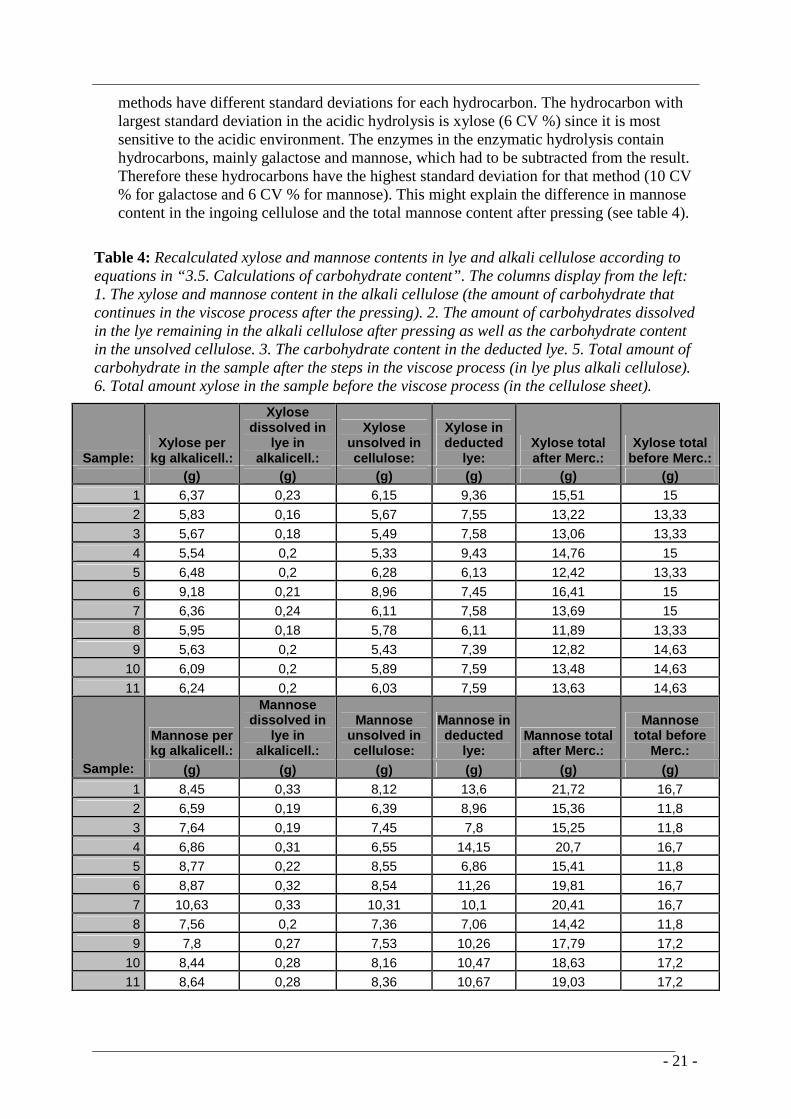
methods have different standard deviations for each hydrocarbon. The hydrocarbon with largest standard deviation in the acidic hydrolysis is xylose (6 CV %) since it is most sensitive to the acidic environment. The enzymes in the enzymatic hydrolysis contain hydrocarbons, mainly galactose and mannose, which had to be subtracted from the result. Therefore these hydrocarbons have the highest standard deviation for that method (10 CV % for galactose and 6 CV % for mannose). This might explain the difference in mannose content in the ingoing cellulose and the total mannose content after pressing (see table 4).
Table 4: Recalculated xylose and mannose contents in lye and alkali cellulose according to equations in “3.5. Calculations of carbohydrate content”. The columns display from the left: 1. The xylose and mannose content in the alkali cellulose (the amount of carbohydrate that continues in the viscose process after the pressing). 2. The amount of carbohydrates dissolved in the lye remaining in the alkali cellulose after pressing as well as the carbohydrate content in the unsolved cellulose. 3. The carbohydrate content in the deducted lye. 5. Total amount of carbohydrate in the sample after the steps in the viscose process (in lye plus alkali cellulose). 6. Total amount xylose in the sample before the viscose process (in the cellulose sheet).
Sample: Xylose per
kg alkalicell.:
Xylose dissolved in
lye in alkalicell.:
Xylose unsolved in cellulose:
Xylose in deducted
lye: Xylose total after Merc.:
Xylose total before Merc.:
(g) (g) (g) (g) (g) (g) 1 6,37 0,23 6,15 9,36 15,51 15
2 5,83 0,16 5,67 7,55 13,22 13,33
3 5,67 0,18 5,49 7,58 13,06 13,33
4 5,54 0,2 5,33 9,43 14,76 15
5 6,48 0,2 6,28 6,13 12,42 13,33
6 9,18 0,21 8,96 7,45 16,41 15
7 6,36 0,24 6,11 7,58 13,69 15
8 5,95 0,18 5,78 6,11 11,89 13,33
9 5,63 0,2 5,43 7,39 12,82 14,63
10 6,09 0,2 5,89 7,59 13,48 14,63
11 6,24 0,2 6,03 7,59 13,63 14,63
Mannose per kg alkalicell.:
Mannose dissolved in
lye in alkalicell.:
Mannose unsolved in cellulose:
Mannose in deducted
lye: Mannose total
after Merc.:
Mannose total before
Merc.: Sample: (g) (g) (g) (g) (g) (g)
1 8,45 0,33 8,12 13,6 21,72 16,7
2 6,59 0,19 6,39 8,96 15,36 11,8
3 7,64 0,19 7,45 7,8 15,25 11,8
4 6,86 0,31 6,55 14,15 20,7 16,7
5 8,77 0,22 8,55 6,86 15,41 11,8
6 8,87 0,32 8,54 11,26 19,81 16,7
7 10,63 0,33 10,31 10,1 20,41 16,7
8 7,56 0,2 7,36 7,06 14,42 11,8
9 7,8 0,27 7,53 10,26 17,79 17,2
10 8,44 0,28 8,16 10,47 18,63 17,2
11 8,64 0,28 8,36 10,67 19,03 17,2
- 22 -
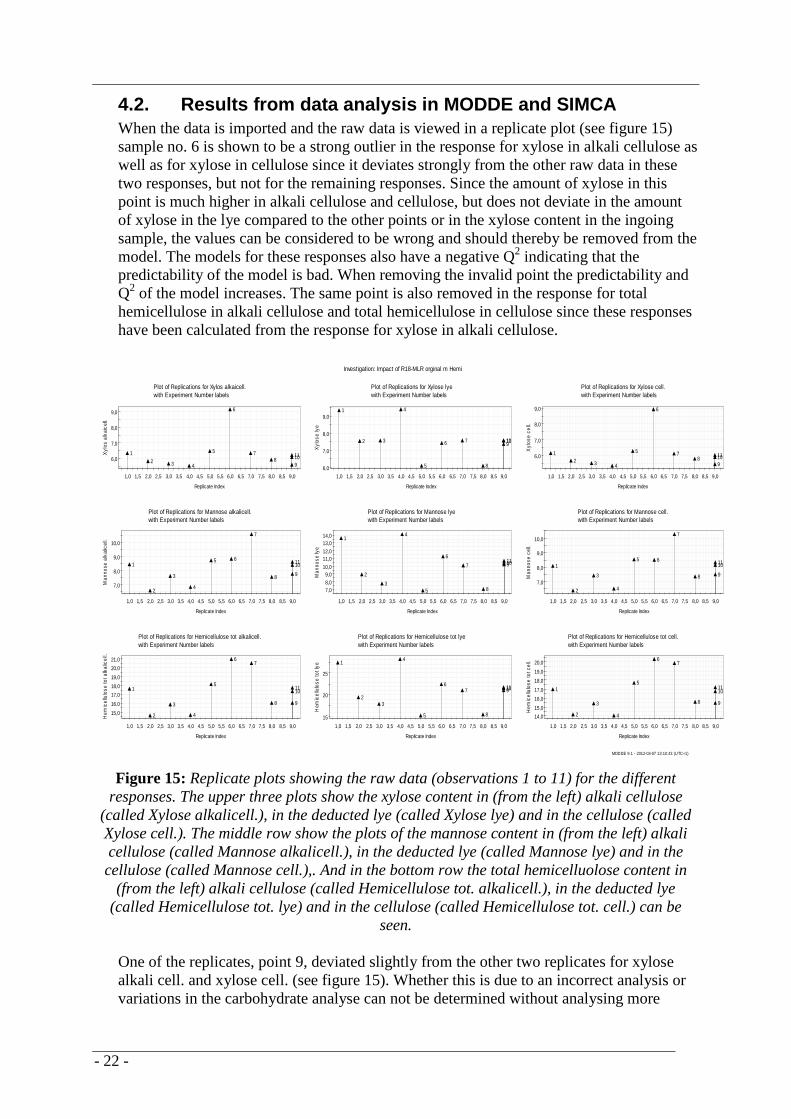
4.2. Results from data analysis in MODDE and SIMCA When the data is imported and the raw data is viewed in a replicate plot (see figure 15) sample no. 6 is shown to be a strong outlier in the response for xylose in alkali cellulose as well as for xylose in cellulose since it deviates strongly from the other raw data in these two responses, but not for the remaining responses. Since the amount of xylose in this point is much higher in alkali cellulose and cellulose, but does not deviate in the amount of xylose in the lye compared to the other points or in the xylose content in the ingoing sample, the values can be considered to be wrong and should thereby be removed from the model. The models for these responses also have a negative Q2 indicating that the predictability of the model is bad. When removing the invalid point the predictability and Q2 of the model increases. The same point is also removed in the response for total hemicellulose in alkali cellulose and total hemicellulose in cellulose since these responses have been calculated from the response for xylose in alkali cellulose.
6,0
7,0
8,0
9,0
1,0 1,5 2,0 2,5 3,0 3,5 4,0 4,5 5,0 5,5 6,0 6,5 7,0 7,5 8,0 8,5 9,0
Xyl
os a
lkai
cell.
Replicate Index
Plot of Replications for Xylos alkaicell.with Experiment Number labels
12 3 4
5
6
78
91011
6,0
7,0
8,0
9,0
1,0 1,5 2,0 2,5 3,0 3,5 4,0 4,5 5,0 5,5 6,0 6,5 7,0 7,5 8,0 8,5 9,0
Xyl
ose
lye
Replicate Index
Plot of Replications for Xylose lyewith Experiment Number labels
1
2 3
4
5
6 7
8
91011
6,0
7,0
8,0
9,0
1,0 1,5 2,0 2,5 3,0 3,5 4,0 4,5 5,0 5,5 6,0 6,5 7,0 7,5 8,0 8,5 9,0
Xyl
ose
cell.
Replicate Index
Plot of Replications for Xylose cell.with Experiment Number labels
12 3 4
5
6
78
91011
7,0
8,0
9,0
10,0
1,0 1,5 2,0 2,5 3,0 3,5 4,0 4,5 5,0 5,5 6,0 6,5 7,0 7,5 8,0 8,5 9,0
Man
nose
alk
alic
ell.
Replicate Index
Plot of Replications for Mannose alkalicell.with Experiment Number labels
1
2
3
4
5 6
7
8 9
1011
7,08,09,0
10,0
11,012,0
13,014,0
1,0 1,5 2,0 2,5 3,0 3,5 4,0 4,5 5,0 5,5 6,0 6,5 7,0 7,5 8,0 8,5 9,0
Man
nose
lye
Replicate Index
Plot of Replications for Mannose lyewith Experiment Number labels
1
2
3
4
5
6
7
8
91011
7,0
8,0
9,0
10,0
1,0 1,5 2,0 2,5 3,0 3,5 4,0 4,5 5,0 5,5 6,0 6,5 7,0 7,5 8,0 8,5 9,0
Man
nose
cel
l.
Replicate Index
Plot of Replications for Mannose cell.with Experiment Number labels
1
2
3
4
5 6
7
8 9
1011
15,0
16,0
17,0
18,0
19,0
20,0
21,0
1,0 1,5 2,0 2,5 3,0 3,5 4,0 4,5 5,0 5,5 6,0 6,5 7,0 7,5 8,0 8,5 9,0
Hem
icel
lulo
se to
t alk
alic
ell.
Replicate Index
Plot of Replications for Hemicellulose tot alkalicell.with Experiment Number labels
1
2
3
4
5
67
8 9
1011
15
20
25
1,0 1,5 2,0 2,5 3,0 3,5 4,0 4,5 5,0 5,5 6,0 6,5 7,0 7,5 8,0 8,5 9,0
Hem
icel
lulo
se to
t lye
Replicate Index
Plot of Replications for Hemicellulose tot lyewith Experiment Number labels
1
23
4
5
67
8
91011
14,0
15,0
16,0
17,0
18,0
19,0
20,0
1,0 1,5 2,0 2,5 3,0 3,5 4,0 4,5 5,0 5,5 6,0 6,5 7,0 7,5 8,0 8,5 9,0
Hem
icel
lulo
se to
t cel
l.
Replicate Index
Plot of Replications for Hemicellulose tot cell.with Experiment Number labels
1
2
3
4
5
67
8 9
1011
Investigation: Impact of R18-MLR orginal m Hemi
MODDE 9.1 - 2012-03-07 13:10:43 (UTC+1) Figure 15: Replicate plots showing the raw data (observations 1 to 11) for the different
responses. The upper three plots show the xylose content in (from the left) alkali cellulose (called Xylose alkalicell.), in the deducted lye (called Xylose lye) and in the cellulose (called Xylose cell.). The middle row show the plots of the mannose content in (from the left) alkali cellulose (called Mannose alkalicell.), in the deducted lye (called Mannose lye) and in the cellulose (called Mannose cell.),. And in the bottom row the total hemicelluolose content in
(from the left) alkali cellulose (called Hemicellulose tot. alkalicell.), in the deducted lye (called Hemicellulose tot. lye) and in the cellulose (called Hemicellulose tot. cell.) can be
seen.
One of the replicates, point 9, deviated slightly from the other two replicates for xylose alkali cell. and xylose cell. (see figure 15). Whether this is due to an incorrect analysis or variations in the carbohydrate analyse can not be determined without analysing more
- 23 -
replicates. Performing more analyses were however not possible in this study due to the time limit and the budget. The distribution in the replicates is nearly as large as the variation between the sample points indicating that there is a bad reproducibility for xylose alkali cell. and xylose cell. Two models, one with the deviating replicate included and one model with the same replicate excluded were constructed and a prediction with a contour plot for each model was made. Both predictions were nearly identical and therefore the replicate were excluded from the models for these two responses since this does not change the model other than simplifying it in such a way that the reproducibility increases. The impact from the factors in the model and the direction of the influence is not affected but the possible lack of accuracy of the predictions for these responses has to be considered when drawing conclusions from these two models.
-0,30-0,20
-0,10-0,000,100,200,30
NaO
H
Tem
p
Pre
ss
R18
g/kg
Scaled & Centered Coefficients for Xylos alkaicell.
N=9 R2=0,952 RSD=0,1033 DF=4 Q2=0,774 Conf. lev.=0,95
-0,050
-0,040
-0,030
-0,020
-0,010
0,000
NaO
H
Tem
p
Pre
ss
R18
g
Scaled & Centered Coefficients for Xylose lye~
N=11 R2=0,996 RSD=0,004588 DF=6 Q2=0,992 Conf. lev.=0,95
-0,30-0,20-0,10-0,000,10
0,200,30
NaO
H
Tem
p
Pre
ss
R18
g/kg
Scaled & Centered Coefficients for Xylose cell.
N=9 R2=0,947 RSD=0,1043 DF=4 Q2=0,733 Conf. lev.=0,95
-0,05
0,00
0,05
NaO
H
Tem
p
Pre
ss
R18
g/kg
Scaled & Centered Coefficients for Mannose alkalicell.~
N=11 R2=0,921 RSD=0,02084 DF=6 Q2=0,712 Conf. lev.=0,95
-0,10
-0,05
-0,00
NaO
H
Tem
p
Pre
ss
R18
g
Scaled & Centered Coefficients for Mannose lye~
N=11 R2=0,966 RSD=0,02458 DF=6 Q2=0,896 Conf. lev.=0,95
-0,05
0,00
0,05
NaO
H
Tem
p
Pre
ss
R18
g/kg
Scaled & Centered Coefficients for Mannose cell.~
N=11 R2=0,917 RSD=0,02163 DF=6 Q2=0,686 Conf. lev.=0,95
-0,05
0,00
0,05
NaO
H
Tem
p
Pre
ss
R18
g/kg
Scaled & Centered Coefficients for Hemicellulose tot alkalicell.~
N=10 R2=0,903 RSD=0,01892 DF=5 Q2=0,684 Conf. lev.=0,95
-0,05
0,00
NaO
H
Tem
p
Pre
ss
R18
g/kg
Scaled & Centered Coefficients for Hemicellulose tot lye~
N=11 R2=0,981 RSD=0,01528 DF=6 Q2=0,940 Conf. lev.=0,95
-0,05
0,00
0,05
NaO
H
Tem
p
Pre
ss
R18
g/kg
Scaled & Centered Coefficients for Hemicellulose tot cell.~
N=10 R2=0,897 RSD=0,01964 DF=5 Q2=0,654 Conf. lev.=0,95
Investigation: Impact of R18-MLR orginal m Hemi (MLR)
MODDE 9.1 - 2012-03-07 13:14:59 (UTC+1)
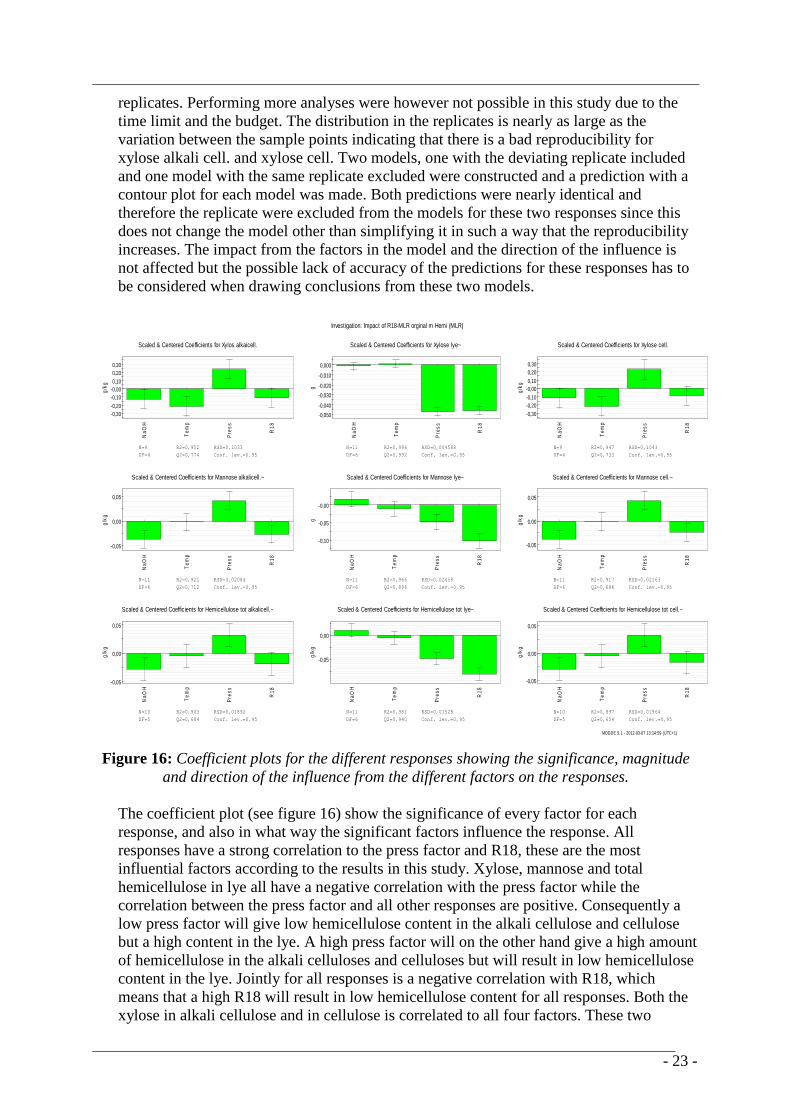
Figure 16: Coefficient plots for the different responses showing the significance, magnitude and direction of the influence from the different factors on the responses.
The coefficient plot (see figure 16) show the significance of every factor for each response, and also in what way the significant factors influence the response. All responses have a strong correlation to the press factor and R18, these are the most influential factors according to the results in this study. Xylose, mannose and total hemicellulose in lye all have a negative correlation with the press factor while the correlation between the press factor and all other responses are positive. Consequently a low press factor will give low hemicellulose content in the alkali cellulose and cellulose but a high content in the lye. A high press factor will on the other hand give a high amount of hemicellulose in the alkali celluloses and celluloses but will result in low hemicellulose content in the lye. Jointly for all responses is a negative correlation with R18, which means that a high R18 will result in low hemicellulose content for all responses. Both the xylose in alkali cellulose and in cellulose is correlated to all four factors. These two
- 24 -
responses are the only ones dependent on the temperature, for all other responses that term is insignificant. The sodium hydroxide concentration is significant and has a negative influence on the xylose, mannose and hemicellulose content in both alkali cellulose and cellulose but is insignificant for all carbohydrate contents in the lye. The concentration of the NaOH can therefore be chosen by mainly considering the effect it has of the hemicellulose content in the alkali cellulose and cellulose.
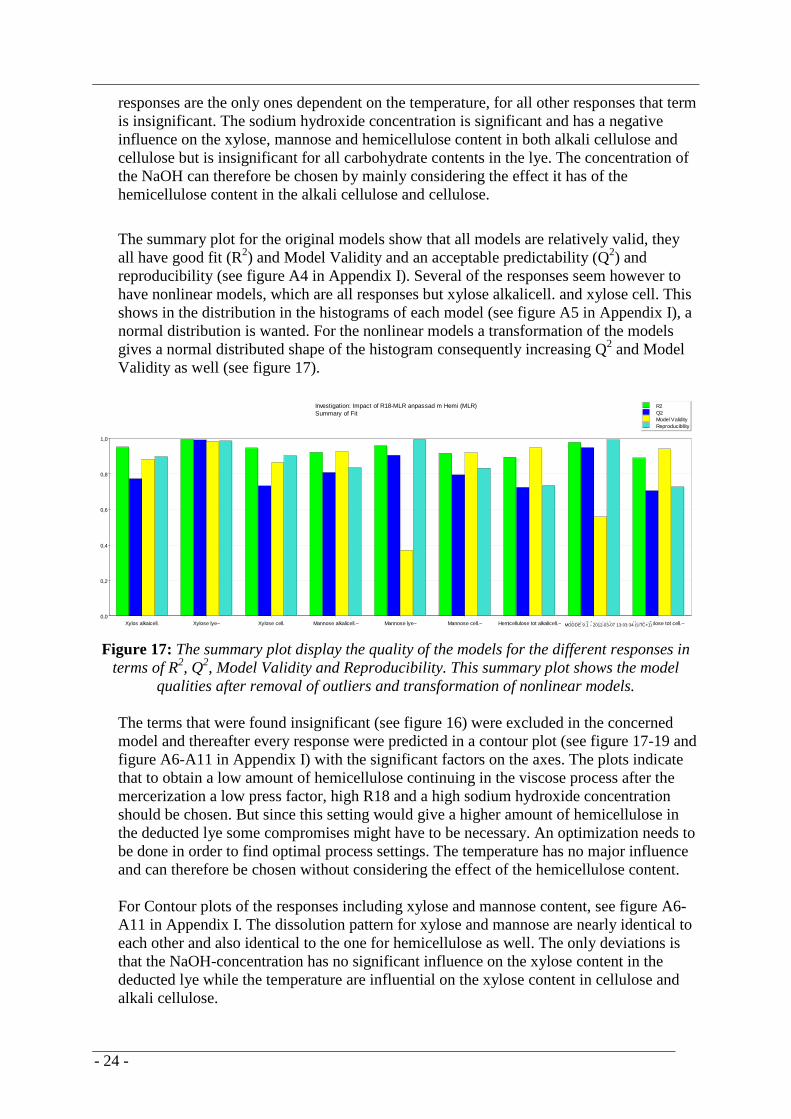
The summary plot for the original models show that all models are relatively valid, they all have good fit (R2) and Model Validity and an acceptable predictability (Q2) and reproducibility (see figure A4 in Appendix I). Several of the responses seem however to have nonlinear models, which are all responses but xylose alkalicell. and xylose cell. This shows in the distribution in the histograms of each model (see figure A5 in Appendix I), a normal distribution is wanted. For the nonlinear models a transformation of the models gives a normal distributed shape of the histogram consequently increasing Q2 and Model Validity as well (see figure 17).
0,0
0,2
0,4
0,6
0,8
1,0
Xylos alkaicell. Xylose lye~ Xylose cell. Mannose alkalicell.~ Mannose lye~ Mannose cell.~ Hemicellulose tot alkalicell.~ Hemicellulose tot lye~ Hemicellulose tot cell.~
Investigation: Impact of R18-MLR anpassad m Hemi (MLR)Summary of Fit
R2Q2Model ValidityReproducibility
MODDE 9.1 - 2012-03-07 13:03:34 (UTC+1) Figure 17: The summary plot display the quality of the models for the different responses in
terms of R2, Q2, Model Validity and Reproducibility. This summary plot shows the model qualities after removal of outliers and transformation of nonlinear models.
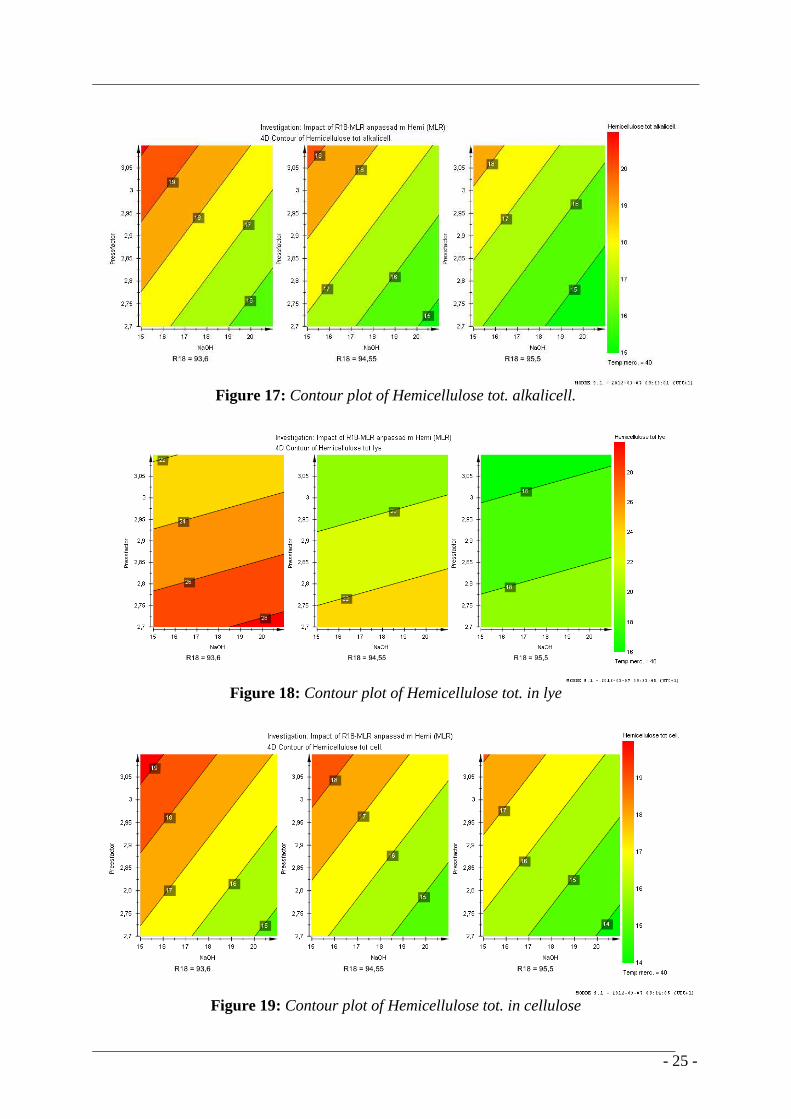
The terms that were found insignificant (see figure 16) were excluded in the concerned model and thereafter every response were predicted in a contour plot (see figure 17-19 and figure A6-A11 in Appendix I) with the significant factors on the axes. The plots indicate that to obtain a low amount of hemicellulose continuing in the viscose process after the mercerization a low press factor, high R18 and a high sodium hydroxide concentration should be chosen. But since this setting would give a higher amount of hemicellulose in the deducted lye some compromises might have to be necessary. An optimization needs to be done in order to find optimal process settings. The temperature has no major influence and can therefore be chosen without considering the effect of the hemicellulose content. For Contour plots of the responses including xylose and mannose content, see figure A6-A11 in Appendix I. The dissolution pattern for xylose and mannose are nearly identical to each other and also identical to the one for hemicellulose as well. The only deviations is that the NaOH-concentration has no significant influence on the xylose content in the deducted lye while the temperature are influential on the xylose content in cellulose and alkali cellulose.
- 25 -
Figure 17: Contour plot of Hemicellulose tot. alkalicell.
Figure 18: Contour plot of Hemicellulose tot. in lye
Figure 19: Contour plot of Hemicellulose tot. in cellulose

- 26 -
-1,1
-1,0
-0,9
-0,8
-0,7
-0,6
-0,5
-0,4
-0,3
-0,2
-0,1
0,0
0,1
0,2
0,3
0,4
0,5
0,6
0,7
0,8
0,9
1,0
-1,1 -1,0 -0,9 -0,8 -0,7 -0,6 -0,5 -0,4 -0,3 -0,2 -0,1 0,0 0,1 0,2 0,3 0,4 0,5 0,6 0,7 0,8 0,9 1,0
pc(corr)[1], t(corr)[1]
Saras exjobb ny.M1 (PLS)pc(corr)[Comp. 1]/pc(corr)[Comp. 2]
NaOH
Temp Merc
PressfactoR18
Hemi in
Hemi alkal
Hemi lye
Hemi cell.
11109
4
37
8
2
5
1
Figure 120: Loading bi-plot displaying the correlation between different factors and between
factors and observations as well as the influence of the factors on the responses.
0,0
0,1
0,2
0,3
0,4
0,5
0,6
0,7
0,8
0,9
Com
p[1]
Com
p[2]
Comp No.
Saras exjobb ny.M1 (PLS) R2Y(cum)Q2(cum)
SIMCA-P+ 12.0.1 - 2012-03-16 13:30:58 (UTC+1)
Figure 21: Model overview plot for the PLS-model.

- 27 -
The loading bi-plot (see figure 20) for the PLS-model that was created in SIMCA confirmed the results from the MLR-model from MODDE. Since sample point 6 was considered to be deviating in the raw data and consequently inaccurate this sample was removed from the model. According to the loading bi-plot the R18-value (denoted R18 in the plot), NaOH-concentration (NaOH), press factor (pressfacto) and the ingoing hemicellulose content (Hemi in) has a significant affect on the responses. Temperature (Temp Merc) on the other hand has a negligible effect. In the Model overview plot (see figure 21) for the PLS-model it shows that the predictability (Q2) in the first component is bad, but the fit (R2) of the included points in the model is relatively high. The second component on the other hand has a high Q2 and has hence a good predictability. After two components the model is usable for predicting the responses and the predictions can therefore be considered to be valid.
4.3. Repeatability and accuracy Three replicates are a very limited number of runs when determining the repeatability and an extended number of replicates would show a more accurate and true variation. But because of limited time and a small amount of sample available the possibility of running an extensive set of replicates was limited. Three replicates were considered to generate a reasonable number of analyses as well as resulting in enough information for showing the variation in the analysis. The standard method ISO 692 “Pulps – Determination of alkali solubility” specifies an acceptable standard deviation for two replicates of 0.3 %. The standard deviation obtained for the replicates in this project was 0.1 and both the analysis and the analyst can therefore be considered to have a good repeatability.
The average for the replicates is 94.6 % differ 0.17 % from the true value (94.77 %). (See table 5). But since the acceptable deviation is considered to be 0.20 %, the value lies within the acceptable range and can be considered as valid. And since the standard deviation for the analyst is identical to the standard deviation of the laboratory shift workers, the variation in R18 in this project is no more influential than in the results from daily analyses.
Table 5: Results from R18 for the three replicates
Replicate R18 (%) 1 94,5
2 94,6
3 94,7
Average: 94,6
True value: 94,8
Standard deviation: 0,1

- 28 -
4.4. Correlation between R10, R18 and hemicellulose content A problem with the method used at Domsjö Fabriker for analysing the alkali resistance (R18) is that the soluble content in cellulose from soft wood consists mainly contains hemicellulose in terms of hexoses while the same from hard wood consist of pentoses. Because of the difference in numbers of carbon atoms these molecules consume different numbers of dichromate ions, why the result could differ whether the cellulose origin from hard or soft wood. Therefore, analysing R18 according to ISO 699 would be preferable over the method used at Domsjö Fabriker at some points, for example when comparing cellulose from different wood species. [21] In this study did all samples origin from the same wood species. This also indicates that the results from this study, and also other studies made on softwood is not applicable on hardwood.
Two of the three samples with a R18 of 94,8 % have very similar hemicellulose contents according to the carbohydrate analyse. The third sample on the other hand contain more hemicellulose than the previous ones (see table 6 and figure A12 in Appendix I). Since R18 is 0,1 % higher for the third sample it should contain a slightly lower amount of hemicellulose if there are a linear relationship between R18 and the carbohydrate content, however is that not the case. This sample contains a somewhat higher amount of hemicellulose than the remaining two and the difference is due to a higher amount of mannose than the other two samples. The carbohydrate content in these samples are analysed by doing an enzymatic hydrolysis. The enzymes used in this method contain hydrocarbons, mainly mannose and galactose, which had to be subtracted from the result. The subtraction of mannose from the result gives an uncertainty in mannose content in the sample and consequently a relatively large standard deviation. This could be the causation for the difference in mannose and thus the total hemicellulose content for the deviating point.
Table 6: Results from R18, R10 and the carbohydrate analysis from three different cellulose samples with similar alkali resistance. The total hemicellulose content in the samples was calculated from equation (1). The numbers in the parentheses correspond to the uncertainty of the results.
R18 R10 Xylose Mannose Glucose Galactose Arabinose Hemicellulose
content Sample Time (%) (%) (g/kg) (g/kg) (g/kg) (g/kg) (g/kg) (g/kg)
2011-12-10 21:00 94,8
(+/- 0.1) 91,4
(+/- 0.1) 14,96
(+/- 1.80) 13,9
(+/- 0.83) 928
(+/- 37) <0.2
(+/- 0.02) <0.2
(+/- 0.02) 33,51
(+/- 2.91)
2011-12-14 21:00 94,8
(+/- 0.1) 91,1
(+/- 0.1) 14,29
(+/- 1.71) 14,1
(+/- 0.85) 941
(+/- 38) <0.2
(+/- 0.02) <0.2
(+/- 0.02) 33,06
(+/- 2.84)
2011-12-21 03:00 94,9
(+/- 0.1) 90,8
(+/- 0.1) 15
(+/- 1.80) 16,7
(+/- 1.00) 941
(+/- 38) <0.2
(+/- 0.02) <0.2
(+/- 0.02) 37,28
(+/- 3.13)
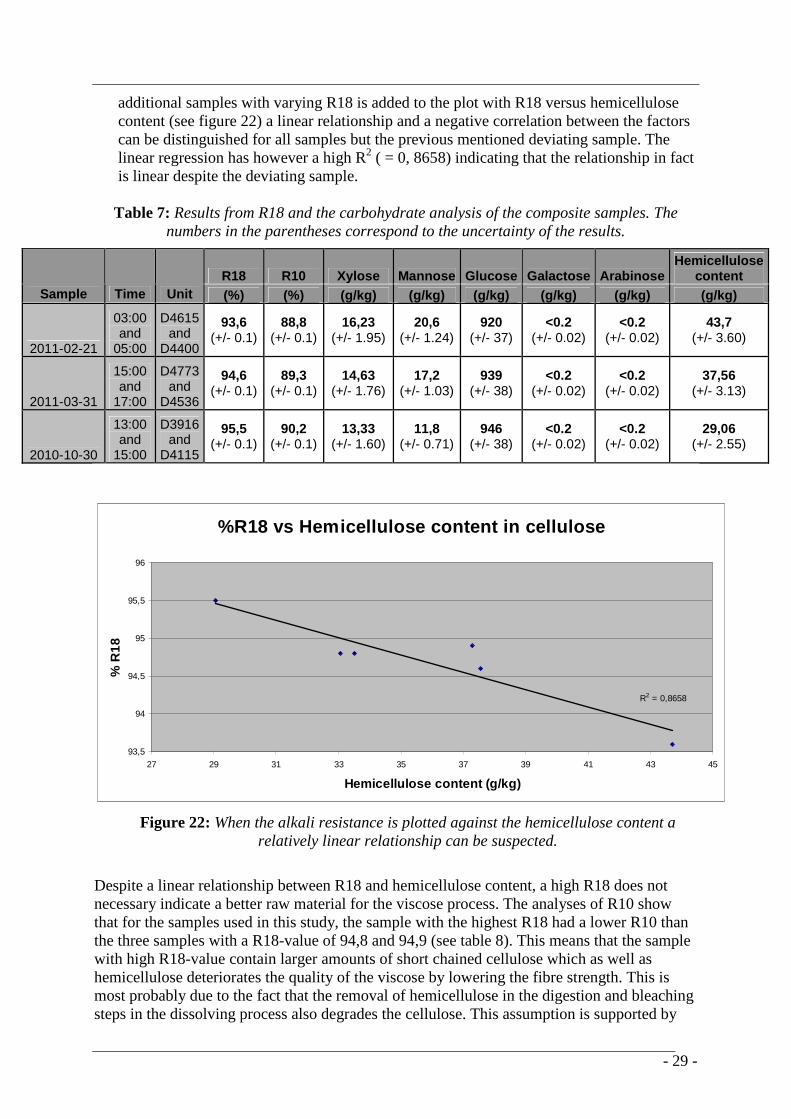
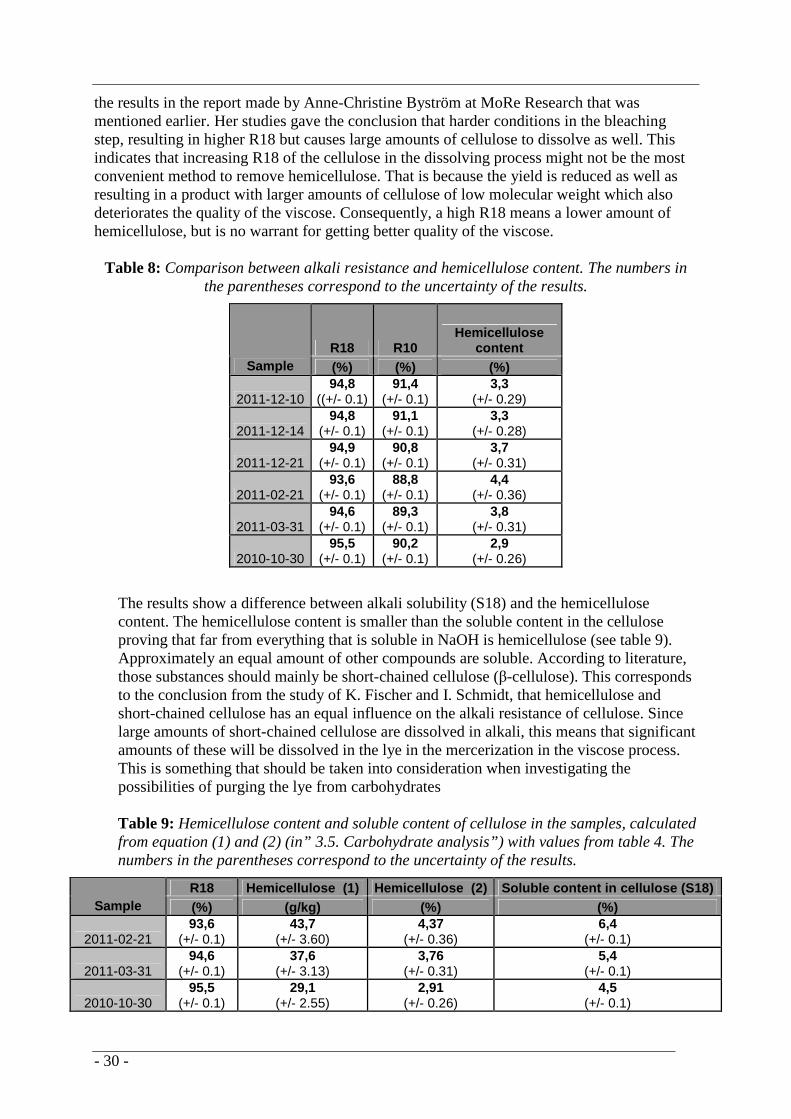
The three samples with varying R18 seem to have a linear correlation, since the hemicellulose content varies nearly just as much between the lowest R18 value and the centre point as for the highest R18 value and the centre point. The sample that has a R18 value of 94,6 % contain a slightly higher amount of hemicellulose than the three samples with similar R18 values. These three samples correspond to a negative correlation between R18 and hemicellulose content as the sample with the highest R18 contain the smallest amount of hemicellulose and the sample with lowest R18 has the highest hemicellulose content (see table 7, 8, also figure A13 in Appendix I). When these three
- 29 -
additional samples with varying R18 is added to the plot with R18 versus hemicellulose content (see figure 22) a linear relationship and a negative correlation between the factors can be distinguished for all samples but the previous mentioned deviating sample. The linear regression has however a high R2 ( = 0, 8658) indicating that the relationship in fact is linear despite the deviating sample.
Table 7: Results from R18 and the carbohydrate analysis of the composite samples. The
numbers in the parentheses correspond to the uncertainty of the results.
R18 R10 Xylose Mannose Glucose Galactose Arabinose Hemicellulose
content Sample Time Unit (%) (%) (g/kg) (g/kg) (g/kg) (g/kg) (g/kg) (g/kg)
2011-02-21
03:00 and
05:00
D4615 and
D4400
93,6 (+/- 0.1)
88,8 (+/- 0.1)
16,23 (+/- 1.95)
20,6 (+/- 1.24)
920 (+/- 37)
<0.2 (+/- 0.02)
<0.2 (+/- 0.02)
43,7 (+/- 3.60)
2011-03-31
15:00 and
17:00
D4773 and
D4536
94,6 (+/- 0.1)
89,3 (+/- 0.1)
14,63 (+/- 1.76)
17,2 (+/- 1.03)
939 (+/- 38)
<0.2 (+/- 0.02)
<0.2 (+/- 0.02)
37,56 (+/- 3.13)
2010-10-30
13:00 and
15:00
D3916 and
D4115
95,5 (+/- 0.1)
90,2 (+/- 0.1)
13,33 (+/- 1.60)
11,8 (+/- 0.71)
946 (+/- 38)
<0.2 (+/- 0.02)
<0.2 (+/- 0.02)
29,06 (+/- 2.55)
%R18 vs Hemicellulose content in cellulose
R2 = 0,8658
93,5
94
94,5
95
95,5
96
27 29 31 33 35 37 39 41 43 45
Hemicellulose content (g/kg)
% R
18
Figure 22: When the alkali resistance is plotted against the hemicellulose content a relatively linear relationship can be suspected.
Despite a linear relationship between R18 and hemicellulose content, a high R18 does not necessary indicate a better raw material for the viscose process. The analyses of R10 show that for the samples used in this study, the sample with the highest R18 had a lower R10 than the three samples with a R18-value of 94,8 and 94,9 (see table 8). This means that the sample with high R18-value contain larger amounts of short chained cellulose which as well as hemicellulose deteriorates the quality of the viscose by lowering the fibre strength. This is most probably due to the fact that the removal of hemicellulose in the digestion and bleaching steps in the dissolving process also degrades the cellulose. This assumption is supported by
- 30 -
the results in the report made by Anne-Christine Byström at MoRe Research that was mentioned earlier. Her studies gave the conclusion that harder conditions in the bleaching step, resulting in higher R18 but causes large amounts of cellulose to dissolve as well. This indicates that increasing R18 of the cellulose in the dissolving process might not be the most convenient method to remove hemicellulose. That is because the yield is reduced as well as resulting in a product with larger amounts of cellulose of low molecular weight which also deteriorates the quality of the viscose. Consequently, a high R18 means a lower amount of hemicellulose, but is no warrant for getting better quality of the viscose.
Table 8: Comparison between alkali resistance and hemicellulose content. The numbers in the parentheses correspond to the uncertainty of the results.
R18 R10 Hemicellulose
content Sample (%) (%) (%)
2011-12-10 94,8
((+/- 0.1) 91,4
(+/- 0.1) 3,3
(+/- 0.29)
2011-12-14 94,8
(+/- 0.1) 91,1
(+/- 0.1) 3,3
(+/- 0.28)
2011-12-21 94,9
(+/- 0.1) 90,8
(+/- 0.1) 3,7
(+/- 0.31)
2011-02-21 93,6
(+/- 0.1) 88,8
(+/- 0.1) 4,4
(+/- 0.36)
2011-03-31 94,6
(+/- 0.1) 89,3
(+/- 0.1) 3,8
(+/- 0.31)
2010-10-30 95,5
(+/- 0.1) 90,2
(+/- 0.1) 2,9
(+/- 0.26)
The results show a difference between alkali solubility (S18) and the hemicellulose content. The hemicellulose content is smaller than the soluble content in the cellulose proving that far from everything that is soluble in NaOH is hemicellulose (see table 9). Approximately an equal amount of other compounds are soluble. According to literature, those substances should mainly be short-chained cellulose (β-cellulose). This corresponds to the conclusion from the study of K. Fischer and I. Schmidt, that hemicellulose and short-chained cellulose has an equal influence on the alkali resistance of cellulose. Since large amounts of short-chained cellulose are dissolved in alkali, this means that significant amounts of these will be dissolved in the lye in the mercerization in the viscose process. This is something that should be taken into consideration when investigating the possibilities of purging the lye from carbohydrates Table 9: Hemicellulose content and soluble content of cellulose in the samples, calculated from equation (1) and (2) (in” 3.5. Carbohydrate analysis”) with values from table 4. The numbers in the parentheses correspond to the uncertainty of the results.
R18 Hemicellulose (1) Hemicellulose (2) Soluble content in cellulose (S18) Sample (%) (g/kg) (%) (%)
2011-02-21 93,6
(+/- 0.1) 43,7
(+/- 3.60) 4,37
(+/- 0.36) 6,4
(+/- 0.1)
2011-03-31 94,6
(+/- 0.1) 37,6
(+/- 3.13) 3,76
(+/- 0.31) 5,4
(+/- 0.1)
2010-10-30 95,5
(+/- 0.1) 29,1
(+/- 2.55) 2,91
(+/- 0.26) 4,5
(+/- 0.1)

- 31 -
5. Conclusions All the results in this study can only be considered to be valid for celluloses produced in the sulfite process using softwood as raw material, which contain low amounts of xylose and with quality parameters similar to the samples used in this study. The multiple linear regression on the data showed that all factors except the temperature have a significant influence of the total hemicellulose content in the alkali cellulose as well as in the lye and the cellulose. The study proved a clear influence from R18 on the total amount of hemicellulose continuing in the viscose process after the pressing. Variations in NaOH-concentration in the mercerization and the press factor in pressing had a significant effect on the dissolution of hemicellulose while the temperature in mercerization did not give a distinguishable impact on the total amount of dissolved hemicellulose. R18 and NaOH-concentration are negatively correlated to the total amount hemicellulose continuing in the viscose process while the press factor and the ingoing total amount of hemicellulose are positively correlated. For the total hemicellulose content in the lye from the mercerization, R18 and the press factor are negatively correlated while the NaOH-concentration has a slightly positive correlation. This shows that even though celluloses have high R18, the hemicellulose content can still be reduced remarkably by adjusting the process parameters in the first steps of the viscose process. Significant amount of hemicellulose can be removed from the cellulose in Domsjö Fabriker by choosing the right settings for mercerization and pressing. Besides, since several other factors influence the dissolution of hemicellulose in the viscose process no limitations in R18 can be determined. The separate models for the dissolution pattern of xylose and mannose showed that these are nearly identical to the one for the total hemicellulose content. The differences were the influence of temperature on the xylose content in cellulose and alkali cellulose and the insignificance of NaOH-concentration on the xylose content in the deducted lye. These results could be considered when removal of more xylose or mannose from cellulose is desired. The PLS-model from SIMCA confirmed the conclusions drawn from the MLR-analysis of the data. This model verifies that all factors but the temperature has a clear influence on the hemicellulose content in the alkali cellulose as well as in the lye and the cellulose, and the correlations between the factors and the responses are identical to the MLR-model.
The results from this study indicate a linear relationship between R18 and the hemicellulose content in cellulose from Domsjö Fabriker. The analyses also showed that the soluble content in R18 does not only contain hemicellulose but also other compounds that most probably consist of mainly cellulose with low molecular weight. This means that the soluble content is not equal to the hemicellulose content and that the actual hemicellulose content can not be determined by the R18 value alone. However from the linear relationship between R18 and hemicellulose content it can be concluded that speciality cellulose with high R18 contains lower amounts of hemicellulose than speciality cellulose with low R18. The study has proved that even though the relationship between R18 and hemicellulose content is linear, the use of speciality cellulose with high R18 value does not necessary guarantee a better viscose product. Speciality cellulose with higher R18 can still contain larger amounts of degraded cellulose with low molecular weight which causes a deterioration of fibre strength of viscose. A raise in R18 alone is therefore not a solution for improving the quality of the viscose product.
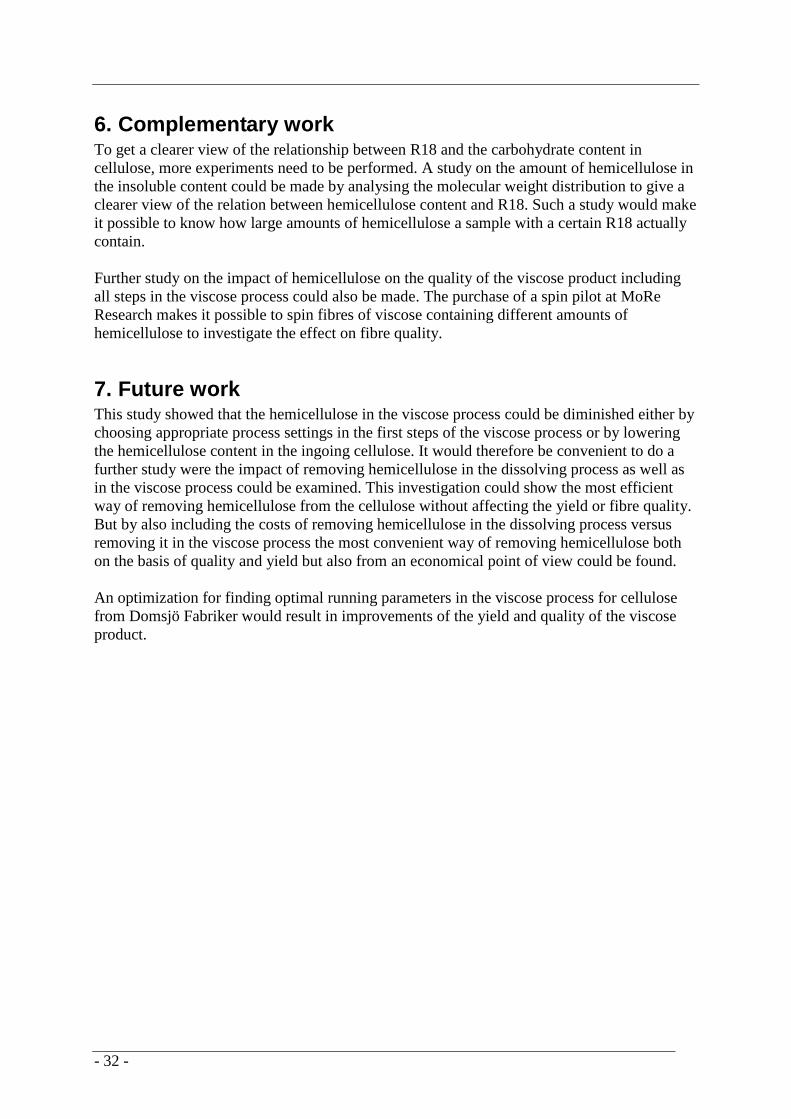
- 32 -
6. Complementary work To get a clearer view of the relationship between R18 and the carbohydrate content in cellulose, more experiments need to be performed. A study on the amount of hemicellulose in the insoluble content could be made by analysing the molecular weight distribution to give a clearer view of the relation between hemicellulose content and R18. Such a study would make it possible to know how large amounts of hemicellulose a sample with a certain R18 actually contain. Further study on the impact of hemicellulose on the quality of the viscose product including all steps in the viscose process could also be made. The purchase of a spin pilot at MoRe Research makes it possible to spin fibres of viscose containing different amounts of hemicellulose to investigate the effect on fibre quality.
7. Future work This study showed that the hemicellulose in the viscose process could be diminished either by choosing appropriate process settings in the first steps of the viscose process or by lowering the hemicellulose content in the ingoing cellulose. It would therefore be convenient to do a further study were the impact of removing hemicellulose in the dissolving process as well as in the viscose process could be examined. This investigation could show the most efficient way of removing hemicellulose from the cellulose without affecting the yield or fibre quality. But by also including the costs of removing hemicellulose in the dissolving process versus removing it in the viscose process the most convenient way of removing hemicellulose both on the basis of quality and yield but also from an economical point of view could be found. An optimization for finding optimal running parameters in the viscose process for cellulose from Domsjö Fabriker would result in improvements of the yield and quality of the viscose product.
- 33 -
8. Acknowledgements I would like to thank all the great people of Domsjö Fabriker who has, by being friendly, helpful and obligingly, made my time during this master’s thesis both interesting and enjoyable. Special thanks to: Dr Kristina Elg Christoffersson and Magnus Lundmark at Domsjö Fabriker for giving me the opportunity to do this degree project at DomInnova. My supervisor Maria Wallenius at DomInnova, Domsjö Fabriker your all your help, guidance and support. Dr Roland Agnemo, Peter Strunk and Anna Svedberg for taking time to answer my questions, help for finding solutions to problems and also discussions of the final results. Curt Hägglund, Nadine Hollinger at MoRe Research for help and guidance regarding the viscose micro plant and Christina Wedin, MoRe Research for help with analyses and for answering to my questions. The laboratory shift workers at Domsjö Fabriker for help with the R18-analysis as well as showing patience when I occupied parts of the laboratory while running my analyses. Jörgen Hellström and Roger Hellström for answering questions regarding production, daily routines at Domsjö Fabriker, the mill and its process and for showing grate support. Kristina, Maria, Roland, Peter, Anna, Erik, Fredrik and Hans at DomInnova for making me feel like a member of your group. Solomon Tesfalidet, my supervisor at Umeå University for support and guidance.

- 34 -
References [1] Internal document Domsjö Fabriker, Basic education certification- Wood and fibre [2] Internal document Domsjö Fabriker, Företagspresentation Domsjö (eng) [3] Verbal information from Dr Kristina Elg Christoffersson, Domsjö Fabriker [4] Elg, Christoffersson, Kristina. 2005. Dissolving pulp- Multivariate Characterisation and Analysis of Reactivity and Spectroscopic Properties. Diss. Umeå University. Umeå: Umeå Universities [5] Fischer K., Schmidt I. 2008. Hemicellulose in Dissolving Pulp and its Behaviour during its Processing to Viscose. Macromolecular Symposia 262: 85-88 [6] Sjöström, Eero., 1993. Wood Chemistry: Fundamentals and Applications [7] Lindman, Björn., Karlström, Gunnar., Stigsson, Lars. 2010. On the mechanism of dissolution of cellulose. Journal of Molecular Liquids 156: 76-81. [8] Internal document Domsjö Fabriker, ”Basic education certification- Domsjö Fermentation” [9] Raymond A. Young., Roger M. Rowell. 1986. Cellulose: Structure, Modification and Hydrolysis [10] Kvarnlöf, Niklas. 2007. Activation of dissolving pulps prior to viscose preparation. Diss., Karlstads University Studies. Karlstad: Karlstad University [11] Klemm, D., Heublein, B., Fink, H., and Bohn, A. Cellulose: Fascinating Bipolymer/Sustaniable Raw Material (28 April 2005) http://www.wavesignal.com/cellulose.htm (Collected 2012-01-25) [12] FiberSource (2011). Cellulose. http://www.fibersource.com/f-tutor/cellulose.htm (Collected 2011-11-14) [13] Lundmark, Magnus., PM alfa, beta och gamma [14] Internal document MoRe Research, “Kolhydrater” [15] Internal document Domsjö Fabriker, ”Basic education certification- Domsjö wood yard and wood room” [16] Internal document Domsjö Fabriker, ”Basic education certification- Domsjö Digestion” [17] Internal document Domsjö Fabriker, ”Basic education certification- Domsjö Bleaching”
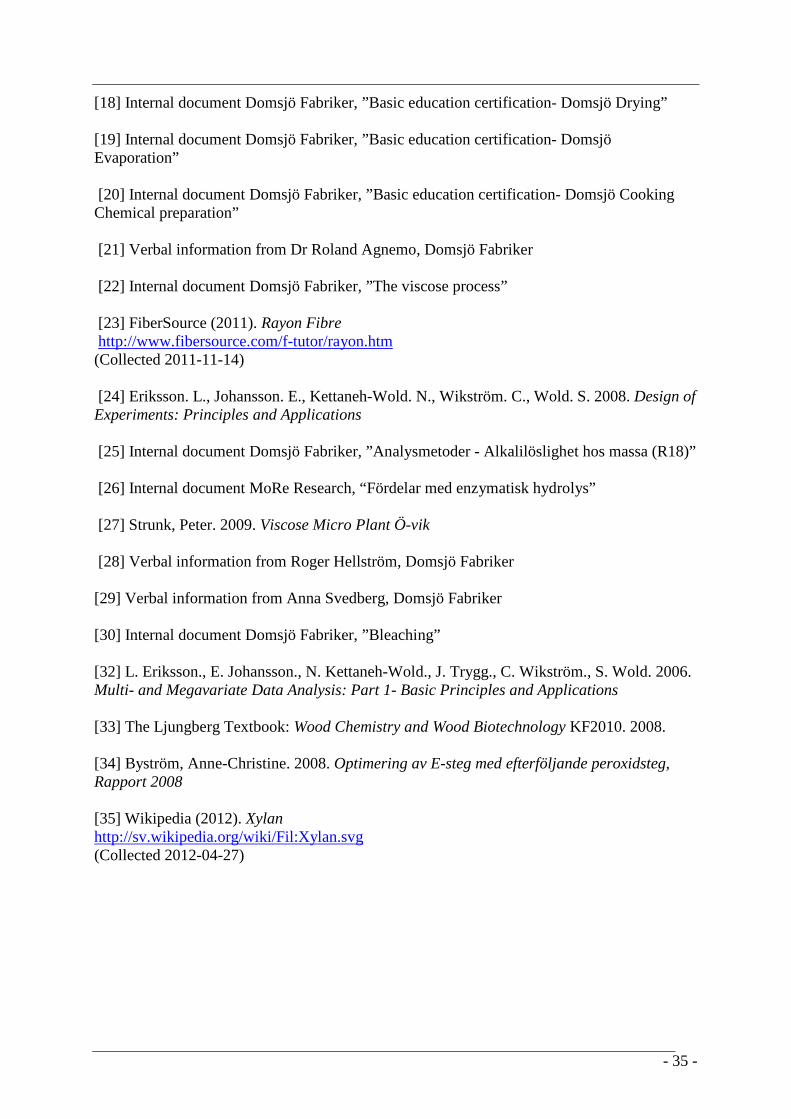
- 35 -
[18] Internal document Domsjö Fabriker, ”Basic education certification- Domsjö Drying” [19] Internal document Domsjö Fabriker, ”Basic education certification- Domsjö Evaporation” [20] Internal document Domsjö Fabriker, ”Basic education certification- Domsjö Cooking Chemical preparation” [21] Verbal information from Dr Roland Agnemo, Domsjö Fabriker [22] Internal document Domsjö Fabriker, ”The viscose process” [23] FiberSource (2011). Rayon Fibre http://www.fibersource.com/f-tutor/rayon.htm (Collected 2011-11-14) [24] Eriksson. L., Johansson. E., Kettaneh-Wold. N., Wikström. C., Wold. S. 2008. Design of Experiments: Principles and Applications [25] Internal document Domsjö Fabriker, ”Analysmetoder - Alkalilöslighet hos massa (R18)” [26] Internal document MoRe Research, “Fördelar med enzymatisk hydrolys” [27] Strunk, Peter. 2009. Viscose Micro Plant Ö-vik [28] Verbal information from Roger Hellström, Domsjö Fabriker [29] Verbal information from Anna Svedberg, Domsjö Fabriker [30] Internal document Domsjö Fabriker, ”Bleaching” [32] L. Eriksson., E. Johansson., N. Kettaneh-Wold., J. Trygg., C. Wikström., S. Wold. 2006. Multi- and Megavariate Data Analysis: Part 1- Basic Principles and Applications [33] The Ljungberg Textbook: Wood Chemistry and Wood Biotechnology KF2010. 2008. [34] Byström, Anne-Christine. 2008. Optimering av E-steg med efterföljande peroxidsteg, Rapport 2008 [35] Wikipedia (2012). Xylan http://sv.wikipedia.org/wiki/Fil:Xylan.svg (Collected 2012-04-27)

A
Appendix I
Table A1: The values of R18, viscosity, amount of added Visco-388, resin content and brightness for the chosen samples, all values were picked out from WinMOPS, except for R18 which is the results from the analyses in this project.
Date Time Line R18 (%)
Viscosity (ml/g)
Visco-388 (kg/t)
Resin (%)
Brightness (% ISO)
2011-12-10 21:00 1 94,8 529 1 0,13 91,6
2011-12-14 21:00 1 94,8 510 1 0,11 91,1
2011-12-21 03:00 3 94,9 524 1 0,12 92,1
Table A2: The values of R18, viscosity, amount of added Visco-388, resin content and brightness for the chosen samples, all values were picked out from WinMOPS, except for R18 which is the results from the analyses in this project.
Date Time Line R18 (%)
Viscosity (ml/g)
Visco-388 (kg/t)
Resin (%)
Brightness (% ISO)
2011-02-21 3.00 3 93,6 567 1 0,12 91,1
2011-03-31 15:00 3 94,6 552 1 0,11 92,4
2010-10-30 15:00 3 95,7 546 1 0,1 92,4
Table A3: Samples selected to be included in the three composite samples.
Composite sample name: Time for included samples:
Line for included samples: Quality
2010-10-30 15:00 1 D3916
15:00 2 D3916
15:00 3 D4115
17:00 3 D4115
2011-02-21 03:00 1 D4400
03:00 3 D4615
05:00 1 D4400
05:00 3 D4615
2011-03-31 13:00 3 D4773
15:00 1 D4536
15:00 2 D4536
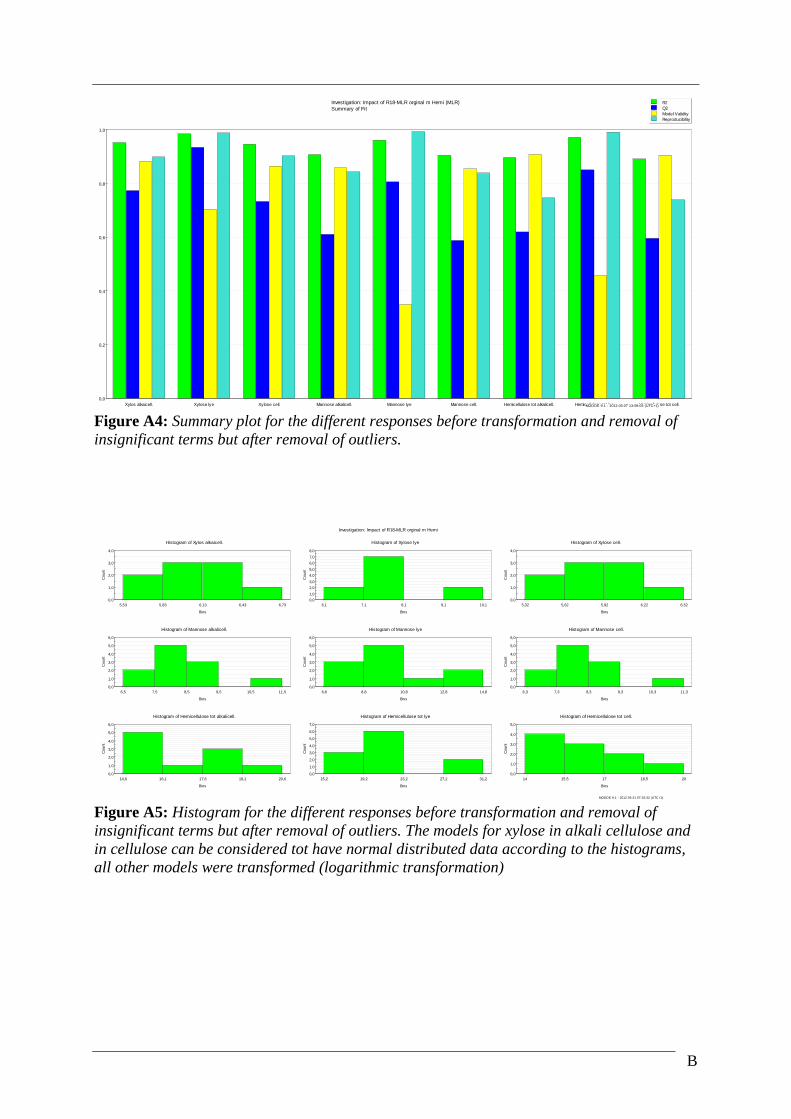
B
0,0
0,2
0,4
0,6
0,8
1,0
Xylos alkaicell. Xylose lye Xylose cell. Mannose alkalicell. Mannose lye Mannose cell. Hemicellulose tot alkalicell. Hemicellulose tot lye Hemicellulose tot cell.
Investigation: Impact of R18-MLR orginal m Hemi (MLR)Summary of Fit
R2Q2Model ValidityReproducibility
MODDE 9.1 - 2012-03-07 13:09:05 (UTC+1) Figure A4: Summary plot for the different responses before transformation and removal of insignificant terms but after removal of outliers.
0,0
1,0
2,0
3,0
4,0
5,53 5,83 6,13 6,43 6,73
Cou
nt
Bins
Histogram of Xylos alkaicell.
0,0
1,0
2,0
3,0
4,0
5,0
6,0
7,0
8,0
6,1 7,1 8,1 9,1 10,1
Cou
nt
Bins
Histogram of Xylose lye
0,0
1,0
2,0
3,0
4,0
5,32 5,62 5,92 6,22 6,52
Cou
nt
Bins
Histogram of Xylose cell.
0,0
1,0
2,0
3,0
4,0
5,0
6,0
6,5 7,5 8,5 9,5 10,5 11,5
Cou
nt
Bins
Histogram of Mannose alkalicell.
0,0
1,0
2,0
3,0
4,0
5,0
6,0
6,8 8,8 10,8 12,8 14,8
Cou
nt
Bins
Histogram of Mannose lye
0,0
1,0
2,0
3,0
4,0
5,0
6,0
6,3 7,3 8,3 9,3 10,3 11,3
Cou
nt
Bins
Histogram of Mannose cell.
0,0
1,0
2,0
3,0
4,0
5,0
6,0
14,6 16,1 17,6 19,1 20,6
Cou
nt
Bins
Histogram of Hemicellulose tot alkalicell.
0,0
1,0
2,0
3,0
4,0
5,0
6,0
7,0
15,2 19,2 23,2 27,2 31,2
Cou
nt
Bins
Histogram of Hemicellulose tot lye
0,0
1,0
2,0
3,0
4,0
5,0
14 15,5 17 18,5 20
Cou
nt
Bins
Histogram of Hemicellulose tot cell.
Investigation: Impact of R18-MLR orginal m Hemi
MODDE 9.1 - 2012-03-21 07:33:32 (UTC+1) Figure A5: Histogram for the different responses before transformation and removal of insignificant terms but after removal of outliers. The models for xylose in alkali cellulose and in cellulose can be considered tot have normal distributed data according to the histograms, all other models were transformed (logarithmic transformation)
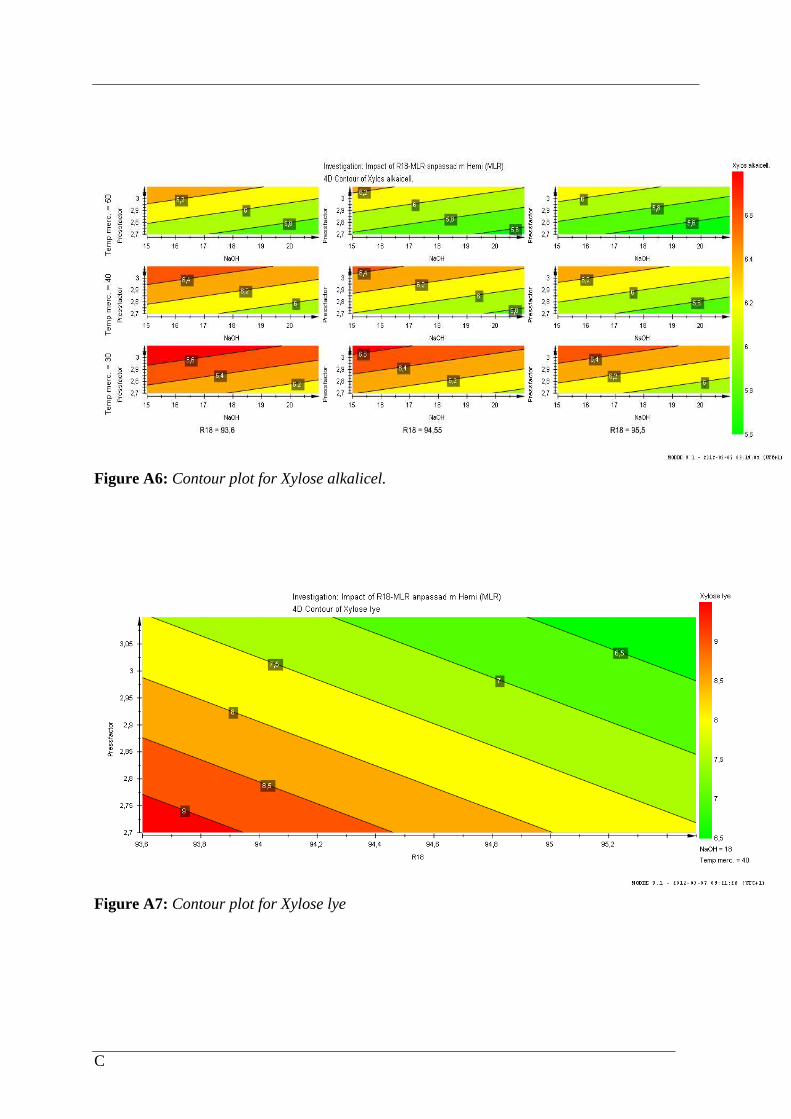
C
Figure A6: Contour plot for Xylose alkalicel.
Figure A7: Contour plot for Xylose lye
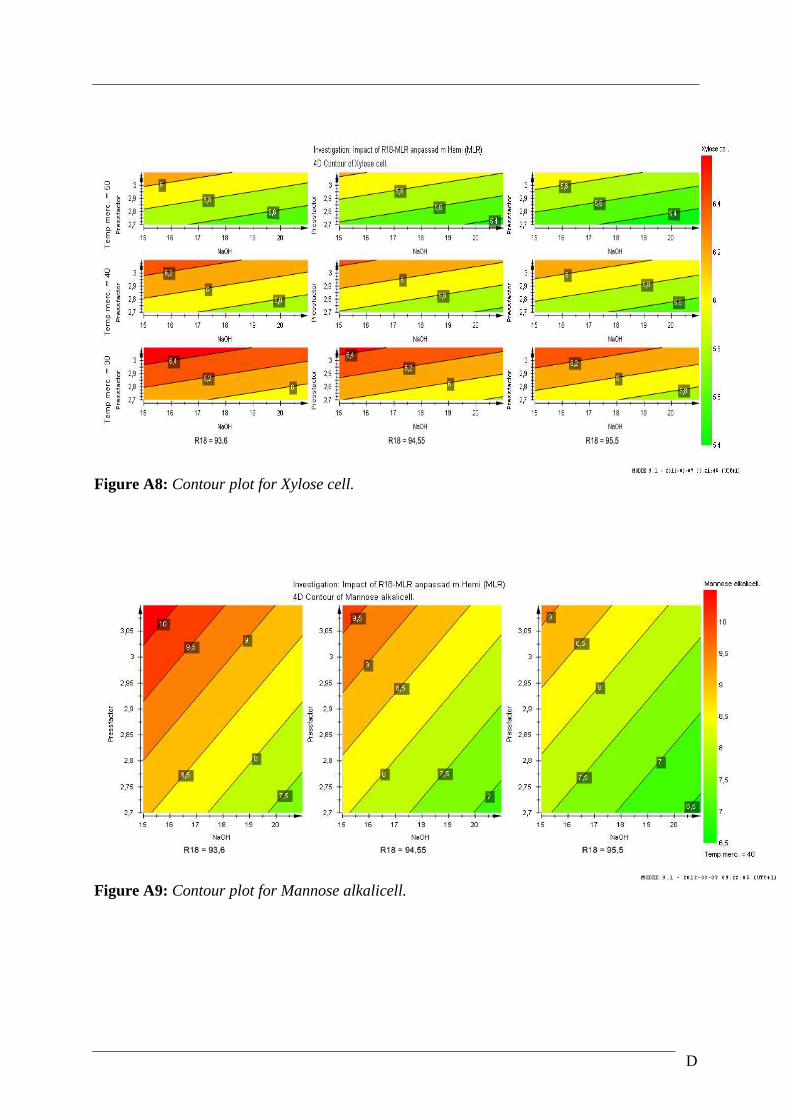
D
Figure A8: Contour plot for Xylose cell.
Figure A9: Contour plot for Mannose alkalicell.
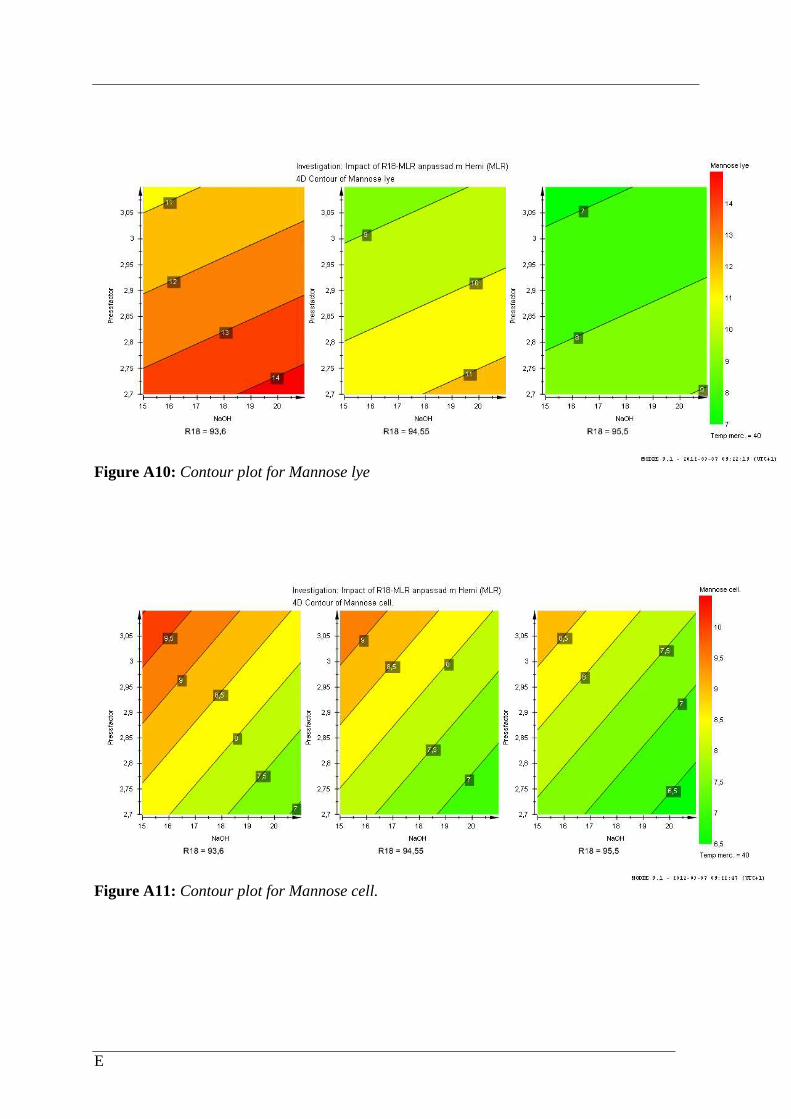
E
Figure A10: Contour plot for Mannose lye
Figure A11: Contour plot for Mannose cell.
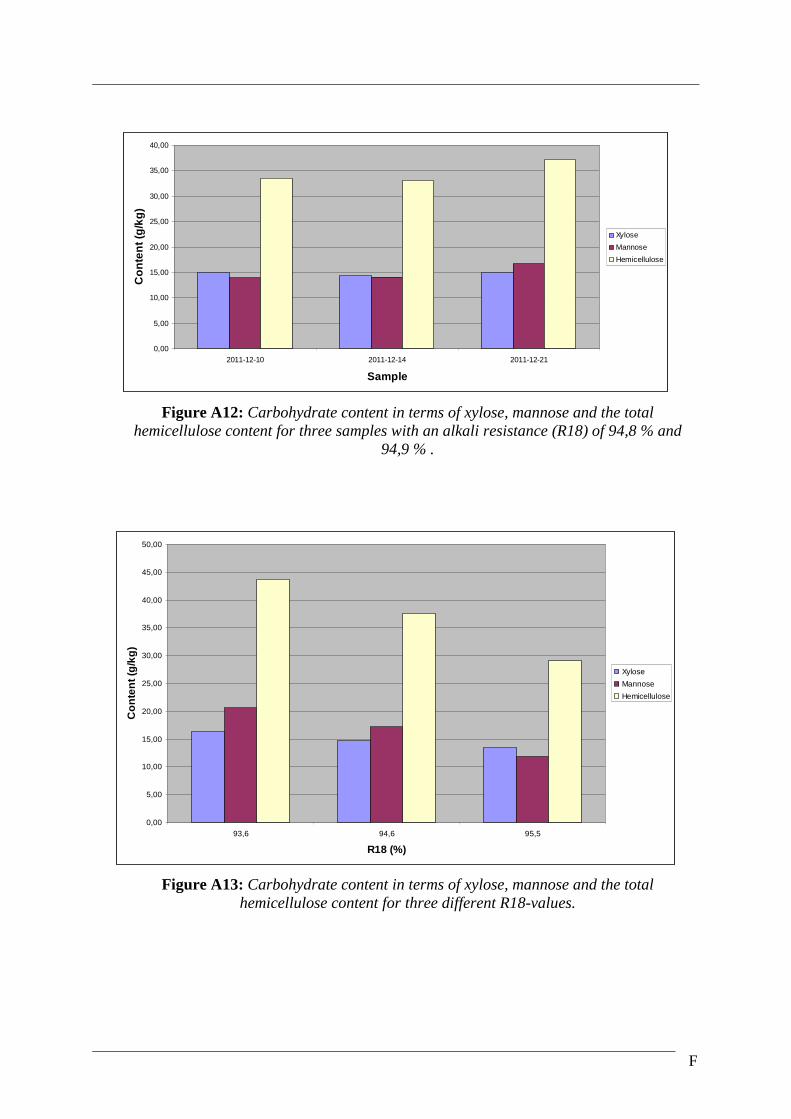
F
0,00
5,00
10,00
15,00
20,00
25,00
30,00
35,00
40,00
2011-12-10 2011-12-14 2011-12-21
Sample
Co
nte
nt (
g/k
g)
Xylose
Mannose
Hemicellulose
Figure A12: Carbohydrate content in terms of xylose, mannose and the total hemicellulose content for three samples with an alkali resistance (R18) of 94,8 % and
94,9 % .
0,00
5,00
10,00
15,00
20,00
25,00
30,00
35,00
40,00
45,00
50,00
93,6 94,6 95,5
R18 (%)
Co
nte
nt (
g/k
g)
Xylose
Mannose
Hemicellulose
Figure A13: Carbohydrate content in terms of xylose, mannose and the total hemicellulose content for three different R18-values.

G
Appendix II Refinement of MLR-models for all responses in MODDE:
1. Observation 6 is excluded from the models for xylose in alkali cellulose and cellulose and for total hemicellulose in alkali cellulose and cellulose. Observation 9 is also excluded from the models for xylose in alkali cellulose and cellulose.
2. The model for xylose in lye and all models for mannose and total hemicellulose is
transformed (logarithmic transformation).
3. The insignificant terms is removed for every response. Terms that are insignificant but influential on the predictability in the model is however kept. The terms that were removed were Temperature and NaOH-concentration for xylose in lye and the Temperature was removed in all models for mannose and hemicellulose.
4. All models can now be considered valid and can be used for prediction.


Department of Chemistry S-901 87 Umeå, Sweden Telephone +46 90 786 50 00 Text telephone +46 90 786 59 00 www.umu.se