virtual energy assessments project report
TRANSCRIPT

Contact
Wattblock
Suite 6, Level 1
10 Pittwater Rd
Manly NSW 2095
Phone: +61 (2) 9977 1801
Virtual Energy AssessmentsProject Report
Prepared for:
City of Sydney
Date: 31/01/16
TABLE OF CONTENTS
Customer Support: (02) 9977 1801
Page 1
Executive Summary 2
Introduction 3
Project Overview 6
Participant Data Analysis 12
Extrapolated Results 20
Survey Responses 23
Wattblock Report Design 28
Conclusions 34
Acknowledgements 37

EXECUTIVE SUMMARY
Customer Support: (02) 9977 1801
Page 2
* Over 75% of residents in the City of Sydney live in residential strata
* City of Sydney has over 1,650 apartment buildings
* Strata committees underestimate electricity savings, guessing 17% savings possible with 7 year payback
* This project has shown 45% savings possible with 3.6 year payback across tariff and energy efficiency
* Data analytics can lower the cost of mobilising strata committees on energy saving
* Apartment building dimensions, energy billing, product data, installation costs, maintenance costs, product lifespan & geo-location are key data inputs
* Electricity savings of $338 per apartment p.a. possible
* Average apartment property valuation increase of $8,500 following energy saving
* Sustainable Sydney 2030 target of 70% carbon emission reduction can be achievedin existing residential buildings, retrofitting existing solutions
* Potential to reduce carbon emissions in residential strata of 393,000 tonnes p.a., equivalent to taking 90,350 cars off the road

Virtual Energy Assessments Project
Project Objectives
Strategic Fit
About Wattblock
Introduction

INTRODUCTION
Virtual Energy Assessment Project
On the 19th of July 2015, Wattblock was engaged by the City of Sydney to run a “Virtual Energy Assessments” project to investigate the use of data benchmarking for residential energy efficiency assessment. Via the project, 10 residential apartment buildings were engaged to receive a Wattblock Virtual Energy Assessment report for their building. Participant buildings were selected to cover a cross section of building size, demographics and representation across different suburbs within the City of Sydney.
Project Objectives
The principle objective of the City of Sydney ‘”Virtual Energy Assessments” project is to investigate the merits of utilising data benchmarking based reporting. This is underpinned by an interest in lowering the costs of promoting awareness and mobilising action on energy efficiency in apartment buildings and potentially other sectors. A lower cost solution will enable a broader reach to engage and mobilize apartment buildings.
Add Value:Wattblock Reports enable council to offer apartment buildings immediate value.
Maximise Reach:Low cost energy benchmarking allows greater reach in educating, generating awareness and motivating action.
Fast-track Decision Process:Wattblock Reports help buildings with high-level prioritisation of projects to aid the decision process.
More Case Studies:Wattblock provides an engagement channel for council to develop case studies and deploy incentives.
More Data:Higher reach and participation inform future benchmarking standards and recognition schemes.
Community Relations:Adding immediate value creates engagement to build upon with further initiatives.
Customer Support: (02) 9977 1801
Page 4
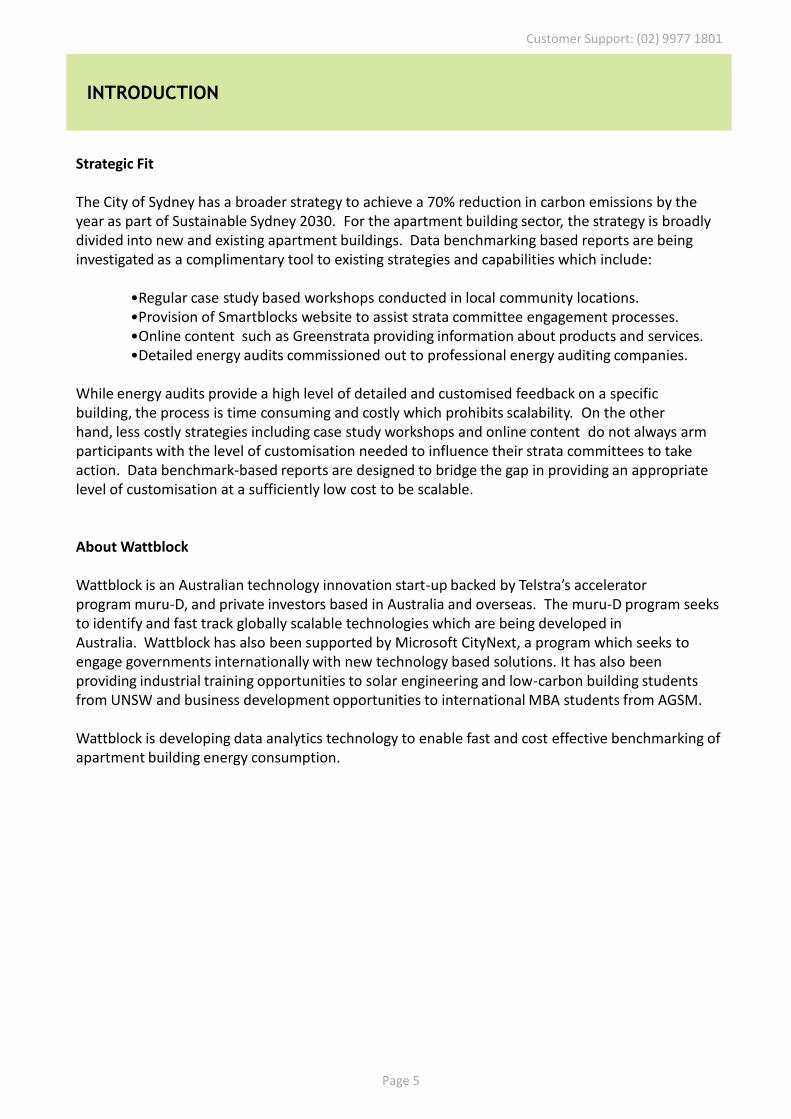
Strategic Fit
The City of Sydney has a broader strategy to achieve a 70% reduction in carbon emissions by the year as part of Sustainable Sydney 2030. For the apartment building sector, the strategy is broadly divided into new and existing apartment buildings. Data benchmarking based reports are being investigated as a complimentary tool to existing strategies and capabilities which include:
•Regular case study based workshops conducted in local community locations.•Provision of Smartblocks website to assist strata committee engagement processes.•Online content such as Greenstrata providing information about products and services.•Detailed energy audits commissioned out to professional energy auditing companies.
While energy audits provide a high level of detailed and customised feedback on a specific building, the process is time consuming and costly which prohibits scalability. On the other hand, less costly strategies including case study workshops and online content do not always arm participants with the level of customisation needed to influence their strata committees to take action. Data benchmark-based reports are designed to bridge the gap in providing an appropriate level of customisation at a sufficiently low cost to be scalable.
About Wattblock
Wattblock is an Australian technology innovation start-up backed by Telstra’s accelerator program muru-D, and private investors based in Australia and overseas. The muru-D program seeks to identify and fast track globally scalable technologies which are being developed in Australia. Wattblock has also been supported by Microsoft CityNext, a program which seeks to engage governments internationally with new technology based solutions. It has also been providing industrial training opportunities to solar engineering and low-carbon building students from UNSW and business development opportunities to international MBA students from AGSM.
Wattblock is developing data analytics technology to enable fast and cost effective benchmarking of apartment building energy consumption.
INTRODUCTION
Customer Support: (02) 9977 1801
Page 5
Participant Data Sample
Benchmarking Data Sample
Participant Engagement Process
Participant Survey Results
Virtual Energy Assessment Report Design
Technologies Selected for Inclusion
Data Benchmarking Results
Project Overview

PROJECT OVERVIEW
Participant Data Sample
Participant buildings were selected to include a range of different building types as well as representative demographics and a cross section across different suburbs within the City of Sydney. Buildings aged between 8 and 50 years were included in the project.
Participant buildings were divided into Low Rise, Mid Rise, and High Rise based on the number of floors. Consistent with ABS definitions, Low Rise is classified as 1-3 floors, Mid Rise 4-8 floors, and High Rise as anything above 8 floors. It is noted that 10 buildings is a small sample size and in particular there is only 1 building in the Low Rise classification.
Other definitions of High Rise have been used by City of Sydney with a lower number of floors. Wattblock has adopted the ABS definition because there are more distinct characteristics identifiable in buildings above 8 floors. In particular the presence of common area leisure facilities like swimming pools and spas are more typical in buildings with more than 8 residential levels.
Building: Suburb Block size: Residential
levels:
Number of
units
Number of
residents:
Age (Years)
1 ALEXANDRIA MID 4 31 60 11 to 20
2 CAMPERDOWN MID 5 114 219 11 to 20
3 CHIPPENDALE LOW 3 8 15 11 to 20
4 GLEBE MID 6 43 83 0 to 10
5 GLEBE HIGH 12 120 230 41 to 50
6 PYRMONT MID 7 20 38 0 to 10
7 SURRY HILLS MID 4 29 56 11 to 20
8 SYDNEY HIGH 12 127 244 11 to 20
9 SYDNEY HIGH 20 40 77 21 to 30
10 SYDNEY HIGH 31 120 230 21 to 30
Participants generally indicated that their building residents had a diversity of ages and ethnicity. 33% of buildings were suspected to have Air BnB or other commercial activity within the residential block.
Benchmarking Data Sample
While 10 buildings have been selected for participation in the Wattblock Virtual Energy Assessment project, a broader data set is being collected to inform data benchmarking analytics. With assistance from the UNSW intern program, Wattblock has gathered data on approximately one third of all 1,650 apartment buildings within the City of Sydney.
LOW RISE: 1-3 levels MEDIUM RISE: 4-8 levels HIGH RISE: 9+ levels
Customer Support: (02) 9977 1801
Page 7

Participant Engagement Process
*Initial registrations of interest*Surveys conducted with the participant to collect demographic and behavioural data*Buildings selected to represent an initial cross section*Disclosure agreements signed for participation*Energy bills collected from strata managers*Collection of high level building metadata required to run benchmarking*Site visits to participant buildings to observe any peculiarities*UNSW students engaged to assist with technology research*Report scope designed and tested*Customised reports provided to participant contacts for distribution to their strata committees*Follow up contact to gauge effectiveness of reports and collect feedback
Participant Survey Results
Wattblock surveyed 15 applicants for participation in the Virtual Assessments Project. Results of the survey are summarised in the Survey Responses section of the report. Most of the applicants were members of the Executive Committee for their building, with more than half holding the positions of Chairperson, Secretary or Treasurer. On average, the respondents owned their unit for 6.1 years and represented on their committee for 5.3 years.
Respondents were generally happy with the management of the building with 53% of buildings having an onsite building manager.
Respondents generally felt that their committee was also effective. The results suggest greater satisfaction with managing cleaning and maintenance and the least satisfaction with water efficiency. Energy efficiency management was viewed slightly more positively than negatively on balance.
Wattblock gauged perceptions about energy efficiency in advance of providing the participants with the Wattblock Virtual Energy Assessment. On average, energy efficiency initiatives were perceived as being able to offer up to 17.3% reduction on energy bills with an average payback of 7.5 years. Wattblock believes this shows most committee members under estimate the value and financial returns of energy efficiency and that this is likely to lead to lower prioritisation being given to investment in energy efficiency.
Overall the respondents indicated that energy efficiency initiatives were likely to be approved in general. Indicatively, the main barriers for gaining approvals were likely to be availability of funding and lack of awareness and information. There is strong indication that providing estimates of costs and savings and guidance on where to start are key to mobilising the committee to approve energy efficiency initiatives.
PROJECT OVERVIEW
Customer Support: (02) 9977 1801
Page 8

The following layout and design principles were applied:- Minimizing the number of pages- Logical flow and structure- Minimizing the use of technical jargon- Use of text and data visualisation (graphs) to convey key messages- Everything in dollar terms with financial payback and valuation impacts- Guide the committee to pursue projects in a logical order- Avoid specific recommendation of any particular product or service providers- Highlight environmental statistics and contribution toward Sustainable Sydney 2030 targets- Highlight areas that will deliver the greatest dollar cost impact on carbon emissions
For this reason the first page of the report highlights at the top of the page the overall financial case for areas which can deliver the fastest payback and which are the logical 'next best step' for the committee to consider. Tariff optimisation and energy efficiency initiatives across a number of areas are grouped together in this section while solar power and microgrid investments are not.
It is in the best interests of strata to first complete energy efficiency initiatives in the building before investigating solar power. By completing energy efficiency and tariff optimisation first, the committee will avoid investing in an oversized solar power system and they will be able to better judge the financial case for solar.
Regardless of this, the solar energy analysis is provided based on the projected energy consumption profile of the building after energy efficiency. In some cases the strata committee may be interested in proceeding with solar energy investment prior to the completion of energy efficiency. Therefore it was deemed more useful for strata committees, and in their best interests, to provide the solar energy analysis based on projected load post-energy efficiency rather than based on their current energy consumption.
Report FeedbackInitial feedback from participant buildings and internal review with City of Sydney include:- Provide more specific recommendations- Provide specific product and supplier advice- Provide more detailed guidelines for the committee on how best to proceed- Include more information about relevant financial incentives- Greater focus on common areas and less focus on apartments- Layout and content suggestions to improve clarity- Include impact on strata levies for an average apartment
Virtual Energy Assessment Report Design
The Wattblock Virtual Energy Assessment Report has been designed to provide relevant information about the building that is easily understood by a strata committee. The primary objective is to achieve rapid and clear communication of the specific financial and environmental impact of energy consumption in their building. A more detailed description of each page of the report is contained in the Report Design section
PROJECT OVERVIEW
Customer Support: (02) 9977 1801
Page 9

Technologies Selected for Inclusion
Following field research around the typical needs of apartment buildings and energy related technologies currently available, the following were selected for inclusion in the City of Sydney Virtual Energy Assessments project.
Tariff OptimisationUtilising data capture from billing files and public government databases Wattblock is able to quickly determine whether or not the building is spending more than they need to for energy supply and whether or not the type of meter and tariff is appropriate. There are many providers offering power from renewable energy sources at highly competitive prices and superior data services for better on-going power management.
Energy EfficiencyWattblock has collected benchmark data on a range of products across lighting, mechanical, HVAC, water, and leisure facilities like swimming pools, spas and saunas. Almost universally, LED lighting is of immediate benefit to building common areas and usually represents the fastest return on investment. Following LED lighting, big areas for savings often include use of variable speed ventilation fans, pool filters, timers, controls and sensors on water pumps, ventilation, lighting, and air conditioning. There are many different vendors across these kinds of technologies and they are generally competitively priced, although quality can vary.
Solar PowerResidential strata buildings are a largely untapped market for solar PV energy solutions, which are a very mature and cost effective technology in the Australian market. There are many vendors with competitive pricing although there is a large range in quality. Solar PV energy also readily lends itself to data benchmarking techniques for high level assessment. Competing dynamics are primarily available roof space and the energy usage profile of common area power supply. Combined with weather data, a high level assessment of Solar PV viability can be determined.
Microgrid or Embedded Electrical NetworksWhile a more challenging proposition for a strata building to implement, a Microgrid or Embedded Electrical Network has been included due the size of the financial benefits that can be achieved and due to the ability of the strata committee to subsequently manage the energy footprint of the entire building. A Microgrid involves installing a gate meter, which provides power not only to the building common areas, but also into the apartments. This means that power supply can be negotiated on behalf of all owners and tenants for a much lower cost. It also opens the opportunity of utilising more renewable energy sources. While this is included to start committees thinking about this possibility, it is expected that such investment will take a while to approve.
Excluded TechnologiesWattblock investigated a number of other technologies including batteries, electric vehicle recharge, lift replacement, power factor correction, solar hot water heating, co-generation and tri-generation technologies. There were various reasons for not including these technologies at the time including maturity of the technology, commercial viability, investment economics and having sufficient benchmarking data. Following completion of the City of Sydney project, batteries have become a feasible addition to the Wattblock Virtual Energy Assessment including interrelation with Solar PV Energy and Microgrid.
PROJECT OVERVIEW
Customer Support: (02) 9977 1801
Page 10

Data Benchmarking Results
Wattblock Virtual Energy Assessments reports were provided to the ten participant buildings. The reports identify potential for cost and energy savings and CO2 emissions reductions through a roadmap of energy savings initiatives. Initiatives include tariff optimisation, common area energy efficiency, solar energy and microgrid. The roadmap priority is based on financial payback and lowest-cost carbon abatement outcomes for owners.
The reports identify an average of $72,787 in annual energy cost savings per block across all included initiatives. This represents an average 68% reduction in grid-energy import and CO2
equivalent emissions. Considering only savings available from tariff optimisation, energy efficiency and solar installation, annual common-area energy cost savings averaged 45%.
LOW RISE MEDIUM RISE HIGH RISE
PR
E-IN
ITIA
TIV
ESEN
ERG
Y C
OST
SP
OST
-IN
ITIA
TIV
ES
ENER
GY
CO
STS
100% 100% 100%
89% 64% 52%
` APARTMENTSCOMMON AREA
The Wattblock reports highlight Tariff Optimisation and Energy Efficiency for common areas as offering the fastest financial payback with an average of 3.6 years. Subsequent solar energy investment has a longer payback.
The average valuation impact of tariff, energy efficiency and solar initiatives is estimated at $8,498 per unit across the 10 participant buildings.
Extrapolating these savings from a scope of ten buildings to the whole City of Sydney apartment sector demonstrates an energy cost savings opportunity of $25m p.a.
PROJECT OVERVIEW
Customer Support: (02) 9977 1801
Page 11

Average Energy and Emission Reduction Potential
Cost Reduction Potential
Emissions Reduction Potential
Average Common Area Energy Consumption
Recommended Next Steps
Payback Period
Solar Energy Potential
Valuation Impact
Participant Data Analysis

Customer Support: (02) 9977 1801
Better outcomes for
low to medium rise
blocks are to be
expected due to the
large component that
common-area lighting
contributes to their
load (see graph).
Efficiency upgrades
are highly effective
in reducing energy
costs and emissions.
Wattblock has outlined total solar potential of 306.6 kW across the ten buildings selected. Coupled with tariff optimisation and improved energy efficiency, total potential CO2 abatement is estimated to be 3,948 tonnes per year, or an equivalent 908 cars removed from the road per annum. This represents an average CO2 emission reduction per building of 68%, and an average contribution of 97% towards the 2030 City of Sydney CO2 emission reduction target of 70% [1].
The total number of apartment residents that will benefit from these savings is estimated at 1,252, or 0.8% of the entire City of Sydney apartment-residing population [2,3].
AVG. ENERGY AND EMISSION
REDUCTION POTENTIAL
Averages: LOW RISE MEDIUM
RISE
HIGH RISE Overall
Average
Common area energy cost reduction 56% 47% 38% 45%
CO2 emission abatement 80% 74% 56% 68%
Contribution to City of Sydney 2030 emission
reduction target
114% 106% 81% 97%
TOTAL ANNUAL EMISSION REDUCTION
EQUIVALENT EMISSIONS
tonnes/yr CO2
abated
cars/yr removed from road
RESIDENTS IMPACTED
CITY of SYDNEY APARTMENT POPULATION REACHED [2,3]
0.8%
Page 13
3948 908
City of Sydney 2030
CO2 emission reduction
target: 70%.
56%
80%
114%
47%
74%
106%
38%
56%
81%
Energy Cost Reduction: CO2-e Emission Reduction: Sydney 2030 Emission Target Contribution:
LOW RISE
MEDIUM RISE
HIGH RISE
1252

T A R I F F E F F I C I E N C Y S O L A R M I C R O G R I D
Tariff
Efficiency
Solar
Micro Grid
CUMMULATIVEAVG. COMMON
ENERGY COST
SAVINGS
$9,610
$21,790$25,641
$72,787
COST REDUCTION POTENTIAL
On average, common-area energy savings of $72,787 per block per annum have been identified.
Averages: Tariff
Optimisation
Energy
Efficiency
Solar
Installation
Micro-Grid
Billing
Energy savings per initiative ($) $9,610 $12,181 $3,850 $47,146
Cumulative savings per initiative ($) $9,610 $21,790 $25,641 $72,787
6%
14%
18%62%
HIGH RISE
5%
13%
42%
40%
LOW RISE
Tariff
Optimisation
Energy
Efficiency
Solar
Installation
Micro-Grid
Billing
Low Rise 13% 42% 5% 40%
Medium Rise 12% 11% 5% 72%
High Rise 14% 18% 6% 62%
Average contribution: 13% 17% 5% 65%
COST REDUCTION POTENTIAL
BREAKDOWN by BLOCK SIZE
Transition to micro-grid offers the greatest potential savings, contributing on average 62% to all identified savings per block. Efficiency upgrades contribute 17%; tariff optimisation, 15%; solar, 6%.
5%
12%
11%
72%
MEDIUM RISE
Solar Tariff Efficiency Micro Grid
The relative percentage contribution to total energy cost savings by each initiative, broken into block heights: Low (1-3 levels), Medium (4-8 levels), High (9+ levels)
Page 14
Customer Support: (02) 9977 1801
EMISSION and ENERGY IMPORT REDUCTION POTENTIAL
E N E R G Y E F F I C I E N C Y S O L A R M I C R O G R I D
ENERGY EFFICIENCY
SOLAR
MICRO GRID
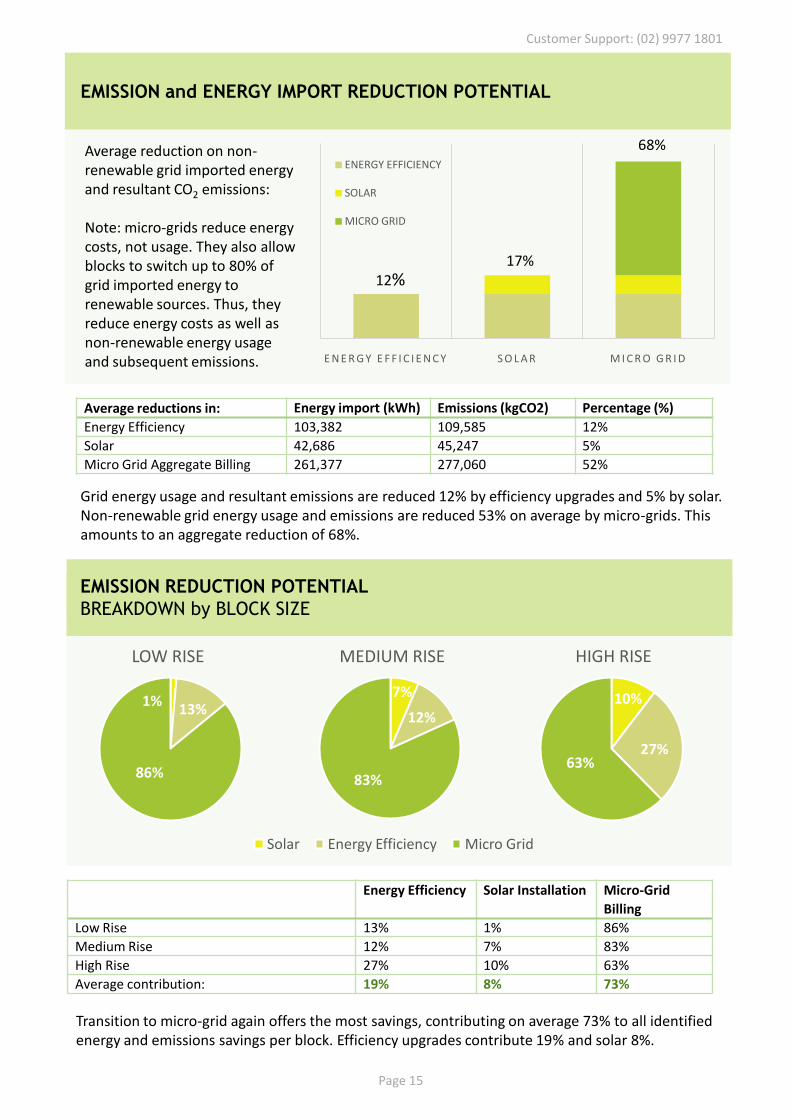
Average reduction on non-renewable grid imported energy and resultant CO2 emissions:
Note: micro-grids reduce energy costs, not usage. They also allow blocks to switch up to 80% of grid imported energy to renewable sources. Thus, they reduce energy costs as well as non-renewable energy usage and subsequent emissions.
12%17%
68%
Average reductions in: Energy import (kWh) Emissions (kgCO2) Percentage (%)
Energy Efficiency 103,382 109,585 12%
Solar 42,686 45,247 5%
Micro Grid Aggregate Billing 261,377 277,060 52%
Grid energy usage and resultant emissions are reduced 12% by efficiency upgrades and 5% by solar. Non-renewable grid energy usage and emissions are reduced 53% on average by micro-grids. This amounts to an aggregate reduction of 68%.
EMISSION REDUCTION POTENTIAL
BREAKDOWN by BLOCK SIZE
1%13%
86%
LOW RISE
Transition to micro-grid again offers the most savings, contributing on average 73% to all identified energy and emissions savings per block. Efficiency upgrades contribute 19% and solar 8%.
7%
12%
83%
MEDIUM RISE
Solar Energy Efficiency Micro Grid
Energy Efficiency Solar Installation Micro-Grid
Billing
Low Rise 13% 1% 86%
Medium Rise 12% 7% 83%
High Rise 27% 10% 63%
Average contribution: 19% 8% 73%
Page 15
Customer Support: (02) 9977 1801
10%
27%63%
HIGH RISE

HIGH RISE
Lighting Mechanical HVAC Water Leisure
AVG. COMMON AREAENERGY CONSUMPTION
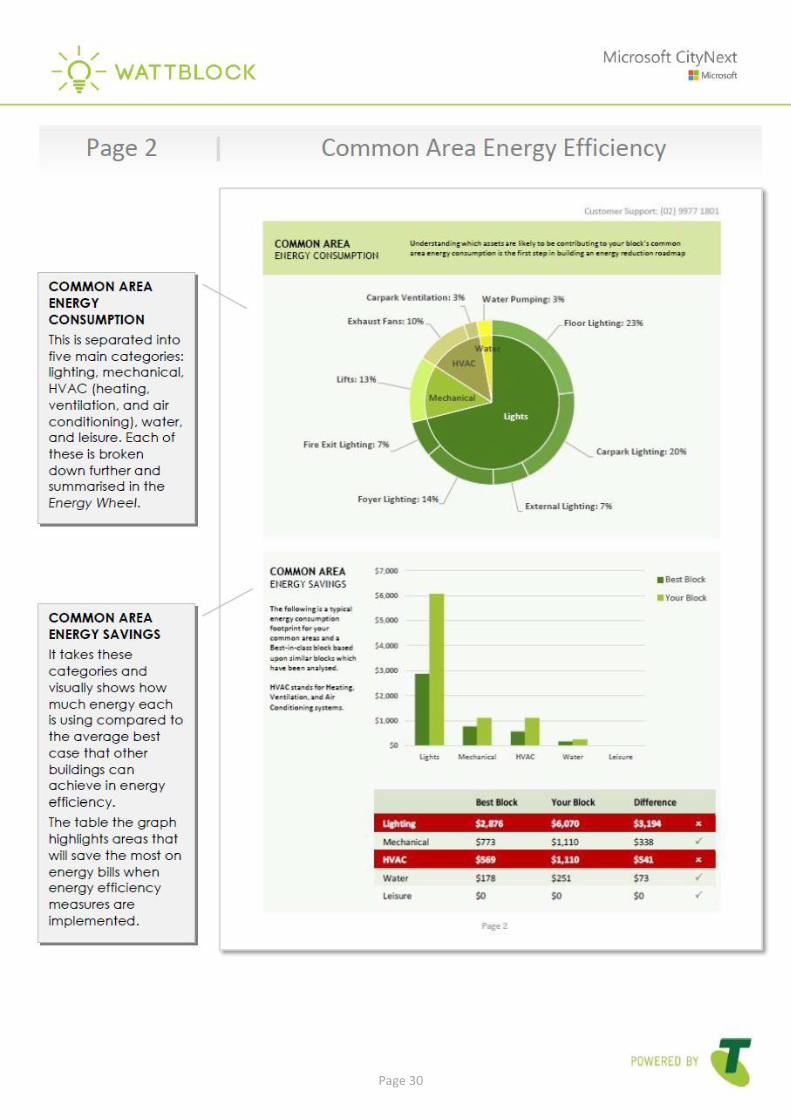
Understanding which assets are likely to be contributing to the common area energy consumption of a block is the first step in building an energy reduction roadmap.
LOW RISE MEDIUM RISE
89%68%
26%
32%
21%16%
12%11% 13%8%
4%
Due to the range of facilities offered by blocks of varying sizes, breakdown of common-area energy usage is correlated with block size. The load of low to medium rise blocks consists primarily of lighting – 89% and 68% respectively. Mechanical consumption contributes 11% in low-rise, and 16% in medium-rise, with HVAC and water pumping making noticeable contributions in medium rise blocks. In high rises, HVAC, water pumping and leisure energy usage increases to 21%, 13% and 8% respectively, mechanical to 32% and lighting drops to 26%. Common energy usage per unit is on average 37,130 MJ per year.
Percentage contribution to total
common-area energy consumption:
LOW RISE MEDIUM RISE HIGH RISE
Lighting 89% 68% 26%
Mechanical 11% 16% 32%
HVAC 0% 12% 21%
Water 0% 4% 8%
Leisure 0% 0% 13%
Common-area energy costs are significantly reduced by tariff optimisation, energy efficiency and solar. Tariff optimisation reduces expenditure to 80% of current costs. Following energy efficiency these costs reduce further to 55%, and finally to 47% after solar installation.
Optimising tariffs does not impact a building’s energy usage, only its energy costs. Therefore, following optimisation, consumption remains at 100% of current usage. Energy efficiency initiatives, however, reduce consumption to 62% on average, and solar to 46% of current usage.
Customer Support: (02) 9977 1801
Page 16

Customer Support: (02) 9977 1801
Page 17
QUICK PAYBACK OPPORTUNITIES
Or “lowest hanging
fruit”: tariff
optimisation and
energy efficiency
benchmarking with
fast payback.
AVERAGE ESTIMATED COMMON
ENERGY COST REDUCTION
45%
AGGREGATE ESTIMATED
COST SAVINGS(PER ANNUM)
$312,250
AVERAGE ESTIMATED COMMON
ENERGY SAVINGS(PER ANNUM)
38%Energy & MaintenanceGrid-Imported ElectricityElectricity Bills
The fastest payback, “lowest hanging fruit” opportunities uncovered are tariff optimisation and energy efficiency upgrades, reducing common energy costs by 45% on average, and energy usage by 38%. This represents cost savings totalling $312,250 across the ten blocks in the project, with aggregate energy savings, in terms of grid imported kWh, of 1,450,681 kWh per annum. The average payback period for these initiatives is 3.6 years.
AGGREGATE ESTIMATED
ENERGY SAVINGS (kWh)
1,460,681
Grid-Imported Electricity
RECOMMENDED NEXT STEPS
100% 100%
62%
46%
C U R R E N T U S A G E T A R I F F E F F I C I E N C Y S O L A R
100%
80%
55%47%
C U R R E N T C O S T S T A R I F F E F F I C I E N C Y S O L A R
of current expenditure
AVG. COMMON
ENERGY COST
REDUCTION
Tariff optimisation for common area electricity offers immediate benefit at minimal cost.
of current expenditure
of current expenditure
Reduced to…
AVG. COMMON
ENERGY USAGE
REDUCTION
Energy efficiency and solar initiatives offer significant reduction potential on grid-energy consumption.
Reduced to…of current
usage
of current usage
of current usage
Recommended Next Steps

Customer Support: (02) 9977 1801
Page 18
2.1
3.6
5.7
0.0
1.0
2.0
3.0
4.0
5.0
6.0
MINIMUM AVERAGE MAXIMUM
PAYBACK PERIOD
Averages: LOW RISE MED. RISE HIGH RISE Average
Payback period (years)For tariff optimisation and energy efficiency upgrade
2.9 3.8 3.5 3.6
Average payback periods for tariff optimisation and energy efficiency initiatives. Average payback of 3.6 years; minimum payback period found, 2.1 years; maximum, 5.7 years.
Total solar potential of 306.6 kW has been uncovered over the ten buildings analysed in the project. The smallest system found was 0.5 kW, through to 100 kW. Systems of up to 100 kW can utilise government Small-Scale Technology Certificates (STC’s), thereby reducing the capital expenditure required for system implementation.
SOLAR ENERGY POTENTIAL
306.6Total
kWuncovered
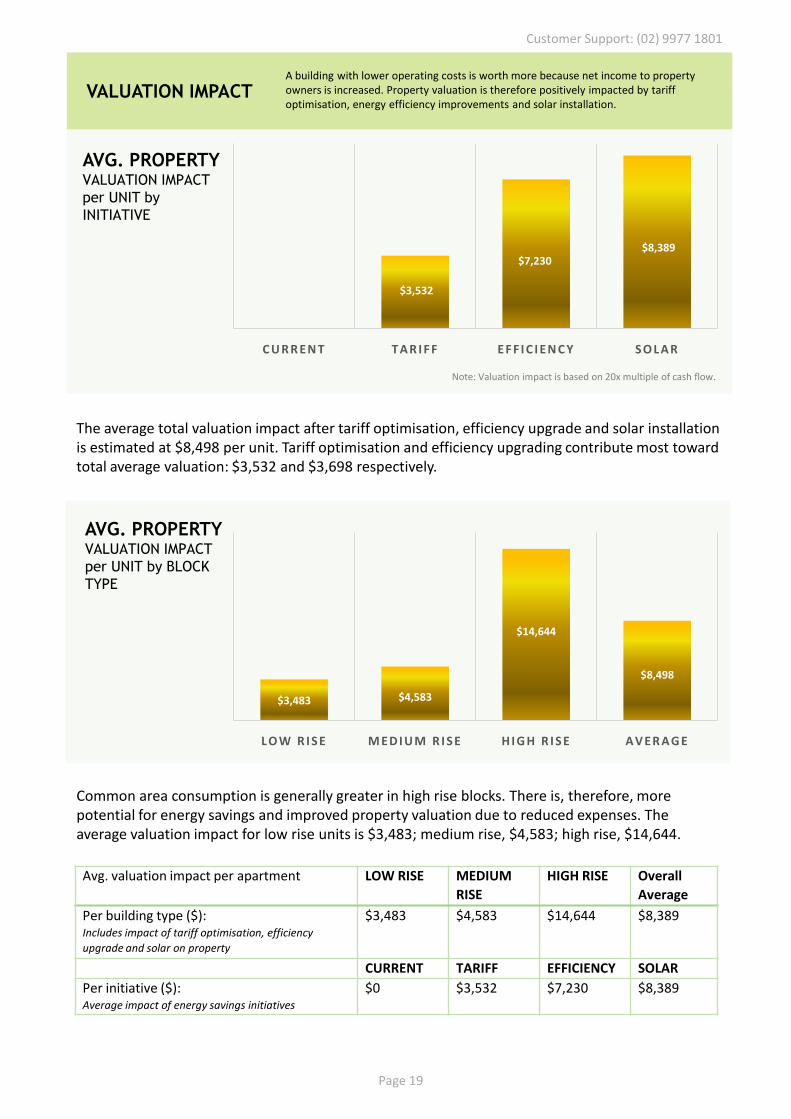
AVG. PROPERTY VALUATION IMPACT
per UNIT by BLOCK
TYPE
Common area consumption is generally greater in high rise blocks. There is, therefore, more potential for energy savings and improved property valuation due to reduced expenses. The average valuation impact for low rise units is $3,483; medium rise, $4,583; high rise, $14,644.
Avg. valuation impact per apartment LOW RISE MEDIUM
RISE
HIGH RISE Overall
Average
Per building type ($):Includes impact of tariff optimisation, efficiency
upgrade and solar on property
$3,483 $4,583 $14,644 $8,389
CURRENT TARIFF EFFICIENCY SOLAR
Per initiative ($):Average impact of energy savings initiatives
$0 $3,532 $7,230 $8,389
$3,483 $4,583
$14,644
$8,498
L O W R I S E M ED I U M R I S E H I G H R I S E A V ER A G E
Page 19
Customer Support: (02) 9977 1801
$3,532
$7,230 $8,389
C U R R EN T T A R I F F EF F I C I EN C Y S O L A R
AVG. PROPERTY VALUATION IMPACT
per UNIT by
INITIATIVE
Note: Valuation impact is based on 20x multiple of cash flow.
The average total valuation impact after tariff optimisation, efficiency upgrade and solar installation is estimated at $8,498 per unit. Tariff optimisation and efficiency upgrading contribute most toward total average valuation: $3,532 and $3,698 respectively.
VALUATION IMPACTA building with lower operating costs is worth more because net income to property owners is increased. Property valuation is therefore positively impacted by tariff optimisation, energy efficiency improvements and solar installation.

Participant CO2 Emissions Reduction Potential
Extrapolation of Results to City of Sydney
Extrapolated Results

PARTICIPANT CO2 EMISSIONS REDUCTION POTENTIAL
TOTALCITY OF SYDNEY
RESIDENTS IMPACTED
CITY OF SYDNEY APARTMENT POPULATION
REACHED
AVG. ANNUAL ENERGY PER UNIT ELECTRICITY + GAS
MJ / YR
TOTAL CURRENT BLOCK CO2
EMMISSIONS (TONNES/YR)
1,252 0.8% 37,130
6,975
EMMISSIONS AFTER ALL
INITIATIVES (TONNES/YR)
3,027
TOTAL CO2
EMMISSIONSSAVINGS
(TONNES/YR)
3,948
CITY OF SYDNEY CO2 REDUCTION
2030 TARGET CONTRIBUTION
97%
AVG. ANNUAL CO2 EMISSIONS
ABATEMENT
68%
The total number of residents within the ten buildings analysed by Wattblock is estimated at 1,252, or 0.8% of the City of Sydney apartment residing population. Across the ten buildings, emission savings identified total 3,948 tonnes CO2, an average abatement of 68% per annum per block. This represents an average contribution to the City of Sydney CO2 emission reduction target of 97%.
The City of Sydney apartment sector generates an estimated 10% of all LGA emissions [2]. Taking City CO2 emissions at 2006 levels and multiplying by this 10%, we have a conservative estimate of City apartment sector annual carbon emissions.
Following all identified initiatives the 10 participant apartment blocks will almost exceed Sydney’s 2030 carbon reduction target. If every block initiated similar upgrades, we would be well on our way to meeting the target.
Customer Support: (02) 9977 1801
Page 21
EFFICIENCY
MICROGRID
SOLAR
CU
RR
ENT
EMIS
SIO
NS
39
3,0
00
tC
O2
RED
UC
TIO
N
RED
UC
ED
EMIS
SIO
NS
296,200
68,350
28,450
Wattblock’s analysis of 10 City of Sydney apartment buildings shows average reduction in emissions and grid-energy import due to solar installation is 5%. Extrapolating this reduction to total apartment sector emissions, it is estimated that City emissions would reduce by 28,450 tonnes CO2 per annum if every apartment building utilised its solar potential to offset grid-energy usage. This would be equivalent to removing 6,550 passenger cars from Sydney roads every year.
Similarly, from Wattblock’s study, the average emissions reduction potential from efficiency upgrades is 12%. The average reduction from renewably sourced micro-grid billing is 53%. Extrapolating these reductions to all City apartments suggests further cuts of 68,350 and 296,200 tonnes CO2 may be achieved. The sum of these savings is 393,000 tonnes CO2 per annum.
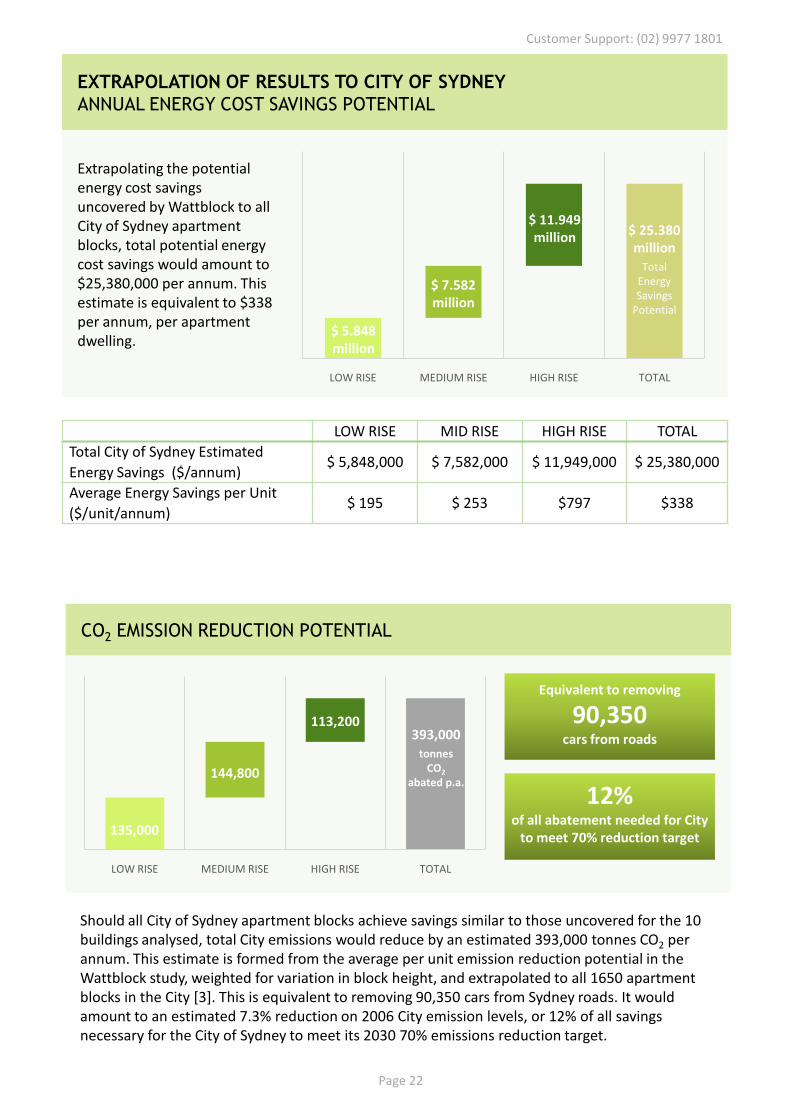
LOW RISE MEDIUM RISE HIGH RISE TOTAL
CO2 EMISSION REDUCTION POTENTIAL
393,000tonnes
CO2
abated p.a.
Should all City of Sydney apartment blocks achieve savings similar to those uncovered for the 10 buildings analysed, total City emissions would reduce by an estimated 393,000 tonnes CO2 per annum. This estimate is formed from the average per unit emission reduction potential in the Wattblock study, weighted for variation in block height, and extrapolated to all 1650 apartment blocks in the City [3]. This is equivalent to removing 90,350 cars from Sydney roads. It would amount to an estimated 7.3% reduction on 2006 City emission levels, or 12% of all savings necessary for the City of Sydney to meet its 2030 70% emissions reduction target.
135,000
144,800
113,200
Equivalent to removing
90,350cars from roads
12%of all abatement needed for City
to meet 70% reduction target
LOW RISE MEDIUM RISE HIGH RISE TOTAL
Extrapolating the potential energy cost savings uncovered by Wattblock to all City of Sydney apartment blocks, total potential energy cost savings would amount to $25,380,000 per annum. This estimate is equivalent to $338 per annum, per apartment dwelling.
EXTRAPOLATION OF RESULTS TO CITY OF SYDNEY
ANNUAL ENERGY COST SAVINGS POTENTIAL
LOW RISE MID RISE HIGH RISE TOTAL
Total City of Sydney Estimated
Energy Savings ($/annum)$ 5,848,000 $ 7,582,000 $ 11,949,000 $ 25,380,000
Average Energy Savings per Unit
($/unit/annum)$ 195 $ 253 $797 $338
$ 25.380 million
Total Energy Savings
Potential
$ 11.949 million
$ 7.582 million
$ 5.848 million
Customer Support: (02) 9977 1801
Page 22

Survey Participants
Building Demographics
Building Management
Committee Effectiveness
Perceptions About Energy Efficiency
Barriers to Energy Efficiency
Mobilising Energy Efficiency
Survey Responses
WATTBLOCK SURVEY RESULTS
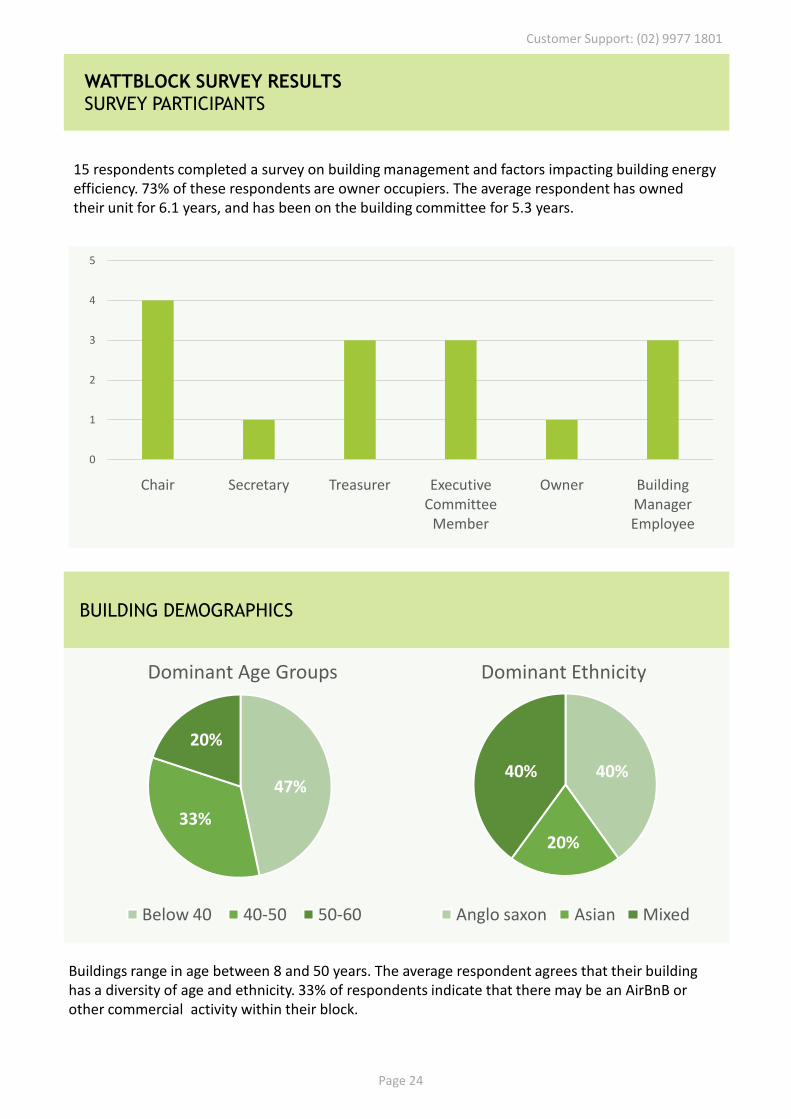
SURVEY PARTICIPANTS
15 respondents completed a survey on building management and factors impacting building energy efficiency. 73% of these respondents are owner occupiers. The average respondent has owned their unit for 6.1 years, and has been on the building committee for 5.3 years.
0
1
2
3
4
5
Chair Secretary Treasurer Executive Committee
Member
Owner Building Manager Employee
BUILDING DEMOGRAPHICS
47%
33%
20%
Dominant Age Groups
Below 40 40-50 50-60
40%
20%
40%
Dominant Ethnicity
Anglo saxon Asian Mixed
Buildings range in age between 8 and 50 years. The average respondent agrees that their building has a diversity of age and ethnicity. 33% of respondents indicate that there may be an AirBnB or other commercial activity within their block.
Page 24
Customer Support: (02) 9977 1801
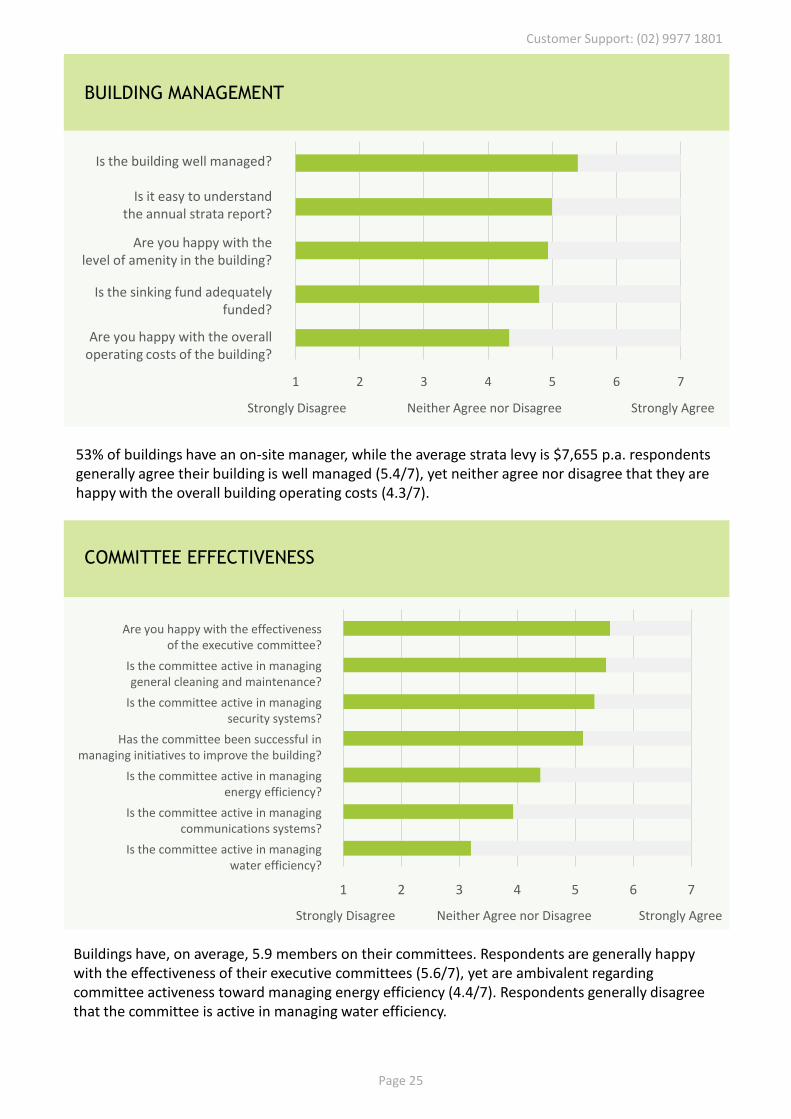
COMMITTEE EFFECTIVENESS
Buildings have, on average, 5.9 members on their committees. Respondents are generally happy with the effectiveness of their executive committees (5.6/7), yet are ambivalent regarding committee activeness toward managing energy efficiency (4.4/7). Respondents generally disagree that the committee is active in managing water efficiency.
BUILDING MANAGEMENT
53% of buildings have an on-site manager, while the average strata levy is $7,655 p.a. respondents generally agree their building is well managed (5.4/7), yet neither agree nor disagree that they are happy with the overall building operating costs (4.3/7).
1 2 3 4 5 6 7
1 2 3 4 5 6 7
Are you happy with the effectiveness of the executive committee?
Is the committee active in managing general cleaning and maintenance?
Is the committee active in managing security systems?
Has the committee been successful in managing initiatives to improve the building?
Is the committee active in managing energy efficiency?
Is the committee active in managing communications systems?
Is the committee active in managing water efficiency?
Is the building well managed?
Is it easy to understand the annual strata report?
Are you happy with the level of amenity in the building?
Is the sinking fund adequately funded?
Are you happy with the overall operating costs of the building?
Strongly Disagree Neither Agree nor Disagree Strongly Agree
Strongly Disagree Neither Agree nor Disagree Strongly Agree
Page 25
Customer Support: (02) 9977 1801

BARRIERS TO ENERGY EFFICIENCY
Respondents largely agree (5.6/7) that committees are likely to approve energy efficiency in general.
PERCEPTIONS ABOUT ENERGY EFFICIENCY
Respondents expect to be able to reduce energy costs by 17.3% on average
Average expected common-area energy cost savings of $12,563 p.a.
Average expected total project capital costs of $93,975
Average payback period expectation of 7.5 years
0
1
2
3
4
5
6
7
0-10% 10-20% 20-30% 30-40%
Expected Energy Cost Savings
1 2 3 4 5 6 7
Is availability of funding a barrier to enacting energy efficiency?
Is lack of awareness and information a barrier?
Is potential impact on amenity a barrier?
Is hiring an energy auditor a barrier?
Is product selection a barrier?
Is concern about unforeseen complications a barrier?
Is concern about on-going maintenance costs a barrier?
Is trust in cost and savings estimates a barrier?
Is obtaining multiple quotes a barrier?
Is trusting an electrician a barrier?
Is the committee likely to approve energy efficiency in general?
Strongly Disagree Neither Agree Strongly Agreenor Disagree
Page 26
Customer Support: (02) 9977 1801

0% 10% 20% 30% 40% 50% 60% 70%
What have been the barriers to doing energy saving projects?
BARRIERS TO ENERGY EFFICIENCY
Don’t know where to start / How much will it cost? / How much will we save?
Don’t have any spare funds to spend on energy saving
Worried about selecting the right electricians or product suppliers so we
get good value
Can’t agree to get a professional consultant in e.g. energy auditors
MOBILISING ENERGY EFFICIENCY
0% 20% 40% 60% 80% 100%
Would your committee be more interested in running projects if they:
Knew what the savings would be in advance of running the projects
Knew which projects to run first to get the most savings
Didn’t have to spend money from admin or sinking fund to enact energy saving projects
Didn’t have to spend time and effort getting lots of different tradespersons to come to the building and
give quotes
Didn’t have to compare quotes and then select tradespeople
Page 27
Customer Support: (02) 9977 1801

Page 1: Energy Report Overview
Page 2: Common Area Energy Efficiency
Page 3: Solar Energy Impact Assessment
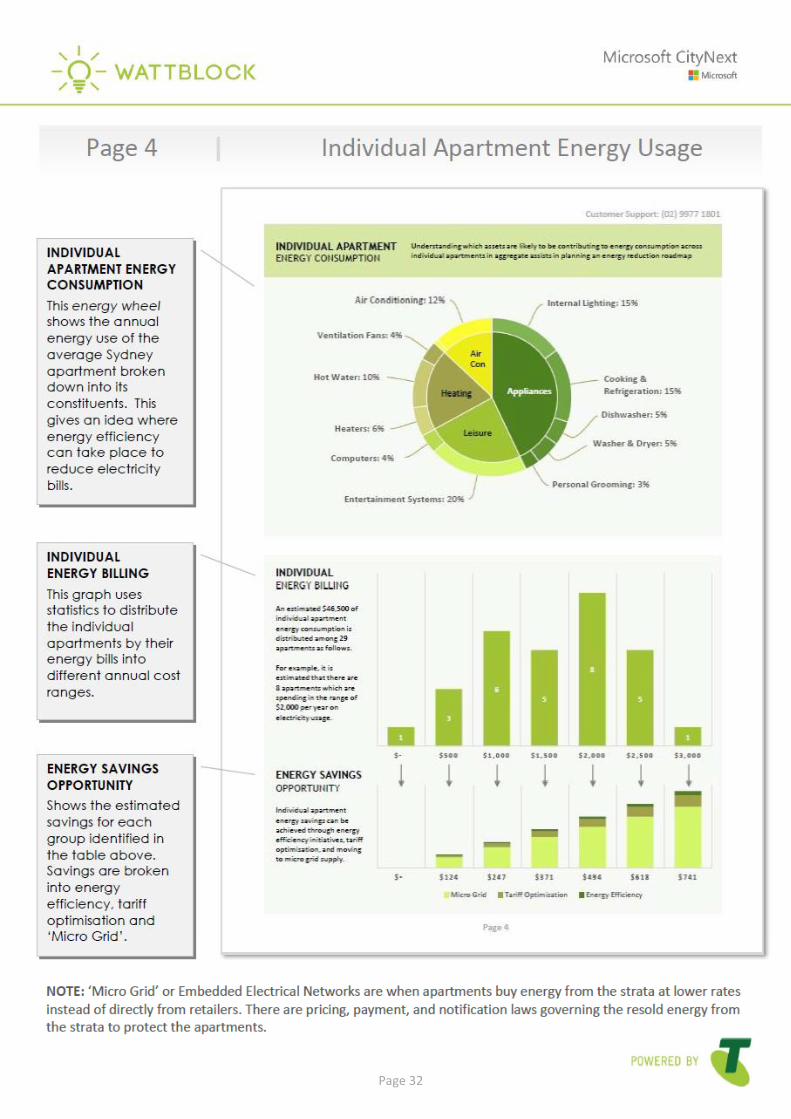
Page 4: Individual Apartment Energy Usage
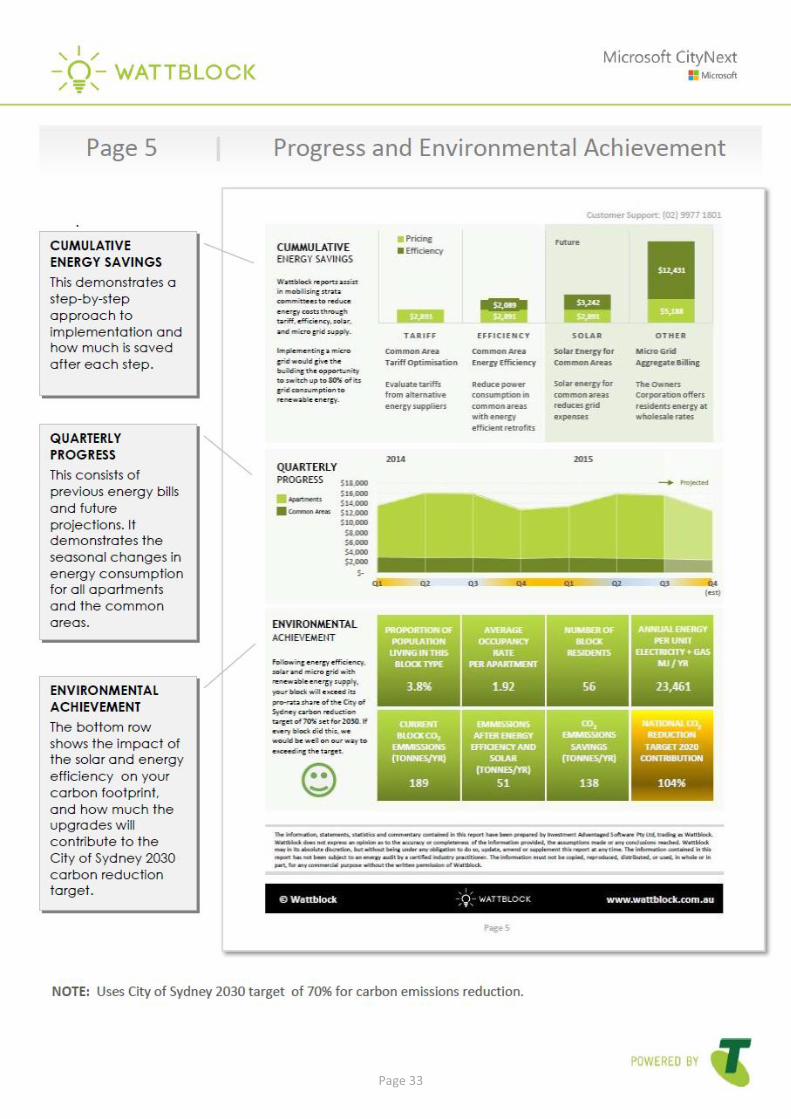
Page 5: Progress and Environmental Achievement
Wattblock Report Design

Page 29
Page 30

Page 31
Page 32
Page 33

Conclusions, Acknowledgements and References
Conclusions

Customer Support: (02) 9977 1801
Page 35
CONCLUSIONS
FROM THE 10 CITY OF SYDNEY WATTBLOCK ENERGY REPORTS
Over 75% of residents within the City of Sydney local government area already live in apartment buildings and the upwards trend is set to continue. A young and vibrant apartment dwelling community is receptive to energy efficiency and renewable energy with previous studies showing 88% of Australians thinking the government should do more to increase the use of solar power. Communicating energy savings in terms of 'hip-pocket' expenses and apartment property valuation uplift shows early signs of resonating within the apartment dwelling audience.
The highlights from the Virtual Energy Assessment projects are:
* Combined energy savings of over $25m a year are possible within existing residential strata buildings in the City of Sydney, equivalent to $338 savings per individual apartment p.a.
* Average apartment property valuation will increase by $8,500 following tariff, energy efficiency and solar project implementation
* Strata representatives expected that on average, common area energy costs could be reduced by 17% with a 7 year payback. The project data suggest on average 45% energy cost reduction is possible, with a 3.6 year payback
* If strata communities work as a unified residential community to retrofit a single billing infrastructure, energy costs for common areas and individual apartments could be reduced on average by 68% through bulk-buying and reduced connection fees
* Carbon Emissions from existing residential strata buildings in the City of Sydney can be reduced by 393,000 tonnes per annum, the equivalent of taking 90,350 cars off the road
* 60% of survey respondents cited 'not knowing where to start / how much it will cost or how much they will save' as the biggest barrier to energy efficiency
* The fastest way to lower carbon emissions in residential strata buildings is to switch the grid-based energy retailer for common areas to an energy retailer with a certified high renewable energy share
* LED lighting upgrades continue to be the hardware implementation with the fastest payback, typically less than 2 years

Customer Support: (02) 9977 1801
Page 36
CONCLUSIONS
FROM THE 10 CITY OF SYDNEY WATTBLOCK ENERGY REPORTS
* 90% of committees would be more interested in running projects if they knew what the savings would be in advance of running the projects
* Residential apartment buildings can meet the 70% carbon emissions reduction target under Sustainable Sydney 2030 using existing technologies which can be deployed immediately in 2016
Virtual Energy Assessment Project Recommendations
* Invest further in social media channels to create awareness and community engagement, given young populations residing in City of Sydney apartment buildings
* Add battery analysis as a means of increasing the size of solar photovoltaic implementations and making solar viable on smaller residential strata buildings
* Pilot low-interest rate lending to residential stratas to incentivize 'big-bang' energy upgrades and reduce strata committee 'project fatigue'
* Match-make strata committees with proven vendors and suppliers to stimulate the downstream upgrade of residential strata buildings
* Engage a further 20 residential strata buildings to improve sample size of Virtual Energy Assessments
0.00
0.05
0.10
0.15
0.20
0.25
0.30
LOW RISE MEDIUM RISE HIGH RISE
$/k
g C
O2
ab
ated
Avg. Dollar Cost per kg CO2 Abated
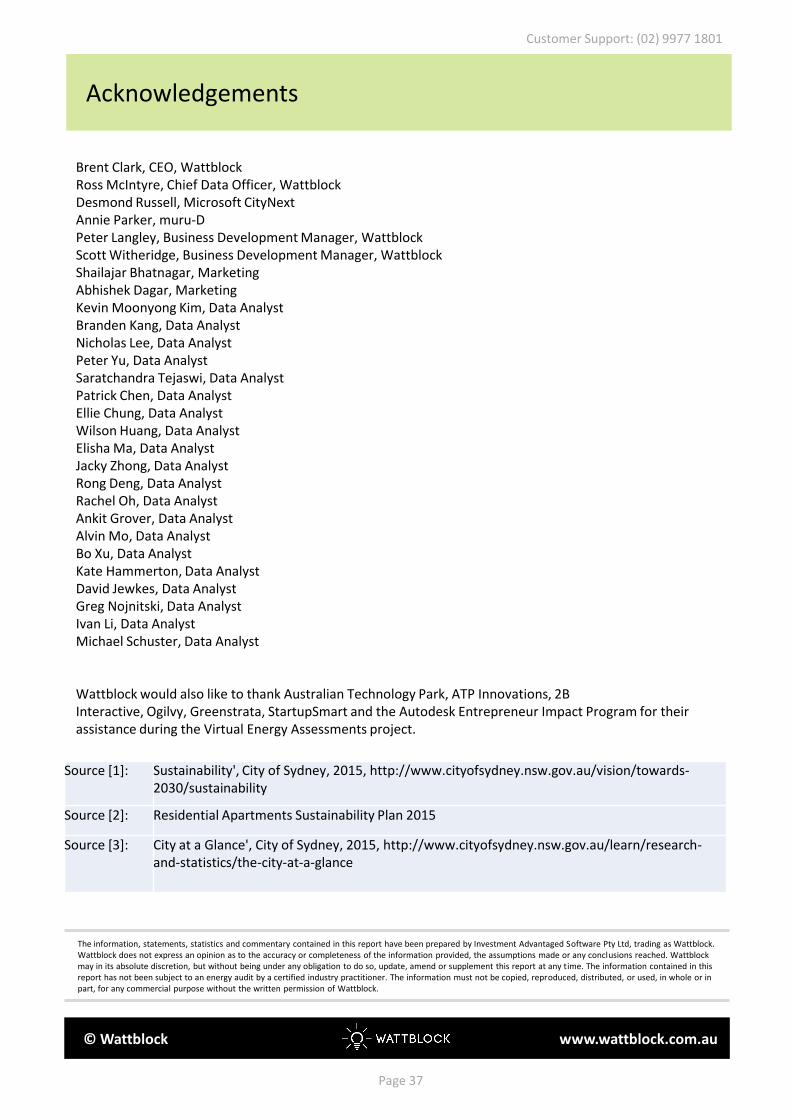
Brent Clark, CEO, WattblockRoss McIntyre, Chief Data Officer, WattblockDesmond Russell, Microsoft CityNextAnnie Parker, muru-DPeter Langley, Business Development Manager, WattblockScott Witheridge, Business Development Manager, WattblockShailajar Bhatnagar, MarketingAbhishek Dagar, MarketingKevin Moonyong Kim, Data AnalystBranden Kang, Data AnalystNicholas Lee, Data AnalystPeter Yu, Data AnalystSaratchandra Tejaswi, Data AnalystPatrick Chen, Data AnalystEllie Chung, Data AnalystWilson Huang, Data AnalystElisha Ma, Data AnalystJacky Zhong, Data AnalystRong Deng, Data AnalystRachel Oh, Data AnalystAnkit Grover, Data AnalystAlvin Mo, Data AnalystBo Xu, Data AnalystKate Hammerton, Data AnalystDavid Jewkes, Data AnalystGreg Nojnitski, Data AnalystIvan Li, Data AnalystMichael Schuster, Data Analyst
Wattblock would also like to thank Australian Technology Park, ATP Innovations, 2B Interactive, Ogilvy, Greenstrata, StartupSmart and the Autodesk Entrepreneur Impact Program for their assistance during the Virtual Energy Assessments project.
Acknowledgements
Page 37
The information, statements, statistics and commentary contained in this report have been prepared by Investment Advantaged Software Pty Ltd, trading as Wattblock. Wattblock does not express an opinion as to the accuracy or completeness of the information provided, the assumptions made or any conclusions reached. Wattblock may in its absolute discretion, but without being under any obligation to do so, update, amend or supplement this report at any time. The information contained in this report has not been subject to an energy audit by a certified industry practitioner. The information must not be copied, reproduced, distributed, or used, in whole or in part, for any commercial purpose without the written permission of Wattblock.
© Wattblock www.wattblock.com.au
Source [1]: Sustainability', City of Sydney, 2015, http://www.cityofsydney.nsw.gov.au/vision/towards-2030/sustainability
Source [2]: Residential Apartments Sustainability Plan 2015
Source [3]: City at a Glance', City of Sydney, 2015, http://www.cityofsydney.nsw.gov.au/learn/research-and-statistics/the-city-at-a-glance
Customer Support: (02) 9977 1801