virginia univ charlottesville dept of mechanical and- …
TRANSCRIPT

!0- 61-A 612 VIRGINIA UNIV CHARLOTTESVILLE DEPT OF MECHANICAL AND--ETC F/ 21/5THE SCHLADITZ FUEL INJECTOR. AN INITIAL PERFORMANCE EVALUATION -ETC(U)MAR 82 6 8 MATTHEWS, J E SCOTT, K A HARVEY NORO01R-T7 .056R
UNCLASSIFIED UVA/525335/MAETG/1O1R NL, E'IliEllEllEEEEIBIhEIIE-IIEII//i/l/hlh//lIllllElllllllEiIIIIIIIIhhmhlhhhhhhhmhhhhmu

I A Report
TEE SCHLADITZ FUEL INJECTOR:AN INITIAL PERFORMANCE EVALUATION WITHOUT BURNING
Submitted to:Power Programs (Code 473)
Office of Naval Research800 N. Quincy StreetArlington, VA 22217
Submitted by:
E 1 G. B. Matthews-Professor
* J. E. Scott" Professor
K. A. Havey, Jr.Graduate Research Assistant
J. Z. Colt, Jr.
Graduate Research Assistant
j Report No. UVA/525335/MAE78/1O1R
February 1979
[Revised March 1982
KSCHOOL OF ENGINEERING ANDAPPLIED SCIENCE
DEPARTMENT OF MECHANICAL AND
Lj AEROSPACE ENGINEERING
C2 UNIVERSITY OF VIRGINIA
CHARLOTTESVILLE, VIRGINIA 22901
I 82 04 19 148

A Report
THE SCHLADITZ FUEL INJECTOR:AN INITIAL PERFORMANCE EVALUATION WITHOUT BURNING
Submitted to:
Power Programs (Code 473)Office of Naval Research
800 N. Quincy StreetArlington, VA 22217
Submitted by:
G. B. MatthewsProfessor
J. E. ScottProfessor
K. A. Havey, Jr.Graduate Research Assistaut
J. Z. Colt, Jr.Graduate Research Assistant
Department of Mechanical and Aerospace Engineering
RESEARCH LABORATORIES FOR THE ENGINEERING SCIENCES
SCHOOL OF ENGINEERING AND APPLIED SCIENCE
UNIVERSITY OF VIRGINIA
CHARLOTTESVILLE, VIRGINIA
Report No. UVA/525335/MAE78/1O1 Copy No.
February 1979 (Revised March 1982)
Att

SECURITY CLASUIFICATIod of T#4g5 PAGE eUY.. Dole &u#6,94
REPORT DOCUMENTATION PAGE REDWTCotR S IO // ' .I CPIENT'S CATALOG NU RSER
4. ITL (anO d UISbie) "tO CRTAPRO OE
"The Schladitz Fuel Injector: An Initial Oina Report Pmocvcg
Performance Evaluation Without Burning" 090/7- 0228 796PeRFORIONG Ono. REPORT NUM1SER1
4,7. AUTHOR(@) 5.COTR10GAN1NRSU
G. B. Matthews K. A. Havey, Jr.-J. E. Scott J. Z. Colt, Jr.
____________________________________ N00014-77-C-0564S. PERFORMING ORGANIZATION NAME AND ADDRESS to. PROGRAW ILENTPREC.ASDepartment of Mechanical Engineering A6 WORK UNIT NUMINIIERSU niversity of rii, Thornton Hall
I -CONTROLING OFIC NAME AND ADDRESS U.REPORT GATE
* I ~~Power Program, Department of the Navy, ONR ~ ~E AE
Arlington, VA 22217 IS-___________Of__PAGES_
14. MONITORING AGENCY NAME 4 AOORESS(It diloent bern Con~fliwllug Ofle) ISL SECURITY CLASS. (41 twoe repoft)
* ,. 4Unclassified
* IS..DECLASWIICATION/OOWGRADING
1S. DISTRIBUTION STATEMENT (of tleS Iceport)
Approved for public release; distribution unlimited.
* 5~7. DISTRIBUTION STATEMENT (of thn. abstrore entered In Black 20. it difforent howe Re~or)
NA
16. SUPPLEMENTARY NOTES
* The findings in this report are not to be construed fs- aniTffi~jal-PeJ nsof the Navy position, unless so designated by other authorized docuie t fa
It. KCEY WORDS (Continue on revere, aid* It nec..eay mid identify by block number)I combustionfuel injection
particle size determination r
20. ASBSTRACT (C.AUmAI an revere. old* It nocaesey a"d Identify by block number)
Past tests of the Schladitz Fuel Injector (SF1), a network of electrkblly-heated, extremely-thin metal whiskers, have shown that very fine fuel I pletsprays are formed leading to substantial improvements in combustion efficillcy.Evaluation of this performance potential, however, requires thorough in'q/esti-gatlon of the flow rate/pressure drop/heating rate, influences on spray qaiityand droplet size distribution. Such tests were performed ork two SF1, gem ies( with steady flows of Jet-A fuel.
DID 'JAN, 1473 ECriIO OF I NOV 65 is ODSGLeft~ ~UngIassified
SECURITY CLASSEiFCA1fna ISV r PeIWfonS
___~~~ 7

~I
20. ABSTRACT (conued
,-hen these flows were discharged directly to the atmosphere, pressure -
drop reached a minimum at heating rates of 280 I/cc. At this point, sprayquality improved noticeably, showing substantial fog or mist production, whichbecame complete mist as the heating rate approached three-fourths the Jet-A Uenthalpy of vaporization. Similar tests of SFI flows exhausting through con-ventional spray nozzles showed appreciable improvement in spray quality, pro-ilducing 50% or more mist at heating rates about one-third less than those re-quired in the absence of nozzles. This improvement was essentially independentof the type nozzle employed, and all nozzle pressure drops were much less thanthose of the SFI..
,Droplet size' investigations included examination of spray samples on soot-coated slides and observations of laser light absorption. Both techniquesindicated the presence of extremely fine droplets, of ordet' 'O pm diameter orless, in the SFI-produced mists; and both supported the provious spray qualitydeterminations, showing a monotonic decrease in mean particl size with increas-ing heating-to-flowrate ratio. Precise droplet size distributiotis were not deter-mined, but theoretical analyses indicated that mean size trends with heatingwere not sensitive to assumed distributions.
Further tests to evaluate trade-offs between heating rate and nozzlepressure drop in terms of spray quality are recommended.
.1
NITlS 'i&"DI'C 7!cc ss t ror
w*aaaw.Lit 'jd FiJjustiric.at tn-_
Ditribu ,tion/
ltailo'..lIty CodeSIAA.L ar..,/Or
-i~ ~an...J i:;/orDIst Sp,c al L
L(ii
INSI. E.

ABSTRACT
Production of very small droplets in a fuel injection system is an
effective means of improving combustion performance, as demonstrated in
past tests of the Schladitz Fuel Injector (SFI), a device in which
extremely thin metal whiskers are placed in the fuel flow passages in
the presence of an electrical heating coil. Potential improvements from
this injector include the realization of greater combustion efficiency,
establishment of wider flamability limits, and reduction in noxious
pollutant products.
- However, a meaningful evaluation of the performance potential of
the SFI requires more complete understanding of the atomization process
with heat addition in the whisker environment. To this end, initial
tests of the flow-rate-pressure drop relationship were conducted over a
wide range of heating rates, with concurrent observations of spray
quality, limited sampling of droplets, and preliminary droplet size
determinations from optical scattering. Two different injector geo-
metries were tested at a series of steady flow conditions with Gulf
Jet-A fuel in a simple, gas-pressurized feed system.
The results of one series of tests in which the flows from both
injectors were discharged directly into the atmosphere showed that the
*pressure drop across the injector decreased monotonically until a heat-
ing rate of approximately 280 J/cc had been reached, beyond which the
drop increased with any further heating. At this same critical heating
condition, a noticeable change in the spray quality began to be evident
in the form of substantial portions of the flow appearing as fog or
r. iii
- -.- 7 -.

7mist. Further heat addition brought about dramatic improvement in the
spray atomization, with essentially complete mist appearing at a heating
* - rate approaching three-fourths of the average enthalpy of vaporization
of Jet-A fuel at atmospheric pressure.'-C A different pressure environment was provided in a second series of
tests in which the SFI exhaust was fed through one of two spray nozzles
before discharging into room air. These nozzles exhibited quite modest
* pressure drops in the range of flows investigated, with the major drop
still occurring across the SFI itself. However, the spray quality
. ,evidenced by both injector models was improved substantially over that
achieved at the same heating rate in the absence of the exit nozzle.
Stated alternatively, the presence of the downstream nozzle reduced the
required heat addition rate by about one-third for formation of a spray
having 50% or more mist content. It was further noted that this heating
rate reduction was essentially independent of the type nozzle employed,
i.e., swirling, spring-loaded pintle or simple solenoid-operated ori-
fice, and of the pressure drop across the nozzle over a range of from
one to four atmospheres.
A limited amount of supporting evidence of the presence of very
small droplets in the heated flows was obtained from soot-coated slides
exposed to the spray by a simple rotating slit device. Reduction in
mean droplet replica size and an increasing fraction of small droplets
in the spray were both observed in these slide samples as heating rate
was increased.
A more objective means of determining the effect of different
operating conditions on droplet size was developed utilizing laser light
iv
scattering and absorbing properties of the spray. Simple physical
arguments were combined with Mie theory to develop consistent evidence
of relative changes in the mean size of the spray distribution as a
function of heating rate-to-flowrate ratio and of nozzle pressure drop.
Results of these tests reinforced the simpler soot slide observations,
indicating a decreasing drop size with increasing heating rate and
pressure drop. The relative size index thus obtained is shown to be an
* "I approximate upper limit to the actual dimensions of the fuel droplets.
Analysis of the injected fluid thermodynamic states on an enthalpy-
temperature plot for Jet-A fuel suggests that the creation of a fine
mist by the SFI in the absence of any downstream nozzle is accompanied
by the formation of a measurable fraction of vapor within the injector,
while a similar spray formed by the SFI-nozzle combination is essen-
.. tially free from any vapor until the isenthalpic expansion occurs
through the nozzle.
Further verification of the test results to date, with a more
detailed evaluation of the trade-offs between heat additions and nozzle
pressurization, is recommended for the future as a logical extension of
the present work.
v
" - • ; -- 2 "5 7 '-- ,~~, -. .-- ..: - ,- . . . . . .

TABLE OF CONTENTS
I. INTRODUCTION ....................... 1
II. DESCRIPTION OF APPARATUS .................
III. PROCEDURES ............ ........................ 17I A. Pressure Drop Measurements ..... .............. .. 17B. Spray Evaluation ....... ................... ... 21
IV. RESULTS AND DISCUSSION ....... .................. ... 31
A. Injector #1 Performance ...... ................ .. 31B. Injector #1-1 ........ ..................... ... 34
, C. Injector #2-2 ........ ..................... ... 34D. Injector #2-3 ........ ..................... ... 38E. Comparisons of Pressure Drop Characteristics .. ..... 44
7' F. Effect of Downstream Nozzle on Injector Performance 48G. "Cost" of Heating the Fuel ..... .............. .. 57H. Particle Size Determinations .... ............. .. 59
V. CONCLUSIONS AND RECOMMENDATIONS ..... .............. .. 74
REFERENCES ......... ........................ .. 76
APPENDICES ......... ........................ .. 77
A. Properties of Jet-A Fuel Used for this Report .. ..... 77B. Ranges in Test Results for Injectors I and 2 . . . . . 78
vi

LIST OF FIGURES
Figure Page
1. Electron Micrograph of Schladitz Whiskers .... ........ 3
2. Fuel Mist Produced by a Whisker Fuel Injector ... ...... 3
3a. Photograph of Schladitz Fuel Injector #1. ...... ... 5
n3b. Schematic Diagram of Schladitz Fuel Injector #1 .. .. ... 6
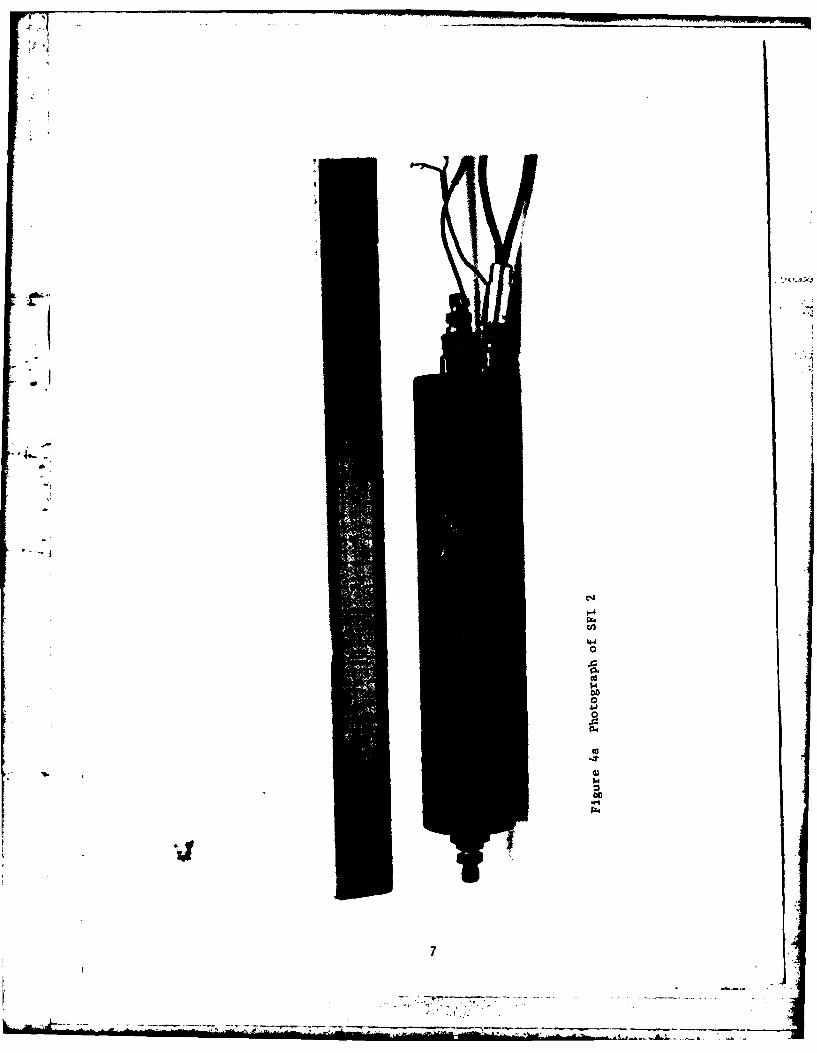
4a. Photograph of Schladitz Fuel Injector #2 .... ........ 7
4b. Schematic Diagram of Schladitz Fuel Injector #2 .. ..... 8
5a. Photograph of S.F.I. Testing System ..... ........... 10
5b. Schematic Diagram of S.F.I. Testing System . ....... ... 11
5c. Schematic Diagram of Droplet Measurement Apparatus . 16
6. Soot-Slide Sampling Can ..... ................ ... 24
7. Photomicrograph of Fuel Particle Impaction Sites . ... 26
8. Pressure Drop Characteristics of Injector #1 ....... . 32
9. Performance Characteristics of Injector #1 . ....... ... 33
10. Effect of a Downstream Nozzle on Injector #1 Performance. 35
11. Pressure Drop Characteristics of Injector #2-2 ..... ... 36
12. Performance Characteristics of Injector #2-2 ....... . 37
13. Performance Characteristics of Injector #2-3 ....... 40
14. Pressure Drop Characteristics of Injector #2-3 ..... ... 41
15. Approximate Enthalpy Diagram for Jet-A Fuel ......... ... 45
16. Fuel Injector Control Volume ..... .............. . 47
17. Decrease in Specific Heating Requirements Dueto a Downstream Pressure Drop ..... .............. ... 50
18. Comparison of Performance with and withouta Downstream Pressure Drop ..... ............... ... 52
v1i

LIST OF FIGURES (continued)
Figure page
19. Photographs of a Test without a Nozzle .. ......... ... 53
20. Photographs of a Test with a Nozzle ... ........... ... 55
21. Correlation of Particle Size Distribution withthe Qualitative Performance Rating ... ........... .. 60
22. Correlation of Particle Size Distribution with
the Qualitative Performance Rating ..... ........... 60
I 23. Correlation of Particle Size Distribution with
the Qualitative Performance Rating ..... ........... 67
24. Correlation of Particle Size Distribution with"Ithe Qualitative Performance Rating .. ....... .... 61
25. Correlation of Mean Particle Size with theQualitative Performance Rating .... ............. .. 62
26. Correlation of Mean Particle Replica Size with
Heating to Flowrate Ratio ...... ................ .. 62
27. Experimental and Theoretical Particle Size Distributions. 67
28. Mean Droplet Radius vs. Heating to Flowrate Ratiofor Assumed Log-Normal Size Distribution .......... .. 69
29. Mean Droplet Radius vs. Heating to Flowrate Ratiofor Assumed Monodisperse Size Distribution ........ ... 71
viii
_ 77_

LIST OF TABLES
Table Page
1. Average Heating Requirements for GivenPerformance Ratings for Both Injectors,with and without a Downstream Pressure Drop ........ . 39
2. Percentage of the Heating Value, Hv, ofJet-A Fuel that must be Used to Give aRating of 9, or 90% Mist ..... ............... ... 58
3. Ranges in the Test Flow Resultsfor Injectors 1 and 2 ...... ................. ... 78
vix

SECTION 1
INTRODUCTION
The production of very small liquid fuel particles in a combustion
injection system is highly desirable as a means of improving the vapori-
4zation of the fuel and, hence, the performance of the combustion system.
When this process of subdivision of the bulk liquid fuel into smaller
particles, usually called atomization, involves the production of very
fine droplets (under 10 pm in diameter), the phenomenon is called
nebulization. For spherical fuel particles, the vaporization rate per
* unit mass of fuel is proportional to the ratio of the surface area of
the particle to its volume, that is, to the reciprocal of the particle
diameter. Consequently, efficient nebulization and its resultant small
particle sizes correspond to high vaporization rates and accompanying
improvements in performance. In existing combustion systems such
improvements could result in reduced specific fuel consumption and
increased range of aircraft and ships. Alternatively, these improve-
ments could enable the use of a lower grade, cheaper fuel of higher
availability in a given combustion system without appreciable loss of
performance when compared to current fuels.
Several years ago, Mr. Hermann Schladitz, of Munich, Germany,
developed a device which nebulizes liquid fuel into a very fine mist in
order to achieve cleaner and more complete combustion. The device,
called a Schladitz Heat Exchanger, consists of a very large number of
small polycrystalline whiskers sintered together to form a porous net-
work or skeleton which is then surrounded by a heating element. The
polycrystalline whiskers (with diameters in the range 0.3-20 pm and
1i

* .I
length-to-diameter ratios in the range l0 - 104 ) are produced by the
thermal decomposition of metal carbonyl vapors, e.g., Fe, Ni, Cr, in the
presence of a magnetic field. (Study of the whisker production mech-
anism is under way currently at the University of Virginia under the
sponsorship of the Metallurgy Branch of ONR). Whiskers produced in this
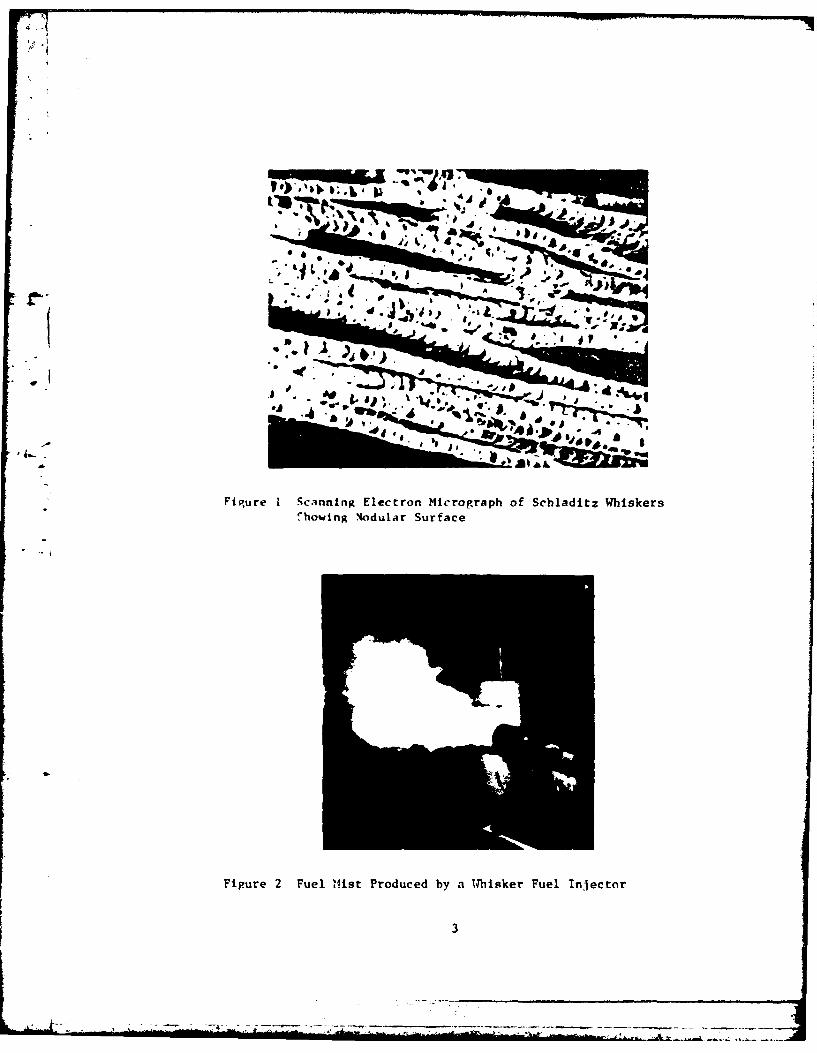
manner have a large surface area (see Figure 1) and, since they are
metal, can easily be heated to further prepare a liquid fuel passing
* Ithrough the whisker network for subsequent vaporization, mixing, and
combustion. Used as a fuel injection scheme, the Schladitz Fuel
Injector (SFI) is a kind of porous plug made of very small diameter,
long metal whiskers. Liquid fuels forced under pressure through an SFI
Jemerge as a very fine mist (see Figure 2), the degree of nebulization
(or atomization) of a given fuel being governed primarily by the poro-
sity, the type and size of whisker material, the amount of energy
supplied as heat to the device (usually by ohmic heating), and the
pressure drop imposed upon the discharge nozzle.
Qualitative experimental results on the performance of the device
tend to indicate that it is an exceptionally good fuel atomizer and has
the potential capability of providing substantial improvement over
existing combustion systems using liquid fuels ranging from residual
fuel oils to high grade jet fuel. The improved high quality of fuel
atomization must certainly enhance the performance of a combustion
system by increasing combustion efficiency, broadening flammability
limits, and possibly improving the quality of combustion product emiss-
ion. Any further development of the SFI, however, will be dependent upon
a thorough understanding of the nature of the critical process of
atomization with heat addition in the whisker environment.
2
~Ai
OW
Figure I Scanning Electron Micropraph of Schladitz WhiskersThawing 4odular Surface
Figure 2 Fuel Mist Produced by a 14bisker Fuel Injector
SECTION II
DESCRIPTION OF APPARATUS
Two configurations of the Schladitz Fuel Injector have been studied
in an attempt to evaluate the overall flowrate-pressure drop character-
istics, heating requirements, and spray particle sizes. A two-section
design (Figure 3) designated SFI #1, or the "Pancake" model, is a
multiple-tube arrangement, not unlike an ordinary heat exchanger, wrap-
ped with an electrical heating element. The "tubes" are actually a
series of holes drilled in a solid block of steel. Each tube is filled
with nickel whiskers, restricted in their axial movement by a screen
placed at the downstream and of the solid block. Each of the two sec-
tions has individual fuel input and exit connections, a heating element,
S-' and 2 thermocouples. The heating elements are Nichrome wire insulated
by a coating of magnesium oxide. The resistance of one such heating
element is approximately 14 ohms. Two iron-constantan theruocouples are
provided with each section: one near the discharge (thermocouple #1)
and one imbedded in the heating coil (thermocouple #2). In the original
configuration, both sections of SFI #1 were insulated as a unit by
wrapping with a ceramic felt material.
The three-section design, SFI #2, provides only one flow path per
section (Figure 4), a whisker-filled volume in the shape of a long annu-
lus between two coaxial cylinders, with the outer cylinder encircled by
the heating element. The resistances and material of the heating ele-
ments are similar to those used in SFI #1, as are the type and arrange-
ment of the two thermocouples. Each section of SFI #2 is individually
insulated with ceramic felt, and the whisker material is iron rather
than nickel.4

0 - N I~) q '0 73
I~ 0)I
L4.4
00
Pk)

000
41P4
.4 a.
.4 r4
7~4 d -- 7
44
440
00
P4

,* Sj
* U-qC a9,
CHC'
4-.0
- 0 0

i ' ~ . . ..................................... ...
On the downstream end of the injector, two different discharge
nozzles were used at different times to provide a pressure drop after
passage of the fluid through the whisker network. The first of these
nozzles is an electrically-operated valve which displays very little
tendency to produce spray or mist when operated without the whisker
network. The pressure drop-flowrate relationship for this nozzle is
essentially linear over the working range. As a second candidate con-
* . figuration, a pressure-operated Bosch nozzle, designed for use in a
passenger car fuel injection system, was used. This nozzle has a vari-
able geometry because of its spring-loaded valve, and it exhibits an
',. almost constant pressure drop over a wide range of flowrates. The
nozzle is designed to produce a fuel spray independent of the presence
* of the whiskers upstream.
In all flow tests, fuel was supplied to the injector by a pressu-
rized tank system consisting of a compressed gas bottle, a pressure
regulator, a fuel reservoir, a filter, and a liquid flow control valve
(Figure 5). Nitrogen from the gas bottle was regulated through a variable-
pressure regulator and was used to pressurize the gas in the volume
above the fuel level in the reservoir. Typical working pressures in the
fuel reservoir, which has a volume of approximately 60.5 liters (16.0
gal.), range from 500 to 2000 KPa (64 - 300 psi), depending on the
desired flowrate. Tank pressure was displayed on one scale of a Marsh
Instruments "Duplex" (double-indicator) bourdon-tube gauge. Fuel leaves
the reservoir under pressure through an exit positioned below the fluid
level.
9
C),!L" T i .. i = :r _, . , .= , .. . ,:

*
4J
oJ
1-404
IJ-40
0.
'4
04J0
04
*1-04
S.
10
- j-~ ~Ij . -

5 tii
nk4,'4
w1 (L

All liquid passing from the reservoir passes through a filter,
which has a replaceable element made of sintered stainless steel. Rated
pore sizes for different filter elements used ranged from 2 pm to 15 pa.
The hand-operated fuel control valve served as the final flowrate control,
providing fine adjustment.
The basic properties of the flow are monitored by three instru-
ments: a "Bearingless" turbine flowmeter, a strain-gauge pressure trans-
4Iducer sensing injector inlet pressure, and a Heise bourdon-tube pressure
gauge indicating injector exit pressure when this pressure is greater
than atmospheric.
The Bearingless flow meter, in which the signal produced is a pulseJ
of light converted to an electrical square wave, was calibrated over the
range from 1.26 ml/sec to 200 ml/sec. The frequency of the square wave
signal is proportional to the volumetric flow rate through the flow
meter. A digital frequency counter was used to display this infor-
mation. Calibration curves, plotting frequency as a function of volume
flowrate, were generated by running both water and jet fuel A through
the flow meter at a fixed frequency for a measured amount of time into a
beaker of known empty weight. The mass of the filled beaker was mea-
sured on a balance, and the volume flowrate was calculated from the mass
of fluid, the known density of the fluid at room temperature, and the
elapsed time of the flow. The density of Jet-A was obtained from a plot
of density and temperature supplied by Gulf Oil Corporation, the manu-
facturer, while the density of water used in the tests was taken to be
0.998 Kg/liter at 190C. Temperature was measured by a standard mercury-
12
-- o ,. . . .

in-glass thermometer. It should be noted that the flowmeter was origi-
nally placed downstream from the flow-control valve; but more consistent
calibration results were obtained by placing it in the more nearly
constant pressure region upstream -from the valve, which then became its
permanent location.
Fuel pressure at the inlet of the injector was monitored by the
strain-gauge type pressure transducer (Viatran #103) and the other half
.- "of the "Duplex" gauge. This "Duplex" gauge was not used to acquire
data, but simply as a visual indicator, giving a rough value of pressure
and some indication of how the pressure was changing with time, with the
strain-gauge transducer acting as the primary pressure monitor at the
whisker network inlet. The electrical signal from the transducer was
displayed on a Keithley #]06B digital multimeter. Typical output volt-
... ages during a run ranged from 15 to 20 mv, corresponding to pressures
of approximately 1000 KPa to 1300 KPa.
Since the pressure transducer was not located exactly at the inlet
to the whisker network but was separated from it by a short length of
copper tube, a correction factor was included in the data-reduction
program to compensate for the pressure drop of the tubing. This correc-
tion factor is a function of flowrate and was found by measuring the
pressure drop-flowrate characteristics of the tube with the whisker
network detached. In this manner a more accurate value of the actual
pressure existing at the input of the whisker network was established.
When the exit pressure from the whisker network was larger than one
atmosphere (as is the case when a nozzle is used downstream), a bourdon-
tube Heise gauge was connected to a fitting between the whisker package
13
* - *---!

and the nozzle. This Heise gauge is readable to 0.05 psi, having a
range of 0-100 psi. Both the Viatran transducer and the Heise gauge
were calibrated with a dead weight tester, with the pressure transducer
calibration spanning a 0-300 psi range.
Thermocouple outputs were referenced to an ice point cold junction
and displayed individually on the Keithley digital voltmeter by means of
a switching network. A visual indication of temperature was provided by
displaying the thermocouple outputs continuously on a multi-channel
chart recorder. Using this chart recorder, it was easier to determine
when the system had reached thermal equilibrium. The constant visual
display also proved useful in detecting sudden transients in the fuel
flow and malfunctions in the heating elements.
Electrical power for the heating elements, sometimes exceeding 1 KW
per element, was obtained from a 208-volt, split-phase AC line, with
voltage controlled by means of an autotransformer (Superior Electric
Company "Powerstat"). The voltage across the heating elements was
displayed continuously by a Westinghouse panel meter and a Non-Linear
Systems, Inc. Series X3 digital voltmeter. The current was also dis-
played by a General Electric panel meter. The entire circuit was pro-
tected by a 20-ampere fuse in series with the input to the autotrans-
former.
Additional apparatus was assembled for optical investigation of
droplet sizes in the heated sprays, for which tests the Schladitz fuel
injector and its accompanying spray nozzle were mounted so as to dis-
charge vertically downward into a plexiglas duct having a square cross
14

section of about 900 cm2 . This specialized test set-up, as shown sche-
matically in Figure 5c, included a water-cooled Schladitz whisker net-
work from which the condensed liquid fuel was collected for re-use. A
vacuum blower was used to draw the droplets through the condenser,
producing a net downward air velocity of approximately 1/3 meter/second.
A Spectra-Physics 5 mw He-Ne laser (X = 6328A) was used as a photon
source, arranged to project a horizontal beam through the spray at a
* point approximately 40 cm downstream from the nozzle exit. A photo-
multiplier tube was placed opposite the laser to receive the beam, and a
scale was mounted horizontally on the outside surface of the duct as a
means of estimating the optical path length of the laser within the
spray.
15
7 -Ai. . .. .

Fuel rsFlow-srerGauSupply meter P s Gauge
Electril Watt- Whisker Package
, Pressure Gauge
| + Nozzle
Plexiglass Duct PowerSpray Cone Supply
P.M. Tube
Laser
Scale: IDisplay
Water-cooledWhisker Condense (Exhaust Air)
Liquid Trap
Vacuum Blower
(Reusable Fuel) F PFuel Pump
Figure 5c. Schematic Diagram of Droplet Measurement Apparatus
16
. .. . . . . .

SECTION III
PROCEDURES
A number of different test procedures were used to determine the
flow characteristics and performance of the SFI.
A. PRESSURE DROP MEASUREMENTS
Initial flowrate-pressure drop tests (SFI #1 with water) were
carried out by simply setting the desired flowrate, using the flow~IpI
control valve, and observing the flowrate indicator on the digital
frequency counter, recording the measured (millivolt) reading from the
pressure transducer after it reached equilibrium. No particular atten-
tion was paid to the time between readings, nor were any tests of flow-
rate changes with time made during the initial tests. Shortly there-
after, all tests were made with "time of reading" recorded for each data
point taken. A steady increase with time of the pressure required to
achieve a particular flowrate was discovered, and tests with water were
suspended. Because of the concern for possible rust formations none of
the elements of SFI #2 were used with water.
Acetone and dilute citric acid were alternately forced through SFI
#1 (as per Professor Schladitz's recommendation) to remove suspected
clogging material, and tests with Jet Fuel "A" were initiated. Cold
Flow tests comparable to those previously made with water were carried
out as follows: flowrate was set at a fixed value, and pressure readings
were taken every 30 seconds (or 15.0 sec for some runs) for 3 minutes.
During the three minute interval, the fluid exiting the system was
collected in a beaker (of known mass) and weighed to calibrate the
flowmeter for jet fuel. This procedure was repeated for 26 different
17

flowrates ranging from .593 cc/sec to 5.954 cc/sec. Above 5.954 cc/sec,
total run times were reduced to 90 sec, with an interval between read-
ings of 15 sec. Nine more flowrates were measured using this procedure,
extending to a maximum volume flowrate of 13.7 cc/sec. The temperature
of the collected fluid in the beaker was measured with a Brooklyn
mercury-in-glass thermometer.
Heated flow tests without a pressure-drop nozzle downstream from
the injector,were all made with a fixed flow, variable heating rate
format. Pressure, flowrate, and electrical heating voltage and current
values were recorded every 60 seconds. Temperature data from the
thermocouples were displayed and recorded continuously on a stripchart
recorder. Spot-checks of thermocouple readings were made with the
digital voltmeter at irregular intervals during the test,- to serve as
calibration points on the chart.
At the beginning of the test, an initial flowrate was established,
and conditions were allowed to stabilize before heat was added. After
voltage was applied to the heating element, pressure and flowrate were
allowed to adjust themselves, the pressure level being maintained
roughly constant by the tank pressure regulator, with values recorded
each minute. A given heating rate was maintained until the output from
the thermocouples reached an essentially constant value, which condition
usually was taken to be an indication of thermal equilibrium. Such
equilibrium was achieved in a time interval of 6 minutes or less. Once
thermal equilibrium had been reached, a spray "quality" evaluation was
made, and a photograph was taken. Spray quality was estimated on the
basis of what percent of the spray consisted of "mist", the fine, white,
18

cloudlike component. An approximate 10% "mist" spray received a rating
of 1, and so on up to 100% "mist", which received a rating of 10. Thusestimated % mist
rating = I Occasional temperature measurements were
made at the exit of the injector using one of the mercury-in-glas ther-
mometers placed directly in the stream.
A cold flow test with a pressure-drop-producing nozzle downstream
was made following the same format as pressure-drop-producing previous
cold flow tests, except that values of flowrate and pressure were ob-
served every 60 seconds for I hour, and no calibration of the flowmeter
was carried out. Also, the pressure between the whisker package and the
-. nozzle was observed on the Heise gauge and recorded each minute.
Heated tests, with downstream pressure drops, followed three diff-
erent formats and included actual spray sampling. In-tially, heated
tests with a nozzle were carried out with the same procedure as the
heated tests without a nozzle, except for observation of the additional
pressure value resulting from the presence of the nozzle. This pro-
cedure duplication was carried out in order to compare the performance
of the injector under similar conditions, both with and without a down-
stream pressure drop.
Since initial testing had demonstrated that heating rate and down-
stream pressure drop have a great influence on spray quality, tests were
run with the downstream pressure fixed and the heating rate variable, as
well as with heating rate fixed and the downstream pressure varying. In
both of these test formats, adjustments were made to the "fixed" value
to ensure that it would remain relatively constant during a test.
19L di
Adjustments to the nozzle pressure drop were made by simply adjust-
ing the flowrate. The voltage necessary to achieve a particular heating
rate, Q/V, was found by calculation, using the measured volume flowrate
and measured value of the resistance of the heating element. Using both
of the above techniques, either flowrate, and hence pressure drop, or
heating rate could be adjusted independently of each other. As in pre-
vious heated tests, pressure, flowrate, voltage, and current data were
. I recorded each minute. Gauge pressure at the inlet to the whisker pack-
age was monitored by the pressure transducer, and the pressure drop
across the nozzle, discharging to atmosphere, was monitored by the Heise
gauge as before.
20

B. SPRAY EVALUATION
The mean fuel spray droplet diameter and the distribution of
particle sizes about this mean were chosen as the primary quantitative
indices of injector performance to support the qualitative evidence
obtained from visual and photographic observations. One attractive
method for obtaining such size data involves the use of optical scat-
tering techniques, particularly laser scattering, since measurements of
-- I very small (Eub-micron) particles can be made by simply shining a light
beam through the droplet cloud, observing the resultant disperson of the
beam, and inferring the corresponding droplet distribution from well-
established theory. This non-invasive experimental method eliminates
any possible errors due to deformation of the droplets and their adjacent
air flow field because of collisions with a solid collector or probe
* inserted in the stream. In addition, the use of optical scattering
techniques minimizes the necessity for calibrating the measuring instru-
ment against a standard particle-size sample.
However, the selection of the particular laser scattering-droplet
size determination technique from the large number of such methods
currently available requires prior knowledge of the specific range of
sizes anticipated in the sample, each size range requiring slightly
different procedures and theoretical relationships to make the technique
valid.
Thus, in order to justify the use of any laser scattering tech-
nique, the existence of micron-size droplets in the spray must be estab-
lished; and to select the optimum method, the approximate size distri-
bution should also be known. To this end, a rapid, simple and convenient
21
- -S

particle sampling technique was sought. Straightforward techniques
involving insertion of glass slides into the spray and subsequent micro-
scopic examination of the surface of the slides were attempted. Plain
glass slides were tried as well as those coated with various substances
suggested in the literature (Refs. 4,6,7). Among the coatings investi-
gated were talc, paraffin wax, glycerine, teflon, and soot from a
kerosene flame. Of these, the teflon, wax, and talc coatings exhibited
either a surface roughness or a grain size large enough to obscure the
traces of captured particles. Although glycerine-coated slides showed a
propensity for capturing small droplets, it was quite difficult to
distinguish between these traces and those left in the glycerine coating
by some other artifacts, such as room dust. A dry coating was therefore
chosen, with carbon soot offering the best combination of grain size,
.-- ease of handling, and visible permanent record of each sample taken.
Initial investigations of the spray patterns from both injectors were
then conducted with soot-coated slides.
The soot coating was formed on the glass slides by passing them
repeatedly through a smoky flame of kerosene oil, until the slide was
completely coated and opaque. This yielded a coating with a thickness
on the order of 50-100 pm. Thinner coatings were tried, albeit unsuccess-
fully in that replica profiles became very inconsistent, except for the
smallest particle ranges. Impact sites smaller than 10 ps did not seem
to be better defined in the thinner soot layer, so the thick coatings
were retained. Each slide was numbered at one end, and this number was
used as a guide to the orientation of the slide in its placement in the
"sampler" and under the microscope. On the microscope stage, which was
22
q~s... ... ... '" -,'t -="= ._ .- .'-,-:= . , . .-..*.

equipped with a positioning device, slides were always placed with the
number to the viewer's left, and the coordinates of each "sweep" were
read on the positioner, which "was readable to 0.1 m along its x-and
y-axes.
Initially, collection was accomplished by placing a card in the
spray stream and passing a soot-covered slide across a slot cut in the
card. This method was used for the first twenty-four slides made; but a
-* Inumber of slides taken prior to #25 were found to be totally saturated
or to be nearly devoid of measurable particle impaction sites. In an
effort to produce more consistent results, therefore, a shutter mech-
anism was constructed from two wooden disks and an open-ended steel
"can" (see Figure 6). A slot was made in one disk, slightly smaller
than the dimensions of a glass microscope slide. A "pie slice" (in-
cluded angle of 300) was cut out of the remaining disk. By rotating the
second disk directly in front of the "slotted" disk, a slide placed
behind the slot could be exposed to the stream of particles for varying
amounts of time, depending upon the angular velocity of the rotating
disk. The back of the slide was protected by the "can" which fit the
disk tightly.
The rotating disk was turned manually, with a crank. An average
speed for the disk was approximately 6 rad/sec, producing an effective
average exposure time of .087 sec. For very fine sprays (or sprays that
would qualitatively be rated at "90% mist"), some samples were taken at
a slower shutter speed to facilitate the collection of smaller particles
which lose linear momentum faster than larger particles, thereby
23

NEl
d.
-4U,
JJ00
U,
'.0
ciI.'
cc
24

inhibiting the formation of measurable impact sites in the soot. It was
thought that a slower shutter speed would increase the number of part-
icles hitting the slide and, in so doing, increase the number of measur-
able impact sites. This slower speed, corresponding to approximately 4
rad/sec rotational velocity for the disk, resulted in an effective
exposure time of 0.131 sec.
The slides were observed and measured using a Reichert microscope.
* ITwo different objective lenses were used: 11/.25 and 32/.65, with cor-
responding magnification powers of 9 x and 12.5 x. The projected real
image from these lenses was imaged by a television camera mounted on the
microscope, and the resulting video signal was displayed on a monitor.
When viewed on this monitor, an object having a linear dimension of 100
pm has a dimension of 3.56 cm with the 11/.25 objective lens in place
and 9.45 cm if the 32/.65 objective is used. A considerable magnifica-
tion is thus gained through the use of the video display. The monitor
was calibrated by placing a scale with lines 10 pm apart on the stage of
the microscope. Initially this image was traced directly onto the video
pizture tube with short grease-pencil marks along the edge. However, a
more precise scale, with horizontal lines crossing the entire screen,
was made by placing the micro-scale on the stage of the microscope and
carefully measuring the dimensions of the video image. Using these
dimensions, lines were ruled onto clear plastic sheets, one sheet cali-
brated for each objective lens. All slides viewed after 7/12/78 were
measured using these overlay sheets on the video screen. Figure 7 is a
photograph of the field of view seen in the video image.
25
--.. ... . - . -~-.. ~

Gio
"q
F p..'-26

Actual samples were taken as follows: (1) An unused slide was
placed behind the slot in the wooden disk. (2) The "sampler" was then
assembled and placed in the stream. (3) The center of the slide was
positioned near the center of the spray, on-axis with the nozzle at a
downstream location approximately 30-35 cm, a distance judged to be
sufficient for complete development of the spray. (The exhaust fan
normally used to dispose of the spray was turned off during sampling so
that the only momentum carried by the particles was that which they had
upon leaving the nozzle plus that imparted to them by normal air cur-
rents or by neighboring particles interacting with them.) (4) After
being exposed to the spray, the slides were placed in a cardboard box
with a lid, or in a glass sample jar with a lid, and transported to the
microscope.
. . The particle impaction sites, or replicas, were classified accord-
ing to the size ranges into which they fell. Ranges were 0 through 10
pm, > 10 through 20 pm, > 20 through 30 pm, etc., up to 100 pm, with
replicas greater than 100 pm classified simply as > 100 pm. Under
reflected light, it was possible to survey the profile of a suspected
impaction site by focusing up and down through its depth. A consistent
replica was round and had near vertical walls, i.e., a clean "hole"
punched in the soot coating. At the very surface of the coating, the
edges of the "hole" might be tapered, or beveled; but by focusing deeper
into the impression a definite circular outline would appear for a
relatively long range of focus, indicating that the outline was the
image of a vertical surface, on-axis with the optical system. The
diameter of this circular outline was the dimension measured for the
replica. An impression size-to-droplet size ratio of 1.05 is given27

!'
in the literature (Ref. 4). However, since this correction is small,
and its omission gives rise to a larger value for the observed particle
size (corresponding to a decrease in injector performance), the value of
this ratio was taken to be unity as a conservative estimate.
A mean droplet size for each heating rate was calculated by multi-
plying the number of observed impaction sites in each size classifi-
cation by the middle value in that range and dividing the sum of these
* I products by the total number of sites.
Each observed spray at specific settings of heating rate-to-
flowrate ratio and downstream pressure drop was assigned a qualitative
"rating," based on visual observation, and was recorded photograph-
ically. This rating, based on the aforementioned 1-to-10 scale, could
not provide quantitative droplet size information; but it was used to
furnish a reliable relative index by which changes in the spray appear-
ance could be detected and documented, especially when supplemented by a
photographic record.
The non-invasive laser scattering experiments that were conducted
following the glass slide observations were the simplest that could be
carried out with any expectation of quantitative results. Each test
consisted of a straightforward measurement of the attenuation of a
single beam along a straight path through the cloud of fuel droplets.
By utilizing a well-established solution to Maxwell's electromagnetic
wave equations for the case of spherical particles in a monochromatic
beam (Mie theory), one can model this experiment analytically; and de-
pending upon the assumptions made, experimental results can be predicted
for a range of mean droplet sizes and size distributions. Measured
28

experimental data are then compared to the analytical predictions; and,
if agreement is found, the particular distribution and mean droplet size
assumed in the calculations are considered similar to the actual values
for the spray in question. The degree to which the simulated conditions
may be equated to the actual ones then depends upon how well the fol-
lowing assumptions underlying the Mie theory have been met:
(1) light is scattered by individual droplets only and is unaf-fected by the spaces between them;
E I (2) each scatterer is illuminated by the incident beam and not bylight scattered from other droplets; and
(3) the scattering elements are spherical.
-Assuming these conditions to be satisified, the analytical solution
to the attenuation experiment defines the ratio of transmitted beam
intensity to incident beam intensity to be:
I/I = e-v £
where V = attenuation index = f N(a)C(a)da, and0
N(a) = Number of spheres per unit volume of spray having aradius a,
C(a) = Scattering cross-section for a particle radius a,
I = optical path length through the distribution.
Since I/I and i are measured quantities which characterize a
particular size distribution, a value for the attenuation index can be
calculated. Then, based upon an assumed size distribution function, a
series of analytical values of attenuation index are computed theoretic-
ally for a range of mean sphere radii. Finally, each of these calcu-
lated values is compared with the experimentally-determined one; and, if
29

[i
the assumed size distribution function is correct, the mean droplet
radius producing the matching theoretical attenuation index is taken to
be the mean radius of the actual droplet distribution.
Measurements of the intensity ratio (I/I ) and the optical path
length (1) were carried out using the apparatus previously described and
shown schematically in Figure 5c. With the spray off, the photomulti-
plier tube power supply was adjusted so that the tube output was 1.00
volts for the unattenuated laser beam. At this same constant supply
voltage, the spray was initiated and a measurement made of the tube
output for each selected heating rate-to-flowrate ratio. This observed
output voltage then corresponds numerically to the intensity ratio.
The externally-mounted scale was utilized to estimate the optical
path length by noting that those photons scattered by the cloud of
droplets appear to the observer as a thin red line whose approximate
beginning and end points could be identified on the scale. An addi-
tional check on this estimate was made by photographing each spray in
such a way that the laser trace and the scale were both in one frame.
These photographs were all taken from a fixed position more than 2 m
from the spray in order to minimize parallax errors caused by the fact
that the scale was displaced approximately 15 cm radially from the spray
axis. It should also be noted that with the measurement of .9, the spray
cross-sectional area, which is assumed circular, has also been deter-
mined.
30
Lg..

SECTION IV
RESULTS AND DISCUSSION
A. INJECTOR #1 PERFORMANCE
Injector #1 was initially tested with no nozzle downstream from the
injector, and pressure drop characteristics for constant flowrates and
various heating rate-to-flowrate ratios are shown in Figure 8. Note
that volume flowrate is used but may be changed to mass flowrate simply
by multiplying by the density of the fuel at room temperature, .809
gm/cc, since the flowrates used herein are based on the temperature of
the fuel entering the flowmeter upstream from the injector. The rating
of the fuel spray exiting the injector, a qualitative index representing
% mist/10, is shown in Figure 9. No particle size data were taken for
this series of constant mass flowrate tests.
Re-examining Figure 8 it should be noted that the points of minimum
pressure drop all occur at a heating rate-to-flowrate ratio of
approximately 280 J/cc. At atmospheric pressure, with an initial
temperature of 210C, Jet-A fuel begins to vaporize after an enthalpy
change of about 310 J/cc. These two numbers are sufficiently close to
suggest that the increase in pressure drop following the addition of
more than 280 J/cc may be caused by the occurrence of some vaporization
within the injector, since this condition corresponds to a rate of heat
addition essentially great enough to reach the saturation enthalpy of
the liquid fuel.
Figure 9 also has an interesting feature centered-about the heat
addition point of 310 J/cc. The performance of the spray changes very
little up to about 275 J/cc; but above this value, a very small increase
31

C
C',
C3
Cm)
C32
0-~- -- -
* 4 -- - -

PEFRFO RMRNC FVS. HERT/FLONRRTE
0
In
U N ZL
Lfl
0
+
cb. 00 75.00 150. 00 225.00 300. 00 375. 00 450. 00 525. 00 GOO. 00H1ERT/FLOWIRTE J/Mt3 x1O -
Figure 9 Performance Characteristics of Injector #1
33

in heating rate causes a relatively large increase in performance rating.
In fact, the rating jumps from about 1.3 at 275 J/cc to approximately
9.0 at 400 J/cc, an increase of nearly 600% in rating for a 45% increase
in specific heating rate.
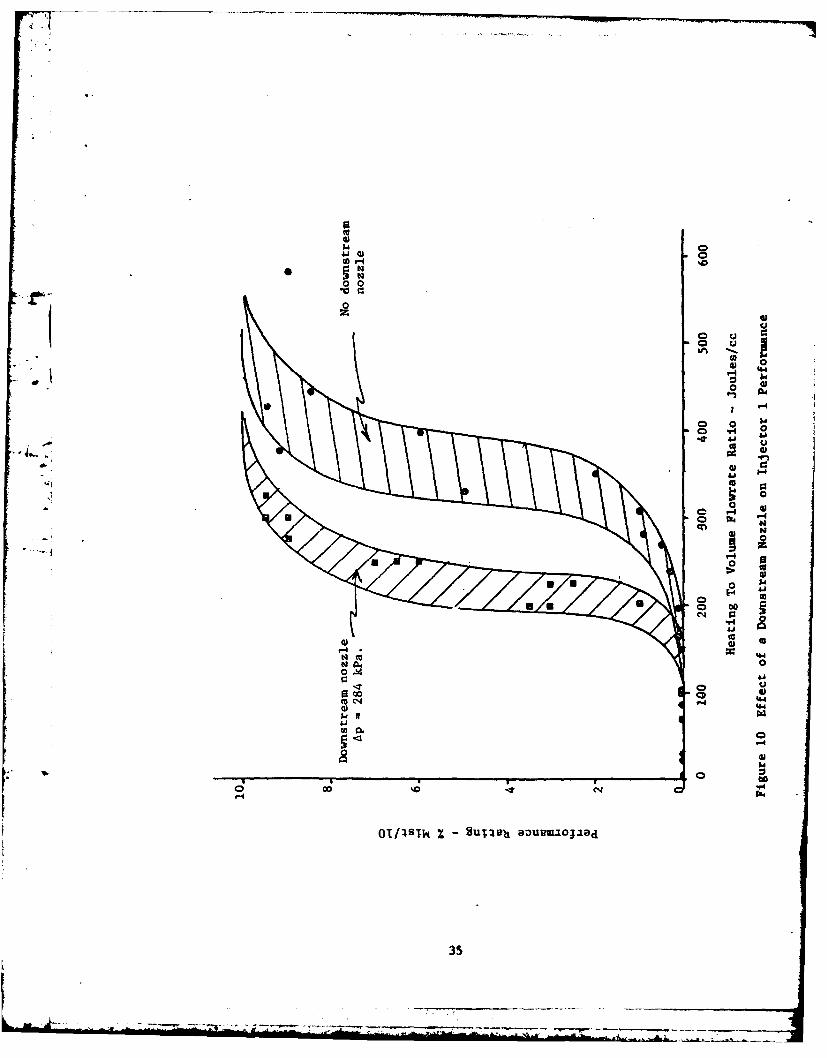
B. ;NJECTOR #1-1
Injector #1-1 was tested with and without a downstream nozzle, with
the average nozzle pressure drop equal to 284 kPa. Figure 10 shows the
marked decrease in heating rate-to-flowrate ratio required for a given
performance rating in tests with a nozzle. Without a nozzle, a rating
of 5 required a heating rate of about 350 J/cc, whereas the addition of
a nozzle reduced the heating requirement to obtain the same spray quality
to about 210 J/cc, a decrease of 40%. This phenomenon occurred in all
tests conducted with a downstream nozzle pressure drop and will be
discussed in more detail later in this report.
In addition to these qualitative performance observations, attempts
were made to measure the mean particle size and droplet size distribu-
tion during tests on injector #1-1, and the data from these tests are
summarized in Section IV-H, "Particle Size Results."
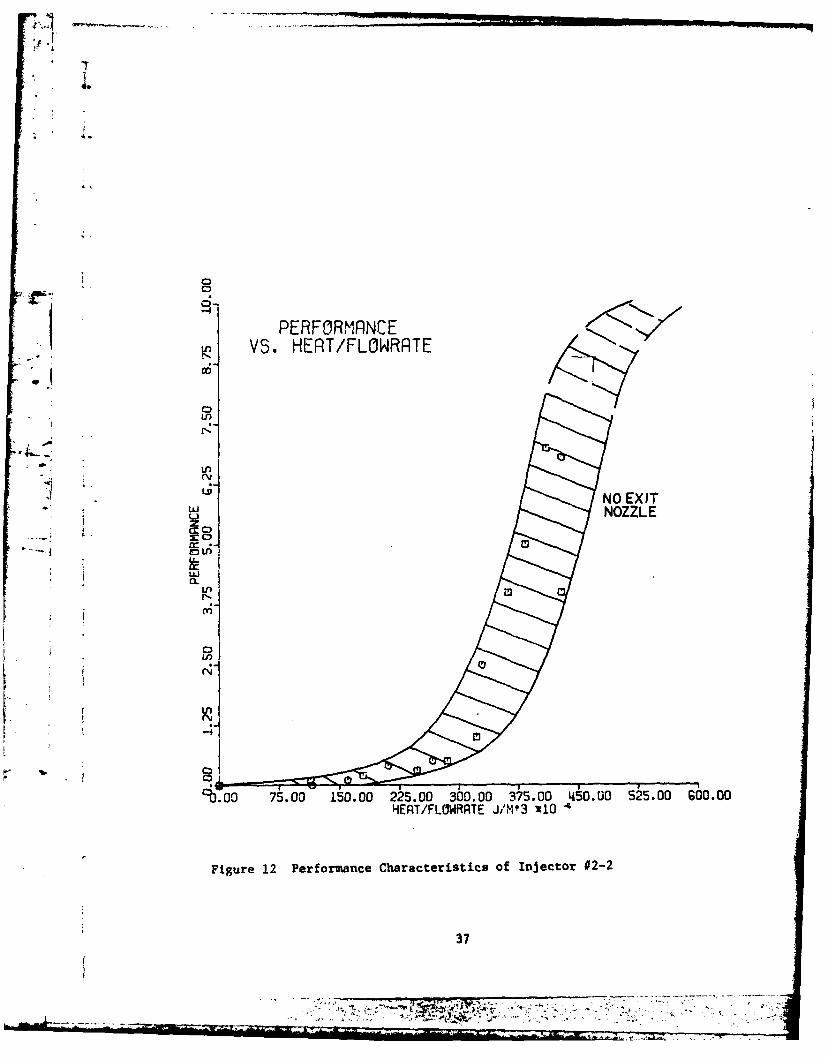
C. INJECTOR #2-2
Figures 11 and 12 indicate the same pressure drop and spray quality
characteristics for injector #2-2 as have already been observed in the
performance of injector #1 and #1-1 in tests with no downstream nozzle,
namely, a minimum in the pressure drop curve at about 280 J/cc and a
rapid increase in performance following a certain critical heating
rate-to-flowrate ratio. Here the rating rises from 1.3 at 325 J/cc to
34
- - - - - --
- -
00 -
0hG 0
0 0
00
El4
0
0
:0
CO.
41.
04 0
000
46.4
- 141
oI/:IsTk % HUII Suwi eUVW0119
35

HERTING TO FLOWRRTE RRTIO
r-
rC
U,
cc0.0
C0
0;
0J24 M
:3C:n
b. 00 75. 00 150.00 225.00 360.00 375.00 4k0.00 525.00 G..0HEAT/FLOWRATE J/Mt3 710 -
Figure 11 Pressure Drop Characteristics of Injector #2-2
36
. if.
2 PERFORM1RNCEVS. HERT/FLOARRTE
Ud
r'.
A.l
Li37
NO EXI

9.0 at 450 J/cc, an increase of 600% in performance with only a 387.
increase in specific heating rate.
The performance curve for this injector was displaced further to
the right on the heating axis than that for injectors #1 and #1-1; i.e.,
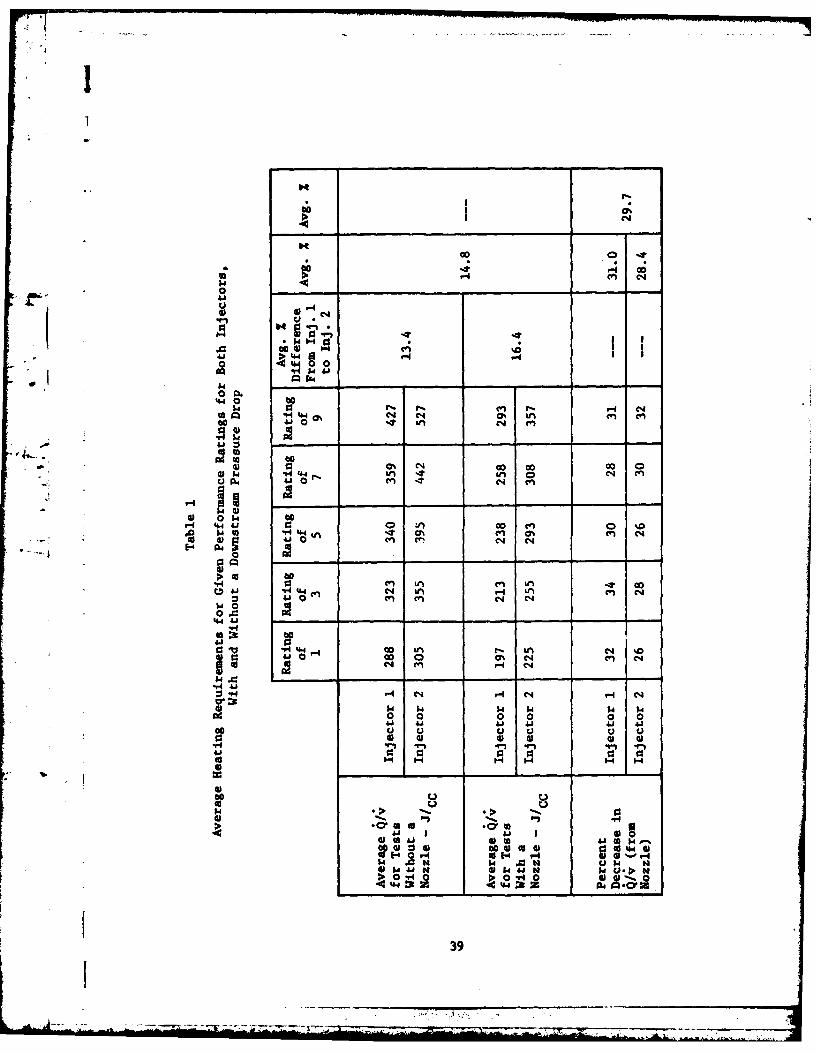
more heat was required to achieve a given rating. Table 1 provides a
comparison of the heating requirements of injectors #1 and #2 for a
given performance rating. The effect of a nozzle is also clearly shown
in this table. On the average, injector #2 required 14.8% more specific
heating than injector #1 for any given performance rating.
D. INJECTOR #2-3
The effect of a nozzle downstream of injector #2-3 is shown again
* .. in Figure 13. Here a spray performance rating of 5 was achieved with a
nozzle at a decreased heating requirement of 275 J/cc, down 35% from the
425 J/cc value without a nozzle. The nozzle pressure drop varied
between 20 and 469 kPa for tests on this injector, but the increased
performance rating seemed almost independent of the magnitude of the
pressure drop. (This was found to be true on all injectors.) The
*optimum pressure drop was not sought for the nozzles utilized herein,
since there had been no attempt to optimize their geometry in relation
to the characteristics of the fuel or the flow rates.
.The pressure drop characteristics exhibited by this injector are
shown in Figure 14. The minimum in the pressure drop curve that was
characteristic of tests on injectors #1 and #2-2 is found in only one of
the eight flowrate conditions tested, viz., in one of the two flows in
which the downstream nozzle was not present (1.50 cc/sec and 2.02
cc/sec).
38
4 I
00 m44 00014 0
$4 P. 1- 4 C4
).0 40% In4 m
to~r. 000 CIA co G G
4 P44 n -41 Ln C
.1~4 0rz W__ to_ -
-A 44nN 0% en at VS C00 4 0 -t C-.1C4 C
to. 0040 0 0% cn C-0
00 0
-H4 4.44 00 LA LM C4 0 %D4- 0 000 4* 0% C14 Nn C
'-4 _ _ _ _ _ - -
04* r4 4
.1 N 1-14ad N
0* 0S 0 0 0
'4. 4*
00 00 ud 9). Ud u u4*0 01 0 0) V
14 >
4*i 4 4* 4* 4* 140 0 0 0 0 40 0
E r-4 to~ EI~ .- 4 4 Z - "
4*00 0 0 0 0
-7 1 Hx 144-

C
PERFORMRNCEVS. HERI/FLONRRTE+
U,
ti 0
Ui
LL
04

7. "
090
o HERTING TO FLONRRTE RPTIO.E- '14. VS. PRESSURE DROP
-I
-- 2.98 CM'S
..... 2. 94
Cl
O 2.74-0
0-
Lii
no
C3.
t-
Figure 14 Pressure Drop Characteristics of Injector #2-3
41

*IIt should be noted that the scale of pressure drops on Figure 14
ranges from 0 to 2,000 kPa, a factor of 10 larger than that of Figure
11, and five times as large as the scale of Figure 8. This abnormally
high pressure drop phenomenon was not studied in detail, but apparently
the injector became partially clogged. This clogging could be due to a
number of circumstances such as thermal cracking of the fuel with sub-
sequent gum formation or "coking," compression of the metal whiskers
* I within the injector volume, or bulk thermal expansion of the whisker
volume at the elevated temperatures encountered during testing. Order
of magnitude analyses of all these possible phenomena were carried out
in order to isolate the most probable causes of the observed increase in
* pressure drop.
The problem of coking or gum formation is of significant interest
..... with the SFI since its performance depends so heavily upon the addition
of heat to the fuel. Although the measured liquid or spray temperature
reached at the exit of the injector was generally below 250°C, there
were several instances during the early testing phases in which local
fuel temperatures :ould have exceeded 500°C, well above the vapori-
zation and typical cracking values. Furthermore, even in those cases
where temperatures were less than 2000C, the time of exposure of the
fuel to these elevated levels may have been sufficiently lengthy to
permit thermal cracking to occur.
A generalized representation of the cracking process in good quality
jet fuels shows that critical exposure times for substantial gum forma-
tion decrease logarithmically with temperature rise from values of about
42
S- -1L

100 seconds at 160*C to 10 seconds at 210*C. In the experiments invol-
ving injectors #1-1 and #2-3, overall residence time of the fuel in the
flow passages did not exceed 10.4 seconds, based upon the minimum tested
flowrate of 1.25 cc/sec; and certainly the average time of exposure to
very high temperatures was substantially below this value. Neverthe-
less, it is possible that a local spot within the whisker network had anlower porosity than the average, causing the fuel to decelerate within
EI that passage and thus to experience longer-than-average residence times.
In some of the earliest tests, temperatures clearly exceeded the
minimum for excessive gum formation, even at relatively high flow rates;
and it is likely that this phenomenon was a major factor contributing to
the high pressure drops encountered in some of these tests as well as to
the observed increase of pressure drop from one test to the next.
Obviously, then, tests of a continuing nature should only be performed
if the temperature does not exceed about 200*C, especially for an experi-
mental setup in which the fuel is collected and re-used.
A related problem observed in a few tests was the time dependency
of pressure drop for a constant flow rate even when no heat was added to
the injector. This behavior was probably due to a spring-like whisker
network which compressed slightly, and inelastically, with the applica-
tion of pressure, creating an apparent decrease in porosity with time.
During testing, it was not always evident that the pressure drop for any
given flowrate and heating rate was approaching some final, constant
value, particularly in the case of injector #2. According to one of
Prof. Schladitz's co-workers, this injector may not have had the whiskers
as well packed into the annular ring (Figure 4b) as originally designed;
43
.. .... . " i ... = . ....... -. .. .
and even after approximately 100 hours of total test time, the pressure
drop across this injector was still increasing, albeit slowly enough to
conduct a meaningful experiment.
In addition to gum formation and possible shifting of the whisker
network resulting from different inlet pressures and flows, the volume
change of the whiskers due to thermal expansion should be examined. The
extreme condition in this situation would be that in which the injector
volume remained unchanged while the whisker volume expanded, thereby
reducing the effective porosity. Assuming an average bulk coefficient
of thermal expansion for nickel of 13 x 10- 6 per OC, wi.th a maximum
temperature rise of 260°C, the change in porosity is approximately
0.25%, which is clearly a negligible decrease when compared to the
several-fold increases in observed pressure drop. Thermal expansion can
therefore be eliminated as a possible contributing factor.
E. COMPARISONS OF PRESSURE DROP CHARACTERISTICS
Figures 8 and 11 both show a minimum in the pressure drop across
the injectors at about 280 J/cc when there is no nozzle downstream of
the injector exit. At a flowrate of 1.50 cc/sec, a test also performed
without a downstream nozzle and the only curve in Figure 14 demonstrating
a pressure minimum, this minimum was again reached at about the same 280
J/cc heating rate. These results can be intepreted with the help of the
enthalpy diagram for Jet-A fuel, Figure 15 (developed from Refs. 1, 2,
3), and with the control volume schematic diagram for a Schladitz Fuel
Injector, Figure 16. Point A on Figure 15 is the initial vaporization
point for Jet-A fuel at atmospheric pressure. At that pressure, any
heat applied to the fuel that causes the enthalpy to exceed 365 J/cc
44
7 - .i . , _

44
0
El a)
co Ao U0
cN" 1 0
I.1 k
ca 00v44
4) %
ma/solor -4dvq'-4
45,
6L44

1II
will result in some vapor formation. Figure 16 shows this change in
enthalpy for the fuel. If it is assumed that all of the energy supplied
to the injector heating coil reaches the fuel, then the enthalpy change
for any test on the SF1 can be approximated as the sum of the heating
rate-to-flowrate ratio and the enthalpy of the fuel entering the injec-
tor at room temperature, 55 J/cc. This value of enthalpy can then be
used on Figure 15 to find the thermodynamic state (liquid, vapor, or
mixture) of the jet fuel spray if either the downstream pressure or
temperature is known.
4 It was suggested earlier that the increase in pressure drop across
the injector for a given flowrate at heating rate-to-flowrate ratios
above 280 J/cc was due to internal vapor formation. This can only be
speculated, since the pressure drop across the injector occurs con-
tinuously through the length of the injector; and, similarly, the heating
takes place over the entire length of the injector. Vapor formation may
possibly occur only at the very end of the injector flow channel, if at
all, in which case the increased pressure drop is not explained ade-
quately by this model. However, the repeatability of the experimental
results, and the close agreement between the enthalpy change required
for vaporization and the actual amount of heat addition (280 J/cc at the
minimum pressure drop), indicates that the existence of fuel vapor may
be a valid explanation. As a further test of this hypothesis, the
experiments performed with a nozzle downstream from the injector (all
flowrates except 2.02 and 1.50 cc/sec in Figure 14), can be examined
in mAre detail. At a pressure drop across the nozzle of one atmosphere
46
- --- ..-----

,in
Fuel In Schlrditz Fuel Injecto Fuel Out
m h mhout0
T 21 0 C Tout 192°CTin Q thermal losses
(hou - h) = 306 J/cc (163 Btu/ibm) For Qloss= 0
Figure 16. Fuel Injector Control Volume Showing Jet-AEnthalpy Change Required to Start Vaporizationof the Fuel (at Atmospheric Pressure)
47

(-100 kPa), the heating rate-to-flowrate ratio required for vapor forma-
tion within the injector is 430 J/cc - 55 J/cc = 375 J/cc, (see Figure
15) an increase of 65 J/cc over the heat addition required to reach the
saturated liquid point at atmospheric pressure. If enough heat were
applied for vapor formation at higher pressures, then the minimum pres-
sure drop points would occur at higher heating rate-to-flowrate ratios,
the ratio for each minimum point depending upon the nozzle pressure
drop. The curves in Figure 14 (except that for 1.50 cc/sec) are con-
sistent with this prediction in that larger heating rate-to-flowrate
ratios would be expected to characterize the minimum pressure drop
points if they were to occur in the extrapolated curves. Large pressure
drops across the injector itself, even without a downstream nozzle,
could also cause the change in the location of the minimum point. (This
may be the reason that the test at 2.02 cc/sec showed no such minimum.)
Thus, the inhibition of vapor formation due to a combination of nozzle
pressure drop and high injector pressures is the most probable cause for
the disappearance of the pressure minima in Figure 14.
F. EFFECT OF DOWNSTREAM NOZZLE ON INJECTOR PERFORMANCE
Table 1 provides a method for comparing injectors 1 and 2 in tests
with and without a nozzle. In all cases, the effect of the downstream
pressure drop was to decrease the heating requirements for a given
performance rating, with an average decrease over all ratings of approx-
imately 30% for both injectors.
48
- - -- -
- f--- -- -

The performance effect of a downstream pressure drop can be examined
in the light of the vaporization hypothesis with the following example,
making use of the enthalpy diagram of Figure 17.
A. Without an exit nozzle B. With an exit nozzle
Rating = 9.5 Rating = 9.5
=412 J/cc = 328 J/cc
AP inj. = 380 kPa AP 585 kPa. PAP nozzle = 0 AP nozzle = 288 kPa
(2.84atm)
For case A, the fuel discharging from the injector is represented
by point 2 in Figure 17. A linear interpolation along the 1-atmosphere
isobar indicates a spray quality of 34% vapor. (Note that this calcu-
lation assumes that all of the electrical energy supplied reaches the
fuel.) For Case B, the fuel entering the nozzle must be represented by
point 3' in Figure 17, corresponding to a state of compressed liquid.
Assuming an isenthalpic expansion across the exit nozzle, the final
state of the fuel is represented by point 3, a mixture containing about
4% vapor.
The results given by this example are typical of those observed in
all injector tests. Test results from the experiments indicate that the
presence of a downstream nozzle would significantly reduce the amount
of, or eliminate all of, the vapor in the stream entering the atmosphere.
This suggests that the high degree of atomization observed when a nozzle
is placed downstream of the injector is not due simply to vaporization
of the fuel within the injector. When there is no downstream nozzle,
however, a significant proportion of the fuel must be vaporized to create
49

"44 0 JJN r. bo 0
A 41 "o 00A i coo " o
xJ C: m~ as*r
4 H,* "4
i .0 $4 0 0 r0)0 Ao 41 . 00 Aj q)
0 u 03 to as4h
0) (1)i "-1i W J (1
00 EJ@ 4
02 0
sa 1r-4w
0004
Rihi
cc
E-42
C-4 0OTZZON V aTMR312SUaso hiZO
- 3noq2TM A/b
0 0 0 0 0 0 0 in 0
m31/salnor' - Ad~vqzu3
50

a fine mist. On the average, a rating of 9 for injector 1, with no
nozzle downstream, required 427 J/cc of specific heat addition, enough
to vaporize 33% of the fuel. However, this same rating was attained
with only 293 J/cc for tests with a nozzle, which is not enough heat to
vaporize any of the fuel. For injector 2, a rating of 9 required, on
the average, 527 J/cc when no nozzle was present, corresponding to about
71% vapor; while with a nozzle, it required 357 J/cc, enough to vaporize
*" I only 17% of the fuel. Thus, the Schladitz Heat Exchanger - Fuel Injector
is not simply boiling the fuel to create an apparently finely atomized
spray, but rather the metal whiskers are apparently playing a signifi-
cant role in the atomization of the fuel in addition to merely increas-
ing the heat transfer surface.
Even though the decrease in heating requirements caused by a down-
stream pressure drop was about the same for both injectors (29.7%),
injector #2 required an average of 14.8% more heat than injector #1 to
achieve a given performance rating (see Table 1). This difference is
demonstrated graphically in Figure 18. Because the geometry and the
amount and type of insulation were different for the two injector de-
signs, the fraction of the electrical energy supplied to the coils that
actually reached the fuel should be expected to be different (as was the
case here) resulting in a difference in performance of the two injec-
tors. Typical photographs relating performance rating and specific
heating rate for tests with no nozzle downstream of the injector are
shown in Figure 19, while Figure 20 presents similar evidence from tests
with a nozzle. These photographs help to clarify the differences in
qualitative performance ratings as assigned by the experimenters.
51

* - 10.7
8
Injector 1 with /Injector 2 with no
exit nozzle extnzl
Injector 2 with
6. xtnzl Injector 1 with no0 I exit nozzle
4.1
0
2
0
0 200 400 600
Heating to Flowrate Ratio -Joules/cm 3
Figure 18 Comparison of Performance Data from Injectors #1 and#2, with and without a Downstream Pressure Drop
52

180 J/cc
.4-Rating -0
343 J/cc
Rating -1.0
381 J/cc
Rating - 2.5
427 J/cc
Rating = 5.0
Figure 19 Typical Photographs of a Test with No Iozzle, Comparing
Performance Rating and Heating to Flowrate Ratio
53

469 J/cc
Rating -6.5
1 579 3/cc
Rating - 9.0
*1 611 J/cc
Rating =10.0
Figure 19 cant 'd
54
__________7. ~.~.~~-_______

0 J/cc
Rating =0.0
100 J/cc
Rating = 0.0
150 3/cc
Rating = 0.0
225 i/cc
Rating =2.5
Figure 20 Typical Photograph of a Test with a Nozzle, ComparingPerformance Rating and Beating to Flowrate Ratio
55

250 J/cc
Rating 7.0
1275 Jc* IRating =9.0
- 300 3/cc
Rating = 9.5 w
325 J/cc
Rating =9.5
Figure 20 cont'd
56
G. "COST" OF HEATING THE FUEL
A performance rating of 9 for these injectors corresponds to a very
fine mist or fog. If it is assumed that a rating of this magnitude is
an indication of an improved combustion process, then the "cost" of such
an improvement can be estimated by evaluating the fraction of the heat
of combustion that must be put back into the fuel in the form of energyBtu
used for heating. (Assume H = 10,560 J/cc, or 19,800 u ). The
results are shown in Table 2.
i* I The corresponding reduced particle size could be beneficial in
three ways:
1) Increased power output from the combustion process utilizing
this fuel,
2) Reduced fuel consumption, and
3) Reduced environmentally harmful exhaust emissions.
All of these are interrelated, of course, and some combination of the
three would most likely be realized.
The overall improvements in combustion efficiency, specific fuel
consumption, and/or exhaust emissions must be sufficient to offset the
use of up to 1.6% of the heating value of the fuel (see Table 2). The
decrease in engine specific fuel consumption itself may be significant
enough to justify the use of such a fuel injection scheme. The cost
factor may also be justified as the combustion efficiency is improved
and as the need for mechanically-complicated and expensive anti-pollu-
tion devices is reduced or eliminated.
57

Table 2
Percentage of the Heating Value, Hv, of Jet-A Fuel That MustBe Used to Give a Rating of 9, or 90% Mist
Injector Number 1 1 2 2
Downstream Nozzle? No Yes No Yes
Flow Rating 9 9 9 9
Specific Heat Addition,/ Joules/cm3 427 293 527 357
Fuel Enthalpy = h, h1 n + Q/v x .523, BTU/LBM 257 186 310 220
* h(% of H ) 100 x - 1.30% .94% 1.57% 1.11%v Hv

H. PARTICLE SIZE DETERMINATIONS
The results of the soot slide study on injector #1-1 with a nozzle
pressure drop of 283 kPa are presented in Figures 21-26, where it should
be noted that the number of particles near the lower limit of resolution
(" ( 10pm) was found to be greater in sprays that were given high quali-
tative ratings than those considered to be lower on the performance
scale. Figures 21 through 23 show the fraction of particles counted
that fell below 10 pm, 20 pm and 30 pm in size, respectively. The
number of particles with sizes larger than the effective upper limit of
4 -the ability of the method to record size accurately, (_100 pm) was found
to be smaller in sprays given a higher qualitative rating (Figure 24).
It is evident from the results presented in Figure 25 that increas-
ing spray quality is accompanied by a reduction in the observed mean
particle size. Similarly, the results presented in Figure 26 indicate
that increasing the heating rate-to-flowrate ratio results in a reduc-
tion in the mean particle size.
Although the value of the mean droplet size measured from the
slides seemed to be only a weak function of heating rate-to-flowrate
ratio (Figure 26), photographic, laser-scattering, and visual evidence
gave rise to the possibility that much more dramatic changes occurred in
the spray as the heating rate was increased. The inability of the
soot-coated slide to characterize impacting droplets accurately, the
spray sampling method, the large droplet measurement limitations, and
the method used to view the collected sample each influenced the data,
so that the measured value may not have been an accurate representation
59

0 ~ 000 ( P
oG
04)
00 $40=0o0 044Ai
-I 4 0
0 C: 4 04
0w
'-o -.0C
00
'-40
0 0 40>CO
+ 44) -400O
-A V4 JJ
CD 4.'
It 0
0 0 0
0 444 Ai a
0 0 w
NNO
060

00
&j 4)
00o2c00
cow
614
I o
to 4'4
00444
-r4o ~ 4
0 r41
door-4
44
'.0 DO-
0U -A
04 cc
000owH-
VI%40 0
4
a0 t
o w to 00
0 43
r.4
61

"4
*14
00cc*
-1
00
0 a4
41
00
x- Aj w 0 4-4 4
41*
10
00 C-4
* ISuOIOTH - Z1s appie19 uga0
-4
C14 4 0 -A>C4-4 - 41 (A
Ai 4o4140 t
V4 U,AI u
41'4 rco 41 44$
41 31
oto"4 r.41
1 4) 4*
-$4U14 "4 tn
62

of the true particle replica size. The possibility of an inaccurate
particle size measurement appeared to be strong in the regions of drop-
let sizes below 10 pm and above 100 m. At or below a size of 10 pm and
at or above a size comparable with the thickness of the soot coating,
the replica profiles became irregular and inconsistently shaped. In
this size class, anything that resembled a depression in the soot was
assumed to be a replica. In the large (> 100 pm) size range, the approx-
imate diameters of whatever impressions existed were measured. Both of
these ranges of measurement exhibited a large amount of scatter in the
data when compared to other particle size ranges, and it is possible
. that the values reported for these ranges were in error because of the
presence of artifacts (see Figures 21 and 26).
The probability that there were many more particles of sizes less
than 10 pm than had been. observed was raised by the existence of ob-
viously wetted areas on slides taken in high performance sprays, but
with an absence of measurable impact sites. Wetted areas on such slides
appeared very rough, similar to what one might expect to see if a very
large number of 10 pm sites overlapped each other. Also, researchers in
earlier studies have found that an effective lower limit of particle
size determination for this and similar techniques is about 10 pm (Refs.
4,5,6,7). Still another indication that there may be large numbers of
unrecorded particles smaller than 10 jm is the existence of sample
slides with as many as 47% of all counted impaction sites in this size
class. The occurrence of these slides was inconsistent with other
samples taken under similar flow and heating conditions, and they were
therefore treated as anomalies, not to be included in the presentation
of results. It was thought that the sample-taking device might be63

acting somehow as a particle-size discriminator and in this way, influ-
enced on random occasions by the uncertainty introduced by hand-cranking
the shutter, only "small" size particles might reach the soot slide. In
an attempt to isolate this possible effect, a number of samples were
taken at different "shutter speeds," holding the flow conditions constant.
Two different shutter speeds, "normal" and "slower," used at three fixed
spray quality ratings (10%, 50% and 90% mist) showed, for 2 ratings, a
noticeable increase in measured mean particle size for the slower shutter
speed. In the third case (90 "mist") the entire slide was wetted and,
under observation with the microscope, seen to be very "rough" on its
surface for the slower speed, while for the normal speed a replica size
distribution more consistent with previous samples was found. These
results reinforce the Suspicion that the collection shutter is indeed
acting as a size discriminator.
In the range of sizes larger than the soot thickness, the ratio of
replica size to particle size increases, i.e., the impression in the
soot layer grows relative to the particle size. This raises the possi-
bility that the mean, calculated from impressions made by particles that
are above the effective lower limit for soot, is actually lower than
reported. On the other hand, as discussed subsequently, laser scat-
tering experiments suggest that a significant fraction of large-sized
droplets may have been present at the lower heating rates.
The correction factor from the literature of I for the ratio of1.05
soot replica size to droplet size was not introduced into the data
reduction. The resultant implied assumption that replica size equals
droplet size is therefore a conservative estimate of the spray char-
acteristics.64

The implied existence of many uncounted small (< 10 pa) droplets
and the large uncertainties inherent in the soot-slide technique, sug-
gested that an optical scattering system might be the logical next step
in the investigation of the characteristics of sprays produced by the
Schladitz fuel injector. It was felt that the elimination of uncer-
tainties due to invading the flow of particles might be expected to lead
to the development of a more accurate quantitative index of fuel spray
performance. Therefore, a straightforward scattering experment con-
sistent with time and resource limitations was chosen, as mentioned in
the PROCEDURES section. The results of this investigation were not
'4- conclusive in an absolute sense; but they did reinforce previous quali-
tative observations of the variation of mean droplet size with heat
addition to the fuel. Furthermore, the mean size dependency upon heating
rate deduced from theory was found to be surprisingly insensitive to the
assumed particle distribution function, thus reinforcing the choice of a
highly simplified experiment.
Since the Hie scattering theory inextricably binds the mean par-
ticle radius, i, with its distribution function, N(a), one must either
determine these two parameters from a series of independent measurements
or assume a knowledge of one of them and derive the corresponding value
of the other from experiments. In the first case, it would have been
necessary to obtain a large number of laser beam attenuation ratios,
1/10, each at a known and fixed scattering angle, 9, measured with
respect to the direction of the incident beam, and each with its partic-
ular optical path length, k, to be determined by separate measurement at
65
, - .... - ,. C :;; L ,. , r- - ,
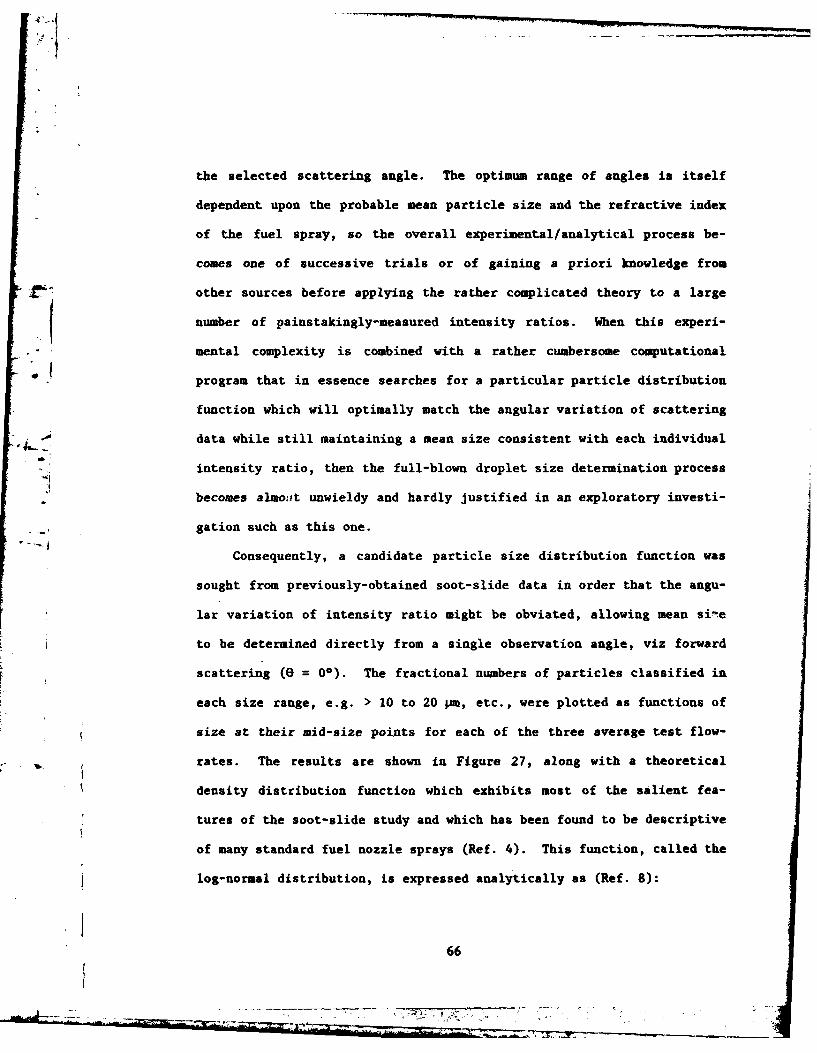
the selected scattering angle. The optimum range of angles is itself
dependent upon the probable mean particle size and the refractive index
of the fuel spray, so the overall experimental/analytical process be-
comes one of successive trials or of gaining a priori knowledge from
other sources before applying the rather complicated theory to a large
number of painstakingly-measured intensity ratios. When this experi-
mental complexity is combined with a rather cumbersome computational
program that in essence searches for a particular particle distribution
function which will optimally match the angular variation of scattering
data while still maintaining a mean size consistent with each individual
intensity ratio, then the full-blown droplet size determination process
becomes almo. t unwieldy and hardly justified in an exploratory investi-
gation such as this one.
Consequently, a candidate particle size distribution function was
sought from previously-obtained soot-slide data in order that the angu-
lar variation of intensity ratio might be obviated, allowing mean sie
to be determined directly from a single observation angle, viz forward
scattering (e = 00). The fractional numbers of particles classified in
each size range, e.g. > 10 to 20 pm, etc., were plotted as functions of
size at their mid-size points for each of the three average test flow-
rates. The results are shown in Figure 27, along with a theoretical
density distribution function which exhibits most of the salient fea-
tures of the soot-slide study and which has been found to be descriptive
of many standard fuel nozzle sprays (Ref. 4). This function, called the
log-normal distribution, is expressed analytically as (Ref. 8):
66- --- ~ ~

.3
m .2
0
0
0 •U- 35 O-..
• al , - 27I--
10 20 30 40 50 60 70 80 90 100
.I-- Droplet Size (Ip-m)
(a) Soot Slide Study Results
.3
v40. .20
Sb
0
M14
U " in47 1
'U a 27 I-m
10 20 30 40 50 60 70 80 90 100
Droplet Size (1J-m)
(b) Log Normal Distribution
a - 30 uI-m
Figure 27. Experimental and Theoretical Particle Size Distributions
67
. .. . ... - -" '-;: -'' " ' -f ...z ... .. '". ,Lk ... . . : ... ... , 4

n + in (in+ 1
exp 2 (
Sf~a) = ,.
a 2n In (+ 1)
where a is the standard deviation.
Utilizing this (or any other) prescribed distribution function as
an input, the mean droplet radius corresponding to each measured inten-
sity ratio was calculated from Hie theory, utilizing a Fortran program
on the Cyber 72 computer. The variation in this mean size determination
with changes in the heating rate-to-flowrate ratio is shown in Figure 28
for the log-normal distribution. The most striking feature of these
results is the strong dependence of mean droplet size on the heating
rate at any flowrate. In the range of interest, from about 150 to 300
Joules/cc, the predicted mean size decrea .es nearly four fold. If these
results are reasonably accurate, the dramatic improvement in spray
quality described earlier on a rather coarse rating scale is certainly a
reasonable expectation.
The large discrepancy between the calculated mean droplet size
(Figure 28) and the soot-slide measured values at very low heating
rate-to-flowrate ratios (Figure 26) is disconcerting in that the uncer-
tainties in the assumed size distribution function are potentially as
great as those in the rough experimental measurements. In an attempt to
ascribe some reasonable degree of confidence to the calculated values,
it seemed desirable to investigate the sensitivity of the theoretical
computations to the form of the assumed distribution function. To this
end, the extreme case of a mondisperse spray, in which all droplets have
68
. .... 'r----

Volume Flowrate m3 /sec
A - 3.9 x 10- '
B - 3.0 x 10- s
200 C - 2.2 x 10- 6
175
"150
125
-~100
Cu
., . 75
C
S 50 3A
25
I I 0 I I0100 125 150 175 200 225 250 275 300
Heating Rate to Flowrate Ratio (J/m1)
Figure 28. Mean Droplet Radius vs. HeatLng to FlowrateRatio for Assumed " g-Normal Size Distribution
69
777TZ h-

the same size, was applied to the experimental measurements of intensity
ratio. The resulting variation of mean size with heating rate at each
of the three flow rates is shown in Figure 29, and it is seen that both
the shape and order of magnitude of the two sets of curves (Figures 28
and 29) are quite similar. In fact, the mean size range exhibits very
little difference with assumed distribution function, except at the
extreme ends of the heating rate-to-flowrate scale, where the mono-
disperse assumption produces more extreme values of the mean sizes.
As relative indicators of the spray behavior, however, the two
results are in agreement, both showing the same favorable change in
spray quality with increased heat addition and the somewhat less pro-
nounced dependence of mean particle size upon pressure drop as evidenced
by increasing flow rate. Based on this comparison between an admittedly
limited selection of assumed size distributions, it appears that a
simple function, such as the monodisperse case, is capable of providing
as good a relative indication of spray performance as the more compli-
cated continuous distribution. Thus it would appear that the time-
consuming and potentially costly task of numerically integrating the
attenuation index equation over the entire range of expected droplet
radii may be sidestepped with acceptable levels of uncertainty.
Having established the laser attenuation experiment as a reasonable
means of objectively detecting changes in the injector characteristics,
we now turn our attention to determining how much, if any, physical
significance (beyond the idea of a relative index of droplet size) can
be attached to the "observed" droplet radius. Because the technique is
based upon accepted theory and other arguments based on well-established
70
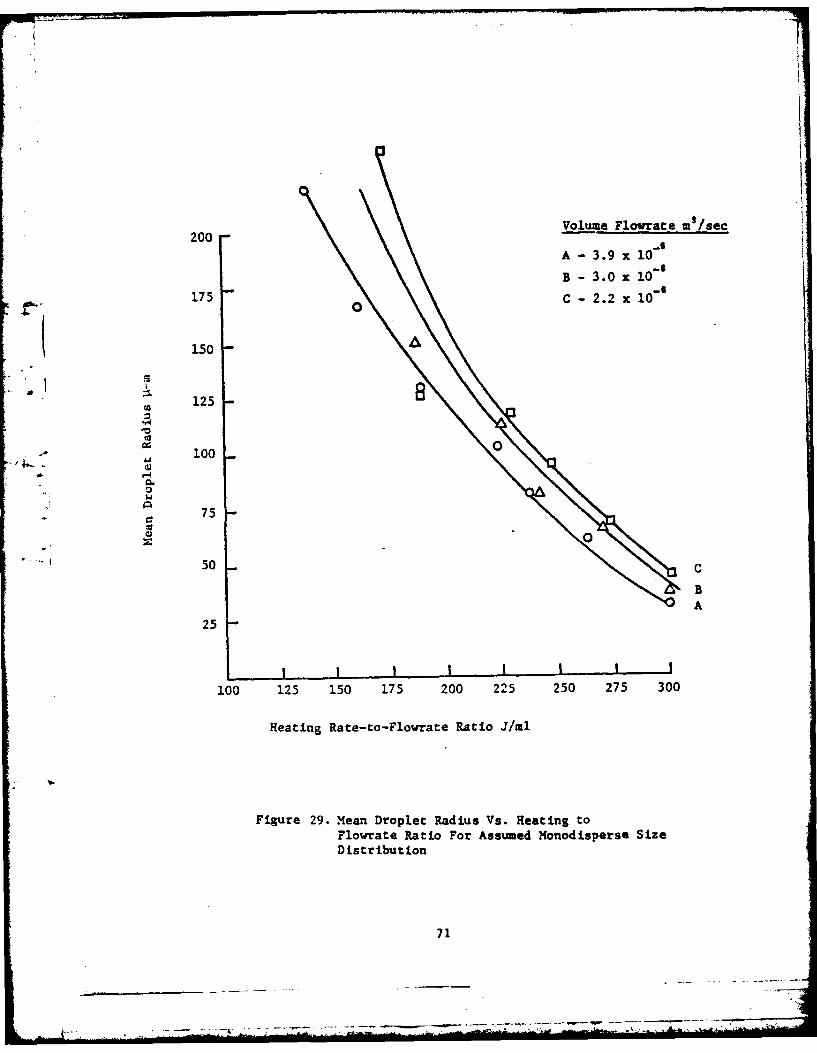
Volume Flowrate m9/6 ec200 -
A -39 x -1
A - 3.0 x 10 -
175 C - 2.2 x10-
150
El 1258
10
00
50 0
75
50 12c5 7 0 2 5 7 0
Heating Rate-to-Flowrate Ratio J/ml
Figure 29. Mean Droplet Radius Vs. Heating toFlowrate Ratio For Assued Monodisperse SizeDistribution
71
77I

physical principles, the question of attaching physical significance to
the measured mean droplet radii is basically one of establishing the
validity (or lack thereof) of the assumptions made in the interpretation
of the experimental observations.
There is little one can say about the first assumption, that of
discrete scatterers, other than simply to state it. However, if we
consider the sizes "observed" in this study, we find the smallest value
of about 30 pm much larger than typical molecular dimensions (< 10
Furthermore, the evidence of the soot slide study clearly shows the
presence of discrete droplets of fuel. Hence, the assumption of dis-
* crete scattering elements seems reasonable.
The second assumed condition for validity of the theory is that of
single scattering of photons from the incident beam. A rule of thumb in
popular use (Ref. 9) proposes that if the product of attenuation index
and optical path length is less than 0.1, single scattering predomi-
nates. When the product is between 0.1 and 0.3, corrections for multiple
scattering may be needed; while fer values greater than 0.3, multiple
scattering will dominate. In the experiments reported herein, this
product varied from about 0.15 at the largest droplet sizes to nearly
1.5 for the smallest. This clearly suggests the presence of some
multiple scattering, which may be examined from the point of view of its
effect on the results at the small size end of the distribution spectrum.
A careful comparison of the relative effects of this assumption on the
calculated values indicates that agreement between experimental obser-
vations under conditions of multiple scattering with analytical solu-
tions under assumed single scattering conditions is found for a mean
72

calculated droplet size larger than the actual size present in the
spray. Thus, departure from the single scattering state will lead to
predicted spray characteristics which are not as favorable as those
likely to be encountered. To this end, the assumption is conservative
when used in the evaluation of the Schladitz whisker injector.
The third assumed condition, that of spherical droplets, is satis-
fied if the influence of surface tension is much stronger than that of
* viscous drag on the particles. Selecting a drag coefficient dependent
upon Reynolds number in the velocity range between approximately 10
meters/sec initial speed and 0.1 m/sec terminal speed, and noting the
decrease of surface tension with increasing temperature, the sphericity
criterion was calculated for a wide spectrum of particle sizes (30-
200 pm). In all cases, it was found that surface tension effects pre-
dominate as the droplets approach terminal velocity. A further calcu-
lation of particle trajectories then showed that this steady-state
velocity would be reached or approached to a satisfactory degree before
entering the light-scattering region. The assumption of spherical
particles is therefore justified.
73I-

SECTION V
CONCLUSIONS AND RECOMENDATIONS
From the analysis of the test results obtained to date, several
conclusions about the Schladitz Fuel Injector may be drawn:
1) With no pressure drop downstream from an injector, heat must
be supplied in quantities sufficient to vaporize a significant
proportion (33 to 71%) of the fuel flowing through the in-
jector in order to attain a satisfactorily high performance
rating (9.0 or 90% mist).
2) With a downstream pressure drop of 20 to 469 kPa, such as may
be attained with a simple nozzle, a high performance rating
(9.0) can be attained with a significantly lower heating rate,
thereby vaporizing a smaller percentage of the fuel (0 to 17%)
than without a pressure drop.
3) With or without a nozzle downstream from the injector, a
maximum of 2% of the heat of combustion of the fuel must be
returned to the fuel in the form of electrical energy to the
injector. This includes any heat loss through the injector to
the surroundings.
4) Collection of fuel spray droplets on soot-coated slides show
that the mean replica size of particles leaving the injector
and the fraction of large (greater than 100 pm) particle
replica sizes decrease substantially with increased heating
rate-to-flowrate ratio, and the fraction of small (less than
20 pu) particle replica sizes increases with increased heating
rate-to-flowrate ratio.
74

5) Theoretically-based calculations of the dependency of mean
particle size on heating rate-to-flowrate ratio, obtained from
simple laser scattering experimental data, support the quali-
tative evidence of soot slide collection methods.
6) Although these semi-empirical results show wider divergence of
mean sizes than the soot-slide experiments, their insensi-
tivity to assumed distribution function is encouraging, and
" l their validity in the present experimental circumstances is
readily substantiated.
On the basis of the promising, but as yet preliminary and incom-
'4 ..... plete results, it is recommended that further tests be carried out on
the Schladitz Fuel Injector to determine:
1) optimum or critical nozzle pressure drop for the best per-
formance of the injector at a particular heating rate-to-
flowrate ratio,
2) accurate particle size distribution using an appropriate
optical technique applied over the anticipated range of mean
sizes,
3) performance of this particular injector geometry using a
different fuel type, e.g., a residual fuel oil,
4) actual combustion performance of the injector under realistic
environmental conditions.
75
=MLA.:

REFERENCES
1. J. B. Maxwell, Data Book on Hydrocarbons, D. VanNostrand Company,Inc., Princeton, N.J., 1960.
2. Baumuster, T., Avallone, E. A., and Baumater, III, T., Mark'sStandards Handbook for Mechanical Engineers, McGraw-Hill BookCompany, New York, 1978.
3. Barnett, H. C., and Hilbard, R. R., Properties of Aircraft Fuels,NACA TN 3276, Washington, August, 1956.
4. E: Giffen, A. Muraszew, The Atomization of Liquid Fuels, John Wiley
and Sons, New York, 1953.
5. E. Sher, and C. Elata, Spray Formation from Pressure Cansby
4 L Flashing, Ind. Eng. Chem., Process Des. Dev. , Vol. 16, No. 2, 1977(page 237).
6. K. R. May, The Cascade Impactor: An Instrument for Sampling CoarseAerosols, Journal of Sci. Insts., Vol. 22, Oct. 1945.
7. K. R. May, The Measurement of Airborne Droplets by the MagnesiumOxide Method, Journalof Sci. Insts., Vol. 27, May 1950.
8. Choi, S. C. , Introductory Applied Statistics in Science, Prentice-Hall, 1978.
9. van de Hulst, Light Scattering by Small Particles, Wiley, 1957.
76

APPENDIX A
PROPERTIES OF JET-A FUEL USED FOR THIS REPORT
Volume average boiling point = 4090F (209C)
Weight average boiling point = 411*F (211°C)
Mean average boiling point = 410F (210°C)
Molal average boiling point 407°F (2080C)
Normal boiling point = 379*F (193°C)
Characterization Factor = 11.7
Molecular Weight = 163
Specific gravity, 600F, 42*API or .8155
High heating value 19,850 Btu/lbm
* Low heating value 18,550 Btu/lbm
77
7'

APPENDIX B
14 ~ ~ C 9.4 a 0
r4 cg*
44 "4 .4'
r4 an C*4 "40
E-4 0.
600.
% d 4 0 0 in 0 0
0
r4 " r4di0 "4I i4 M " Nf-I
0 $4d
4.5 '.4 4 4
S 79

DISTRIBUTION LIST
Copy No.
1 - 6 Power Programs (Code 473)Office of Naval Research800 N. Quincy StreetArlington, VA 22217
7 Dr. David H. LewisJet Propulsion Lab4800 Oak Grove DriveMail Stop 122-101Pasedena, CA 91103
8 Dr. Ronald Kostoff* Department of Energy
'4 - 400 First Street, N.W.Room 509
Washington, D.C. 20545
9 - 10 Mr. C. Richard MainAdministrative Contracting OfficerOffice of Naval Research Resident Representative2110 G. Street, N.W.Washington, D.C. 20037
11 - 12 J. E. Scott
13 - 14 G. B. Matthews
15 K. A. Havey, Jr.
16 J. Z. Colt, Jr.
17 M. A. Townsend
18 Office of Sponsored Programs
" 19 - 20 E.H. PancakeClark Hall
21 RLES Files
22 - 82 See ONR Distribution List
D#200R
2269:LLL
Univ. of Virginia
Cntr. # N00014-77-C-0564094-376
Schliditz Fuel Inj. Sys.
Recipient No. of Copies
Defense Documentation CenterCameron Station (12)Alexandria, Virginia 22314
Chief of Naval ResearchDepartment of the NavyArlington, Virginia 22217
Attn: Mr. J.F. Patton, Jr., Code 473 (2)
CommanderNaval Air Systems CommandDepartment of the NavyWashington, D.C. 20360
Attn: Code 330 (1)Code 310 (1)Technical Library, Code 604 (1)
CommanderNaval Sea Systems CommandDepartment of the NavyCP# 6 Room 8062211 Jefferson Davis HighwayArl.;>.jton, Virginia 20360
Attn: Chas. L. Miller (1)
The Boeing CompanyHeadquarters OfficeP.O. Box 3707Seattle, Washington 98124
Attn: Gas Turbine Division (1)
General Electric CompanyAircraft Gas Turbine DivisionCincinnati, Ohio 45215
Attn: Manager of Engineering (1)
(7

Recip.ent No. of Copies
Commanding OfficerU.S. Army Research OfficeBox CM, Duke StationDurham, North Carolina 27706Attn: Mr. Jas. Murray (1)
DirectorNational Aeronautics & Space AdministrationHeadquartersWashington, D.C. 20546Attn: Division Research Information (1)
DirectorNational Bureau of StandardsGaithersburg, Maryland 20760 (1)
Office of the Assistant Secretaryof Defense (R&D)
- Room 3E1065- The PentagonWashington, D.C. 20301
Attn: Technical Library (I)
"* Aerojet-General CorporationP.O. Box 296Azusa, California 91702
Attn: Librarian (1)
AiResearch Manufacturing Company9851 Sepulveda BoulevardLos Angeles, California 90045Attn: Chief Engineer (1)
General Motors CorporationAllison DivisionIndianapolis, Indiana 46206Attn: Director of Engineering (1)
General Electric CompanyEngineering DepartmentTurbine DivisionSchenectady, New York 12305 (1)
General Electric CompanyAircraft Turbine DepartmentWest Lynn, Massachusetts 01905 (1)
AVCO CorporationLycoming Spencer Division652 Oliver StreetWilliamsport, PA 17701 (1)
-* , - - -. , . *., * , * • ,

Recipient No. of Copies
National Aeronautics & SpaceAdministration
Lewis Research Center21000 Brookpark RoadCleveland, Ohio 44135 (2)
United Technologies Corporation* Pratt & Whitney Aircraft Group
East Hartford, Conn. 06118Attn: Chief Engineer (1)
Solar Aircraft Company* San Diego, California 92101
Attn: Chief Engineer (1)
United Technologies Research CenterEast Hartford, Conn. 06118Attn: Director of Research (1)
- CommanderNaval Surface Weapons Center
- White OakSilver Spring, Maryland 20910
--- Attn: Library (1)
CommanderNaval Weapons CenterChina Lake, California 93555
Attn: Technical Library (1)
CommanderWright Air Development CenterWright-Patterson Air Force Base, Ohio 45433Attn: WCLPN-1, WCACD, WCLPS-l (3)
DirectorU.S. Naval Research Laboratory4555 Overlook Avenue, S.W.Washington, D.C. 20375
* I Attn: Technical Information Division (6)
Office of Naval ResearchDepartment of the NavyCode 102D1ARlington, Virginia 22217 (1)

Recipient No. of Copies
DirectorOffice of Naval Research Branch Office536 South Clark StreetChicago, Illinois 60605 (1)
Officer in ChargeNaval Ship Engineering CenterPhiladelphia DivisionPhiladelphia, PA 19112Attn: Code 6700 (1)
Technical Library (1)
SuperintendentU.S. Naval Postgraduate SchoolMonterey, California 93940
Attn: Professor Max Platzer (1)Library, Code 0212 (1)
United Technologies CorporationPratt & Whitney Aircraft GroupGovt. Products Div.P.O. Box 2691West Palm Beach, Florida 33402 (1)
Naval Ship.Research & Development CenterAnnapolis DivisionAnnapolis, Maryland 21402
Attn: Library, Code A214 (1)
DirectorOrdnance Research LaboratoryPennsylvania State UniversityUniversity Park, PA 16802 (1)
Naval Surface Weapons CenterDahlgren, Virginia 22448Attn: Technical Library (1)
Project SQUIDJet Propulsion CenterSchool of Mechanical EngineeringPurdue UniversityLafayette, Indiana 47907
Attn: Professor Murthy (1)

Recipient No. Of Copies
DirectorApplied Physics Laboratory8621 Georgia AvenueSilver Spring, Maryland 20910
Attn: Library (1)
CommanderAir Force Aero Propulsion LaboratoryWright-Patterson Air Force BaseDayton, Ohio 45433 (1)
CommanderI Air Force Rocket Propulsion Laboratory
Edwards Air Force Base, California 93523 (1)
CommanderAir Force Office of Scientific Research1400 Wilson Boulevard
* Arlington, Virginia 22209Attn: B. Wolfson (1)
* - -- :f-- - -

UINERSITY OF VIRGINIASchool of ..gineering and Applied Science
The University of Virginia's School of Engineering and Applied Science has an undergraduate enrollmentof approximately 1,450 students with a graduate enrollment of approximately 500. There are 125 facultymembers, a majority of whom conduct research in addition to teaching.
- Research is an integral part of the educational program and interests parallel academic specialties. These-, ..... range from the classical engineering departments of Chemical, Civil, Electrical, and Mechanical and
Aerospace to departments of Biomedical Engineering, Engineering Science and Systems, Materials* Science, Nuclear Engineering and Engineering Physics, and Applied Mathematics and Computer Science.
In addition to these departments, there are interdepartmental groups in the areas of Automatic Controls andApplied Mechanics. All departments offer the doctorate; the Biomedical and Materials ScienceDepartments grant only graduate degrees.
-- The School of Engineering and Applied Science is an integral part of the University (approximately 1,500full-time faculty with a total enrollment of about 16,000 full-time students), which also has professionalschools of Architecture, Law, Medicine, Commerce, Business Administration, and Education. In addition,the College of Arts and Sciences houses departments of Mathematics, Physics, Chemistry and othersrelevant to the engineering research program. This University community provides opportunities for
1' interdisciplinary work in pursuit of the basic goals nf education, research, and public service.
II
I '