virginia college savings plan, annual report for the ... · aom:63 . 3 management’s ... (irc)...
TRANSCRIPT


- T A B L E O F C O N T E N T S -
Pages
INDEPENDENT AUDITOR’S REPORT 1-2 MANAGEMENT’S DISCUSSION AND ANALYSIS 3-8 FINANCIAL STATEMENTS:
Statement of Net Assets – Enterprise Fund 10 Statement of Revenues, Expenses, and Changes in Net Assets – Enterprise Fund 11 Statement of Cash Flows – Enterprise Fund 12-13 Statement of Fiduciary Net Assets – Private-Purpose Trust Funds 14 Statement of Changes in Fiduciary Net Assets – Private-Purpose Trust Funds 15 Notes to Financial Statements 17-24
BOARD MEMBERS 25

1
December 5, 2003 The Honorable Mark R. Warner Governor of Virginia The Honorable Kevin G. Miller Chairman, Joint Legislative Audit and Review Commission Board Members Virginia College Savings Plan
INDEPENDENT AUDITOR’S REPORT We have audited the accompanying financial statements of the enterprise fund, which is a major fund, and the private-purpose trust funds of the Virginia College Savings Plan (Plan) as of and for the year ended June 30, 2003, which collectively comprise the Plan’s basic financial statements as listed in the table of contents. These financial statements are the responsibility of the Plan’s management. Our responsibility is to express opinions on these financial statements based on our audit. We conducted our audit in accordance with auditing standards generally accepted in the United States of America and the standards applicable to financial audits contained in Government Auditing Standards, issued by the Comptroller General of the United States. Those standards require that we plan and perform the audit to obtain reasonable assurance about whether the financial statements are free of material misstatement. An audit includes examining, on a test basis, evidence supporting the amounts and disclosures in the financial statements. An audit also includes assessing the accounting principles used and significant estimates made by management, as well as evaluating the overall financial statement presentation. We believe that our audit provides a reasonable basis for our opinions. As discussed in Note 1, the basic financial statements of the Plan are intended to present the financial position and the changes in financial position and cash flows of only that portion of the business-type activities, major enterprise fund, and aggregate remaining fund information of the Commonwealth of Virginia that is attributable to the transactions of the Plan. They do not purport to, and do not, present fairly the Commonwealth of Virginia’s overall financial position as of June 30, 2003, and the changes in its financial position and its cash flows, where applicable, for the year then ended in conformity with accounting principles generally accepted in the United States of America.

2
In our opinion, the financial statements referred to above present fairly, in all material respects, the respective financial position of the enterprise fund and private-purpose trust funds of the Virginia College Savings Plan as of June 30, 2003, and the respective changes in its financial position and its cash flows, where applicable, thereof for the year then ended in conformity with accounting principles generally accepted in the United States of America.
The “Management’s Discussion and Analysis” on pages 3 through 8 is not a required part of the basic financial statements, but is supplementary information required by the Governmental Accounting Standards Board. We have applied certain limited procedures which consisted principally of inquiries of management regarding the methods of measurement and presentation of the required supplementary information. However, we did not audit the information and express no opinion on it.
In accordance with Government Auditing Standards, we have also issued our report dated December
5, 2003, which includes our consideration of the Plan’s internal control over financial reporting and on our tests of its compliance with certain provisions of laws, regulations, contracts, and grants. That report is an integral part of an audit performed in accordance with Government Auditing Standards and should be read in conjunction with this report in considering the results of our audit.
AUDITOR OF PUBLIC ACCOUNTS SAH:aom aom:63

3
MANAGEMENT’S DISCUSSION AND ANALYSIS
The Virginia College Savings Plan’s Management Discussion and Analysis (MD&A) is required
supplemental information under the Governmental Accounting Standards Board (GASB) reporting model. It is designed to assist the reader in focusing on significant financia l issues and provides an overview of financial activity. This discussion includes an analysis of the Plan’s financial condition and results of operations for the fiscal year ended June 30, 2003. Since this presentation includes summarized data, it should be read in conjunction with the accompanying financial statements and notes.
The Virginia College Savings Plan (the Plan) operates the Commonwealth’s Internal Revenue Code (IRC) Section 529 qualified tuition program, which offers three options, the Virginia Prepaid Education Program (VPEP), the Virginia Education Savings Trust (VEST), and CollegeAmerica. VPEP is considered a defined benefit plan which offers contracts, for actuarially determined amounts, guaranteeing full future tuition and mandatory fee payments at the Commonwealth’s higher education institutions and differing payouts at private or out-of-state institutions. Annually, the Plan’s actuary determines the actuarial soundness of VPEP. Key factors used in the soundness analysis include potential tuition increases (both short and long-term) as well as anticipated investment performance.
VEST is a defined contribution program which allows participants to make contributions into their selected investment portfolio(s). VEST accounts are subject to market investment risk, including the possible loss of principal. CollegeAmerica is also a defined contribution plan which offers 21 different American Funds mutual fund products as investment options. CollegeAmerica participants also bear all market risk for their investment, including the potential loss of principal. The American Funds acts as program manager for this program and provides all back office and operational activities for the program.
Financial Highlights
• VPEP cash, cash equivalents, and investments increased by $151 million, or 34.4 percent, due to both new participation and more favorable market conditions.
• VPEP’s actuarially determined tuition benefits payable liability increased by $395.9 million, or 50.6 percent, primarily as a result of unprecedented tuition increases.
• As a result, VPEP’s total net assets decreased by $174.6 million to a deficit of $232.5 million as compared to a deficit $57.9 million in the prior year.
• VEST net assets held in trust for program participants increased by $121.8 million or about 81 percent, which is also due to increases in investor participation and improved market conditions.
• CollegeAmerica net assets held in trust for program participants more than tripled over the previous year to $3.4 billion.
Overview of Financial Statements
This discussion and analysis is an introduction to the Plan’s basic financial statements, which include the Plan’s business-type activity or enterprise fund, the fiduciary or private purpose trust funds, and the notes to the financial statements.
4
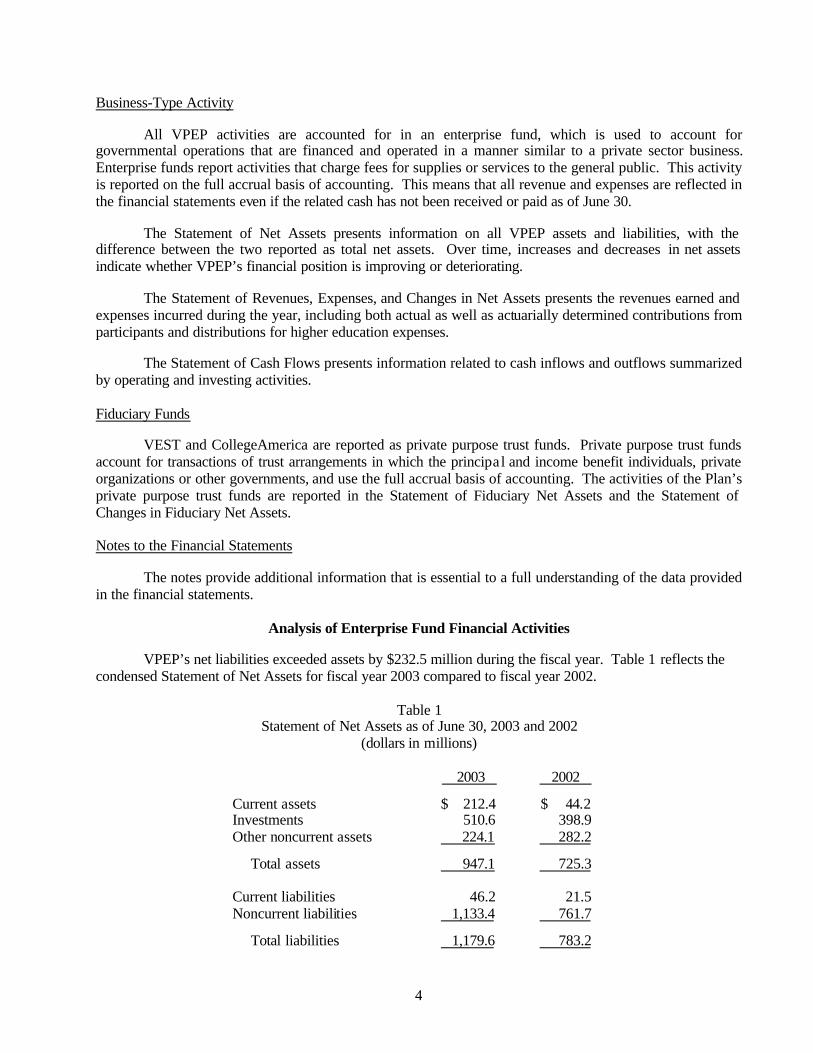
Business-Type Activity
All VPEP activities are accounted for in an enterprise fund, which is used to account for governmental operations that are financed and operated in a manner similar to a private sector business. Enterprise funds report activities that charge fees for supplies or services to the general public. This activity is reported on the full accrual basis of accounting. This means that all revenue and expenses are reflected in the financial statements even if the related cash has not been received or paid as of June 30.
The Statement of Net Assets presents information on all VPEP assets and liabilities, with the difference between the two reported as total net assets. Over time, increases and decreases in net assets indicate whether VPEP’s financial position is improving or deteriorating.
The Statement of Revenues, Expenses, and Changes in Net Assets presents the revenues earned and expenses incurred during the year, including both actual as well as actuarially determined contributions from participants and distributions for higher education expenses.
The Statement of Cash Flows presents information related to cash inflows and outflows summarized by operating and investing activities.
Fiduciary Funds
VEST and CollegeAmerica are reported as private purpose trust funds. Private purpose trust funds account for transactions of trust arrangements in which the principal and income benefit individuals, private organizations or other governments, and use the full accrual basis of accounting. The activities of the Plan’s private purpose trust funds are reported in the Statement of Fiduciary Net Assets and the Statement of Changes in Fiduciary Net Assets. Notes to the Financial Statements
The notes provide additional information that is essential to a full understanding of the data provided in the financial statements.
Analysis of Enterprise Fund Financial Activities
VPEP’s net liabilities exceeded assets by $232.5 million during the fiscal year. Table 1 reflects the condensed Statement of Net Assets for fiscal year 2003 compared to fiscal year 2002.
Table 1 Statement of Net Assets as of June 30, 2003 and 2002
(dollars in millions)
2003 2002 Current assets $ 212.4 $ 44.2 Investments 510.6 398.9 Other noncurrent assets 224.1 282.2 Total assets 947.1 725.3 Current liabilities 46.2 21.5 Noncurrent liabilities 1,133.4 761.7 Total liabilities 1,179.6 783.2

5
Net assets: Invested in capital assets
0.2
0.2
Unrestricted (232.7) (58.1) Total net assets $ (232.5) $ (57.9)
Overall the net assets decreased by approximately $174.6 million.
Current assets increased primarily due to the increase in cash and cash equivalents and to the
classification of a portion of tuition contributions receivable from noncurrent assets to current. Cash and cash equivalents include short-term investments. This line item increased as of June 30, 2003, due to additional cash being allocated to selected managers immediately prior to fiscal year end close for subsequent investment. Total tuition contributions receivable increased by $69.2 million and represented the increase in the actuarially determined amount expected to be collected from contract holders of record at June 30th in the future.
Investments increased by $111.7 million, or approximately 28 percent, due in part to strong investment performance during the last two quarters of the fiscal year. In addition, tuition contributions increased over the prior year due to lump sum/down payments on new contracts as well as continued participation by existing contract holders. The total tuition benefits payable increased by $395.9 million, or approximately 50.6 percent, and reflects the changes in the actuarial present value of the future tuition obligation as well as increases for new contracts issued. Changes in the present value of the future tuition benefit obligation include the changes in the present value discount due to the passage of time, differences between actual experience and the actuarial assumptions used, and any changes in actuarial assumptions. This substantial increase in the tuition benefit payable clearly caused the overall decrease in VPEP’s net assets and resulted in a worsening of the deficit position. During fiscal year 2003, the VPEP’s deficit position moved from $57.9 million to a deficit of $232.6 million. This increase is mostly attributable to higher than expected tuition increases and changes in the actuarial assumptions used in performing the actuarial valuation. Average tuition rates for the 2003-2004 academic year increased approximately 22.1 percent for universities and 28.4 percent for community colleges, which is above the 11.8 percent and 15 percent rates respectively assumed in the prior valuation. The actual tuition increases include both the 2002-2003 mid-year increases as well as the increases for fall 2003. This sharp increase resulted in an actuarial loss of $85 million. The two most significant assumptions in the valuation are the rate of investment return and future tuition growth. The 2003 valuation projects an expected rate of return on investments of 6.75 percent, which represents a 0.25 percent decrease from the 7 percent investment return assumption used in the prior year’s valuation. This change increased the actuarial deficit by $21.4 million. The tuition growth assumption was changed from 11.8 percent for two years and 6 percent thereafter to 15 percent for two years and 6 percent thereafter for university tuition, and from 15 percent for two years and 6 percent thereafter to 15 percent for two years and 9 percent thereafter for community college tuition. This increased the present value of obligations and the actuarial deficit by $81.6 million.
Other changes affecting the actuarial deficit include new contract sales as well as actual investment performance. New VPEP contracts opened during the fiscal year were priced so as to accumulate a reserve, which provided an actuarial gain of $14.8 million to reduce the prior year’s deficit. In addition, the return on VPEP investments for the fiscal year was 5.6 percent on a time-weighted basis and 7.2 percent on a dollar-weighted basis. For the June 2002 actuarial valuation and in developing contract prices, a 7 percent return

6
was assumed. This produced a net actuarial gain of approximately $1 million. By comparison, the return from the prior year was -1.4 percent.
The overall effect of the changes on the actuarial reserve (deficit) are summarized in the following
table. Please note that the full actuaria l valuation report may be obtained from the Plan.
Table 2 (amounts in millions)
Actuarial reserve (deficit) at June 30, 2002 $ (57.9) Tuition gain (loss) (85.0) Change in investment return assumption (21.4) Change in tuition growth assumption (81.6) Contribution to reserve from new sales 14.8 Investment gain (loss) 1.0 Interest on prior deficit at 7.0% (4.1) Miscellaneous 1.6 Actuarial reserve (deficit) at June 30, 2003 $ (232.6)
Table 3 reflects a condensed Statement of Revenues, Expenses, and Changes in Net Assets for fiscal
year 2003 as compared to the prior year.
Table 3 Statement of Revenues, Expenses, and Changes
in Net Assets for June 30, 2003 and 2002 (dollars in millions)
2003 2002 Operating revenues: Interest and dividends $ 12.7 $ 18.7 Net increase (decrease) of fair value of investments 22.2 (24.4) Tuition contributions 194.3 162.8 Other 4.6 2.4 Total operating revenue 233.8 159.5 Operating expenses: Personal services 2.4 2.3 Contractual services 2.0 3.3 Tuition benefits expense 403.6 252.8 Other 0.3 0.4 Total operating expenses 408.3 258.8 Operating income (loss) (174.5) (99.3) Transfer to Commonwealth (0.1) (0.1)

7
Change in net assets (174.6) (99.4) Net assets - beginning (57.9) 41.5 Net assets – ending $ (232.5) $ (57.9)
Net increase (decrease) in fair value of investments increased primarily due to the improvement of
market conditions at the end of the fiscal year. This resulted in an increase in the actual market value of most equity investments on June 30, 2003.
As mentioned earlier, tuition contributions increased over the prior year due to lump sum/down payments on new contracts as well as continued participation by existing contract holders.
Tuition benefits expense includes both actual distributions made to higher education institutions on behalf of program participants and an adjustment for the increase in the actuarially determined liability. Due to the large increase in the actuarially determined liability, most of the increase in the tuition benefits expense over the prior year may be attributed to this actuarial adjustment.
Table 4 reflects the condensed Statement of Cash Flows.
Table 4 Statement of Cash Flows for June 30, 2003 and 2002
(dollars in millions)
2003 2002 Cash provided (used) by: Operating activities $ 116.5 $ 80.9 Noncapital financing activity (0.1) (0.1) Capital and related financing - (0.1) Investing activities (76.6) (147.6) Net increase (decrease) in cash 39.8 (66.9) Cash – beginning of year 41.7 108.6 Cash – end of year $ 81.5 $ 41.7
Major sources of cash from operating activities in fiscal year 2003 included an increase in
contributions from participants due to lump sum/down payments from new accounts as well as continued contributions to existing accounts. In addition, the rapid growth of CollegeAmerica resulted in an increase in the administrative fee revenue collected from the American Funds. The Plan receives 10 basis points annually in administrative fees, which is accumulated daily and paid on a quarterly basis based on the daily market value of total assets in CollegeAmerica.
VPEP equity investment managers elected to reduce the number of overall trades in the marketplace throughout fiscal year 2003, in part due to market volatility. This resulted in a reduction of both purchases and sales from investing activities.
8
Analysis of Fiduciary Fund Financial Activities
Participation in the VEST program continued to grow despite poor market conditions during the first two quarters of the fiscal year. Contributions increased by $26.1 million over the amount contributed in the prior year. These contributions represented participation from new account holders as well as continued contributions from existing participants. Due to improved market conditions at the end of the fiscal year, the market value of VEST’s assets at June 30, 2003, was much improved over the prior year. Like contributions, deductions also continued to grow as more participants withdrew funds to cover tuition expenses. Tuition benefits paid increase by $6.3 million, or 58 percent over the prior year.
Assets under management in CollegeAmerica, which launched February 15, 2002, increased by 232 percent during the fiscal year, from $1 billion to $3.4 billion. New unique accounts opened during the year were approximately 280,000. This activity resulted in CollegeAmerica becoming the number one broker-sold IRC Section 529 in the country.
Economic Factors and Outlook
The Plan is cautiously optimistic that the improved market conditions experienced thus far in calendar year 2003 will continue and that actual VPEP investment performance will continue to exceed the current actuarial assumptions. However, it is expected that tuitions at Virginia’s public higher education institutions will continue to be extremely volatile. In light of this, establishing the contract pricing for a new enrollment period will be difficult. Any new enrollment in VPEP will increase cash and the asset base of the program but will also add to the future tuition benefit obligation of the plan. Therefore, the Plan is exploring a number of options including a short-term delay in establishing a new enrollment period for the Virginia Prepaid Education Program.

9
FINANCIAL STATEMENTS
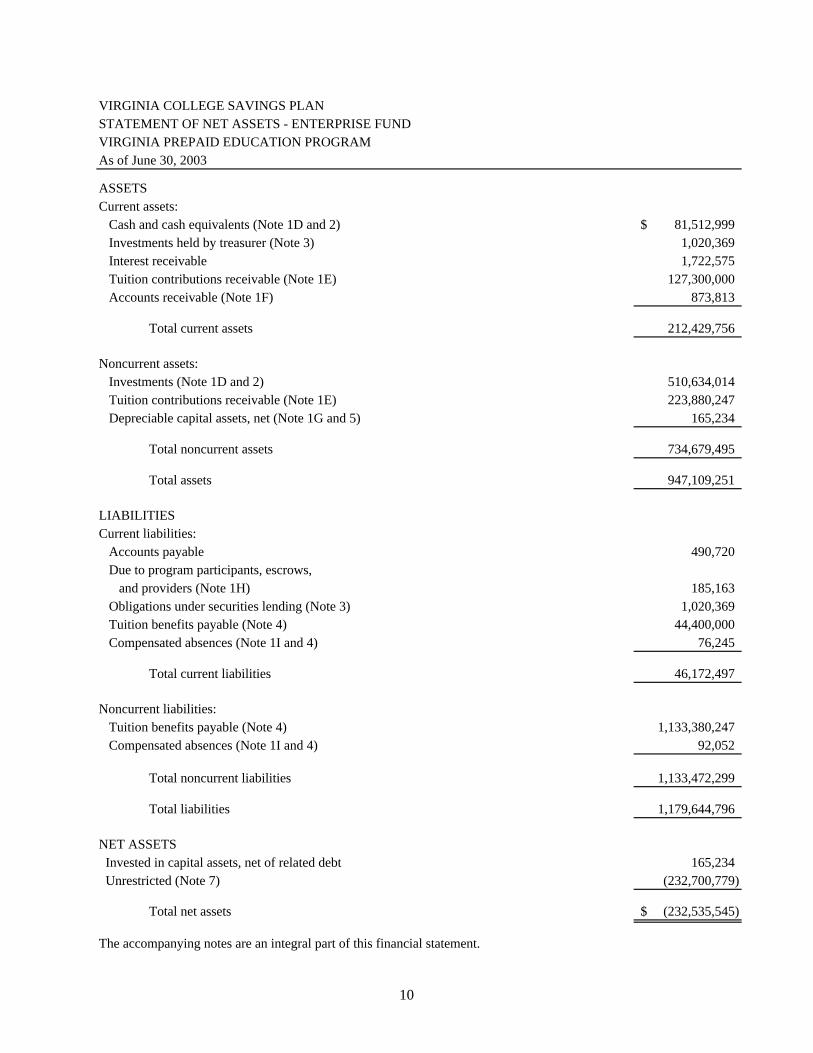
VIRGINIA COLLEGE SAVINGS PLANSTATEMENT OF NET ASSETS - ENTERPRISE FUND VIRGINIA PREPAID EDUCATION PROGRAMAs of June 30, 2003
Current assets: Cash and cash equivalents (Note 1D and 2) 81,512,999$ Investments held by treasurer (Note 3) 1,020,369 Interest receivable 1,722,575 Tuition contributions receivable (Note 1E) 127,300,000 Accounts receivable (Note 1F) 873,813
Total current assets 212,429,756
Noncurrent assets: Investments (Note 1D and 2) 510,634,014 Tuition contributions receivable (Note 1E) 223,880,247 Depreciable capital assets, net (Note 1G and 5) 165,234
Total noncurrent assets 734,679,495
Total assets 947,109,251
Current liabilities: Accounts payable 490,720 Due to program participants, escrows, and providers (Note 1H) 185,163 Obligations under securities lending (Note 3) 1,020,369 Tuition benefits payable (Note 4) 44,400,000 Compensated absences (Note 1I and 4) 76,245
Total current liabilities 46,172,497
Noncurrent liabilities: Tuition benefits payable (Note 4) 1,133,380,247 Compensated absences (Note 1I and 4) 92,052
Total noncurrent liabilities 1,133,472,299
Total liabilities 1,179,644,796
NET ASSETS Invested in capital assets, net of related debt 165,234 Unrestricted (Note 7) (232,700,779)
Total net assets (232,535,545)$
The accompanying notes are an integral part of this financial statement.
ASSETS
LIABILITIES
10

VIRGINIA COLLEGE SAVINGS PLANSTATEMENT OF REVENUES, EXPENSES, AND CHANGES IN NET ASSETS ENTERPRISE FUND - VIRGINIA PREPAID EDUCATION PROGRAMFor the Fiscal Year Ended June 30, 2003
Operating revenues: Charges for sales and services 4,657,661$ Interest, dividends, rents, and other investment income 12,694,380 Net increase in fair value of investments 22,229,900 Tuition contributions 125,055,862 Actuarial tuition contributions 69,202,956
Total operating revenues 233,840,759
Operating expenses: Personal services 2,388,879 Contractual services 1,995,725 Supplies and materials 34,792 Depreciation 62,311 Rent, insurance, and other related charges 147,779 Tuition benefits expense 7,712,891 Actuarial tuition benefits expense 395,952,956 Expendable equipment 17,163 Other 41,559
Total operating expenses 408,354,055
Operating income (loss) (174,513,296)
Transfers: Transfers to the General Fund of the Commonwealth (105,898)
Change in net assets (174,619,194)
Net assets - July 1, 2002 (57,916,351)
Net assets - June 30, 2003 (232,535,545)$
The accompanying notes are an integral part of this financial statement.
11

VIRGINIA COLLEGE SAVINGS PLANSTATEMENT OF CASH FLOWS - ENTERPRISE FUNDVIRGINIA PREPAID EDUCATION PROGRAMFor the Fiscal Year Ended June 30, 2003
Cash flows from operating activities: Receipts for sales and services 3,967,701$ Payments to suppliers for goods and services (66,036) Payments to employees (2,414,552) Contributions received 124,988,332 Payments for contractual services (2,430,900) Tuition benefit payments (7,527,744) Other operating payments (5,355)
Net cash provided by (used for) operating activities 116,511,446
Cash flows from noncapital financing activities: Transfer to the General Fund of the Commonwealth (105,898)
Net cash provided by (used for) noncapital financing activities (105,898)
Cash flows from capital and related financing activities: Acquisition of fixed assets (15,223)
Net cash provided by (used for) capital and related financing activities (15,223)
Cash flows from investing activities: Purchase of investments (1,066,333,461) Proceeds from sales or maturities of investments 976,824,742 Interest income on cash, cash equivalents, and investments 12,919,342
Net cash provided by (used for) investing activities (76,589,377)
Net increase in cash and cash equivalents 39,800,948
Cash and cash equivalents - July 1, 2002 41,712,051
Cash and cash equivalents - June 30, 2003 81,512,999$
12

VIRGINIA COLLEGE SAVINGS PLANSTATEMENT OF CASH FLOWS - ENTERPRISE FUNDVIRGINIA PREPAID EDUCATION PROGRAM (continued)For the Fiscal Year Ended June 30, 2003
Reconciliation of operating income to net cash provided by operating activities: Operating income (loss) (174,513,296)$
Adjustments to reconcile operating income to net cash provided by (used for) operating activities: Depreciation 62,311 Interest, dividends, rents and other investment income (12,919,342) Net increase in fair value of investments (22,229,900) Changes in assets and liabilities: (Increase) decrease in receivables (714,359) (Increase) decrease in tuition contributions receivable (69,202,956) Increase (decrease) in accounts payable (10,604) Increase (decrease) in amounts due to program participants 119,775 Increase (decrease) in current tuition benefits payable 24,100,000 Increase (decrease) in current compensated absences 54,699 Increase (decrease) in noncurrent tuition benefits payable 371,852,956 Increase (decrease) in noncurrent compensated absences (87,838)
Net cash provided by (used for) operating activities 116,511,446$
The accompanying notes are an integral part of this financial statement.
13

VIRGINIA COLLEGE SAVINGS PLANSTATEMENT OF FIDUCIARY NET ASSETS -PRIVATE-PURPOSE TRUST FUNDSAs of June 30, 2003
Virginia EducationSavings Trust CollegeAmerica Total
Assets: Cash and cash equivalents (Note 1D and 2) 5,796,110$ -$ 5,796,110$ Receivables: Contributions 277,766 - 277,766 Interest and dividends 209,584 - 209,584 Investments: (Note 1D and 2) Mutual funds 133,234,731 3,359,913,130 3,493,147,861 Index funds 64,386,275 - 64,386,275 Guaranteed investment contracts 51,844,529 - 51,844,529 Common stock 16,247,228 - 16,247,228
Total investments 265,712,763 3,359,913,130 3,625,625,893
Total assets 271,996,223 3,359,913,130 3,631,909,353
Liabilities: Accounts payable 76,615 - 76,615 Due to program participants, escrows, and providers (Note 1H) 13,047 - 13,047
Total liabilities 89,662 - 89,662
Net assets held in trust for program participants 271,906,561$ 3,359,913,130$ 3,631,819,691$
The accompanying notes are an integral part of this financial statement.
14

VIRGINIA COLLEGE SAVINGS PLANSTATEMENT OF CHANGES IN FIDUCIARY NET ASSETS - PRIVATE-PURPOSE TRUST FUNDSFor the Fiscal Year Ended June 30, 2003
Virginia EducationSavings Trust CollegeAmerica Total
Additions: Contributions: From participants 127,566,197$ 2,274,809,904$ 2,402,376,101$ Charges for services 654,625 - 654,625 Investment income: Net increase in fair value of investments 12,109,301 171,824,126 183,933,427 Interest, dividends, and other investment income 2,485,051 46,416,776 48,901,827
Total investment income 14,594,352 218,240,902 232,835,254
Less investment expenses (1,364,903) (4,971,340) (6,336,243)
Net investment income 13,229,449 213,269,562 226,499,011
Other 20,443 - 20,443
Total additions 141,470,714 2,488,079,466 2,629,550,180
Deductions: Tuition benefits paid 17,219,324 24,072,690 41,292,014 Shares redeemed 1,841,016 114,321,297 116,162,313 Other expenses 654,625 2,039,801 2,694,426
Total deductions 19,714,965 140,433,788 160,148,753
Net increase 121,755,749 2,347,645,678 2,469,401,427
Net assets held in trust for program participants: July 1, 2002 150,150,812 1,012,267,452 1,162,418,264
June 30, 2003 271,906,561$ 3,359,913,130$ 3,631,819,691$
The accompanying notes are an integral part of this financial statement.
15

16
NOTES TO FINANCIAL STATEMENTS

17
VIRGINIA COLLEGE SAVINGS PLAN
NOTES TO FINANCIAL STATEMENTS
AS OF JUNE 30, 2003 1. SUMMARY OF SIGNIFICANT ACCOUNTING POLICIES
The Virginia College Savings Plan (the Plan), an independent agency of the Commonwealth of Virginia, was created in 1994 by the Virginia General Assembly and its enabling legislation is codified at §23-38.75 through §23-38.87 of the Code of Virginia , as amended. The Plan operates the Commonwealth’s IRC §529 qualified tuition program, which offers three options, the Virginia Prepaid Education Program (VPEP), the Virginia Education Savings Trust (VEST), and CollegeAmerica.
VPEP is a defined benefit program, which offers contracts, for actuarially determined
amounts, guaranteeing full future tuition and mandatory fee payments at Virginia higher education institutions. The contract provisions also allow benefits to be used at private or out-of-state institutions with a payout based on the amounts charged by Virginia’s higher education institutions. VPEP has a limited enrollment period each year, and is open to children in the ninth grade or younger if the child or participant is a Virginia resident. During the seven enrollment periods to date, approximately 67,000 accounts have been opened, with over 59,000 contracts remaining active at year-end. The program had contributions and net earnings of approximately $593 million as of June 30, 2003. The program invests contract payments to meet future obligations. Operating costs are paid from program earnings. The Plan does not receive any general fund appropriations. The program’s assets and income are exempt from federal, state, and local income taxation. Legislation was passed in 1998 to provide a financial guarantee to cover VPEP contractual obligations in the event of a funding shortfall.
VEST is a defined contribution program, which allows participants of all ages to save for
qualified higher education expenses, including tuition and fees, at any qualified higher education institution by making contributions into the investment portfolio(s) of their choice. New participants are allowed to select from among 11 investment portfolios. A twelfth portfolio is still actively traded in the VEST program but is closed to new participation. The VEST program, which is open year round, has no age or residency restrictions, and carries no legislative guarantee of return of principal. VEST accounts are subject to market investment risk, including the possible loss of principal. VEST began operation in December 1999. As of June 30, 2003, over 44,000 accounts have been opened with a net asset value of approximately $271 million. Investment management fees and VEST operating expenses are paid on a pro-rata basis by each VEST account owner and vary according to the portfolio selected. VEST accounts provide investors with the same federal and state tax benefits available to participants in the prepaid program.
In 2001, the Board of the Virginia College Savings Plan entered into a 15-year contract with
Capital Research and Management Company, American Funds Distributors, Inc., and American Funds Service Company, Inc. (together, the American Funds) to administer a broker-sold IRC §529 college savings option using 21 of the American Funds. This new program, called CollegeAmerica, is a defined contribution plan which launched on February 15, 2002. The American Funds acts as program manager and provides all back office and operational activities for the program. As a result of this structure, the Plan’s staff has minimal day-to-day administrative responsibility, other than program oversight and review.
18
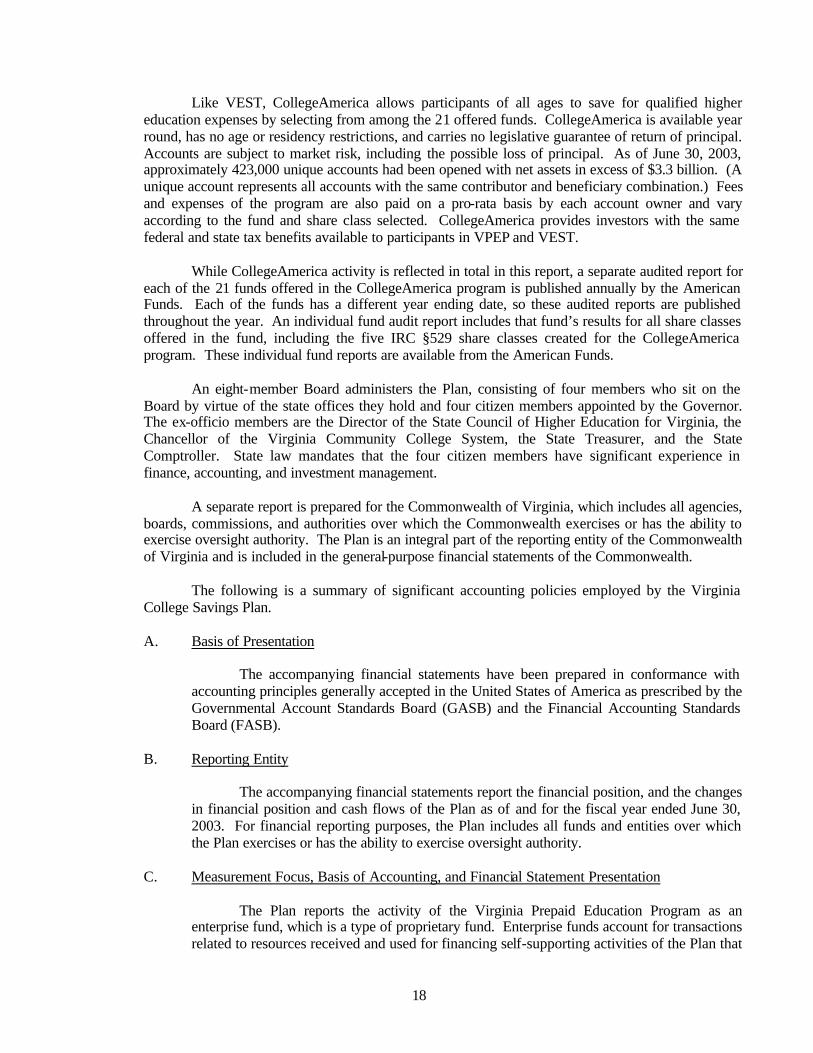
Like VEST, CollegeAmerica allows participants of all ages to save for qualified higher education expenses by selecting from among the 21 offered funds. CollegeAmerica is available year round, has no age or residency restrictions, and carries no legislative guarantee of return of principal. Accounts are subject to market risk, including the possible loss of principal. As of June 30, 2003, approximately 423,000 unique accounts had been opened with net assets in excess of $3.3 billion. (A unique account represents all accounts with the same contributor and beneficiary combination.) Fees and expenses of the program are also paid on a pro-rata basis by each account owner and vary according to the fund and share class selected. CollegeAmerica provides investors with the same federal and state tax benefits available to participants in VPEP and VEST.
While CollegeAmerica activity is reflected in total in this report, a separate audited report for
each of the 21 funds offered in the CollegeAmerica program is published annually by the American Funds. Each of the funds has a different year ending date, so these audited reports are published throughout the year. An individual fund audit report includes that fund’s results for all share classes offered in the fund, including the five IRC §529 share classes created for the CollegeAmerica program. These individual fund reports are available from the American Funds.
An eight-member Board administers the Plan, consisting of four members who sit on the
Board by virtue of the state offices they hold and four citizen members appointed by the Governor. The ex-officio members are the Director of the State Council of Higher Education for Virginia, the Chancellor of the Virginia Community College System, the State Treasurer, and the State Comptroller. State law mandates that the four citizen members have significant experience in finance, accounting, and investment management.
A separate report is prepared for the Commonwealth of Virginia, which includes all agencies,
boards, commissions, and authorities over which the Commonwealth exercises or has the ability to exercise oversight authority. The Plan is an integral part of the reporting entity of the Commonwealth of Virginia and is included in the general-purpose financial statements of the Commonwealth.
The following is a summary of significant accounting policies employed by the Virginia
College Savings Plan.
A. Basis of Presentation The accompanying financial statements have been prepared in conformance with
accounting principles generally accepted in the United States of America as prescribed by the Governmental Account Standards Board (GASB) and the Financial Accounting Standards Board (FASB).
B. Reporting Entity
The accompanying financial statements report the financial position, and the changes
in financial position and cash flows of the Plan as of and for the fiscal year ended June 30, 2003. For financial reporting purposes, the Plan includes all funds and entities over which the Plan exercises or has the ability to exercise oversight authority.
C. Measurement Focus, Basis of Accounting, and Financial Statement Presentation
The Plan reports the activity of the Virginia Prepaid Education Program as an
enterprise fund, which is a type of proprietary fund. Enterprise funds account for transactions related to resources received and used for financing self-supporting activities of the Plan that
19
offer products and services on a user-charge basis to external users. All operating expenses and all administrative fee revenue collected to support Plan operations, including administrative revenue and expenses of VEST and CollegeAmerica, are reflected in the enterprise fund.
The Plan reports the activity of the Virginia Education Savings Trust and
CollegeAmerica as private-purpose trust funds, which is a type of fiduciary fund. Private-purpose trust funds account for transactions of trust arrangements in which the principal and income benefit individuals, private organizations, or other governments.
The financial statements of the proprietary and fiduciary funds are reported using the
economic resources measurement focus and the accrual basis of accounting. Revenues are recorded when earned and expenses are recognized when a liability is incurred, regardless of the timing of related cash flows.
Proprietary funds distinguish operating revenues and expenses from nonoperating
items. Operating revenues and expenses generally result from providing services and producing and delivering goods in connection with a proprietary fund’s principal ongoing operations. Revenues and expenses not meeting this definition are reported as nonoperating. The principal operating revenues of the Plan are tuition contributions for program participants and investment income. Operating expenses of the plan include tuition benefits expense and contractual and personal services.
GASB Statement No. 20, Accounting and Financial Reporting for Proprietary Funds
and Other Governmental Entities That Use Proprietary Fund Accounting, provides governments two options for using proprietary fund activities. All proprietary funds reported herein apply all applicable Governmental Accounting Standards Board pronouncements and all Financial Accounting Standards Board Statements and Interpretations, Accounting Principle Board Opinions, and Accounting Research Bulletins issued on or before November 30, 1989, unless they conflict with or contradict GASB pronouncements.
D. Cash Equivalents and Investments
Money market investments of the Plan, which are deemed short-term, highly liquid
investments, are reported at amortized cost. Long-term investments of the Plan are recorded at fair value based upon quoted market prices. Cash equivalents are investments with an original maturity of three months or less.
The Plan also participates in the Commonwealth’s General Account pool, which is
managed by the State Treasurer. These pooled investments are valued on an amortized cost basis. The Plan receives income on a quarterly basis from the Commonwealth based on the Plan’s relative participation during the quarter. The Plan receives no additional distribution of unrealized gains or losses in the fair values of the pool’s investments.
E. Tuition Contributions Receivable
Tuition contributions receivable in VPEP represents the actuarially determined
present value of future payments anticipated from contract holders.

20
F. Accounts Receivable
Accounts receivable reflected in VPEP include the amount due from the American Funds for second quarter administrative fees collected on behalf of the Plan from the CollegeAmerica program. The American Funds pays the Plan an annual fee equal to one tenth of one percent (.10 percent) of the average daily net asset value of the underlying funds held in CollegeAmerica. This fee is accrued daily and paid to the Plan on a quarterly basis. In addition, accounts receivable include an amount due from the Plan’s software vendor, SCT, as part of a royalty agreement whereby the Plan receives a small royalty from the licensing fees paid to SCT by other states.
G. Property, Plant, and Equipment
Fixed assets are capitalized and depreciated on a straight-line basis over their useful
lives. Fixed assets are valued at historical cost. The Plan capitalizes all property, plant, and equipment that have a cost or value greater than $5,000 and an expected useful life of greater than two years; however, all computer equipment is capitalized regardless of cost or value. Equipment currently owned by the Plan has an estimated useful life of five years.
H. Amounts Due To Program Participants
Amounts due to program participants reflects amounts due to participants who
cancelled prepaid tuition contracts or savings trust accounts prior to June 30, 2003, but had not yet received a refund. Additionally, this amount includes administrative fees due to providers that had accrued in selected portfolios in the VEST program at June 30, 2003, but had not been paid.
I. Accrued Leave Policy
Employees accrue annual leave at a rate of four to nine hours semi-monthly,
depending on their length of service. The maximum accumulation is dependent upon years of service, but in no case may it exceed 42 days. All employees leaving the agency are paid for accrued vacation leave up to the maximum calendar year limit at their current earnings rate.
In conformance with Section C60 of GASB Codification, the monetary value of
accumulated annual leave payable upon termination is included in the accompanying financial statements. The liability at June 30, 2003, was computed using salary rates effective at that date and represents vacation and compensatory leave earned up to the allowable ceilings. In accordance with GASB Statement No. 16, Accounting for Compensated Absences, included in the liability is the agency’s share of FICA taxes on leave balances for which employees will be compensated.
Employees of the Plan have elected to participate in the Virginia Sickness and
Disability Program. The Virginia Retirement System (VRS) administers the program to provide income protection for absences due to sickness or disability from the first day on the job. After a seven calendar-day waiting period following the first incident of disability, eligible employees receive short-term disability benefits ranging from 60 to 100 percent of compensation up to a maximum of 125 work days, based upon months of State service. After a 180 calendar-day waiting period (125 work days of short-term disability) eligible employees receive long-term disability benefits equal to 60 percent of compensation until

21
they return to work, until age 65, or until death. Employees enrolled in this program are not eligible for disability retirement benefits under the VRS.
All State agencies are required to contribute to the cost of providing disability
benefits. Initial contribution requirements to fund the program were determined by the VRS actuary based on an estimate of the amount of the liability for disability benefits that would transfer from VRS to the new program. The contribution requirement was 1.07 percent of payroll for State employees. Further information about this program can be found in the Commonweal th of Virginia’s Comprehensive Annual Financial Report.
2. CASH, CASH EQUIVALENTS, AND INVESTMENTS
The Board of the Virginia College Savings Plan has full power to invest funds in accordance with §23-38.80 of the Code of Virginia , as amended. This section requires the Board to discharge its duties in a manner which will provide the investment return and risk level consistent with the actuarial return requirements and cash flow demands of the Plan and conforming to all statutes governing the investment of Plan funds. The Board shall exercise the judgment of care under the circumstances then prevailing, which persons of prudence, discretion, and intelligence exercise in the management of their own affairs, not in regard to speculation but to the permanent disposition of funds, considering the probable income as well as the probable safety of their capital when investing funds. In order to meet the return requirements, the Plan’s portfolio shall be invested in a broadly diversified portfolio of domestic and foreign stocks, bonds, and cash equivalent investments, which are defined as investments with an original maturity of three months or less. The Board’s allocation target for the overall VPEP portfolio, at market value, is 50 percent investment in equity securities and 50 percent investment in fixed income instruments. The Board’s allocation targets for the VEST program vary according to the investment objective of each portfolio. To assist in with the investment of the Plan assets, the Board has selected a group of 11 external managers and/or funds. In addition, the Plan has monies invested by the State Treasurer as part of the Commonwealth's General Account for both VPEP and VEST.
The Board authorized its partner, the American Funds, to offer 21 of the ir mutual funds to
investors in CollegeAmerica. The Board has oversight and review authority for the investment activity and operations of the CollegeAmerica program. The American Funds is required to seek renewed approval of the use of these mutual funds on an annual basis.
Investments held in the VPEP, VEST, and CollegeAmerica programs at June 30, 2003, have
been categorized according to the level of credit risk associated with its custodial arrangements at fiscal year end. Credit risk refers to the risk that the Plan may not be able to obtain possession of its investments in the event of default by a counterparty. Category 1 includes investments that are insured or registered or for which securities are held by the Plan or its agent in the Plan’s name. Category 2 includes uninsured and unregistered investments for which securities are held by the counterparty’s trust department or agent in the Plan’s name. Category 3 includes uninsured and unregistered investments for which securities are held by the counterparty, or by its trust department or agent, but not in the Plan’s name. Certain investments cannot be categorized because they are not evidenced by physical securities. VPEP investments, reported in the enterprise fund at June 30, 2003, were categorized as follows.

22
Fair Value Category 1: U.S. Treasury and agency securities $ 59,343,761 Common and preferred stocks 97,690,515 Corporate and other bonds 101,344,853 Non-categorized: Mutual, Money Market Funds 128,172,045 Index Funds 109,241,609 Guaranteed Investment Contracts 56,846,789 Fixed Income/Commingled Funds 28,878,807 State Treasurer General Account Investment Pool 10,628,634 Total cash equivalents and investments $592,147,013 Investment holdings of the VEST and CollegeAmerica programs, reported as private-
purpose trust funds, were categorized as follows. Fair Value Category 1: Common and preferred stocks $ 16,247,228 Non-categorized: Mutual, Money Market Funds 3,497,233,937 Index Funds 64,386,275 Guaranteed Investment Contracts 51,844,529 State Treasurer General Account Investment Pool 1,710,034 Total cash equivalents and investments $3,631,422,003
3. SECURITIES LENDING TRANSACTIONS
Investments held by the Treasurer of Virginia represent the Plan’s allocated share of securities received for securities lending transactions held in the General Account of the Commonwealth. Information related to the credit risk of these investments and securities lending transactions held in the General Account is available on a statewide level in the Commonwealth of Virginia’s Comprehensive Annual Financial Report.
4. LONG-TERM LIABILITIES
Long-term liabilities of the Plan include tuition benefits payable, which represents the actuarially determined present value of future obligations anticipated for payment of benefits and administrative expenses for the Virginia Prepaid Education Program. Also, reflected in the enterprise fund are the accrued compensated absences for the Plan’s employees.

23
Enterprise Fund
Balance July 1, 2002
Increases
Decreases
Balance June 30, 2003
Due Within One Year
Compensated absences
$ 201,436
$ 99,990
$ 133,129
$ 168,297
$ 76,245
Tuition benefits payable
781,827,291
418,106,155
22,153,199
1,177,780,247
44,400,000
Total $782,028,727 $418,206,145 $22,286,328 $1,177,948,544 $44,476,245
5. PROPERTY, PLANT, AND EQUIPMENT
The following schedule presents capital asset activity of the Plan for the year ended June 30, 2003.
Enterprise Fund July 1, 2002 Increases Decreases June 30, 2003 Depreciable capital assets: Equipment $ 340,344 $ 15,223 $ - $ 355,567 Less accumulated depreciation for: Equipment 128,022 62,311 - 190,333 Total depreciable capital assets, net of accumulated depreciation
$ 212,322
$ (47,088) $ -
$ 165,234
6. RETIREMENT AND PENSION PLAN
Employees of the Plan are employees of the Commonwealth of Virginia. The employees participate in a defined benefit pension plan administered by the Virginia Retirement System (VRS). The VRS also administers life insurance for employees and retirees. Information relating to these plans is available at the statewide level only in the Commonwealth of Virginia’s Comprehensive Annual Financial Report. The Commonwealth, not the Plan, has overall responsibility for determining contributions to these plans.
7. DEFICIT NET ASSETS (ENTERPRISE FUND)
The deficit net assets amount at June 30, 2003, reflected in the enterprise fund corresponds to the projected unfunded actuarial liability disclosed in the previous footnote. The actuarial deficit is primarily due to the tuition increases experienced in fiscal year 2003 as well as the expectation of additional significant increases in both university and community college tuitions for at least the next two years. An additional factor was the decrease in the long-term investment return assumption.
The Board will continue to address this issue by working with the VPEP actuary and
investment consultant to continually monitor the investment allocation and determine if there should be any additional diversification or expansion into other investment strategies in order to enhance long-term investment returns. During fiscal year 2003, the Board, with the assistance of the investment consultant, conducted a quantitative analysis of various VPEP investment manger scenarios. The results of this analysis led to the hiring of six new investment managers and the

24
elimination of one existing manager. It is the Board’s intention that the new investment management allocations, along with the slightly improved market conditions experienced thus far in calendar year 2003, will result in future VPEP investment performance meeting or exceeding the current long-term actuarial assumptions.
It remains the Board’s intention to reduce the actuarial deficit over time by creating an
actuarial reserve and implementing appropriate premium pricing in any future enrollment periods. However, it is expected that tuitions at Virginia’s public higher education institutions will continue to be extremely volatile. In light of this, establishing the appropriate contract pricing for a new enrollment period will remain difficult. Any new enrollment in VPEP will increase cash and the asset base of the program, but if priced inappropriately, will also significantly increase the future tuition benefit obligation. Therefore, the Board is exploring a number of options including a short-term delay in opening a new enrollment period.
8. RISK MANAGEMENT
The Virginia College Savings Plan is exposed to various risks of loss related to torts; theft or, damage to, and destruction of assets; errors and omissions; non-performance of duty; injuries to employees; and natural disasters. The Plan participates in insurance plans maintained by the Commonwealth of Virginia. The state employee health care and worker’s compensation plans are administered by the Department of Human Resource Management and the risk management insurance plans are administered by the Department of Treasury, Division of Risk Management. Risk management insurance includes property, general liability, medical malpractice, faithful performance of duty bond, automobile, and air and watercraft plans. The Plan pays premiums to each of these Departments for its insurance coverage. Information relating to the Commonwealth’s insurance plans is available at the statewide level in the Commonwealth of Virginia’s Comprehensive Annual Financial Report.
9. VIRGINIA COLLEGE DREAM FOUNDATION
The Virginia College Dream Foundation (VCDF) is a private, non-profit 501(c)(3) scholarship foundation founded in 1997. The VCDF enables individuals, organizations, community groups, corporations, and trusts to make charitable contributions, which are then used to purchase VPEP tuition and fee contracts and to open VEST accounts for at-risk youth. The mission of the VCDF is to work with community partners to make the dream of college a reality for deserving youth in Virginia and to create a model for helping at-risk students through state-sponsored college savings programs nationwide.
At June 30, 2003, the VCDF owned 55 VPEP contracts and 26 VEST accounts.
25
VIRGINIA COLLEGE SAVINGS PLAN Richmond, Virginia
BOARD MEMBERS As of June 30, 2003
Lee B. Krumbein, Chairman
Julie Cox, Vice-Chairman
Jody M. Wagner, Secretary/Treasurer
Dr. Glenn DuBois
Robert P. Hanrahan
Phyllis A. Palmiero
Cindy M. Roberts
David A. Von Moll
EXECUTIVE DIRECTOR
Diana F. Cantor