vineyard yield estimation yield estimation- wsu.pdf · figure 1. grape processing for wine and...
TRANSCRIPT
VINEYARD YIELD ESTIMATION
ByBrittany Komm, former Graduate Research Assistant, WSU Department of Horticulture, Irrigated Agriculture Research & Extension Center, Prosser. Michelle M. Moyer, Assistant Professor and Statewide Viticulture Extension Specialist, WSU Department of Horticulture, Irrigated Agriculture Research & Extension Center, Prosser EM086E
EM086E | Page 1 | ext.wsu.edu
Vineyard Yield Estimation
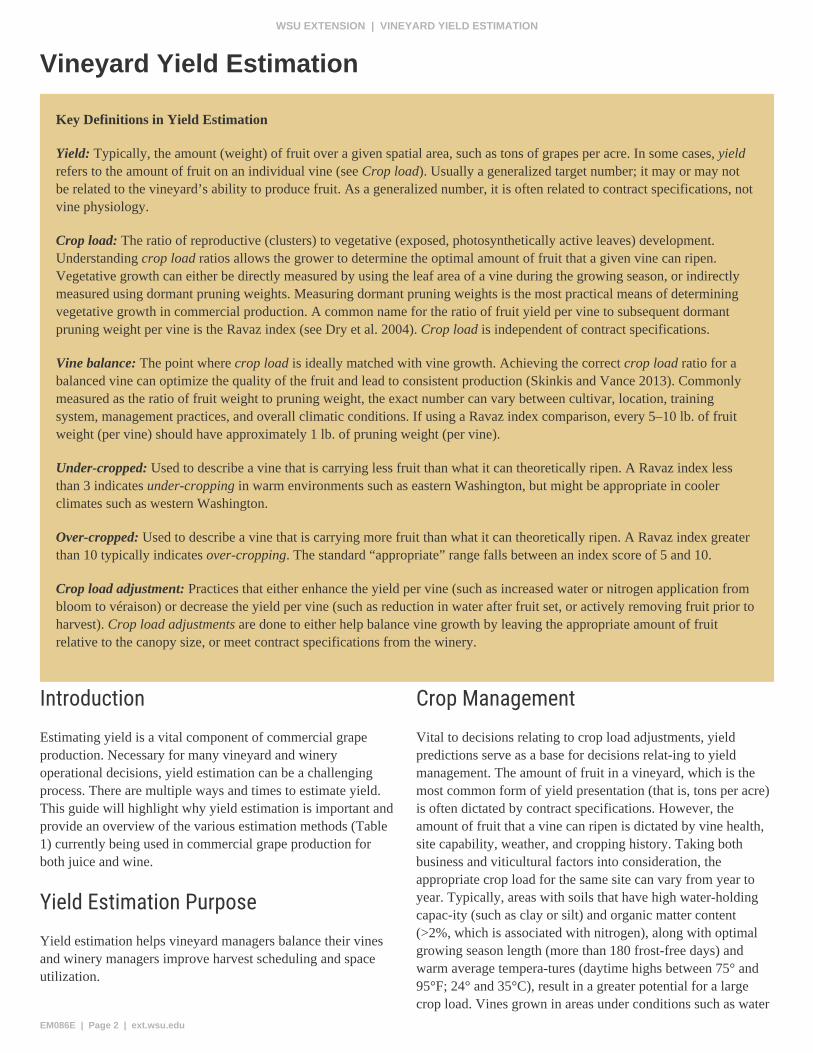
Key Definitions in Yield Estimation
Yield: Typically, the amount (weight) of fruit over a given spatial area, such as tons of grapes per acre. In some cases, yield refers to the amount of fruit on an individual vine (see Crop load). Usually a generalized target number; it may or may not be related to the vineyard’s ability to produce fruit. As a generalized number, it is often related to contract specifications, not vine physiology.
Crop load: The ratio of reproductive (clusters) to vegetative (exposed, photosynthetically active leaves) development. Understanding crop load ratios allows the grower to determine the optimal amount of fruit that a given vine can ripen. Vegetative growth can either be directly measured by using the leaf area of a vine during the growing season, or indirectly measured using dormant pruning weights. Measuring dormant pruning weights is the most practical means of determining vegetative growth in commercial production. A common name for the ratio of fruit yield per vine to subsequent dormant pruning weight per vine is the Ravaz index (see Dry et al. 2004). Crop load is independent of contract specifications.
Vine balance: The point where crop load is ideally matched with vine growth. Achieving the correct crop load ratio for a balanced vine can optimize the quality of the fruit and lead to consistent production (Skinkis and Vance 2013). Commonly measured as the ratio of fruit weight to pruning weight, the exact number can vary between cultivar, location, training system, management practices, and overall climatic conditions. If using a Ravaz index comparison, every 5–10 lb. of fruit weight (per vine) should have approximately 1 lb. of pruning weight (per vine).
Under-cropped: Used to describe a vine that is carrying less fruit than what it can theoretically ripen. A Ravaz index less than 3 indicates under-cropping in warm environments such as eastern Washington, but might be appropriate in cooler climates such as western Washington.
Over-cropped: Used to describe a vine that is carrying more fruit than what it can theoretically ripen. A Ravaz index greater than 10 typically indicates over-cropping. The standard “appropriate” range falls between an index score of 5 and 10.
Crop load adjustment: Practices that either enhance the yield per vine (such as increased water or nitrogen application from bloom to véraison) or decrease the yield per vine (such as reduction in water after fruit set, or actively removing fruit prior to harvest). Crop load adjustments are done to either help balance vine growth by leaving the appropriate amount of fruit relative to the canopy size, or meet contract specifications from the winery.
IntroductionEstimating yield is a vital component of commercial grape production. Necessary for many vineyard and winery operational decisions, yield estimation can be a challenging process. There are multiple ways and times to estimate yield. This guide will highlight why yield estimation is important and provide an overview of the various estimation methods (Table 1) currently being used in commercial grape production for both juice and wine.
Yield Estimation PurposeYield estimation helps vineyard managers balance their vines and winery managers improve harvest scheduling and space utilization.
Crop ManagementVital to decisions relating to crop load adjustments, yield predictions serve as a base for decisions relating to yield management. The amount of fruit in a vineyard, which is the most common form of yield presentation (that is, tons per acre) is often dictated by contract specifications. However, the amount of fruit that a vine can ripen is dictated by vine health, site capability, weather, and cropping history. Taking both business and viticultural factors into consideration, the appropriate crop load for the same site can vary from year to year. Typically, areas with soils that have high water-holding capacity (such as clay or silt) and organic matter content (>2%, which is associated with nitrogen), along with optimal growing season length (more than 180 frost-free days) and warm average temperatures (daytime highs between 75° and 95°F; 24° and 35°C), result in a greater potential for a large crop load. Vines grown in areas under conditions such as water
EM086E | Page 2 | ext.wsu.edu
WSU EXTENSION | VINEYARD YIELD ESTIMATION
stress, low nutritional status (sandy soils, low organic matter), and cool temperatures (average daytime highs during the growing season are less than 75°F) have a reduced ability to ripen a crop, and therefore have a lower optimal crop load.
The long-term mismanagement of crop load can have negative consequences. Over-cropping a vine can lead to a decrease in the vine’s carbohydrate reserves (which are necessary for overwintering and spring growth) and a reduction in potential bud fruitfulness. If vines are continuously over-cropped, premature death can result. Under-cropping the vine can result in management challenges but will not lead to as severe of consequences (premature death of the vine) as over-cropping a vine. By under-cropping a vine, energy will be diverted and used for vegetative growth instead of reproductive growth. The end result of this will be an excessively large canopy. Such canopies can ultimately shade the fruit and reduce ripening potential. This can also create the perfect microclimate for various fungi such as Erysiphe necator, causal agent of grape powdery mildew, and Botrytis cinerea, causal agent of Botrytis bunch rot.
In most cases, if yield (tons per acre) does not align with crop load, the long-term sustainability of the vineyard can be threatened. In those cases, management practices should be adjusted to meet the capacity of the individual vines. For example, if the individual crop load is low due to lack of vine vigor, which would ultimately translate into low yield, then management strategies would suggest an intervention such as increased water between bloom and véraison, or additional nitrogen application during the standard pre- and post-bloom nitrogen fertilization programs if soil and tissue tests indicate nitrogen is low (Hoheisel and Moyer 2014). If the vineyard manager simply leaves more buds and clusters to increase the yield in the vineyard, the crop load might be too high for the individual vines, and they will not be able to adequately ripen the fruit (over-cropped situation relative to what the vine can handle). In an alternative example, if crop load is high due to high vine vigor but contracts specify a low yield (under-cropped situation), management strategies such as reduced water application (implementation of regulated deficit irrigation, or RDI, just after fruit set) or multiple vineyard passes to remove excess fruit may be necessary. In this latter case, however, inappropriate timing of crop adjustment can
Yield and Crop Load Example
Cougar Vineyards has a contract with Crimson Winery, which specifies a yield of 5 tons on their one-acre Chardonnay block. After years of farming, they have realized that this yield results in ideal vine balance under “average” conditions; but, not all years are average. The vineyard manager knows that if it is a hot year, and they keep watering all season, 6 tons will be produced. In other words, given higher than average water and heat, vine balance is achieved at 6 tons per acre. What does the vineyard manager do to maintain his contract in this situation? They can either thin the crop between bloom and bunch closure to reduce yield, or they can limit the amount of water available to the plant, especially just at and after fruit set, to reduce the vine’s capacity to produce fruit. In the first scenario, the vineyard manager is not addressing vine balance, and as such, is artificially reducing crop load relative to the vine’s capacity. This might result in increased canopy growth. In the water-restriction scenario, the vineyard manager is directly altering vine balance by specifically limiting both reproductive (clusters) and vegetative (canopy) growth. In cooler vintages (years where the growing degree day accumulations are less than the region’s average), the vine’s capacity to ripen a crop is limited. In order to balance the amount of fruit on the vine to what its capacity is, clusters must be removed. In this scenario, less than 5 tons per acre is likely the appropriate crop level to maintain vine balance.
also send a high vigor vineyard into uncontrollable growth, thus perpetuating the out-of-balance cycle.
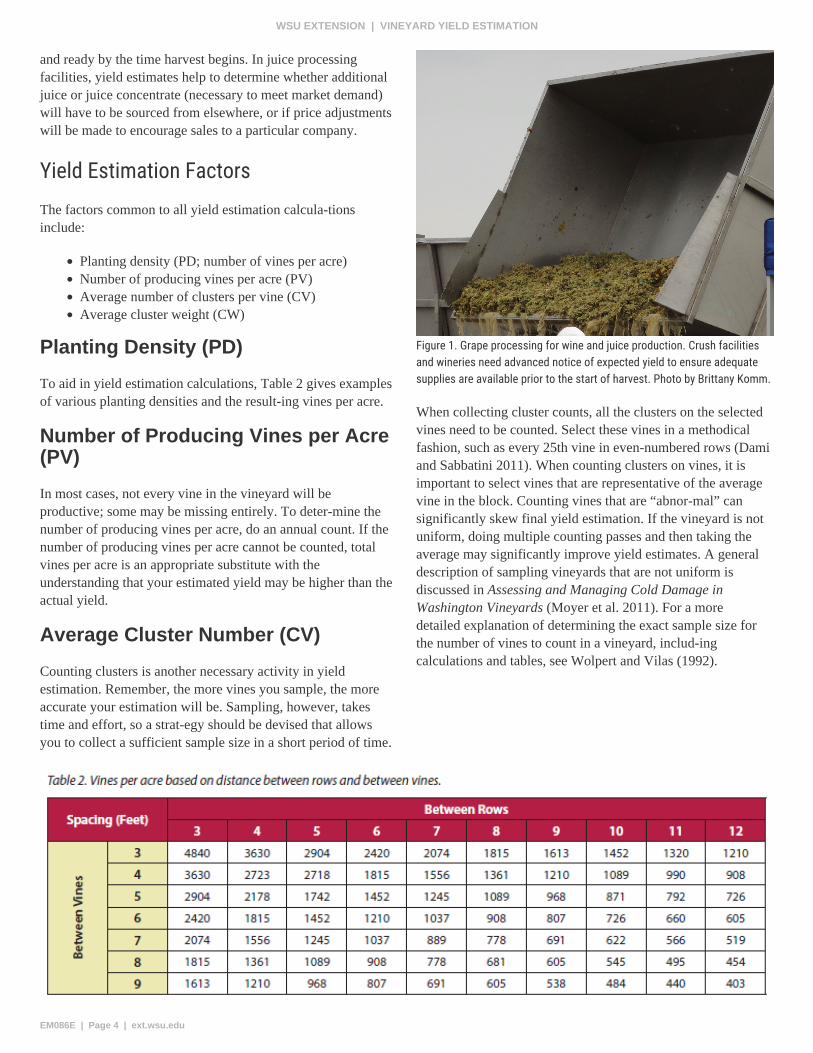
Winery and Juice Facilities PreparationVineyard yield estimates are also critical for winemakers who prepare their winery for a rapid influx of fruit (Figure 1). Scheduling and coordinating storage and processing space is critical in keeping the workflow of a winery under control. Yeast, fining agents, barrels, and tanks all need to be ordered
EM086E | Page 3 | ext.wsu.edu
WSU EXTENSION | VINEYARD YIELD ESTIMATION
and ready by the time harvest begins. In juice processing facilities, yield estimates help to determine whether additional juice or juice concentrate (necessary to meet market demand) will have to be sourced from elsewhere, or if price adjustments will be made to encourage sales to a particular company.
Yield Estimation FactorsThe factors common to all yield estimation calculations include:
Planting density (PD; number of vines per acre)Number of producing vines per acre (PV)Average number of clusters per vine (CV)Average cluster weight (CW)
Planting Density (PD)
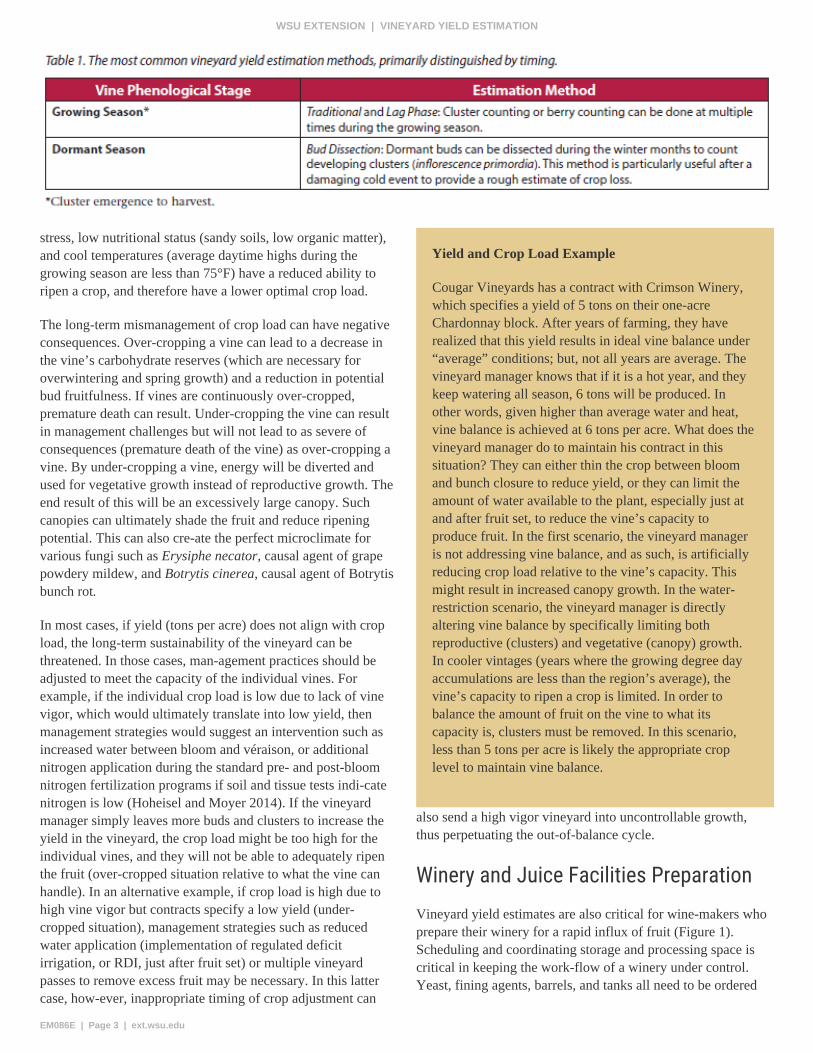
To aid in yield estimation calculations, Table 2 gives examples of various planting densities and the resulting vines per acre.
Number of Producing Vines per Acre (PV)
In most cases, not every vine in the vineyard will be productive; some may be missing entirely. To determine the number of producing vines per acre, do an annual count. If the number of producing vines per acre cannot be counted, total vines per acre is an appropriate substitute with the understanding that your estimated yield may be higher than the actual yield.
Average Cluster Number (CV)
Counting clusters is another necessary activity in yield estimation. Remember, the more vines you sample, the more accurate your estimation will be. Sampling, however, takes time and effort, so a strategy should be devised that allows you to collect a sufficient sample size in a short period of time.
Figure 1. Grape processing for wine and juice production. Crush facilities and wineries need advanced notice of expected yield to ensure adequate supplies are available prior to the start of harvest. Photo by Brittany Komm.
When collecting cluster counts, all the clusters on the selected vines need to be counted. Select these vines in a methodical fashion, such as every 25th vine in even-numbered rows (Dami and Sabbatini 2011). When counting clusters on vines, it is important to select vines that are representative of the average vine in the block. Counting vines that are “abnormal” can significantly skew final yield estimation. If the vineyard is not uniform, doing multiple counting passes and then taking the average may significantly improve yield estimates. A general description of sampling vineyards that are not uniform is discussed in Assessing and Managing Cold Damage in Washington Vineyards (Moyer et al. 2011). For a more detailed explanation of determining the exact sample size for the number of vines to count in a vineyard, including calculations and tables, see Wolpert and Vilas (1992).
EM086E | Page 4 | ext.wsu.edu
WSU EXTENSION | VINEYARD YIELD ESTIMATION
Clusters per vine can be determined by i) physically counting the number of clusters per vine during the growing season (either a single or multiple times) or ii) multiplying the number of buds you left during pruning (that is, the number of intended shoots per vine) by the typical number of clusters per shoot you see for that variety or block. The second method may present a problem if latent buds develop and produce fruit, or if cooler temperatures from the previous growing season reduced bud fruitfulness, but it does allow for estimation during the dormant season. In addition, buds can be dissected during the dormant season, and the number of developing clusters (inflorescence primordia) can be used as an estimate of the number of clusters per shoot.
Average Cluster Weight (CW)
Unlike the task of counting clusters, to obtain cluster weights, clusters must be removed (generally by hand) from the vine. Only remove clusters from the fruit zone; avoid any clusters that are developing on summer lateral shoots (also termed “Christmas clusters” or “second crop” clusters). Arbitrary sampling from multiple vines and weighing approximately 100 clusters per acre is sufficient if the vineyard is uniform across 1–3 acres (Dami 2006).
For larger blocks (5+ acres), typical protocols suggest sampling and weighing 200–400 clusters (Hellman and Casteel 2003).Cluster weights can be measured during the lag phase of cluster development(see Understanding Lag Phase for more information) or as close to commercial harvest as time allows.
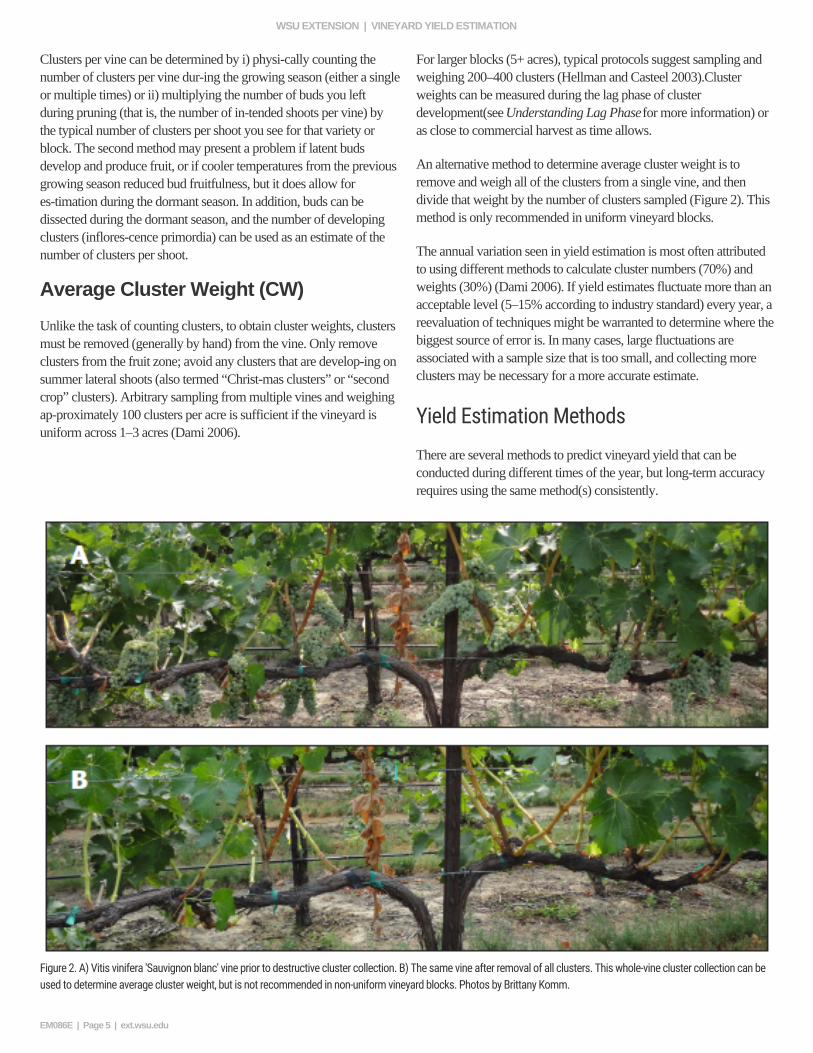
An alternative method to determine average cluster weight is to remove and weigh all of the clusters from a single vine, and then divide that weight by the number of clusters sampled (Figure 2). This method is only recommended in uniform vineyard blocks.
The annual variation seen in yield estimation is most often attributed to using different methods to calculate cluster numbers (70%) and weights (30%) (Dami 2006). If yield estimates fluctuate more than an acceptable level (5–15% according to industry standard) every year, a reevaluation of techniques might be warranted to determine where the biggest source of error is. In many cases, large fluctuations are associated with a sample size that is too small, and collecting more clusters may be necessary for a more accurate estimate.
Yield Estimation MethodsThere are several methods to predict vineyard yield that can be conducted during different times of the year, but long-term accuracy requires using the same method(s) consistently.
Figure 2. A) Vitis vinifera 'Sauvignon blanc' vine prior to destructive cluster collection. B) The same vine after removal of all clusters. This whole-vine cluster collection can be used to determine average cluster weight, but is not recommended in non-uniform vineyard blocks. Photos by Brittany Komm.
EM086E | Page 5 | ext.wsu.edu
WSU EXTENSION | VINEYARD YIELD ESTIMATION
The two most common methods (Table 1) for crop estimation are i) in-season cluster counting (traditional, historical) or weighing (lag phase) or both, and ii) dormant winter bud dissection. In-season methods can be divided into traditional, which uses in-season cluster counts coupled with knowledge of historical cluster weights, and lag phase, which incorporates in-season cluster counts with in-season cluster weights measured during stalled berry growth. Viticulturists may use a combination of methods to improve estimation accuracy.
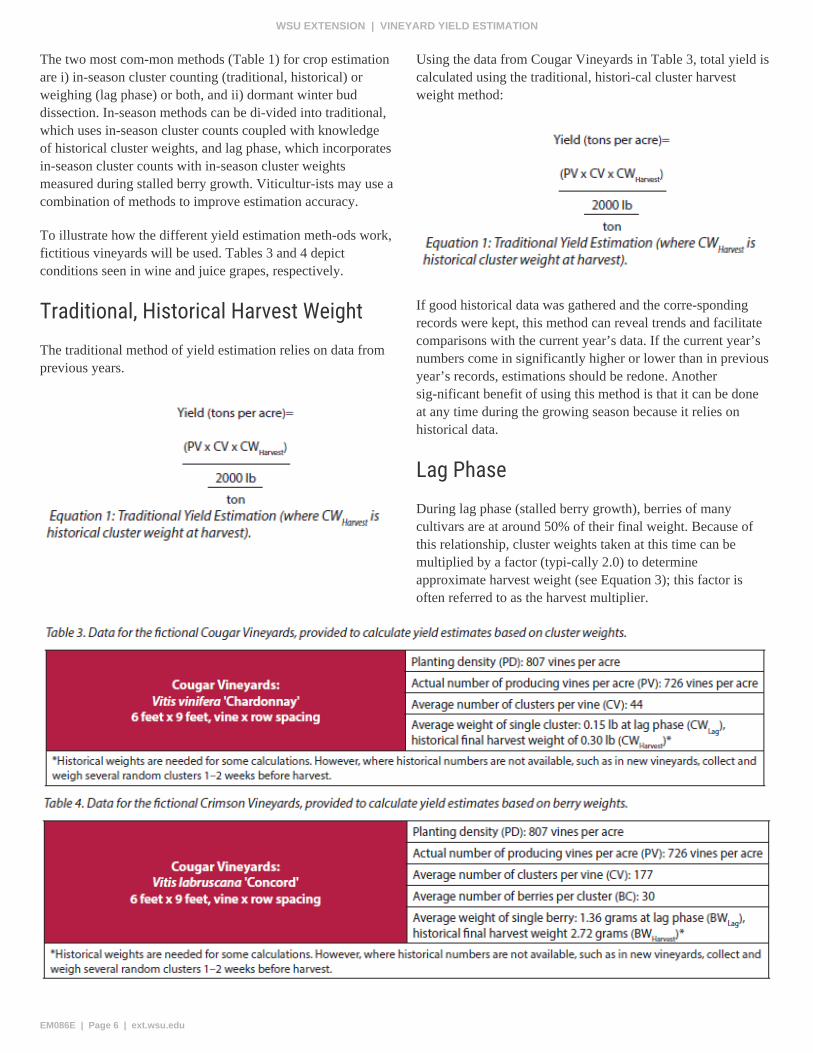
To illustrate how the different yield estimation methods work, fictitious vineyards will be used. Tables 3 and 4 depict conditions seen in wine and juice grapes, respectively.
Traditional, Historical Harvest WeightThe traditional method of yield estimation relies on data from previous years.
Using the data from Cougar Vineyards in Table 3, total yield is calculated using the traditional, historical cluster harvest weight method:
If good historical data was gathered and the corresponding records were kept, this method can reveal trends and facilitate comparisons with the current year’s data. If the current year’s numbers come in significantly higher or lower than in previous year’s records, estimations should be redone. Another significant benefit of using this method is that it can be done at any time during the growing season because it relies on historical data.
Lag PhaseDuring lag phase (stalled berry growth), berries of many cultivars are at around 50% of their final weight. Because of this relationship, cluster weights taken at this time can be multiplied by a factor (typically 2.0) to determine approximate harvest weight (see Equation 3); this factor is often referred to as the harvest multiplier.
EM086E | Page 6 | ext.wsu.edu
WSU EXTENSION | VINEYARD YIELD ESTIMATION
Understanding Lag Phase
Lag phase is a period of little or no growth in berries that occurs between the two rapid periods of growth. The lag phase directly precedes véraison, approximately 50–60 days after bloom (Dami and Sabbatini 2011). The length of this phase can vary anywhere from a few days up to a couple of weeks depending on the climate and cultivar. Some cultivars have a longer lag phase than others (Dami 2011). If berry or cluster weights or both are tracked throughout the season, the start of lag phase (that is, when size change slows or stops) is simple to capture. This tracking method is recommended if lag phase yield estimation is going to be routinely used.
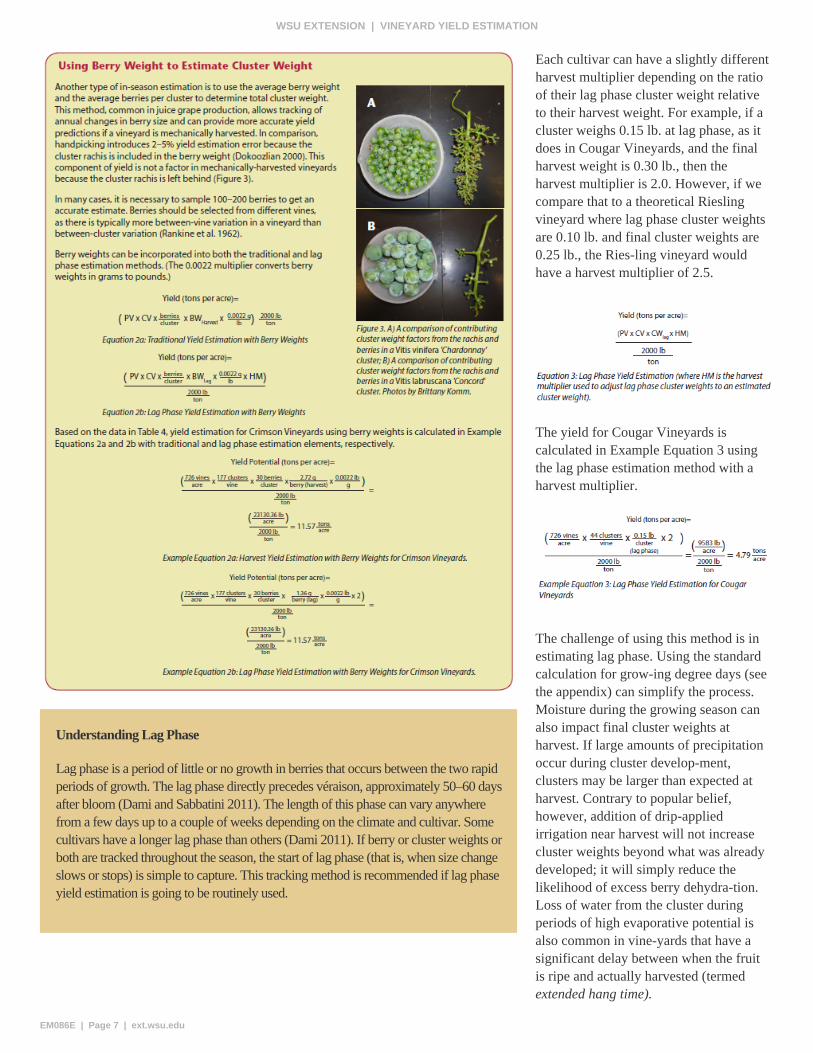
Each cultivar can have a slightly different harvest multiplier depending on the ratio of their lag phase cluster weight relative to their harvest weight. For example, if a cluster weighs 0.15 lb. at lag phase, as it does in Cougar Vineyards, and the final harvest weight is 0.30 lb., then the harvest multiplier is 2.0. However, if we compare that to a theoretical Riesling vineyard where lag phase cluster weights are 0.10 lb. and final cluster weights are 0.25 lb., the Riesling vineyard would have a harvest multiplier of 2.5.
The yield for Cougar Vineyards is calculated in Example Equation 3 using the lag phase estimation method with a harvest multiplier.
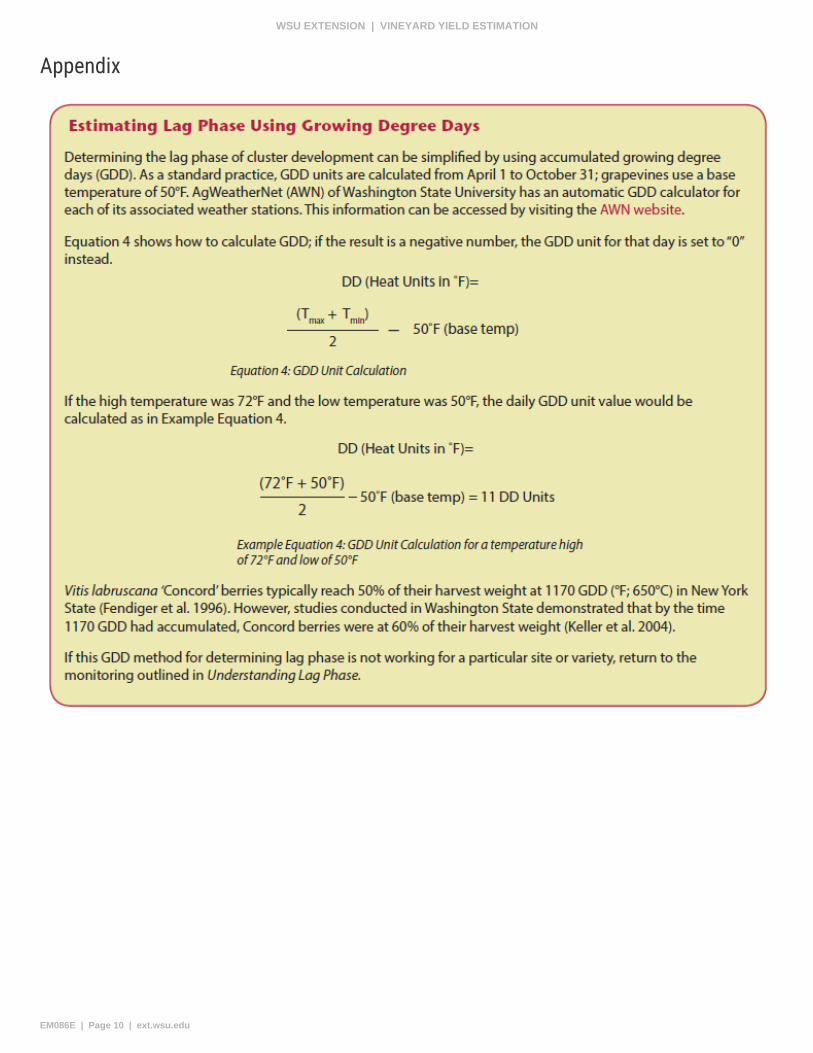
The challenge of using this method is in estimating lag phase. Using the standard calculation for growing degree days (see the appendix) can simplify the process. Moisture during the growing season can also impact final cluster weights at harvest. If large amounts of precipitation occur during cluster development, clusters may be larger than expected at harvest. Contrary to popular belief, however, addition of drip-applied irrigation near harvest will not increase cluster weights beyond what was already developed; it will simply reduce the likelihood of excess berry dehydration. Loss of water from the cluster during periods of high evaporative potential is also common in vineyards that have a significant delay between when the fruit is ripe and actually harvested (termed extended hang time).
EM086E | Page 7 | ext.wsu.edu
WSU EXTENSION | VINEYARD YIELD ESTIMATION
Because the relationship between lag phase and harvest weights can vary depending on weather patterns and vineyard management strategies (such as irrigation regimes), lag phase estimations tend to not be as accurate as estimations made directly before harvest.
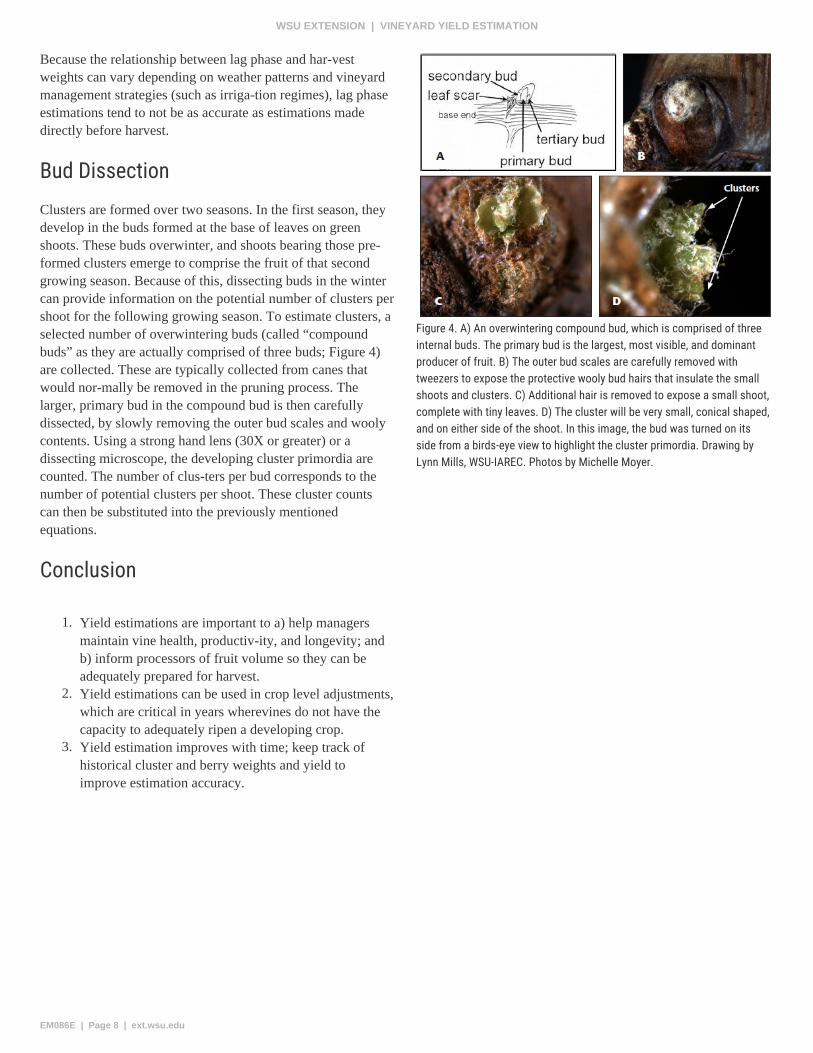
Bud DissectionClusters are formed over two seasons. In the first season, they develop in the buds formed at the base of leaves on green shoots. These buds overwinter, and shoots bearing those pre-formed clusters emerge to comprise the fruit of that second growing season. Because of this, dissecting buds in the winter can provide information on the potential number of clusters per shoot for the following growing season. To estimate clusters, a selected number of overwintering buds (called “compound buds” as they are actually comprised of three buds; Figure 4) are collected. These are typically collected from canes that would normally be removed in the pruning process. The larger, primary bud in the compound bud is then carefully dissected, by slowly removing the outer bud scales and wooly contents. Using a strong hand lens (30X or greater) or a dissecting microscope, the developing cluster primordia are counted. The number of clusters per bud corresponds to the number of potential clusters per shoot. These cluster counts can then be substituted into the previously mentioned equations.
Conclusion
1. Yield estimations are important to a) help managers maintain vine health, productivity, and longevity; and b) inform processors of fruit volume so they can be adequately prepared for harvest.
2. Yield estimations can be used in crop level adjustments, which are critical in years wherevines do not have the capacity to adequately ripen a developing crop.
3. Yield estimation improves with time; keep track of historical cluster and berry weights and yield to improve estimation accuracy.
Figure 4. A) An overwintering compound bud, which is comprised of three internal buds. The primary bud is the largest, most visible, and dominant producer of fruit. B) The outer bud scales are carefully removed with tweezers to expose the protective wooly bud hairs that insulate the small shoots and clusters. C) Additional hair is removed to expose a small shoot, complete with tiny leaves. D) The cluster will be very small, conical shaped, and on either side of the shoot. In this image, the bud was turned on its side from a birds-eye view to highlight the cluster primordia. Drawing by Lynn Mills, WSU-IAREC. Photos by Michelle Moyer.
EM086E | Page 8 | ext.wsu.edu
WSU EXTENSION | VINEYARD YIELD ESTIMATION
ReferencesDami, I. 2006. Methods of Crop Estimation in Grapes. The Ohio State University.
Dami, I. and P. Sabbatini. 2011. Crop Estimation of Grapes. The Ohio State University Fact Sheet HYG-1434-11.
Davenport, J. and D. Horneck. 2011. Sampling Guide for Nutrient Assessment of Irrigated Vineyards in the Inland Pacific Northwest. Pacific Northwest Extension Publication PNW622. Washington State University.
Dokoozlian, N.K. 2000. Grape Berry Growth and Development. In Raisin Production Manual, edited by L.P. Christensen, 30-37. University of California Publication 3393.
Dry, P.R., R.G. Iland, and R. Ristic. 2004. What is Vine Balance? In Proceedings from the 12th Australian Wine Industry Technical Conference, 68-74, edited by R.J. Blair, P.J. Williams, and I.S. Pretorius. 24-29 July 2004. Melbourne, Victoria.
Fendiger, A.G., R.M. Pool, R.M. Dunst, and R. Smith. 1996. Effects of Mechanical Thinning Minimally-Pruned ‘Concord’ Grapevines on Fruit Composition. In Proceedings of the 4th
International Symposium on Cool Climate Enology and Viticulture, 13-17, edited by T. Henick-Kling, T.E. Wolf, and E.M. Harkness. New York State Agricultural Experiment Station.
Hellman, E. and T. Casteel. 2003. Crop Estimation and Thinning. In Oregon Viticulture, 231-234, edited by E. Hellman. Oregon State University Press.
Hoheisel, G.A. and M.M. Moyer, eds. 2015 Pest Management Guide for Grapes in Washington. Washington State University Extension Publication EB0762.
Keller, M., L.J. Mills, R.L. Wample, and S.E. Spayd. 2004. Crop Load Management in Concord Grapes Using Different Pruning Techniques. American Journal of Enology and Viticulture 55: 35-50.
Kurtural, K.S. and B. O’Daniel. 2007. Crop Estimation in Vineyards. University of Kentucky Extension Publication HO-86.
Moyer, M.M, L. Mills, G.A. Hoheisel, and M. Keller. 2011. Assessing and Managing Cold Damage in Washington Vineyards. Washington State University Extension Manual EM042E.
Moyer, M.M., R.T. Peters, and R. Hamman. 2013. Irrigation Basics for Eastern Washington Vineyards. Washington State University Extension Manual EM061E. Washington State University.
Rankine, B.C., K.M. Cellier, and E.W. Boehm. 1962. Studies on Grape Variability and Field Sampling. American Journal of Enology and Viticulture 13: 58-72.
Skinkis, P. and A. Vance. 2013. Understanding Vine Balance: An Important Concept in Vineyard Management. Oregon State University Extension Manual EM9068.
Wolpert, J.A. and E.P. Vilas. 1992. Estimating Vineyard Yields: Introduction to a Simple, Two-Step Method. American Journal of Enology and Viticulture 43: 384-388.
WSU AgWeatherNet (AWN). Growing Degree Day Overview. Washington State University Irrigated Agriculture Research & Extension Center.
EM086E | Page 9 | ext.wsu.edu
WSU EXTENSION | VINEYARD YIELD ESTIMATION
Appendix
EM086E | Page 10 | ext.wsu.edu
WSU EXTENSION | VINEYARD YIELD ESTIMATION
Copyright 2015 Washington State University
WSU Extension bulletins contain material written and produced for public distribution. Alternate formats of our educational materials are available upon request for persons with disabilities. Please contact Washington State University Extension for more information.
Issued by Washington State University Extension and the U.S. Department of Agriculture in furtherance of the Acts of May 8 and June 30, 1914. Extension programs and policies are consistent with federal and state laws and regulations on nondiscrimination regarding race, sex, religion, age, color, creed, and national or ethnic origin; physical, mental, or sensory disability; marital status or sexual orientation; and status as a Vietnam-era or disabled veteran. Evidence of noncompliance may be reported through your local WSU Extension office. Trade names have been used to simplify information; no endorsement is intended. Published February 2015.
EM086E | Page 11 | ext.wsu.edu
WSU EXTENSION | VINEYARD YIELD ESTIMATION