vilsaint, c. l., kelly, j.f., bergman, b., gorchakov, t ... … · vilsaint, c. l., kelly, j.f.,...
TRANSCRIPT

BARC-10 1
Vilsaint, C. L., Kelly, J.F., Bergman, B., Gorchakov, T., Best, D. & White, W. (2017).
Development and validation of a brief assessment of recovery capital (BARC-10) for alcohol and
drug use disorder, Drug and Alcohol Dependence., 177, 71-76. [Original Submission]
Development and Validation of a Brief Assessment of Recovery Capital (BARC-10) for Alcohol
and Drug Use Disorder
Corrie L. Vilsaint,1 John F. Kelly
2, Brandon G. Bergman
3
1-3Recovery Research Institute, Massachusetts General Hospital & Harvard Medical School
151 Merrimac Street, Boston MA 02114-4709, USA
1Email: [email protected]
2Email: [email protected]
3Email: [email protected]
Teodora Groshkova4
4European Monitoring Centre for Drugs and Drug Addiction, Praça Europa 1, Cais do Sodré
1249-289 Lisbon, Portugal
4Email: [email protected]
David Best5
5Sheffield Hallam University, Room HC.2.14, Heart of the Campus Building, Collegiate
Crescent, Collegiate Campus, Sheffield, S10 2BQ, UK
5Email: [email protected]
William White6
6Chestnut Health Systems, 3329 Sunset Key Circle # 203, Punta Gorda, FL 33955, USA
6Email: [email protected]

BARC-10 2
Correspondence concerning this article should be addressed to Corrie L. Vilsaint.
This research was funded by an anonymous donation to the MGH Recovery Research Institute
(RRI). Donors played no role in the design or conduct of the research or in the collection,
analysis, or interpretation of the data, the writing of the report, or in the decision to submit this
work for publication.
Abstract
Background: It has been long established that achieving recovery from an alcohol or other drug
use disorder is associated with increased biobehavioral stress. To enhance the chances of
recovery, a variety of psychological, physical, social, and environmental resources, known as
“recovery capital”, are deemed important as they can help mitigate this high stress burden. A 50-
item measure of recovery capital was developed (Assessment of Recovery Capital [ARC]), with
10 subscales; however, a briefer version could enhance further deployment in research and busy
clinical/recovery support service settings. To help increase utility of the measure, the goal of the
current study was to create a shorter version using Item Response Theory models. Method:
Items were pooled from the original treatment samples from Scotland and Australia (N=450) for
scale reduction. A reduced version was tested in an independent sample (N=123), and a
Receiver Operating Characteristic Curve was constructed to determine optimal cut-off for
sustained remission (> 12 months abstinence). Results: An abbreviated 10-item measure of
recovery capital captured item representation from all 10 original subscales, was invariant across
participant’s locality and gender, had high internal consistency (α = .90), concurrent validity with
the original measure (rpb =.90), and predictive validity with sustained remission using a cut-off
score of 47. Conclusion: The brief assessment of recovery capital 10-item version (BARC-10)

BARC-10 3
concisely measures a single unified dimension of recovery capital that may have utility for
researchers, clinicians, and recovery support services.
Keywords: recovery capital; substance use disorder; item response theory; brief scale; alcohol;
remission
1.1 Introduction
Policy changes have implicated personal health and well-being as important additional
primary outcomes to assess in recovery from substance use disorder, also referred to as SUD
(Clark, 2007; Davison & White, 2007; Dept. Health and Human Services, 2003; Gagne, White,
& Anthony, 2007; Institute of Medicine, 2006; White, 2005), yet clinical research in the US has
focused almost exclusively on abstinence (Donovan et al, 2012). Remission from SUD is
increasingly recognized as a dynamic reciprocal process that results in, and is supported by, the
accrual of personal, social, environmental, and cultural resources that aid the recovery journey
(Kelly & Hoeppner, 2015). Collectively, these resources have been termed, “recovery capital”
(Granfield & Cloud, 1999). Recovery capital represents the quantity and quality of internal and
external resources that can be brought to bear to initiate and sustain recovery from SUD. The
accrual of recovery capital is theoretically important because greater assets will influence
resiliency and coping, and can help mitigate the high burden of biological and psychological
stress associated with the adaptation to abstinence and remission from SUD (Kelly & Hoeppner,
2015; Laudet & White, 2008). Traditional clinical and research tools often use deficit-based
forms of assessment which focus on measuring pathology and harm (e.g., ASI; McLellan et al,
1992). When used alone, traditional tools fail to capture what a review of long-term recovery

BARC-10 4
concluded was one of the strongest predictors of remission: strength-based assessment of
resources (White & Cloud, 2008).
The significance of the construct of recovery capital has led to the development and
testing of psychometrically and conceptually sound assessment tools. For example, a recovery
capital assessment tool (Assessment of Recovery Capital: ARC; Groshkova, Best, & White,
2013) was validated recently showing good psychometric properties and consisted of 50 items
representing 10 conceptual subscales. The addition of a briefer version of the ARC, could
increase its adoption and implementation in busy clinical and recovery support service settings
by increasing speed of administration and scoring; however, this process of scale reduction
requires rigorous methodological guidelines to maintain validity.
Item response theory (IRT) and the rasch model of scale development (Rasch,
1960/1980) is a powerful paradigm for scale reduction as it maximizes the efficiency of construct
measurement and can help to create briefer measures of equal or greater psychometric value as
longer measures of the same domains. IRT methods allow for a precise “diagnosis” of the
functioning of each item and response category using a set of interpretative tools (item
characteristic, response probability, information curves, differential item functioning, etc.) which
provide the bases for item retention in scale reduction (Goetz et al, 2013).
The aim of this study was to work with the original set of 50 items from the ARC
(Groshkova et al, 2013) to develop a briefer version that could be deployed more widely in busy
clinic/recovery support services settings and in research contexts. The original 50 items are
made up of subscales that capture 10 different conceptual domains of recovery capital:
substance use and sobriety, global psychological health, global physical health, citizenship and
community involvement, social support, meaningful activities, housing and safety, risk-taking,

BARC-10 5
coping and life functioning, and recovery experience. Our goal was to keep as few items as
possible while preserving the conceptual model and maximizing its psychometric properties. In
doing so we used IRT to identify one item from each of the 10 subscales with the best
psychometric characteristics that could be retained and combined to represent a single unified
dimension of recovery capital. Similar to current methodological guidelines for shortening
composite measurement scales (Goetz et al, 2013), we sought to preserve the content validity and
psychometric properties of the original instrument, eliminate differential item functioning (DIF)
and item redundancy, document the empirical and conceptual reasons for the item selection, and
validate the short instrument (Brief Assessment of Recovery Capital, BARC-10) in an
independent sample.
2.1 Method
2.2 Participants
Secondary data analyses were performed on the original treatment sample from Scotland
used to field-test the Assessment of Recovery Capital (ARC) in 2010 (Groshkova et al, 2013),
and a treatment sample from Australia collected in 2015 (Best et al, 2016). The treatment
sample from Scotland (n =142) was recruited from four community rehabilitation services. Of
the 142 individuals, 62.7% were men, 69% were white British and 31% were of other ethnicity.
The average age at time of assessment was 35 (± 12.3). Alcohol was the primary substance
reported by 35.3% of the sample, other drugs were reported by 31.6 %, and 33.1% indicated both
alcohol and other drugs. A detailed description of the study design and characteristics of the
sample from Scotland are published by Groshkova and colleagues (2013).
The other treatment sample (n =308) was recruited from five Therapeutic Communities
on the east coast of Australia. Of the 308 individuals, 67.9 % were male, 89.6% were born in

BARC-10 6
Australia and the rest were from the United Kingdom (2.6%) or New Zealand (1.6%). The
average age was 35 years (± 9.2). The majority reported a drug (other than alcohol) to be their
primary substance (63.6%) while 33.1% reported alcohol as primary. A detailed description of
the study design and characteristics of the sample from Australia are published by Best and
colleagues (2016).
Our goal was to develop a brief measure of recovery capital by retaining the treatment
samples from Scotland and Australia for three reasons: 1- we seek to be as consistent with the
original ARC development as possible thereby incorporating the original sample, 2- a brief
measure of recovery capital that is validated on diverse samples will have wider utility, and 3-
suggestions for future DIF guidelines (Zwick, 2012) stated that in order to increase sample size,
if necessary, pooling data from beyond a 12 month interval should be considered to increase
stability of results.
2.3 Measure
The ARC (Groshkova et al, 2013) is a self-report, strength-based measure of an
individual’s personal and social resources that can support recovery from a SUD and contains 50
items. Participants are asked to respond by placing a check mark in the box for the statements
that they agree with and that describe their experience on the day of assessment. The
participant’s response is then recorded and entered as a binary response option (agree/disagree).
The 50 – items are divided into 10 subscales (5 items per subscale) to assess the following
conceptual domains: substance use and sobriety, global psychological health, global physical
health, citizenship and community involvement, social support, meaningful activities, housing
and safety, risk-taking, coping and life functioning, and recovery experience. Subscale scores
are calculated by summing the items. Thus, a score between 0 and 5 can be reached for each

BARC-10 7
subscale. The ARC also can be scored by separating the 50-items into subscales of personal
versus social recovery capital and summing the scores on 25 items in each domain. An overall
total score is the sum of each subscale score and can range from 0 to 50. Higher scores indicate
greater levels of recovery capital.
2.4 Analysis Plan
2.5 Unidimensionality. Evidence of unidimensionality, or finding a single underlying
pattern in the data matrix, is an assumption of using the Rasch model. The original ARC was
designed to have a strong unidimensional component as described in Groshkova et al. (2013).
They reported a single factor was extracted from ten subscales using a principle components
analysis (PCA) which was confirmed by a Bartlett’s test of sphericity and Kaiser-Mayer-Olkin
measure of sampling adequacy. This means that although the ARC has ten subscales, they are
more conceptual than empirical (i.e., PCA does not produce 10 different factors) and may be
represented by a common construct. The samples from Scotland and Australia could be
heterogenous so we will use PCAs to inspect for differences in the subscale factor structure and
assess the degree of empirical support for pooling the samples. If we find the factor structures
are similar in the number of factors produced and range of the loadings, we will use PCA to
assess the subscale factor structure of the pooled samples. The criterion suggests that the first
component should be ≥ 20% (Reckase, 1979), the ratio of the first to second eigenvalue should
be at least 3 to 1 in order for the scale to be considered unidimensional (Lord, 1980).
2.6 Best fitting model (1-PL vs. 2-PL). We compared the fit of the one-parameter
logistic model (i.e., 1-PL also referred to as the Rasch Model) to the two-parameter logistic
model (2-PL) using the program BILOG-MG (Zimowski, Muraki, Mislevy, & Bock, 1996). The
“one parameter” makes reference to the only defining characteristic of the Rasch model: item

BARC-10 8
difficulty (β). The 2-PL is an extension of the 1-PL through the addition of an item slope or
discrimination parameter (α). An items discrimination indicates how strongly the item is related
to the latent trait, similar to a factor loading in classical test theory. Items with high
discrimination are better at differentiating respondents around the location point (b) (i.e., the
amount of the latent trait needed to have a 50% chance of endorsing the item), thus increasing
measurement precision. The 1-PL (Rasch, 1960/1980) and the 2-PL (Birnbaum, 1968) are
appropriate for analyzing ordered dichotomous response formats where respondents rate their
level of agreement with a statement using two categories (e.g., agree/disagree). We used the best
fitting model to test for DIF and then select items for retention in the scale reduction process.
2.7 Differential item functioning (DIF). A test item is labeled with DIF when
examinees with equal ability (i.e., matched or “controlled for” on the underlying latent trait
referred to as theta [θ]), but from different groups, have an unequal probability of endorsing the
item. In other words, if the response to an item is dependent on group membership, the test item
is not invariant across groups (also referred to as item bias). A test of DIF would provide further
empirical information if the samples from Scotland and Australia were similar enough to be
pooled into a single calibration sample by inspecting for invariance in the difficulty (b) and
discrimination (α) parameters. After eliminating items that are labeled with DIF between
locality we pooled the reports into a single calibration sample and tested for DIF between sex.
Since our goal was to eliminate as many items as possible while still retaining conceptual
representation from each of the ten subscales, we adopted flagging rules based on statistical
significance (p < .05) with Mantel-Haenszel as opposed to rules associated with clinical or
practical significance which can produce more conservative results when the goal may be to
retain scale items based upon the impact of DIF (Scott et al, 2010).

BARC-10 9
2.8 Comparison of psychometric properties. We tested whether the BARC-10 had
equivalent psychometric properties to the original ARC by comparing the internal consistency
and concurrent validity between the two measures.
2.9 Independent sample validation. We piloted the BARC-10 in a battery of measures
as part of a survey of members from InTheRooms.com, an online community of individuals in or
seeking recovery, primarily for SUD. InTheRooms.com hosts more than 400,000 individuals,
and is designed to facilitate peer interaction and recovery support through many online resources
including, but not limited to “chats” and live online video meetings. A detailed description of
the study design and sample characteristics can be found elsewhere (Bergman, Kelly, Hoeppner,
Vilsaint, & Kelly, in press).
2.9.1 Category response functioning. The original 50 – item ARC had participants
respond by marking a tick next to the boxes for the statements that they agree which is then
recorded and entered as a binary response option (agree/disagree). We expanded the response
options to six categories for two reasons. First, instruments with binary response categories can
fail to capture the nuances of the construct which may be more apparent in a brief 10-item
measure compared to a more comprehensive 50-item measure. Second, multiple response
options increase sensitivity and thus the ability to make finer discriminations. This is especially
important when measurements are used to make decisions about an individual rather than a
group trait (Frank-Stromborg, 2004) which is a common condition in clinical research.
Therefore, we piloted the BARC-10 in an independent sample with the following six-point Likert
scale response categories: (1) strongly disagree, (2) disagree, (3) somewhat disagree, (4)
somewhat agree, (5) agree, and (6) strongly agree. Scores can range from a minimum of 10 to a
maximum of 60.

BARC-10 10
We used the Partial Credit Model (PCM; Masters, 1982) to examine response categories
functioning in the program WINSTEPS (Linacre, 2011). PCM is appropriate for testing if
polytomous response formats, where respondents rate their level of agreement with a statement
on a multi-point scale, are indeed ordered. The PCM makes no constraints about step difficulties
(intersections between response categories), so step difficulties can differ across different items
and will reflect if the Likert scale functions in a meaningful way. Unlike the Graded Response
Model (Samejima, 1969), the PCM provides an empirical test of the assumption that categories
are ordered which can be useful for item screening during in an initial validation such as this.
Average measures, step calibrations, and fit statistics were examined to test whether the
response categories behaved sufficiently well. Average measures (i.e., ability / trait level
estimates of theta θ, which is recovery capital in this case) and step calibrations are expected to
increase with increasing response categories. Violation of this pattern indicates the response
categories are disordered, or reversed. In addition, we used category fit indices (infit and outfit)
and category probability curves to provide additional information about functioning of response
categories. Infit and outfit statistics reflect the degree of unexpectedness in the data. Infit is
sensitive to patterns of misfit in the data responses than would otherwise be predicted by the
model. Outfit is sensitive to unusual responses such a highly able person failing to endorse an
easy item. The categories are considered as misfitting if infit or outfit statistics were less than .5
or greater than 2 (Linacre, 2011).
2.9.2 Predictive validity. To determine and compare the sensitivity (SN) and specificity
(SP) of the BARC – 10 as an indicator of sustained remission (> 12 months of abstinence) and
obtain its optimal cut-off scores, a receiver operating characteristic (ROC) curve was examined.
Validity coefficients (SN, SP), and the area under the curve (AUC) and its associated 95%
BARC-10 11
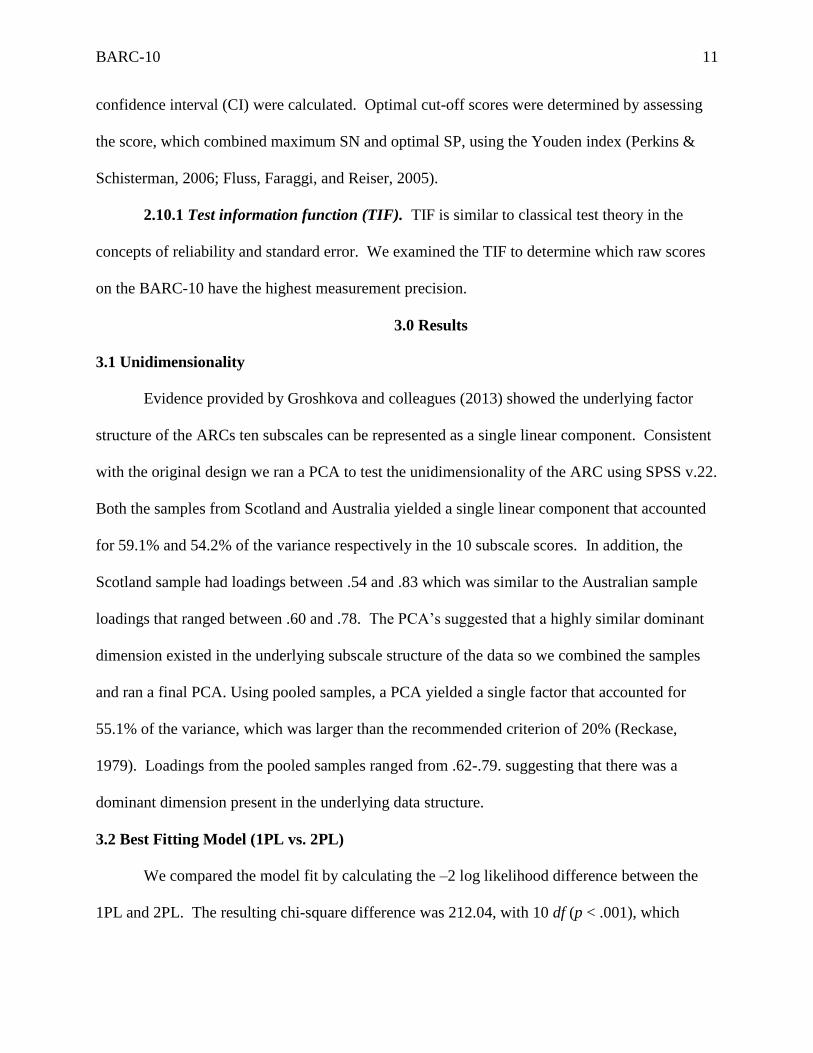
confidence interval (CI) were calculated. Optimal cut-off scores were determined by assessing
the score, which combined maximum SN and optimal SP, using the Youden index (Perkins &
Schisterman, 2006; Fluss, Faraggi, and Reiser, 2005).
2.10.1 Test information function (TIF). TIF is similar to classical test theory in the
concepts of reliability and standard error. We examined the TIF to determine which raw scores
on the BARC-10 have the highest measurement precision.
3.0 Results
3.1 Unidimensionality
Evidence provided by Groshkova and colleagues (2013) showed the underlying factor
structure of the ARCs ten subscales can be represented as a single linear component. Consistent
with the original design we ran a PCA to test the unidimensionality of the ARC using SPSS v.22.
Both the samples from Scotland and Australia yielded a single linear component that accounted
for 59.1% and 54.2% of the variance respectively in the 10 subscale scores. In addition, the
Scotland sample had loadings between .54 and .83 which was similar to the Australian sample
loadings that ranged between .60 and .78. The PCA’s suggested that a highly similar dominant
dimension existed in the underlying subscale structure of the data so we combined the samples
and ran a final PCA. Using pooled samples, a PCA yielded a single factor that accounted for
55.1% of the variance, which was larger than the recommended criterion of 20% (Reckase,
1979). Loadings from the pooled samples ranged from .62-.79. suggesting that there was a
dominant dimension present in the underlying data structure.
3.2 Best Fitting Model (1PL vs. 2PL)
We compared the model fit by calculating the –2 log likelihood difference between the
1PL and 2PL. The resulting chi-square difference was 212.04, with 10 df (p < .001), which

BARC-10 12
indicated the more complex model (2PL) was the best fit to test for DIF and complete the scale
analysis for item retention.
3.3 Differential Item Functioning
Despite the smaller sample sizes, we found significant DIF for one item when comparing
the treatment samples from Australia (nR = 308) to Scotland (nF = 142). We then pooled the
treatment samples and found no DIF between men (nR = 297) and women (nF = 148). The DIF
analysis provided additional support that the samples were similar enough to be pooled into a
single calibration sample. We eliminated the item labeled DIF before completing the scale
analysis and item selection.
3.4 Item Selection
Our goal was to keep as few items as possible while preserving the conceptual model and
maximizing its psychometric properties. Therefore, we retained a single item from each
narrowband subscale to keep the conceptual pieces of recovery capital intact. We used a strategy
that would maximize psychometric properties and efficiency by selecting items with high
discrimination, spanned a wide range of item difficulty, and eliminated items that measured the
same level of difficulty twice (i.e., redundancy). The final items and corresponding parameter
estimates retained for the BARC-10 are displayed in Table 1.
3.5 Comparison of Psychometric Properties
The BARC-10 retained similar psychometric properties of the original ARC which has an
internal consistency of α = .92 compared to the BARC-10 α = .90. The concurrent validity
between the ARC and BARC-10 is high at rpb =.90.

BARC-10 13
Table 1
Item
Threshold
S.E.
Slope
S.E.
There are more important things to me in life than using substances -2.01 1.47
0.21 0.23
In general I am happy with my life 0.18 1.98
0.06 0.22
I have enough energy to complete the tasks I set for myself -0.49 1.82
0.08 0.23
I am proud of the community I live in and feel a part of it -0.48 1.35
0.09 0.17
I get lots of support from friends -0.63 1.36
0.10 0.18
I regard my life as challenging and fulfilling without the need for using drugs or alcohol -0.30 2.00
0.06 0.23
My living space has helped to drive my recovery journey -0.65 1.44
0.09 0.18
I take full responsibility for my actions -1.64 1.31
0.17 0.17
I am happy dealing with a range of professional people 1.53 1.31
0.18 0.19
I am making good progress on my recovery journey -1.32 1.95
0.11 0.24
IRT Parameter Estimates
BARC -10 Scale Items with Corresponding Item Parameter Estimates for Threshold (i.e., difficulty) and Slope
(i.e., discrimination) with Standard Error (S.E)

BARC-10 14
3.6 Independent Sample Validation
3.6.1 Participants. Of the N = 123 respondents from InTheRooms.com, the average age
was approximately 51 years, 43% were male, 94% white, and approximately 45% were
employed full-time. Two-thirds (≈ 64%) identified alcohol as their primary substance and the
mean length of time abstinent was 7.34 years (± 9.25). The sample had extensive treatment
histories, with 65% reporting participation in outpatient addiction treatment, almost 50% had
used medical detoxification, and 60% inpatient/residential. The mean total score on the BARC-
10 was 50.70 (± 6.91).
3.6.2 Category response functioning. Overall, the PCM supported the use of a six –
point Likert scale response category. Within each item, the average measures and step
calibrations increased monotonically as the rating scale moved from lower to higher categories.
The category response curves also showed successive response categories each located in the
expected order. This meant that each category was the most likely to be endorsed according to a
corresponding trait level and there is no reason to consider collapsing response categories.
Inspection of the category fit indices showed that each of the six response categories showed
acceptable infit mean-square statistics (between .96 - 1.79) and all categories had acceptable
outfit mean-square statistics with the exception of one (between .94 - 2.45), strongly disagree
which was 2.45.
3.6.3 Predictive validity. Sensitivity (SN) and specificity (SP) values for different cut-
off points were computed and a ROC curve was constructed to determine the best cut-off to
choose. The estimated ROC curve had an AUC of .79 (95% CI .71 - .86) which indicates the
BARC-10’s concurrent validity with sustained remission (> 12 months of abstinence). The
hypothesis was tested whether the AUC was greater than .5, that is whether using the BARC –

BARC-10 15
10 to predict recovery stage is better than chance alone. The AUC = .79 (95% CI .71 - .86) (P <
.0001), suggesting the BARC-10 does help to predict recovery stage. Next, Youden indices were
calculated for a range of possible cut-off points using SN and SP values for the BARC-10 total
score. According to the ROC curve above and guided by the J-values, the optimal cut-off level
yielding maximal SN and SP for predicting early recovery or later (i.e., 1 year or more) was a
BARC-10 score of 47 (SN = 84%; SP = 65%, at J = .53).
3.6.4 Test information function (TIF). TIF is an indicator of measurement precision
and can be determined at any level of ability, or in this case, any level of recovery capital. For
ability estimates of theta (θ) that range between −2.40 and 2.03 the scale measures with greater
than 80% reliability. This means the BARC-10 is over 80% reliable on raw scores between 15 to
53.
4.0 Discussion
This is the first empirical study to develop a brief version of the original 50-item ARC
(Groshkova et al, 2013) using item response theory. We shortened the ARC by eliminating
items that showed DIF and item redundancy, retained one item from each of the 10 narrowband
subscales that had the best psychometric properties to maintain content validity and represent a
single unified dimension, and validated the brief instrument in an independent sample. After
piloting the BARC-10, we used the PCM to determine that a six-point Likert scale was
empirically supported and each response category had meaning relative to a corresponding trait
level. We used a ROC curve analysis to test the ability of the BARC-10 to identify individuals
who had reached self-reported sustained remission and found that 12 months or more of
abstinence from alcohol and other drugs was associated with a score of 47. The resulting
BARC-10 is a 10 – item measure which is invariant across groups based on locality and sex.

BARC-10 16
The BARC-10 can be completed in approximately one minute, has high content validity
capturing the same 10 domains of recovery capital used to develop the original instrument, and
possesses equivalent psychometric properties.
The need for measures of recovery capital is driven by a paradigmatic shift in the field of
addiction recovery and reinforced by policy changes (Clark, 2007; Davison et al, 2007; Dept.
Health and Human Services, 2003; Gagne et al, 2007; Institute of Medicine, 2006; White, 2005).
Similar to the ARC, the BARC-10 measures the quantity of broader personal, social, physical,
and professional resources in an individual’s environment that are used to initiate and sustain
recovery as well as structural supports such as a recovery-supportive living space and
community relationships, but in a briefer version with equally good psychometric properties and
a high correlation with the longer measure. As such, it offers an alternative measure of recovery
capital in settings where brevity is valued.
The BARC-10 provides an index of recovery progress that extends beyond mere
abstinence. As such, it might be used as measure of the positive outcome benefits accrued as
individuals abstain or reduce their substance use. Additionally, it may serve as a useful
proximal/intermediate measure to assess mechanisms of behavior change as greater accrual or
recovery capital may predict future abstinence and remission (Kelly et al, 2015). Evaluation and
progress measures can provide valuable insight to both program evaluation and patients’ success,
and is often of interest (or requirement) of insurance companies. As important payers and other
stakeholders in the field continue to scrutinize the recovery construct (Knopf, 2001; El-Guebaly,
2012) it is important to have measureable indicators of recovery progress beyond self-reported
abstinence, objective urine, and blood tests.
4.1 Limitations

BARC-10 17
Findings from the current study should be viewed in light of important limitations. One
such limitation is the lack of verification of self-reported recovery time. In addition, the mean
score on the BARC-10 was almost 50 which may suggest a ceiling effect given the maximum
score is 60; however, this should be considered in light of the mean length of recovery time in
the sample which was approximately 7.5 years (i.e., maintenance or long-term recovery). A
strength of the measure is its cross-validation in international treatment samples; however, the
we used convenience samples that could have some heterogeneity and the psychometric
properties should be further evaluated in other samples. Furthermore, the extent to which
clinicians find the BARC-10 helpful in establishing care plans and ranking priorities in ongoing
client support is yet to be investigated. As noted by Groshkova and colleagues (2013), an
important line of future research is to determine the degree to which various profiles of recovery
capital combined with symptoms of problem severity predict levels of care and post-intervention
recovery outcomes.
4.2 Conclusion
With the aid of Item Response modeling and its wide acceptance as a gold standard for
refining and reducing the length of existing scales in the social, medical, and educational
sciences we have been able to reduce scale length without undermining its psychometric
properties. As such, the briefer BARC-10 may serve as a potentially helpful additional tool for
researchers, clinicians, health care systems and electronic health records, as well as peer-to-peer
recovery support services where brevity is needed.

BARC-10 18
References
Bergman, B. G., Kelly, N.W., Hoeppner, B. B., Vilsaint, C.L., & Kelly, J.F. (in press).
Psychology of Addictive Behaviors. Digital recovery management: Characterizing
participation and perceived benefit among members of a recovery-specific social network
site.
Best, D. W., Haslam, C., Staiger, P., Dingle G., Savic, M., Bathish, R., Mackenzie J., Beckwith,
M., Lubman, D. I., (2016). Social networks and recovery (SONAR): characteristics of a
longitudinal outcome study in five therapeutic communities in Australia. The
International Journal of Therapeutic Communities, 37(3), 131-139.
http://dx.doi.org/10.1108/TC-04-2016-0012
Birnbaum, A. (1968). Some latent trait models and their use in inferring an examinee’s ability, in
F. Lord & M. Novick (Eds.). Statistical Theories of Mental Test Scores. Reading, MA:
Addison-Wesley, 397-479.
Clark, W. (2007). Recovery as an organizing concept. Accessed 02/09/2017 at
http://www.williamwhitepapers.com/pr/Interview_With_H._Westley_Clark_MD_JD,_M
PH_CAS_FASAM%20Interview.pdf
Davidson, L., & White, W. (2007). The concept of recovery as an organizing principle for
integrating mental health and addiction services. Journal of Behavioral Health Services
and Research, 34(2), 1094-3412. doi:10.1007/s11414-007-9053-7
Department of Health and Human Services (2003). Achieving the promise: Transforming mental
health care in America. Rockville, MD: Substance Abuse and Mental Health Services
Administration.
Donovan, D.M., Bigelow, G. E., Brigham, G. S., Carroll, K. M., Cohen, A. J., Gardin, J. G.,
BARC-10 19
Hamilton, J. A., Huestis, M.A., Hughes, J.R., Lindbald, R., Marlatt, G.A., Preston, K. L., Selzer,
J. A., Somoza, E. C., Wakim, P. G., & Wells, E. A. (2012). Primary outcome indices in
illicit drug dependence treatment research: systematic approach to selection and
measurement of drug use end-points in clinical trials. Addiction, 107(4), 694-708. doi:
10.1111/j.1360-0443.2011.03473.x.
El-Guebaly, N. (2012). The meanings of recovery from addiction: Evolution and promises.
Journal Addiction Medicine, 6, 1–9. doi: 10.1097/ADM.0b013e31823ae540.
Frank-Stromborg, M. (2004). Instruments for clinical health-care research. 3rd Edition, Jones
and Bartlett, Sudbury.
Fluss R., Faraggi, D., and Reiser, B. (2005). Estimation of the Youden index and its associated
cutoff point. Biometrical Journal, 47(4), 458-472. DOI: 10.1002/bimj.200410135.
Gagne, C. A., White, W., & Anthony, W. A. (2007). Recovery: A common vision for the fields
of mental health and addictions. Psychiatric Rehabilitation Journal, 32(1), 32−37.
doi:10.2975/31.1.2007.32.37
Goetz, C., Coste, J., Lemetayer, F., Rat, A., Montel, S., Recchia, S., Debourverie, M., Pouchot,
J., Spitz, E., & Guillemin, F. (2013). Journal of Clinical Epidemiology, 66, 710-718.
http://dx.doi.org/10.1016/j.jclinepi.2012.12.015.
Granfield, R., & Cloud, W. (1999). Coming clean: Overcoming addiction without treatment.
New York: New York University Press.
Groshkova, T., Best, D., & White, W. (2013). The Assessment of Recovery Capital: Properties
and psychometrics of a measure of addiction recovery strengths. Drug and Alcohol
Review, 32(2), 187-194.
Institute of Medicine (2006). Improving the quality of health care for mental and substance-use
BARC-10 20
conditions. Washington, DC: National Academy Press.
Kelly, J. F., & Hoeppner, B. (2015). A biaxial formulation of the recovery construct. Addiction
Research & Theory, 23(1), 5-9. http://dx.doi.org/10.3109/16066359.2014.930132
Knopf, A. (2011). Definition of recovery is vague, measures elusive, even as taxpayers fund
services. Alcoholism & Drug Abuse Weekly, 23(18), 1-8. DOI: 10.1002/adaw.20280
Jollife, I. T. (2002). Principal Component Analysis. Second ed. Springer Series in Statistics. New
York: Springer-Verlag New York.
Laudet, A, B. & White, W. L. (2008). Recovery capital as prospective predictor of sustained
recovery, life satisfaction, and stress among former poly-substance users. Substance Use
& Misuse, 43(1), 27-54. DOI: 10.1080/10826080701681473.
Linacre, J. M. (2002). Optimizing rating scale category effectiveness. Journal of Applied
Measurement, 3(1), 85–106.
Lord, F. M. (1980). Applications of item response theory to practical testing problems. Hillsdale,
NJ: Erlbaum.
Masters, G. N. (1982). A rasch model for partial credit scoring. Psychometrika, 47(2), 149-174.
DOI: 10.1007/BF02296272.
McLellan, T. A., Kushner, H., Metzger, D., Peters, R., Smith, I., Grissom, G., Pettinati, H.,
Argeriou, M. (1992). The fifth edition of the addiction severity index. Journal of
Substance Abuse Treatment, 9(3), 1969-213.
Perkins, N. J & Schisterman, E. F. (2006). The inconsistency of “Optimal” cutpoints obtained
using two criteria based on the receiver operating characteristic curse. American Journal
of Epidemiology, 163(7), 670-675. DOI: 10.1093/aje/kwj063.
Rasch, G. Probabilistic models for some intelligence and attainment tests. Danish Institute for

BARC-10 21
Educational Research, 1960 [in Danish]. The University of Chicago Press; 1980.
Reprinted by Chicago: MESA Press, 1993.
Reckase, M. D. (1979). Unifactor latent trait models applied to multifactor tests: Results and
implications. Journal of Educational Statistics, 4, 207–230. doi:10.2307/1164671.
Rosato, R., Testa, S., Bertolotto, A., Confalonieri, P., Patti, F., Lugaresi, A., Grasso, M., G.,
Toscano, A., Giordano, A., Solari, A. (2016). Development of a short version of
MSQOL-54 using factor analysis and item response theory. Plos One, 11(4), 1-15.
DOI:10.1371/journal.pone.0153466.
Samejima, F. (1969). Estimation of Latent Ability Using a Response Pattern of Graded Scores
(Psychometric Monograph No. 17). Richmond, VA: Psychometric Society. Retrieved
from http://www.psychometrika.org/journal/online/MN17.pdf
Scott, N. W., Fayers, P. M., Aaronson, N. K., Bottomley, A., de Graeff, A., Groenvold, M.,
Gundy, C., Koller, M., Peterson, M. A., Sprangers, M. AG. (2010). Differential item
functioning (DIF) analyses of health-related quality of life instruments using logistic
regression. Health and Qualify of Life Outcomes, 8(81), 2010. DOI: 10.1007/s11136-009-
9453-7.
White, W. (2005). Recovery: Its history and renaissance as an organizing construct. Alcoholism
Treatment Quarterly, 23(1), 3−15. doi:10.1300/J020v23n01_0.
White, W. (2007). Addiction recovery: Its definition and conceptual boundaries. Journal of
Substance Abuse Treatment, 33(3), 229-241.
White, W. & Cloud, W. (2008). Recovery capital: A primer for addictions professionals.
Counselor, 9(5), 22-27.
Zimowski, M. F., Muraki, E., Mislevy, R. J., & Bock, R. D. (1996). BILOG-MG: multiple-group

BARC-10 22
item analysis and test scoring. Chicago: Scientific Software International.
Zwick, R. (2012). A review of ETS differential item functioning assessment procedures: flagging
rules, minimum sample size, and criterion refinement. ETS Research Report Series,
2012(1). DOI: 10.1002/j.2333-8504.2012.tb02290.x.