village of wellsville - history wwtp...village of wellsville preliminary engineering report...
TRANSCRIPT

Village of Wellsville
152 Bolivar
Wellsville, New York 14895
Prepared by:
The Culver Road Armory
145 Culver Road, Suite 160
Rochester, New York 14620
(585) 381-9250 — (585) 381-1008 fax
www.mrbgroup.com — e-mail: [email protected]
Copyright 2016 by MRB Group
All Rights Reserved
The following is an excerpt from the New York Education Law Article 145 Section 7209 and applies to this document.
“It is a violation of this law for any person unless he is acting under the direction of a Licensed Professional Engineer or Land Surveyor to alter an item in any way. If
an item bearing the Seal of an Engineer or Land Surveyor is altered, the Altering Engineer or Land Surveyor shall affix to the item his Seal and the Notation ‘Altered
By’ followed by his signature and the date of such alteration and a specific description of the alteration”.
PRELIMINARY ENGINEERING REPORT
For the
VILLAGE OF WELLSVILLE
WASTEWATER TREATMENT PLANT
Revised December 2016
MRB Group Project No. 2314.15001

Village of Wellsville Preliminary Engineering Report
Wastewater Treatment Plant August 2016
MRB Group Project No. 2314.15001 Page 1
TABLE OF CONTENTS
I. EXECUTIVE SUMMARY .......................................................................................................... 3
II. INTRODUCTION ................................................................................................................... 6
A. PURPOSE OF REPORT .................................................................................................. 6 B. BACKGROUND........................................................................................................... 6
III. EXISTING FACILITIES ............................................................................................................ 8
A. EXISTING WWTP COMPONENTS .................................................................................. 8 B. EXISTING LOADING CONDITIONS ................................................................................. 9
IV. BASIS FOR EVALUATION CONDITIONS .................................................................................. 12
A. PERMIT REQUIREMENTS .............................................................................................. 12 B. DESIGN SCENARIOS ................................................................................................. 12
V. WWTP COMPONENT EVALUATION ...................................................................................... 14
A. INFLUENT SCREEN ..................................................................................................... 15 B. AERATED GRIT REMOVAL ......................................................................................... 15 C. PRIMARY CLARIFIERS ................................................................................................ 16 D. TRICKLING FILTERS .................................................................................................... 17 E. FINAL CLARIFIERS ..................................................................................................... 18 F. SOLIDS HANDLING ................................................................................................... 19
VI. NITRIFICATION CONDITION EVALUATION.............................................................................. 20
A. TRICKLING FILTERS .................................................................................................... 20 B. LEACHATE RECEIVING STATION ................................................................................. 20 C. RECIRCULATION SYSTEM ............................................................................................ 21
VII. PROPOSED DESIGN IMPROVEMENTS ..................................................................................... 22
A. EXISTING DESIGN CONDITION ................................................................................... 22 B. PROPOSED DESIGN CONDITION ................................................................................ 23
VIII. PROJECT COST ESTIMATES .................................................................................................. 26
A. CAPITAL PROJECT COSTS ......................................................................................... 26 B. TOTAL ANNUAL USER COSTS ..................................................................................... 26
IX. RECOMMENDATIONS ......................................................................................................... 28
Village of Wellsville Preliminary Engineering Report
Wastewater Treatment Plant August 2016
MRB Group Project No. 2314.15001 Page 2
LIST OF TABLES
TABLE III.1: EXISTING FLOWS ................................................................................................... 9
TABLE III.2: EXISTING INFLUENT ORGANIC LOADING ............................................................... 10
TABLE III.3: EXISTING EFFLUENT ORGANIC LOADING ............................................................... 11
TABLE III.4: POPULATION PROJECTIONS ................................................................................. 11
TABLE IV.5: DESIGN FLOWS AND LOADING ............................................................................ 12
TABLE V.6: PRIMARY CLARIFIERS DIMENSIONS ....................................................................... 15
TABLE V.7: PRIMARY CLARIFIER CAPACITY ............................................................................ 15
TABLE V.8: FINAL CLARIFIER CAPACITY ................................................................................. 17
TABLE VIII.9: CAPITAL PROJECT COSTS ................................................................................. 25
TABLE VIII.10: TOTAL ANNUAL USER COSTS ........................................................................... 26
TABLE IX.11: POSSIBLE PROJECT SCHEDULE ........................................................................... 28
LIST OF FIGURES
FIGURE 1. LOCATION MAP
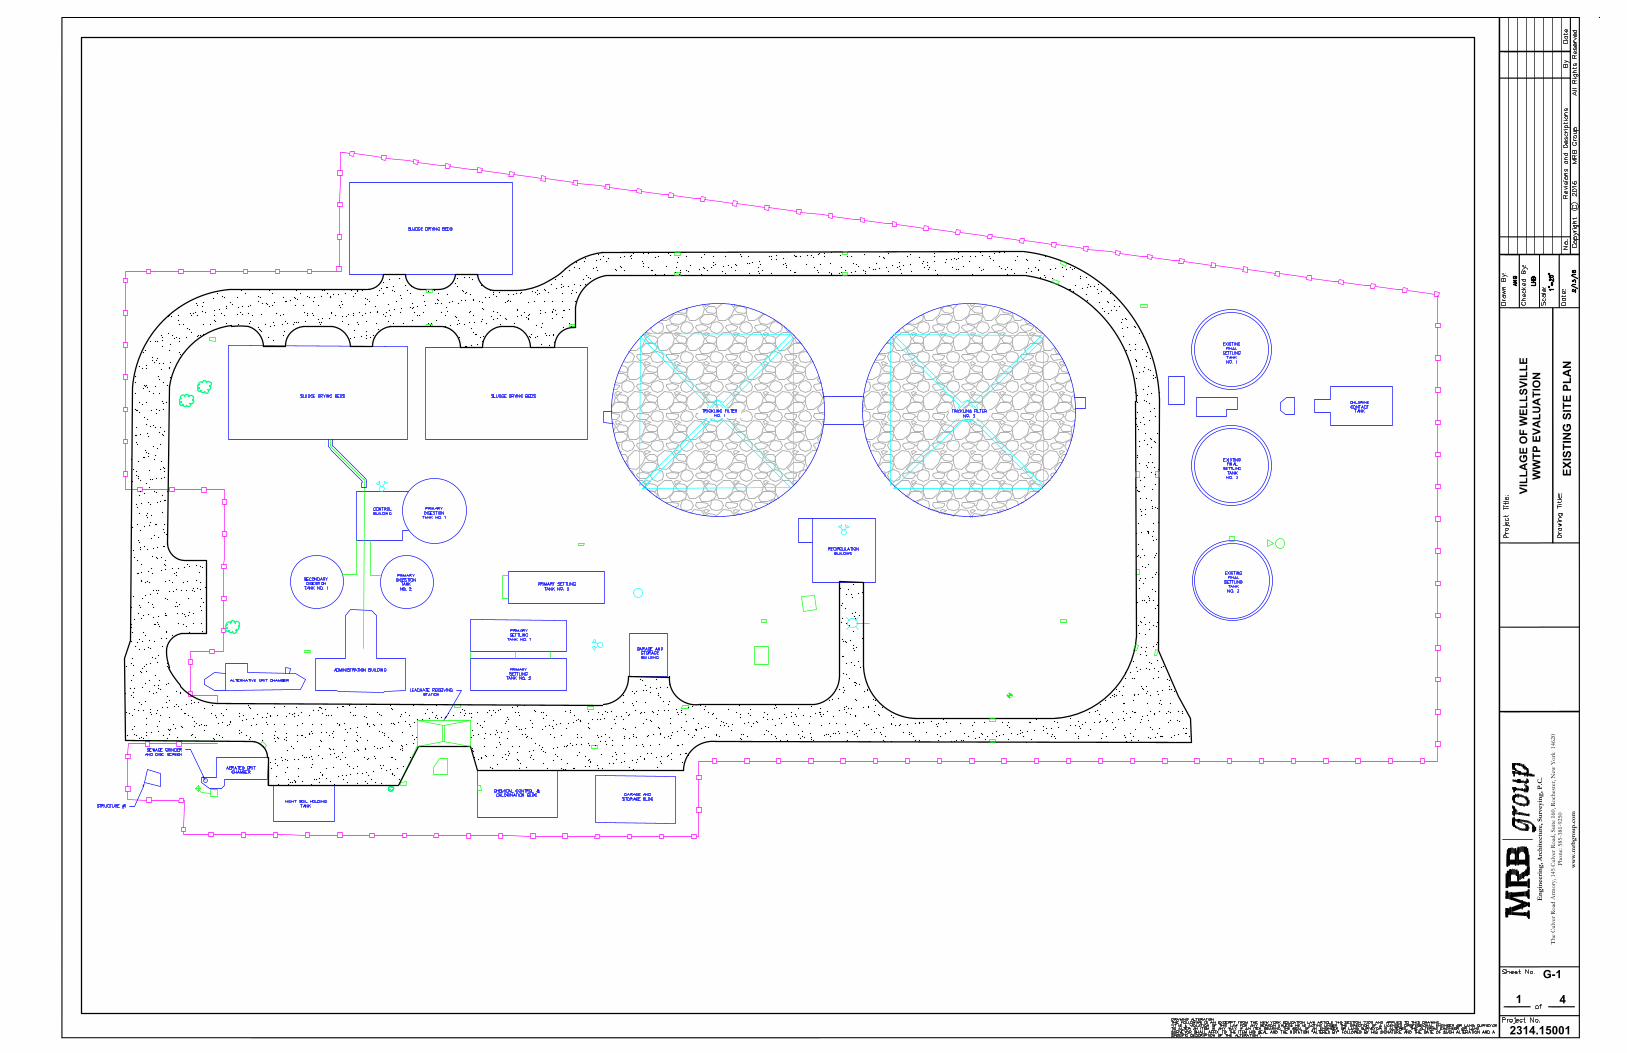
FIGURE 2. EXISTING SITE PLAN
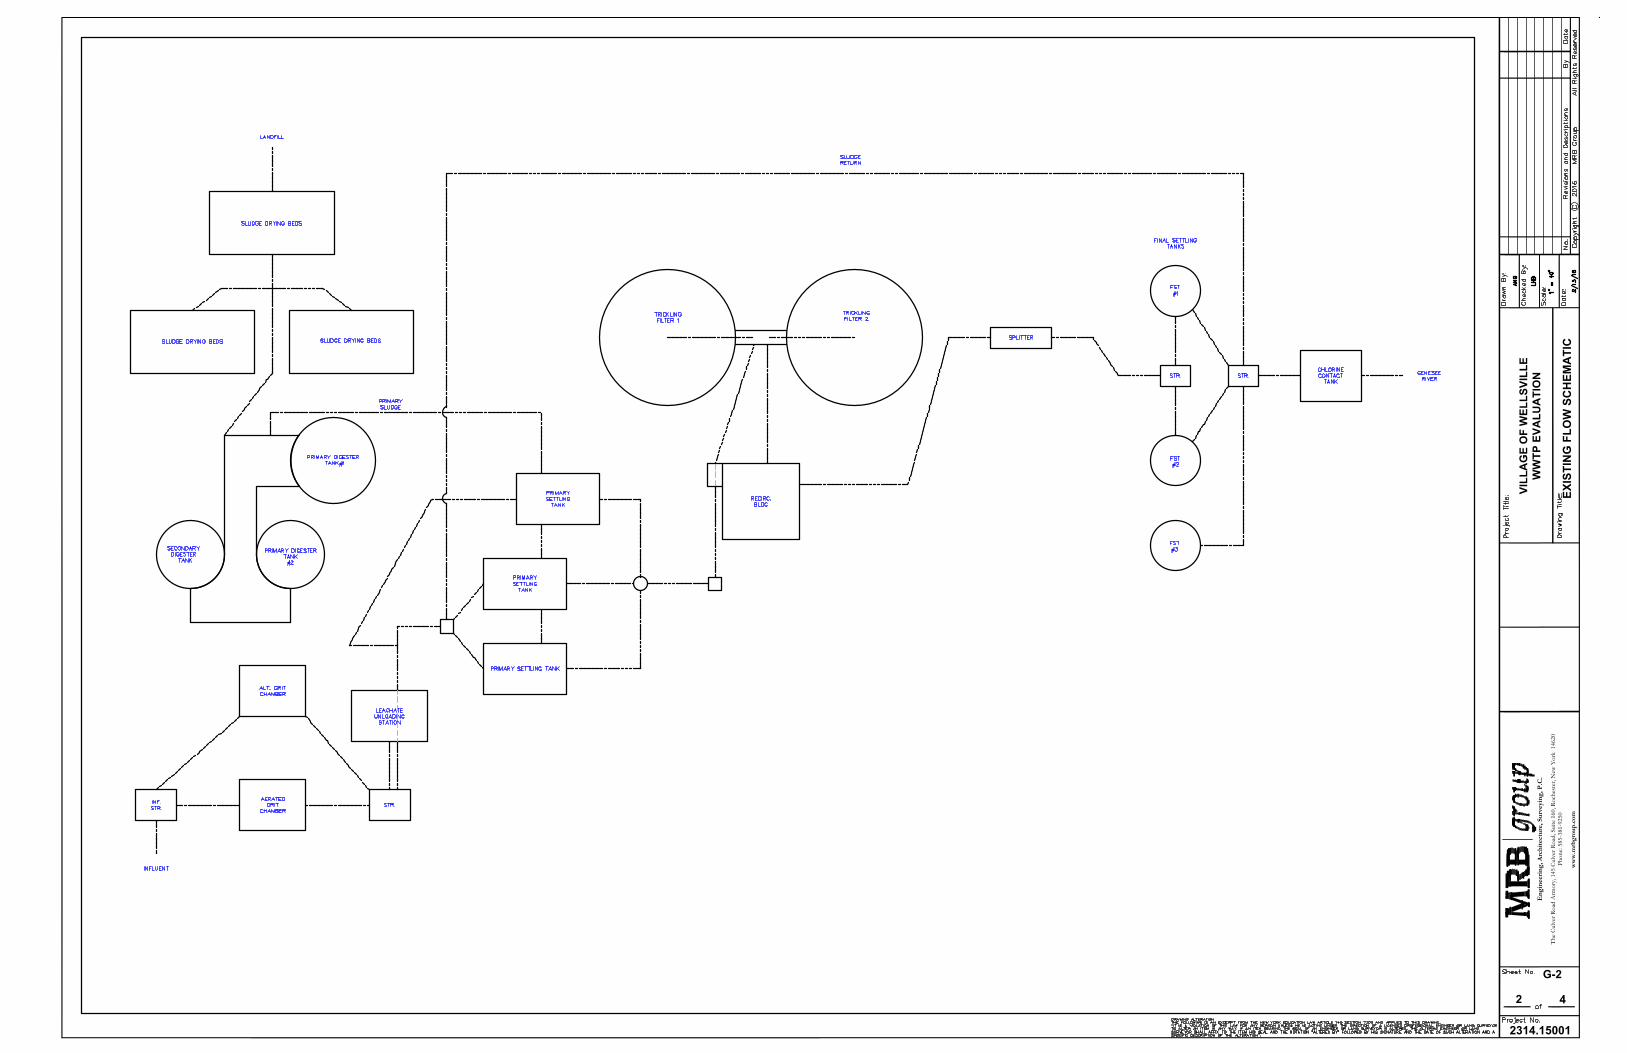
FIGURE 3. EXISTING PROCESS FLOW SCHEMATIC
FIGURE 4. PROPOSED SITE PLAN
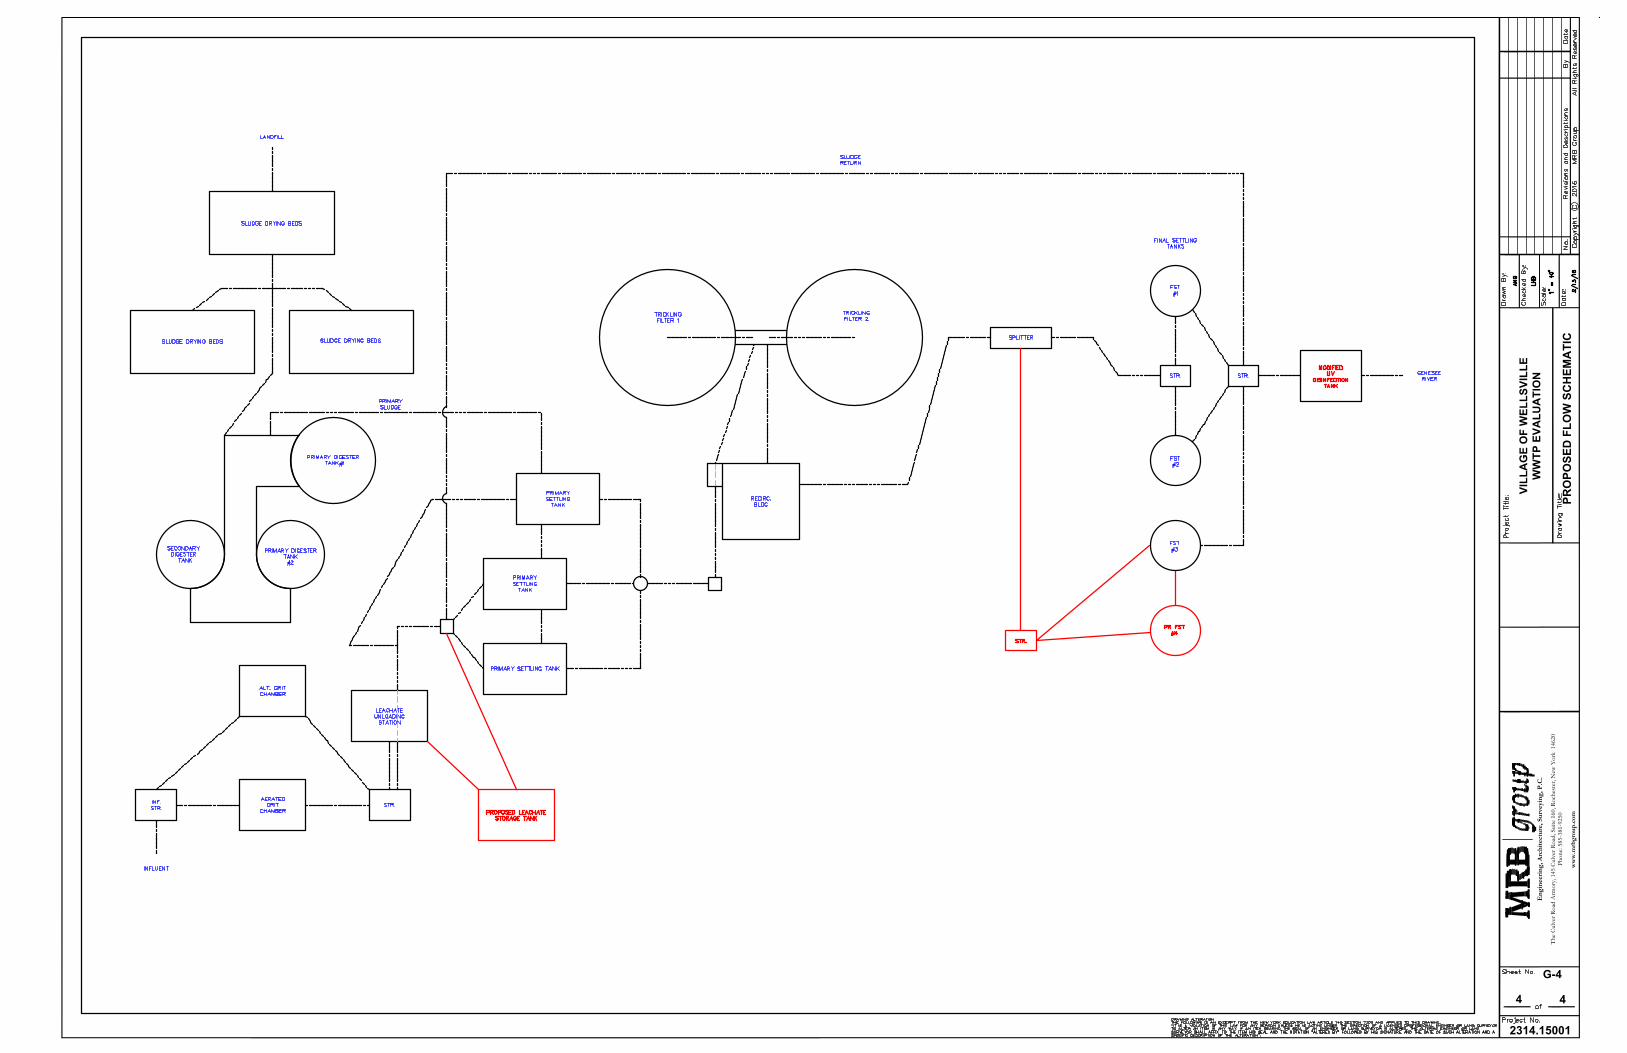
FIGURE 5. PROPOSED PROCESS FLOW SCHEMATIC
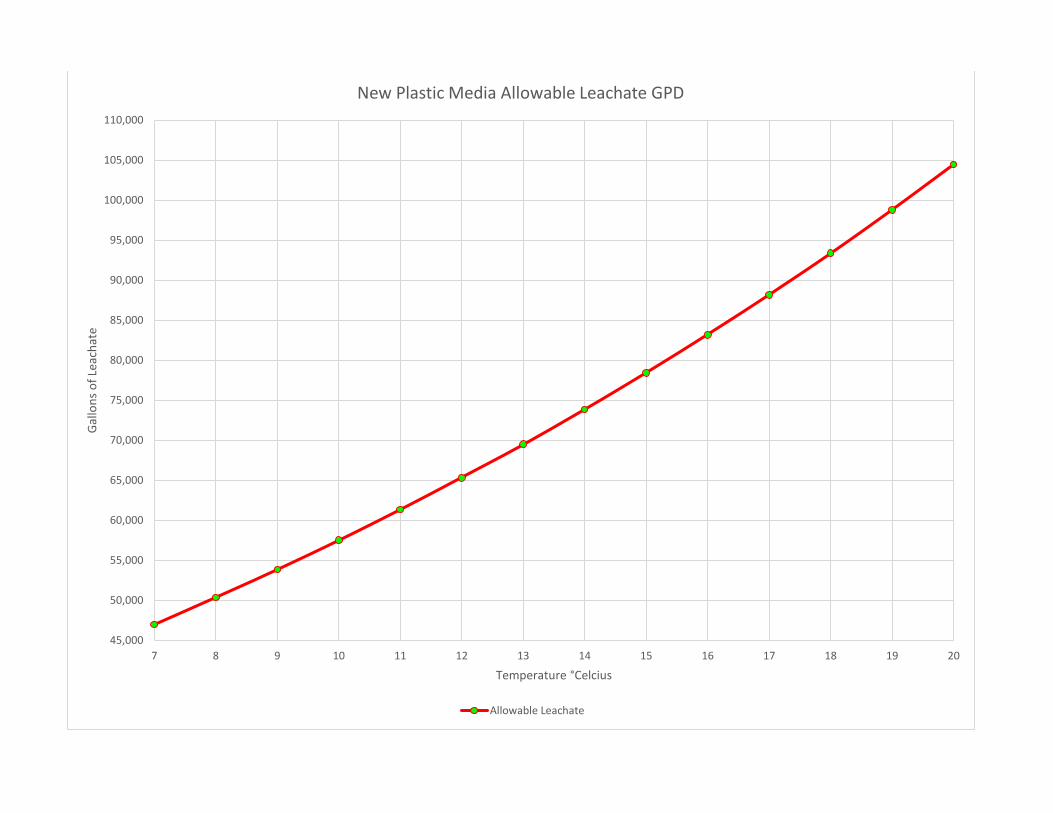
FIGURE 6. ALLOWABLE LEACHATE ESTIMATES
LIST OF APPENDICES
A. CURRENT WWTP SPDES PERMIT
B. SEWER EDU DETERMINATION
C. NYSDEC WI/PWL LISTING FOR GENESEE RIVER AT WELLSVILLE
D. EXISTING FLOW AND LOADINGS
E. LEACHATE DATA
F. DESIGN PARAMETERS
G. WWTP CAPACITY EVALUATION CALCULATIONS
H. PROJECT COST ESTIMATES
I. WELLSVILLE ACS MEDIAN HOUSEHOLD INCOME
J. WELLSVILLE SEWER BUDGET
Village of Wellsville Preliminary Engineering Report
Wastewater Treatment Plant August 2016
MRB Group Project No. 2314.15001 Page 3
I. EXECUTIVE SUMMARY
The Village of Wellsville is evaluating the need for improvements at the Wastewater
Treatment Plant (WWTP) to address recent changes to its State Pollution Discharge
Elimination System (SPDES) permit, specifically a new effluent Ammonia limit. The
WWTP currently treats influent flow from the Village and accepts and processes
leachate from local landfills. The primary source of leachate comes from the Hyland
Landfill in Angelica New York. The current changes to the SPDES permit have a direct
effect on the amount of leachate that the WWTP can adequately treat and
therefore accept. The acceptance of leachate also has a direct effect on the
Village’s Sewer budget as it is a source of revenue for their Sewer Fund.
This Preliminary Engineering Report generally presents the following:
The existing unit processes can meet the required limits specified in their SPDES
permit only under current flow and loading conditions experienced at the
treatment plant. To meet design flows and loadings, the plant would need
capacity upgrades. In addition, leachate acceptance would be severely limited.
An outline of the major upgrades needed at the WWTP can be reviewed within
the report and their associated cost estimates. To allow the WWTP to maintain its
rated capacity and in preparation to meet future limits, major capital
improvements are needed.
This analysis concludes that the addition of plastic media, along with mechanicals
and covers for the filters will allow the plant to process much more leachate
(40,000-50,000 gallons per day) and still meet the new effluent ammonia limits. In
order to store and release leachate into the plant at a controlled rate, we note
that additional storage may be required. The Village should also update the
headworks analysis to verify acceptable leachate quantities.
The cost benefit analysis for disinfection identifies Ultra-violet disinfection (UV
disinfection) as being a more cost effective solution than chlorination/de-
chlorination for the Village of Wellsville. Major contributing factors include the
handling costs of chlorination and de-chlorination chemicals, the need for
increased tankage for chlorine contact time, regulatory requirements associated
Village of Wellsville Preliminary Engineering Report
Wastewater Treatment Plant August 2016
MRB Group Project No. 2314.15001 Page 4
with chemical storage and the low electrical cost associated with the Village of
Wellsville utilities.
Due to the significant cost associated with these improvements, it is
recommended the Village apply for funding, including the CWSRF through NYS
EFC. Upon approval of the funds, the Village can determine the best economical
approach.
In conjunction with any potential improvements to the WWTP, it is important that
the Village continue (on an annual basis) to identify and attempt to reduce
Infiltration and Inflow (I&I) in order to keep excessive I&I flows to a minimum. The
Village is aware of Inflow and Infiltration issues within the collection system.
Previous smoke testing and wet/dry analysis show significant repairs are required
to the collection system.
Some other minor and inter-related upgrades needed at the WWTP are discussed
and included in the report as part of the WWTP project. These issues were evaluated
in previous reports and have been included in the scope of this project to provide a
more comprehensive solution in regards to upgrading the WWTP.
If the Village were to undertake all recommended improvements, the project cost is
estimated at approximately $10.2 million in capital costs. The Village MHI (median
household income) is $39,792 based 2010-2014 ACS census data. With this capital
cost financed at 4.5% interest and considering that the operational and
maintenance costs would be relatively the same as they are now (due to
improvements in efficiencies associated with the upgrades), an EDU cost has been
projected to rise from $196 to $342. This represents an approximate increase in the
overall sewer budget of approximately 75% which would require the same increase
in sewer rates to cover this additional expense. Any potential low interest financing
or grant will help reduce this significant increase in costs.
Village of Wellsville Preliminary Engineering Report
Wastewater Treatment Plant August 2016
MRB Group Project No. 2314.15001 Page 5
In accordance with NYS CWSRF requirements, this investigation and report
evaluated, where applicable, the most efficient water use, reuse, and recapture
conservation efforts. As examples, treated effluent water is used to wash equipment
and tanks, and gas from the digesters is proposed to fuel the heating system.
Modern, energy efficient motors and equipment is recommended to replace
outdated, less conservative models where possible. Upgrades that were evaluated,
considered the costs of operating and maintaining the project over its effective life
span, along with replacement costs.

Village of Wellsville Preliminary Engineering Report
Wastewater Treatment Plant August 2016
MRB Group Project No. 2314.15001 Page 6
II. INTRODUCTION
A. PURPOSE OF REPORT
This report has been prepared to evaluate the potential need to upgrade the
existing Village of Wellsville WWTP to address the following issues:
Recent modifications to the SPDES permit to include Ammonia limits
Evaluating the capacity of the existing trickling filters and their ability to treat BOD
and NH3 (Ammonia) with the existing rock media and with proposed plastic high
rate filter media.
Evaluating the feasibility and benefits of adding covers to the Trickling filters.
Determining the amount of leachate the existing WWTP can take without
exceeding the biological capacity of the plant.
Determining the amount of leachate the WWTP can take if the trickling filters were
upgraded, and evaluate options for the storage and discharge of the leachate.
Analyze plant process components with respect to capacity and service life
Provide cost estimates for recommended upgrades
This report will assess the capacity of the processes to meet both current and future
conditions.
B. BACKGROUND
The Village of Wellsville WWTP is located off Bolivar Road on the west side of the
Genesee River in the Village of Wellsville. The WWTP takes and treats waste from
within the Village of Wellsville, special districts within the Town of Wellsville as well
as taking leachate from a number of different landfills. The average influent flow
at the plant, including leachate, is 1.15 MGD.
For this evaluation, the Village POTW is considered to serve approximately 4,270
Equivalent Dwelling Units (EDU’s). This is calculated based on the number of
residential sewer accounts and the ratio of flow contributed by non-residential
users to the average residential customer, which is approximately 38,145 gallons
per year or 105 gallons per day (see Appendix B).
Village of Wellsville Preliminary Engineering Report
Wastewater Treatment Plant August 2016
MRB Group Project No. 2314.15001 Page 7
The WWTP accepts leachate from the Allegany County Landfill, the Hyland Facility
in Angelica NY and from the Village of Wellsville. The total average monthly
leachate accepted at the WWTP is approximately 30,000 gpd. The WWTP started
operations in 1937. Over the years the plant has seen numerous upgrades and
expansions. A map showing the plant location is presented in Figure 1.
The general arrangement of the existing treatment process is as follows. Influent
passes through bar racks and a disc screen directs solids into a channel grinder.
Aerated grit removal follows, then on to primary clarification. The main treatment
components of the plant are the two trickling filters that were constructed as part
of one of the plants upgrades in the 70’s. Each trickling filter has a 120’ diameter
with a 6’ media depth. A 16” influent pipe carries flows to a center feed distributor
with four (4) rotating arms. Each trickling filter has approximately 6’ of filter rock
media and is open to ambient air temperatures. The two filters are generally run
in series however, during the colder winter temperatures (due to freezing) one filter
is typically taken off line resulting in a decrease in treatment capacity and
nitrification (Ammonia processing). Following the filters, flow is directed to final
clarifiers for further settling and phosphorus removal. Sludge is then digested
anaerobically, pressed, dried and disposed of at the Allegany County Landfill.
With the recent modification to the Villages SPDES permit (see Appendix A), to
require nitrification the plant will be limited in the amount of leachate it can accept
without violating its permit.
The Village is interested in modifications at the plant that will allow them to
continue to accept the same amount of leachate or more.
Village of Wellsville Preliminary Engineering Report
Wastewater Treatment Plant August 2016
MRB Group Project No. 2314.15001 Page 8
III. EXISTING FACILITIES
A. EXISTING WWTP COMPONENTS
A site plan of the existing plant is presented in Figure 2. The plant consists of the
following treatment processes:
Wastewater treatment
Influent sewer to disc screen and sewage grinder, aerated grit removal system
with alternate grit chamber.
Leachate unloading station with two 8000 gallon holding tanks and pumps.
On site structure to take all influent from grit chambers and from leachate
holding tank.
Primary settling tanks (3)
Trickling filters (2) (with flow meter and recirculation) only one filter utilized during
cold winter months.
Final settling tanks (3)
Chlorine contact tank and associated chemical feed system (not currently
utilized)
Outfall sewer to Genesee River
Biosolids treatment
Primary and secondary digesters
Belt filter press
Sludge drying beds
Removal of solids to the Allegheny County Landfill.
The existing treatment processes are summarized in the process flow diagram
shown in Figure 3.
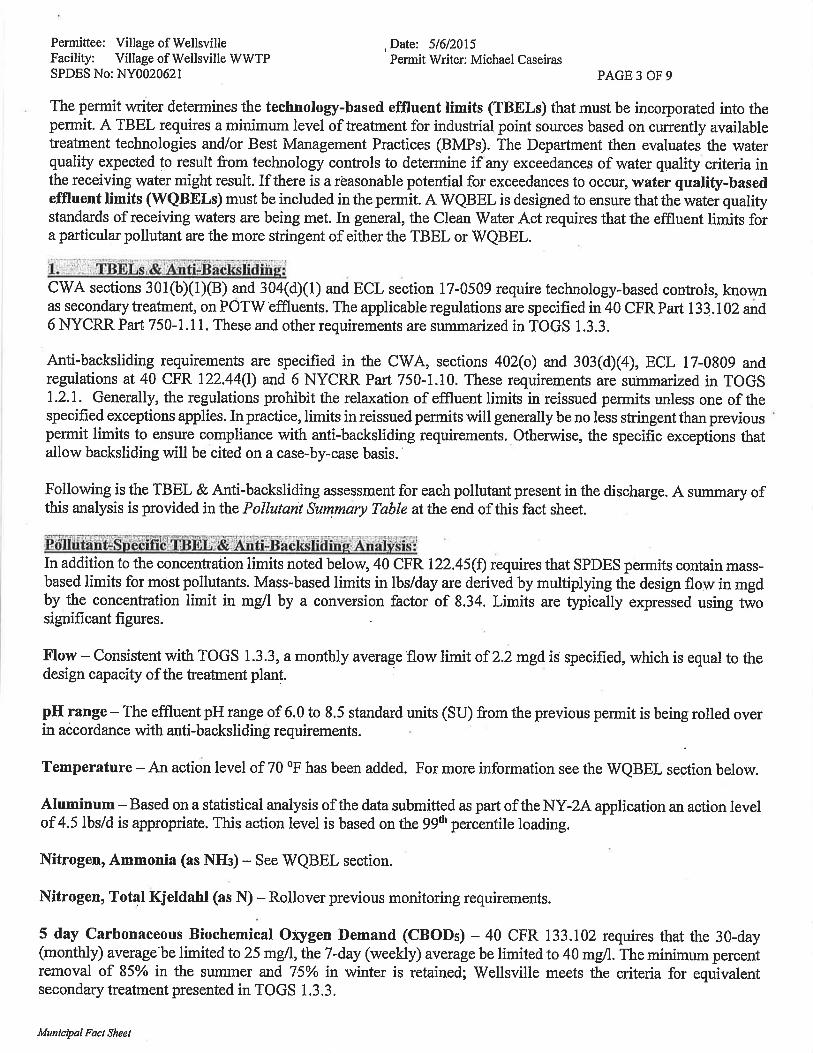
Samples for monitoring compliance with permit requirements are taken as
specified in the permit. The influent samples are taken prior to the aerated grit
chamber, but following the grinder. The effluent samples are taken from the
effluent chamber prior to discharge into the Genesee River.

Village of Wellsville Preliminary Engineering Report
Wastewater Treatment Plant August 2016
MRB Group Project No. 2314.15001 Page 9
The receiving water body for the effluent discharge is the Genesee River, Class C
(T), and discharges through Outfall 001. (See Appendix C).
B. EXISTING LOADING CONDITIONS
Data was collected for the period 2012 to 2014 for this evaluation (see Appendix
D). Generally, average daily flow and peak hourly flow conditions are used to
evaluate capacity, and the maximum of average daily flows averaged monthly is
additionally used to monitor compliance with permitted organic limits in the
effluent. Minimum flow conditions are also used to monitor the range of the
equipment for purposes of efficiency. Note that maximum (peak) and minimum
flows are typically recorded on an instantaneous basis.
1. Hydraulic Loading
The following influent flow conditions were observed (flow includes leachate):
Table III.1: Existing Flows
Flow condition Plant Value
(With Leachate)
Leachate
Value
Plant
Value
(Without
Leachate)
Average Daily Flow (ADF)1 1.153 MGD 0.031 MGD 1.122 MGD
Maximum Month Average Daily Flow
(MMF)1
1.815 MGD 0.074 MGD 1.741 MGD
Peak Hourly Flow (PHF)2 5.00 MGD -
Minimum Flow (PHF)2 0.78 MGD 0.018 MGD 0.762 MGD
ADF to MMF peaking factor 1.57 -
ADF to PHF peaking factor 4.34 -
Notes: 1. On a monthly average basis
2. On an instantaneous maximum/minimum basis
Village of Wellsville Preliminary Engineering Report
Wastewater Treatment Plant August 2016
MRB Group Project No. 2314.15001 Page 10
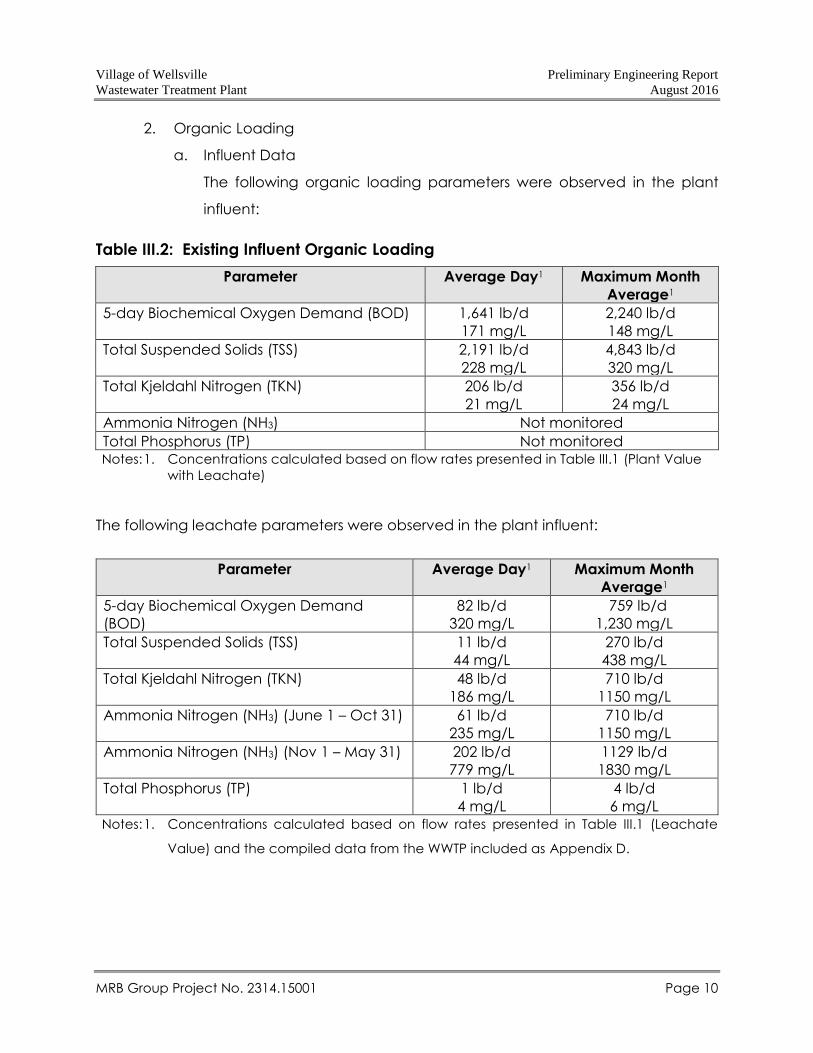
2. Organic Loading
a. Influent Data
The following organic loading parameters were observed in the plant
influent:
Table III.2: Existing Influent Organic Loading
Parameter Average Day1 Maximum Month
Average1
5-day Biochemical Oxygen Demand (BOD) 1,641 lb/d
171 mg/L
2,240 lb/d
148 mg/L
Total Suspended Solids (TSS) 2,191 lb/d
228 mg/L
4,843 lb/d
320 mg/L
Total Kjeldahl Nitrogen (TKN) 206 lb/d
21 mg/L
356 lb/d
24 mg/L
Ammonia Nitrogen (NH3) Not monitored
Total Phosphorus (TP) Not monitored Notes: 1. Concentrations calculated based on flow rates presented in Table III.1 (Plant Value
with Leachate)
The following leachate parameters were observed in the plant influent:
Parameter Average Day1 Maximum Month
Average1
5-day Biochemical Oxygen Demand
(BOD)
82 lb/d
320 mg/L
759 lb/d
1,230 mg/L
Total Suspended Solids (TSS) 11 lb/d
44 mg/L
270 lb/d
438 mg/L
Total Kjeldahl Nitrogen (TKN) 48 lb/d
186 mg/L
710 lb/d
1150 mg/L
Ammonia Nitrogen (NH3) (June 1 – Oct 31) 61 lb/d
235 mg/L
710 lb/d
1150 mg/L
Ammonia Nitrogen (NH3) (Nov 1 – May 31) 202 lb/d
779 mg/L
1129 lb/d
1830 mg/L
Total Phosphorus (TP) 1 lb/d
4 mg/L
4 lb/d
6 mg/L Notes: 1. Concentrations calculated based on flow rates presented in Table III.1 (Leachate
Value) and the compiled data from the WWTP included as Appendix D.

Village of Wellsville Preliminary Engineering Report
Wastewater Treatment Plant August 2016
MRB Group Project No. 2314.15001 Page 11
b. Effluent Data
The following organic loading parameters were observed in the plant
effluent:
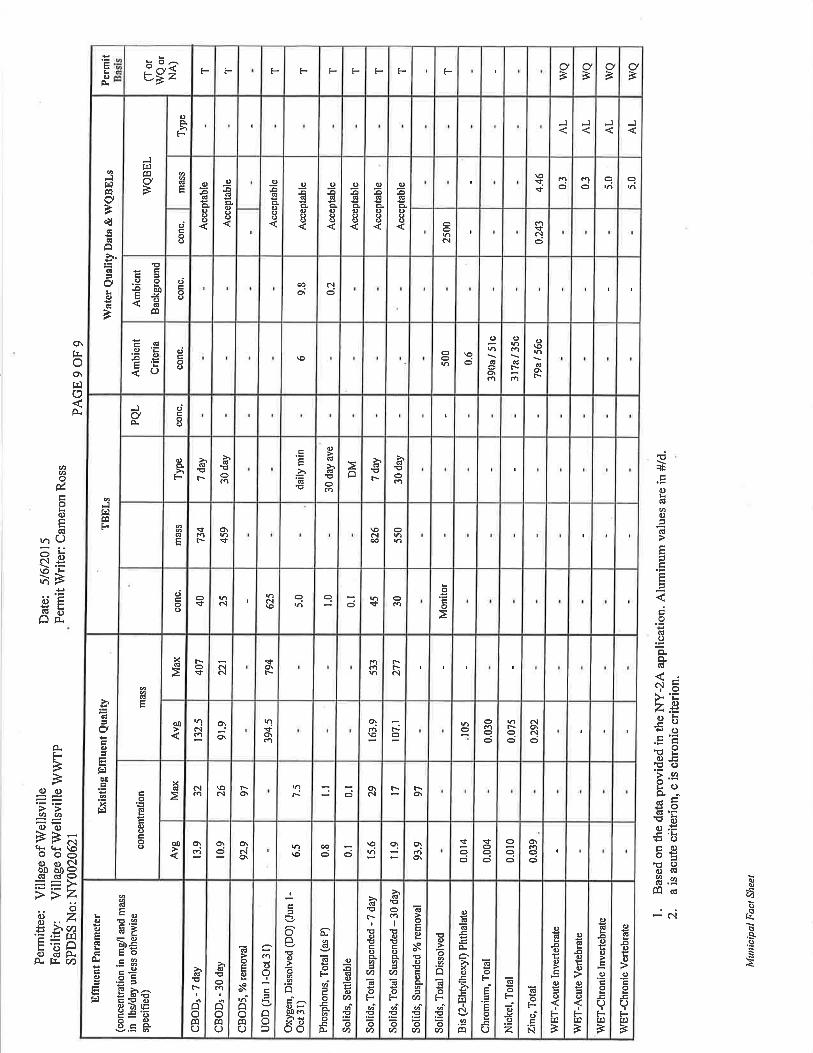
Table III.3: Existing Effluent Organic Loading
Parameter Average Day1 Maximum Month
Average1
SPDES Permit
Limits (monthly avg.)
5-day Biochemical Oxygen Demand (BOD) 124 lb/d
12 mg/L
323 lb/d
27 mg/L
459 lb/d
25 mg/l
Total Suspended Solids (TSS) 120 lb/d
12 mg/L
245 lb/d
20 mg/L
550 lb/d
30 mg/l
Total Kjeldahl Nitrogen (TKN) 120 lb/d
13 mg/L
498 lb/d
53 mg/L
Monitor
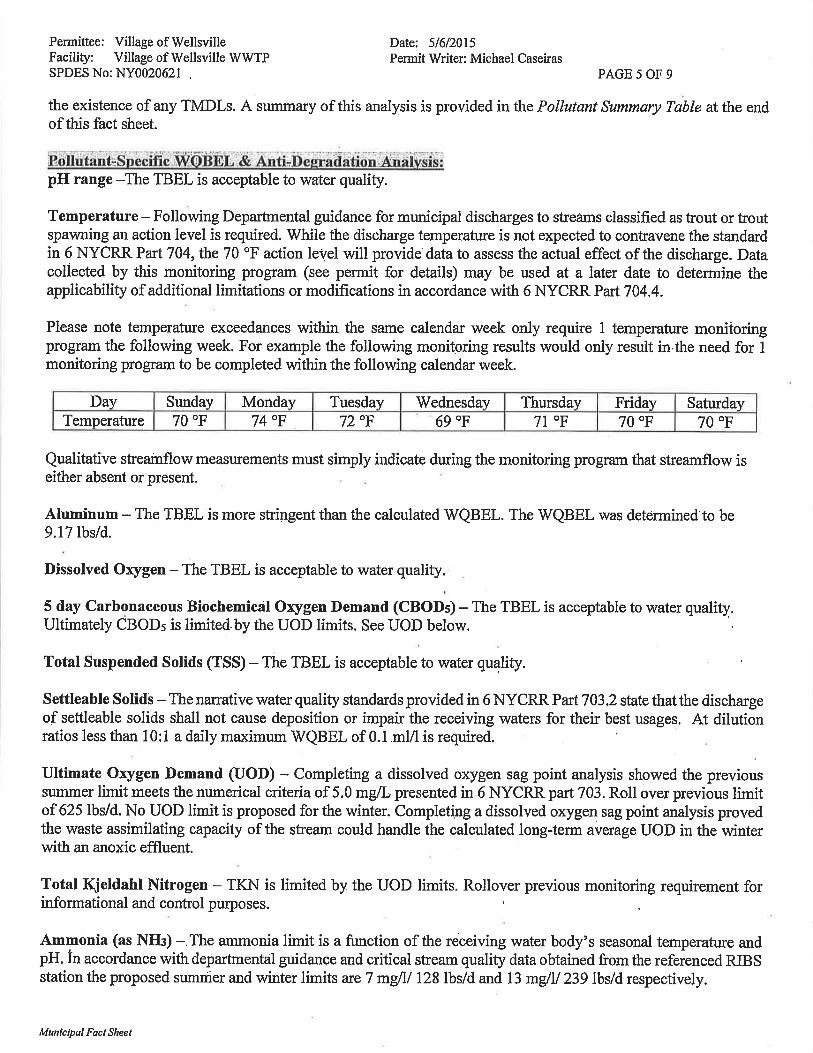
Ammonia Nitrogen (NH3) 2 119 lb/d
13 mg/L
566 lb/d
61 mg/L
128:239 lb/d2
7:13 mg/l2
Total Phosphorus (TP) 7 lb/d
0.73 mg/L
14 lb/d
0.98 mg/L
1 mg/l
Total Aluminum 1.30 lb/d
0.13 mg/L
5.06 lb/d
0.5 mg/L
4.5 lb/d
Daily max. Notes: 1. Concentrations calculated based on flow rates presented in Table III.1 and compiled
data from the WWTP included as Appendix D.
2. Summer and winter limits respectively.
c. Future Loading Conditions
Population projections prepared by the Southern Tier West Regional Planning and
Development Board were reviewed for this evaluation. Population estimates for the
Village of Wellsville and the Town of Wellsville are presented in Table III.3.
Table III.3. Population Projections
20131 20202 20302 20402 2040 Net
Change
2040 %
Change
Village of Wellsville 4,621 4,528 4,436 4,344 -277 -6%
Town of Wellsville 2,718 2,681 2,644 2,608 -110 -4% Notes: 1. US Census American Community Survey Estimates 2009-2013. Town of Palmyra data
extrapolated from Town total population subtracting Village total population.
2. STWRPDB Forecasts May 2013.

Village of Wellsville Preliminary Engineering Report
Wastewater Treatment Plant August 2016
MRB Group Project No. 2314.15001 Page 12
IV. BASIS FOR EVALUATION CONDITIONS
In addition to the existing loading conditions, design parameters have been
established to evaluate the plant’s ability to address the future conditions presented
in Section II.
A. PERMIT REQUIREMENTS
The current SPDES permit is included in Appendix A.
B. DESIGN SCENARIOS
Existing Design Condition
The current operating conditions at the plant are a combination of Village/Towns
influent flow as well as Village and landfill leachate.
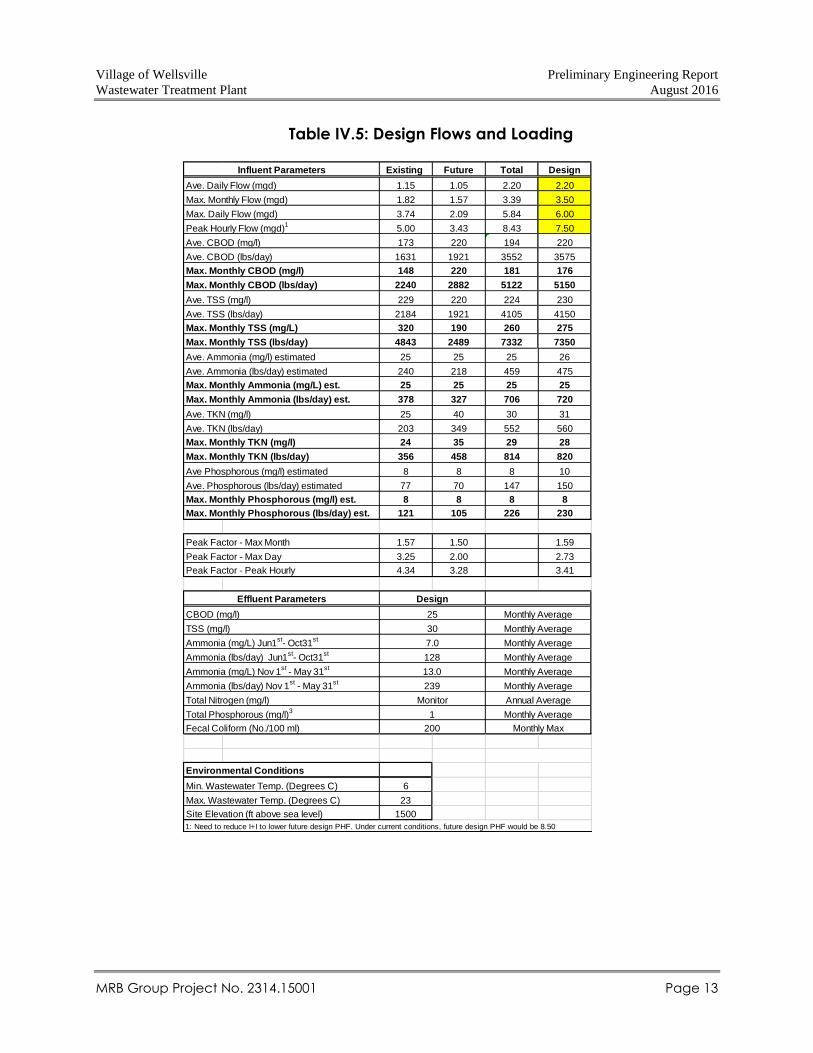
Proposed Design Condition
Design influent flows and loadings are presented in Table 4.
Village of Wellsville Preliminary Engineering Report
Wastewater Treatment Plant August 2016
MRB Group Project No. 2314.15001 Page 13
Table IV.5: Design Flows and Loading
Existing Future Total Design
1.15 1.05 2.20 2.20
1.82 1.57 3.39 3.50
3.74 2.09 5.84 6.00
5.00 3.43 8.43 7.50
173 220 194 220
1631 1921 3552 3575
148 220 181 176
2240 2882 5122 5150
229 220 224 230
2184 1921 4105 4150
320 190 260 275
4843 2489 7332 7350
25 25 25 26
240 218 459 475
25 25 25 25
378 327 706 720
25 40 30 31
203 349 552 560
24 35 29 28
356 458 814 820
8 8 8 10
77 70 147 150
8 8 8 8
121 105 226 230
Peak Factor - Max Month 1.57 1.50 1.59
Peak Factor - Max Day 3.25 2.00 2.73
Peak Factor - Peak Hourly 4.34 3.28 3.41
Environmental Conditions
Min. Wastewater Temp. (Degrees C) 6
Max. Wastewater Temp. (Degrees C) 23
Site Elevation (ft above sea level) 1500
1: Need to reduce I+I to lower future design PHF. Under current conditions, future design PHF would be 8.50
Ammonia (lbs/day) Nov 1st
- May 31st
239 Monthly Average
Ammonia (mg/L) Nov 1st
- May 31st
13.0 Monthly Average
200
Total Nitrogen (mg/l)
Total Phosphorous (mg/l)3
Monitor
1
Ave. CBOD (mg/l)
Max. Monthly Flow (mgd)
Max. Daily Flow (mgd)
Ave. CBOD (lbs/day)
128
Ammonia (mg/L) Jun1st
- Oct31st
Max. Monthly CBOD (mg/l)
Ave Phosphorous (mg/l) estimated
Ave. TKN (mg/l)
Design
Max. Monthly TKN (lbs/day)
Max. Monthly Phosphorous (mg/l) est.
Ave. TSS (mg/l)
Max. Monthly TSS (mg/L)
Effluent Parameters
Max. Monthly Ammonia (mg/L) est.
Ave. Daily Flow (mgd)
Influent Parameters
Ave. Ammonia (mg/l) estimated
Peak Hourly Flow (mgd)1
Max. Monthly Phosphorous (lbs/day) est.
Ave. Phosphorous (lbs/day) estimated
Max. Monthly Ammonia (lbs/day) est.
Max. Monthly CBOD (lbs/day)
Ave. TSS (lbs/day)
Max. Monthly TSS (lbs/day)
Ave. Ammonia (lbs/day) estimated
Max. Monthly TKN (mg/l)
Ave. TKN (lbs/day)
Fecal Coliform (No./100 ml)
Monthly Average
Monthly Average
Annual Average
Monthly Average
Monthly Max
Monthly Average
30TSS (mg/l)
7.0
Monthly AverageAmmonia (lbs/day) Jun1st
- Oct31st
25CBOD (mg/l)

Village of Wellsville Preliminary Engineering Report
Wastewater Treatment Plant August 2016
MRB Group Project No. 2314.15001 Page 14
V. WWTP COMPONENT EVALUATION
The evaluation of the Trickling Filters at the WWTP focuses on the ability to meet the
design conditions presented in Table 4
To aid in the evaluation, reference standards, including the Recommended
Standards for Wastewater Facilities (also known as Ten States’ Standards), and the
Technical Report 16: Guides for the Design of Wastewater Treatment Works (also
known as TR-16), have been used to compare baseline performance of the unit
processes.
Detailed capacity evaluation calculations are presented in Appendix F. It should be
noted that all calculations are preliminary, and sizing of any proposed facilities or
equipment presented herein will need to be reviewed during design to meet actual
conditions.
It is assumed for this evaluation that the trickling filter will continue to be the primary
mode of secondary treatment, and that improvement of the treatment capacity will
be based on cost effective upgrades to the plant, such as replacement of the
existing rock media with new plastic media, the addition of covers, with the possibility
of a new leachate storage tank that would allow leachate to flow into the influent
stream at a steady controlled pace. While the trickling filters are the focus of this
evaluation, the remainder of the plant is in need of upgrading as well. The headworks
of the plant have become antiquated, along with solids dewatering equipment.
BOD levels must first be reduced down to approximately 20 mg/l before effective
nitrification will begin. The existing primary and final clarifiers were also evaluated for
capacity and service life. Recommended process improvements are discussed
further in Section IV.

Village of Wellsville Preliminary Engineering Report
Wastewater Treatment Plant August 2016
MRB Group Project No. 2314.15001 Page 15
A. INFLUENT SCREEN
Influent flows are passed through a disc
screen which directs solids, rags and larger
debris toward a sewage grinder for
emulsification. The disc screen was installed in
the 1996 upgrade that replaced the old
comminutor. The disc screen and grinder
themselves have become worn and
inefficient. Operator reports show that the
grinder requires replacement every 5 to 6 years which is a clear sign of
overloading.
B. AERATED GRIT REMOVAL
After the sewage grinder flow enters an
aerated chamber that settles grit to the
bottom for mechanical removal with a clam
shell bucket. The system is functional and this
type of design is still installed today. The
mechanical bucket is very labor intensive
however. A new grit pump and dewatering
system would make the process more efficient.

Village of Wellsville Preliminary Engineering Report
Wastewater Treatment Plant August 2016
MRB Group Project No. 2314.15001 Page 16
C. PRIMARY CLARIFIERS
Following preliminary treatment, the flow enters into a junction box shared by three,
rectangular peripheral feed clarifiers. The clarifier’s dimensions are outlined in Table
IVII.1. All three clarifiers are identical in size.
Table V.6: Primary Clarifier Dimensions
Dimension EA Total
Length 50 ft 150 ft
Width 16 ft 48 ft
Total surface area 800 sq ft 2400 sq ft
Depth 9.7 ft 9.7 ft
Volume
7,760 cu ft
58,045 gal
23,280 cu ft
174,134 gal
Weir Length 80 ft 240 ft
The capacity of the primary clarifiers is based primarily on two conditions: overflow
rate based on surface area loading, and overflow rate based on weir loading. Ten
States’ Standards recommends the following overflow rates for primary clarifiers that
do not receive waste activated sludge:
Surface overflow rate @ ADF: 1,000 gpd/sq ft
Surface overflow rate @ PHF: 1,500-2,000 gpd/sq ft (assume 2,000 gpd/sq ft for
evaluation)
Weir loading rate @ PHF (ADF ≤ 1.0 MGD): 20,000 gpd/ft
Detailed capacity evaluation calculations for the primary clarifiers are summarized in
Appendix F.
Table V.7: Primary Clarifiers Capacity
Design
condition
Flow,
MGD
Flow at max. surface
overflow rate, MGD
Flow at max. weir
overflow rate, MGD
Actual Surface
Overflow rate G/d*ft2 Capacity1
Existing ADF 1.15 2.40 N/A 480 OK
Existing MMF 1.82 2.40 N/A 756 OK
Existing PHF 5.00 4.80 7.20 2,083 Marginal
Design ADF 2.20 2.40 N/A 917 OK
Design MMF 3.50 2.40 N/A 1458 OK
Design PHF 7.502 4.80 7.20 3,542 Inadequate Notes: 1. Based on both overflow rates being satisfied
2. Need to reduce I+I to lower design PHF. Under current conditions future PHF would
be 8.50 MGD

Village of Wellsville Preliminary Engineering Report
Wastewater Treatment Plant August 2016
MRB Group Project No. 2314.15001 Page 17
The capacity of the primary clarifier’s appears to be marginal to meet existing
peak flow and insufficient to meet design max monthly and peak flow conditions
at the recommended overflow rates. Detailed capacity evaluation calculations
for the primary clarifiers are summarized in Appendix F.
The condition of the primary clarifier’s structure appears to be adequate at this
time. Two clarifiers were installed when the plant was built in 1937. The third was
installed when the plant was upgraded in 1996. At that time the existing two had
the mechanicals rebuilt and tanks evaluated. At this time, the Village should plan
and consider additional or alternative primary clarification, should flows approach
the design limit of the plant. In addition, reduction of I+I into the system would
minimize the peak flows to the primary clarifier.
D. TRICKLING FILTERS
Capacity Evaluation
The dimensions of the existing trickling filters
are as follows:
Diameter 120 ft.
Surface area 11,310 sf.
Media depth (approx.) 6.0 ft.
Media volume (approx.) 67,858 cf.

Village of Wellsville Preliminary Engineering Report
Wastewater Treatment Plant August 2016
MRB Group Project No. 2314.15001 Page 18
The trickling filter capacity is currently limited
by the rock media used in the original
design. As discussed in Section III, under
current loadings, the plant has seen some
effluent BOD concentrations that would
have exceeded the limit in the most current
SPDES permit on a maximum monthly
average basis.
Detailed capacity evaluation calculations of the trickling filters with rock media
and plastic media are presented in Appendix F.
The calculations show that, on average, the rock media would have to be
replaced if the WWTP were to receive flows beyond the existing design condition.
Assuming plastic media is used, the treatment capability of the trickling filter was
re-evaluated, expanding the dosing rate recommended by the manufacturer.
The capacity of the trickling filter is greatly improved by adding the plastic media.
E. FINAL CLARIFIERS
The WWTP currently has three 40’ diameter
final clarifiers. Two were installed in 1977 and
are in need of repairs. It should be noted that
the current configuration does not meet ten
states standards for design peak hourly flow
rates. Considering the importance of the
final clarifiers for phosphorus removal,
additional clarification should be
considered.

Village of Wellsville Preliminary Engineering Report
Wastewater Treatment Plant August 2016
MRB Group Project No. 2314.15001 Page 19
Detailed capacity evaluation calculations of the final clarifiers are presented in
Appendix F.
Table V.8 Final Clarifier Capacity
Design
condition
Flow,
MGD
Flow at max. surface
overflow rate, MGD
Actual Surface
Overflow rate G/d*ft2 Capacity1
Existing ADF 1.15 3.39 306 N/A
Existing MMF 1.82 3.39 481 N/A
Existing PHF 5.00 3.39 1,326 Inadequate
Design ADF 2.20 3.39 584 N/A
Design MMF 3.50 3.39 928 Inadequate
Design PHF 7.50 3.39 1989 Inadequate Notes: 1. Based on surface overflow rates of 900 gpd/sf being satisfied
F. SOLIDS HANDLING
The WWTP utilizes 3 anaerobic digesters to stabilize sludge. Two are considered
primary and one secondary. The Primary digesters are currently in need of a new
sludge mixing and heating system. The sludge flows from the digesters to a belt
filter press for de watering. The existing press was installed in 1988 and has outlived
original service life.

Village of Wellsville Preliminary Engineering Report
Wastewater Treatment Plant August 2016
MRB Group Project No. 2314.15001 Page 20
VI. NITRIFICATION CONDITION EVALUATION
A. TRICKLING FILTERS
The current condition of the trickling filters and its equipment is consistent with
original design life. Both filters were installed in 1975 when the plant was upgraded.
The tanks appear to be in decent condition. If any improvements are considered,
it is recommended to remove the rock media and ascertain the condition of the
bottom of the tank. The distributors and hydraulic arms are functional but outdated
and showing signs of wear. If any upgrades are performed on the trickling filters it
is recommended to replace these components as well. The rock media is in poor
condition. Operator reports show that the rock is deteriorating and falling apart.
Periodic cleaning is necessary to prevent clogging and ponding of the filter. In
addition, new plastic media technology has improved, and will provide significant
added capacity.
As mentioned above, the colder weather has significant adverse effects to the
efficiency of the trickling filters. Not only do they freeze up when temperatures get
low, but the nitrification (Ammonia removal) process is greatly reduced.
B. LEACHATE RECEIVING STATION
Along with the upgrade in 1996, the leachate receiving station was improved. New
transfer pumps and piping were installed, as well as a dedicated receiving slab
with trench drain. The only improvement in this area would be increased storage
capacity. The plant currently has 16,000 gallons of permanent leachate storage,
and 21,000 gallons of temporary storage. If improvements to the filters are
undertaken, the Village should consider increasing this capacity. In that regard the
plant could accept more leachate, and allow for more controlled distribution into
the treatment process.

Village of Wellsville Preliminary Engineering Report
Wastewater Treatment Plant August 2016
MRB Group Project No. 2314.15001 Page 21
C. RECIRCULATION SYSTEM
When the Trickling filters were installed in 1975 they were outfitted with a dedicated
pumping/recirculation station. The station is comprised of 3 Allis Chalmers
centrifugal pumps, each capable of pumping 3175 gallons per minute. These
pumps were more than capable when installed and are still in operation today.
Two of the drive motors have been replaced/remanufactured but with more than
40 years of service this is to be expected. If the filters are upgraded with new plastic
media the existing pumps are going to need to be re designed based on the new
media recommended wetting rates. To operate efficiently, the new media will
require a much higher rate of flow than the existing pumps can provide. Based on
the age of this equipment, and the proposed upgrades to the trickling filter, it is
recommended to replace the pumps and evaluate the condition of piping and
components as well.
Village of Wellsville Preliminary Engineering Report
Wastewater Treatment Plant August 2016
MRB Group Project No. 2314.15001 Page 22
VII.PROPOSED DESIGN IMPROVEMENTS
Based on the capacity evaluations presented in Section V, the following improvements
are presented for each of the design conditions.
A. EXISTING DESIGN CONDITION
The capacity evaluation shows that certain plant components are insufficient in
capacity to meet design flows and loadings at the existing design condition. Ten
states standards recommended capacity is only surpassed on the existing peak
hourly flow condition. This is not a critical issue considering peak flows have only
approached design limits three times in the last three years. The real issue arises
when evaluating design max monthly and peak hourly flows. At the current
capacity both scenarios are insufficient. These scenarios are in regard to future
flow and loading conditions. If no improvements are made this will severely hamper
the ability of the plant to support development both inside and outside of the
Village, as well as accept leachate. Addressing these concerns will also have an
improvement on the treatment efficiency of the plant, as the full capacity of
existing unit processes will be better utilized.
One alternative would be to do no improvements at this time and wait till flows or
loadings increase to the point of nearing violation. Deferring necessary
improvements is undesirable from a long term financial perspective. Not only are
the same upgrades expected to increase in cost over time due to inflation; current
financing rates are significantly lower than historical rates, and the available
financing programs tend to prioritize comprehensive improvement projects that
address multiple issues over piecemeal component upgrades (as other similar
Villages have experienced in attempting to secure financing for upgrades to their
waste water plants.)
Due to the above concerns, this alternative is not recommended.
Village of Wellsville Preliminary Engineering Report
Wastewater Treatment Plant August 2016
MRB Group Project No. 2314.15001 Page 23
B. PROPOSED DESIGN CONDITION
Proposed design incorporates the following improvements. Any one of these
potential options could be undertaken individually if the Village chooses.
Replace rock media in existing trickling filters with crossflow plastic media.
Conceptually, AccuPAC CF-1900 manufactured by Brentwood Industries (specific
media packing surface area = 48 sq ft / cu ft) is proposed, and has been assumed
for the capacity evaluation calculations. Per manufacturer, minimum dosing rate
is recommended to be 0.25 gpm/sq ft. When the rock is removed the tanks can
be cleaned and evaluated for signs of wear, repairs made if necessary and recoat
concrete surfaces. Calculations have been completed and are included in
Appendix F showing that the existing media although currently adequate, is highly
dependent on the temperatures and therefore time of year (so whether one filter
is running or if both are running), the influent flows and the amount of leachate
discharged at the plant. The existing media is also degrading and falling apart. The
operator reports having to rearrange the media at times to prevent ponding on
top of the filters.
Replace trickling filter hydraulic distributors and arms with upgraded stainless steel
motorized units, providing more control and flexibility to the operator. With
motorized units, the operator can directly control the dosing (wetting) rate to the
filters responding to changes needed in treatment.
Replace trickling filter pumps with larger units capable of meeting recommended
wetting rates of new media. It is cost effective to continue use of self-priming
pumps to minimize alterations to the pump system and wet well setup. Suction and
discharge piping has adequate capacity to support the new pumps. These
components can remain as long as they are found to be in good condition.
Install geo dome covers with mechanical venting over both trickling filters to
control temperatures and air flow. This will vastly improve the efficiency of the filters
Village of Wellsville Preliminary Engineering Report
Wastewater Treatment Plant August 2016
MRB Group Project No. 2314.15001 Page 24
by regulating the internal temperatures and oxygen content. This will also allow for
year round operation of both filters, without the laborious task of chipping ice off
the filters.
Increase leachate storage capacity. The plant currently has two storage tanks for
leachate. The existing night soils holding tank and a modified chemical holding
tank. Both tanks have a total capacity of approximately 16,000 gallons. If the filters
are upgraded the plant will require more storage capacity. Construction of a new,
underground 50,000 gallon concrete tank would provide approximately two days
of storage (33,000 gallons a day along with current storage), if the plant has an
issue and cannot process leachate. This will also allow for the most consistent
addition of leachate into the treatment process.
C. Inflow and Infiltration Improvements
The Village has been aware for some time that a good portion of the sewage
collection system is in need of repair. During wet weather events the WWTP
experiences much higher flows than normal. This is due to aging pipes and
manholes allowing storm water to leak in. The Village recently hired MRB to do
some testing on the existing system. The results show the need to reline
approximately 7500 linear feet of sewer main, and repair and seal at least 5
manholes. The reduction of I+I will reduce peak flows to the plant, and save
capacity for additional growth to the Village.
D. New Influent Screen
The current disc screen and sewage grinder are very high maintenance and
inefficient at removing rags and other debris. That material is currently passing
downstream clogging pumps and nozzles. The current influent structure is also
exposed to the elements. A new center flow band screen with washing
compactor will capture this material, and dewater it for easy disposal. It is
recommended to house the new equipment in a fiberglass or CMU structure to
avoid exposure to the elements.
Village of Wellsville Preliminary Engineering Report
Wastewater Treatment Plant August 2016
MRB Group Project No. 2314.15001 Page 25
E. New Effluent Disinfection System
The NYS DEC has notified several WWTP’s in the region of upcoming disinfection
requirements in the next one to three years. A cost benefit analysis was performed
to ascertain the most cost efficient approach to disinfect effluent for the Village
of Wellsville. Results show that U.V. (ultra violet) disinfection is more economical
over a 20 year period. See appendix H for the cost benefit analysis breakdown.
If a capital project is undertaken, it is recommended to install a new U.V.
disinfection system in the project.
F. Final Clarifier Improvements
Two of the three existing final clarifiers are in need of mechanical repairs. It is
recommended to drain the tanks, check for wear and recoat the tanks if
necessary and replace the mechanicals. A new 40’ diameter final clarifier is also
recommended, as the current configuration does not meet ten states standards
for overflow rates at existing peak hourly flow or design max monthly and peak
hourly flows.
G. New solids de watering press
The Current belt filter press has become worn and inefficient. Operator reports
show significant labor and frequent repairs are required to keep it running. A new
solids de watering screw press is recommended to replace the existing press. A
new screw press would be less labor intensive, and offer the operator more control
over operations.
H. New SCADA system
The WWTP currently does not have a SCADA (supervisory control and data
acquisition) system. These systems are critical for plants of Wellsville’s size to more
accurately control and respond to changes in conditions and equipment
maintenance. In addition, a new system would simplify the acquisition of data
such as influent and effluent concentrations.

Village of Wellsville Preliminary Engineering Report
Wastewater Treatment Plant August 2016
MRB Group Project No. 2314.15001 Page 26
VIII. PROJECT COST ESTIMATES
A. CAPITAL PROJECT COSTS
The capital project costs associated with the improvements described in Section
VI are estimated in Appendix G and summarized in Table 8
Table VIII.9: Capital Project Costs
Description Probable
Cost1
Construction
Site Work $339,000
Trickling Filter Improvements $2,327,000
Increase Leachate Storage $119,000
Inflow and Infiltration Improvements $463,000
Influent Screen and Enclosure $253,000
Effluent UV Disinfection System $380,000
Final Clarification Improvements $651,000
Solids Handling upgrades $708,000
SCADA system $340,000
M.E.P. Contracts $1,265,000
Mobilization, Bonds, Insurance $446,000
Construction Subtotal $7,291,000
Associated Costs
Construction Contingency $1,093,000
Engineering Services $1,458,000
Administrative, Financial, and Legal Services $364,000
TOTAL PROJECT COST $10,206,000 Notes: 1. Costs rounded to nearest $1,000.
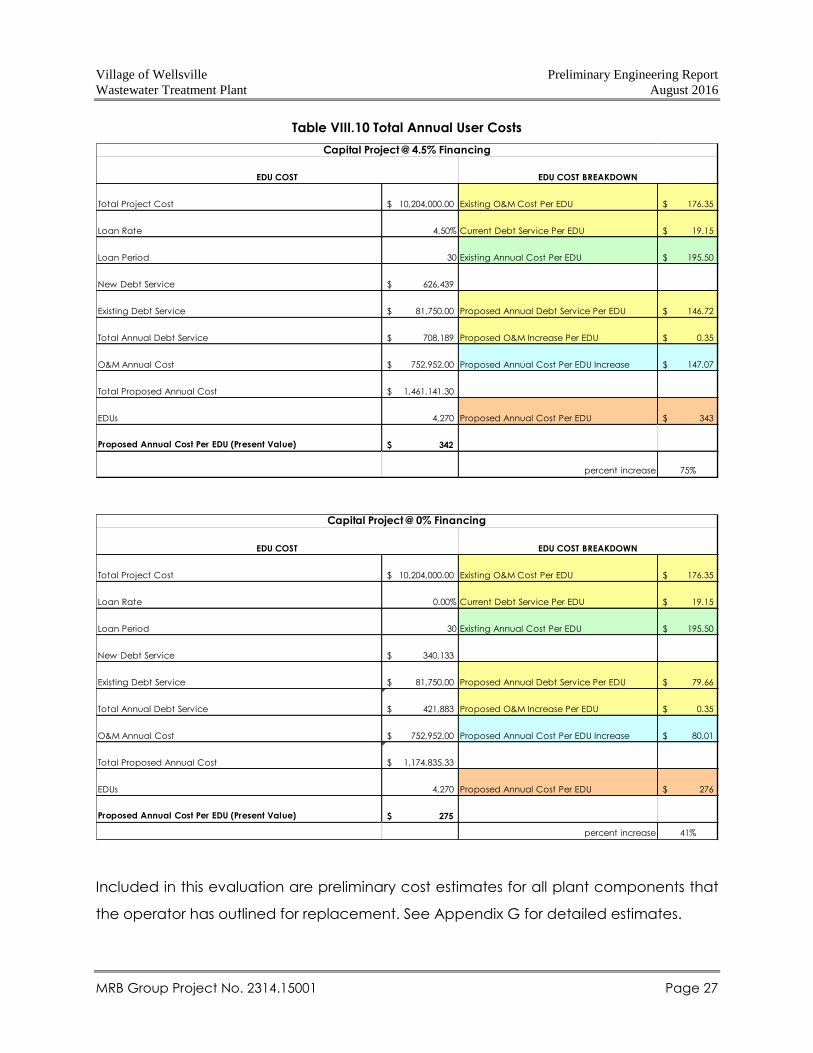
B. TOTAL ANNUAL USER COSTS
Estimates for the total annual cost per EDU is presented in Appendix B and
summarized in Table 9. Estimates are based on various debt service rates assuming
30-year financing through the CWSRF, administered by NYSEFC.
Village of Wellsville Preliminary Engineering Report
Wastewater Treatment Plant August 2016
MRB Group Project No. 2314.15001 Page 27
Table VIII.10 Total Annual User Costs
Included in this evaluation are preliminary cost estimates for all plant components that
the operator has outlined for replacement. See Appendix G for detailed estimates.
Total Project Cost 10,204,000.00$ Existing O&M Cost Per EDU 176.35$
Loan Rate 4.50% Current Debt Service Per EDU 19.15$
Loan Period 30 Existing Annual Cost Per EDU 195.50$
New Debt Service 626,439$
Existing Debt Service 81,750.00$ Proposed Annual Debt Service Per EDU 146.72$
Total Annual Debt Service 708,189$ Proposed O&M Increase Per EDU 0.35$
O&M Annual Cost 752,952.00$ Proposed Annual Cost Per EDU Increase 147.07$
Total Proposed Annual Cost 1,461,141.30$
EDUs 4,270 Proposed Annual Cost Per EDU 343$
Proposed Annual Cost Per EDU (Present Value) 342$
percent increase 75%
Capital Project @ 4.5% Financing
EDU COST EDU COST BREAKDOWN
Total Project Cost 10,204,000.00$ Existing O&M Cost Per EDU 176.35$
Loan Rate 0.00% Current Debt Service Per EDU 19.15$
Loan Period 30 Existing Annual Cost Per EDU 195.50$
New Debt Service 340,133$
Existing Debt Service 81,750.00$ Proposed Annual Debt Service Per EDU 79.66$
Total Annual Debt Service 421,883$ Proposed O&M Increase Per EDU 0.35$
O&M Annual Cost 752,952.00$ Proposed Annual Cost Per EDU Increase 80.01$
Total Proposed Annual Cost 1,174,835.33$
EDUs 4,270 Proposed Annual Cost Per EDU 276$
Proposed Annual Cost Per EDU (Present Value) 275$
percent increase 41%
EDU COST EDU COST BREAKDOWN
Capital Project @ 0% Financing

Village of Wellsville Preliminary Engineering Report
Wastewater Treatment Plant August 2016
MRB Group Project No. 2314.15001 Page 28
IX. RECOMMENDATIONS
The existing Village of Wellsville WWTP is currently functioning sufficiently well to meet
the existing permitted effluent limits. This is attributed to good operations and
maintenance practices, as well as the plant influent loadings being far below the
original design capacity. However, it is anticipated the plant will be faced with a
number of challenges in the near future that will necessitate capital improvements.
Some of these are imposed externally (e.g. changes in regulatory requirements), and
others are a consequence of the age of the facility and equipment, as well as the
original process design and deviations from it.
It has been demonstrated in this evaluation that future design conditions will not be
met without improvements to multiple components. Fortunately, it is believed that
many of the existing unit processes can be reused and upgraded without requiring
a total redesign of the plant – the only new structures recommended are a new
leachate storage tank, and a new final clarifier.
The imposition of new effluent limits in the Villages SPDES permit will limit the amount
of leachate the plant can process. The recommended improvements are needed
to address these requirements. If no improvements are undertaken, the Village will
be severely limited in the amount of leachate they can process, in the colder months
maybe none at all. If the Village determines that it will continue to generate revenue
from processing leachate, implementing the capital improvements will provide
additional capacity for acceptance and treatment of leachate. Therefore, it is
recommended for the Village to proceed with a capital project at this time.

Village of Wellsville Preliminary Engineering Report
Wastewater Treatment Plant August 2016
MRB Group Project No. 2314.15001 Page 29
A possible project schedule is presented in Table VIII.1.
Table IX.11 Possible Project Schedule
Milestone Date
Submit Project Engineering Report for Review August 2016
Complete Environmental Review Process November 2016
Submit Application for Project Financing December 2016
Submit Plans and Specifications for Review January 2017
Advertise for Bids February 2017
Commence Construction June 2017
Complete Construction June 2019
Village of Wellsville Preliminary Engineering Report
Wastewater Treatment Plant August 2016
MRB Group Project No. 2314.15001
FIGURES
Village of Wellsville Preliminary Engineering Report
Wastewater Treatment Plant August 2016
MRB Group Project No. 2314.15001
APPENDIX A
CURRENT WWTP SPDES PERMIT

Village of Wellsville Preliminary Engineering Report
Wastewater Treatment Plant August 2016
MRB Group Project No. 2314.15001
APPENDIX B
SEWER EDU DETERMINATION

Village of Wellsville Preliminary Engineering Report
Wastewater Treatment Plant August 2016
MRB Group Project No. 2314.15001
APPENDIX C
NYSDEC WI/PWL LISTING FOR GENESSEE
RIVER AT WELLSVILLE

Village of Wellsville Preliminary Engineering Report
Wastewater Treatment Plant August 2016
MRB Group Project No. 2314.15001
APPENDIX D
EXISTING FLOW AND LOADINGS

Village of Wellsville Preliminary Engineering Report
Wastewater Treatment Plant August 2016
MRB Group Project No. 2314.15001
APPENDIX E
LEACHATE DATA
Village of Wellsville Preliminary Engineering Report
Wastewater Treatment Plant August 2016
MRB Group Project No. 2314.15001
APPENDIX F
WWTP DESIGN PARAMETERS

Village of Wellsville Preliminary Engineering Report
Wastewater Treatment Plant August 2016
MRB Group Project No. 2314.15001
APPENDIX G
WWTP CAPACITY EVALUATION
CALCULATIONS

Village of Wellsville Preliminary Engineering Report
Wastewater Treatment Plant August 2016
MRB Group Project No. 2314.15001
APPENDIX H
PROJECT COST ESTIMATES

Village of Wellsville Preliminary Engineering Report
Wastewater Treatment Plant August 2016
MRB Group Project No. 2314.15001
APPENDIX I
WELLSVILLE ACS MEDIAN HOUSEHOLD
INCOME DATA

Village of Wellsville Preliminary Engineering Report
Wastewater Treatment Plant August 2016
MRB Group Project No. 2314.15001
APPENDIX J
VILLAGE OF WELLSVILLE
SEWER BUDGET

Village of Wellsville Preliminary Engineering Report
Wastewater Treatment Plant August 2016
MRB Group Project No. 2314.15001
FIGURES

N:\2314.15001.000\dw
g\W
ellsville S
ite P
lan - 2-11-16_1_1_1817.sv$.dw
g, 5/25/2016 2:20:02 P
M, lbailey
En
gin
eeri
ng
, A
rch
itectu
re,
Su
rveyin
g,
P.C
.
Th
e C
ulv
er R
oad
Arm
ory
, 145 C
ulv
er R
oad
, Suit
e 160, R
och
este
r, N
ew Y
ork
14620
Ph
on
e: 5
85-3
81-9
250
ww
w.m
rbg
rou
p.c
om
2314.15001
VIL
LA
GE
O
F W
EL
LS
VIL
LE
WW
TP
E
VA
LU
AT
IO
N
4
G-1
1
EX
IS
TIN
G S
IT
E P
LA
N
En
gin
eeri
ng
, A
rch
itectu
re,
Su
rveyin
g,
P.C
.
Th
e C
ulv
er R
oad
Arm
ory
, 145 C
ulv
er R
oad
, Suit
e 160, R
och
este
r, N
ew Y
ork
14620
Ph
on
e: 5
85-3
81-9
250
ww
w.m
rbg
rou
p.c
om
2314.15001
VIL
LA
GE
O
F W
EL
LS
VIL
LE
WW
TP
E
VA
LU
AT
IO
N
4
G-2
2
EX
IS
TIN
G F
LO
W S
CH
EM
AT
IC

En
gin
eeri
ng
, A
rch
itectu
re,
Su
rveyin
g,
P.C
.
Th
e C
ulv
er R
oad
Arm
ory
, 145 C
ulv
er R
oad
, Suit
e 160, R
och
este
r, N
ew Y
ork
14620
Ph
on
e: 5
85-3
81-9
250
ww
w.m
rbg
rou
p.c
om
2314.15001
VIL
LA
GE
O
F W
EL
LS
VIL
LE
WW
TP
E
VA
LU
AT
IO
N
4
G-3
3
PR
OP
OS
ED
S
IT
E P
LA
N
En
gin
eeri
ng
, A
rch
itectu
re,
Su
rveyin
g,
P.C
.
Th
e C
ulv
er R
oad
Arm
ory
, 145 C
ulv
er R
oad
, Suit
e 160, R
och
este
r, N
ew Y
ork
14620
Ph
on
e: 5
85-3
81-9
250
ww
w.m
rbg
rou
p.c
om
2314.15001
VIL
LA
GE
O
F W
EL
LS
VIL
LE
WW
TP
E
VA
LU
AT
IO
N
4
G-4
4
PR
OP
OS
ED
F
LO
W S
CH
EM
AT
IC

0
1,000
2,000
3,000
4,000
5,000
6,000
7,000
8,000
9,000
10,000
11,000
12,000
13,000
14,000
15,000
16,000
17,000
18,000
19,000
20,000
21,000
22,000
23,000
24,000
25,000
7 8 9 10 11 12 13 14 15 16 17 18 19 20
Gal
lon
s o
f Le
ach
ate
Temperature Degrees Celcius
Existing Rock Media Allowable Leachate GPD
Allowable Leachate
45,000
50,000
55,000
60,000
65,000
70,000
75,000
80,000
85,000
90,000
95,000
100,000
105,000
110,000
7 8 9 10 11 12 13 14 15 16 17 18 19 20
Gal
lon
s o
f Le
ach
ate
Temperature °Celcius
New Plastic Media Allowable Leachate GPD
Allowable Leachate

Village of Wellsville Preliminary Engineering Report
Wastewater Treatment Plant August 2016
MRB Group Project No. 2314.15001
APPENDIX A
CURRENT WWTP SPDES PERMIT


Village of Wellsville Preliminary Engineering Report
Wastewater Treatment Plant August 2016
MRB Group Project No. 2314.15001
APPENDIX B
SEWER EDU DETERMINATION
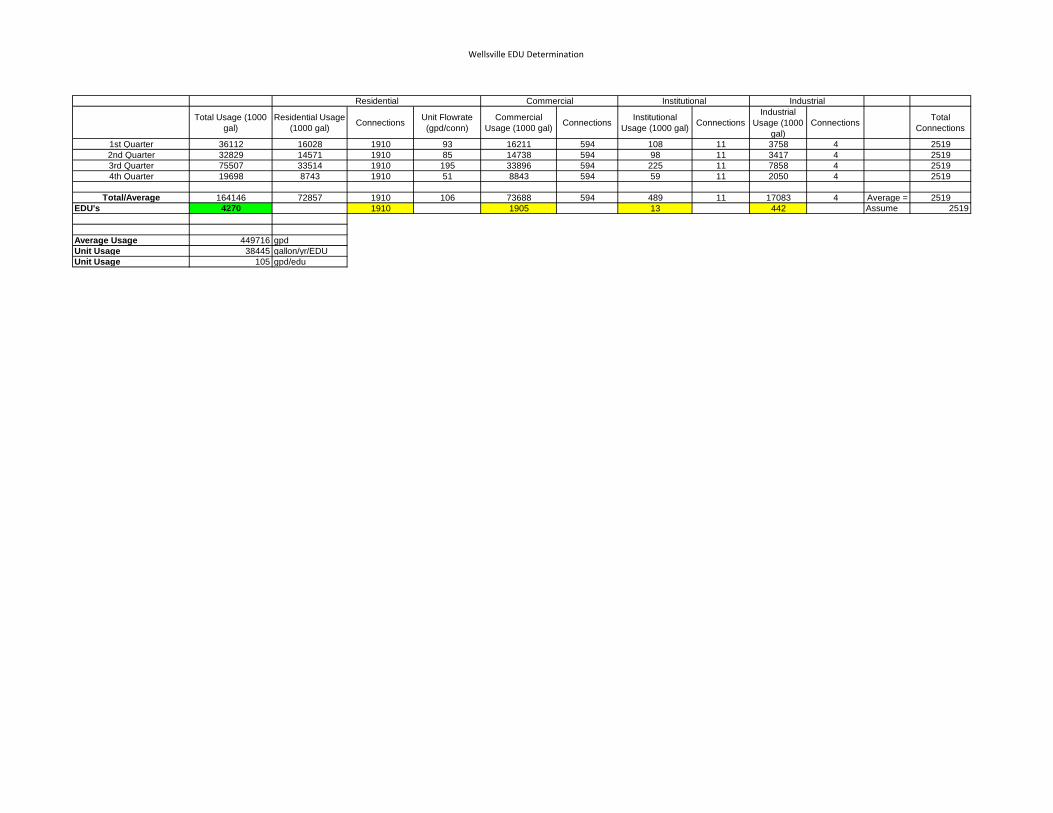
Wellsville EDU Determination
Total Usage (1000
gal)
Residential Usage
(1000 gal)Connections
Unit Flowrate
(gpd/conn)
Commercial
Usage (1000 gal)Connections
Institutional
Usage (1000 gal)Connections
Industrial
Usage (1000
gal)
ConnectionsTotal
Connections
1st Quarter 36112 16028 1910 93 16211 594 108 11 3758 4 2519
2nd Quarter 32829 14571 1910 85 14738 594 98 11 3417 4 2519
3rd Quarter 75507 33514 1910 195 33896 594 225 11 7858 4 2519
4th Quarter 19698 8743 1910 51 8843 594 59 11 2050 4 2519
Total/Average 164146 72857 1910 106 73688 594 489 11 17083 4 Average = 2519
EDU's 4270 1910 1905 13 442 Assume 2519
Average Usage 449716 gpd
Unit Usage 38445 gallon/yr/EDU
Unit Usage 105 gpd/edu
Residential Commercial Institutional Industrial

Village of Wellsville Preliminary Engineering Report
Wastewater Treatment Plant August 2016
MRB Group Project No. 2314.15001
APPENDIX C
NYSDEC WI/PWL LISTING FOR GENESSEE
RIVER AT WELLSVILLE

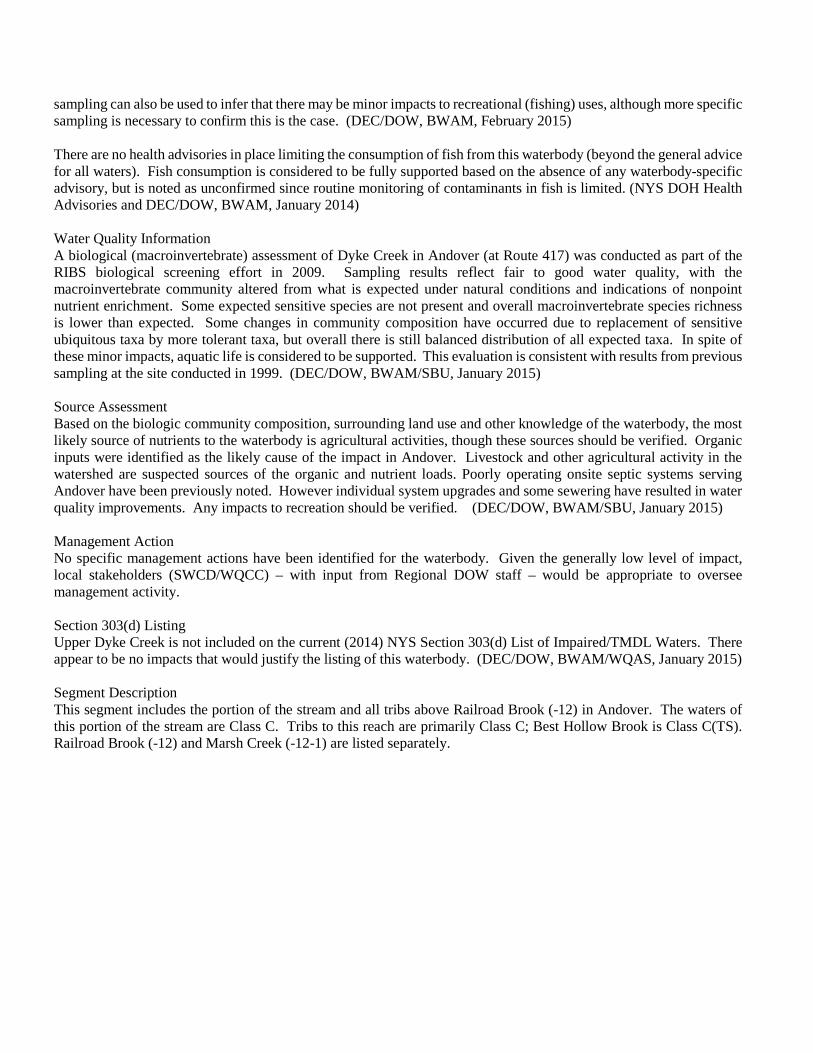
Dyke Creek Watershed (0413000202)
Water Index Number Waterbody Segment Category Ont 117-184 Dyke Creek, Lower, and tribs (0403-0004) Minor Impacts Ont 117-184 Dyke Creek, Upper, and tribs (0403-0071) Minor Impacts Ont 117-184-12 Railroad Brook, Marsh Creeks and tribs (0403-0072) Unassessed Ont 117-184-12-P164 Andover Pond (0403-0056) Unassessed

Dyke Creek, Lower, and tribs (0403-0004) Minor Impacts Waterbody Location Information Revised: 05/01/2015 Water Index No: Ont 117-184 Drain Basin: Genesee River Unit Code: 0413000202 Class: C(T) Upper Genesee River Water Type/Size: River 66.1 Miles Reg/County: 9/Allegany Co. (2) Description: stream and tribs from mouth to Andover Water Quality Problem/Issue Information Uses Evaluated Severity Confidence Water Supply N/A - Public Bathing N/A - Recreation Stressed Unconfirmed Aquatic Life Stressed Suspected Fish Consumption Fully Supported Unconfirmed Conditions Evaluated Habitat/Hydrology Unknown Aesthetics Unknown
Type of Pollutant(s) Known: - - - Suspected: UNKNOWN POLLUTANTS (specify/biological impacts), Nutrients (Phosphorus) Unconfirmed: Low D.O./Oxygen Demand, Pathogens Source(s) of Pollutant(s) Known: - - - Suspected: UNKNOWN SOURCE, Agriculture Unconfirmed: - - - Management Information Management Status: Verification of Pollutants/Causes Needed Lead Agency/Office: ext/WQCC IR/305(b) Code: Water Attaining All Standards (IR Category 1) Further Details Overview This portion of Dyke Creek is assessed as having minor impacts due to aquatic life that is thought to be stressed. No specific pollutant or sources have been identified, but sampling results and surrounding land use suggest nonpoint nutrient contributions from agriculture and/or onsite (septic) systems. Use Assessment This portion of Dyke Creek is a Class C(T) waterbody, suitable for general recreation use and support of aquatic life, but not as a water supply or for public bathing. The waterbody is also designated as a cold water (trout) fishery. Aquatic life is evaluated as supported but stressed based on biological sampling that shows slight impacts. This

sampling can also be used to infer that there may be minor impacts to recreational (fishing) uses, although more specific sampling is necessary to confirm this is the case. (DEC/DOW, BWAM, February 2015) There are no health advisories in place limiting the consumption of fish from this waterbody (beyond the general advice for all waters). Fish consumption is considered to be fully supported based on the absence of any waterbody-specific advisory, but is noted as unconfirmed since routine monitoring of contaminants in fish is limited. (NYS DOH Health Advisories and DEC/DOW, BWAM, January 2014) Water Quality Information A biological (macroinvertebrate) assessment of Dyke Creek in Andover (at Route 417) was conducted as part of the RIBS biological screening effort in 2009. Sampling results reflect fair to good water quality, with the macroinvertebrate community altered from what is expected under natural conditions and indications of nonpoint nutrient enrichment. Some expected sensitive species are not present and overall macroinvertebrate species richness is lower than expected. Some changes in community composition have occurred due to replacement of sensitive ubiquitous taxa by more tolerant taxa, but overall there is still balanced distribution of all expected taxa. In spite of these minor impacts, aquatic life is considered to be supported. This evaluation is consistent with results from previous sampling at the site and at a downstream location in Wellsville conducted in 1999. (DEC/DOW, BWAM/SBU, January 2015) Source Assessment Based on the biologic community composition, surrounding land use and other knowledge of the waterbody, the most likely source of nutrients to the waterbody is agricultural activities, though these sources should be verified. Organic inputs were identified as the likely cause of the impact in Andover. Livestock and other agricultural activity in the watershed are suspected sources of the organic and nutrient loads. Poorly operating onsite septic systems serving Andover have been previously noted. However individual system upgrades and some sewering have resulted in water quality improvements. Any impacts to recreation should be verified. (DEC/DOW, BWAM/SBU, January 2015) Management Action No specific management actions have been identified for the waterbody. Given the generally low level of impact, local stakeholders (SWCD/WQCC) – with input from Regional DOW staff – would be appropriate to oversee management activity. Section 303(d) Listing Lower Dyke Creek is not included on the current (2014) NYS Section 303(d) List of Impaired/TMDL Waters. There appear to be no impacts that would justify the listing of this waterbody. (DEC/DOW, BWAM/WQAS, January 2015) Segment Description This segment includes the portion of the stream and all tribs from the mouth to Railroad Brook (-12) in Andover. The waters of this portion of the stream are Class C from the mouth to a point one mile upstream, and Class C(T) for the remainder of the reach. Tribs to this reach, including Trapping Brook (-1), Elm Valley Brook (-5) and Indian Creek (-9), are primarily Class C; Indian Brook is Class C(TS). Railroad Brook (-12) and Marsh Creek (-12-1) listed separately.

Dyke Creek, Upper, and tribs (0403-0071) Minor Impacts Waterbody Location Information Revised: 05/01/2015 Water Index No: Ont 117-184 Drain Basin: Genesee River Unit Code: 0413000202 Class: C(T) Upper Genesee River Water Type/Size: River 66.1 Miles Reg/County: 9/Allegany Co. (2) Description: stream and tribs from mouth to Andover Water Quality Problem/Issue Information Uses Evaluated Severity Confidence Water Supply N/A - Public Bathing N/A - Recreation Stressed Unconfirmed Aquatic Life Stressed Suspected Fish Consumption Fully Supported Unconfirmed Conditions Evaluated Habitat/Hydrology Unknown Aesthetics Unknown
Type of Pollutant(s) Known: - - - Suspected: UNKNOWN POLLUTANTS (specify/biological impacts), Nutrients (Phosphorus) Unconfirmed: Low D.O./Oxygen Demand Source(s) of Pollutant(s) Known: - - - Suspected: UNKNOWN SOURCE, Agriculture Unconfirmed: - - - Management Information Management Status: Verification of Pollutants/Causes Needed Lead Agency/Office: ext/WQCC IR/305(b) Code: Water Attaining All Standards (IR Category 1) Further Details Overview This portion of Dyke Creek is assessed as having minor impacts due to aquatic life that is thought to be stressed. No specific pollutant or sources have been identified, but sampling results and surrounding land use suggest nonpoint nutrient contributions from agriculture and/or onsite (septic) systems. Use Assessment This portion of Dyke Creek is a Class C waterbody, suitable for general recreation use and support of aquatic life, but not as a water supply or for public bathing. Aquatic life is evaluated as supported but stressed based on biological sampling that shows slight impacts. This
sampling can also be used to infer that there may be minor impacts to recreational (fishing) uses, although more specific sampling is necessary to confirm this is the case. (DEC/DOW, BWAM, February 2015) There are no health advisories in place limiting the consumption of fish from this waterbody (beyond the general advice for all waters). Fish consumption is considered to be fully supported based on the absence of any waterbody-specific advisory, but is noted as unconfirmed since routine monitoring of contaminants in fish is limited. (NYS DOH Health Advisories and DEC/DOW, BWAM, January 2014) Water Quality Information A biological (macroinvertebrate) assessment of Dyke Creek in Andover (at Route 417) was conducted as part of the RIBS biological screening effort in 2009. Sampling results reflect fair to good water quality, with the macroinvertebrate community altered from what is expected under natural conditions and indications of nonpoint nutrient enrichment. Some expected sensitive species are not present and overall macroinvertebrate species richness is lower than expected. Some changes in community composition have occurred due to replacement of sensitive ubiquitous taxa by more tolerant taxa, but overall there is still balanced distribution of all expected taxa. In spite of these minor impacts, aquatic life is considered to be supported. This evaluation is consistent with results from previous sampling at the site conducted in 1999. (DEC/DOW, BWAM/SBU, January 2015) Source Assessment Based on the biologic community composition, surrounding land use and other knowledge of the waterbody, the most likely source of nutrients to the waterbody is agricultural activities, though these sources should be verified. Organic inputs were identified as the likely cause of the impact in Andover. Livestock and other agricultural activity in the watershed are suspected sources of the organic and nutrient loads. Poorly operating onsite septic systems serving Andover have been previously noted. However individual system upgrades and some sewering have resulted in water quality improvements. Any impacts to recreation should be verified. (DEC/DOW, BWAM/SBU, January 2015) Management Action No specific management actions have been identified for the waterbody. Given the generally low level of impact, local stakeholders (SWCD/WQCC) – with input from Regional DOW staff – would be appropriate to oversee management activity. Section 303(d) Listing Upper Dyke Creek is not included on the current (2014) NYS Section 303(d) List of Impaired/TMDL Waters. There appear to be no impacts that would justify the listing of this waterbody. (DEC/DOW, BWAM/WQAS, January 2015) Segment Description This segment includes the portion of the stream and all tribs above Railroad Brook (-12) in Andover. The waters of this portion of the stream are Class C. Tribs to this reach are primarily Class C; Best Hollow Brook is Class C(TS). Railroad Brook (-12) and Marsh Creek (-12-1) are listed separately.

Railroad Brook, Marsh Creeks and tribs (0403-0072) Unassessed Waterbody Location Information Revised: 05/01/2015 Water Index No: Ont 117-184-12 Drain Basin: Genesee River Unit Code: 0413000202 Class: C Upper Genesee River Water Type/Size: River 27.7 Miles Reg/County: 9/Allegany Co. (2) Description: entire length of both streams and tribs Water Quality Problem/Issue Information Uses Evaluated Severity Confidence Water Supply N/A - Public Bathing N/A - Recreation Unassessed - Aquatic Life Unassessed - Fish Consumption Unassessed - Conditions Evaluated Habitat/Hydrology Unknown Aesthetics Unknown
Type of Pollutant(s) Known: - - - Suspected: - - - Unconfirmed: - - - Source(s) of Pollutant(s) Known: - - - Suspected: - - - Unconfirmed: - - - Management Information Management Status: UnAssessed Lead Agency/Office: DOW/BWAM IR/305(b) Code: Water with Insufficient Data (IR Category 3) Further Details Overview Currently there is inadequate data/information to evaluate uses and determine a water quality assessment for this waterbody. Segment Description This segment includes the entire length of both streams and all tribs. The waters of these stream and their tribs are primarily Class C; a portion of Marsh Creek is Class C(TS).

Andover Pond (0403-0056) Unassessed Waterbody Location Information Revised: 05/01/2015 Water Index No: Ont 117-184-12-P164 Drain Basin: Genesee River Unit Code: 0413000202 Class: C Upper Genesee River Water Type/Size: Lake 7.6 Acres Reg/County: 9/Allegany Co. (2) Description: entire lake Water Quality Problem/Issue Information Uses Evaluated Severity Confidence Water Supply N/A - Public Bathing N/A - Recreation Unassessed - Aquatic Life Unassessed - Fish Consumption Unassessed - Conditions Evaluated Habitat/Hydrology Unknown Aesthetics Unknown
Type of Pollutant(s) Known: - - - Suspected: - - - Unconfirmed: - - - Source(s) of Pollutant(s) Known: - - - Suspected: - - - Unconfirmed: - - - Management Information Management Status: Assessment/Reassessment Scheduled Lead Agency/Office: DOW/BWAM IR/305(b) Code: Water with Insufficient Data (IR Category 3) Further Details Overview Currently there is inadequate data/information to evaluate uses and determine a water quality assessment for this waterbody. The waterbody is scheduled to be sampled through the NYSDEC RIBS Program in 2015. Segment Description This segment includes the entire area of the lake. The waters of the lake are Class C.

Village of Wellsville Preliminary Engineering Report
Wastewater Treatment Plant August 2016
MRB Group Project No. 2314.15001
APPENDIX D
EXISTING FLOW AND LOADINGS

Village of Wellsville
Influent Summary
Date PrecipInstant
Max. Flow
Avg. Daily
Flow
Q,MGD
Instant Min.
Flow
Daily
Influent
Temp
Influent
BOD, mg/L
Influent
BOD,
#/day
Influent
TSS, mg/L
Influent TSS,
#/day
Influent
TKN, mg/L
Influent
TKN, #/day
Total Monthly
Leachate
Treated (gal.)
Monthly
Leachate
Treated (gpd)
Monthly
Leachate
Treated
(MGD)
MAX. 2.10 5.00 3.743 1.96 23 379 3942 1244 12938 56 422
MIN. 0.00 0.86 0.574 0.00 6 52 691 84 900 8 65
AVERAGE 0.10 2.34 1.153 0.61 14 173 1631 229 2184 25 203
Date Precip
Instant
Max.
Monthly
Flow
Avg.
Monthly
Flow
Q,MGD
Instant Min.
Flow
Avg.
Monthly
Influent
Temp
Influent
BOD, mg/L
Influent
BOD,
#/day
Influent
TSS, mg/L
Influent TSS,
#/day
Influent
TKN, mg/L
Influent
TKN, #/day
Total Monthly
Leachate
Treated (gal.)
Monthly
Leachate
Treated (gpd)
Monthly
Leachate
Treated
(MGD)
Aug-12 0.06 1.89 0.777 0.430 21 207 1403 281 1947 37 250 593908 19158 0.019
Sep-12 0.13 2.48 0.799 0.332 20 184 1470 266 2164 15 126 526488 17550 0.018
Oct-12 0.19 2.33 1.037 0.456 17 172 1637 229 2261 21 191 757434 24433 0.024
Nov-12 0.02 2.49 1.096 0.537 14 209 1913 170 1569 1016835 33895 0.034
Dec-12 0.23 2.67 1.466 0.848 12 145 1991 167 2313 700622 22601 0.023
Jan-13 0.09 2.68 1.537 0.932 10 151 1801 156 1925 1313726 42378 0.042
Feb-13 0.06 2.38 1.300 0.771 9 154 1608 133 1371 1053097 37611 0.038
Mar-13 0.03 2.27 1.238 0.659 9 135 1511 158 1762 931843 30059 0.030
Apr-13 0.12 2.41 1.404 0.807 11 146 1552 164 1736 1028619 34287 0.034
May-13 0.15 2.38 1.185 0.631 15 199 2107 225 2457 982983 31709 0.032
Jun-13 0.13 2.50 1.264 0.683 17 166 1789 147 1513 15 161 888379 29613 0.030
Jul-13 0.11 2.27 1.057 0.499 20 177 1574 179 1629 17 153 734581 23696 0.024
Aug-13 0.08 2.16 0.847 0.310 20 235 1785 278 2110 24 184 585933 18901 0.019
Sep-13 0.10 1.90 0.782 0.285 20 259 1745 230 1547 23 154 641468 21382 0.021
Oct-13 0.16 2.16 0.892 0.394 18 220 1599 215 1543 24 173 1042368 33625 0.034
Nov-13 0.11 2.57 1.061 0.501 14 155 1520 251 2752 39 297 840738 28025 0.028
Dec-13 0.08 2.59 1.376 0.759 11 171 1725 271 2639 854273 27557 0.028
Jan-14 0.06 2.55 1.341 0.782 10 133 1448 158 1746 2285755 73734 0.074
Feb-14 0.09 2.31 1.101 0.563 9 175 1492 177 1522 947083 33824 0.034
Mar-14 0.09 2.52 1.359 0.807 8 208 2240 450 4843 997922 32191 0.032
Apr-14 0.08 2.84 1.666 1.062 10 90 1266 114 1641 1110583 37019 0.037
May-14 0.16 2.56 1.586 0.982 14 124 1571 187 2399 744302 24010 0.024
Jun-14 0.17 2.45 1.256 0.728 17 138 1407 206 2119 20 213 888379 29613 0.030
Jul-14 0.12 1.130 19 146 1468 221 2322 21 203 938457 30273 0.030
Aug-14 0.11 2.30 0.982 0.436 19 224 1941 259 2287 40 356 1444890 46609 0.047
Sep-14 0.06 1.94 0.836 0.319 19 223 1697 255 1963 34 258 1024391 34146 0.034
Oct-14 0.08 1.83 0.811 0.337 18 211 1553 420 3106 26 192 777083 25067 0.025
Nov-14 0.06 2.01 0.897 0.404 14 213 1647 230 1773 17 127 611213 20374 0.020
Dec-14 0.08 2.29 1.083 0.566 12 151 1382 169 1561 1190548 38405 0.038
Jan-15 0.03 2.19 0.998 0.497 10 174 1517 228 1935 25 256 1064457 34337 0.034
Feb-15 0.07 2.11 1.021 0.492 9 198 1743 274 2398 616516 22018 0.022
Mar-15 0.04 2.40 1.395 0.816 9 155 1729 227 2590 1174947 37902 0.038
Apr-15 0.11 2.91 1.815 1.261 10 108 1561 159 2301 1360229 45341 0.045
May-15 0.07 2.17 1.063 0.591 15 156 1459 239 2227 976156 31489 0.031
Jun-15 0.19 2.16 1.102 0.546 18 144 1403 285 2711 21 172 815565 27186 0.027
Jul-15 0.07 2.09 0.963 0.472 19 205 1835 477 4196 28 235 578691 18667 0.019
Max 0.23 2.91 1.815 1.261 21 259 2240 477 4843 40 356 2285755 73734 0.074
Average 0.10 2.34 1.153 0.614 14 174 1641 229 2191 25 206 945568 31075 0.031
Min 0.02 1.83 0.777 0.285 8 90 1266 114 1371 15 126 526488 17550 0.018
STD 0.05 0.26 0.264 0.232 4 38 215 82 715 8 61 324199 10477 0.010
BASED ON ENTIRE DATA SET
MONTHLY DATA

Village of Wellsville
Effluent Summary
Date
Avg. Daily
Flow
Q,MGD
Daily
Effluent
Temp
Effluent
BOD, mg/L
Effluent
BOD, #/day
Effluent
TSS, mg/L
Effluent TSS,
#/day
Effluent
TKN, mg/L
Effluent
TKN, #/day
Effluent
NH3, mg/L
Effluent
NH3, #/day
Effluent TP,
mg/L
Effluent TP,
#/day
Effluent
Alum, mg/L
Effluent
Alum,
#/day
Total Monthly
Leachate
Treated (gal.)
Monthly
Leachate
Treated (gpd)
Monthly
Leachate
Treated
(MGD)
MAX. 3.743 24 34.00 347.00 33.00 459.07 53.40 498.35 60.70 566.48 1.60 23.69 0.50 5.06
MIN. 0.574 5 4.00 37.30 3.00 31.05 1.40 13.36 0.10 0.62 0.20 2.64 0.03 0.15
AVERAGE 1.153 14 11.84 119.86 11.78 119.80 9.29 81.35 8.14 74.90 0.73 7.32 0.13 1.27
Date
Avg. Daily
Flow
Q,MGD
Daily
Effluent
Temp
Effluent
BOD, mg/L
Effluent
BOD, #/day
Effluent
TSS, mg/L
Effluent TSS,
#/day
Effluent
TKN, mg/L
Effluent
TKN, #/day
Effluent
NH3, mg/L
Effluent
NH3, #/day
Effluent TP,
mg/L
Effluent TP,
#/day
Effluent
Alum, mg/L
Effluent
Alum,
#/day
Total Monthly
Leachate
Treated (gal.)
Monthly
Leachate
Treated (gpd)
Monthly
Leachate
Treated
(MGD)
Aug-12 0.777 21 9.20 63.32 9.60 67.65 6.10 42.58 0.66 4.25 0.64 4.43 0.09 0.76 593908 19158 0.019
Sep-12 0.799 19 10.25 85.79 10.50 88.02 10.25 83.73 0.35 3.30 0.78 6.68 0.07 0.67 526488 17550 0.018
Oct-12 1.037 16 9.25 90.76 11.60 145.52 7.18 76.78 1.22 9.81 0.88 9.64 0.04 0.27 757434 24433 0.024
Nov-12 1.096 11 13.00 118.31 20.00 183.76 0.70 6.43 0.11 1.18 1016835 33895 0.034
Dec-12 1.466 10 11.50 162.62 17.25 245.44 0.93 13.60 0.21 2.52 700622 22601 0.023
Jan-13 1.537 9 14.00 165.26 17.20 217.37 0.94 12.14 0.14 1.40 1313726 42378 0.042
Feb-13 1.300 8 16.75 175.36 14.25 149.82 0.68 7.15 0.19 2.39 1053097 37611 0.038
Mar-13 1.238 9 14.50 162.41 9.00 106.93 0.70 7.84 0.07 0.65 931843 30059 0.030
Apr-13 1.404 11 9.40 100.80 12.00 131.02 0.68 7.22 0.08 0.77 1028619 34287 0.034
May-13 1.185 16 11.25 123.33 13.50 154.83 0.93 9.94 0.12 1.13 982983 31709 0.032
Jun-13 1.264 18 7.50 79.79 7.00 68.96 6.15 64.30 3.18 30.88 0.49 5.06 0.09 0.93 888379 29613 0.030
Jul-13 1.057 21 7.40 67.65 7.60 71.28 7.64 70.76 1.84 16.63 0.52 4.81 0.13 1.53 734581 23696 0.024
Aug-13 0.847 20 11.50 87.79 9.00 69.38 5.23 39.86 3.50 26.38 0.75 5.74 0.05 0.37 585933 18901 0.019
Sep-13 0.782 19 11.25 75.88 7.00 47.34 7.28 48.85 6.70 44.87 0.63 4.21 641468 21382 0.021
Oct-13 0.892 16 7.40 53.17 9.00 64.22 5.26 36.69 2.90 19.82 0.62 4.39 0.03 0.15 1042368 33625 0.034
Nov-13 1.061 11 8.75 85.71 12.50 119.28 17.10 129.35 9.70 80.33 0.90 8.80 0.13 1.00 840738 28025 0.028
Dec-13 1.376 9 9.00 93.64 9.25 95.64 14.40 149.16 11.40 118.08 0.71 7.13 0.13 1.43 854273 27557 0.028
Jan-14 1.341 7 16.60 180.14 10.80 117.29 21.60 262.18 0.60 6.59 0.19 1.91 2285755 73734 0.074
Feb-14 1.101 7 18.75 165.77 11.00 95.84 32.40 288.93 0.80 6.90 0.08 0.64 947083 33824 0.034
Mar-14 1.359 7 27.00 299.72 13.75 151.48 24.30 222.52 28.20 258.24 0.78 8.56 0.16 1.43 997922 32191 0.032
Apr-14 1.666 10 11.00 163.56 7.80 113.75 0.56 7.56 0.07 0.91 1110583 37019 0.037
May-14 1.586 14 12.75 163.18 10.25 132.56 14.00 154.59 0.65 8.22 0.06 0.64 744302 24010 0.024
Jun-14 1.256 18 7.75 80.32 8.25 87.29 5.65 58.56 4.97 52.61 0.58 5.95 0.09 0.99 888379 29613 0.030
Jul-14 1.130 19 7.80 80.97 11.40 112.15 6.41 63.69 3.50 33.76 0.62 6.30 0.22 2.02 938457 30273 0.030
Aug-14 0.982 20 7.75 70.95 8.75 80.71 14.00 126.93 9.89 89.03 0.75 6.88 0.08 0.74 1444890 46609 0.047
Sep-14 0.836 19 11.00 85.96 9.00 69.69 13.71 110.01 12.80 102.53 0.68 5.32 0.06 0.52 1024391 34146 0.034
Oct-14 0.811 16 10.00 73.74 14.20 105.52 11.27 86.94 8.83 68.89 0.91 6.70 0.20 1.26 777083 25067 0.025
Nov-14 0.897 11 9.50 74.29 17.25 134.86 22.80 169.81 14.50 107.99 0.98 7.61 0.20 1.49 611213 20374 0.020
Dec-14 1.083 10 10.60 98.00 17.80 165.67 14.00 113.49 0.78 7.35 0.18 1.46 1190548 38405 0.038
Jan-15 0.998 8 15.00 129.43 11.50 99.21 26.60 270.65 0.83 7.38 0.20 2.03 1064457 34337 0.034
Feb-15 1.021 7 24.00 210.34 20.25 176.51 0.85 7.47 0.20 2.04 616516 22018 0.022
Mar-15 1.395 8 27.00 322.73 16.75 203.21 53.40 498.35 60.70 566.48 0.70 8.42 0.11 0.98 1174947 37902 0.038
Apr-15 1.815 10 15.80 228.17 10.20 146.59 0.72 10.92 0.08 0.93 1360229 45341 0.045
May-15 1.063 16 10.00 94.65 8.25 78.06 33.20 336.14 30.70 310.83 0.55 5.22 0.50 5.06 976156 31489 0.031
Jun-15 1.102 19 7.75 76.69 15.25 160.19 6.15 57.94 3.68 33.00 0.75 7.78 0.23 1.87 815565 27186 0.027
Jul-15 0.963 20 6.40 58.01 7.20 64.52 4.02 37.08 1.68 15.83 0.78 7.06 578691 18667 0.019
Date
Avg. Daily
Flow
Q,MGD
Daily
Effluent
Temp
Effluent
BOD, mg/L
Effluent
BOD, #/day
Effluent
TSS, mg/L
Effluent TSS,
#/day
Effluent
TKN, mg/L
Effluent
TKN, #/day
Effluent
NH3, mg/L
Influent
NH3, #/day
Effluent TP,
mg/L
Effluent TP,
#/day
Effluent
Alum, mg/L
Effluent
Alum,
#/dayMax 1.815 21 27.00 322.73 20.25 245.44 53.40 498.35 60.70 566.48 0.98 13.60 0.50 5.06 2285755 73734 0.074
Average 1.153 14 12.18 123.56 11.83 120.04 13.40 119.53 12.67 118.59 0.73 7.32 0.13 1.30 945568 31075 0.031
Min 0.777 7 6.40 53.17 7.00 47.34 4.02 36.69 0.35 3.30 0.49 4.21 0.03 0.15 526488 17550 0.018
STD 0.264 5 5.20 65.06 3.80 47.76 11.89 113.10 13.81 133.53 0.13 2.06 0.09 0.90 324199 10477 0.010
BASED ON ENTIRE DATA SET
BASED ON ENTIRE DATA SET
BASED ON MONTHLY DATA SET
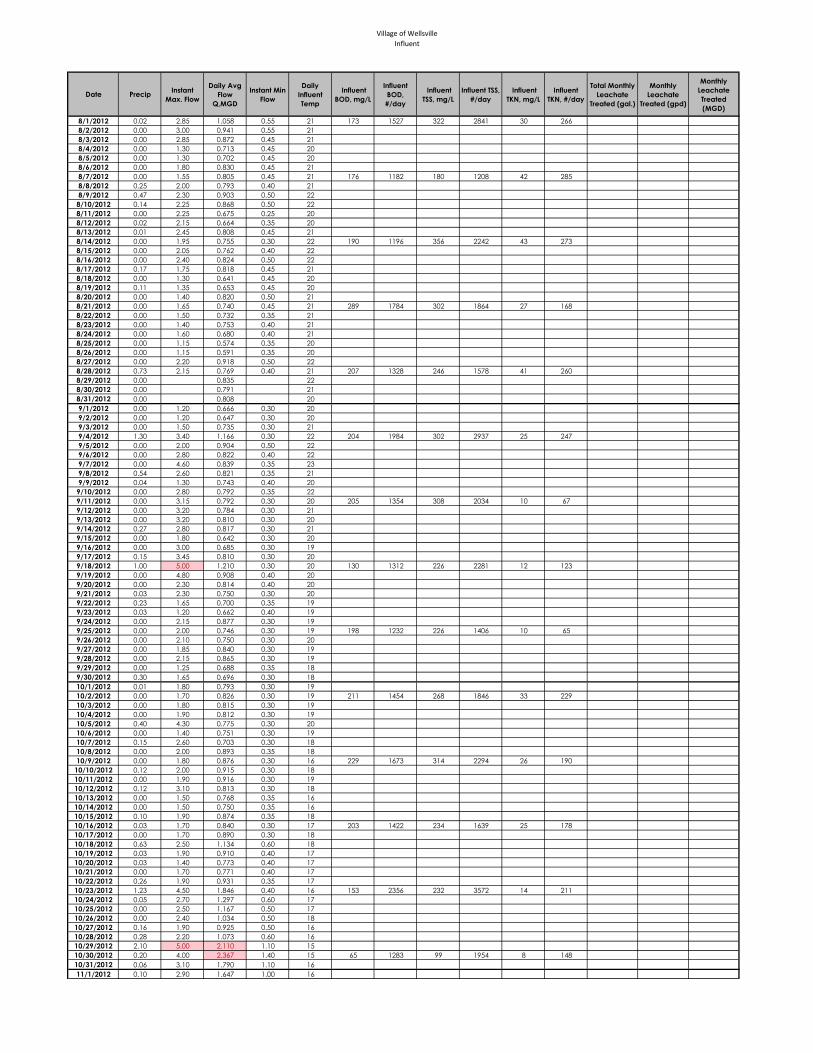
Village of Wellsville
Influent
Date PrecipInstant
Max. Flow
Daily Avg
Flow
Q,MGD
Instant Min
Flow
Daily
Influent
Temp
Influent
BOD, mg/L
Influent
BOD,
#/day
Influent
TSS, mg/L
Influent TSS,
#/day
Influent
TKN, mg/L
Influent
TKN, #/day
Total Monthly
Leachate
Treated (gal.)
Monthly
Leachate
Treated (gpd)
Monthly
Leachate
Treated
(MGD)
8/1/2012 0.02 2.85 1.058 0.55 21 173 1527 322 2841 30 266
8/2/2012 0.00 3.00 0.941 0.55 21
8/3/2012 0.00 2.85 0.872 0.45 21
8/4/2012 0.00 1.30 0.713 0.45 20
8/5/2012 0.00 1.30 0.702 0.45 20
8/6/2012 0.00 1.80 0.830 0.45 21
8/7/2012 0.00 1.55 0.805 0.45 21 176 1182 180 1208 42 285
8/8/2012 0.25 2.00 0.793 0.40 21
8/9/2012 0.47 2.30 0.903 0.50 22
8/10/2012 0.14 2.25 0.868 0.50 22
8/11/2012 0.00 2.25 0.675 0.25 20
8/12/2012 0.02 2.15 0.664 0.35 20
8/13/2012 0.01 2.45 0.808 0.45 21
8/14/2012 0.00 1.95 0.755 0.30 22 190 1196 356 2242 43 273
8/15/2012 0.00 2.05 0.762 0.40 22
8/16/2012 0.00 2.40 0.824 0.50 22
8/17/2012 0.17 1.75 0.818 0.45 21
8/18/2012 0.00 1.30 0.641 0.45 20
8/19/2012 0.11 1.35 0.653 0.45 20
8/20/2012 0.00 1.40 0.820 0.50 21
8/21/2012 0.00 1.65 0.740 0.45 21 289 1784 302 1864 27 168
8/22/2012 0.00 1.50 0.732 0.35 21
8/23/2012 0.00 1.40 0.753 0.40 21
8/24/2012 0.00 1.60 0.680 0.40 21
8/25/2012 0.00 1.15 0.574 0.35 20
8/26/2012 0.00 1.15 0.591 0.35 20
8/27/2012 0.00 2.20 0.918 0.50 22
8/28/2012 0.73 2.15 0.769 0.40 21 207 1328 246 1578 41 260
8/29/2012 0.00 0.835 22
8/30/2012 0.00 0.791 21
8/31/2012 0.00 0.808 20
9/1/2012 0.00 1.20 0.666 0.30 20
9/2/2012 0.00 1.20 0.647 0.30 20
9/3/2012 0.00 1.50 0.735 0.30 21
9/4/2012 1.30 3.40 1.166 0.30 22 204 1984 302 2937 25 247
9/5/2012 0.00 2.00 0.904 0.50 22
9/6/2012 0.00 2.80 0.822 0.40 22
9/7/2012 0.00 4.60 0.839 0.35 23
9/8/2012 0.54 2.60 0.821 0.35 21
9/9/2012 0.04 1.30 0.743 0.40 20
9/10/2012 0.00 2.80 0.792 0.35 22
9/11/2012 0.00 3.15 0.792 0.30 20 205 1354 308 2034 10 67
9/12/2012 0.00 3.20 0.784 0.30 21
9/13/2012 0.00 3.20 0.810 0.30 20
9/14/2012 0.27 2.80 0.817 0.30 21
9/15/2012 0.00 1.80 0.642 0.30 20
9/16/2012 0.00 3.00 0.685 0.30 19
9/17/2012 0.15 3.45 0.810 0.30 20
9/18/2012 1.00 5.00 1.210 0.30 20 130 1312 226 2281 12 123
9/19/2012 0.00 4.80 0.908 0.40 20
9/20/2012 0.00 2.30 0.814 0.40 20
9/21/2012 0.03 2.30 0.750 0.30 20
9/22/2012 0.23 1.65 0.700 0.35 19
9/23/2012 0.03 1.20 0.662 0.40 19
9/24/2012 0.00 2.15 0.877 0.30 19
9/25/2012 0.00 2.00 0.746 0.30 19 198 1232 226 1406 10 65
9/26/2012 0.00 2.10 0.750 0.30 20
9/27/2012 0.00 1.85 0.840 0.30 19
9/28/2012 0.00 2.15 0.865 0.30 19
9/29/2012 0.00 1.25 0.688 0.35 18
9/30/2012 0.30 1.65 0.696 0.30 18
10/1/2012 0.01 1.80 0.793 0.30 19
10/2/2012 0.00 1.70 0.826 0.30 19 211 1454 268 1846 33 229
10/3/2012 0.00 1.80 0.815 0.30 19
10/4/2012 0.00 1.90 0.812 0.30 19
10/5/2012 0.40 4.30 0.775 0.30 20
10/6/2012 0.00 1.40 0.751 0.30 19
10/7/2012 0.15 2.60 0.703 0.30 18
10/8/2012 0.00 2.00 0.893 0.35 18
10/9/2012 0.00 1.80 0.876 0.30 16 229 1673 314 2294 26 190
10/10/2012 0.12 2.00 0.915 0.30 18
10/11/2012 0.00 1.90 0.916 0.30 19
10/12/2012 0.12 3.10 0.813 0.30 18
10/13/2012 0.00 1.50 0.768 0.35 16
10/14/2012 0.00 1.50 0.750 0.35 16
10/15/2012 0.10 1.90 0.874 0.35 18
10/16/2012 0.03 1.70 0.840 0.30 17 203 1422 234 1639 25 178
10/17/2012 0.00 1.70 0.890 0.30 18
10/18/2012 0.63 2.50 1.134 0.60 18
10/19/2012 0.03 1.90 0.910 0.40 17
10/20/2012 0.03 1.40 0.773 0.40 17
10/21/2012 0.00 1.70 0.771 0.40 17
10/22/2012 0.26 1.90 0.931 0.35 17
10/23/2012 1.23 4.50 1.846 0.40 16 153 2356 232 3572 14 211
10/24/2012 0.05 2.70 1.297 0.60 17
10/25/2012 0.00 2.50 1.167 0.50 17
10/26/2012 0.00 2.40 1.034 0.50 18
10/27/2012 0.16 1.90 0.925 0.50 16
10/28/2012 0.28 2.20 1.073 0.60 16
10/29/2012 2.10 5.00 2.110 1.10 15
10/30/2012 0.20 4.00 2.367 1.40 15 65 1283 99 1954 8 148
10/31/2012 0.06 3.10 1.790 1.10 16
11/1/2012 0.10 2.90 1.647 1.00 16
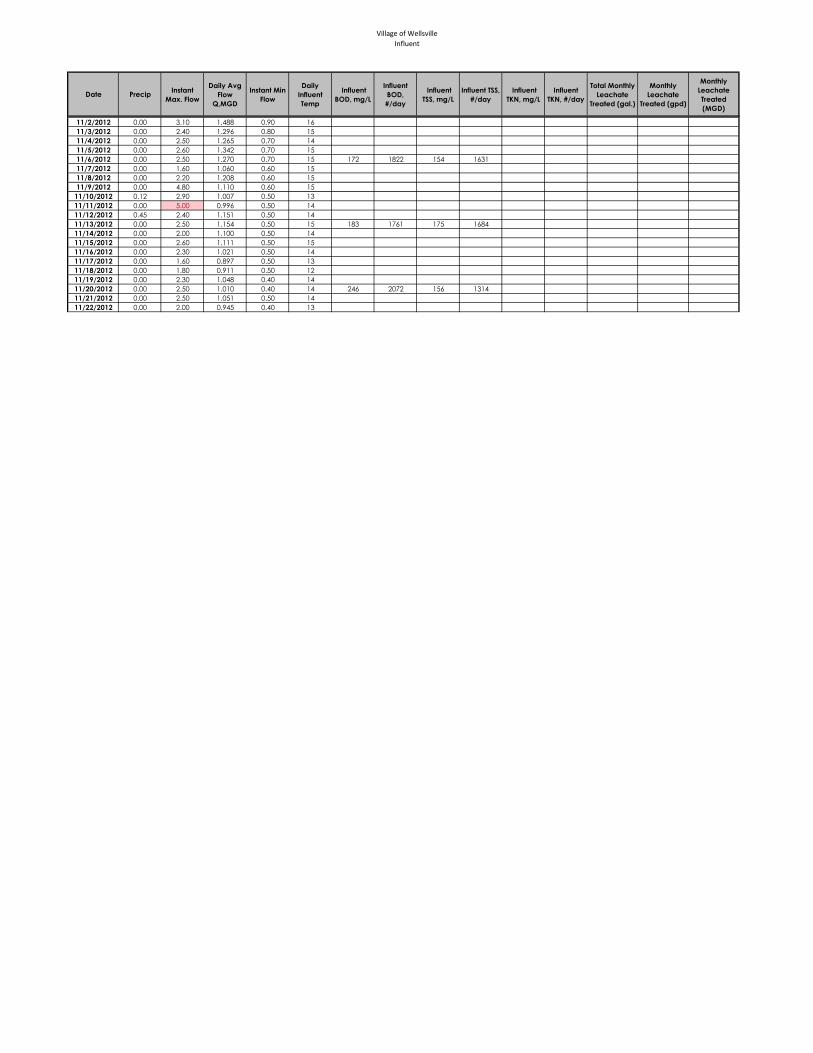
Village of Wellsville
Influent
Date PrecipInstant
Max. Flow
Daily Avg
Flow
Q,MGD
Instant Min
Flow
Daily
Influent
Temp
Influent
BOD, mg/L
Influent
BOD,
#/day
Influent
TSS, mg/L
Influent TSS,
#/day
Influent
TKN, mg/L
Influent
TKN, #/day
Total Monthly
Leachate
Treated (gal.)
Monthly
Leachate
Treated (gpd)
Monthly
Leachate
Treated
(MGD)
11/2/2012 0.00 3.10 1.488 0.90 16
11/3/2012 0.00 2.40 1.296 0.80 15
11/4/2012 0.00 2.50 1.265 0.70 14
11/5/2012 0.00 2.60 1.342 0.70 15
11/6/2012 0.00 2.50 1.270 0.70 15 172 1822 154 1631
11/7/2012 0.00 1.60 1.060 0.60 15
11/8/2012 0.00 2.20 1.208 0.60 15
11/9/2012 0.00 4.80 1.110 0.60 15
11/10/2012 0.12 2.90 1.007 0.50 13
11/11/2012 0.00 5.00 0.996 0.50 14
11/12/2012 0.45 2.40 1.151 0.50 14
11/13/2012 0.00 2.50 1.154 0.50 15 183 1761 175 1684
11/14/2012 0.00 2.00 1.100 0.50 14
11/15/2012 0.00 2.60 1.111 0.50 15
11/16/2012 0.00 2.30 1.021 0.50 14
11/17/2012 0.00 1.60 0.897 0.50 13
11/18/2012 0.00 1.80 0.911 0.50 12
11/19/2012 0.00 2.30 1.048 0.40 14
11/20/2012 0.00 2.50 1.010 0.40 14 246 2072 156 1314
11/21/2012 0.00 2.50 1.051 0.50 14
11/22/2012 0.00 2.00 0.945 0.40 13

Village of Wellsville
Influent
Date PrecipInstant
Max. Flow
Daily Avg
Flow
Q,MGD
Instant Min
Flow
Daily
Influent
Temp
Influent
BOD, mg/L
Influent
BOD,
#/day
Influent
TSS, mg/L
Influent TSS,
#/day
Influent
TKN, mg/L
Influent
TKN, #/day
Total Monthly
Leachate
Treated (gal.)
Monthly
Leachate
Treated (gpd)
Monthly
Leachate
Treated
(MGD)
11/23/2012 0.00 2.30 1.013 0.40 13
11/24/2012 0.00 1.50 0.908 0.50 13
11/25/2012 0.00 1.70 0.925 0.50 13
11/26/2012 0.00 2.20 1.014 0.40 13
11/27/2012 0.00 1.90 1.024 0.40 13 234 1998 193 1648
11/28/2012 0.00 2.80 0.995 0.40 12
11/29/2012 0.00 2.50 1.000 0.40 13
11/30/2012 0.00 2.70 0.919 0.30 12
12/1/2012 0.00 1.30 0.792 0.40 11
12/2/2012 0.50 1.80 0.986 0.50 13
12/3/2012 0.00 3.60 1.038 0.50 14
12/4/2012 0.70 3.00 1.472 0.70 14 223 2738 310 3806
12/5/2012 0.00 2.30 1.356 0.60 12
12/6/2012 0.00 2.70 1.254 0.50 13
12/7/2012 0.31 2.70 1.363 0.80 13
12/8/2012 0.02 2.10 1.144 0.60 11
12/9/2012 0.35 3.00 1.244 0.70 12
12/10/2012 0.34 2.90 1.910 1.10 13
12/11/2012 0.00 3.00 1.623 0.90 13 168 2274 119 1611
12/12/2012 0.00 3.00 1.474 0.80 12
12/13/2012 0.00 4.00 1.431 0.50 13
12/14/2012 0.00 2.90 1.289 0.60 12
12/15/2012 0.00 1.90 1.103 0.70 12
12/16/2012 0.40 2.40 1.265 0.90 12
12/17/2012 0.57 3.30 2.033 1.20 12
12/18/2012 0.38 3.70 2.486 1.20 12 74 1534 104 2156
12/19/2012 0.00 3.20 1.838 1.30 13
12/20/2012 0.44 2.90 1.948 1.40 12
12/21/2012 0.20 3.10 2.133 1.40 12
12/22/2012 0.00 2.60 1.659 1.00 10
12/23/2012 0.00 2.10 1.546 1.00 10
12/24/2012 0.17 2.90 1.615 0.90 11
12/25/2012 0.00 2.20 1.361 0.90 11
12/26/2012 1.80 2.60 1.493 0.90 11 114 1419 135 1681
12/27/2012 0.00 2.20 1.362 0.90 9
12/28/2012 0.42 2.60 1.262 0.90 12
12/29/2012 0.17 2.10 1.386 0.90 12
12/30/2012 2.50 1.227 0.80 11
12/31/2012 0.00 2.10 1.358 0.80 11
1/1/2013 0.00 2.10 1.235 0.80 10 158 1627 147 1514
1/2/2013 2.80 1.412 0.75 11
1/3/2013 0.00 2.50 1.339 0.70 11
1/4/2013 2.30 1.305 0.75 11
1/5/2013 0.00 2.30 1.194 0.70 10
1/6/2013 0.17 2.15 1.199 0.70 10
1/7/2013 0.00 2.90 1.336 0.70 10
1/8/2013 0.00 2.70 1.291 0.70 10 151 1626 130 1400
1/9/2013 0.00 3.75 1.385 0.70 10
1/10/2013 0.00 2.50 1.375 0.80 10
1/11/2013 0.10 2.40 1.643 0.80 11
1/12/2013 0.00 2.70 2.081 1.10 9
1/13/2013 0.03 3.00 2.180 1.40 9
1/14/2013 0.00 2.90 1.930 1.60 11
1/15/2013 0.05 2.90 1.775 1.30 11 101 1495 151 2235
1/16/2013 2.90 1.748 1.20 12
1/17/2013 0.08 3.10 1.703 1.10 10
1/18/2013 2.65 1.542 0.95 10
1/19/2013 0.00 2.35 1.384 0.90 9
1/20/2013 0.00 2.20 1.314 0.80 11
1/21/2013 0.06 2.40 1.417 0.80 11
1/22/2013 0.02 2.40 1.311 0.80 9 173 1892 142 1553
1/23/2013 0.00 2.30 1.368 0.80 10
1/24/2013 0.00 2.00 1.269 0.70 10
1/25/2013 0.05 2.80 1.229 0.70 9
1/26/2013 0.00 1.90 1.052 0.70 10
1/27/2013 1.60 1.069 0.70 10
1/28/2013 0.23 2.20 1.343 0.75 11
1/29/2013 0.43 3.10 1.668 1.00 11 170 2365 210 2921
1/30/2013 1.11 4.70 2.859 1.70 10
1/31/2013 0.10 4.70 2.697 1.80 9
2/1/2013 0.02 2.90 1.993 1.39 9
2/2/2013 0.00 2.43 1.717 1.28 8
2/3/2013 0.06 2.47 1.559 1.08 8
2/4/2013 0.04 3.22 1.640 0.90 10
2/5/2013 0.00 2.58 1.519 0.93 10 133 1685 100 1267
2/6/2013 0.00 2.85 1.492 0.90 10
2/7/2013 0.00 3.17 1.503 0.86 9
2/8/2013 0.10 2.57 1.336 0.83 9
2/9/2013 0.01 1.70 1.155 0.76 9
2/10/2013 0.00 2.25 1.182 0.74 11
2/11/2013 0.00 2.50 1.354 0.75 10
2/12/2013 0.00 2.37 1.283 0.78 9 154 1648 119 1273
2/13/2013 0.00 2.65 1.324 0.72 9
2/14/2013 0.00 2.89 1.354 0.79 10
2/15/2013 2.31 1.274 0.71 10
2/16/2013 1.77 1.108 0.71 9
2/17/2013 0.00 1.53 1.025 0.66 9
2/18/2013 0.00 2.69 1.169 0.63 9
2/19/2013 0.11 2.27 1.186 0.68 9 155 1533 143 1414
2/20/2013 0.10 2.49 1.235 0.65 9
2/21/2013 2.17 1.138 0.57 10
2/22/2013 0.00 2.24 1.130 0.62 10
2/23/2013 0.00 1.44 0.963 0.58 9

Village of Wellsville
Influent
Date PrecipInstant
Max. Flow
Daily Avg
Flow
Q,MGD
Instant Min
Flow
Daily
Influent
Temp
Influent
BOD, mg/L
Influent
BOD,
#/day
Influent
TSS, mg/L
Influent TSS,
#/day
Influent
TKN, mg/L
Influent
TKN, #/day
Total Monthly
Leachate
Treated (gal.)
Monthly
Leachate
Treated (gpd)
Monthly
Leachate
Treated
(MGD)
2/24/2013 0.00 1.94 0.970 0.57 8
2/25/2013 0.00 2.15 1.080 0.50 10
2/26/2013 0.46 2.38 1.079 0.54 9 174 1566 170 1530
2/27/2013 0.38 2.15 1.289 0.73 10
2/28/2013 0.12 2.58 1.344 0.74 10
3/1/2013 3.11 1.233 0.60 10
3/2/2013 1.84 1.071 0.64 9
3/3/2013 0.01 1.74 1.030 0.59 9
3/4/2013 0.00 2.37 1.219 0.61 10
3/5/2013 0.00 1.99 1.161 0.62 9 170 1646 179 1733
3/6/2013 0.00 2.27 1.171 0.56 10
3/7/2013 2.45 1.214 0.59 9
3/8/2013 0.00 2.36 1.151 0.62 9
3/9/2013 0.00 1.98 1.183 0.71 9
3/10/2013 0.00 2.17 1.282 0.80 8
3/11/2013 0.22 3.12 1.709 1.09 9
3/12/2013 0.10 3.16 1.736 0.90 10 123 1781 142 2056
3/13/2013 0.06 2.52 1.573 0.86 10
3/14/2013 0.00 2.56 1.479 0.85 9
3/15/2013 0.00 2.77 1.426 0.83 10
3/16/2013 0.00 1.75 1.175 0.73 9

Village of Wellsville
Influent
Date PrecipInstant
Max. Flow
Daily Avg
Flow
Q,MGD
Instant Min
Flow
Daily
Influent
Temp
Influent
BOD, mg/L
Influent
BOD,
#/day
Influent
TSS, mg/L
Influent TSS,
#/day
Influent
TKN, mg/L
Influent
TKN, #/day
Total Monthly
Leachate
Treated (gal.)
Monthly
Leachate
Treated (gpd)
Monthly
Leachate
Treated
(MGD)
3/17/2013 0.00 2.07 1.155 0.71 8
3/18/2013 0.22 2.57 1.324 0.72 9
3/19/2013 0.11 2.62 1.344 0.72 9 130 1457 146 1637
3/20/2013 0.02 2.17 1.273 0.68 9
3/21/2013 2.30 1.221 0.01 10
3/22/2013 0.00 2.41 1.185 0.67 10
3/23/2013 0.00 1.78 1.047 0.61 10
3/24/2013 0.00 1.80 1.069 0.63 10
3/25/2013 0.00 2.16 1.178 0.57 10
3/26/2013 0.00 2.28 1.187 0.60 11 117 1158 164 1624
3/27/2013 0.05 2.16 1.190 0.62 10
3/28/2013 0.00 1.99 1.174 0.55 10
3/29/2013 0.00 2.09 1.150 0.56 11
3/30/2013 0.00 1.86 1.010 0.58 8
3/31/2013 0.00 1.86 1.043 0.59 8
4/1/2013 0.20 2.58 1.252 0.65 10
4/2/2013 0.00 2.35 1.191 0.64 10 147 1460 161 1599
4/3/2013 0.00 2.52 1.214 0.57 10
4/4/2013 0.00 2.08 1.132 0.59 12
4/5/2013 0.00 2.24 1.127 0.63 11
4/6/2013 0.00 1.51 0.986 0.60 10
4/7/2013 0.00 1.78 0.988 0.57 9
4/8/2013 0.00 2.26 1.119 0.58 11
4/9/2013 0.17 2.36 1.163 0.64 12 186 1804 236 2289
4/10/2013 1.38 2.50 2.344 0.70 12
4/11/2013 0.03 2.84 1.863 1.08 11
4/12/2013 0.00 2.70 2.606 1.60 10
4/13/2013 0.00 2.61 1.843 1.36 10
4/14/2013 2.36 1.636 1.14 10
4/15/2013 0.00 2.83 1.658 1.02 12
4/16/2013 0.90 2.90 1.672 1.00 11 110 1534 115 1604
4/17/2013 0.00 2.70 1.580 0.94 12
4/18/2013 0.00 2.80 1.555 0.97 12
4/19/2013 0.00 2.29 1.542 0.98 13
4/20/2013 0.00 1.98 1.318 0.88 10
4/21/2013 0.00 2.04 1.236 0.78 11
4/22/2013 0.00 2.55 1.348 0.74 12
4/23/2013 0.00 3.33 1.299 0.72 12 137 1484 154 1668
4/24/2013 0.50 2.46 1.384 0.76 12
4/25/2013 0.00 2.49 1.309 0.73 12
4/26/2013 0.00 2.03 1.230 0.69 12
4/27/2013 0.00 1.84 1.076 0.68 12
4/28/2013 0.20 2.57 1.091 0.66 12
4/29/2013 0.00 2.34 1.201 0.64 13
4/30/2013 0.00 2.50 1.167 0.70 13 152 1479 156 1518
5/1/2013 0.00 2.22 1.196 0.61 14
5/2/2013 0.00 2.23 1.163 0.57 14
5/3/2013 0.00 1.91 1.069 0.59 15
5/4/2013 0.00 1.43 0.956 0.59 14
5/5/2013 0.00 1.65 0.965 0.54 14
5/6/2013 0.00 2.08 1.129 0.52 14
5/7/2013 0.00 2.08 1.019 0.55 15 238 2023 330 2804
5/8/2013 0.63 2.14 1.156 0.67 15
5/9/2013 0.64 3.62 1.562 0.75 15
5/10/2013 0.00 2.42 1.351 0.87 15
5/11/2013 0.45 1.87 1.221 0.75 13
5/12/2013 0.05 1.68 1.118 0.68 13
5/13/2013 0.00 2.42 1.258 0.66 14
5/14/2013 0.00 2.06 1.139 0.56 14 210 1995 155 1472
5/15/2013 0.00 2.26 1.185 0.60 15
5/16/2013 0.00 2.73 1.164 0.54 15
5/17/2013 0.00 2.34 1.068 0.54 15
5/18/2013 0.00 1.48 0.920 0.55 14
5/19/2013 0.00 1.87 0.948 0.53 14
5/20/2013 0.00 2.52 1.084 0.52 16
5/21/2013 0.00 2.22 1.031 0.51 16 181 1556 183 1574
5/22/2013 0.22 2.67 1.069 0.50 18
5/23/2013 1.00 3.17 1.368 0.64 17
5/24/2013 0.05 2.43 1.164 0.60 16
5/25/2013 0.00 1.65 0.969 0.57 15
5/26/2013 0.00 1.68 0.903 0.55 14
5/27/2013 0.00 1.94 0.979 0.48 15
5/28/2013 1.63 4.82 2.074 0.91 16 165 2854 230 3978
5/29/2013 0.00 3.26 1.735 0.94 16
5/30/2013 0.00 3.07 1.490 0.82 16
5/31/2013 0.00 4.03 1.289 0.85 17
6/1/2013 0.04 1.94 1.078 0.70 16
6/2/2013 0.40 1.77 1.168 0.64 15
6/3/2013 0.00 2.51 1.248 0.63 17
6/4/2013 0.00 2.49 1.183 0.54 17 174 1717 160 1579 9 91
6/5/2013 0.00 2.22 1.149 0.56 17
6/6/2013 0.80 4.67 1.619 0.70 17
6/7/2013 0.00 2.75 1.487 0.91 17
6/8/2013 0.00 1.85 1.202 0.74 16
6/9/2013 0.00 1.79 1.141 0.72 15
6/10/2013 0.75 3.07 1.790 1.15 17
6/11/2013 0.10 2.82 1.646 0.93 17 177 2430 97 1332 16 224
6/12/2013 0.03 3.17 1.520 0.85 17
6/13/2013 0.53 3.58 1.871 1.07 18
6/14/2013 0.00 3.36 1.525 0.92 17
6/15/2013 0.00 2.17 1.264 0.79 17
6/16/2013 0.02 2.11 1.212 0.77 17
6/17/2013 0.00 3.24 1.326 0.65 17
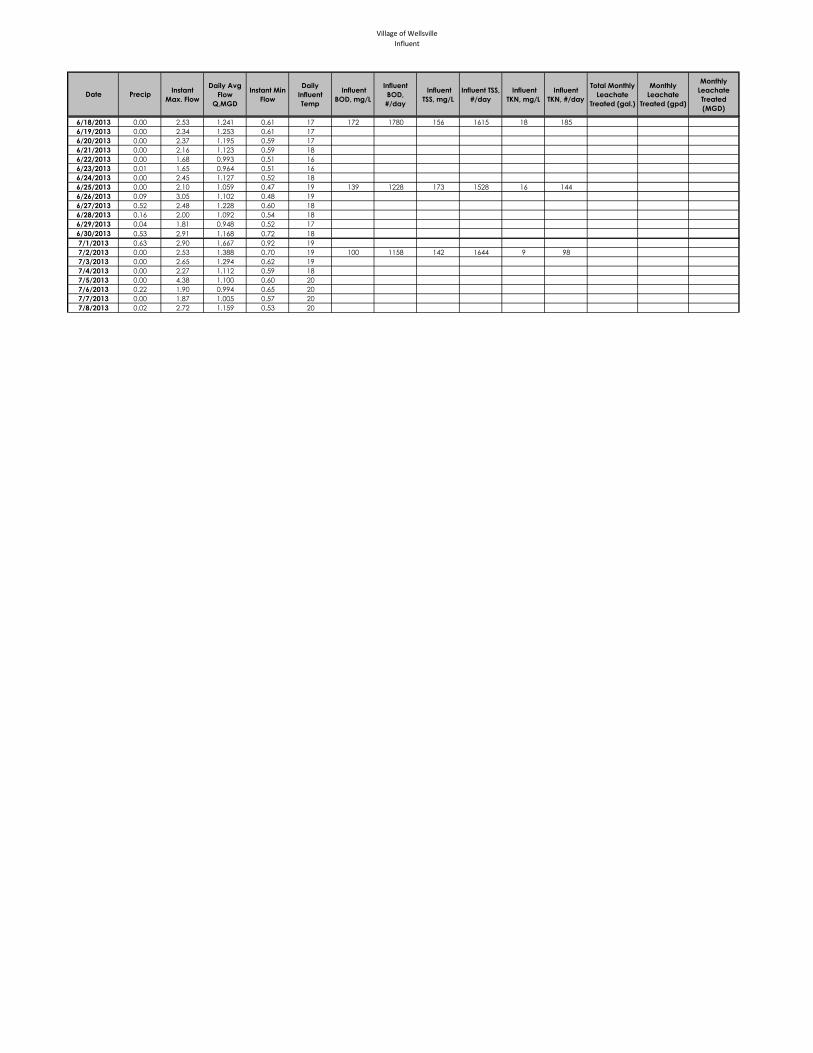
Village of Wellsville
Influent
Date PrecipInstant
Max. Flow
Daily Avg
Flow
Q,MGD
Instant Min
Flow
Daily
Influent
Temp
Influent
BOD, mg/L
Influent
BOD,
#/day
Influent
TSS, mg/L
Influent TSS,
#/day
Influent
TKN, mg/L
Influent
TKN, #/day
Total Monthly
Leachate
Treated (gal.)
Monthly
Leachate
Treated (gpd)
Monthly
Leachate
Treated
(MGD)
6/18/2013 0.00 2.53 1.241 0.61 17 172 1780 156 1615 18 185
6/19/2013 0.00 2.34 1.253 0.61 17
6/20/2013 0.00 2.37 1.195 0.59 17
6/21/2013 0.00 2.16 1.123 0.59 18
6/22/2013 0.00 1.68 0.993 0.51 16
6/23/2013 0.01 1.65 0.964 0.51 16
6/24/2013 0.00 2.45 1.127 0.52 18
6/25/2013 0.00 2.10 1.059 0.47 19 139 1228 173 1528 16 144
6/26/2013 0.09 3.05 1.102 0.48 19
6/27/2013 0.52 2.48 1.228 0.60 18
6/28/2013 0.16 2.00 1.092 0.54 18
6/29/2013 0.04 1.81 0.948 0.52 17
6/30/2013 0.53 2.91 1.168 0.72 18
7/1/2013 0.63 2.90 1.667 0.92 19
7/2/2013 0.00 2.53 1.388 0.70 19 100 1158 142 1644 9 98
7/3/2013 0.00 2.65 1.294 0.62 19
7/4/2013 0.00 2.27 1.112 0.59 18
7/5/2013 0.00 4.38 1.100 0.60 20
7/6/2013 0.22 1.90 0.994 0.65 20
7/7/2013 0.00 1.87 1.005 0.57 20
7/8/2013 0.02 2.72 1.159 0.53 20

Village of Wellsville
Influent
Date PrecipInstant
Max. Flow
Daily Avg
Flow
Q,MGD
Instant Min
Flow
Daily
Influent
Temp
Influent
BOD, mg/L
Influent
BOD,
#/day
Influent
TSS, mg/L
Influent TSS,
#/day
Influent
TKN, mg/L
Influent
TKN, #/day
Total Monthly
Leachate
Treated (gal.)
Monthly
Leachate
Treated (gpd)
Monthly
Leachate
Treated
(MGD)
7/9/2013 0.00 2.13 1.079 0.49 19 165 1485 148 1332 17 153
7/10/2013 0.15 2.04 1.131 0.46 19
7/11/2013 0.00 2.42 1.121 0.49 19
7/12/2013 0.00 1.93 0.971 0.49 18
7/13/2013 0.00 1.71 0.879 0.47 18
7/14/2013 0.00 1.39 0.847 0.45 20
7/15/2013 0.00 2.44 1.016 0.41 20
7/16/2013 0.00 2.09 0.962 0.37 20 216 1733 175 1404 20 164
7/17/2013 0.00 2.30 1.010 0.42 20
7/18/2013 0.70 3.54 1.111 0.40 21
7/19/2013 0.00 2.11 1.000 0.43 21
7/20/2013 0.00 1.66 0.872 0.40 21
7/21/2013 1.95 0.834 0.40 19
7/22/2013 0.90 2.57 1.194 0.48 21
7/23/2013 0.24 2.05 1.138 0.50 21 156 1481 194 1841 18 175
7/24/2013 0.00 1.98 1.003 0.46 20
7/25/2013 0.00 2.46 1.111 0.50 20
7/26/2013 0.00 2.03 0.938 0.44 20
7/27/2013 0.50 1.70 0.953 0.54 19
7/28/2013 0.02 2.13 0.938 0.48 19
7/29/2013 0.00 2.29 0.999 0.43 20
7/30/2013 0.00 2.40 0.970 0.40 20 249 2014 238 1925 22 176
7/31/2013 0.00 2.00 0.977 0.41 20
8/1/2013 0.03 2.21 0.972 0.04 20
8/2/2013 0.00 2.21 0.909 0.35 21
8/3/2013 0.00 1.59 0.744 0.37 18
8/4/2013 0.00 1.33 0.766 0.36 18
8/5/2013 0.00 2.14 0.932 0.37 20
8/6/2013 0.00 2.19 0.891 0.38 20 305 2266 446 3314 29 214
8/7/2013 0.00 2.36 0.948 0.37 20
8/8/2013 0.42 2.56 0.983 0.33 20
8/9/2013 0.45 2.48 0.984 0.40 21
8/10/2013 0.00 1.64 0.758 0.37 20
8/11/2013 0.00 1.68 0.754 0.37 18
8/12/2013 0.54 2.27 1.003 0.39 20
8/13/2013 0.06 2.40 0.969 0.35 21 172 1390 200 1616 17 141
8/14/2013 0.00 2.50 0.841 0.30 20
8/15/2013 0.00 1.90 0.889 0.32 20
8/16/2013 0.00 2.25 0.854 0.30 20
8/17/2013 0.00 1.30 0.653 0.28 18
8/18/2013 0.00 1.63 0.700 0.27 19
8/19/2013 0.00 2.25 0.806 0.29 20
8/20/2013 0.00 1.96 0.853 0.27 20 211 1501 197 1401 26 184
8/21/2013 0.00 2.08 0.808 0.27 20
8/22/2013 0.10 2.18 0.866 0.33 20
8/23/2013 0.00 2.21 0.797 0.27 21
8/24/2013 0.00 1.52 0.664 0.30 19
8/25/2013 0.00 1.17 0.632 0.24 19
8/26/2013 0.00 2.08 0.903 0.30 21
8/27/2013 0.77 4.70 0.944 0.30 21 252 1984 268 2110 25 196
8/28/2013 0.20 4.45 0.994 0.33 21
8/29/2013 0.00 2.34 0.901 0.28 21
8/30/2013 0.00 2.22 0.856 0.30 20
8/31/2013 0.00 1.30 0.670 0.20 21
9/1/2013 0.18 1.92 0.654 0.30 21
9/2/2013 0.05 1.97 0.793 0.26 20
9/3/2013 0.05 2.13 0.818 0.29 21 309 2108 204 1392 23 153
9/4/2013 0.00 2.18 0.932 0.41 21
9/5/2013 0.00 2.17 0.793 0.28 21
9/6/2013 0.00 1.83 0.773 0.25 20
9/7/2013 0.50 1.46 0.676 0.25 19
9/8/2013 0.00 1.28 0.669 0.26 19
9/9/2013 0.01 1.69 0.808 0.30 20
9/10/2013 0.00 1.81 0.816 0.32 21 187 1273 228 1552 26 178
9/11/2013 0.76 2.28 1.009 0.37 21
9/12/2013 0.35 2.81 1.051 0.38 21
9/13/2013 0.05 2.12 0.808 0.29 20
9/14/2013 0.00 1.38 0.692 0.31 19
9/15/2013 0.00 1.25 0.687 0.28 18
9/16/2013 0.00 2.05 0.866 0.27 20
9/17/2013 0.00 1.83 0.815 0.28 19 279 1896 252 1713 23 153
9/18/2013 0.00 2.23 0.833 0.28 20
9/19/2013 0.00 3.12 0.869 0.25 19
9/20/2013 0.00 1.68 0.649 0.25 20
9/21/2013 0.90 1.85 0.874 0.34 19
9/22/2013 0.00 1.85 0.736 0.32 19
9/23/2013 0.00 2.08 0.763 0.28 19
9/24/2013 0.00 1.96 0.785 0.27 19 260 1702 234 1532 20 133
9/25/2013 0.00 1.98 0.805 0.26 19
9/26/2013 0.00 1.91 0.740 0.28 20
9/27/2013 0.00 1.84 0.768 0.27 19
9/28/2013 0.00 1.35 0.606 0.24 17
9/29/2013 0.00 1.21 0.613 0.20 17
9/30/2013 0.00 1.86 0.756 0.22 18
10/1/2013 0.00 1.91 0.737 0.27 19 260 1598 258 1586 31 192
10/2/2013 0.00 2.06 0.773 0.24 19
10/3/2013 0.20 2.21 0.777 0.27 19
10/4/2013 0.00 1.79 0.624 0.30 20
10/5/2013 0.26 3.75 0.925 0.44 19
10/6/2013 1.25 2.12 0.887 0.38 19
10/7/2013 0.50 2.41 1.137 0.49 19
10/8/2013 0.00 2.11 0.923 0.40 19 171 1316 202 1555 19 149
10/9/2013 0.00 2.10 0.901 0.37 19

Village of Wellsville
Influent
Date PrecipInstant
Max. Flow
Daily Avg
Flow
Q,MGD
Instant Min
Flow
Daily
Influent
Temp
Influent
BOD, mg/L
Influent
BOD,
#/day
Influent
TSS, mg/L
Influent TSS,
#/day
Influent
TKN, mg/L
Influent
TKN, #/day
Total Monthly
Leachate
Treated (gal.)
Monthly
Leachate
Treated (gpd)
Monthly
Leachate
Treated
(MGD)
10/10/2013 0.02 1.89 0.870 0.36 19
10/11/2013 0.00 1.89 0.864 0.40 18
10/12/2013 0.00 1.47 0.706 0.35 16
10/13/2013 0.50 1.53 0.823 0.44 17
10/14/2013 0.03 3.62 0.922 0.00 19
10/15/2013 0.00 2.22 0.875 0.38 18 189 1379 254 1854 21 151
10/16/2013 0.20 2.00 0.924 0.46 18
10/17/2013 0.69 3.21 1.287 0.70 18
10/18/2013 0.00 2.44 1.015 0.49 18
10/19/2013 0.00 1.38 0.879 0.53 17
10/20/2013 0.00 1.47 0.863 0.50 17
10/21/2013 0.04 2.33 0.928 0.43 17
10/22/2013 0.10 1.99 0.962 0.45 18 292 2343 172 1380 23 181
10/23/2013 0.02 2.88 0.973 0.45 18
10/24/2013 0.14 1.67 0.915 0.41 17
10/25/2013 0.00 2.10 0.858 0.36 17
10/26/2013 0.00 1.67 0.704 0.36 15
10/27/2013 0.05 1.41 0.729 0.35 15
10/28/2013 0.00 2.11 0.859 0.33 16
10/29/2013 0.00 1.94 0.856 0.33 17 190 1356 188 1342 27 190
10/30/2013 0.00 2.32 0.876 0.33 18

Village of Wellsville
Influent
Date PrecipInstant
Max. Flow
Daily Avg
Flow
Q,MGD
Instant Min
Flow
Daily
Influent
Temp
Influent
BOD, mg/L
Influent
BOD,
#/day
Influent
TSS, mg/L
Influent TSS,
#/day
Influent
TKN, mg/L
Influent
TKN, #/day
Total Monthly
Leachate
Treated (gal.)
Monthly
Leachate
Treated (gpd)
Monthly
Leachate
Treated
(MGD)
10/31/2013 1.04 2.88 1.282 0.66 17
11/1/2013 0.00 2.60 1.252 0.40 17
11/2/2013 0.00 1.78 0.908 0.48 15
11/3/2013 0.00 3.02 0.852 0.44 14
11/4/2013 0.00 3.50 0.949 0.42 14
11/5/2013 0.00 3.50 0.907 0.48 15 152 1150 39 297
11/6/2013 0.54 4.15 1.077 0.53 16
11/7/2013 0.10 4.34 1.142 0.61 16
11/8/2013 4.61 1.031 0.00 15
11/9/2013 0.00 2.13 0.682 0.00 14
11/10/2013 0.28 2.01 0.680 0.00 14
11/11/2013 1.44 0.880 0.00 14
11/12/2013 2.24 1.079 0.55 14 146 1314 166 1494
11/13/2013 0.00 2.68 1.067 0.56 15
11/14/2013 0.00 2.17 1.046 0.51 14
11/15/2013 0.00 2.50 0.963 0.53 13
11/16/2013 0.00 1.44 0.833 0.49 13
11/17/2013 0.52 2.32 1.169 0.61 14
11/18/2013 0.00 2.52 1.284 0.69 13
11/19/2013 0.00 2.23 1.160 0.66 14 166 1605 254 2456
11/20/2013 0.00 2.08 1.107 0.61 13
11/21/2013 0.20 2.40 1.173 0.58 13
11/22/2013 0.00 2.39 1.042 0.58 14
11/23/2013 0.00 1.89 0.921 0.52 13
11/24/2013 0.01 1.57 0.895 0.51 12
11/25/2013 0.00 2.42 1.063 0.49 14
11/26/2013 1.18 3.20 1.546 0.80 13 156 2011 334 4306
11/27/2013 0.10 3.03 1.653 0.88 12
11/28/2013 2.27 1.230 0.77 9
11/29/2013 0.00 2.77 1.160 0.66 11
11/30/2013 0.00 1.90 1.086 0.68 10
12/1/2013 0.00 1.69 1.032 0.64 10
12/2/2013 0.00 2.14 1.209 0.68 12
12/3/2013 0.00 2.50 1.242 0.60 12 163 1688 155 1606
12/4/2013 0.30 2.79 1.309 0.76 13
12/5/2013 0.00 2.58 1.473 0.93 12
12/6/2013 0.00 2.70 1.484 0.80 12
12/7/2013 1.92 1.208 0.82 10
12/8/2013 0.00 1.76 1.162 0.78 12
12/9/2013 0.01 2.33 1.266 0.73 12
12/10/2013 0.01 2.39 1.187 0.64 12 134 1327 160 1584
12/11/2013 0.03 2.83 1.159 0.64 12
12/12/2013 0.00 2.34 1.034 0.58 12
12/13/2013 0.04 2.00 0.974 0.52 11
12/14/2013 0.37 1.43 0.899 0.51 11
12/15/2013 0.01 1.86 0.944 0.52 11
12/16/2013 0.03 2.43 1.017 0.42 12 267 2265 600 5089
12/17/2013 0.04 1.92 0.989 0.55 11
12/18/2013 0.00 2.13 1.084 0.51 11
12/19/2013 0.00 2.68 1.187 0.48 10
12/20/2013 0.40 2.74 1.545 0.48 12
12/21/2013 0.60 5.00 3.117 1.57 11
12/22/2013 0.20 3.95 2.640 1.65 11
12/23/2013 0.00 3.48 1.982 1.30 11
12/24/2013 0.00 2.50 1.606 1.05 11 121 1621 170 2277
12/25/2013 0.04 2.50 1.382 0.98 10
12/26/2013 0.00 2.88 1.546 0.92 11
12/27/2013 0.04 3.10 1.395 0.86 11
12/28/2013 0.00 2.33 1.220 0.78 11
12/29/2013 0.20 2.27 1.560 1.05 11
12/30/2013 0.00 4.11 1.472 0.01 11
12/31/2013 0.01 3.07 1.339 0.81 9
1/1/2014 0.08 2.33 1.196 0.78 10 99 987 91 908
1/2/2014 0.30 2.70 1.319 0.77 11
1/3/2014 0.00 2.25 1.264 0.60 10
1/4/2014 0.00 2.02 1.124 0.65 9
1/5/2014 0.30 3.16 1.431 0.89 10
1/6/2014 0.13 3.10 1.723 0.70 9
1/7/2014 0.00 2.90 1.455 0.72 9 145 1760 164 1990
1/8/2014 0.00 2.06 1.299 0.74 10
1/9/2014 0.00 3.20 1.424 0.70 10
1/10/2014 0.07 3.80 1.295 0.80 11
1/11/2014 0.43 3.10 1.830 0.94 11
1/12/2014 0.00 2.15 1.454 0.96 10
1/13/2014 0.12 3.10 1.605 1.15 10
1/14/2014 3.17 1.720 1.01 10 89 1277 140 2008
1/15/2014 0.00 3.01 1.564 0.96 11
1/16/2014 2.71 1.691 1.20 10
1/17/2014 0.14 2.90 1.631 0.95 10
1/18/2014 0.00 2.26 1.199 0.77 10
1/19/2014 0.00 2.02 1.204 0.76 9
1/20/2014 0.01 2.60 1.327 0.74 10
1/21/2014 0.00 2.39 1.273 0.71 9 133 1412 150 1593
1/22/2014 2.12 1.223 0.68 9
1/23/2014 1.88 1.180 0.65 9
1/24/2014 0.00 2.35 1.131 0.67 9
1/25/2014 0.00 1.86 1.056 0.61 9
1/26/2014 0.01 2.05 1.029 0.62 9
1/27/2014 0.05 2.09 1.066 0.61 9
1/28/2014 0.00 2.31 1.087 0.58 10 199 1804 246 2230
1/29/2014 0.00 2.38 1.302 0.88 8
1/30/2014 0.00 2.65 1.372 0.91 10
1/31/2014 0.00 2.47 1.107 0.54 9

Village of Wellsville
Influent
Date PrecipInstant
Max. Flow
Daily Avg
Flow
Q,MGD
Instant Min
Flow
Daily
Influent
Temp
Influent
BOD, mg/L
Influent
BOD,
#/day
Influent
TSS, mg/L
Influent TSS,
#/day
Influent
TKN, mg/L
Influent
TKN, #/day
Total Monthly
Leachate
Treated (gal.)
Monthly
Leachate
Treated (gpd)
Monthly
Leachate
Treated
(MGD)
2/1/2014 0.75 1.91 0.989 0.55 9
2/2/2014 0.00 1.64 0.990 0.49 9
2/3/2014 0.00 2.43 1.095 0.53 10
2/4/2014 0.22 1.76 0.994 0.54 9 231 1915 149 1235
2/5/2014 0.34 2.15 1.007 0.48 9
2/6/2014 0.00 2.49 1.038 0.50 10
2/7/2014 0.00 3.10 0.984 0.50 10
2/8/2014 0.00 2.75 0.889 0.52 9
2/9/2014 0.10 1.75 0.821 0.51 9
2/10/2014 0.00 2.17 1.009 0.53 9
2/11/2014 0.00 1.90 0.938 0.51 10 236 1846 223 1745
2/12/2014 0.00 2.26 1.204 0.02 10
2/13/2014 0.13 3.08 1.283 0.80 9
2/14/2014 0.00 2.12 1.040 0.53 10
2/15/2014 0.00 2.18 0.887 0.51 7
2/16/2014 0.07 1.94 0.841 0.47 7
2/17/2014 0.01 2.22 0.965 0.49 9
2/18/2014 0.06 2.03 0.987 0.51 8 84 691 155 1276
2/19/2014 0.00 2.26 1.097 0.49 9
2/20/2014 0.30 2.65 1.376 0.76 8
2/21/2014 0.21 3.29 1.662 0.74 8

Village of Wellsville
Influent
Date PrecipInstant
Max. Flow
Daily Avg
Flow
Q,MGD
Instant Min
Flow
Daily
Influent
Temp
Influent
BOD, mg/L
Influent
BOD,
#/day
Influent
TSS, mg/L
Influent TSS,
#/day
Influent
TKN, mg/L
Influent
TKN, #/day
Total Monthly
Leachate
Treated (gal.)
Monthly
Leachate
Treated (gpd)
Monthly
Leachate
Treated
(MGD)
2/22/2014 0.14 2.37 1.292 0.78 11
2/23/2014 0.00 2.43 1.344 0.80 9
2/24/2014 0.01 2.62 1.313 0.72 9
2/25/2014 2.09 1.220 0.67 9 149 1516 180 1831
2/26/2014 0.00 2.21 1.216 0.66 8
2/27/2014 2.46 1.239 0.61 9
2/28/2014 0.00 2.43 1.097 0.57 9
3/1/2014 0.10 1.60 0.938 0.52 8
3/2/2014 0.07 1.41 0.939 0.55 8
3/3/2014 0.00 3.51 1.043 0.50 8
3/4/2014 0.00 2.77 1.098 0.53 8 163 1493 145 1328
3/5/2014 0.00 3.66 1.052 0.51 9
3/6/2014 0.00 2.08 1.034 0.50 8
3/7/2014 0.00 1.77 1.067 0.49 10
3/8/2014 0.00 1.46 0.867 0.46 8
3/9/2014 0.00 1.52 0.882 0.49 9
3/10/2014 0.00 2.28 1.362 0.86 9
3/11/2014 0.05 2.31 1.515 0.93 10 158 1996 298 3765
3/12/2014 0.82 3.56 1.800 0.97 8
3/13/2014 0.00 3.08 1.430 0.81 8
3/14/2014 0.00 3.68 2.128 1.40 8
3/15/2014 0.00 2.74 1.897 1.19 8
3/16/2014 0.00 2.43 1.428 0.95 9
3/17/2014 0.00 2.42 1.399 0.80 8
3/18/2014 0.00 2.58 1.411 0.82 9 130 1530 114 1342
3/19/2014 0.28 2.96 1.640 1.10 9
3/20/2014 2.84 1.551 0.94 9
3/21/2014 0.00 2.55 1.422 0.93 9
3/22/2014 0.00 1.83 1.356 0.93 8
3/23/2014 0.02 2.31 1.268 0.83 8
3/24/2014 0.01 2.78 1.334 0.79 9
3/25/2014 2.19 1.247 0.75 8 379 3942 1244 12938
3/26/2014 2.28 1.277 0.70 7
3/27/2014 0.10 2.49 1.272 0.62 8
3/28/2014 2.31 1.197 0.77 8
3/29/2014 0.88 3.34 1.765 1.05 8
3/30/2014 0.00 2.33 1.654 1.11 6
3/31/2014 0.00 3.10 1.848 1.22 8
4/1/2014 0.00 2.75 1.681 1.15 9 111 1556 121 1696
4/2/2014 0.00 2.50 1.632 1.05 9
4/3/2014 0.18 3.01 1.718 1.00 9
4/4/2014 0.00 3.18 2.169 1.10 9
4/5/2014 0.00 2.64 1.775 1.26 8
4/6/2014 0.00 2.09 1.580 1.14 9
4/7/2014 0.78 2.80 1.917 1.08 9
4/8/2014 0.07 3.79 2.557 1.02 8 52 1109 97 2069
4/9/2014 0.00 3.26 2.040 1.43 10
4/10/2014 0.00 2.89 1.919 1.27 10
4/11/2014 0.00 3.36 2.005 1.24 10
4/12/2014 0.00 2.69 1.653 1.20 9
4/13/2014 0.00 2.47 1.572 1.11 9
4/14/2014 0.00 2.85 1.643 1.30 11
4/15/2014 0.00 3.76 2.340 1.56 10
4/16/2014 4.34 1.929 1.30 10 80 1287 84 1351
4/17/2014 0.00 3.50 1.775 1.18 10
4/18/2014 0.00 4.87 1.650 1.11 11
4/19/2014 0.00 2.31 1.435 1.02 10
4/20/2014 0.00 2.13 1.385 0.97 10
4/21/2014 0.00 2.62 1.510 0.91 11
4/22/2014 0.12 2.50 1.495 0.94 12 105 1309 129 1608
4/23/2014 0.00 2.24 1.430 0.85 12
4/24/2014 0.10 2.50 1.352 0.82 11
4/25/2014 0.10 2.27 1.281 0.76 11
4/26/2014 0.00 1.88 1.129 0.73 11
4/27/2014 0.00 1.59 1.110 0.73 10
4/28/2014 0.00 3.14 1.305 0.70 12
4/29/2014 0.15 2.24 1.266 0.74 13 101 1066 140 1478
4/30/2014 0.84 2.88 1.737 1.20 13
5/1/2014 0.06 2.74 1.609 1.00 12
5/2/2014 0.00 2.80 1.453 1.00 13
5/3/2014 0.36 2.12 1.347 1.02 12
5/4/2014 0.00 2.01 1.328 0.90 11
5/5/2014 0.00 2.52 1.402 0.82 13
5/6/2014 0.00 2.20 1.324 0.77 13 136 1502 120 1325
5/7/2014 0.03 2.96 1.291 0.73 13
5/8/2014 0.05 2.46 1.311 0.67 13
5/9/2014 0.23 2.64 1.221 0.78 14
5/10/2014 0.00 1.91 1.091 0.69 13
5/11/2014 0.00 1.70 1.031 0.67 13
5/12/2014 0.00 2.35 1.236 0.69 14
5/13/2014 0.60 2.96 1.527 0.83 15 94 1197 171 2178
5/14/2014 0.22 2.35 1.425 0.93 15
5/15/2014 1.55 2.50 2.250 1.05 14
5/16/2014 0.59 2.72 3.743 1.02 14
5/17/2014 0.00 3.23 2.417 1.85 14
5/18/2014 0.00 2.67 1.963 1.50 14
5/19/2014 0.00 3.18 1.887 1.27 14
5/20/2014 0.33 3.15 1.789 1.30 14 86 1283 100 1492
5/21/2014 0.52 3.16 2.164 1.60 14
5/22/2014 0.05 2.90 1.920 1.30 14
5/23/2014 0.04 2.90 1.700 1.14 14
5/24/2014 0.00 2.45 1.459 1.05 12
5/25/2014 0.00 2.10 1.332 0.95 13

Village of Wellsville
Influent
Date PrecipInstant
Max. Flow
Daily Avg
Flow
Q,MGD
Instant Min
Flow
Daily
Influent
Temp
Influent
BOD, mg/L
Influent
BOD,
#/day
Influent
TSS, mg/L
Influent TSS,
#/day
Influent
TKN, mg/L
Influent
TKN, #/day
Total Monthly
Leachate
Treated (gal.)
Monthly
Leachate
Treated (gpd)
Monthly
Leachate
Treated
(MGD)
5/26/2014 0.00 2.07 1.314 0.87 13
5/27/2014 0.37 3.12 1.541 0.95 15 179 2300 358 4601
5/28/2014 0.00 3.08 1.420 0.83 15
5/29/2014 0.00 2.44 1.367 0.86 15
5/30/2014 0.00 2.39 1.228 0.74 14
5/31/2014 0.00 1.74 1.072 0.70 15
6/1/2014 0.00 1.55 1.038 0.68 14
6/2/2014 0.00 2.37 1.367 1.00 16
6/3/2014 0.45 2.86 1.258 0.71 16 120 1259 163 1710 20 205
6/4/2014 0.00 2.34 1.224 0.63 17
6/5/2014 0.00 2.17 1.159 0.65 16
6/6/2014 0.00 2.01 1.035 0.60 16
6/7/2014 0.00 1.64 0.953 0.57 16
6/8/2014 1.13 3.52 1.488 0.84 16
6/9/2014 0.00 2.79 1.400 0.77 16
6/10/2014 0.18 2.31 1.388 0.84 17 106 1227 205 2373 24 276
6/11/2014 0.30 2.03 1.372 0.93 17
6/12/2014 0.19 2.56 1.409 0.85 17
6/13/2014 0.00 2.23 1.259 0.74 17
6/14/2014 0.00 1.72 1.090 0.71 15
6/15/2014 0.00 2.39 1.071 0.66 15
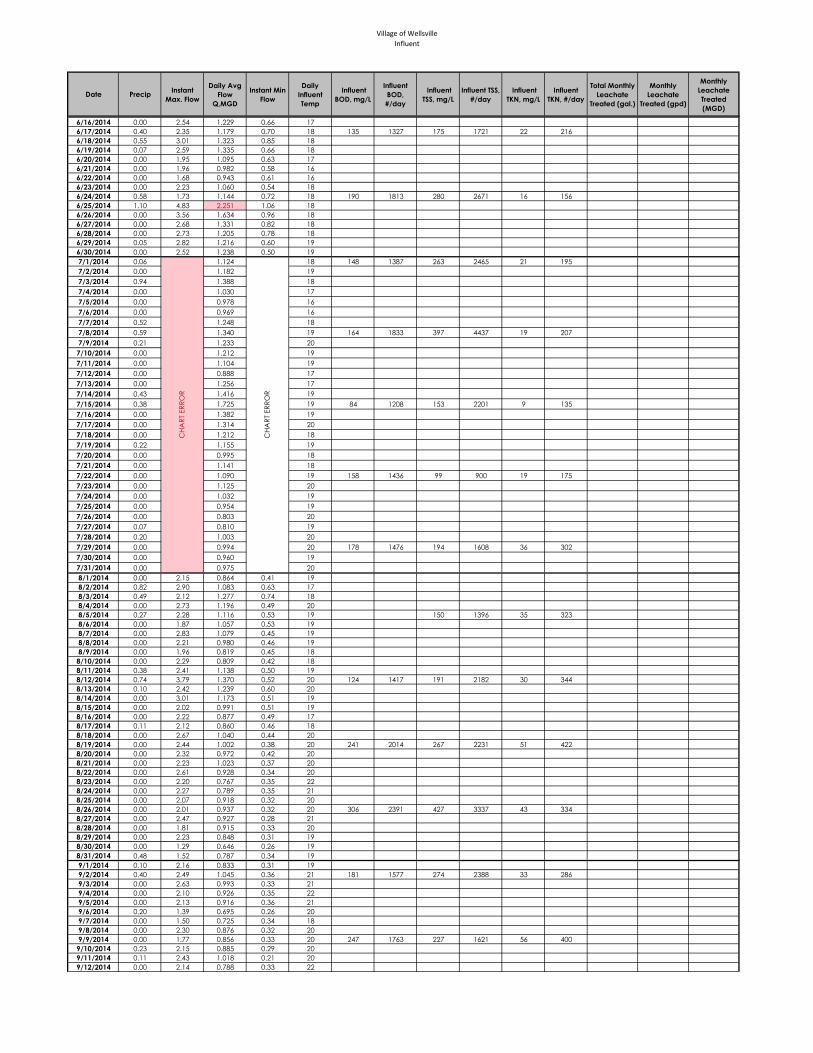
Village of Wellsville
Influent
Date PrecipInstant
Max. Flow
Daily Avg
Flow
Q,MGD
Instant Min
Flow
Daily
Influent
Temp
Influent
BOD, mg/L
Influent
BOD,
#/day
Influent
TSS, mg/L
Influent TSS,
#/day
Influent
TKN, mg/L
Influent
TKN, #/day
Total Monthly
Leachate
Treated (gal.)
Monthly
Leachate
Treated (gpd)
Monthly
Leachate
Treated
(MGD)
6/16/2014 0.00 2.54 1.229 0.66 17
6/17/2014 0.40 2.35 1.179 0.70 18 135 1327 175 1721 22 216
6/18/2014 0.55 3.01 1.323 0.85 18
6/19/2014 0.07 2.59 1.335 0.66 18
6/20/2014 0.00 1.95 1.095 0.63 17
6/21/2014 0.00 1.96 0.982 0.58 16
6/22/2014 0.00 1.68 0.943 0.61 16
6/23/2014 0.00 2.23 1.060 0.54 18
6/24/2014 0.58 1.73 1.144 0.72 18 190 1813 280 2671 16 156
6/25/2014 1.10 4.83 2.251 1.06 18
6/26/2014 0.00 3.56 1.634 0.96 18
6/27/2014 0.00 2.68 1.331 0.82 18
6/28/2014 0.00 2.73 1.205 0.78 18
6/29/2014 0.05 2.82 1.216 0.60 19
6/30/2014 0.00 2.52 1.238 0.50 19
7/1/2014 0.06 1.124 18 148 1387 263 2465 21 195
7/2/2014 0.00 1.182 19
7/3/2014 0.94 1.388 18
7/4/2014 0.00 1.030 17
7/5/2014 0.00 0.978 16
7/6/2014 0.00 0.969 16
7/7/2014 0.52 1.248 18
7/8/2014 0.59 1.340 19 164 1833 397 4437 19 207
7/9/2014 0.21 1.233 20
7/10/2014 0.00 1.212 19
7/11/2014 0.00 1.104 19
7/12/2014 0.00 0.888 17
7/13/2014 0.00 1.256 17
7/14/2014 0.43 1.416 19
7/15/2014 0.38 1.725 19 84 1208 153 2201 9 135
7/16/2014 0.00 1.382 19
7/17/2014 0.00 1.314 20
7/18/2014 0.00 1.212 18
7/19/2014 0.22 1.155 19
7/20/2014 0.00 0.995 18
7/21/2014 0.00 1.141 18
7/22/2014 0.00 1.090 19 158 1436 99 900 19 175
7/23/2014 0.00 1.125 20
7/24/2014 0.00 1.032 19
7/25/2014 0.00 0.954 19
7/26/2014 0.00 0.803 20
7/27/2014 0.07 0.810 19
7/28/2014 0.20 1.003 20
7/29/2014 0.00 0.994 20 178 1476 194 1608 36 302
7/30/2014 0.00 0.960 19
7/31/2014 0.00 0.975 20
8/1/2014 0.00 2.15 0.864 0.41 19
8/2/2014 0.82 2.90 1.083 0.63 17
8/3/2014 0.49 2.12 1.277 0.74 18
8/4/2014 0.00 2.73 1.196 0.49 20
8/5/2014 0.27 2.28 1.116 0.53 19 150 1396 35 323
8/6/2014 0.00 1.87 1.057 0.53 19
8/7/2014 0.00 2.83 1.079 0.45 19
8/8/2014 0.00 2.21 0.980 0.46 19
8/9/2014 0.00 1.96 0.819 0.45 18
8/10/2014 0.00 2.29 0.809 0.42 18
8/11/2014 0.38 2.41 1.138 0.50 19
8/12/2014 0.74 3.79 1.370 0.52 20 124 1417 191 2182 30 344
8/13/2014 0.10 2.42 1.239 0.60 20
8/14/2014 0.00 3.01 1.173 0.51 19
8/15/2014 0.00 2.02 0.991 0.51 19
8/16/2014 0.00 2.22 0.877 0.49 17
8/17/2014 0.11 2.12 0.860 0.46 18
8/18/2014 0.00 2.67 1.040 0.44 20
8/19/2014 0.00 2.44 1.002 0.38 20 241 2014 267 2231 51 422
8/20/2014 0.00 2.32 0.972 0.42 20
8/21/2014 0.00 2.23 1.023 0.37 20
8/22/2014 0.00 2.61 0.928 0.34 20
8/23/2014 0.00 2.20 0.767 0.35 22
8/24/2014 0.00 2.27 0.789 0.35 21
8/25/2014 0.00 2.07 0.918 0.32 20
8/26/2014 0.00 2.01 0.937 0.32 20 306 2391 427 3337 43 334
8/27/2014 0.00 2.47 0.927 0.28 21
8/28/2014 0.00 1.81 0.915 0.33 20
8/29/2014 0.00 2.23 0.848 0.31 19
8/30/2014 0.00 1.29 0.646 0.26 19
8/31/2014 0.48 1.52 0.787 0.34 19
9/1/2014 0.10 2.16 0.833 0.31 19
9/2/2014 0.40 2.49 1.045 0.36 21 181 1577 274 2388 33 286
9/3/2014 0.00 2.63 0.993 0.33 21
9/4/2014 0.00 2.10 0.926 0.35 22
9/5/2014 0.00 2.13 0.916 0.36 21
9/6/2014 0.20 1.39 0.695 0.26 20
9/7/2014 0.00 1.50 0.725 0.34 18
9/8/2014 0.00 2.30 0.876 0.32 20
9/9/2014 0.00 1.77 0.856 0.33 20 247 1763 227 1621 56 400
9/10/2014 0.23 2.15 0.885 0.29 20
9/11/2014 0.11 2.43 1.018 0.21 20
9/12/2014 0.00 2.14 0.788 0.33 22
CH
AR
T ER
RO
R
CH
AR
T ER
RO
R
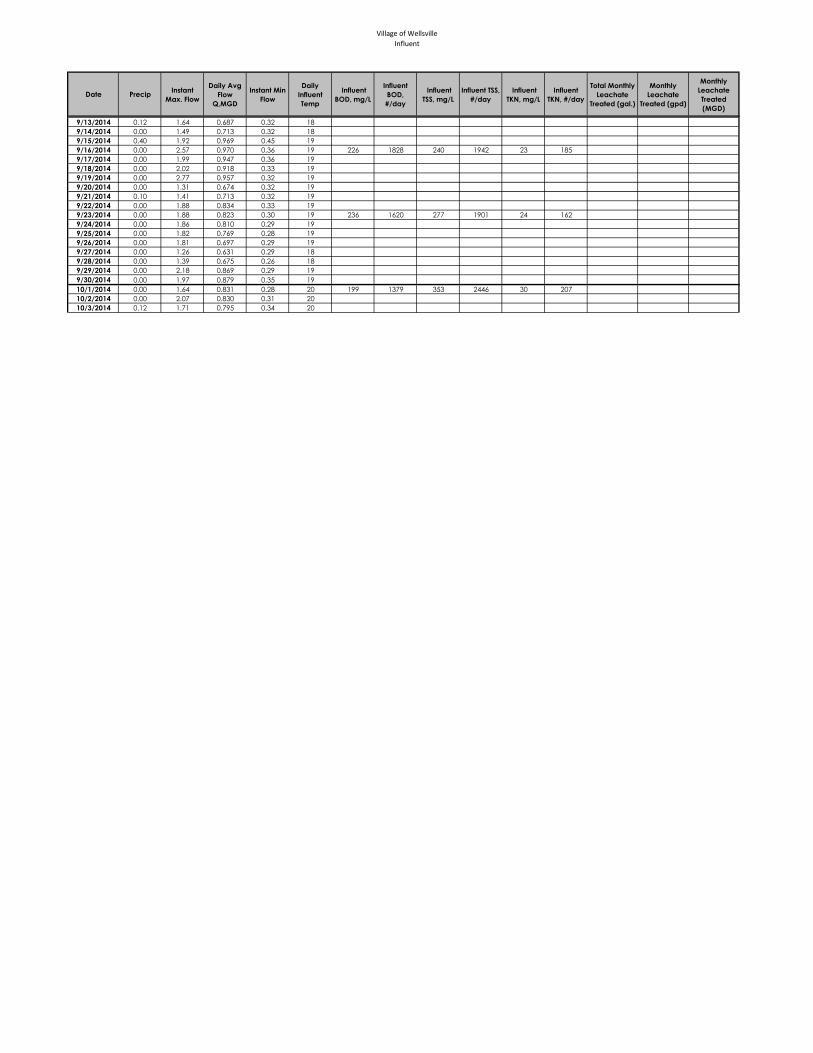
Village of Wellsville
Influent
Date PrecipInstant
Max. Flow
Daily Avg
Flow
Q,MGD
Instant Min
Flow
Daily
Influent
Temp
Influent
BOD, mg/L
Influent
BOD,
#/day
Influent
TSS, mg/L
Influent TSS,
#/day
Influent
TKN, mg/L
Influent
TKN, #/day
Total Monthly
Leachate
Treated (gal.)
Monthly
Leachate
Treated (gpd)
Monthly
Leachate
Treated
(MGD)
9/13/2014 0.12 1.64 0.687 0.32 18
9/14/2014 0.00 1.49 0.713 0.32 18
9/15/2014 0.40 1.92 0.969 0.45 19
9/16/2014 0.00 2.57 0.970 0.36 19 226 1828 240 1942 23 185
9/17/2014 0.00 1.99 0.947 0.36 19
9/18/2014 0.00 2.02 0.918 0.33 19
9/19/2014 0.00 2.77 0.957 0.32 19
9/20/2014 0.00 1.31 0.674 0.32 19
9/21/2014 0.10 1.41 0.713 0.32 19
9/22/2014 0.00 1.88 0.834 0.33 19
9/23/2014 0.00 1.88 0.823 0.30 19 236 1620 277 1901 24 162
9/24/2014 0.00 1.86 0.810 0.29 19
9/25/2014 0.00 1.82 0.769 0.28 19
9/26/2014 0.00 1.81 0.697 0.29 19
9/27/2014 0.00 1.26 0.631 0.29 18
9/28/2014 0.00 1.39 0.675 0.26 18
9/29/2014 0.00 2.18 0.869 0.29 19
9/30/2014 0.00 1.97 0.879 0.35 19
10/1/2014 0.00 1.64 0.831 0.28 20 199 1379 353 2446 30 207
10/2/2014 0.00 2.07 0.830 0.31 20
10/3/2014 0.12 1.71 0.795 0.34 20

Village of Wellsville
Influent
Date PrecipInstant
Max. Flow
Daily Avg
Flow
Q,MGD
Instant Min
Flow
Daily
Influent
Temp
Influent
BOD, mg/L
Influent
BOD,
#/day
Influent
TSS, mg/L
Influent TSS,
#/day
Influent
TKN, mg/L
Influent
TKN, #/day
Total Monthly
Leachate
Treated (gal.)
Monthly
Leachate
Treated (gpd)
Monthly
Leachate
Treated
(MGD)
10/4/2014 0.08 1.28 0.662 0.36 18
10/5/2014 0.00 1.37 0.693 0.33 18
10/6/2014 0.20 1.87 0.844 0.35 18
10/7/2014 0.16 2.11 0.930 0.45 18 223 1730 378 2932 30 233
10/8/2014 0.00 1.80 0.845 0.33 19
10/9/2014 0.00 2.07 0.853 0.31 19
10/10/2014 0.10 1.48 0.725 0.32 18
10/11/2014 0.00 1.35 0.619 0.28 17
10/12/2014 0.00 1.27 0.633 0.27 17
10/13/2014 0.00 1.89 0.834 0.32 16
10/14/2014 0.00 1.53 0.754 0.26 18 201 1264 354 2226 24 153
10/15/2014 0.70 2.68 1.036 0.39 19
10/16/2014 0.01 2.68 0.921 0.33 19
10/17/2014 0.00 1.94 0.775 0.32 18
10/18/2014 0.20 1.40 0.701 0.33 17
10/19/2014 0.00 1.91 0.718 0.30 16
10/20/2014 0.12 1.88 0.877 0.39 17
10/21/2014 0.28 2.01 0.985 0.38 18 187 1536 344 2826 21 174
10/22/2014 0.02 2.02 0.908 0.37 17
10/23/2014 0.00 2.15 0.829 0.36 17
10/24/2014 0.00 2.31 0.831 0.34 17
10/25/2014 0.00 1.24 0.673 0.34 16
10/26/2014 0.00 1.27 0.669 0.31 16
10/27/2014 0.00 1.74 0.818 0.28 16
10/28/2014 0.40 2.14 0.931 0.41 17 L
10/29/2014 0.02 2.00 0.913 0.36 17 244 1858 670 5102 26 194
10/30/2014 0.00 1.92 0.890 0.35 16
10/31/2014 0.00 2.11 0.831 0.41 16
11/1/2014 0.00 1.40 0.725 0.39 15
11/2/2014 0.00 1.43 0.784 0.40 15
11/3/2014 0.00 2.17 0.946 0.35 15
11/4/2014 0.17 2.30 0.893 0.36 16 210 1564 298 2219 17 127
11/5/2014 0.00 1.92 0.896 0.37 16
11/6/2014 0.70 3.28 1.294 0.61 15
11/7/2014 0.00 2.46 1.003 0.48 16
11/8/2014 0.10 1.72 0.835 0.46 15
11/9/2014 0.00 1.95 0.837 0.41 14
11/10/2014 0.00 2.26 0.956 0.41 15
11/11/2014 0.01 2.17 0.873 0.39 15 251 1827 227 1653
11/12/2014 0.00 2.50 0.950 0.39 15
11/13/2014 0.08 2.07 0.946 0.40 15
11/14/2014 0.02 1.90 0.874 0.39 14
11/15/2014 0.03 1.34 0.731 0.38 14
11/16/2014 0.06 1.42 0.768 0.36 14
11/17/2014 0.23 2.30 1.122 0.49 14
11/18/2014 0.00 2.41 0.990 0.40 14 202 1668 195 1610
11/19/2014 0.01 2.07 0.961 0.40 13
11/20/2014 0.05 1.98 0.939 0.40 15
11/21/2014 0.00 2.23 0.846 0.35 13
11/22/2014 0.00 1.42 0.750 0.40 12
11/23/2014 0.18 1.54 0.859 0.44 12
11/24/2014 0.02 2.71 1.032 0.41 13
11/25/2014 0.00 2.20 0.970 0.40 13 189 1529 199 1610
11/26/2014 0.10 2.84 0.984 0.39 11
11/27/2014 0.05 1.64 0.826 0.38 14
11/28/2014 0.00 1.46 0.784 0.39 13
11/29/2014 0.00 1.50 0.737 0.35 13
11/30/2014 0.03 1.72 0.804 0.37 13
12/1/2014 0.00 1.97 0.906 0.40 13
12/2/2014 0.18 1.97 0.972 0.50 12 200 1621 235 1905
12/3/2014 0.01 2.24 1.000 0.45 13
12/4/2014 0.00 1.83 0.941 0.41 12
12/5/2014 0.27 2.86 1.056 0.52 12
12/6/2014 0.50 2.87 1.426 0.66 10
12/7/2014 0.00 1.70 1.053 0.59 13
12/8/2014 0.00 2.66 1.153 0.55 13
12/9/2014 0.01 2.09 1.081 0.48 13 184 1659 177 1596
12/10/2014 0.48 2.45 1.083 0.55 13
12/11/2014 0.20 2.43 1.017 0.52 10
12/12/2014 0.00 2.38 0.962 0.48 11
12/13/2014 0.00 1.85 0.862 0.48 11
12/14/2014 0.00 1.62 0.974 0.60 12
12/15/2014 0.00 2.42 1.198 0.65 11
12/16/2014 0.20 2.60 1.424 0.90 12 111 1318 148 1758
12/17/2014 0.02 2.74 1.387 0.75 10
12/18/2014 0.02 2.65 1.244 0.65 12
12/19/2014 0.00 2.48 1.112 0.59 11
12/20/2014 0.00 2.17 0.959 0.57 11
12/21/2014 0.00 2.00 0.938 0.54 11
12/22/2014 0.00 2.60 1.104 0.52 13
12/23/2014 0.00 2.15 1.070 0.51 11 124 1107 150 1339
12/24/2014 0.20 2.19 1.113 0.59 12
12/25/2014 0.00 1.97 1.041 0.63 11
12/26/2014 0.25 2.39 1.080 0.56 12
12/27/2014 0.00 2.03 1.050 0.67 11
12/28/2014 0.00 2.13 1.082 0.62 11
12/29/2014 2.64 1.175 0.56 12
12/30/2014 2.70 1.064 0.52 12 136 1207 136 1207
12/31/2014 2.14 1.043 0.54 11
1/1/2015 0.00 1.60 0.967 0.50 9
1/2/2015 0.00 2.13 1.024 0.55 10
1/3/2015 0.00 2.19 1.107 0.58 9
1/4/2015 0.00 2.69 1.360 0.77 11

Village of Wellsville
Influent
Date PrecipInstant
Max. Flow
Daily Avg
Flow
Q,MGD
Instant Min
Flow
Daily
Influent
Temp
Influent
BOD, mg/L
Influent
BOD,
#/day
Influent
TSS, mg/L
Influent TSS,
#/day
Influent
TKN, mg/L
Influent
TKN, #/day
Total Monthly
Leachate
Treated (gal.)
Monthly
Leachate
Treated (gpd)
Monthly
Leachate
Treated
(MGD)
1/5/2015 0.00 2.13 1.240 0.61 10
1/6/2015 0.02 2.23 1.220 0.67 10 180 1831 147 1496 25 256
1/7/2015 0.03 2.69 1.166 0.65 9
1/8/2015 0.11 2.09 1.111 0.62 10
1/9/2015 0.00 2.05 1.024 0.55 11
1/10/2015 0.00 1.66 0.887 0.49 11
1/11/2015 0.05 1.59 0.902 0.51 10
1/12/2015 0.16 2.57 1.042 0.53 12
1/13/2015 0.16 1.99 1.016 0.49 11 162 1373 215 1822
1/14/2015 0.00 2.34 1.038 0.54 11
1/15/2015 0.00 1.93 1.028 0.54 11
1/16/2015 0.00 2.24 0.981 0.49 11
1/17/2015 0.00 1.84 0.869 0.48 9
1/18/2015 0.04 2.15 0.908 0.48 12
1/19/2015 0.00 2.48 1.052 0.47 10
1/20/2015 0.00 2.20 0.976 0.48 11
1/21/2015 0.06 2.14 0.979 0.44 9
1/22/2015 0.00 3.12 0.987 0.39 11 182 1498 225 1852
1/23/2015 0.00 1.85 0.899 0.41 10
1/24/2015 0.00 1.91 0.812 0.41 9
1/25/2015 0.01 1.93 0.816 0.37 9

Village of Wellsville
Influent
Date PrecipInstant
Max. Flow
Daily Avg
Flow
Q,MGD
Instant Min
Flow
Daily
Influent
Temp
Influent
BOD, mg/L
Influent
BOD,
#/day
Influent
TSS, mg/L
Influent TSS,
#/day
Influent
TKN, mg/L
Influent
TKN, #/day
Total Monthly
Leachate
Treated (gal.)
Monthly
Leachate
Treated (gpd)
Monthly
Leachate
Treated
(MGD)
1/26/2015 0.31 3.83 0.990 0.39 10
1/27/2015 0.00 2.31 0.951 0.43 9 172 1364 324 2570
1/28/2015 0.00 1.90 0.955 0.42 10
1/29/2015 0.05 2.33 0.967 0.39 11
1/30/2015 0.00 2.60 0.906 0.39 9
1/31/2015 0.00 1.27 0.748 0.38 9
2/1/2015 0.40 1.30 0.763 0.35 10
2/2/2015 0.40 2.32 0.967 0.39 9
2/3/2015 0.00 2.42 1.222 0.80 9 187 1906 217 2212
2/4/2015 0.19 2.01 0.971 0.38 10
2/5/2015 0.01 2.01 1.016 0.40 9
2/6/2015 0.22 2.40 1.059 0.35 9
2/7/2015 0.00 1.41 0.790 0.38 9
2/8/2015 0.00 1.51 0.843 0.38 10
2/9/2015 0.08 2.79 0.936 0.38 10
2/10/2015 0.00 1.96 0.953 0.37 10 180 1431 194 1542
2/11/2015 0.06 2.73 1.005 0.42 11
2/12/2015 0.04 1.94 1.002 0.39 9
2/13/2015 0.00 1.95 0.883 0.39 10
2/14/2015 0.20 1.39 1.057 0.59 9
2/15/2015 0.00 1.41 0.935 0.61 7
2/16/2015 0.00 2.27 1.346 0.91 7
2/17/2015 0.00 2.22 1.090 0.43 10 232 2109 343 3118
2/18/2015 0.05 1.93 0.968 0.43 9
2/19/2015 2.98 1.059 0.45 8
2/20/2015 0.00 1.92 0.980 0.40 9
2/21/2015 0.00 1.64 1.199 0.90 9
2/22/2015 0.06 1.82 1.010 0.36 9
2/23/2015 0.00 1.90 0.949 0.38 9
2/24/2015 0.00 2.73 1.260 0.40 9
2/25/2015 0.05 3.21 0.959 0.50 9 191 1528 340 2719
2/26/2015 0.00 3.19 1.067 0.60 8
2/27/2015 0.00 2.02 1.206 0.72 7
2/28/2015 0.00 1.78 1.099 0.73 6
3/1/2015 0.18 1.99 1.087 0.69 8
3/2/2015 0.00 2.29 1.154 0.37 10
3/3/2015 0.30 2.12 1.111 0.43 9 168 1557 215 1992
3/4/2015 2.35 1.038 0.39 9
3/5/2015 0.00 2.17 0.996 0.39 9
3/6/2015 0.00 2.08 0.931 0.34 9
3/7/2015 0.00 1.50 0.773 0.39 8
3/8/2015 0.00 1.94 0.837 0.34 10
3/9/2015 0.00 2.13 1.046 0.48 9
3/10/2015 0.02 1.95 1.119 0.61 10 202 1885 323 3014
3/11/2015 0.00 2.68 1.600 0.90 9
3/12/2015 0.00 2.34 1.410 0.80 7
3/13/2015 0.15 2.38 1.474 0.95 8
3/14/2015 0.00 2.80 2.044 1.36 8
3/15/2015 0.00 2.86 1.576 1.02 7
3/16/2015 0.05 2.99 2.005 0.96 9
3/17/2015 0.01 3.22 2.113 1.37 9 96 1692 179 3154
3/18/2015 0.00 2.86 1.699 1.10 8
3/19/2015 0.00 2.59 1.592 0.99 8
3/20/2015 0.04 2.64 1.476 0.95 10
3/21/2015 0.00 2.46 1.489 1.05 8
3/22/2015 0.00 1.96 1.347 0.93 7
3/23/2015 0.00 2.46 1.440 0.84 11
3/24/2015 0.00 2.30 1.389 0.83 9 154 1784 190 2201
3/25/2015 0.11 2.39 1.420 0.84 9
3/26/2015 0.35 2.85 1.913 1.27 8
3/27/2015 0.01 2.57 1.568 1.03 9
3/28/2015 0.00 2.24 1.375 0.92 8
3/29/2015 0.01 2.20 1.307 0.90 8
3/30/2015 0.00 2.42 1.490 0.97 8
3/31/2015 2.54 1.429 0.89 9
4/1/2015 0.00 2.60 1.388 1.30 9 125 1447 153 1771
4/2/2015 0.13 2.51 1.684 1.32 9
4/3/2015 0.00 2.47 1.990 1.28 9
4/4/2015 0.28 2.46 1.734 1.26 7
4/5/2015 0.31 2.52 1.775 1.42 7
4/6/2015 0.01 3.60 1.968 1.20 9
4/7/2015 0.42 3.66 2.076 1.37 10 95 1645 179 3099
4/8/2015 0.05 3.82 2.414 1.65 9
4/9/2015 0.40 3.37 2.498 1.96 9
4/10/2015 0.00 3.86 2.405 1.74 9
4/11/2015 0.00 2.67 1.908 1.48 9
4/12/2015 0.00 2.70 1.808 1.31 8
4/13/2015 0.54 3.15 2.100 1.17 11
4/14/2015 0.00 2.96 2.009 1.37 11 77 1290 102 1709
4/15/2015 0.00 3.24 1.797 1.22 10
4/16/2015 0.13 2.45 1.705 1.16 11
4/17/2015 0.00 3.29 1.688 1.13 11
4/18/2015 0.00 2.65 1.515 1.01 10
4/19/2015 0.19 2.47 1.485 1.05 11
4/20/2015 0.65 3.40 2.109 1.46 12
4/21/2015 0.10 3.23 2.016 1.35 11 99 1665 108 1816
4/22/2015 0.20 3.17 2.033 1.42 11
4/23/2015 0.00 2.97 1.866 1.30 11
4/24/2015 0.00 3.28 1.733 1.15 10
4/25/2015 0.00 2.51 1.547 1.09 10
4/26/2015 0.00 2.22 1.445 1.03 10
4/27/2015 0.00 2.48 1.511 0.95 11
4/28/2015 0.00 2.92 1.474 0.94 12 143 1758 253 3110

Village of Wellsville
Influent
Date PrecipInstant
Max. Flow
Daily Avg
Flow
Q,MGD
Instant Min
Flow
Daily
Influent
Temp
Influent
BOD, mg/L
Influent
BOD,
#/day
Influent
TSS, mg/L
Influent TSS,
#/day
Influent
TKN, mg/L
Influent
TKN, #/day
Total Monthly
Leachate
Treated (gal.)
Monthly
Leachate
Treated (gpd)
Monthly
Leachate
Treated
(MGD)
4/29/2015 0.00 2.44 1.409 0.89 13
4/30/2015 0.00 2.20 1.350 0.84 13
5/1/2015 0.00 2.99 1.313 0.79 13
5/2/2015 0.00 1.86 1.128 0.76 11
5/3/2015 0.00 0.86 1.135 0.76 11
5/4/2015 0.00 2.74 1.252 0.69 13
5/5/2015 0.08 2.52 1.214 0.68 13 123 1245 196 1984
5/6/2015 0.00 2.46 1.195 0.67 14
5/7/2015 0.00 1.85 1.173 0.62 14
5/8/2015 0.00 3.45 1.154 0.61 15
5/9/2015 0.00 1.89 0.949 0.64 14
5/10/2015 0.08 2.47 0.987 0.62 14
5/11/2015 0.22 2.23 1.173 0.65 16
5/12/2015 0.23 2.67 1.187 0.62 16 165 1633 187 1851
5/13/2015 0.00 2.11 1.116 0.61 15
5/14/2015 0.00 2.59 1.252 0.64 15
5/15/2015 0.20 2.84 1.093 0.62 15
5/16/2015 0.20 1.95 0.941 0.60 14
5/17/2015 0.00 1.57 0.929 0.59 14
5/18/2015 0.17 2.24 1.137 0.61 16
5/19/2015 0.00 2.12 1.088 0.58 17
5/20/2015 0.00 2.29 1.151 0.60 16 157 1507 272 2611
5/21/2015 2.35 1.100 0.53 16
5/22/2015 0.00 1.94 1.002 0.54 16
5/23/2015 0.00 1.67 0.872 0.49 14
5/24/2015 0.00 1.81 0.844 0.50 15
5/25/2015 0.00 1.51 0.849 0.48 15
5/26/2015 0.00 2.25 0.977 0.47 16 178 1450 302 2461
5/27/2015 0.20 2.06 1.011 0.47 17
5/28/2015 0.00 2.11 0.993 0.45 17
5/29/2015 0.00 2.15 0.875 0.47 17
5/30/2015 0.31 1.46 0.778 0.50 18
5/31/2015 0.51 2.23 1.078 0.47 16
6/1/2015 0.02 1.97 0.994 0.49 16
6/2/2015 0.00 2.11 0.977 0.46 17 139 1133 324 2640 21 172
6/3/2015 0.00 2.03 0.965 0.45 17
6/4/2015 2.11 0.959 0.41 17
6/5/2015 0.00 2.05 0.864 0.41 17
6/6/2015 0.00 1.42 0.743 0.36 16
6/7/2015 0.00 1.41 0.796 0.38 15
6/8/2015 1.43 2.50 1.533 0.72 17
6/9/2015 0.35 2.60 1.596 0.80 17 103 1371 170 2263
6/10/2015 0.05 2.72 1.365 0.78 18
6/11/2015 0.00 1.93 1.207 0.58 18
6/12/2015 0.12 2.10 1.082 0.54 19
6/13/2015 0.37 1.68 0.878 0.52 17
6/14/2015 0.23 1.80 1.097 0.61 17
6/15/2015 0.17 1.90 1.330 0.65 19
6/16/2015 0.02 2.16 1.178 0.56 18 158 1552 252 2476
6/17/2015 0.00 2.53 1.101 0.54 18
6/18/2015 0.01 2.16 1.106 0.53 18
6/19/2015 0.00 2.00 0.997 0.44 18
6/20/2015 0.07 1.46 0.822 0.50 19
6/21/2015 0.06 2.04 0.864 0.47 19
6/22/2015 0.00 2.23 1.046 0.48 19
6/23/2015 0.38 2.09 1.054 0.52 19 177 1556 394 3463
6/24/2015 0.00 2.28 0.937 0.47 19
6/25/2015 0.00 2.15 0.970 0.42 18
6/26/2015 0.33 2.19 0.879 0.43 19
6/27/2015 0.87 2.90 1.662 0.54 17
6/28/2015 0.43 1.78 1.241 0.83 17
6/29/2015 0.10 3.01 1.272 0.69 17
6/30/2015 0.60 3.51 1.534 0.80 18
7/1/2015 0.10 2.94 1.377 0.80 18 125 1436 270 3101
7/2/2015 0.00 2.89 1.330 0.68 18
7/3/2015 0.00 2.35 1.065 0.63 17
7/4/2015 0.00 1.58 0.900 0.58 17
7/5/2015 0.00 1.69 0.914 0.55 17
7/6/2015 0.00 2.19 1.043 0.55 18
7/7/2015 0.50 2.03 1.118 0.61 18 269 2508 484 4513 32 302
7/8/2015 0.02 2.70 1.071 0.62 19
7/9/2015 0.45 2.40 1.215 0.63 19
7/10/2015 0.02 2.29 1.108 0.50 18
7/11/2015 0.00 1.66 0.875 0.52 17
7/12/2015 0.00 1.47 0.869 0.52 17
7/13/2015 0.00 1.88 0.959 0.52 19
7/14/2015 0.40 2.69 1.130 0.55 19 192 1809 374 3525 19 179
7/15/2015 0.00 2.30 0.990 0.49 20
7/16/2015 0.00 2.23 0.967 0.46 19
7/17/2015 0.00 2.70 1.007 0.42 19
7/18/2015 0.00 1.68 0.780 0.37 19
7/19/2015 0.03 1.64 0.786 0.38 19
7/20/2015 0.00 2.33 0.902 0.43 19
7/21/2015 0.24 2.08 0.957 0.39 21 295 2355 977 7798 34 271
7/22/2015 0.00 2.09 0.916 0.36 20
7/23/2015 0.00 2.06 0.913 0.38 19
7/24/2015 0.00 2.12 0.844 0.35 19
7/25/2015 0.00 1.45 0.679 0.33 18
7/26/2015 0.00 1.41 0.706 0.33 19
7/27/2015 0.00 1.90 0.853 0.35 21
7/28/2015 0.00 1.65 0.876 0.36 20 146 1067 280 2046 26 189
7/29/2015 0.00 2.02 0.892 0.33 21
7/30/2015 0.35 2.21 0.980 0.33 22

Village of Wellsville
Effluent
Date
Avg. Daily
Flow
Q,MGD
Daily
Effluent
Temp
Effluent
BOD, mg/L
Effluent
BOD, #/day
Effluent
TSS, mg/L
Effluent TSS,
#/day
Effluent
TKN, mg/L
Effluent
TKN, #/day
Effluent
NH3, mg/L
Influent
NH3, #/day
Effluent TP,
mg/L
Effluent TP,
#/day
Effluent
Alum, mg/L
Effluent
Alum,
#/day8/1/2012 1.058 21 9.00 79.41 13.00 114.71 7.30 64.41 0.20 1.76 0.70 6.18 0.09 0.76
8/2/2012 0.941 22
8/3/2012 0.872 22
8/4/2012 0.713 21
8/5/2012 0.702 21
8/6/2012 0.830 22
8/7/2012 0.805 22 10.00 67.14 8.00 53.71 5.90 39.61 0.10 0.67 0.60 4.03
8/8/2012 0.793 22
8/9/2012 0.903 22
8/10/2012 0.868 22
8/11/2012 0.675 22
8/12/2012 0.664 20
8/13/2012 0.808 21
8/14/2012 0.755 22 8.00 50.37 8.00 50.37 3.50 22.04 0.10 0.63 0.50 3.15
8/15/2012 0.762 22
8/16/2012 0.824 22
8/17/2012 0.818 21
8/18/2012 0.641 20
8/19/2012 0.653 19
8/20/2012 0.820 19
8/21/2012 0.740 20 9.00 55.54 10.00 61.72 7.00 43.20 1.70 10.49 0.70 4.32
8/22/2012 0.732 20
8/23/2012 0.753 21
8/24/2012 0.680 21
8/25/2012 0.574 21
8/26/2012 0.591 21
8/27/2012 0.918 22
8/28/2012 0.769 22 10.00 64.13 9.00 57.72 6.80 43.61 1.20 7.70 0.70 4.49
8/29/2012 0.835 21
8/30/2012 0.791 20
8/31/2012 0.808 19
9/1/2012 0.666 19
9/2/2012 0.647 21
9/3/2012 0.735 21
9/4/2012 1.166 22 12.00 116.69 13.00 126.42 8.20 79.74 0.50 4.86 1.20 11.67 0.07 0.67
9/5/2012 0.904 22
9/6/2012 0.822 22
9/7/2012 0.839 22
9/8/2012 0.821 22
9/9/2012 0.743 19
9/10/2012 0.792 18
9/11/2012 0.792 19 9.00 59.45 7.00 46.24 10.20 67.37 0.10 0.66 0.40 2.64
9/12/2012 0.784 19
9/13/2012 0.810 20
9/14/2012 0.817 21
9/15/2012 0.642 20
9/16/2012 0.685 18
9/17/2012 0.810 18
9/18/2012 1.210 19 11.00 111.01 11.00 111.01 12.20 123.12 0.70 7.06 0.80 8.07
9/19/2012 0.908 19
9/20/2012 0.814 17
9/21/2012 0.750 18
9/22/2012 0.700 19
9/23/2012 0.662 17
9/24/2012 0.877 17
9/25/2012 0.746 16 9.00 55.99 11.00 68.44 10.40 64.71 0.10 0.62 0.70 4.36
9/26/2012 0.750 18
9/27/2012 0.840 18
9/28/2012 0.865 17
9/29/2012 0.688 16
9/30/2012 0.696 16
10/1/2012 0.793 17
10/2/2012 0.826 17 9.00 62.00 10.00 68.89 6.50 44.78 0.10 0.69 1.00 6.89 0.04 0.27
10/3/2012 0.815 19
10/4/2012 0.812 19
10/5/2012 0.775 19
10/6/2012 0.751 18
10/7/2012 0.703 17
10/8/2012 0.893 15
10/9/2012 0.876 15 10.00 73.06 8.00 58.45 8.90 65.02 0.10 0.73 0.80 5.84
10/10/2012 0.915 15
10/11/2012 0.916 15
10/12/2012 0.813 15
10/13/2012 0.768 12
10/14/2012 0.750 14
10/15/2012 0.874 17
10/16/2012 0.840 15 10.00 70.06 6.00 42.03 6.50 45.54 5.20 36.43 0.80 5.60
10/17/2012 0.890 14
10/18/2012 1.134 15
10/19/2012 0.910 16
10/20/2012 0.773 15
10/21/2012 0.771 14
10/22/2012 0.931 15
10/23/2012 1.846 15 le 26.00 400.29 11.00 169.35 0.60 9.24 1.30 20.01
10/24/2012 1.297 17
10/25/2012 1.167 17
10/26/2012 1.034 18

Village of Wellsville
Effluent
Date
Avg. Daily
Flow
Q,MGD
Daily
Effluent
Temp
Effluent
BOD, mg/L
Effluent
BOD, #/day
Effluent
TSS, mg/L
Effluent TSS,
#/day
Effluent
TKN, mg/L
Effluent
TKN, #/day
Effluent
NH3, mg/L
Influent
NH3, #/day
Effluent TP,
mg/L
Effluent TP,
#/day
Effluent
Alum, mg/L
Effluent
Alum,
#/day
10/27/2012 0.925 16
10/28/2012 1.073 15
10/29/2012 2.110 14
10/30/2012 2.367 14 8.00 157.93 8.00 157.93 3.00 59.22 0.10 1.97 0.50 9.87
10/31/2012 1.790 14
11/1/2012 1.647 14
11/2/2012 1.488 14
11/3/2012 1.296 12
11/4/2012 1.265 11
11/5/2012 1.342 12
11/6/2012 1.270 12 9.00 95.33 16.00 169.47 0.60 6.36 0.11 1.18
11/7/2012 1.060 11
11/8/2012 1.208 11
11/9/2012 1.110 11
11/10/2012 1.007 11
11/11/2012 0.996 12
11/12/2012 1.151 13
11/13/2012 1.154 12 12.00 115.49 20.00 192.49 0.60 5.77
11/14/2012 1.100 12
11/15/2012 1.111 11
11/16/2012 1.021 11
11/17/2012 0.897 9
11/18/2012 0.911 9
11/19/2012 1.048 11
11/20/2012 1.010 11 20.00 168.47 23.00 193.74 0.80 6.74
11/21/2012 1.051 12
11/22/2012 0.945 10
11/23/2012 1.013 10
11/24/2012 0.908 9
11/25/2012 0.925 8
11/26/2012 1.014 9
11/27/2012 1.024 10 11.00 93.94 21.00 179.34 0.80 6.83
11/28/2012 0.995 10
11/29/2012 1.000 10

Village of Wellsville
Effluent
Date
Avg. Daily
Flow
Q,MGD
Daily
Effluent
Temp
Effluent
BOD, mg/L
Effluent
BOD, #/day
Effluent
TSS, mg/L
Effluent TSS,
#/day
Effluent
TKN, mg/L
Effluent
TKN, #/day
Effluent
NH3, mg/L
Influent
NH3, #/day
Effluent TP,
mg/L
Effluent TP,
#/day
Effluent
Alum, mg/L
Effluent
Alum,
#/day
11/30/2012 0.919 10
12/1/2012 0.792 10
12/2/2012 0.986 11
12/3/2012 1.038 13
12/4/2012 1.472 14 15.00 184.15 20.00 245.53 1.20 14.73 0.21 2.52
12/5/2012 1.356 12
12/6/2012 1.254 10
12/7/2012 1.363 10
12/8/2012 1.144 10
12/9/2012 1.244 11
12/10/2012 1.910 12
12/11/2012 1.623 11 13.00 175.97 17.00 230.11 1.00 13.54
12/12/2012 1.474 10
12/13/2012 1.431 10
12/14/2012 1.289 9
12/15/2012 1.103 9
12/16/2012 1.265 10
12/17/2012 2.033 11
12/18/2012 2.486 12 8.00 165.87 13.00 269.53 0.90 18.66
12/19/2012 1.838 11
12/20/2012 1.948 10
12/21/2012 2.133 10
12/22/2012 1.659 9
12/23/2012 1.546 9
12/24/2012 1.615 10
12/25/2012 1.361 10
12/26/2012 1.493 9 10.00 124.52 19.00 236.58 0.60 7.47
12/27/2012 1.362 8
12/28/2012 1.262 9
12/29/2012 1.386 9
12/30/2012 1.227 8
12/31/2012 1.358 9
1/1/2013 1.235 9 11.00 113.30 12.00 123.60 0.50 5.15 0.14 1.40
1/2/2013 1.412 9
1/3/2013 1.339 9
1/4/2013 1.305 9
1/5/2013 1.194 8
1/6/2013 1.199 9
1/7/2013 1.336 10
1/8/2013 1.291 9 14.00 150.74 13.00 139.97 0.80 8.61
1/9/2013 1.385 9
1/10/2013 1.375 10
1/11/2013 1.643 10
1/12/2013 2.081 10
1/13/2013 2.180 10
1/14/2013 1.930 11
1/15/2013 1.775 9 15.00 222.05 15.00 222.05 1.60 23.69
1/16/2013 1.748 10
1/17/2013 1.703 9
1/18/2013 1.542 9
1/19/2013 1.384 9
1/20/2013 1.314 10
1/21/2013 1.417 9
1/22/2013 1.311 7 16.00 174.94 13.00 142.14 0.60 6.56
1/23/2013 1.368 7
1/24/2013 1.269 7
1/25/2013 1.229 7
1/26/2013 1.052 6
1/27/2013 1.069 7
1/28/2013 1.343 9
1/29/2013 1.668 10 33.00 459.07 1.20 16.69
1/30/2013 2.859 11
1/31/2013 2.697 8
2/1/2013 1.993 7
2/2/2013 1.717 6
2/3/2013 1.559 7
2/4/2013 1.640 7
2/5/2013 1.519 8 16.00 202.70 16.00 202.70 0.70 8.87 0.19 2.39
2/6/2013 1.492 9
2/7/2013 1.503 9
2/8/2013 1.336 8
2/9/2013 1.155 8
2/10/2013 1.182 8
2/11/2013 1.354 10
2/12/2013 1.283 8 15.00 160.50 11.00 117.70 0.70 7.49
2/13/2013 1.324 9
2/14/2013 1.354 9
2/15/2013 1.274 9
2/16/2013 1.108 7
2/17/2013 1.025 7
2/18/2013 1.169 6
2/19/2013 1.186 8 16.00 158.26 10.00 98.91 0.60 5.93
2/20/2013 1.235 7
2/21/2013 1.138 7
2/22/2013 1.130 7
2/23/2013 0.963 8
2/24/2013 0.970 8
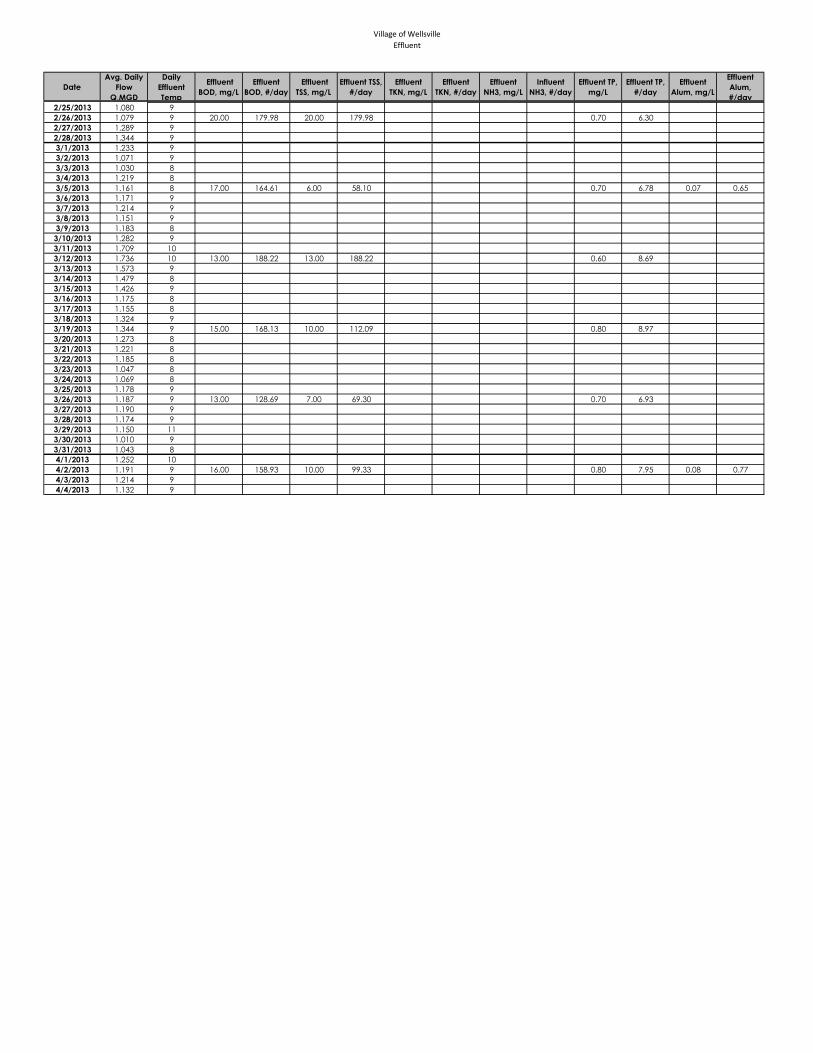
Village of Wellsville
Effluent
Date
Avg. Daily
Flow
Q,MGD
Daily
Effluent
Temp
Effluent
BOD, mg/L
Effluent
BOD, #/day
Effluent
TSS, mg/L
Effluent TSS,
#/day
Effluent
TKN, mg/L
Effluent
TKN, #/day
Effluent
NH3, mg/L
Influent
NH3, #/day
Effluent TP,
mg/L
Effluent TP,
#/day
Effluent
Alum, mg/L
Effluent
Alum,
#/day
2/25/2013 1.080 9
2/26/2013 1.079 9 20.00 179.98 20.00 179.98 0.70 6.30
2/27/2013 1.289 9
2/28/2013 1.344 9
3/1/2013 1.233 9
3/2/2013 1.071 9
3/3/2013 1.030 8
3/4/2013 1.219 8
3/5/2013 1.161 8 17.00 164.61 6.00 58.10 0.70 6.78 0.07 0.65
3/6/2013 1.171 9
3/7/2013 1.214 9
3/8/2013 1.151 9
3/9/2013 1.183 8
3/10/2013 1.282 9
3/11/2013 1.709 10
3/12/2013 1.736 10 13.00 188.22 13.00 188.22 0.60 8.69
3/13/2013 1.573 9
3/14/2013 1.479 8
3/15/2013 1.426 9
3/16/2013 1.175 8
3/17/2013 1.155 8
3/18/2013 1.324 9
3/19/2013 1.344 9 15.00 168.13 10.00 112.09 0.80 8.97
3/20/2013 1.273 8
3/21/2013 1.221 8
3/22/2013 1.185 8
3/23/2013 1.047 8
3/24/2013 1.069 8
3/25/2013 1.178 9
3/26/2013 1.187 9 13.00 128.69 7.00 69.30 0.70 6.93
3/27/2013 1.190 9
3/28/2013 1.174 9
3/29/2013 1.150 11
3/30/2013 1.010 9
3/31/2013 1.043 8
4/1/2013 1.252 10
4/2/2013 1.191 9 16.00 158.93 10.00 99.33 0.80 7.95 0.08 0.77
4/3/2013 1.214 9
4/4/2013 1.132 9

Village of Wellsville
Effluent
Date
Avg. Daily
Flow
Q,MGD
Daily
Effluent
Temp
Effluent
BOD, mg/L
Effluent
BOD, #/day
Effluent
TSS, mg/L
Effluent TSS,
#/day
Effluent
TKN, mg/L
Effluent
TKN, #/day
Effluent
NH3, mg/L
Influent
NH3, #/day
Effluent TP,
mg/L
Effluent TP,
#/day
Effluent
Alum, mg/L
Effluent
Alum,
#/day
4/5/2013 1.127 9
4/6/2013 0.986 8
4/7/2013 0.988 9
4/8/2013 1.119 11
4/9/2013 1.163 13 7.00 67.90 9.00 87.29 0.80 7.76
4/10/2013 2.344 13
4/11/2013 1.863 10
4/12/2013 2.606 10
4/13/2013 1.843 10
4/14/2013 1.636 10
4/15/2013 1.658 11
4/16/2013 1.672 12 8.00 111.56 11.00 153.39 0.50 6.97
4/17/2013 1.580 12
4/18/2013 1.555 12
4/19/2013 1.542 14
4/20/2013 1.318 10
4/21/2013 1.236 9
4/22/2013 1.348 11
4/23/2013 1.299 12 9.00 97.50 21.00 227.51 0.70 7.58
4/24/2013 1.384 12
4/25/2013 1.309 12
4/26/2013 1.230 12
4/27/2013 1.076 11
4/28/2013 1.091 12
4/29/2013 1.201 13
4/30/2013 1.167 14 7.00 68.13 9.00 87.60 0.60 5.84
5/1/2013 1.196 14
5/2/2013 1.163 15
5/3/2013 1.069 15
5/4/2013 0.956 14
5/5/2013 0.965 14
5/6/2013 1.129 15
5/7/2013 1.019 16 10.00 84.98 10.00 84.98 0.98 8.33
5/8/2013 1.156 16
5/9/2013 1.562 15
5/10/2013 1.351 16
5/11/2013 1.221 15
5/12/2013 1.118 14
5/13/2013 1.258 12
5/14/2013 1.139 13 13.00 123.49 9.00 85.49 0.73 6.93 0.12 1.13
5/15/2013 1.185 14
5/16/2013 1.164 16
5/17/2013 1.068 16
5/18/2013 0.920 15
5/19/2013 0.948 15
5/20/2013 1.084 17
5/21/2013 1.031 19 11.00 94.58 18.00 154.77 1.18 10.15
5/22/2013 1.069 19
5/23/2013 1.368 19
5/24/2013 1.164 17
5/25/2013 0.969 17
5/26/2013 0.903 16
5/27/2013 0.979 14
5/28/2013 2.074 15 11.00 190.27 17.00 294.05 0.83 14.36
5/29/2013 1.735 17
5/30/2013 1.490 18
5/31/2013 1.289 19
6/1/2013 1.078 18
6/2/2013 1.168 19
6/3/2013 1.248 18
6/4/2013 1.183 17 9.00 88.80 9.00 88.80 10.10 99.65 8.50 83.86 0.54 5.33 0.09 0.93
6/5/2013 1.149 17
6/6/2013 1.619 17
6/7/2013 1.487 18
6/8/2013 1.202 17
6/9/2013 1.141 17
6/10/2013 1.790 18
6/11/2013 1.646 18 7.00 96.09 3.00 41.18 4.60 63.15 0.40 5.49 0.40 5.49
6/12/2013 1.520 18
6/13/2013 1.871 18
6/14/2013 1.525 17
6/15/2013 1.264 17
6/16/2013 1.212 17
6/17/2013 1.326 18
6/18/2013 1.241 18 7.00 72.45 3.00 31.05 4.60 47.61 0.40 4.14 0.40 4.14
6/19/2013 1.253 17
6/20/2013 1.195 17
6/21/2013 1.123 18
6/22/2013 0.993 18
6/23/2013 0.964 19
6/24/2013 1.127 20
6/25/2013 1.059 20 7.00 61.82 13.00 114.82 5.30 46.81 3.40 30.03 0.60 5.30
6/26/2013 1.102 20
6/27/2013 1.228 20
6/28/2013 1.092 20
6/29/2013 0.948 20
6/30/2013 1.168 19

Village of Wellsville
Effluent
Date
Avg. Daily
Flow
Q,MGD
Daily
Effluent
Temp
Effluent
BOD, mg/L
Effluent
BOD, #/day
Effluent
TSS, mg/L
Effluent TSS,
#/day
Effluent
TKN, mg/L
Effluent
TKN, #/day
Effluent
NH3, mg/L
Influent
NH3, #/day
Effluent TP,
mg/L
Effluent TP,
#/day
Effluent
Alum, mg/L
Effluent
Alum,
#/day
7/1/2013 1.667 19
7/2/2013 1.388 20 6.00 69.46 9.00 104.18 6.80 78.72 0.20 2.32 0.50 5.79 0.13 1.53
7/3/2013 1.294 20
7/4/2013 1.112 20
7/5/2013 1.100 21
7/6/2013 0.994 21
7/7/2013 1.005 21
7/8/2013 1.159 20
7/9/2013 1.079 21 8.00 71.99 9.00 80.99 13.90 125.08 8.70 78.29 0.50 4.50
7/10/2013 1.131 21
7/11/2013 1.121 21
7/12/2013 0.971 21
7/13/2013 0.879 19
7/14/2013 0.847 20
7/15/2013 1.016 22
7/16/2013 0.962 23 7.00 56.16 6.00 48.14 5.90 47.34 0.10 0.80 0.50 4.01
7/17/2013 1.010 23
7/18/2013 1.111 24
7/19/2013 1.000 23
7/20/2013 0.872 23
7/21/2013 0.834 22
7/22/2013 1.194 22

Village of Wellsville
Effluent
Date
Avg. Daily
Flow
Q,MGD
Daily
Effluent
Temp
Effluent
BOD, mg/L
Effluent
BOD, #/day
Effluent
TSS, mg/L
Effluent TSS,
#/day
Effluent
TKN, mg/L
Effluent
TKN, #/day
Effluent
NH3, mg/L
Influent
NH3, #/day
Effluent TP,
mg/L
Effluent TP,
#/day
Effluent
Alum, mg/L
Effluent
Alum,
#/day
7/23/2013 1.138 22 8.00 75.93 7.00 66.44 6.30 59.79 0.10 0.95 0.60 5.69
7/24/2013 1.003 21
7/25/2013 1.111 20
7/26/2013 0.938 20
7/27/2013 0.953 19
7/28/2013 0.938 19
7/29/2013 0.999 19
7/30/2013 0.970 20 8.00 64.72 7.00 56.63 5.30 42.88 0.10 0.81 0.50 4.04
7/31/2013 0.977 20
8/1/2013 0.972 21
8/2/2013 0.909 20
8/3/2013 0.744 20
8/4/2013 0.766 19
8/5/2013 0.932 19
8/6/2013 0.891 19 11.00 81.74 9.00 66.88 4.90 36.41 <.1 0.60 4.46 0.05 0.37
8/7/2013 0.948 20
8/8/2013 0.983 22
8/9/2013 0.984 22
8/10/2013 0.758 21
8/11/2013 0.754 20
8/12/2013 1.003 21
8/13/2013 0.969 21 7.00 56.57 9.00 72.73 4.20 33.94 <.1 0.70 5.66
8/14/2013 0.841 19
8/15/2013 0.889 19
8/16/2013 0.854 19
8/17/2013 0.653 18
8/18/2013 0.700 19
8/19/2013 0.806 20
8/20/2013 0.853 20 10.00 71.14 5.00 35.57 5.00 35.57 3.10 22.05 0.70 4.98
8/21/2013 0.808 20
8/22/2013 0.866 22
8/23/2013 0.797 22
8/24/2013 0.664 20
8/25/2013 0.632 19
8/26/2013 0.903 21
8/27/2013 0.944 22 18.00 141.71 13.00 102.35 6.80 53.54 3.90 30.70 1.00 7.87
8/28/2013 0.994 22
8/29/2013 0.901 23
8/30/2013 0.856 22
8/31/2013 0.670 22
9/1/2013 0.654 22
9/2/2013 0.793 22
9/3/2013 0.818 21 12.00 81.87 9.00 61.40 3.90 26.61 0.50 3.41 0.03 0.22
9/4/2013 0.932 21
9/5/2013 0.793 21
9/6/2013 0.773 19
9/7/2013 0.676 18
9/8/2013 0.669 18
9/9/2013 0.808 19
9/10/2013 0.816 21 12.00 81.67 7.00 47.64 6.40 43.55 4.80 32.67 0.60 4.08
9/11/2013 1.009 23
9/12/2013 1.051 22
9/13/2013 0.808 20
9/14/2013 0.692 18
9/15/2013 0.687 17
9/16/2013 0.866 18
9/17/2013 0.815 16 10.00 67.97 7.00 47.58 8.60 58.46 7.10 48.26 0.70 4.76
9/18/2013 0.833 16
9/19/2013 0.869 17
9/20/2013 0.649 19
9/21/2013 0.874 20
9/22/2013 0.736 18
9/23/2013 0.763 17
9/24/2013 0.785 16 11.00 72.02 5.00 32.73 10.20 66.78 8.20 53.68 0.70 4.58
9/25/2013 0.805 17
9/26/2013 0.740 17
9/27/2013 0.768 18
9/28/2013 0.606 17
9/29/2013 0.613 16
9/30/2013 0.756 17
10/1/2013 0.737 19 9.00 55.32 12.00 73.76 7.90 48.56 4.70 28.89 0.90 5.53 0.03 0.15
10/2/2013 0.773 19
10/3/2013 0.777 18
10/4/2013 0.624 20
10/5/2013 0.925 19
10/6/2013 0.887 19
10/7/2013 1.137 19
10/8/2013 0.923 17 6.00 46.19 9.00 69.28 2.20 16.94 0.10 0.77 0.50 3.85
10/9/2013 0.901 17
10/10/2013 0.870 16
10/11/2013 0.864 16
10/12/2013 0.706 15
10/13/2013 0.823 16
10/14/2013 0.922 17
10/15/2013 0.875 17 7.00 51.08 9.00 65.68 2.40 17.51 0.10 0.73 0.50 3.65
10/16/2013 0.924 17
10/17/2013 1.287 17
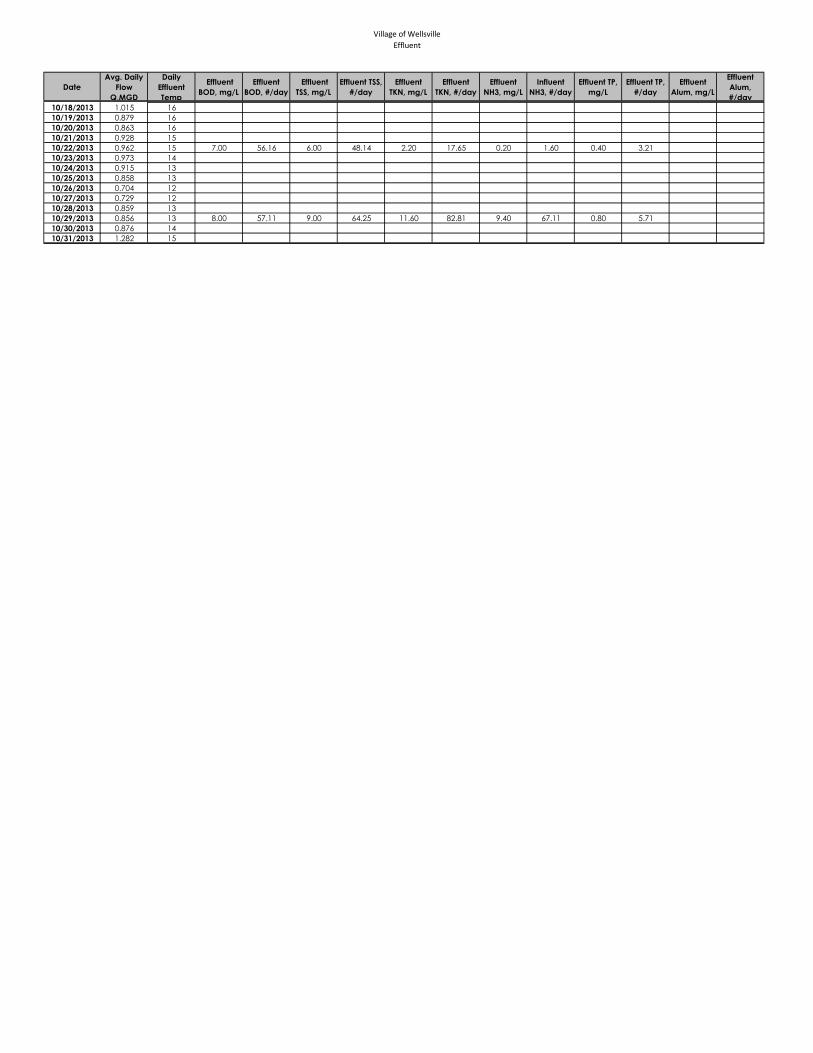
Village of Wellsville
Effluent
Date
Avg. Daily
Flow
Q,MGD
Daily
Effluent
Temp
Effluent
BOD, mg/L
Effluent
BOD, #/day
Effluent
TSS, mg/L
Effluent TSS,
#/day
Effluent
TKN, mg/L
Effluent
TKN, #/day
Effluent
NH3, mg/L
Influent
NH3, #/day
Effluent TP,
mg/L
Effluent TP,
#/day
Effluent
Alum, mg/L
Effluent
Alum,
#/day
10/18/2013 1.015 16
10/19/2013 0.879 16
10/20/2013 0.863 16
10/21/2013 0.928 15
10/22/2013 0.962 15 7.00 56.16 6.00 48.14 2.20 17.65 0.20 1.60 0.40 3.21
10/23/2013 0.973 14
10/24/2013 0.915 13
10/25/2013 0.858 13
10/26/2013 0.704 12
10/27/2013 0.729 12
10/28/2013 0.859 13
10/29/2013 0.856 13 8.00 57.11 9.00 64.25 11.60 82.81 9.40 67.11 0.80 5.71
10/30/2013 0.876 14
10/31/2013 1.282 15

Village of Wellsville
Effluent
Date
Avg. Daily
Flow
Q,MGD
Daily
Effluent
Temp
Effluent
BOD, mg/L
Effluent
BOD, #/day
Effluent
TSS, mg/L
Effluent TSS,
#/day
Effluent
TKN, mg/L
Effluent
TKN, #/day
Effluent
NH3, mg/L
Influent
NH3, #/day
Effluent TP,
mg/L
Effluent TP,
#/day
Effluent
Alum, mg/L
Effluent
Alum,
#/day
11/1/2013 1.252 16
11/2/2013 0.908 15
11/3/2013 0.852 13
11/4/2013 0.949 12
11/5/2013 0.907 12 11.00 83.21 17.00 128.59 17.10 129.35 12.80 96.82 1.10 8.32 0.13 1.00
11/6/2013 1.077 13
11/7/2013 1.142 14
11/8/2013 1.031 12
11/9/2013 0.682 12
11/10/2013 0.680 12
11/11/2013 0.880 12
11/12/2013 1.079 10 7.00 62.99 9.00 80.99 0.80 7.20
11/13/2013 1.067 10
11/14/2013 1.046 10
11/15/2013 0.963 11
11/16/2013 0.833 11
11/17/2013 1.169 12
11/18/2013 1.284 13
11/19/2013 1.160 11 7.00 67.70 13.00 125.72 6.60 63.83 0.70 6.77
11/20/2013 1.107 10
11/21/2013 1.173 10
11/22/2013 1.042 12
11/23/2013 0.921 10
11/24/2013 0.895 6
11/25/2013 1.063 7
11/26/2013 1.546 10 10.00 128.94 11.00 141.83 1.00 12.89
11/27/2013 1.653 10
11/28/2013 1.230 6
11/29/2013 1.160 7
11/30/2013 1.086 6
12/1/2013 1.032 6
12/2/2013 1.209 10
12/3/2013 1.242 11 11.00 113.94 10.00 103.58 14.40 149.16 11.40 118.08 0.70 7.25
12/4/2013 1.309 11 0.13 1.43
12/5/2013 1.473 12
12/6/2013 1.484 11
12/7/2013 1.208 9
12/8/2013 1.162 8
12/9/2013 1.266 10
12/10/2013 1.187 9 10.00 99.00 11.00 108.90 0.80 7.92
12/11/2013 1.159 9
12/12/2013 1.034 7
12/13/2013 0.974 7
12/14/2013 0.899 7
12/15/2013 0.944 5
12/16/2013 1.017 7 8.00 67.85 9.00 76.34 0.94 7.97
12/17/2013 0.989 6
12/18/2013 1.084 7
12/19/2013 1.187 8
12/20/2013 1.545 10
12/21/2013 3.117 10
12/22/2013 2.640 10
12/23/2013 1.982 11
12/24/2013 1.606 11 7.00 93.76 7.00 93.76 0.40 5.36
12/25/2013 1.382 9
12/26/2013 1.546 9
12/27/2013 1.395 10
12/28/2013 1.220 9
12/29/2013 1.560 10
12/30/2013 1.472 9
12/31/2013 1.339 8
1/1/2014 1.196 7 11.00 109.72 11.00 109.72 21.60 215.45 0.70 6.98 0.19 1.91
1/2/2014 1.319 8
1/3/2014 1.264 6
1/4/2014 1.124 7
1/5/2014 1.431 8
1/6/2014 1.723 9
1/7/2014 1.455 5 14.00 169.89 10.00 121.35 22.00 266.96 0.50 6.07
1/8/2014 1.299 6
1/9/2014 1.424 8
1/10/2014 1.295 8
1/11/2014 1.830 9
1/12/2014 1.454 9
1/13/2014 1.605 9
1/14/2014 1.720 10 11.00 157.79 8.00 114.76 21.20 304.11 0.50 7.17
1/15/2014 1.564 10
1/16/2014 1.691 8
1/17/2014 1.631 9
1/18/2014 1.199 7
1/19/2014 1.204 7
1/20/2014 1.327 8
1/21/2014 1.273 8 24.00 254.80 9.00 95.55 0.60 6.37
1/22/2014 1.223 6
1/23/2014 1.180 7
1/24/2014 1.131 7
1/25/2014 1.056 6
1/26/2014 1.029 6

Village of Wellsville
Effluent
Date
Avg. Daily
Flow
Q,MGD
Daily
Effluent
Temp
Effluent
BOD, mg/L
Effluent
BOD, #/day
Effluent
TSS, mg/L
Effluent TSS,
#/day
Effluent
TKN, mg/L
Effluent
TKN, #/day
Effluent
NH3, mg/L
Influent
NH3, #/day
Effluent TP,
mg/L
Effluent TP,
#/day
Effluent
Alum, mg/L
Effluent
Alum,
#/day
1/27/2014 1.066 8
1/28/2014 1.087 6 23.00 208.51 16.00 145.05 0.70 6.35
1/29/2014 1.302 6
1/30/2014 1.372 7
1/31/2014 1.107 7
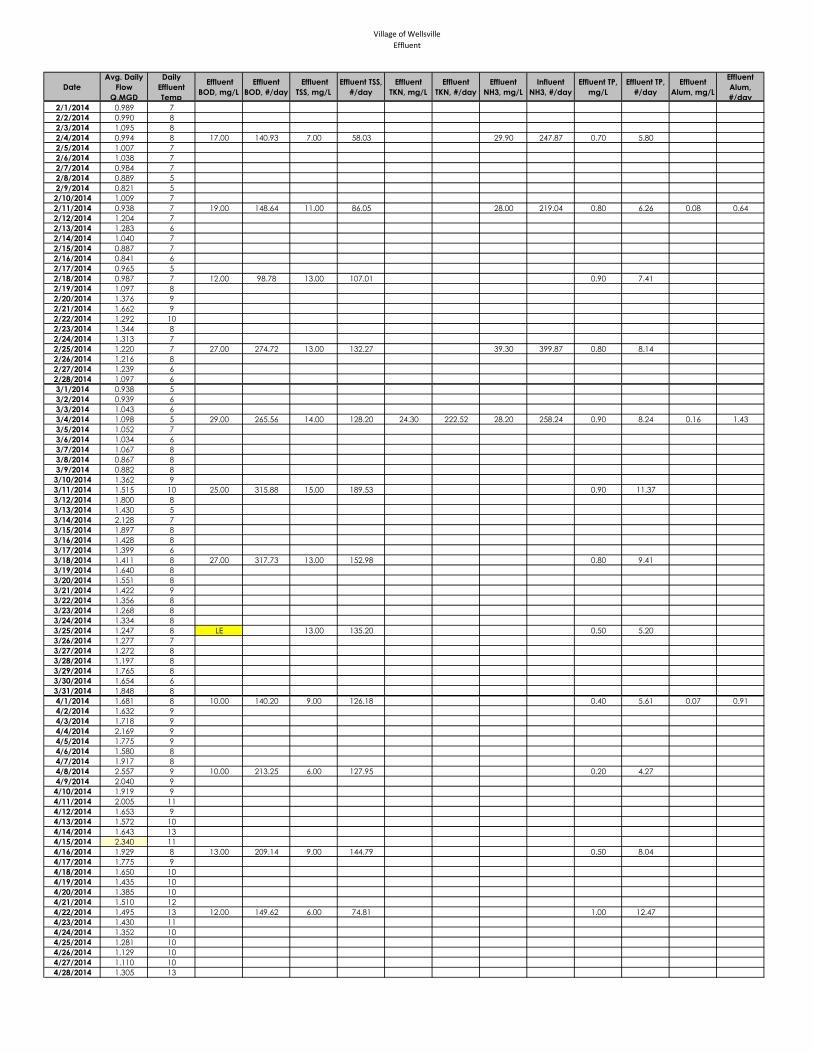
Village of Wellsville
Effluent
Date
Avg. Daily
Flow
Q,MGD
Daily
Effluent
Temp
Effluent
BOD, mg/L
Effluent
BOD, #/day
Effluent
TSS, mg/L
Effluent TSS,
#/day
Effluent
TKN, mg/L
Effluent
TKN, #/day
Effluent
NH3, mg/L
Influent
NH3, #/day
Effluent TP,
mg/L
Effluent TP,
#/day
Effluent
Alum, mg/L
Effluent
Alum,
#/day
2/1/2014 0.989 7
2/2/2014 0.990 8
2/3/2014 1.095 8
2/4/2014 0.994 8 17.00 140.93 7.00 58.03 29.90 247.87 0.70 5.80
2/5/2014 1.007 7
2/6/2014 1.038 7
2/7/2014 0.984 7
2/8/2014 0.889 5
2/9/2014 0.821 5
2/10/2014 1.009 7
2/11/2014 0.938 7 19.00 148.64 11.00 86.05 28.00 219.04 0.80 6.26 0.08 0.64
2/12/2014 1.204 7
2/13/2014 1.283 6
2/14/2014 1.040 7
2/15/2014 0.887 7
2/16/2014 0.841 6
2/17/2014 0.965 5
2/18/2014 0.987 7 12.00 98.78 13.00 107.01 0.90 7.41
2/19/2014 1.097 8
2/20/2014 1.376 9
2/21/2014 1.662 9
2/22/2014 1.292 10
2/23/2014 1.344 8
2/24/2014 1.313 7
2/25/2014 1.220 7 27.00 274.72 13.00 132.27 39.30 399.87 0.80 8.14
2/26/2014 1.216 8
2/27/2014 1.239 6
2/28/2014 1.097 6
3/1/2014 0.938 5
3/2/2014 0.939 6
3/3/2014 1.043 6
3/4/2014 1.098 5 29.00 265.56 14.00 128.20 24.30 222.52 28.20 258.24 0.90 8.24 0.16 1.43
3/5/2014 1.052 7
3/6/2014 1.034 6
3/7/2014 1.067 8
3/8/2014 0.867 8
3/9/2014 0.882 8
3/10/2014 1.362 9
3/11/2014 1.515 10 25.00 315.88 15.00 189.53 0.90 11.37
3/12/2014 1.800 8
3/13/2014 1.430 5
3/14/2014 2.128 7
3/15/2014 1.897 8
3/16/2014 1.428 8
3/17/2014 1.399 6
3/18/2014 1.411 8 27.00 317.73 13.00 152.98 0.80 9.41
3/19/2014 1.640 8
3/20/2014 1.551 8
3/21/2014 1.422 9
3/22/2014 1.356 8
3/23/2014 1.268 8
3/24/2014 1.334 8
3/25/2014 1.247 8 LE 13.00 135.20 0.50 5.20
3/26/2014 1.277 7
3/27/2014 1.272 8
3/28/2014 1.197 8
3/29/2014 1.765 8
3/30/2014 1.654 6
3/31/2014 1.848 8
4/1/2014 1.681 8 10.00 140.20 9.00 126.18 0.40 5.61 0.07 0.91
4/2/2014 1.632 9
4/3/2014 1.718 9
4/4/2014 2.169 9
4/5/2014 1.775 9
4/6/2014 1.580 8
4/7/2014 1.917 8
4/8/2014 2.557 9 10.00 213.25 6.00 127.95 0.20 4.27
4/9/2014 2.040 9
4/10/2014 1.919 9
4/11/2014 2.005 11
4/12/2014 1.653 9
4/13/2014 1.572 10
4/14/2014 1.643 13
4/15/2014 2.340 11
4/16/2014 1.929 8 13.00 209.14 9.00 144.79 0.50 8.04
4/17/2014 1.775 9
4/18/2014 1.650 10
4/19/2014 1.435 10
4/20/2014 1.385 10
4/21/2014 1.510 12
4/22/2014 1.495 13 12.00 149.62 6.00 74.81 1.00 12.47
4/23/2014 1.430 11
4/24/2014 1.352 10
4/25/2014 1.281 10
4/26/2014 1.129 10
4/27/2014 1.110 10
4/28/2014 1.305 13

Village of Wellsville
Effluent
Date
Avg. Daily
Flow
Q,MGD
Daily
Effluent
Temp
Effluent
BOD, mg/L
Effluent
BOD, #/day
Effluent
TSS, mg/L
Effluent TSS,
#/day
Effluent
TKN, mg/L
Effluent
TKN, #/day
Effluent
NH3, mg/L
Influent
NH3, #/day
Effluent TP,
mg/L
Effluent TP,
#/day
Effluent
Alum, mg/L
Effluent
Alum,
#/day
4/29/2014 1.266 11 10.00 105.58 9.00 95.03 0.70 7.39
4/30/2014 1.737 11

Village of Wellsville
Effluent
Date
Avg. Daily
Flow
Q,MGD
Daily
Effluent
Temp
Effluent
BOD, mg/L
Effluent
BOD, #/day
Effluent
TSS, mg/L
Effluent TSS,
#/day
Effluent
TKN, mg/L
Effluent
TKN, #/day
Effluent
NH3, mg/L
Influent
NH3, #/day
Effluent TP,
mg/L
Effluent TP,
#/day
Effluent
Alum, mg/L
Effluent
Alum,
#/day
5/1/2014 1.609 13
5/2/2014 1.453 13
5/3/2014 1.347 12
5/4/2014 1.328 11
5/5/2014 1.402 12
5/6/2014 1.324 13 9.00 99.38 8.00 88.34 14.00 154.59 0.60 6.63 0.06 0.64
5/7/2014 1.291 13
5/8/2014 1.311 14
5/9/2014 1.221 16
5/10/2014 1.091 16
5/11/2014 1.031 14
5/12/2014 1.236 15
5/13/2014 1.527 16 8.00 101.88 7.00 89.15 0.60 7.64
5/14/2014 1.425 17
5/15/2014 2.250 17
5/16/2014 3.743 14
5/17/2014 2.417 14
5/18/2014 1.963 13
5/19/2014 1.887 13
5/20/2014 1.789 14 7.00 104.44 9.00 134.28 0.30 4.48
5/21/2014 2.164 14
5/22/2014 1.920 15
5/23/2014 1.700 15
5/24/2014 1.459 13
5/25/2014 1.332 13
5/26/2014 1.314 13
5/27/2014 1.541 17 27.00 347.00 17.00 218.48 1.10 14.14
5/28/2014 1.420 17
5/29/2014 1.367 16
5/30/2014 1.228 16
5/31/2014 1.072 15
6/1/2014 1.038 15
6/2/2014 1.367 17
6/3/2014 1.258 19 10.00 104.92 11.00 115.41 9.67 101.45 12.50 131.15 0.50 5.25 0.09 0.99
6/4/2014 1.224 18
6/5/2014 1.159 17
6/6/2014 1.035 17
6/7/2014 0.953 16
6/8/2014 1.488 16
6/9/2014 1.400 17
6/10/2014 1.388 18 7.00 81.03 11.00 127.34 3.47 40.17 3.83 44.34 0.60 6.95
6/11/2014 1.372 18
6/12/2014 1.409 19
6/13/2014 1.259 19
6/14/2014 1.090 17
6/15/2014 1.071 15
6/16/2014 1.229 17
6/17/2014 1.179 20 6.00 59.00 5.00 49.16 8.06 79.25 3.42 33.63 0.60 5.90
6/18/2014 1.323 19
6/19/2014 1.335 19
6/20/2014 1.095 18
6/21/2014 0.982 17
6/22/2014 0.943 17
6/23/2014 1.060 19
6/24/2014 1.144 20 8.00 76.33 6.00 57.25 1.40 13.36 0.14 1.35 0.60 5.72
6/25/2014 2.251 19
6/26/2014 1.634 19
6/27/2014 1.331 19
6/28/2014 1.205 18
6/29/2014 1.216 19
6/30/2014 1.238 20
7/1/2014 1.124 21 6.00 56.24 7.00 65.62 3.38 31.68 1.25 11.72 0.60 5.62 0.22 2.02
7/2/2014 1.182 21
7/3/2014 1.388 21
7/4/2014 1.030 19
7/5/2014 0.978 17
7/6/2014 0.969 17
7/7/2014 1.248 19
7/8/2014 1.340 21 9.00 100.58 9.00 100.58 8.59 96.00 4.46 49.84 0.50 5.59
7/9/2014 1.233 20
7/10/2014 1.212 19
7/11/2014 1.104 19
7/12/2014 0.888 20
7/13/2014 1.256 20
7/14/2014 1.416 20
7/15/2014 1.725 20 7.00 100.71 7.00 100.71 3.40 48.91 1.33 19.13 0.50 7.19
7/16/2014 1.382 18
7/17/2014 1.314 18
7/18/2014 1.212 18
7/19/2014 1.155 18
7/20/2014 0.995 19
7/21/2014 1.141 20
7/22/2014 1.090 21 8.00 72.72 15.00 136.36 4.48 40.73 1.51 13.73 0.80 7.27
7/23/2014 1.125 21
7/24/2014 1.032 20
7/25/2014 0.954 19
7/26/2014 0.803 19

Village of Wellsville
Effluent
Date
Avg. Daily
Flow
Q,MGD
Daily
Effluent
Temp
Effluent
BOD, mg/L
Effluent
BOD, #/day
Effluent
TSS, mg/L
Effluent TSS,
#/day
Effluent
TKN, mg/L
Effluent
TKN, #/day
Effluent
NH3, mg/L
Influent
NH3, #/day
Effluent TP,
mg/L
Effluent TP,
#/day
Effluent
Alum, mg/L
Effluent
Alum,
#/day
7/27/2014 0.810 20
7/28/2014 1.003 21
7/29/2014 0.994 19 9.00 74.61 19.00 157.51 12.20 101.14 8.97 74.36 0.70 5.80
7/30/2014 0.960 19
7/31/2014 0.975 20
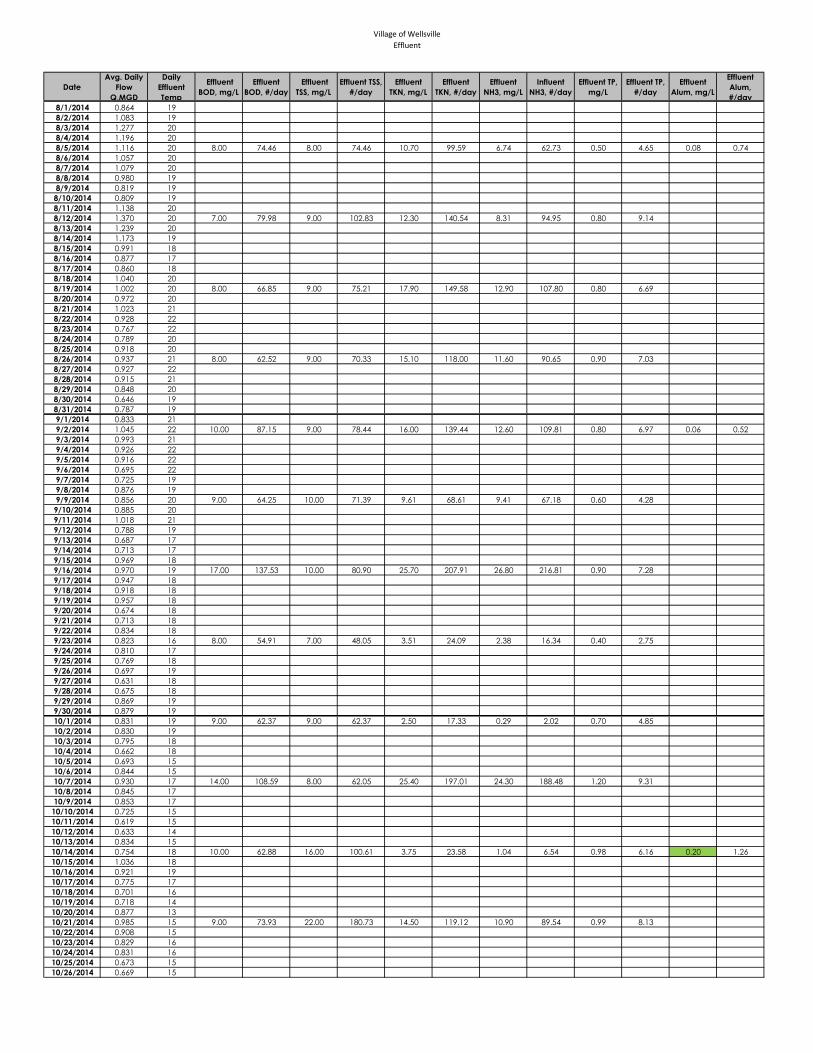
Village of Wellsville
Effluent
Date
Avg. Daily
Flow
Q,MGD
Daily
Effluent
Temp
Effluent
BOD, mg/L
Effluent
BOD, #/day
Effluent
TSS, mg/L
Effluent TSS,
#/day
Effluent
TKN, mg/L
Effluent
TKN, #/day
Effluent
NH3, mg/L
Influent
NH3, #/day
Effluent TP,
mg/L
Effluent TP,
#/day
Effluent
Alum, mg/L
Effluent
Alum,
#/day
8/1/2014 0.864 19
8/2/2014 1.083 19
8/3/2014 1.277 20
8/4/2014 1.196 20
8/5/2014 1.116 20 8.00 74.46 8.00 74.46 10.70 99.59 6.74 62.73 0.50 4.65 0.08 0.74
8/6/2014 1.057 20
8/7/2014 1.079 20
8/8/2014 0.980 19
8/9/2014 0.819 19
8/10/2014 0.809 19
8/11/2014 1.138 20
8/12/2014 1.370 20 7.00 79.98 9.00 102.83 12.30 140.54 8.31 94.95 0.80 9.14
8/13/2014 1.239 20
8/14/2014 1.173 19
8/15/2014 0.991 18
8/16/2014 0.877 17
8/17/2014 0.860 18
8/18/2014 1.040 20
8/19/2014 1.002 20 8.00 66.85 9.00 75.21 17.90 149.58 12.90 107.80 0.80 6.69
8/20/2014 0.972 20
8/21/2014 1.023 21
8/22/2014 0.928 22
8/23/2014 0.767 22
8/24/2014 0.789 20
8/25/2014 0.918 20
8/26/2014 0.937 21 8.00 62.52 9.00 70.33 15.10 118.00 11.60 90.65 0.90 7.03
8/27/2014 0.927 22
8/28/2014 0.915 21
8/29/2014 0.848 20
8/30/2014 0.646 19
8/31/2014 0.787 19
9/1/2014 0.833 21
9/2/2014 1.045 22 10.00 87.15 9.00 78.44 16.00 139.44 12.60 109.81 0.80 6.97 0.06 0.52
9/3/2014 0.993 21
9/4/2014 0.926 22
9/5/2014 0.916 22
9/6/2014 0.695 22
9/7/2014 0.725 19
9/8/2014 0.876 19
9/9/2014 0.856 20 9.00 64.25 10.00 71.39 9.61 68.61 9.41 67.18 0.60 4.28
9/10/2014 0.885 20
9/11/2014 1.018 21
9/12/2014 0.788 19
9/13/2014 0.687 17
9/14/2014 0.713 17
9/15/2014 0.969 18
9/16/2014 0.970 19 17.00 137.53 10.00 80.90 25.70 207.91 26.80 216.81 0.90 7.28
9/17/2014 0.947 18
9/18/2014 0.918 18
9/19/2014 0.957 18
9/20/2014 0.674 18
9/21/2014 0.713 18
9/22/2014 0.834 18
9/23/2014 0.823 16 8.00 54.91 7.00 48.05 3.51 24.09 2.38 16.34 0.40 2.75
9/24/2014 0.810 17
9/25/2014 0.769 18
9/26/2014 0.697 19
9/27/2014 0.631 18
9/28/2014 0.675 18
9/29/2014 0.869 19
9/30/2014 0.879 19
10/1/2014 0.831 19 9.00 62.37 9.00 62.37 2.50 17.33 0.29 2.02 0.70 4.85
10/2/2014 0.830 19
10/3/2014 0.795 18
10/4/2014 0.662 18
10/5/2014 0.693 15
10/6/2014 0.844 15
10/7/2014 0.930 17 14.00 108.59 8.00 62.05 25.40 197.01 24.30 188.48 1.20 9.31
10/8/2014 0.845 17
10/9/2014 0.853 17
10/10/2014 0.725 15
10/11/2014 0.619 15
10/12/2014 0.633 14
10/13/2014 0.834 15
10/14/2014 0.754 18 10.00 62.88 16.00 100.61 3.75 23.58 1.04 6.54 0.98 6.16 0.20 1.26
10/15/2014 1.036 18
10/16/2014 0.921 19
10/17/2014 0.775 17
10/18/2014 0.701 16
10/19/2014 0.718 14
10/20/2014 0.877 13
10/21/2014 0.985 15 9.00 73.93 22.00 180.73 14.50 119.12 10.90 89.54 0.99 8.13
10/22/2014 0.908 15
10/23/2014 0.829 16
10/24/2014 0.831 16
10/25/2014 0.673 15
10/26/2014 0.669 15
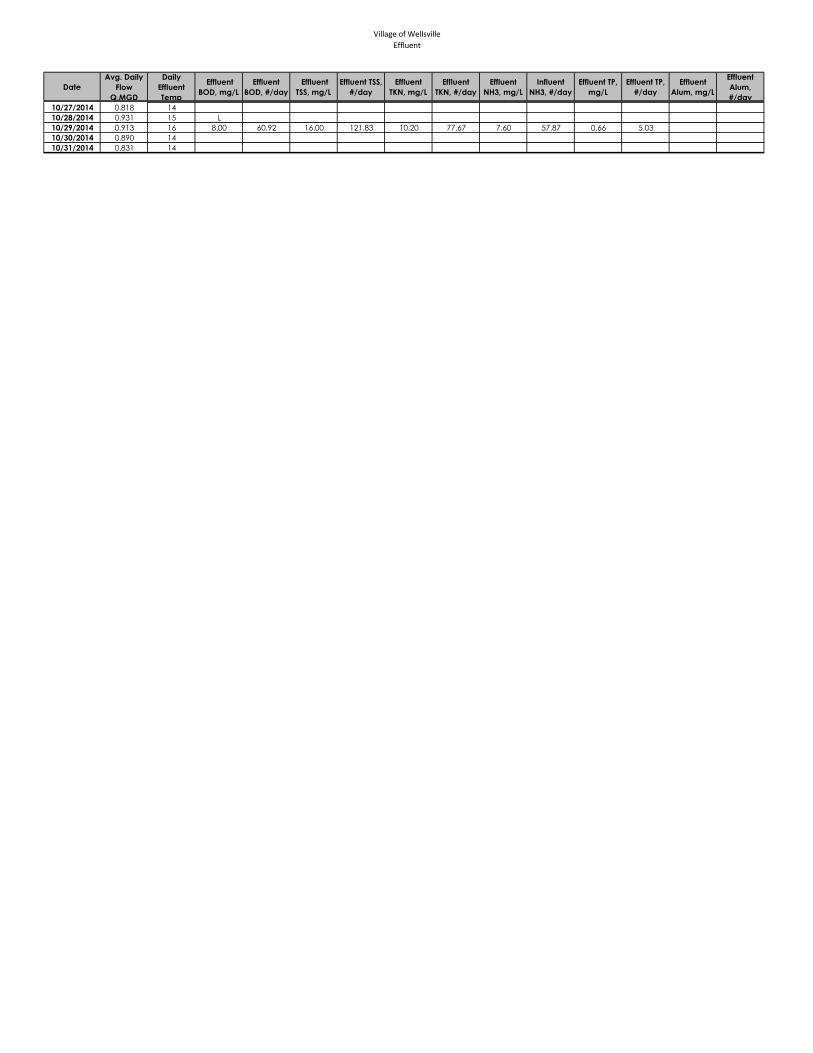
Village of Wellsville
Effluent
Date
Avg. Daily
Flow
Q,MGD
Daily
Effluent
Temp
Effluent
BOD, mg/L
Effluent
BOD, #/day
Effluent
TSS, mg/L
Effluent TSS,
#/day
Effluent
TKN, mg/L
Effluent
TKN, #/day
Effluent
NH3, mg/L
Influent
NH3, #/day
Effluent TP,
mg/L
Effluent TP,
#/day
Effluent
Alum, mg/L
Effluent
Alum,
#/day
10/27/2014 0.818 14
10/28/2014 0.931 15 L
10/29/2014 0.913 16 8.00 60.92 16.00 121.83 10.20 77.67 7.60 57.87 0.66 5.03
10/30/2014 0.890 14
10/31/2014 0.831 14

Village of Wellsville
Effluent
Date
Avg. Daily
Flow
Q,MGD
Daily
Effluent
Temp
Effluent
BOD, mg/L
Effluent
BOD, #/day
Effluent
TSS, mg/L
Effluent TSS,
#/day
Effluent
TKN, mg/L
Effluent
TKN, #/day
Effluent
NH3, mg/L
Influent
NH3, #/day
Effluent TP,
mg/L
Effluent TP,
#/day
Effluent
Alum, mg/L
Effluent
Alum,
#/day
11/1/2014 0.725 13
11/2/2014 0.784 12
11/3/2014 0.946 12
11/4/2014 0.893 14 8.00 59.58 15.00 111.71 22.80 169.81 14.50 107.99 0.90 6.70 0.20 1.49
11/5/2014 0.896 14
11/6/2014 1.294 13
11/7/2014 1.003 13
11/8/2014 0.835 13
11/9/2014 0.837 13
11/10/2014 0.956 14
11/11/2014 0.873 12 9.00 65.53 15.00 109.21 0.90 6.55
11/12/2014 0.950 13
11/13/2014 0.946 12
11/14/2014 0.874 11
11/15/2014 0.731 9
11/16/2014 0.768 9
11/17/2014 1.122 11
11/18/2014 0.990 8 13.00 107.34 18.00 148.62 1.10 9.08
11/19/2014 0.961 7
11/20/2014 0.939 8
11/21/2014 0.846 8
11/22/2014 0.750 7
11/23/2014 0.859 9
11/24/2014 1.032 13
11/25/2014 0.970 12 8.00 64.72 21.00 169.89 1.00 8.09
11/26/2014 0.984 11
11/27/2014 0.826 9
11/28/2014 0.784 9
11/29/2014 0.737 8
11/30/2014 0.804 10
12/1/2014 0.906 11
12/2/2014 0.972 9 12.00 97.28 21.00 170.24 14.00 113.49 0.90 7.30 0.18 1.46
12/3/2014 1.000 10
12/4/2014 0.941 9
12/5/2014 1.056 9
12/6/2014 1.426 10
12/7/2014 1.053 9
12/8/2014 1.153 9
12/9/2014 1.081 10 9.00 81.14 19.00 171.30 0.90 8.11
12/10/2014 1.083 10
12/11/2014 1.017 8
12/12/2014 0.962 8
12/13/2014 0.862 7
12/14/2014 0.974 8
12/15/2014 1.198 10
12/16/2014 1.424 10 9.00 106.89 17.00 201.89 0.90 10.69
12/17/2014 1.387 11
12/18/2014 1.244 10
12/19/2014 1.112 9
12/20/2014 0.959 8
12/21/2014 0.938 8
12/22/2014 1.104 10
12/23/2014 1.070 11 12.00 107.09 19.00 169.55 0.50 4.46
12/24/2014 1.113 12
12/25/2014 1.041 11
12/26/2014 1.080 11
12/27/2014 1.050 10
12/28/2014 1.082 12
12/29/2014 1.175 10
12/30/2014 1.064 9 11.00 97.61 13.00 115.36 0.70 6.21
12/31/2014 1.043 8
1/1/2015 0.967 8
1/2/2015 1.024 9
1/3/2015 1.107 9
1/4/2015 1.360 10
1/5/2015 1.240 9
1/6/2015 1.220 8 13.00 132.27 10.00 101.75 26.60 270.65 1.20 12.21 0.20 2.03
1/7/2015 1.166 7
1/8/2015 1.111 6
1/9/2015 1.024 7
1/10/2015 0.887 6
1/11/2015 0.902 7
1/12/2015 1.042 10
1/13/2015 1.016 8 14.00 118.63 11.00 93.21 0.80 6.78
1/14/2015 1.038 7
1/15/2015 1.028 8
1/16/2015 0.981 8
1/17/2015 0.869 6
1/18/2015 0.908 8
1/19/2015 1.052 9
1/20/2015 0.976 10
1/21/2015 0.979 8
1/22/2015 0.987 9 17.00 139.94 12.00 98.78 0.70 5.76
1/23/2015 0.899 10
1/24/2015 0.812 10
1/25/2015 0.816 10
1/26/2015 0.990 7

Village of Wellsville
Effluent
Date
Avg. Daily
Flow
Q,MGD
Daily
Effluent
Temp
Effluent
BOD, mg/L
Effluent
BOD, #/day
Effluent
TSS, mg/L
Effluent TSS,
#/day
Effluent
TKN, mg/L
Effluent
TKN, #/day
Effluent
NH3, mg/L
Influent
NH3, #/day
Effluent TP,
mg/L
Effluent TP,
#/day
Effluent
Alum, mg/L
Effluent
Alum,
#/day
1/27/2015 0.951 7 16.00 126.90 13.00 103.11 0.60 4.76
1/28/2015 0.955 7
1/29/2015 0.967 7
1/30/2015 0.906 8
1/31/2015 0.748 5

Village of Wellsville
Effluent
Date
Avg. Daily
Flow
Q,MGD
Daily
Effluent
Temp
Effluent
BOD, mg/L
Effluent
BOD, #/day
Effluent
TSS, mg/L
Effluent TSS,
#/day
Effluent
TKN, mg/L
Effluent
TKN, #/day
Effluent
NH3, mg/L
Influent
NH3, #/day
Effluent TP,
mg/L
Effluent TP,
#/day
Effluent
Alum, mg/L
Effluent
Alum,
#/day
2/1/2015 0.763 7
2/2/2015 0.967 8
2/3/2015 1.222 7 19.00 193.64 13.00 132.49 0.70 7.13 0.20 2.04
2/4/2015 0.971 8
2/5/2015 1.016 8
2/6/2015 1.059 7
2/7/2015 0.790 8
2/8/2015 0.843 9
2/9/2015 0.936 8
2/10/2015 0.953 7 18.00 143.06 18.00 143.06 0.70 5.56
2/11/2015 1.005 9
2/12/2015 1.002 9
2/13/2015 0.883 6
2/14/2015 1.057 7
2/15/2015 0.935 7
2/16/2015 1.346 6
2/17/2015 1.090 6 30.00 272.72 28.00 254.54 1.10 10.00
2/18/2015 0.968 6
2/19/2015 1.059 6
2/20/2015 0.980 6
2/21/2015 1.199 6
2/22/2015 1.010 7
2/23/2015 0.949 6
2/24/2015 1.260 7
2/25/2015 0.959 7 29.00 231.94 22.00 175.96 0.90 7.20
2/26/2015 1.067 6
2/27/2015 1.206 6
2/28/2015 1.099 5
3/1/2015 1.087 7
3/2/2015 1.154 8
3/3/2015 1.111 6 34.00 315.04 22.00 203.85 0.80 7.41
3/4/2015 1.038 8
3/5/2015 0.996 8
3/6/2015 0.931 6
3/7/2015 0.773 6
3/8/2015 0.837 8
3/9/2015 1.046 8
3/10/2015 1.119 9 12.00 111.99 53.40 498.35 60.70 566.48 0.50 4.67 0.11 0.98
3/11/2015 1.600 9
3/12/2015 1.410 8
3/13/2015 1.474 9
3/14/2015 2.044 8
3/15/2015 1.576 7
3/16/2015 2.005 8
3/17/2015 2.113 8 18.00 317.20 19.00 334.83 0.70 12.34
3/18/2015 1.699 7
3/19/2015 1.592 7
3/20/2015 1.476 8
3/21/2015 1.489 8
3/22/2015 1.347 6
3/23/2015 1.440 8
3/24/2015 1.389 7 29.00 335.94 14.00 162.18 0.80 9.27
3/25/2015 1.420 8
3/26/2015 1.913 10
3/27/2015 1.568 8
3/28/2015 1.375 7
3/29/2015 1.307 7
3/30/2015 1.490 9
3/31/2015 1.429 8
4/1/2015 1.388 9 25.00 289.40 14.00 162.06 0.60 6.95 0.08 0.93
4/2/2015 1.684 9
4/3/2015 1.990 11
4/4/2015 1.734 8
4/5/2015 1.775 7
4/6/2015 1.968 9
4/7/2015 2.076 9 15.00 259.71 7.00 121.20 0.80 13.85
4/8/2015 2.414 9
4/9/2015 2.498 10
4/10/2015 2.405 10
4/11/2015 1.908 10
4/12/2015 1.808 8
4/13/2015 2.100 11
4/14/2015 2.009 11 12.00 201.06 8.00 134.04 0.70 11.73
4/15/2015 1.797 11
4/16/2015 1.705 11
4/17/2015 1.688 11
4/18/2015 1.515 10
4/19/2015 1.485 11
4/20/2015 2.109 12
4/21/2015 2.016 11 13.00 218.57 10.00 168.13 0.80 13.45
4/22/2015 2.033 11
4/23/2015 1.866 9
4/24/2015 1.733 11
4/25/2015 1.547 9
4/26/2015 1.445 9
4/27/2015 1.511 11
4/28/2015 1.474 12 14.00 172.10 12.00 147.52 0.70 8.61

Village of Wellsville
Effluent
Date
Avg. Daily
Flow
Q,MGD
Daily
Effluent
Temp
Effluent
BOD, mg/L
Effluent
BOD, #/day
Effluent
TSS, mg/L
Effluent TSS,
#/day
Effluent
TKN, mg/L
Effluent
TKN, #/day
Effluent
NH3, mg/L
Influent
NH3, #/day
Effluent TP,
mg/L
Effluent TP,
#/day
Effluent
Alum, mg/L
Effluent
Alum,
#/day
5/1/2015 1.313 13
5/2/2015 1.128 12
5/3/2015 1.135 13
5/4/2015 1.252 14
5/5/2015 1.214 16 10.00 101.25 10.00 101.25 33.20 336.14 30.70 310.83 0.60 6.07 0.50 5.06
5/6/2015 1.195 15
5/7/2015 1.173 16
5/8/2015 1.154 16
5/9/2015 0.949 15
5/10/2015 0.987 15
5/11/2015 1.173 17
5/12/2015 1.187 18 13.00 128.69 6.00 59.40 0.60 5.94
5/13/2015 1.116 15
5/14/2015 1.252 15
5/15/2015 1.093 16
5/16/2015 0.941 16
5/17/2015 0.929 16
5/18/2015 1.137 18
5/19/2015 1.088 18
5/20/2015 1.151 16 7.00 67.20 9.00 86.39 0.50 4.80
5/21/2015 1.100 17
5/22/2015 1.002 16
5/23/2015 0.872 15
5/24/2015 0.844 15
5/25/2015 0.849 17
5/26/2015 0.977 18 10.00 81.48 8.00 65.19 0.50 4.07
5/27/2015 1.011 19
5/28/2015 0.993 19
5/29/2015 0.875 20
5/30/2015 0.778 20
5/31/2015 1.078 19
6/1/2015 0.994 17
6/2/2015 0.977 17 11.00 89.63 14.00 114.07 9.88 80.50 8.75 71.30 0.80 6.52 0.23 1.87
6/3/2015 0.965 17
6/4/2015 0.959 18
6/5/2015 0.864 19
6/6/2015 0.743 18
6/7/2015 0.796 16
6/8/2015 1.533 19
6/9/2015 1.596 18 8.00 106.49 21.00 279.52 3.58 47.65 1.37 18.24 1.00 13.31
6/10/2015 1.365 18
6/11/2015 1.207 21
6/12/2015 1.082 20
6/13/2015 0.878 18
6/14/2015 1.097 19
6/15/2015 1.330 20
6/16/2015 1.178 21 5.00 49.12 18.00 176.84 5.49 53.94 2.13 20.93 0.70 6.88
6/17/2015 1.101 19
6/18/2015 1.106 19
6/19/2015 0.997 20
6/20/2015 0.822 20
6/21/2015 0.864 20
6/22/2015 1.046 20
6/23/2015 1.054 21 7.00 61.53 8.00 70.32 5.65 49.67 2.45 21.54 0.50 4.40
6/24/2015 0.937 19
6/25/2015 0.970 19
6/26/2015 0.879 19
6/27/2015 1.662 19
6/28/2015 1.241 17
6/29/2015 1.272 18
6/30/2015 1.534 19
7/1/2015 1.377 19 6.00 68.91 7.00 80.39 4.71 54.09 2.85 32.73 0.90 10.34
7/2/2015 1.330 19
7/3/2015 1.065 18
7/4/2015 0.900 19
7/5/2015 0.914 19
7/6/2015 1.043 19
7/7/2015 1.118 20 4.00 37.30 5.00 46.62 2.75 25.64 0.47 4.37 0.40 3.73
7/8/2015 1.071 21
7/9/2015 1.215 19
7/10/2015 1.108 19
7/11/2015 0.875 19
7/12/2015 0.869 19
7/13/2015 0.959 19
7/14/2015 1.130 21 9.00 84.82 7.00 65.97 4.79 45.14 1.84 17.34 0.70 6.60
7/15/2015 0.990 21
7/16/2015 0.967 19
7/17/2015 1.007 19
7/18/2015 0.780 19
7/19/2015 0.786 20
7/20/2015 0.902 21
7/21/2015 0.957 21 6.00 47.89 8.00 63.85 4.51 36.00 1.44 11.49 1.10 8.78
7/22/2015 0.916 21
7/23/2015 0.913 20
7/24/2015 0.844 20
7/25/2015 0.679 19
7/26/2015 0.706 21

Village of Wellsville
Effluent
Date
Avg. Daily
Flow
Q,MGD
Daily
Effluent
Temp
Effluent
BOD, mg/L
Effluent
BOD, #/day
Effluent
TSS, mg/L
Effluent TSS,
#/day
Effluent
TKN, mg/L
Effluent
TKN, #/day
Effluent
NH3, mg/L
Influent
NH3, #/day
Effluent TP,
mg/L
Effluent TP,
#/day
Effluent
Alum, mg/L
Effluent
Alum,
#/day
7/27/2015 0.853 21
7/28/2015 0.876 21 7.00 51.14 9.00 65.75 3.36 24.55 1.81 13.22 0.80 5.84
7/29/2015 0.892 22
7/30/2015 0.980 23
7/31/2015 0.830 23

0
50
100
150
200
250
300
Au
g-1
2
Sep
-12
Oct
-12
No
v-1
2
Dec
-12
Jan
-13
Feb
-13
Mar
-13
Ap
r-1
3
May
-13
Jun
-13
Jul-
13
Au
g-1
3
Sep
-13
Oct
-13
No
v-1
3
Dec
-13
Jan
-14
Feb
-14
Mar
-14
Ap
r-1
4
May
-14
Jun
-14
Jul-
14
Au
g-1
4
Sep
-14
Oct
-14
No
v-1
4
Dec
-14
Jan
-15
Feb
-15
Mar
-15
Ap
r-1
5
May
-15
Jun
-15
Jul-
15
BO
D m
g/l
BOD
INF BOD
EFF BOD

0.000
0.200
0.400
0.600
0.800
1.000
1.200
1.400
1.600
1.800
2.000
Au
g-1
2
Sep
-12
Oct
-12
No
v-1
2
Dec
-12
Jan
-13
Feb
-13
Mar
-13
Ap
r-1
3
May
-13
Jun
-13
Jul-
13
Au
g-1
3
Sep
-13
Oct
-13
No
v-1
3
Dec
-13
Jan
-14
Feb
-14
Mar
-14
Ap
r-1
4
May
-14
Jun
-14
Jul-
14
Au
g-1
4
Sep
-14
Oct
-14
No
v-1
4
Dec
-14
Jan
-15
Feb
-15
Mar
-15
Ap
r-1
5
May
-15
Jun
-15
Jul-
15
Flo
w (
MG
D)
Date (month)
Influent Flow and Leachate
INFLUENT LEACHATE
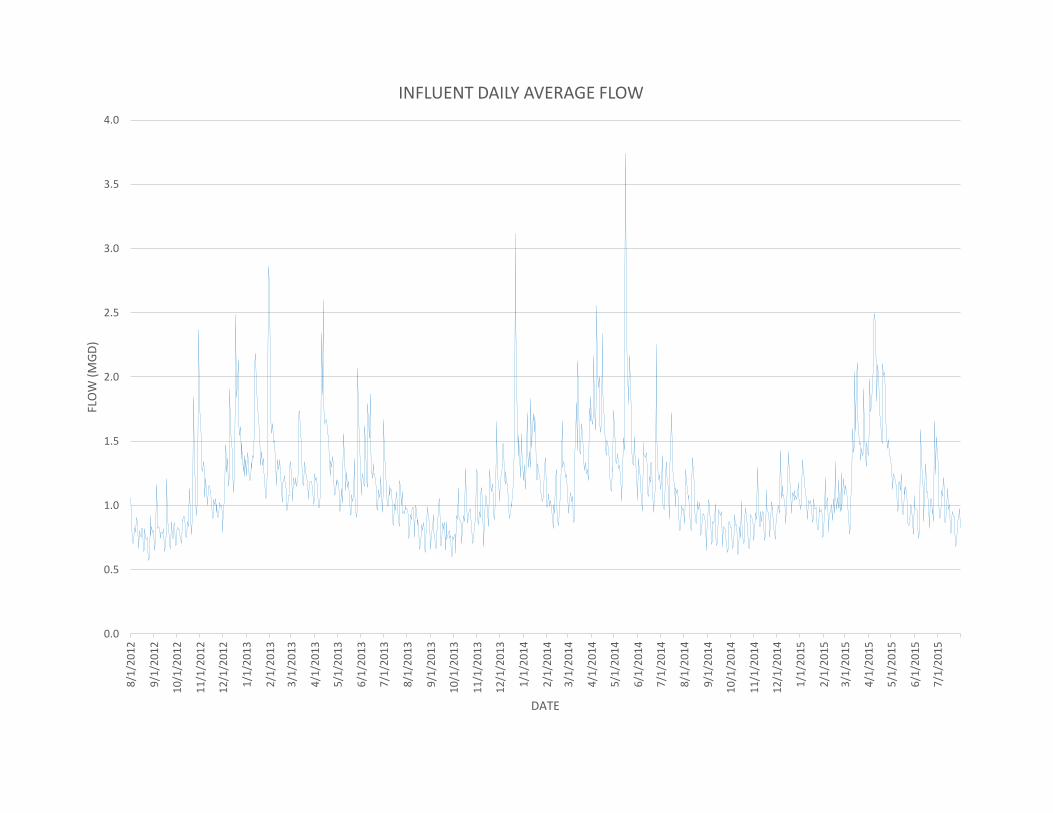
0.0
0.5
1.0
1.5
2.0
2.5
3.0
3.5
4.08
/1/2
01
2
9/1
/20
12
10
/1/2
01
2
11
/1/2
01
2
12
/1/2
01
2
1/1
/20
13
2/1
/20
13
3/1
/20
13
4/1
/20
13
5/1
/20
13
6/1
/20
13
7/1
/20
13
8/1
/20
13
9/1
/20
13
10
/1/2
01
3
11
/1/2
01
3
12
/1/2
01
3
1/1
/20
14
2/1
/20
14
3/1
/20
14
4/1
/20
14
5/1
/20
14
6/1
/20
14
7/1
/20
14
8/1
/20
14
9/1
/20
14
10
/1/2
01
4
11
/1/2
01
4
12
/1/2
01
4
1/1
/20
15
2/1
/20
15
3/1
/20
15
4/1
/20
15
5/1
/20
15
6/1
/20
15
7/1
/20
15
FLO
W (
MG
D)
DATE
INFLUENT DAILY AVERAGE FLOW

0.0
0.5
1.0
1.5
2.0
2.5
3.0
3.5
4.0
4.5
5.0
5.58
/1/2
01
2
9/1
/20
12
10
/1/2
01
2
11
/1/2
01
2
12
/1/2
01
2
1/1
/20
13
2/1
/20
13
3/1
/20
13
4/1
/20
13
5/1
/20
13
6/1
/20
13
7/1
/20
13
8/1
/20
13
9/1
/20
13
10
/1/2
01
3
11
/1/2
01
3
12
/1/2
01
3
1/1
/20
14
2/1
/20
14
3/1
/20
14
4/1
/20
14
5/1
/20
14
6/1
/20
14
7/1
/20
14
8/1
/20
14
9/1
/20
14
10
/1/2
01
4
11
/1/2
01
4
12
/1/2
01
4
1/1
/20
15
2/1
/20
15
3/1
/20
15
4/1
/20
15
5/1
/20
15
6/1
/20
15
7/1
/20
15
FLO
W (
MG
D)
DATE
INFLUENT PEAK FLOW

Village of Wellsville
Average Temperatures
Month Avg. Inf. Temp Avg. Eff. Temp
Aug-12 21 21
Sep-12 20 19
Oct-12 17 16
Nov-12 14 11
Dec-12 12 10
Jan-13 10 9
Feb-13 9 8
Mar-13 9 9
Apr-13 11 11
May-13 15 16
Jun-13 17 18
Jul-13 20 21
Aug-13 20 20 SUMMER
Sep-13 20 19 FALL
Oct-13 18 16 WINTER
Nov-13 14 11 SPRING
Dec-13 11 9
Jan-14 10 7
Feb-14 9 7
Mar-14 8 7
Apr-14 10 10
May-14 14 14
Jun-14 17 18
Jul-14 19 19
Aug-14 19 20
Sep-14 19 19
Oct-14 18 16
Nov-14 14 11
Dec-14 12 10
Jan-15 10 8
Feb-15 9 7
Mar-15 9 8
Apr-15 10 10
May-15 15 16
Jun-15 18 19
Jul-15 19 20
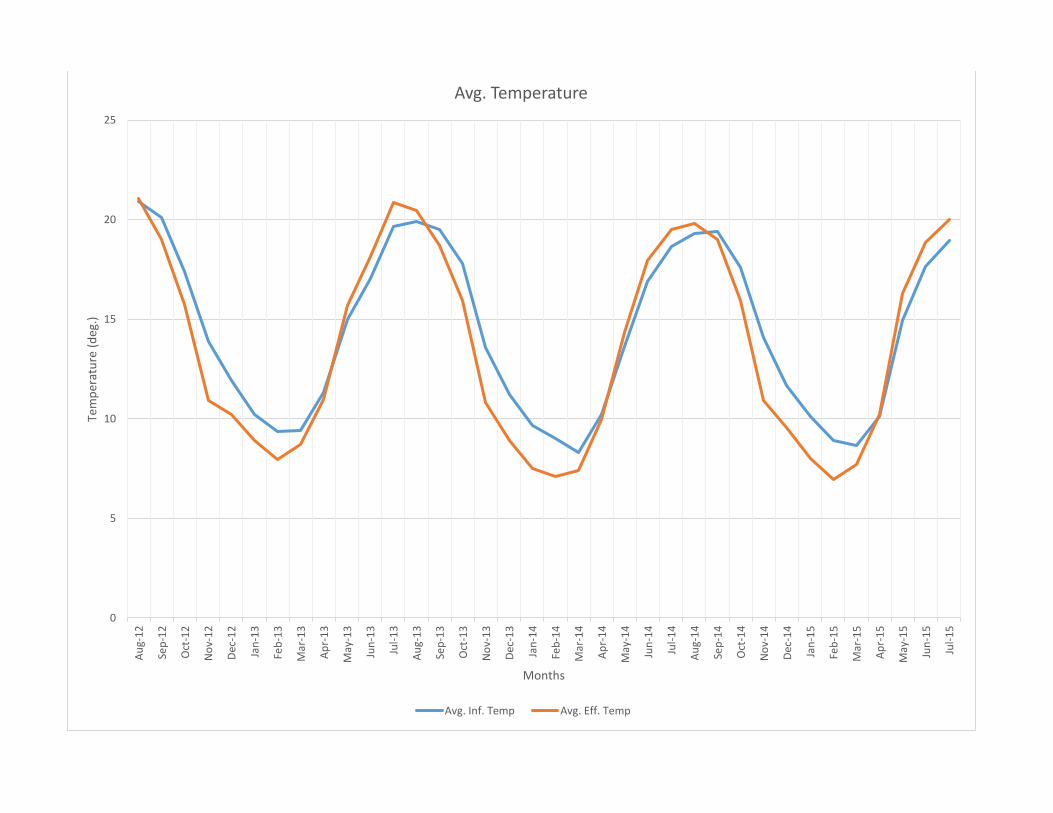
0
5
10
15
20
25
Au
g-1
2
Sep
-12
Oct
-12
No
v-1
2
Dec
-12
Jan
-13
Feb
-13
Mar
-13
Ap
r-1
3
May
-13
Jun
-13
Jul-
13
Au
g-1
3
Sep
-13
Oct
-13
No
v-1
3
Dec
-13
Jan
-14
Feb
-14
Mar
-14
Ap
r-1
4
May
-14
Jun
-14
Jul-
14
Au
g-1
4
Sep
-14
Oct
-14
No
v-1
4
Dec
-14
Jan
-15
Feb
-15
Mar
-15
Ap
r-1
5
May
-15
Jun
-15
Jul-
15
Tem
per
atu
re (
deg
.)
Months
Avg. Temperature
Avg. Inf. Temp Avg. Eff. Temp

Village of Wellsville Preliminary Engineering Report
Wastewater Treatment Plant August 2016
MRB Group Project No. 2314.15001
APPENDIX E
LEACHATE DATA

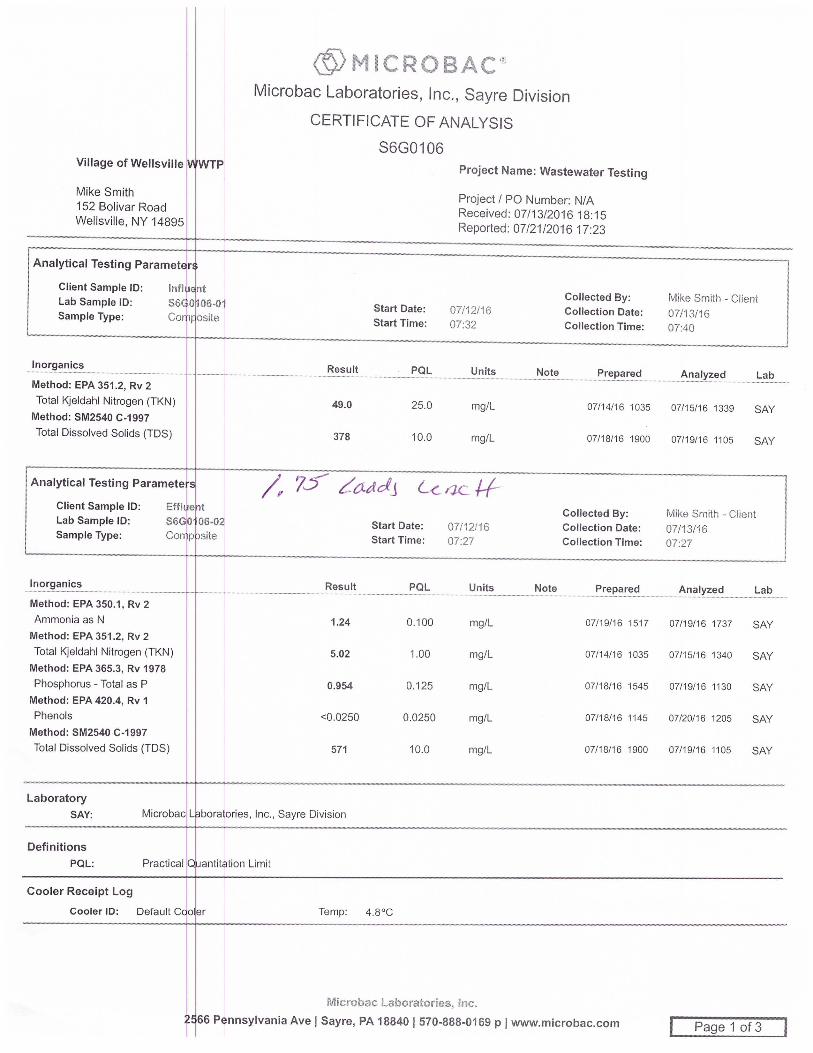
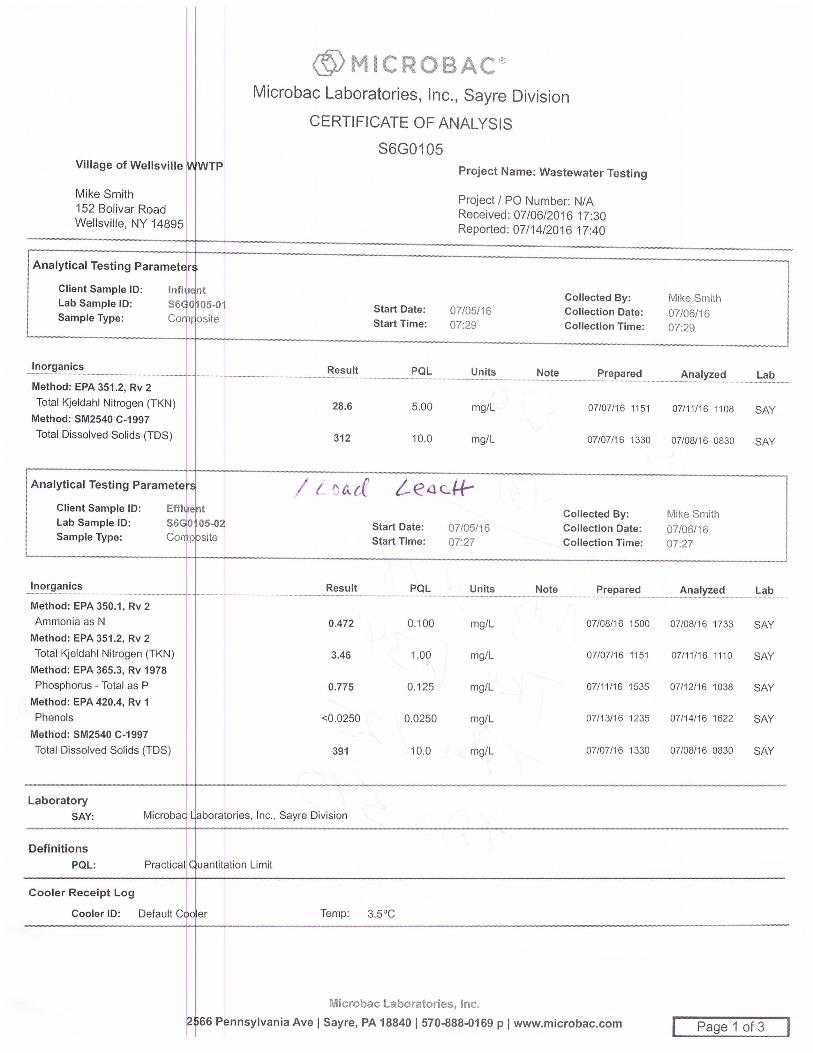


Village of Wellsville Preliminary Engineering Report
Wastewater Treatment Plant August 2016
MRB Group Project No. 2314.15001
APPENDIX F
WWTP DESIGN PARAMETERS

Village of Wellsville
WWTP Design Parameters
Job No:
Page: 1 of 1
Project Name: Date:
Existing Future Total Design
1.15 1.05 2.20 2.20
1.82 1.57 3.39 3.50
3.74 2.09 5.84 6.00
5.00 3.43 8.43 7.50
173 220 194 220
1631 1921 3552 3575
148 220 181 176
2240 2882 5122 5150
229 220 224 230
2184 1921 4105 4150
320 190 260 275
4843 2489 7332 7350
25 25 25 26
240 218 459 475
25 25 25 25
378 327 706 720
25 40 30 31
203 349 552 560
24 35 29 28
356 458 814 820
8 8 8 10
77 70 147 150
8 8 8 8
121 105 226 230
Peak Factor - Max Month 1.57 1.50 1.59
Peak Factor - Max Day 3.25 2.00 2.73
Peak Factor - Peak Hourly 4.34 3.28 3.41
Environmental Conditions
Min. Wastewater Temp. (Degrees C) 6
Max. Wastewater Temp. (Degrees C) 23
Site Elevation (ft above sea level) 1500
Fecal Coliform (No./100 ml)
Monthly Average
Monthly Average
Annual Average
Monthly Average
Monthly Max
Monthly Average
30TSS (mg/l)
7.0
Monthly AverageAmmonia (lbs/day) Jun1st- Oct31
st
25CBOD (mg/l)
Peak Hourly Flow (mgd)1
Max. Monthly Phosphorous (lbs/day) est.
Ave. Phosphorous (lbs/day) estimated
Max. Monthly Ammonia (lbs/day) est.
Max. Monthly CBOD (lbs/day)
Ave. TSS (lbs/day)
Max. Monthly TSS (lbs/day)
Ave. Ammonia (lbs/day) estimated
Max. Monthly TKN (mg/l)
Ave. TKN (lbs/day)
Effluent Parameters
Max. Monthly Ammonia (mg/L) est.
Existing and Future Design Parameters
2314.15001
Checked By: B.Davis
2/8/2016
Completed By: L.Bailey
V/O Wellsville WWTP
Ave. Daily Flow (mgd)
Subject:
Influent Parameters
Ave. Ammonia (mg/l) estimated
Monitor
1
Ave. CBOD (mg/l)
Max. Monthly Flow (mgd)
Max. Daily Flow (mgd)
Ave. CBOD (lbs/day)
128
Ammonia (mg/L) Jun1st- Oct31
st
Max. Monthly CBOD (mg/l)
Ave Phosphorous (mg/l) estimated
Ave. TKN (mg/l)
Design
Max. Monthly TKN (lbs/day)
Max. Monthly Phosphorous (mg/l) est.
Ave. TSS (mg/l)
Max. Monthly TSS (mg/L)
1: Need to reduce I+I to lower future design PHF. Under current conditions, future design PHF would be 8.50
Ammonia (lbs/day) Nov 1st - May 31
st239 Monthly Average
Ammonia (mg/L) Nov 1st
- May 31st
13.0 Monthly Average
200
Total Nitrogen (mg/l)
Total Phosphorous (mg/l)3
N:\2314.15001.000\Calcs\Wellsville Design Parameters-2.2mgd.xlsx - Design Parameters
Village of Wellsville Preliminary Engineering Report
Wastewater Treatment Plant August 2016
MRB Group Project No. 2314.15001
APPENDIX G
WWTP CAPACITY EVALUATION
CALCULATIONS

Village of Wellsville
WWTP Evaluation
Unit Process Capacity Evaluation
Influent Loadings
2314.15001
8/3/2016Plant Existing Future Total Plant Design Notes
Population 4331 433.1 4764 4800 (1)
Growth rate 10.0%
Average Daily Flow (MGD) 1.15 1.05 2.20 2.20 (2)
Max Month Average Daily Flow (MGD) 1.82 1.57 3.39 3.50 (2)
Peak Flow (MGD) 5.00 3.43 8.43 7.50 (2)(3)
ADF-MMF peaking factor 1.57 1.50 - 1.59
ADF-PHF peaking factor 4.34 3.28 - 3.41
BOD influent loading @ ADF (lb/d) 1631 1921 3552 3575 (4)
BOD influent concentration @ ADF (mg/L) 173 220 194 220
TSS influent loading @ ADF (lb/d) 2184 1921 4105 4150 (4)
TSS influent concentration @ ADF (mg/L) 229 220 224 230
BOD influent loading @ MMF (lb/d) 2240 2882 5122 5150 (4)
BOD influent concentration @ MMF (mg/L) 148 220 181 176
TSS influent loading @ MMF (lb/d) 4843 2489 7332 7350 (4)
TSS influent concentration @ MMF (mg/L) 320 190 260 275
Notes:
1 GFLRPC projections 2010-2040. Projection shows decrease in Town; conservatively assume no change.
2 Loading proportioned by flow.
3 TP influent concentration assumed based on 85% removal rate to meet effluent limit of 1.0 mg/L.
Influent Loadings

Village of Wellsville
WWTP Evaluation
Unit Process Capacity Evaluation
EX PC
2314.15001
8/3/2016
PhaseFlow
regimeQ
Q max,
overflow
surf
Actual
SOR
Q max,
overflow
weir
Q
actual,
overflow
weir
t, det,
PC#1
BOD
removed,
PC#1
TSS
remove
d, PC#1
MBOD,
PC#1 in
MBOD,
PC#1 out
XBOD,
PC#1
out
MTSS,
PC#1 in
MTSS, PC#1
out
MTSS,
PC#1
sludge
Q, PC#1
sludge
MGD MGD g/d*sf MGD g/d/lf hr lb/d lb/d mg/L lb/d lb/d lb/d gpd
Existing ADF 1.15 2.40 480 OK 3.6 38% 62% 1631 1011 105 2184 825 1359 5432
Existing MMF 1.82 2.40 756 OK 2.3 36% 58% 2240 1435 95 4843 2037 2806 11216
Existing PHF 5.00 4.80 2083 NG 7.20 20833 OK
Design ADF 2.20 2.40 917 OK 1.9 34% 56% 3575 2362 129 4150 1838 2312 9241
Design MMF 3.50 2.40 1458 NG 1.2 29% 49% 5150 3682 126 7350 3726 3624 14485
Design PHF 7.50 4.80 3125 NG 7.20 31250 NG
Design parameters Design equations
# of tanks, PC 3 ea
Length, PC's 50 ft Q max, overflow surf = (A surf, PC) x (Overflow surf, max)
Width, PC's 16 ft Q max, overflow weir = (L, weir total, PC) x (Overflow weir, max)
A,surface total PC's 2400 sf t, det, PC = (V, PC) / Q
H, PC's 9.7 ft % BOD removed, PC = (t, det, PC) / [0.018 + 0.020 x (t, det, PC)] / 100
V, PC's 23280 cf % TSS removed, PC = (t, det, PC) / [0.0075 + 0.014 x (t, det, PC)] / 100
174134 gal
L, weir total, PC's 240 ft
Overflow surf, max, ADF, TF only 1000 gpd/sf
Overflow surf, max, PHF 2000 gpd/sf
Overflow weir, max, PHF (ADF < 1 MGD) 20000 gpd/ft
Overflow weir, max, PHF (ADF > 1 MGD) 30000 gpd/ft
XTSS, PC sludge 30000 mg/L
N:\2314.15001.000\Calcs\Wellsville Unit Process Capacity Evaluations.xlsx:EX PC Page 2 of 9
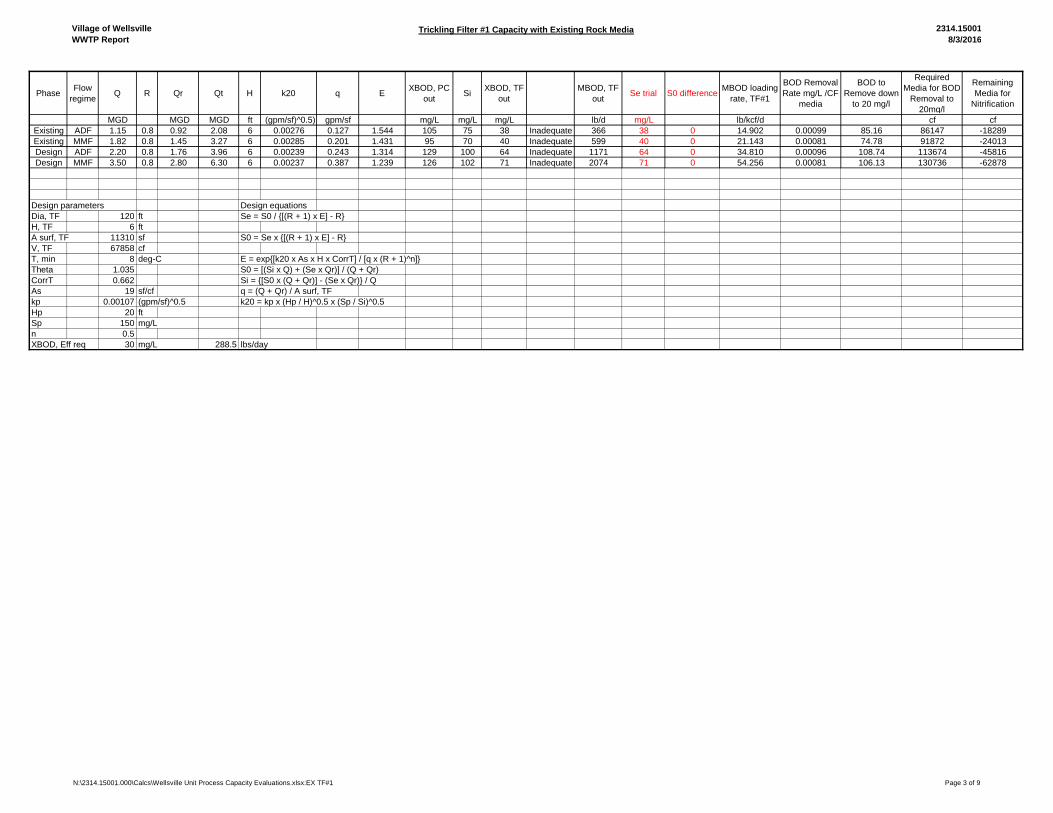
Village of Wellsville
WWTP ReportTrickling Filter #1 Capacity with Existing Rock Media 2314.15001
8/3/2016
PhaseFlow
regimeQ R Qr Qt H k20 q E
XBOD, PC
outSi
XBOD, TF
out
MBOD, TF
outSe trial S0 difference
MBOD loading
rate, TF#1
BOD Removal
Rate mg/L /CF
media
BOD to
Remove down
to 20 mg/l
Required
Media for BOD
Removal to
20mg/l
Remaining
Media for
Nitrification
MGD MGD MGD ft (gpm/sf)^0.5) gpm/sf mg/L mg/L mg/L lb/d mg/L lb/kcf/d cf cf
Existing ADF 1.15 0.8 0.92 2.08 6 0.00276 0.127 1.544 105 75 38 Inadequate 366 38 0 14.902 0.00099 85.16 86147 -18289
Existing MMF 1.82 0.8 1.45 3.27 6 0.00285 0.201 1.431 95 70 40 Inadequate 599 40 0 21.143 0.00081 74.78 91872 -24013
Design ADF 2.20 0.8 1.76 3.96 6 0.00239 0.243 1.314 129 100 64 Inadequate 1171 64 0 34.810 0.00096 108.74 113674 -45816
Design MMF 3.50 0.8 2.80 6.30 6 0.00237 0.387 1.239 126 102 71 Inadequate 2074 71 0 54.256 0.00081 106.13 130736 -62878
Design parameters Design equations
Dia, TF 120 ft Se = S0 / {[(R + 1) x E] - R}
H, TF 6 ft
A surf, TF 11310 sf S0 = Se x {[(R + 1) x E] - R}
V, TF 67858 cf
T, min 8 deg-C E = exp{[k20 x As x H x CorrT] / [q x (R + 1)^n]}
Theta 1.035 S0 = [(Si x Q) + (Se x Qr)] / (Q + Qr)
CorrT 0.662 Si = {[S0 x (Q + Qr)] - (Se x Qr)} / Q
As 19 sf/cf q = (Q + Qr) / A surf, TF
kp 0.00107 (gpm/sf)^0.5 k20 = kp x (Hp / H)^0.5 x (Sp / Si)^0.5
Hp 20 ft
Sp 150 mg/L
n 0.5
XBOD, Eff req 30 mg/L 288.5 lbs/day
N:\2314.15001.000\Calcs\Wellsville Unit Process Capacity Evaluations.xlsx:EX TF#1 Page 3 of 9

Village of Wellsville
WWTP ReportTrickling Filter #1 Capacity with Poposed Plastic Media 2314.15001
8/3/2016
PhaseFlow
regimeQ R Qr Qt H k20 q E
XBOD, PC
outSi
XBOD, TF
out
MBOD, TF
outSe trial S0 difference
MBOD loading
rate, TF#1
BOD Removal
Rate mg/L /CF
media
BOD to
Remove down
to 20 mg/l
Required
Media for BOD
Removal to
20mg/l
Remaining
Media for
Nitrification
MGD MGD MGD ft (gpm/sf)^0.5) gpm/sf mg/L mg/L mg/L lb/d mg/L lb/kcf/d cf cf
Existing ADF 1.15 0.0 0.00 1.15 6 0.00233 0.071 5.319 105 105 20 OK 190 20 0 14.902 0.00126 85.16 81212 -13353
Existing MMF 1.82 0.0 0.00 1.82 6 0.00246 0.111 4.068 95 95 23 OK 353 23 0 21.143 0.00105 74.78 85191 -17333
Design ADF 2.20 0.0 0.00 2.20 6 0.00211 0.135 2.985 129 129 43 Inadequate 791 43 0 34.810 0.00126 108.74 103435 -35577
Design MMF 3.50 0.0 0.00 3.50 6 0.00213 0.215 2.401 126 126 53 Inadequate 1533 53 0 54.256 0.00108 106.13 117425 -49567
Design parameters Design equations
Dia, TF 120 ft Se = S0 / {[(R + 1) x E] - R}
H, TF 6 ft
A surf, TF 11310 sf S0 = Se x {[(R + 1) x E] - R}
V, TF 67858 cf
T, min 8 deg-C E = exp{[k20 x As x H x CorrT] / [q x (R + 1)^n]}
Theta 1.035 S0 = [(Si x Q) + (Se x Qr)] / (Q + Qr)
CorrT 0.662 Si = {[S0 x (Q + Qr)] - (Se x Qr)} / Q
As 48 sf/cf q = (Q + Qr) / A surf, TF
kp 0.00107 (gpm/sf)^0.5 k20 = kp x (Hp / H)^0.5 x (Sp / Si)^0.5
Hp 20 ft
Sp 150 mg/L
n 0.5
XBOD, Eff req 30 mg/L 288.5 lbs/day
FS 1.2
N:\2314.15001.000\Calcs\Wellsville Unit Process Capacity Evaluations.xlsx:PR TF#1 Page 4 of 9
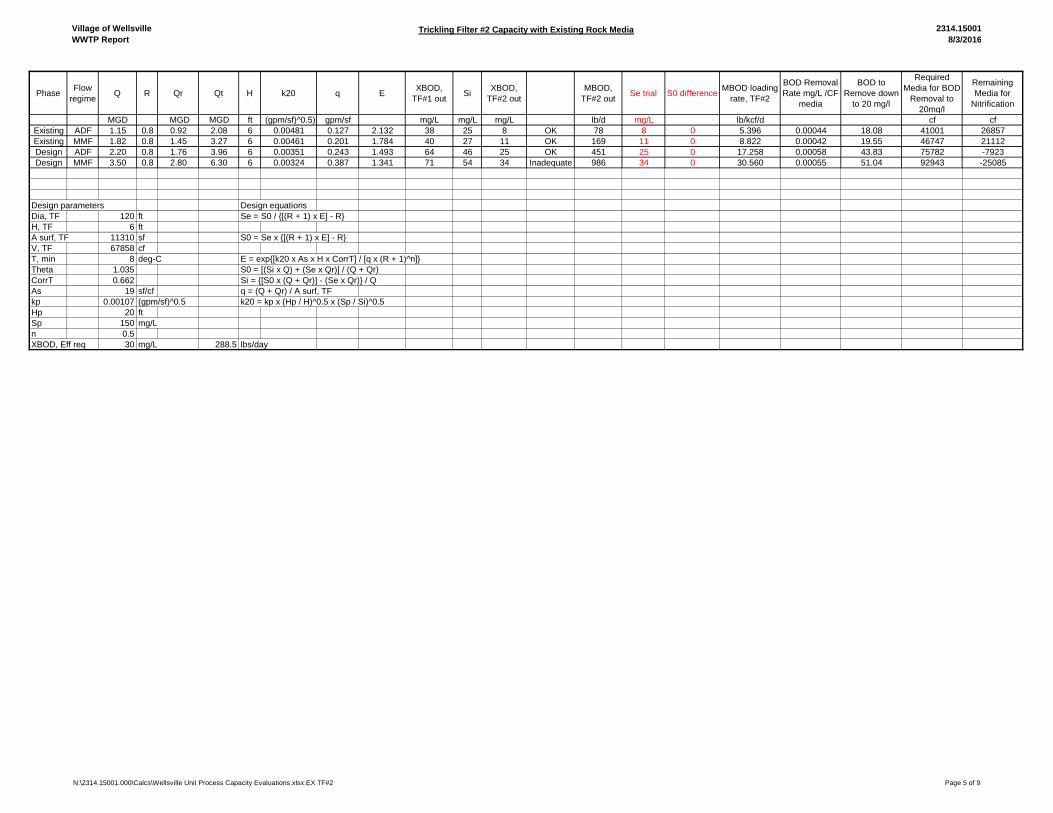
Village of Wellsville
WWTP ReportTrickling Filter #2 Capacity with Existing Rock Media 2314.15001
8/3/2016
PhaseFlow
regimeQ R Qr Qt H k20 q E
XBOD,
TF#1 outSi
XBOD,
TF#2 out
MBOD,
TF#2 outSe trial S0 difference
MBOD loading
rate, TF#2
BOD Removal
Rate mg/L /CF
media
BOD to
Remove down
to 20 mg/l
Required
Media for BOD
Removal to
20mg/l
Remaining
Media for
Nitrification
MGD MGD MGD ft (gpm/sf)^0.5) gpm/sf mg/L mg/L mg/L lb/d mg/L lb/kcf/d cf cf
Existing ADF 1.15 0.8 0.92 2.08 6 0.00481 0.127 2.132 38 25 8 OK 78 8 0 5.396 0.00044 18.08 41001 26857
Existing MMF 1.82 0.8 1.45 3.27 6 0.00461 0.201 1.784 40 27 11 OK 169 11 0 8.822 0.00042 19.55 46747 21112
Design ADF 2.20 0.8 1.76 3.96 6 0.00351 0.243 1.493 64 46 25 OK 451 25 0 17.258 0.00058 43.83 75782 -7923
Design MMF 3.50 0.8 2.80 6.30 6 0.00324 0.387 1.341 71 54 34 Inadequate 986 34 0 30.560 0.00055 51.04 92943 -25085
Design parameters Design equations
Dia, TF 120 ft Se = S0 / {[(R + 1) x E] - R}
H, TF 6 ft
A surf, TF 11310 sf S0 = Se x {[(R + 1) x E] - R}
V, TF 67858 cf
T, min 8 deg-C E = exp{[k20 x As x H x CorrT] / [q x (R + 1)^n]}
Theta 1.035 S0 = [(Si x Q) + (Se x Qr)] / (Q + Qr)
CorrT 0.662 Si = {[S0 x (Q + Qr)] - (Se x Qr)} / Q
As 19 sf/cf q = (Q + Qr) / A surf, TF
kp 0.00107 (gpm/sf)^0.5 k20 = kp x (Hp / H)^0.5 x (Sp / Si)^0.5
Hp 20 ft
Sp 150 mg/L
n 0.5
XBOD, Eff req 30 mg/L 288.5 lbs/day
N:\2314.15001.000\Calcs\Wellsville Unit Process Capacity Evaluations.xlsx:EX TF#2 Page 5 of 9

Village of Wellsville
WWTP ReportTrickling Filter #2 Capacity with Proposed Plastic Media 2314.15001
8/3/2016
PhaseFlow
regimeQ R Qr Qt H k20 q E
XBOD,
TF#1 outSi
XBOD,
TF#2 out
MBOD,
TF#2 outSe trial S0 difference
MBOD loading
rate, TF#2
BOD Removal
Rate mg/L /CF
media
BOD to
Remove down
to 20 mg/l
Required
Media for BOD
Removal to
20mg/l
Remaining
Media for
Nitrification
MGD MGD MGD ft (gpm/sf)^0.5) gpm/sf mg/L mg/L mg/L lb/d mg/L lb/kcf/d cf cf
Existing ADF 1.15 0.0 0.00 1.15 6 0.00538 0.071 47.199 20 20 0 OK 4 0 0 2.802 0.00029 0.00 0 67858
Existing MMF 1.82 0.0 0.00 1.82 6 0.00496 0.111 16.942 23 23 1 OK 21 1 0 5.198 0.00032 0.00 0 67858
Design ADF 2.20 0.0 0.00 2.20 6 0.00364 0.135 6.614 43 43 7 OK 120 7 0 11.663 0.00054 23.13 42877 24981
Design MMF 3.50 0.0 0.00 3.50 6 0.00330 0.215 3.885 53 53 14 OK 395 14 0 22.597 0.00057 32.53 56588 11270
Design parameters Design equations
Dia, TF 120 ft Se = S0 / {[(R + 1) x E] - R}
H, TF 6 ft
A surf, TF 11310 sf S0 = Se x {[(R + 1) x E] - R}
V, TF 67858 cf
T, min 8 deg-C E = exp{[k20 x As x H x CorrT] / [q x (R + 1)^n]}
Theta 1.035 S0 = [(Si x Q) + (Se x Qr)] / (Q + Qr)
CorrT 0.662 Si = {[S0 x (Q + Qr)] - (Se x Qr)} / Q
As 48 sf/cf q = (Q + Qr) / A surf, TF
kp 0.00107 (gpm/sf)^0.5 k20 = kp x (Hp / H)^0.5 x (Sp / Si)^0.5
Hp 20 ft
Sp 150 mg/L
n 0.5
XBOD, Eff req 30 mg/L 288.5 lbs/day
N:\2314.15001.000\Calcs\Wellsville Unit Process Capacity Evaluations.xlsx:PR TF#2 Page 6 of 9

Village of Wellsville
WWTP Evaluation
Unit Process Capacity Evaluation
Existing Final Clarifiers
2314.15001
8/3/2016
PhaseFlow
regimeQ
Q max,
overflow
surf
Q actual,
overflow surf
Q max,
overflow weir
Q actual,
overflow
weir
MTSS,
TF#2 out
MBOD,
TF#2 out
MVSS in
BOD,
TF#2 out
MTSS in
BOD,
TF#2
out
MTSS,
FC in
MTSS,
FC
sludge
Q, FC
sludge
MTSS,
FC out
XTSS, FC
out
MGD MGD gpd/sf MGD lb/d lb/d lb/d lb/d lb/d lb/d gpd lb/d mg/L
Existing ADF 1.15 3.39 306 OK 8.2 78.4 39.2 49.0 57.2 51.5 411.4 5.7 0.6
Existing MMF 1.82 3.39 481 OK 11.2 169.1 84.6 105.7 116.9 105.2 840.8 11.7 0.8
Existing PHF 5.00 3.39 1326 NG 11.31 13263 OK
Design ADF 2.20 3.39 584 OK 24.6 451.0 225.5 281.9 306.5 275.8 2204.9 30.6 1.7
Design MMF 3.50 3.39 928 NG 33.8 985.9 493.0 616.2 650.0 585.0 4676.1 65.0 2.2
Design PHF 7.50 3.39 1989 NG 11.31 19894 OK
Design parameters 3 ea Design equations
D, FC 40 ft
Area, FC 1257 sf Q max, overflow surf = A surf, PST x Overflow surf max, PST
H, FC 10.000 ft Q max, overflow weir = L, weir total, SST x Overflow weir max, SST
V , FC 12566 cf MVSS in BOD, TF#2 out = (MBOD, PST out - MBOD, TF#2 out) x F/M ratio, TF#2
93996 gal MTSS in BOD, TF#2 out = MVSS in BOD, TF#2 out / Volatile fraction, TSS
L, weir ea, FC 126 ft MTSS, SST in = (MTSS, PST out + MTSS in BOD, TF#2 out) x TSS capture, SST
Area total FC's 3770 sf
Volume total FC's 37699 cf
281989 gal
Length Weir total FC's 377 ft
Overflow, surf max, PHF, FC's 1200 gpd/sf
Overflow, surf max (alum), PHF, FC's 900 gpd/sf
Overflow, weir max, PHF, FC's (ADF < 1 MGD) 20000 gpd/ft
Overflow, weir max, PHF, FC's (ADF > 1 MGD) 30000 gpd/ft
F/M ratio, TF 0.5 lb VSS/lb BOD
Volatile fraction, TSS 0.8
TSS capture, FC 90%
XTSS, FC sludge 15000 mg/L
XTSS, Eff req 30 mg/L
N:\2314.15001.000\Calcs\Wellsville Unit Process Capacity Evaluations.xlsx:EX FC Page 7 of 9

Village of Wellsville
WWTP Evaluation
Unit Process Capacity Evaluation
Proposed Final Clarifiers
2314.15001
8/3/2016
PhaseFlow
regimeQ
Q max,
overflow
surf
Q actual,
overflow surf
Q max,
overflow weir
Q actual,
overflow
weir
MTSS,
TF#2 out
MBOD,
TF#2 out
MVSS in
BOD,
TF#2 out
MTSS in
BOD,
TF#2
out
MTSS,
FC in
MTSS,
FC
sludge
Q, FC
sludge
MTSS,
FC out
XTSS, FC
out
MGD MGD gpd/sf MGD lb/d lb/d lb/d lb/d lb/d lb/d gpd lb/d mg/L
Existing ADF 1.15 4.52 229 OK 8.2 78.4 39.2 49.0 57.2 51.5 411.4 5.7 0.6
Existing MMF 1.82 4.52 361 OK 11.2 169.1 84.6 105.7 116.9 105.2 840.8 11.7 0.8
Existing PHF 5.00 4.52 995 NG 15.08 9947 OK
Design ADF 2.20 4.52 438 OK 24.6 451.0 225.5 281.9 306.5 275.8 2204.9 30.6 1.7
Design MMF 3.50 4.52 696 OK 33.8 985.9 493.0 616.2 650.0 585.0 4676.1 65.0 2.2
Design PHF 7.50 4.52 1492 NG 15.08 14921 OK
Design parameters 4 ea Design equations
D, FC 40 ft
Area, FC 1257 sf Q max, overflow surf = A surf, PST x Overflow surf max, PST
H, FC 10.000 ft Q max, overflow weir = L, weir total, SST x Overflow weir max, SST
V , FC 12566 cf MVSS in BOD, TF#2 out = (MBOD, PST out - MBOD, TF#2 out) x F/M ratio, TF#2
93996 gal MTSS in BOD, TF#2 out = MVSS in BOD, TF#2 out / Volatile fraction, TSS
L, weir ea, FC 126 ft MTSS, SST in = (MTSS, PST out + MTSS in BOD, TF#2 out) x TSS capture, SST
Area total FC's 5027 sf
Volume total FC's 50265 cf
281989 gal
Length Weir total FC's 503 ft
Overflow, surf max, PHF, FC's 1200 gpd/sf
Overflow, surf max (alum), PHF, FC's 900 gpd/sf
Overflow, weir max, PHF, FC's (ADF < 1 MGD) 20000 gpd/ft
Overflow, weir max, PHF, FC's (ADF > 1 MGD) 30000 gpd/ft
F/M ratio, TF 0.5 lb VSS/lb BOD
Volatile fraction, TSS 0.8
TSS capture, FC 90%
XTSS, FC sludge 15000 mg/L
XTSS, Eff req 30 mg/L
N:\2314.15001.000\Calcs\Wellsville Unit Process Capacity Evaluations.xlsx:PR FC Page 8 of 9
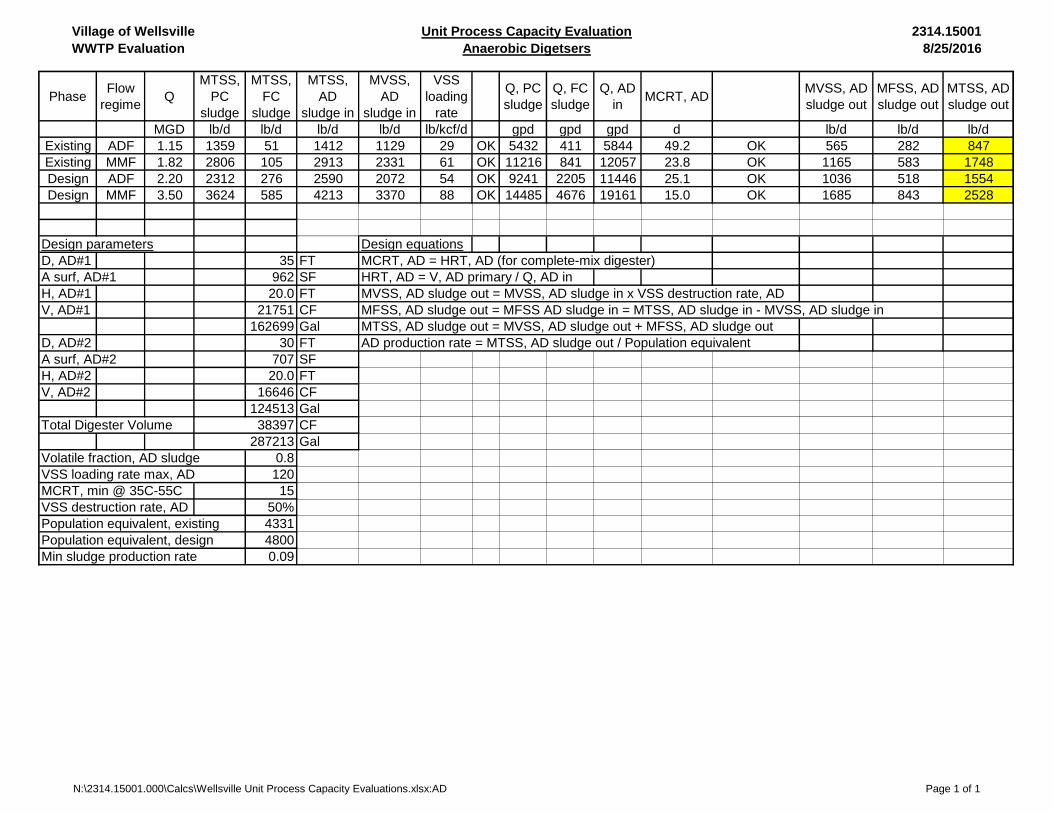
Village of Wellsville
WWTP Evaluation
Unit Process Capacity Evaluation
Anaerobic Digetsers
2314.15001
8/25/2016
PhaseFlow
regimeQ
MTSS,
PC
sludge
MTSS,
FC
sludge
MTSS,
AD
sludge in
MVSS,
AD
sludge in
VSS
loading
rate
Q, PC
sludge
Q, FC
sludge
Q, AD
inMCRT, AD
MVSS, AD
sludge out
MFSS, AD
sludge out
MTSS, AD
sludge out
MGD lb/d lb/d lb/d lb/d lb/kcf/d gpd gpd gpd d lb/d lb/d lb/d
Existing ADF 1.15 1359 51 1412 1129 29 OK 5432 411 5844 49.2 OK 565 282 847
Existing MMF 1.82 2806 105 2913 2331 61 OK 11216 841 12057 23.8 OK 1165 583 1748
Design ADF 2.20 2312 276 2590 2072 54 OK 9241 2205 11446 25.1 OK 1036 518 1554
Design MMF 3.50 3624 585 4213 3370 88 OK 14485 4676 19161 15.0 OK 1685 843 2528
Design parameters Design equations
D, AD#1 35 FT MCRT, AD = HRT, AD (for complete-mix digester)
A surf, AD#1 962 SF HRT, AD = V, AD primary / Q, AD in
H, AD#1 20.0 FT MVSS, AD sludge out = MVSS, AD sludge in x VSS destruction rate, AD
V, AD#1 21751 CF MFSS, AD sludge out = MFSS AD sludge in = MTSS, AD sludge in - MVSS, AD sludge in
162699 Gal MTSS, AD sludge out = MVSS, AD sludge out + MFSS, AD sludge out
D, AD#2 30 FT AD production rate = MTSS, AD sludge out / Population equivalent
A surf, AD#2 707 SF
H, AD#2 20.0 FT
V, AD#2 16646 CF
124513 Gal
Total Digester Volume CF
Gal
Volatile fraction, AD sludge 0.8
VSS loading rate max, AD 120
MCRT, min @ 35C-55C 15
VSS destruction rate, AD 50%
Population equivalent, existing 4331
Population equivalent, design 4800
Min sludge production rate 0.09
38397
287213
N:\2314.15001.000\Calcs\Wellsville Unit Process Capacity Evaluations.xlsx:AD Page 1 of 1

Village of Wellsville Preliminary Engineering Report
Wastewater Treatment Plant August 2016
MRB Group Project No. 2314.15001
APPENDIX H
PROJECT COST ESTIMATES

Village of Wellsville
Cost Estimates
Item Description Unit Price Quantity Units Cost
Site Grading 40,000.00$ 1 LS 40,000.00$
Site Piping 125,000.00$ 1 LS 125,000.00$
Rehab Gate Valves 3,500.00$ 4 EA 14,000.00$
Rehab Drainage Inlets 2,500.00$ 6 EA 15,000.00$
Site Restoration 40,000.00$ 1 LS 40,000.00$
Site Asphalt Drives 3.00$ 35000 SF 105,000.00$
Subtotal
Item Description Unit Price Quantity Units Cost
Existing Rock Media Removal and Tank Cleaning 75,000.00$ 2 EA 150,000.00$
Recoat Concrete Walls and Base 7.00$ 27250 SF 190,750.00$
Filter Dome Covers 237,500.00$ 2 EA 475,000.00$
New Plastic Media 7.00$ 135720 CF 950,040.00$
Media Supports (underdrain) 100,000.00$ 2 EA 200,000.00$
Motor Driven Distibutor and arms (Stainless) 128,140.00$ 2 EA 256,280.00$
Trickling Filter Feed Pumps 35,000.00$ 3 EA 105,000.00$
Subtotal
Item Description Unit Price Quantity Units Cost
New 50,000 Gallon Storage Tank 800.00$ 122 CY 97,600.00$
Coat Concrete Tank Walls and Base 8.00$ 2625 SF 21,000.00$
Subtotal
Item Description Unit Price Quantity Units Cost
Reline VC 8" Sewer Main 60.00$ 7500 LF 450,000.00$
Repair and seal 5 Manholes 2,500.00$ 5 EA 12,500.00$
Subtotal
Item Description Unit Price Quantity Units Cost
New S.S. Through Flow Screen and Compactor 145,000.00$ 1 EA 145,000.00$
New NEMA 4X Control Panel 2,500.00$ 1 EA 2,500.00$
Ultrasonic Level Sensor 5,000.00$ 1 EA 5,000.00$
Fiberglass Enclosure Structure and Base 100,000.00$ 1 LS 100,000.00$
Subtotal
Item Description Unit Price Quantity Units Cost
UV disinfection equipment 210,000.00$ 1 LS 210,000.00$
Concrete tank modifications 50,000.00$ 1 LS 50,000.00$
Pole barn structure 80.00$ 1500 SF 120,000.00$
Subtotal
Item Description Unit Price Quantity Units Cost
Replace/Rebuild Existing Final Mechanicals 130,000.00$ 2 EA 260,000.00$
Recoat Existing Final Concrete tanks 8.00$ 7540 SF 60,320.00$
Polymer Mixing and Feed System 8,000.00$ 1 EA 8,000.00$
Bulk Chemical Tanks 1,750.00$ 3 EA 5,250.00$
Chemical Piping 50.00$ 1000 LF 50,000.00$
Chemical Mixers 4,500.00$ 2 EA 9,000.00$
New 40' Diameter Final Clarifier Concrete Tank 800.00$ 135 CY 108,000.00$
Coat Final Clarifier Concrete Wall and Base 8.00$ 2515 SF 20,120.00$
New Final Clarifier Mechanicals 130,000.00$ 1 EA 130,000.00$
Subtotal
Item Description Unit Price Quantity Units Cost
Dewater and Clean Digester 100,000.00$ 1 EA 100,000.00$
New Sludge Mixing System 80,000.00$ 1 EA 80,000.00$
New Sludge Heating System 210,000.00$ 1 EA 210,000.00$
Replace Raw Sludge Pumps 5,000.00$ 2 EA 10,000.00$
Replace De Watering Pump 7,500.00$ 1 EA 7,500.00$
Belt Filter Press Replacement 300,000.00$ 1 EA 300,000.00$
Subtotal
Item Description Unit Price Quantity Units Cost
New SCADA System 325,000.00$ 1 EA 325,000.00$
New Phosphorus Analyzer 15,000.00$ 1 EA 15,000.00$
Subtotal
Mobilization, bonds and insurance
Subtotal GC Costs
Subtotal EC Costs
Subtotal HVAC Costs
Subtotal PC Costs
CONSTRUCTION COSTS
Construction contingency (15%)
TOTAL CONSTRUCTION COSTS
Engineering, bidding and construction services
Admin, financial, bonding and legal services
SUBTOTAL ADMINISTRATIVE COSTS
TOTAL PROJECT COST
New Influent Screen
Effluent UV Disinfection System
380,000.00$
301,193.00$
CONSTRUCTION
339,000.00$
7,288,870.60$
1,093,300.00$
240,954.40$
722,863.20$
446,000.00$
New SCADA and Components
340,000.00$
Inflow and Infiltration Improvements
6,023,860.00$
707,500.00$
TRICKLING FILTERS
SITEWORK
Solids Digestion and Dewatering
Phosphorus Removal and Final Clarification
650,690.00$
252,500.00$
462,500.00$
Leachate Storage
118,600.00$
2,327,070.00$
1,457,800.00$
364,400.00$
1,822,200.00$
ADMINISTRATIVE COSTS
8,382,170.60$
10,204,000.00$

Village of Wellsville
WWTP Improvements
Cost Estimate Per Existing EDU 2314.15001
8/25/2016
Total Project Cost 10,204,000.00$ Existing O&M Cost Per EDU 176.35$
Loan Rate 4.50% Current Debt Service Per EDU 19.15$
Loan Period 30 Existing Annual Cost Per EDU 195.50$
New Debt Service 626,439$
Existing Debt Service 81,750.00$ Proposed Annual Debt Service Per EDU 146.72$
Total Annual Debt Service 708,189$ Proposed O&M Increase Per EDU 0.35$
O&M Annual Cost 752,952.00$ Proposed Annual Cost Per EDU Increase 147.07$
Total Proposed Annual Cost 1,461,141.30$
EDUs 4,270 Proposed Annual Cost Per EDU 343$
Proposed Annual Cost Per EDU (Present Value) 342$
percent increase 75%
Capital Project @ 4.5% Financing
EDU COST EDU COST BREAKDOWN
N:\2314.15001.000\Calcs\Wellsville Cost Estimates.xlsx:EDU Page 1 of 2

Village of Wellsville
WWTP Improvements
Cost Estimate Per Existing EDU 2314.15001
8/25/2016
Total Project Cost 10,204,000.00$ Existing O&M Cost Per EDU 176.35$
Loan Rate 0.00% Current Debt Service Per EDU 19.15$
Loan Period 30 Existing Annual Cost Per EDU 195.50$
New Debt Service 340,133$
Existing Debt Service 81,750.00$ Proposed Annual Debt Service Per EDU 79.66$
Total Annual Debt Service 421,883$ Proposed O&M Increase Per EDU 0.35$
O&M Annual Cost 752,952.00$ Proposed Annual Cost Per EDU Increase 80.01$
Total Proposed Annual Cost 1,174,835.33$
EDUs 4,270 Proposed Annual Cost Per EDU 276$
Proposed Annual Cost Per EDU (Present Value) 275$
percent increase 41%
Capital Project @ 0% Financing
EDU COST EDU COST BREAKDOWN
N:\2314.15001.000\Calcs\Wellsville Cost Estimates.xlsx:EDU Page 2 of 2
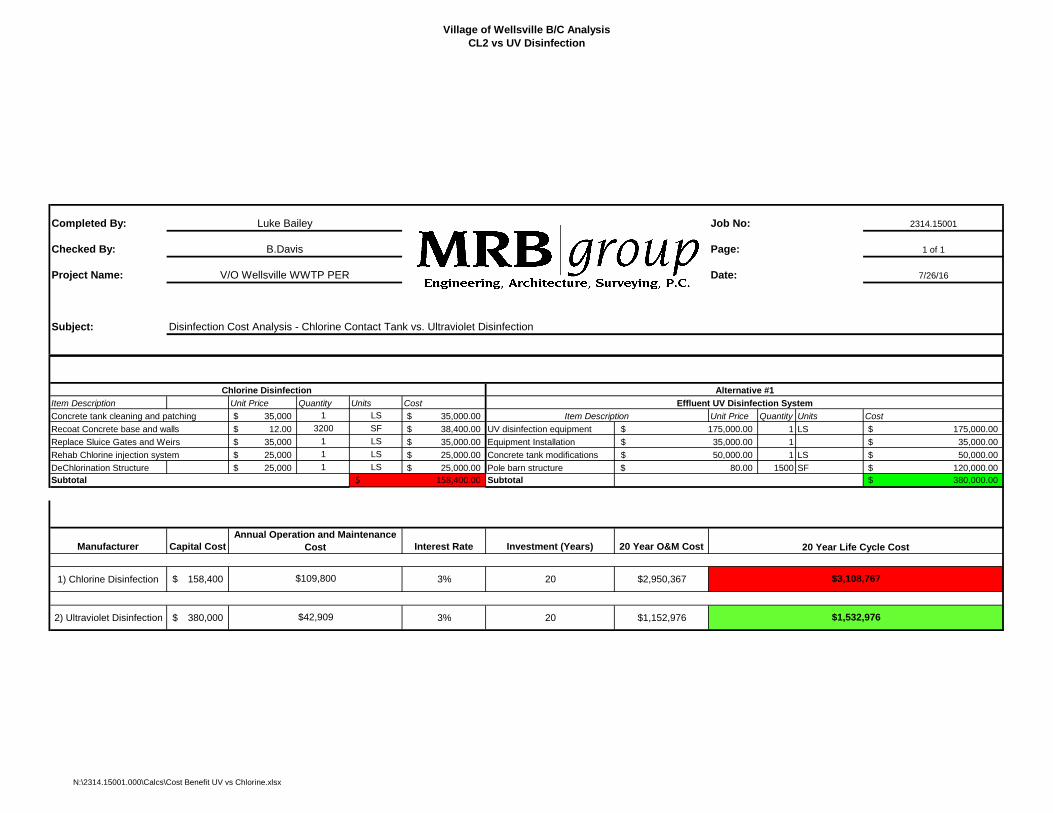
Village of Wellsville B/C Analysis
CL2 vs UV Disinfection
Completed By: Job No: 2314.15001
Checked By: Page: 1 of 1
Project Name: Date: 7/26/16
Subject:
Item Description Unit Price Quantity Units Cost
Concrete tank cleaning and patching 35,000$ 1 LS 35,000.00$ Unit Price Quantity Units Cost
Recoat Concrete base and walls 12.00$ 3200 SF 38,400.00$ UV disinfection equipment 1 LS 175,000.00$
Replace Sluice Gates and Weirs 35,000$ 1 LS 35,000.00$ Equipment Installation 1 35,000.00$
Rehab Chlorine injection system 25,000$ 1 LS 25,000.00$ Concrete tank modifications 1 LS 50,000.00$
DeChlorination Structure 25,000$ 1 LS 25,000.00$ Pole barn structure 1500 SF 120,000.00$
Subtotal Subtotal 380,000.00$
Manufacturer Capital Cost Interest Rate Investment (Years) 20 Year O&M Cost
1) Chlorine Disinfection 158,400$ 3% 20 $2,950,367
2) Ultraviolet Disinfection 380,000$ 3% 20 $1,152,976
158,400.00$
Luke Bailey
B.Davis
V/O Wellsville WWTP PER
Disinfection Cost Analysis - Chlorine Contact Tank vs. Ultraviolet Disinfection
Effluent UV Disinfection System
Chlorine Disinfection
175,000.00$
50,000.00$
Alternative #1
Item Description
35,000.00$
80.00$
$1,532,976
Annual Operation and Maintenance
Cost
$109,800
$42,909
20 Year Life Cycle Cost
$3,108,767
N:\2314.15001.000\Calcs\Cost Benefit UV vs Chlorine.xlsx

Village of Wellsville Preliminary Engineering Report
Wastewater Treatment Plant August 2016
MRB Group Project No. 2314.15001
APPENDIX I
WELLSVILLE ACS MEDIAN HOUSEHOLD
INCOME DATA

Margin of Error
Percent Percent Margin of Error
+/-126 3,763 (X)
+/-182 58.8% +/-5.1
+/-182 58.8% +/-5.1
+/-200 52.2% +/-5.3
+/-89 6.6% +/-2.4
+/-11 0.0% +/-0.8
+/-212 41.2% +/-5.1
+/-137 1,980 (X)
+/-46 8.7% +/-2.3
+/-82 10.4% +/-4.0
+/-94 15.8% +/-4.6
+/-69 11.5% +/-3.3
+/-75 13.4% +/-3.8
+/-104 19.2% +/-5.4
+/-81 9.9% +/-3.9
+/-65 7.8% +/-3.1
+/-29 2.2% +/-1.5
+/-18 1.1% +/-0.9
+/-5,804 (X) (X)
+/-9,530 (X) (X)
Median household income (dollars)
39,792
Mean household income (dollars)
55,359
$100,000 to $149,999 154
$150,000 to $199,999 44
$200,000 or more 21
$35,000 to $49,999 266
$50,000 to $74,999 380
$75,000 to $99,999 196
$10,000 to $14,999 206
$15,000 to $24,999 313
$25,000 to $34,999 228
INCOME AND BENEFITS (IN 2014 INFLATION-ADJUSTED Total households 1,980
Less than $10,000 172
Armed Forces 0
Not in labor force 1,551
2010-2014 American Community Survey 5-Year Estimates
Subject
Civilian labor force 2,212
Employed 1,963
Unemployed 249
Estimate
EMPLOYMENT STATUS
Population 16 years and over 3,763
In labor force 2,212
DP03: SELECTED ECONOMIC CHARACTERISTICS
Wellsville village, New York
Village of Wellsville Preliminary Engineering Report
Wastewater Treatment Plant August 2016
MRB Group Project No. 2314.15001
APPENDIX J
VILLAGE OF WELLSVILLE
SEWER BUDGET


