village and townwise primary census abstract, bathinda
TRANSCRIPT

CENSUS OF INDIA 2001
SERIES-4 PUNJAB
DISTRICT CENSUS HANDBOOK
Part - A & B
BATHINDA DISTRICT
VILLAGE & TOWN DIRECTORY
~
VILLAGE ·AND TOWNWISE PRIMARY CENSUS ABSTRACT
&"if~
\& ~ PEOPLE ORIENTED
Directorate of Census Operations, Punjab

INDIA PUNJAB
DISTRICT BATHINDA Km .• 15 ooKm.
A R
C.D. BLOCK BOUNDARY EXCLUDES STATUTORY TOWN (S)
BOUNDARIES ARE UPDATED UPTO 1.1.2000
TOTAL AREA OF DISTRICT (IN Sq. Km.) ... TOTAL POPULATION OF DISTRICT. TOTAL NUMBER OF TOWNS IN DISTRICT
. 3.,353.00 . .1.163.295
. 9 TOTAL NUMBER OF VILLAGES IN mSTRICT .. ...... . . . . . ZB4
BOUNDARY. STATE ....... .. DISTRICT TAHSIL ............. " ... CD BLOCK ........ ... .
"\ o
HEADQUARTERS:DISTRICT / TAHSIL/CD.BLOCK ....... .. @ @ 0
NATIONAL HIGHWAY ....... . STATE HIGHWAY ........... . IMPORTANT METALLED ROAD RAILWAY LINE WITH STATION, BROAD GAUGE ...... VILLAGE HAVING 5000 AND ABOVE POPULATION WITH NAME ... TOWNS WITH POPULATION SIZE AND CLASS I,lII,1V.V AND VI.. ... ... ... . ... ... .. . .. DEGREE COLLEGE AND TECHNICAL INSTITUTION ...
N.H!? SH 12A
• KOT SHAKIR
C T ~\
DISTRICT/ TAHSIL HEADQUARTERS ARE ALSO C.D.BLOCK HEADQUARTERS
Based upon Survey 01 India map wilh lhe permission of the Surveyor General 01 India.
-.
CENSUS OF INDIA 2001
C.D. BLOCKS A - PHUL B RAMPURA C NATHANA D BATHINDA E - SANG AT F TALWANDI SABO G - MAUR
."[ •• J ._./" DISTRICT BATHINDA '"t CHANGE IN JURISlJICTION '\
)-._.-' ~.
<: (
i .DlSTRICT BATH] -.-.... , I
r·· .... ··" . " .. i) . ~;;
iJIOIDIIDARYSTATE " . . _ •• _ • DlSTRJCT. • • _. _ •
., ( ,
ARb L($'f TO Nt1'LY CREATED btmOC1 MIJt$.l .
lOOH!OOl Km. (0 0 l(J Km.
LJ_J
® Governmenl 01 India Copyrighl.2005.


Gurudwara Damdama Sahib, Talwandi Sabo
Talwandi Sabo is one of the five takhats of the Sikhs .. After the fiefce battles with the Mughals atAnandpur, Chamkaur and Muktsar, Guru Gobind Singh retired to the jungles of Malwa. Talwandi Sabo where the Guru took rest (dam) came to be known as damadama Sahib. The ,Guru stayed here for more than nine months. During this period, he redicated theAdi Granth and made Damdama Sahib a centre for spreading his mission. He called this place Khalsa Da Takhat (throne of the Khalsa),


Foreword Preface Acknowledgements District Highlights-200 I Census Important statistics in the District Ranking of Tahsils in the District
Statements 1-9
Contents
Statement Name of the headquarters of district/tahsil, their rural-urban status
Pages
IX
xi
XIII
xv XVII XIX
and distance from district headquarters, 200 I XXI Statement 2 Name of the headquarters of district/C D block, their rural-urban
status and distance from district headquarters, 2001 XXI Statement 3 Population of the district at each census from 190 I to 200 I XXI Statement 4 Area, number of villages/towns and population in district and tahsil,
2001 XXII Statement 5 C D Block wise number of villages and rural population, 200 I XXIII Statement 6 Population of Urban Agglomerations/towns, 200 I xxiii Statement 7 Villages with population of 5,000 and above at CD Block level as per
2001 census and amenities available XXIV Statement 8 Statutory towns with population less than 5000 as per 200 I census and
amenities available XXIV Statement 9 Houseless and Institutional population of tahsils, rural and urban, 200 I XXVI
Analytical Note
(i) History and scope of the District Census Handbook 3 (ii) Brief history of the ~istrict 4 (iii) Administrative sct up 7 (iv) Physical features: 9
(a) Location and sIze 9 (b) Physiography 9 (c) Climate 9 (d) Natural economic resources IO
(v) Census concepts 16 (vi) Non Census concepts 21 (vii) 200 I Census findings-Population, its distribution 24
Population number of villages and towns, 2001 Size class and status of towns, Population, Growth, Density and Sex Rati0, Literacy, Work participation rate, Religion. Mother Tongue and Language Scheduled Castes and Scheduled Tribes
(viii) Brief analysis of PCA data based on inset tables 1 to 36 28
(ix) Brief analysis of the Village Directory and Town Directory data based on inset tables 37 to 47. 52
(v)

(x) Brief analysis based on houses and household amenities based on inset tables 48 to 52
(xi) Places of tourist, religious, historical or archaeological importance
(xii) Scope of Village Directory and Town Directory
PART-A: VILLAGE AND TOWN DIRECTORY
Section-I : Village Directory
Note explaining abbreviations used in Village Directory
List of Villages treated as towns at 200 I Census
C.D. block Phul
(i) C D Block Maps showing Tahsil boundary
(ii) Alphabetical list of Villages alongwith location code 1991 and 200 I
(iii) Presentation of Village Directory data in prescribed format
C.D. block Rampura
(i) C 0 Block Maps showing Tahsil boundary (ii) Alphabetical list of Villages alongwith 10catiQn code 1991 and 200 I
(iii) Presentation of Village, Directory data in prescribed format
C.D. block Nathana
(i) C D Block Maps showing Tahsil boundary
(ii) Alphabetical list of Villages alongwith location code 1991 and 200 I
(iii) Presentation of Village Directory data in prescribed format
C.D. block Bathinda
(i) C 0 Block Maps showing Tahsil boundary
(ii) Alphabetical list of Villages alongwith location code 1991 and 200 I (iii) Presentation of Village Directory data in prescribed format
C.D. block Sangat
(i) C D Block Maps showing Tahsil boundary
(ii) Alphabetical list of Villages alongwith location code 1991 and 200 I (iii) Presentation of Village Directory data in prescr}bed format
C.D. block Talwandi Sabo
(i) C 0 Block Maps showing Tahsil boundary·· (ii) Alphabetical list of Villages alongwith location code 1991 and 200 I (iii) Presentation of Village Directory data in prescribed format
C.D. block Maur
(i) C D Block Maps showing Tahsil boundary
(ii) Alphabetical list of Villages alongwith location code 1991 and 200 I
(iii) Presentation of Village Directory data in prescribed format
Appendices to Village Directory :
Appendix I Abstract of Educational, Medical and other Amenities in villages
C.D. block level
Villages by number of Primary Schools
Villages by Primary, Middle and Secondary Schools
Pages
60
64
67
71 74
77
78
91
92
103 104
115 116
131
132
143
144
157 158
166 170 170
Appendix IA
Appendix IB
Appendix IC Villages with different sources of drinking water facilities available 170
(vi)

Appendix II
Appendix IIA
Appendix III
Appendix IV
Appendix V
Appendix VI
Appendix VII A:
Appendix VI1 B:
Appendix VIII
Appendix ·IX
Villages with 5,000 and above population which do not have one
or more amenities available
Census towns which do not have one or more amenit ies.
Land utilisation data in respect of Census Towns/non-municipal
towns
C.O. blockwise list of inhabited villages where no amenity other
than drinking water facility is available
Summary showing number of villages not having Scheduled
Caste population
Summary showing number ~f villages not having
Scheduled Tribe population
List of villages according to the proportion of the Scheduled
Castes to the total population by ranges
List of villages according to the proportion of the Scheduled
Tribes to the total population by ranges
Number of villages under each Gram Panchayat (C.O.blockwise)
Statement showing number of girls schools in the villages
Section-II : Town Directory
(a) Note explaining the abbreviations used in Town Directory
Town Directory Statements (I to VII) :
(b) Statement I Status and Growth History
(c) Statement II Physical aspects and location of towns (d) Statement III Municipal finance
(e) Statement IV Civic and other amenities
(f) Statement V Medical, Educational, Recreational and cultural facilities
(g) Statement VI Trade, commerce, Industry and banking
(h) Statement VII Civic and other amenities in slums
PART-B : PRIMARY CENSUS ABSTRACT
(a) Brief note on Primary Census Abstract
(b) District Primary Census Abstract (General)
(c) Appendix to District Primary Census Abstract i.e., Total, SC and ST Population
Urban blockwise Primary Census Abstract for Scheduled Castes
C 0 Blockwise Village Primary Census Abstract
1. C.O. block Phul
2. C.O. block Rampura
3. C.O. block Nathana
4. C.O. block Bathinda
5. C.O. block Sangat
6. C.D. block Talwandi Saba
7. C.O. block Maur
Urban Primary Census Abstract.
(vii),
Pages
171 172
172
172
173
173
174
177
178 178
179
182 182 184 184 186 188 190
195 198
204 218
224 230 236 242 254 260 266 272

Annexure I
Annexure II
Annexure III Annexure IV
Annexure V
Annexure VI Annexure VII
Annexure VlIl
Pages
Number of villages under each Gram Panchayat 290
Fertility and child Mortality, 1991 Census 290
Measures of fertility and mean age at marriage, fertility level 291
Percentage distribution of in Migrants by place of birth/place of last residence. 292 Brief account of main religions in the district/tahsil as per 1991
Census 293
Marital status of population 294 Distribution of Literate by sex and Education Level 295
Distribution of different mother tongues. 296
(viii)

Foreword
The District Census Handbook (DCIIB) published by Census Organisation since 1951 census. is one of
the important publications in the context of planning and development at gross-root level. The publication,
which is brought out for each district, contains several demographic and socia-economic characteristics, village
wise and town-wise, of the district alongwith the status of availability of civic amenities, infrastructural facilities,
etc.
2. The scope of the DCHB was initially confined to a few Census Tables and Primary Census Abstract
(PCA) of each village and town within the district. Thereafter, at successive Censuses, its scope and coverage
has be~n enlarged. The DCBB published at the 1961 Census provided a descriptive account of the district,
administrative statistics, census tables and a village and town directory including PCA. The 1971 CensusDCHB series was in three parts: Part-A related to village and town directory, Part-B to village and town
PCA and Part-C comprised analytical report, administrative statistics, district census tables and certain analytical
tables based on PCA and amenity data in respect of villages. The 1981 Census DCI-IB was in two parts :
Part-A contained village and town directory and Part-B the PCA of village and town including the SCs and
STs PCA up to tahsil/town levels. New features alongwith restructuring of the formats of village and town
directory were added to it. In Village Directory, all amenities except electricity were brought together and
if any amenity was not available in the referent village, the distance in broad ranges from the nearest place
having such an amenity, was given. Information on new items such as adult literacy centres, primary health
sub-centres and community health workers in the village were provided so as to meet the requirements of
some of the Revised Minimum Needs Programme. Information on approach to the village was provided for the first time in the Village Directory so as to give the details on number of inaccessible villages in each
district. In the Town Directory, a statement (IV-A) on slums was introduced to provide the details on civic
and other amenities in the notified slums of Class I and Class" towns.
3. The 1991 Census DCHB, by and large, followed the pattern of presentation of 1981 Census, except the
format of PCA which was restructured. Nine-fold industrial classification of main workers was given against
the four-fold industrial classification presented in the 1981 Census. In addition, sex-wise population in 0-6
age group was included in the PCA for the first time with a view to enable the data users to compile more realistic literacy rate as all children below 7 years of age had been treated as illiterate at the time of 1991
Census. One of the important innovations in the 1991 Census was the Community Development Block (CD
block) level presentation of village directory and PCA data instead of the traditional tahsil/taluk/PS level
presentation. It was expected that the presentation of village directory and PCA data at CD block level will
help the planners in formulation of micro level development plans, CD block being the lowest administrative
unit.
4. The present series of 200 I Census DCHBs have been made more informative and exhaustive in terms
of coverage and content. The Village Directory has been enlarged in scope by including a number of other
facilities like banking, recreational and cultural facilities, newspapers and magazines and 'most important commodity' manufactured in village. Income and expenditure of gram panchayat, wherever possible, has
been provided. Apart from these, more details on distance(s) at which basic amenities are available (if not
available in the village), are given. This includes educational facilities (namely primary and middle schools and college), medical facilities (viz. Allopathic Hospital, Maternity & Child Welfare Centre and Primary Health
Centre), drinking water, post & telegraph (post office and phone), communication, bank, credit societies and
(ix)

recreational facilities. In town directory, the statement on Slums has been modified and its coverage enlarged
by including details on all slums instead of 'notified slums'. The information is given in case of all statutory
towns irrespective of their class, against only Class I and Class II towns in the 1981 and 1991 Censuses.
The basic amenities available in the villages and towns are analysed in depth with the help of a number of cross-classified inset tables and statements. Two other significant additions in the publication are inclusion
of 'motif' highlighting significant characteristics of the district and analytical notes as annexures. The analytical notes on (i) fertility and mortality and (ii) various measures of fertility and mean age at marriage are prepared
based on 1991 Census. Whereas, in the notes relating to (i) percentage distribution of migrants by place of birth/place of last residence, (ii) main religions, (iii) marital status of population, (iv) age, sex and education,
and (v) distribution of spectrum of mother tongue, nature and extent of changes occurred in the district in
its basic socia-demographic features during the decade 1991-200 I are analysed. The eight digits permanent
location code number (PLCN) in all the villages and towns have been assigned keeping in view the future needs.
5. The village and town level amenity data have been collected, compiled and computerized in prescribed
record structure under the supervision of Shri Inder Jit Singh, lAS, Director of Census Operations, Punjab. Thereafter, efforts have been made to ensure comparability of the information with that of 1991 Census data
and the information brought out by the respective State Governments in their annual reports and statistical handbooks for various years after 199 I. The task of planning, designing and coordination of this publication
was carried out by Shri R.G.Mitra, Deputy Registrar General, (C&T) and Dr. I.C.Aggrawal, Senior Research
Officer of Social Studies Division. Dr. R.P. Singh, Deputy Registrar General (Map) provided thc technical
guidance in the preparation of maps. Whereas, Shri Anil Kumar Arora, Deputy Dire~tor of Data Processing Division who worked under the overall supervision ofShri Himakar, Add!. Director (EDP), helped in preparation
of record structure for computerization of village and town directory data and the programme for the generation
of Village Directory and Town Directory statements including analytical inset tables. The draft DCHB
manuscripts received from the Census Directorates have been scrutinised in the Social Studies Division under the guidance of Shri S. L. Jain, Deputy Director and Shri R. K. Mehta, Assitant Director. I am thankful
to all of them and others who contributed to make this publication possible.
New Delhi
Dated ..................... 2007
(x)
n.K. Sikri Registrar Gcneral &
Census Commissioner, India

Preface
The publication of District Census Handbook (DCHB) has been a regular feature ever since 1951, the first
Census after independence. It aims to provide village/town level statistics for use by the government
departments, non-government agencies, academicians and scholars, alike.
At the 1961 Census, a beginning was made to also include village level data on availability of amenities
such as educational, medical, postal and communicational, land use pattern etc. in the form of Vi Ilage Directory.
Likewise, for towns, information with regard to their physical, financial, socio-cultural aspects and infrastructure
were also added at town and ward level. Keeping in view the great utility of non-census data in the form
of Village Directory and Town Directory, the same has remained to be an integral patt of the DCHBs ever
since 1961. Above all, the analytical part and inclusion of maps presenting data at village level has further
enriched the scope and use of this publication. The analytical note describes historical, administrative, physio
graphic and demographic aspect of the district.
The present volume has two parts viz., Part A - Village and Town Directory and Part B - Primary Census
Abstract, giving data for each village within the Community Development (CD) Block and each town in the
district. The CD block maps induded, presenting village level data, have been prepared by using computer
assisted technology. In order to ensure greater authenticity of the data, an effort has been made to cross
check the samc with the information available from other sources. We do hope that the contents and coverage
of this publication would be of great use to the user agencies.
The production of the DCI-IB has always remained to be a joint venture of the Central Government and
the State Government. We greatly acknowledge and express our deep gratitude to the Government of Punjab
for extending their complete cooperation in providing the ;'cquisite data in the form Village Directory and
Town Directory. The District Gazetters and the Statistical Abstracts brought out by the State Government
were of big help to us in the preparation of brief analytical note.
We owe our deepest gratitude to Shri D.K. Sikri, lAS, Additional Secretary, Registrar General, India and
Census Commissioner and Shri J.K. Banthia, lAS, former Registrar General and Census COlllmissioner, India
for their direction and support from time to time in accomplishing this arduous task.
In the directorate, at the outset we are beholden to Shri Inder Jit Singh, lAS under whose able guidance and direction as Director, Census Punjab, the census operations in the stat~ were successfully completed.
Our thanks arc also due to Shri D.R. Khanna, Ex-Deputy Director for getting the compilation of data
and Shri Madhav Shyam, Ex-Deputy Director for drafting specimen model DCI-IS which has been replicated
in other DCHBs.
The great effort and hard work done by Shri Bhagirath Singh, Assistant Director, Shri M.S. Bhatnagar,
Assistant Director (since transferred) and Shri Malkit Singh, Ex- S.1. Gr. I a1'e greatly acknowledged.
Sh. Pawan Kumar Bansal, S.1. Gr. II, Sh. Azad Kumar, S.I.Gr.-1I1 and Sh. I-I.S. Sudan, Sr. Compiler deserve
special thanks for having completed the publication work.
Last but not the least the publication of DCHB is a collective effort of the staff in the directorate and
the services rendered by them (as per list) are acknowledged with thanks.
Chandigarh
Datecl: ..................... 2007
(xi)
R.S. Meena
Joillt Director


Acknowledgements
TASK FORCE FOR QUALITY ASSURANCE
Sh. S.K. Bhandari Sh. Bhagirath Singh Sh. Malkit Singh Sh. Joginder Singh Sh. Azad Kumar
Assistant Director Assistant Director S.1. Gr-I S.1. Gr-lII S.1. Gr-lII
VILLAGE & TOWN DIRECTORY
Sh. S.K. Bhandari Sh. Bhagirath Singh Sh. Joginder Singh Sh. S.K. Joshi Sh. Azad Kumar Smt. Hardeep Kaur Sh. Major Ram Smt. Harbeer Kaur Smt. Asha Vashitha Smt. Santosh Kumari
Sh. Bhagirath Singh Sh. Malkit Singh Sh. Pawan Kumar Bansal Sh. Mansha Ram Sh. Rajpal Pathak Sh. Meeka Singh Smt. Sunita Rani Smt. Shashi Arora
Sh. Ajit Singh Sh. Harbans Singh
Assistant Director Assistant Director S.1. Gr-lII S.1. Gr-lII S.1. Gr-I1I Sr. Compiler Sr. Compiler Sr. Compiler Sr. Compiler Sr. Compiler
PRIMARY CENSUS ABSTRACT
PHOTOCOPY
EDITING
Assistant Director S.I. Gr-I S.1. Gr-II S.1. Gr-lII Compiler Compiler Compiler Compiler
Jr.JGO " Daftri
Sh. S.K. Bhandari Assistant Director Sh. Bhagirath Singh Assistant Director Sh. Azad Kumar S.1. Gr-III Sh. H.S. Sudan Sr. Compiler Smt. Harbeer Kaur Sr. Compiler
PREPARATION OF CAMERA READY COpy (CRC)
Sh. Satinder Pal Singh
Sh. Baldev Singh Sh. Satinder Pal Singh
Dr. B.B. Jain Sh. Tej Pal Singh Sh. Kulbir Singh Smt. Sangita Rahi
SIl. Pawan Kumar Bajaj Sh. Satinder Pal Singh
DATA ENTRY SYSTEM
MAP
TYPING
(xiii)
L.D.C.
D.E.O. LD.C.
Research Officer Sr. Geographer Sr. Draftsman Draftsman
Steno LD.C.


District Highlights - 2001 Census
1. Bathinda district ranks 8th in area and 9th in population.
2. Bathinda is the most populous and Talwandi Sabo is the least populous tahsil.
3. The average population size of village in the district (2,970) is greater than that of the state (1,311).
4. Mehna (27,029) in Bathind~ tahsil is the, largest village by population size followed by Talwandi Sabo (16,754) in the district.
5. 32 villages in the distric! are large sized with a population of 5,000 or more.
6. The decadal population growth rate in the district (20.1 %) is equal to the state average (20.1 %).
7. Bathinda district is relatively less urbanized (29.7%) than the state (33.9%) and it ranks 8th in the state.
8. The sex ratio in the district (870) is lower than the state (876). It ranks 14th among the districts in
the state.
9. The child sex ratio in the district (785) is lower than the state (798). It ranks 13th among the districts
in the state.
(xv)


Important Statistics 2001
STATE DlSTRICf
NUMBER OF VILLAGES Total 12,673 284 Inhabited 12,278 280 Uninhabited 395 4
NUMBER OF TOWNS Statuto·ry Towns 139 8 Census Towns 18
NUMBER OF HOUSEHOLDS Nonnal 4,330,657 207,812 Institutional 9,929 766 Houseless 7,994 415
POPULATION Total Persons 24,358,999 1,183,295 Males 12,985,045 632,809 Females 11,373,954 550,486
Rural Persons 16,096,488 831,541 Males 8,516,596 444,118 Females 7,579,892 387,423
Urban Persons 8,262,511 351,754 Males 4,468,449 188,691 Females 3,794,062 163,063
PERCENTAGE OF URBAN POPULATION 33.9 29.7
Number Percentage Number Percentage
DECADAL POPULATION Persons 4,077,030 20.1 197,994 20.1 GROWTH 1991-2001 Males 2,207,011 20.5 109,848 21.0
Females 1,870,019 19.7 88,146 19.1
AREA (in sq. km.) 50,362 3,353
DENSITY OF POPULATION 484 353 (persons per square kilometre)
SEX RATIO (number offemales per 1,000 males) Total 876 870
Rural 890 872 Urban 849 864
LITERATES Persons 14,756,970 69.7 632,570 61.2 Males 8,442,293 75.2 372,228 67.8 Females 6,314,677 63.4 260,342 53.7
(xvii)

Important Statistics 2001 ~ cone/d ..
Nwnber Percentage Nwnber Percentage
SCHEDULED CASTES POPULATION Persons 7,028,723 28.9 354,652 30.0 Males 3,714,350 28.6 187,539 29.6 Females 3,314,373 29.1 167,113 30.4
SCHEDULED TRIBES POPULATION Persons Nil Nil Nil Nil Males Nil Nil Nil Nil Females Nil Nil Nil Nil
WORKERS AND NON- WORKERS
TOTAL WORKERS Persons 9,127,474 37.5 500,667 42.3 (MAIN & MARGINAL) Males 6,960,213 53.6 349,228 55.2
Females 2,167,261 19.1 151,439 27.5
(i) MAIN WORKERS Persons 7,835,732 85.8 408,924 81.7 Males 6,426,028 92.3 324,536 92.9 Females 1,409,704 65.0 84,388 55.7
(ii) MARGINAL WORKERS Persons 1,291,742 14.2 91,743 IS.3 Males 534,185 7.7 24,692 7.1 Females 757,557 35.0 67,051 44.3
(iii) NON-WORKERS Persons 15,231,525 62.5 682,628 57.7 Males 6,024,832 46.4 283,581 44.8 Females 9,206,693 80.9 399,047 72.5
CATEGORY OF WORKERS (MAIN & MARGINAL)
(i) CULTIVATORS Persons 2,065,067 22.6 149,076 29.8 Males 1,762,869 25.3 119,581 34.3
Females 302,198 13.9 29,495 19.5
(ii) AGRICULTURAL Persons 1,489,861 16.3 107,437 21.4
LABOURERS Males 1,104,140 15.9 72,758 20.8
Females 385,721 17.8 34,679 22.9
(iii) WORKERS IN HOUSEHOLD Persons 333,770 3.7 15,380 3.1
INDUSTRY Males 178,798 2.6 6,353 1.8
Females 154,972 7.2 9,027 5.9
(iv) OTHER WORKERS Persons 5,238,776 57.4 228,774 45.7
Males 3,914,406 56.2 150,536 43.1
Females 1,324,370 61.1 78,238 51.7
(xviii)

Ranking of Tahsil
Serial In Teml of Rampura Phul l3athinda Talwandi Sabo
nwnber Value Rank Value Rank Value Rank
2 3 4 5 6 7 8
I Total Population 283,606 2 631,475 268,214 3
2 Total area (in sq. kms.) 875.2 3 1518.5 973.6 2
3 Density of population per sq.krn. 324 2 416 275 3
4 Sex Ratio 887 857 3 883 2
5 Proportion Urban 15.7 3 41.2 17.6 2
6 Proportion Scheduled Castes 30.7 2 29.3 3 30.9
7 Proportion Scheduled Tribes Nil Nil Nil Nil Nil Nil
8 Proportion Literate 58.2 2 65.8 53.4 3
9 Work participation rate (Main + Marginal Workers) 44.3 2 39.4 3 47.0
10 Percentage of villages having Primary School 100.0 96.7 3 100.0
11 Percentage of villages having Primary Health Sub-Centre 39.5 38.3 2 i 8.2 3
12 Percentage ofvil!ages having Well 100,0 96.7 2 100.0
13 Percentage of villages having Post Office 57,9 55.8 2 42.0 3
14 Percentage of villages having Bus facility 100,0 96.7 2 100.0
IS Percentage of villages having approach by Pucca Road 100,0 96.7 2 100.0
16 Percentage of villages having Electricity for domestic purpose 100.0 96.7 2 100.0
17 Percentage of villages having Irrigated Area 81.37 73.89 3 76.79 2
(xix)


STATEMENT-l
NAME OFTHE HEADQUARTERS OF mSTRlCTffAHSIL, THEIR RURAL-URBAN STATUS AND DISTANCE FROM DISTRICT HEADQUARTERS, 2001
Serial number
1
2
3
Name of District! Tahsil
2
Bathinda*
Rampura Phul*
Bathinda*
Talwandi Saba
Name of District! Whether Urban! Tahsil headquarters Rural
3 4
Bathinda Urban*
Rampura Phul Urban*
Bathinda Urban*
Talwandi Saba Rural
Note:- * Asterisk in column 2 denotes that the district!tahsil headq).larters is a rail head.
Distance from tahsil headquarters to district
headquarters by road (in km.)
5
0
33
0
32
* Asterisk in column 4 denotes that the district/tahsil headquarters is a statutor'y town.
STATEMENT- 2
NAME OF THE HEADQUARTERS OF DISTRICT/CD. BLOCK THEIR RURAL- URBAN STATUS AND DISTANCE FROM DISTRICT HEADQUARTERS, 2001
Serial
number
2
3
4
5
6
7
Name of District!
C.D. block
2
Rampura Phul*
Bathinda*
Talwandi Saba
Nathana
Sangat
Maur*
Phul
Name of District! Whether Urbani
C.D.block headquarters Rural
3 4
Rampura Phul Urban*
Bathinda Urban*
Talwandi Sabo Rural
Nathana Rural
Sangat Urban*
Maur Urban*
Phul Rural
Note:- * Asterisk in column 2 denotes that the district!tahsil headquarters is a rail head.
Distance from C.D.block
headquarters to district headquarters by road ( in km.)
5
33
0
29
25
0
30
32
* Asterisk in column 4 denotes that the district/tahsil headquarters is a statutot't town.
STATEMENT -3 POPULATION OF THE DISTRICT AT EACH CENSUS FROM 1901 TO 2001
District TotaV Census Year Persons Males Females Decadal popUlation variation
RuraV
Urban Absolute Percentage
2 3 4 5 6 7 8
Bathinda Total 1901 NA NA NA NA NA
1911 NA NA NA NA NA
1921 NA NA NA NA NA
1931 NA NA NA NA NA
1941 NA NA NA NA NA
1951 377, 757 205,240 172,337 NA NA
1961 509,031 277,505 231,526 131,274 34.8
1971 623,172 336,729 286,443 114,141 22.4
1981 817,764 439,350 378,414 194,592 31.2
1991 985,301 522,961 462,340 167,537 20.5
2001 1,183,295 632,809 550,486 197,994 20.1

STATEMENT - 3 -concH." ..
POPULATION OF THE DISTRICT AT EACH CENSUS FROM 1901 TO 2001
District Total! Census Year Persons Males Females Decadal population variation
Rural!
Urban Absolute Percentage
2 3 4 5 6 7 8
Rural 1901 NA NA NA NA NA 1911 NA NA NA NA NA 1921 NA NA NA NA NA 1931 NA NA NA NA NA 1941 NA NA NA NA NA 1951 310,919 168,525 142,394 NA NA 1961 399,6 I 4 217,514 182.100 88,695 28.5 1971 492,275 266,045 226.230 92,661 23.2 1981 590,638 316,087 274,551 98,363 20.0 1991 719,5 I I 381.081 338,430 128.873 21.8 2001 831,541 444,118 387,423 112,030 15.6
Urban 1901 NA NA NA NA NA 1911 NA NA NA NA NA 1921 NA NA NA NA NA 1931 NA NA NA NA NA 1941 NA NA NA NA NA 1951 66,838 36,895 29,943 NA NA 1961 109,417 59.991 49,426 42,579 63.7 1971 130,897 70,684 60,213 21,480 19.6 1981 227,126 123,263 103,863 96,229 73.5 1991 265,790 141,880 123,910 38,664 17.0 2001 351,754 188,691 163,063 85,964 32.3
STATEMENT-4 AREA, NUMBER OF VILLAGES I TOWNS AND POPULATION IN DISTRICT AND TAHSIL, 2001
Serial Districtff ahsil/ Total/ Area in Population Number of villages Number Number Nlmlber Population number UAff0 \\n Rural! square per square of of of house-
Urban kilometers kilometer Inhabited Un- statutory census holds Persons Males Females inhabited to\\ns (o\\ns
i 2 ') 4 5 6 7 8· -9 i b II 'Ii "t3 Bathinda Total 3,353.0 353 280 4 8 1 208,993 1,183,295 632,809 550,486
Rural 3,197.0 260 280 4 ° 0 142,616 831,541 444,118 387,423 Urban 156.0 2,256 ° ° 8 1 66,377 351,754 188,691 163,063
1 Rampura Phul Total 875.2 324 76 0 1 0 49,004 283,606 150,259 133,347 Rural 866.3 276 76 0 0 0 40,770 238,941 126,567 112,374 Urban 8.9 5,030 0 0 I 0 8,234 44,665 23,692 20,973
Rampura Phul UA Urban N.A. 0 0 0 8,234 44,665 23,692 20,973 Rampura Phu] (MCI+OG) Urban N.A. 0 0 0 8,234 44,665 23,692 20,973 Rampura Phul (M CI) Urban 8.9 4,822 0 0 1 0 7,902 42,823 22,706 20,117
2 Bathinda Total 1,518.5 416 116 4 5 I 114,215 631,475 340,083 291,392 Rural 1,389.5 267 116 4 0 0 64,236 371,480 200,120 171,360 Urban 129.0 2,015 0 0 5 1 49,979 259,995 139,963 120,032
Goniana (M CI) Urban 4.0 3,203 0 0 I 0 2,312 12,813 6,866 5,947 Bhisiana (CT) Urban 6.8 698 0 0 0 I 1,164 4,775 2,837 1,938 Bhucho Mandi (M Cl) Urban 4.2 3,184 0 0 0 2,284 13,246 7,017 6,229 Bathinda (M CIl Urban 11.0 1,975 0 0 0 42,130 217,256 116,946 100,310 Sangat (M CI) Urban 2.0 2,701 0 0 0 939 5y 401 2,862 2,539 Kot Fatta (M CI) Urban 2.0 3,252 0 0 0 1,150 6,504 3,435 3,069
3 Talwandi Sabo Tota] 973.6 275 88 0 2 0 45,774 268,214 142,467 125,747
Rural 955.6 231 88 0 0 0 37,610 221,I 20 117,431 103,689 Urban 18.01 2,606 0 0 2 0 8,164 47,094 25,036 22,058
Raman (M CI) Urban 4.0 4,900 0 0 ] 0 3,398 19,551 10,361 9,190
Maur(M Cn Urban 14.1 1,956 0 0 I 0 4,766 27,543 14,675 12,868
(xxii)

STATEMENT - 5
CD. BLOCKWISE NUMBER OF VILLAGES AND RURAL POPULATION, 200)
Serial NameofC.D. Number ofvillages Rural Population
block Total Inhabited Persons Males Females
2 3 4 5 6 7
I Phu1 46 46 147,312 77,740 69,572
2 Rampura 30 30 91,629 48,827 42,802
3 Nathana 32 32 129,025 72,059 56,966
4 Bathinda 58 54 164,204 86,984 77,220
5 Sangat 38 38 100,681 52,909 47,772
6 Talwandi Sabo 47 47 129,364 68,664 60,700
7 Maur 33 33 69,326 36,935 32,391
District (Rural) Total: 284 280 831,541 444,118 387,423
STATEMENT - 6
POPULATION OF URBAN AGGLOMERATIONS (INCLUDlNG CONSTITUENT UNITSj/TOWN, 2001
Serial Name of UAlTown+* Urban status Name of tahsil Population
number where town is located Persons Males Females
2 3 4 5 6 7
Bathinda M Cl Bathinda 217,256 116,946 100,310
2 Bhisiana CT Bathinda 4,775 2,837 1.938
3 Bhucho Mandi MCI Bathinda 13,246 7,017 6,229
4 Goniana Mel Bathinda 12,813 6,866 5,947
5 Kot Fatta MCI Bathinda 6,504 3,435 3,069
6 Maur MCI Talwandi Sabo 27,543 14,675 12,868
7 Raman MCI Talwandi Sabo 19,551 10,361 9,190
8 Rampura Phul* UA Rampura Phul 44,665 23,692 20,973
(i) Rampura Phul M CI+OG Rampura Phul 44,665 23,692 20,973
(ii) Rampura Phul MCI Rampura Phul 42,823 22,706 20,117
9 Sangat MCI Bathinda 5,401 2.862 2,539
District (Urban) total: 351,754 188,691 163,063
+ Towns arranged in alphabetical order. • In case of towns having outgrowth an asterisk mark has been placed against their names to indicate that they have outgrowths which
are not separate towns.
(xxiii)

STATEMENT
VILLAGES WITH POPULATION OF5,OOO ANDABOVEAT C.D. BLOCK
Serial Name of c.o. Name of Location Population Whether Whether it is Amenities number block village code it is Tahsil c.o. block Educational
number headquarters headquarters Senior College Secondary
School
2 3 4 5 6 7 8 9
Phul Maluka 01036600 6,069 No No 0 0
2 Phul Kotha Guru 01036700 8,915 No No 0 0 3 Phul Bhagta 01037100 11,809 No No 0 4 Phu\ Jalal 01038000 5,904 No No 0 5 Phul Bhai Rupa 01038800 13,294 No No 0 6 Phul Gumti Kalan 01038900 5,367 No No 0 0
7 Phul DhapaJi 01039400 5,654 No No 0 0
8 Rampura Mandi Kalan 01041000 8.429 No No I 0
9 Rampura Chaoke 01041200 8,280 No No 0
10 Rampura Balianwa1a 01042600 7,169 No No 0
11 Phul Patti Karam
Chand Mehraj 01042900 5.334 No No 0
12 Rampura Rampura(Rural) 01043000 6,883 No No 0 0
13 Rampura Pitho 01043100 5,291 No No 0 0
14 Nathana Nathana 01045100 7,197 No Yes 0
15 Nathana Gobindpura 01045400 7,233 No No 0
16 Nathana Poohla 01045600 5,523 No No 0 0
17 Nathana Lehra Mohabat 01046000 8,966 No No 0 0
18 Nathana Bhucho Kalan 01046300 6,349 No No 0
19 Nathana Mehna 01046700 27,029 No No 2 0
20 Bathinda Jeeda 01047600 5,134 No No 0 0 21 Bathinda Nehianwala 01048400 6,083 No No 0 0
22 Bathinda Sibian 01048500 5,417 No No 0
23 Bathinda MehmaSarja 01048600 7,060 No No 1 0
24 Bathinda Ablu 01049500 6,690 No No 0 0
25 Bathinda Deon 01050000 6,487 No No 0 0
26 Nathana Tungwali 01052600 6,293 No No 0 0
27 Bathinda Kot Shamir 01053100 9,314 No No 0
28 Sangat Pathrala 01055400 6,233 No No 0 0
29 Sangat PakkaKalan 01056400 7,586 No No 0
30 Talwandi Sabo Bhagibandar 01062500 6,578 No No 0
31 Talwandi Sabo Talwandi Sabo 01062600 16,754 Yes Yes I 2
32 Talwandi Sabo Ram Tirath Jaga 01063000 6,212 No No 0 0
SfAlEMENT STATUTORY TOWNS WITH POPULATION LESS THAN 5000
Serial Name of Location Population Whether Whether it is Amenities
number Town code it is Tahsil C.O. block Educational
number headquarters headquarters Senior College
Seconda School
2 3 4 5 6 7 8
NIL
(xxiv)

-7
LEVEL AS PER 2001 CENSUS AND AMENITIES AVAILABLE
Name of Serial Medical Drinking Water Communication Banking village number
Primary Primary Tap water Railway station Commercial Co-operative Health Centre Health Bank Bank
Sub-centre
10 II 12 13 14 15 2
0 0 Yes No 0 Maluka I
0 0 Yes No 0 Kotha Guru 2
0 Yes No 2 Bhagta 3
0 0 Yes No I Jalal 4
I 0 Yes No I 0 Bhai Rupa 5
0 0 . Yes No 0 0 Gumti Kalan 6
0 Yes No I Dhapali 7
I 0 Yes No 0 0 Mandi Kalan 8
0 0 Yes No I Chaoke 9
0 Yes No 0 Balianwala 10
Patti Karam II
0 I Yes No 0 0 Chand Mehraj
0 0 Yes No 0 0 Rampura(Rural) 12
0 Yes No 0 0 Pitho 13
I Yes No 2 1 Nathana 14
0 Yes No 0 0 Gobindpura 15
0 0 Yes No 0 0 Poohla 16
1 Yes Yes Lehra Mohabat 17
0 Yes No 0 Bhucho Kalan 18
0 Yes No I 0 Mehna 19
Yes No 0 0 Jeeda 20
0 1 Yes No 0 Nehianwala 21
0 0 Yes No 0 Sibian 22
0 0 Yes No 1 MehmaSarja 23
0 Yes No 0 0 Ablu 24
0 Yes No 0 0 Deon 25
0 0 Yes No 0 Tungwali 26
1 Yes No 2 0 Kot Shamir 27
0 Yes No 0 0 Pathrala 28
1 Yes No I Pakka Kalan 29
0 Yes No 0 0 Bhagibandar 30
1 1 Yes No 5 2 Talwandi Sabo 31
0 0 Yes No 0 0 Ram Tirath Jaga 32
-8 AS PER 2001 CENSUS AND AMENITIES AVAILABLE
available Name of town Serial
Medical Improved drinking water Communication Banking No.
Hospital Health Centre Tap water Railway Bank
station
9 10 11 n 13 2
NIL
(xxv)

STATEMENT -9
HOUSELESS AND INSTITUTIONAL POPULATION OF TAHSILS, RURAL AND URBAN, 2001
Serial Districtrrahsill Total/ Houseless population Institutional £oEulation
number UA/Town Rural/ Number of Persons Males Females Number of Persons Males Females
Urban households households
2 3 4 5 6 7 8 9 IO II
Bathinda Total 415 2,020 1,162 858 766 13,407 12,064 1,343
Rural 176 962 558 404 447 9,855 9,158 697
Urban 239 1,058 604 454 319 3,552 2,906 646
Rampura Phul Total 107 547 293 254 117 1,040 629 41 I
Rural 69 349 194 155 102 930 576 354
Urban 38 198 99 99 15 110 53 57
Rampura Phul UA Urban 38 198 99 99 15 110 53 57
(M CI+OG)
2 Bathinda Total 203 877 561 316 590 11,527 10,863 664
Rural 50 309 199 110 300 8,200 8,084 116
Urban 153 568 362 206 290 3,327 2,779 548
Goniana (M CI) Urban 3 19 9 10 2 23 19 4
Bhisiana (CT) Urban 17 552 546 6
Bhucho Mandi
(M CI) Urban 7 2 5
Bathinda (M CI) Urban 130 446 299 147 266 2,714 2,192 522
Sangat (M CI) Urban II 61 30 31 2 14 7 7
Kot Falla (M el) Urban 9 42 24 18 2 17 13 4
3 Talwandi Sabo Total 105 596 308 288 59 840 572 268
Rural 57 304 165 , .~ 139 45 725 498 227
Urban 48 292 143 149 14 115 74 41
Raman (M el) Urban 18 114 57 57 3 26 18 8
Maur (M el) Urban 30 178 86 92 II 89 56 33
(xxvi)

ANALYTICAL NOTE


Analytical Note
(i) History and scope of the District Census Handbook
Ever since the beginning of first post independence Census of India 1951, the publication of District Census Handbooks (DCHBs) has'become a regular feature of the Indian Census. Produced by the Cej)sus Organisation of Government of India on behalf of the State Government, the DCHB is a unique publication which gives the census as well as noncensus data down to every village in case of rural areas and ward within the town/urban area in the state. It is recognized as one of the most comprehensive sources of information. Infact, this is the only publication which provides primary census abstract based on census, and non-census data on I
infrastructure and amenities available, such as
educational, medical, postal and communicational at the sub-micro level. It is inter- alia used for delimitation of constituencies, formulation of local level and regional plans and serves as a valuable tool for district administration.
Undisputedly, DCHB has remained to be the most comprehensive and valuable product of the census
organization ever since its initiation. It has always been the endeavour of the Census ofIndia to enlarge
the content and coverage of the data presented at every censw~. The DCHB series of 1951 Census contained important Census Tables and the Primary Census Abstract. At the 1961 Census, the scope of the DCHB was enlarged by including a descriptive account of the district, administrative statistics, census tables and the village and town directory. In 1971,
. the DCHBs were planned in three parts; Part-A
included the village and town directory, Part-B
included village and town wise primary census abstract, while the Part-C was meant to include analysis of census data and a write up covering social, cultural, historical and other important aspects. However, in some states/union territories Part-C remained confined to the district tables only.
During 1981 Census, some new features were added and the formats of village and town directory were. restructured, somewhat. These volumes were published for each district in two parts. Part- A included village and town directory, while Part-B included primary census abstract (PCA) of every village and ward in town/urban area. The inclusion of scheduled castes PCA was the additional feature of the 1981 Census. The village directory of 1981 Census included new parameters viz; information on Adult literacy Centres, Primary Health Sub-Centers and Community Health workers in the village (s) to meet the requirement ofthe Revised Minimum Needs Programme. In addition, infOlmation on approach to th~ village was also provided for the first time in the village directory to help in taking stock of villages
requiring road linkages in the district. Likewise, Statement IV-A included in the Town Directory aimed to provide data on slums so as to undertake development activities in such areas.
The manner of presentation of the DCHBs for the 1991 Census was, by and large, same as followed in 1981 Census. However, the format of PCA was slightly restructured in the 1991 Census for the benefit of data users. The village level data were presented Community Development (C.D.) block wise to cater to the needs of grass root level planning as envisaged under the five year plans. Ninefold industrial classification of the main workers was reintroduced by replacing the four-fold industrial categories adopted at the 1981 Census. In addition, the PCA also gave popullltion in the 0-6 age group by sex essential for working out effective literacy rate, besides providing proportion of child population.
The DCHB 2001, t~e present volume, is the sixth in series. The pattern followed is, by and large, similar to that of the 1991 Census. Among the new features added, information on the availability of newspapers/ magazines, banking facility, agricultural and nonagricultural societies, recreational and cultural facilities

and income and expenditure of the village panchayats find mention. More important is that, it is for the first time in the history of Indian Census that Permanent Location Code Number (PLCN) has been allotted to every village in the state to meet the demand from different organizations to study the village level data over a time spell. It is believed that the permanent location codes assigned to each village would help in tracing the precise location of a village on account of jurisdictional changes in the boundaries of various administrative areas.
(ii) Brief history of the district
Bathind~ as a District came into existence with the formation ofPEPSU in 1948. Bathinda and Mansa Tahsils till then formed part of Patiala State, and Faridkot Tahsil of Faridkot State. The history of Bathinda and Mansa Tahsils consequently followed the fortunes ofPatiala State and the history of Faridkot State. The following account has been extracted from the Phulkian State Gazetteer of 1904 "Bathinda is of great antiquity," but its earlier history is very obscure having been confused with Sirhind, Bhatia and Ohind. According to the khalifa Muhammad Hasan's capital and place of residence, which Mahmud captured, Tabarhindh was, in all probabilities the old name of Bathinda. This is distinctly asserted in the labb-utTawarik. Another form was Batrind, and this is found in Ibn Batuta. The earliest mention to Tabarhindh occurs in the Iami-ul-Hakayat written about 607 H. or 1211 A.D. It is called Tabarhindh or in two MSS, Barhindh or Tarindh (Bathinda). In the Tabaqat-INasiri Tabarhindh is repeatedly mentioned.
The Aina-I-Barar Bans preserves the following traditions:- Bathinda was built by Bhai Rao, son of Bal Band, who in 336 Sambat became the ruler of Punjab, and to whom the foundation of Bhatner is also ascribed.
Medieval Period:
The medieval period of history starts with the Muhammadan invasion of India. The invasion of Sultan Mahmud ofGhazni in the 11 th century shook the Indian rulers completely. It is believed that Bathinda was capital of Hindushahi rulers for more than a century. There is no doubt that the Hindushahi rulers defended this country from the onslaughts of Muhammandan
4
DISTRICT CENSUS HANDBOOK: BATHINDA
invaders for a considerable period, but they could not stand against the incessant invasions of Mahmud of Ghazni. The decline and decay of the Hindushahi kingdom". which was the first to bear the brunt of the Turkish' onslaught, enabled Mahmud to penetrate into the heart of Hindustan. First of all, he besieged in 1004 AD the fort of Bathinda which lay on the route from the north-west into the rich Ganga valley.
The Rajputs rose to power after the fall of the Hindushahi in Punjab. The Chauhans first ruled in Ajmer, but it appears that by 1164 they had occupied Delhi as well as the entire tract of territory lying between it and the Satluj. Sirhind and Bathinda constituted the two most important military stations on the north-western frontiers of the Rajput kingdom. The area of Bathinda District was then under Chauhan Rajput and Prithvi Raj Chauhan was an illustrious ruler of this dynasty. He did not seem to have been ready for the attack and had to surrender. Muhammad Ghori stationed his men in the fortress under the commander, named Zia-ud-din. When the Sultan was about to return, Prithvi Raj appeared in the vicinity of the fortress to recover it. A fierce battle was fought in 119 I . Prithvi Raj besieged the fortress of Bathinda from Zia-ud-din.
Prithvi Raj Chauhan was defeated in the second battle of Tara in, in 1192 which was a landmark in the history of India, and ensured the ultimate succeess of Muhammad Ghori against Hindustan. After the defeat of Prithvi Raj Chauhan the area of Bathinda came under the rule of the Muhammadan. Accordingly, he was the first Muhammadan ruler who was subsequently succeeded by his most prominent slave, named Qutab-ud-din Aibak who laid the foundations of Slave Dynasty. The period between 1206-1526 is known as 'The Period of the Sultan of Delhi'. It is also believed that area of present Bathinda District was part and parcel of the main ~
Delhi Province.
After Illutmish, Raziya who reigned from 1236-1240 was the next important ruler of the Slave Dynasty. Virtually, she was the first woman ruler of India but undue favour shown by her to the slave Ialal-ud-din Yaqut, offended the Turkish nobles who brought about her downfall in an ignoble manner.
The above causes led to a conspiracy against the queen. Altunia, the Governor of Bathinda, was

ANALYTICAL NOTE
also an active member of the conspiracy. He revolted and as soon as Raziya reached Bathinda to suppress the revolt, some agents of the conspirators killed Yaqut, the favourite of the queen and threw her into prison in April, 1240 and Bahram was proclaimed the Sultan of Delhi.
In the redistribution of offices Altunia did not get what he had expected. He thought of a plan to avenge himself. In August 1240, he released Raziya from the prison, married her and proceeded to Delhi to capture it by force. But they were defeated by Bahram's army and were compelled to return towards Bathinda. Their troops deserted them and they were murdered by some robbers on October 13, 1240.
The most important slave king was Balban who ruled this country from 1246-1287. He made his cousin Sher Khan, the Governor of Bathinda and adjoining areas. As the Governor of the frontier provinces, he
. had become so powerful and influential that Balban began to consider him as a danger to his personal authority. It is believed that Balban had managed to get Sher Khan poisoned and appointed his eldest son Bughra Khan, as the Governor of Bathinda. He died in 1285 while he was engaged in a fight against the Mangols.
After the Slave dynasty, the Khilzi Dynasty ruled about 34 years (1288-1321). Ala-ud-din Khilzi was an important ruler of this dynasty. After the Khilzis, the Sayyids reigned from 1414-1451. Sayyid Mubarak Shah was an important ruler of this dynasty, Shaikh Salim was the Governor of Bathinda who had collected a large treasure and in 1430, Faulad Turkbacha confiscated the treasure in July, 1430. The pact of Faulad with Shaikh Ali was a grave danger to Sultanate Delhi.
Before the rule of the Mughal, India was ruled by the Lodhi Dynasty from 1451-1526. Ibrahim Lodhi was the last ruler of the Lodhi Dynasty from whom Babar snatched power after defeating him in the first battle ofPanipat in 1526. It is worthwhile to mention here that the area of present Bathinda District was dominated by the Sidhu-Brars.
Both Tiloka and Rama were sons of Chaudhary Phul and the followers of Guru Gobind Singh. During the battle of Guru with Wazir Khan of Sirhind, Tiloka and Rama helped Guru alongwith their soldiers. They fought at Anandpur Sahib and also at Chamkaur Sahib. Guru Gobind Singh also stayed for sometime at
5
Damdama sahib in Bathinda District. Here, Guru stayed for quite some time dictating the Addi Granth to a devout Sikh, Bhai Mani Singh. When they asked the Guru where his young sons were, the Guru replied, pointing to his followers: "For these thousands, I sacrificed the other four". It is worthwhile to mention here that two elder sons of Guru Gobind Singh, laid down their lives in the battle ofChamkaur Sahib and remaining two younger sons were martyred at Sirhind by Wazir Khan, the Faujdar of Sirhind.
.~
, The most important thing that happened during the rule of Raja Sahib Singh was that Patiala State, including the most of the area of Bathinda District, came under the domination of the British Government as he sought and obtained the protection of the British. He died on March 26, 1813 and was succeeded by his son Karam Singh.
During the first Anglo-Sikh War in 1845-46, Karam Singh fought on the side of the British. He died during this war and his son and successor Maharaja Narinder Singh also helped the British in the Anglo-Sikh War. On November 1,1861, he was invested with the Most Exalted Order of the Star of India, at Allahabad; and about the same time, he was appointed a member of the Governor General Council for making laws and regulations. On November 13, 1862, Maharaja Narinder Singh, the most enlightened ruler of the State, passed away.
In 1873, Rajinder Singh became the Maharaja of Patiala and laid the foundation of Rajendra Hospital in 1877. It gave some sort of medical relief to the people ofMalwa. In 1881, railway line from Rajpura to Bathinda was installed. It added to the facilities of communication to the peopJe of this area. Maharaja Rajinder Singh passed away in 1900.
The Struggle for Freedom :
Namdhari Movement-Namdhari Movement popularly known as Kuka Movement was initiated by Bhai Ram Singh on April 1, 1857 at Ludhiana District. He knew of the hardships and sufferings of the ordinary peasants and based his movement on redressal of their grievances. He had served as a soldier in the Sikh Army and had been influenced by the idea of Sikh dominion over the Punjab. Within a few years, Bhai Ram Singh emerged as Guru Ram Singh with ~ cOl).siderabJe following in Ludhiana and adjoining areas.

Within a short period, Namdhari Movement spread in the rest of Punjab including the area of present Bathinda District. The Namdharis of Bathinda District took an active part in the freedom struggle of the country. However, the movement was ruthlessly suppressed by the British in 1872.
The Ghadar Movement-The Ghadar Movement was the first purely secular movement which aimed at to liberate India by force of arms. The rebellion was planned in the United States and funds were raised from Indians living in foreign countries. The headquarter of the movement was at San Francisco. Sohan Singh Bhakna was the President and Lala Hardyal was the General Secretary of the Party. Pt. Kanshi Ram of Rupnagar District was the treasurer of the Ghadar Party. A weekly paper called Ghadar (The Rebellion) was started with Lala Hardyal as Chief Editor. Because of the Journal, the organisation came to be known as the Ghadar Party.
The harassment of the passengers of the ship 'Kamagata Maru' comprising mostly Punjabis, instigated the people of Punjab living in foreign to participate actively in the Ghadar Movement. Unfortunately, the movement failed because of the leakage of information by Kirpal Singh who had been planted by the British among the Ghadarites.
The Punjab Ryasti Praja Mandai Movement-The Punjab Ryasti Praja Mandai Movement remained very forceful in Patiala State. As much of the area of Bathidna District was under Patiala State; the movemerit had also its impact on the district. To begin with, it focussed its attention on political issues such as liberty of movement and speech and misuse of state finances by the rulers, particularly Maharaja Bhupinder Singh of Patiala. The All India States People's Conference was held at Bombay in 1927, and under its inspiration, Praja Mandals were organized in a large number of states.
Akalis were actively associated with this movement. They started their campaign with a long tour of Patiala State under the leadership of Baba Kharak Singh, who was known as the 'uncrowned king of the Panth'. He addressed a big political conference at Mansa in Bathinda District where the birth of the Punjab Ryasti Praja Mandai was announced on July 17, 1928 and exhorted his audience
6
DISTRICT CENSUS HANDBOOK: BATHINDA
to participate in the agitation launched by the Akalis. Sewa Singh Thikriwala was elected as its president and Bhagwan Singh Longowalia as its general secretary. A rally was attended by thousands of peasants from neighbouring villages. Akalijathas from Barnala, Bathinda, Mansa, Maur, Sardulgarh, Sunam and Bhawanigarh took part in the procession. Baba Kharak Singh in his speech attacked the misdeeds and loose morals of Maharaja Bhupinder Singh of Patiala.
Throughout 1931, the agitation for the sack of Maharaja Bhupinder Singh continued unabated. Budhlada was another important centre of Praja Mandai Movement. In a public meeting held there, resolutions were adopted condemning enhancement of land revenue and abiana and demanding relief in taxes. Religious-cum-political conferences were also held at Mansa and Talwandi Sabo in 1940 by Akalis. There were not much disturbances in the wake of the Quit India Resolution passed by the Bombay Session of the Indian National Congress in August, 1942. The people of Bat hind a District took an active part in overall freedom movement of the country. A big political conference was held at Phul on 25th and 26th April, 1946 which was addressed by prominent Congress leaders from Punjab.
Independence and its Aftermath
At the time of Independence in 1947, Maharaja , Yadvindra Singh was ruling over most of the present Bathinda district, with headquarters at Patiala. As in the rest of the country, people celebrated achievements of Independence with great enthusiasm. Among the states, Maharaja Yadvindra Singh of Patiala played a significant role in the history ofIndia
There was a lot of bloodshed during the partition period in the entire di~trict. India's Independence brought about a little change in the attitude of the princes. The Praja Mandai and the Akalis continued with their demands and remained quarrelling over the details of future set up. But after a very short interval, they patched up the~r differences, forged a united front and started demanding a responsible government. The Akalis issued an ultimatum to the East Punjab States to introduce responsible Government or face a morcha. The Praja Mandai had already been threatening a struggle. It was no
I

ANALYTICAL NOTE
longer possible for the States to continue in their
old ways. Administration was crisis-ridden and the
Central Government at Delhi was not too
sympathetic. In such a situation, the movement for
merger of these states gained ground.
Formation ofPEPSU and its merger with Punjab:
The Patiala and the East Punjab States Union or the PEPSU, as it was popularly called, had come
into existence on August 20, 1948, with the integration
qf the princely States of Patiala, N abha, 1 ind,
Faridkot, Kapurthala, Nalagarh and M~lerkotla. This
union came into being under the active guidance of
Sardar Valabh Bhai Patel who was then the Home Minister and incharge of Indian States Department.
Maharaja Yadvindra Singh of Patiala was appointed
as the Rajparmukh (Head of State).
With the formation of the PEPSU, the Praja
MandaI also changed its name to the PEPSU Pradesh
Congress. All the princes in the East Punjab States
except the Maharaja ofPatiala were eli~inated. Even
the Patiala ruler was nothing more than the
constitutional head of the State and the real power
passed into the hands of the representatives of the
people. In 1956, with the reorganization of the States, PEPSU was merged with Punjab and constitutional position of the Maharaja of Patiala ended. The Praja Mandalist now claimed that they had fought till the consummation of the great struggle which they had
launched nearly thirty years earlier. At present, the
district has three tahsils/sub divisions, viz. Bathinda,
Talwandi Sabo and Rampura Phul. After merger of
PEPSU with Punjab, the district has made rapid
strides in the fields of agriculture and industry. The 0
establishment of Guru Nanak Dev Thermal Plant and
the National Fertilizer Ltd. at Bathinda are the
monuments of modem history of the district.
(iii) Administrative set-up
The State has experienced a large-scale
jurisdictional changes after the 1991 census. The
number of districts has increased from 12 in 1991 to 17 in 2001. The newly created districts include; Nawanshahr, Fatehgarh Sahib, Moga, Muktsar and
Mansa. With the exception of Kapurthala district all
other 11 districts in the State have experienced interdistrict jurisdictional changes of varying magnitude.
7
These 17 districts are distributed over four
divisions. lalandhar division includes districts of Gurdaspur, Amritsar, Kapurthala, lalandhar,
Hoshiarpur and Nawanshahr; Patiala division covers
districts of Rupnagar, Ludhiana, Patiala, Sangrur and Fatehgarh Sahib; Firozpur division spreads over
districts of Firozpur, Moga and Muktsar, while
Faridkot division embraces districts of Faridkot, Bathinda and Mansa.
0;' The intra-districts jurisdictional changes resulted i'n increase in the number oftahsils in the State from
46 in 1991 to 72 in 2001 Census. (In Punjab Tahsil
and Sub Division are synonymous to each other).
Bathinda district spreads over an area of 3353 sq.
kms. Presently Bathinda district is sub-divided into
three tahsils: 1. Rampura Phul, 2. Bathinda., and 3.
Talwandi Sabo. Likewise the number of towns in the
district has increased from 8 to 9, out of which 8
have statutory status. The newly added one town
Bhisiana has the status of Census Town .The district
constitutes 284 villages. Comprising 280 inhabited and
4 uninhabited villages. All the 4 uninhabited villages
falls in Bathnida tahsil.
The statutory towns are notified by the State
government. Section 4 of the Punjab Municipal Act, 1911 lays down the specifications of local areas to be smaller urban areas or transitional areas and constitution of Municipal Council and Nagar
Panchayat. Under this section, the state government
may, having regard to population of area, the density
of population therein, the revenue generated for local
administration, the percentage of employment in non
agricultural activities, the economic importance or such
other factors, as it may deem fit, specifY by notification
in the official gazette any area to be transitional area or a smaller urban area for the purpose of this Act.
Further, under Section 4 (ii) where an area is specified
as a transactional area or as a smaller urban area
under sub section (i), the state government may, by
notification in the official gazette, constituted for the
transactional area so specified a Nagar Panchayat and for the smaller urban area so specified a Municipal
Council of the Class I, Class II, Class III.
The different categories of urban bodies
constituted by Punjab government under the provisi0ns
of Punjab Municipal Act are as follows;

DISTRICT CENSUS HANDBOOK: BATHINDA
SI. Class of Urban Population Income No. Local Bodies
2 3 4
1. Municipal Corporation 3 lac or above. 2 Crore or above
2. Municipal Council Class I 50,000 to 3 lac. 50 lac to 2 crore
3 Municipal Council Class II 10,000 to 50,000 15 lac to 50 lac
4. Municipal Council Class III Upto 10,000 upto 15 lac.
5 Nagar Panchayat 5,000 or above More than Rs. 150 per head
The following statement indicates the jurisdictional changes, which took place after the 1991 Census in Bathinda District.
JURISDICTIONAL CHANGES DURING 1991-2001
Name of District! No. of villages No. of Towns
Tahsil 1991 2001 1991 2001 Changes since 1991 & Govt. Notification No.
2 3 4
Bathinda District 527 284 8
Rampura Phul Tahsil 76 76
Bathinda Tahsil 121 120 5
Talwandi Sabo Tahsil 85 88 2
For the administrative purpose, the district is a part
ofFaridkot Division. For the purposes of general and revenue set up the district is divided into three tahsils viz. Rampura Phul, Bathinda., and Talwandi Sabo. All of them have sub divisional status. The district is further sub-divided into 7 community development blocks viz. 1. Bathinda, 2. Nathana, 3. Talwandi Sabo, 4. Sangat, 5. Phul, 6. Rampura Phul, and 7. Maur. There are 9 towns viz 1. Rampura Phul, 2. Goniana , 3.
8
5
9
6
2
6
i) 240 villages of Mansa Tahsil of Bathinda district transferred to newly created
district Mansa vide notification No.2/2/92-RE-II (1)/4247 dated 8-4-92.
i) No change in Rampura Phul Tahsil since 1991
Census.
i) No change in Bathinda Tahsil since 1991 Census except Bhisiana was made C.T. in 2001
i) Talwandi Sabo Tahsil lost village Nangala HB 149 to newly created Tahsil Sardugarh vide notification No. 2/44/94-RE II (1)/6765 dated 20.7.95.
ii) Above village again transferred to Talwandi Sabo Tahsil from Sardulgarh Tahsil vide notification No. 2/44/94-RE-II (1)/8011 dated 6.8.95.
iii) Talwandi Sabo tahsil gained 3 villages i.e. Ghuman Khurd HB 68, Ghuman Kalan HB 69 and Sukha Singhwala HB 70 from Tahsil Mansa vide notification No. 2/68/96-RE 11(1)
9453 dated 9.12.1996.
Bhisiana,_? 4 .. Bhucho Mandi, 5. Bathinda, 6.Sangat, 7.Kot Fatta, 8.Raman and 9. Maur. The only addition ofBhisiana Census town is a creation of Census 200 1. The district is the basic unit of administration. The administrative machinery of the district consists of hierarchy of officers and officials headed by the Deputy Commissioner (also the District Magistrate) as head of the administration of the district and revenue
administration in the district.

ANALYTICAL NOTE
(iv) Physical Features
Location and Size :
Bathinda district is located in the Central Southern part of Punjab State in the Malwa region, It forms part of Faridkot Revenue Commissioner's Division and is situated between 29°-45' and 30°-45' North latitude and 74°-30' and 75°- 30' East longitude. The district shares boundaries with Muktsar and Faridkot districts in the North and the West, Mansa district in
, the South and Sangrur district in the East. It is constituted of areas of the erstwhile princely the state of Patiala which was known as the Phulkian States.
According to 2001 Census, Bathinda covers an area of 3353 sq. kms and has a population of 1,183,295 comprised of 632,809 males and 550,486 females. This makes 4.9 per cent of State's population and 6.7 per cent of area. Among the districts it ranks eighth in area in the State. In terms of population, it ranks ninth in the state.
Physiography :
Bathinda district is a part of the Punjab Malwa plain and is sub-divided into following micro-regions on the basis of soils, topography, climate and natural vegetation, which are briefly described below:
Bathinda district forms part of Satluj Ganga plain and is characterized by low-lying flat area. The elevation of the land surface ranges from 208 meters in the southwest to 223 meters in the northeast. Thus the slope of the ground is from northeast to southwest. The range of elevation in the district is about 15 meters, hence, gentle slope is characteristic feature of the area. On a macro scale this area may be considered as one landform unit but at microscopic scale the topographical variation may be delineated which is due to flooding of river and presence of sand dunes in some parts of the district.
l.Bathinda Sandy Plain - The region is spread over the parts of Bathinda, Rampura Phul and Talwandi sabo. Being sandy plain the region is dotted with scattered sand dunes, which have the tendency to shift towards eastern side. The geological structure of this region is formed of Alluvium and the main soils are coarse sandy loam to loam, grey or red desert which are orthids Fluvents. Ochrepts Psamments and Psamments Fluvents-Orthid. The maximum height
9
of 220 meters is located near village Sooch of Rampura Phul tahsil and the minimum height of 199 meters is found near village Sardargarh of Bathinda tahsil. The natural vegetation includes Kikar, Ber, Neem and thorn~ bushes.
2.Rampura-Plain - The region spreads over the large parts of Rampura Phul and Bathinda tahsils. This region covers the eastern portion ofthe district. This is a plain area dotted with sand dunes. The geological structure of this region consists of Alluvium and main soils of region are coarse sandy-loam to loam to siltyclay loam, which are classified as Psamment-FulventsOrthids and Ochrepts-Psamments. Natural vegetation includes, Kikar, Ber, Neem and thorny Bushes. It has Bathinda branch, Kotla branch, Odat branch and Biroke branch (Sirhind Canal) and other numerous distributories for irrigation.
Canals:
There is no major river flowing through the district. There are some canals, which flow through this district. The district is served by two canal system, the Sirhind canal and the Bhakra canal. The main source of irrigation in the district is the Sirhind canal, and its other three branches namely the Abohar branch, the Bathinda branch and the Kotla branch. The Bhakra canal system also serves the district but only a small area is irrigated by it.
Water resources:
The water resources of the district include canals, wells & tubewells. Firstly the canals serve large parts of the district. The Bhakra Main canal and branch of Sirhind canal are passing through the district. Various distributaries of these canals provide irrigation to a large area of the district. The traditional types of wells have almost been replaced by tubewells run by electricity and diesel engines. Because of increasing supply of electric power the tubewells run by electricity are increasing in number.
Climate:
The western Himalayas in the north and the Thar Desert in the south and southwest mainly determine the climatic conditions. Geographically Bathinda district falls in the Central-Southern part of Punjab and is distantly located from the Himalayas. The Rajasthan desert is also not far away and its heat,

sand and dust storms influence its weather to a great extent, the district has a very hot summer, mild rainy season and dry but embracing winter. Due to extension of irrigation facilities during the last few decades, the weather has undergone some changes.
The climate, on the whole, is dry in the district. Temperatures start rising from middle of February and increase rapidly from the beginning of March till June, which normally is the hottest month of the season. The temperature occasionally touches 47° centigrade and scorching dust-laden winds; commonly known as 100, blow during the hot season. The temperature drops considerably with the onset of monsoon in early July, although the nights continue to be quite warm. Due to increased humidity in the monsoon period, the weather is oppressive during rains.
Based on the climatic conditions in the district, the year may be divided into four seasons. November to March is the cold season, which is followed by the hot season lasting up to the end of June. The period from July to mid September constitutes the rainy season commonly known as the period of southwest monsoon. The second half of September and October is termed as the period of post monsoon. January is the coldest and June, the hotest month. The period from November to February is cold; in winter, light frost or rains may be experienced. In March weather becomes fine. The following table gives monthly rainfall based on average of 5 years, 1996-2000 for the district
MONTHLY RAINFALL-AVERAGE OF 5 YEARS, 1996-2006
Month Rainfall Month Rainfall (mm.) (mm.)
1. January 6.1 7. July 67.9
2. February 8.9 8. August 51.4
3. March 3.0 9. September 43.1
4. April 7.8 10. October 7.5
5. May 4.9 11. November 1.0
6. June 20.1 12. December 1.5
Total 223.2
Forestry:
Bathinda district falls under the jurisdiction of Divisional Forest Officer, Bathinda. Due to the extension of agriculture the area under forests has declined appreciably during the present century. The
10
DISTRICT CENSUS HANDBOOK: BATHINDA
district was known as jungle once but jungles are no longer to be seen anywhere. The break up of area under various type of forests in the district during 2000-01 is as follows :-
Serial Type of Forest 2000-0 I No. ( in sq. km.)
1 Reserved Forests
2 Protected Forests 67
3 Unclassified Forests 8
4 State Forests (Total 1 to 3) 75
5 Under S/38 of Indian Forest Act, 1927
6 Total Forest (total 4+5) 75
7 Percentage of area under forest 2.2 %
The table reveals that during 2000-01 the area under state forests is 75 sq. km. However, during 2000-01, no area has been reported under the pri vate forests. But the percentage of area under forest is 2.2 per cent, which is far below the norm prescribed for forest cover in the State. With the shifting over of management of road sides, canal banks and strips of land along railway lines to the Forest Department for growing and maintaining tree. plantation therein, some improvements have taken place during last few decades in the district.· The plantation of shisham and kikar trees will not only provide much needed timber to the people but also ensure better returns to department.
Natural Economic Resources
Mineral and Mining :
The district is poor so far as mineral wealth is concerned. Some Kankar (calcarious nodules) is found at some places, particularly in Utar. It is used for road construction and is also burnt for lime. Black clay from which bricks are made also occurs in small quantities. Fine white clay is also found which is used for white washing. In some areas Shora (Saltpetre) is extracted but it is limited only to a few pockets bordering F!lridkot district, where patches of Kallar have appeared
L;md and Land use Pattern:
In the year 2000-2001 against a geographical area of 334,000 hectares, the area of the district. as per the village records. is 337.000 hectare. The two sets of areas show difference due to different methods adopted for measurement by two separate agencies.

ANALYTICAL NOTE
However, for the purpose of discussion in the succeeding pages we will refer to area as per village papers only. It may be noted that out of a total area of 337 thousand hectares as per village papers, 7 thousand hectares is under forest, 30 thousand hectares is put to non-agricultural use and 1 thousand hectares is under Culturable Waste. There are 299 thousand hectares. 'Net Area Sown' in the district during 2000-01, which is 88.7 per cent of total area out of which 263 thousand hectares, is sown more than once. Thus the total cropped area works out to 562 thousand hectares in the district during 2000-01.
o '
Bathinda district is mainly an agricultural district as 70':; per cent of its population is reported to be residing in the rural areas during 2001 Census. Further agriculture alone engaged 51.3 per cent of its main workers during 2001 Census (cultivators 29.8 per cent, agricultural labourers 21.5 per cent). Thus it would be seen that agriculture provides the single largest source of employment in the district though decline
• is noticeable during the last few decades.
Kharif (sawani) and Rabi (harhi) are two main harvesting seasons The principle Kharif crops include paddy(rice), jawar, bajra, sugarcane, groundnut. The Rabi crops include wheat, gram, barley, some oil seeds, pulses, etc. Seasons additional crops are also grown where conditions so permit. These are known as zaidKharif and zaid-Rabi.
Bathinda district, like other districts in Punjab is progressing towards a rice-wheat cropping system along with the prevalent cotton-wheat cropping system. Rice crop is grown more in northern part of the district, where the irrigation is mostly by wells, whereas the cotton crop is grown mostly in central and southern part of the district, where the irrigation
is mostly by canals.
During 2000-01 the district reported an area of 277,000 hectares under Rabi against 285,000 hectares under kharif. Further out of 562,000 hectares of total cropped area of district, 360,000 hectares and 202,000 hectares are reported under food and non-food crops respectively. Thus the total cropped area is reported under food and non-food crops in the district is the 2nd
highest for any district in the State The break up of area under various crops in the district during 2000-01 . was as under! wheat 243.0 thousand hectares cotton
11
447.0 thousand hectares (American 414.7 thousandhectares and desi 32.3 thousand hectares) and Paddy 99.0 thousand hectares.
Irrigation:
This district relatively falls in low rainfall region and thus irrigation has a vital role to play. The main sources of irrigation are the canals. as the rains ,are low and erratic even during the monsoons. Also the sub-soil water is low and brackish, which is considered unsuitable for irrigation. Besides the canals, tubewells (13958 as on 31't march, 2001) are the other source of irrigation in the district, Irrigation by well is also resorted to but to a limited extent. The irrigation is done mainly from Sirhind canal (Bathinda branch, Musa branch, Kotla branch, Odat branch, Biroke branch and New Dhodal branch), but some areas are also irrigated from Bhakra canal and other fluvial distributories (DhapaJi, Phul, Gumman, Bangi, Bhadaur, Raonta, Joga Bhikhi and Sunam).
During the year 1990-91 the net irrigated area reported was 451,600 hectares, out of which 368,000 Hectares from government canals and 83,600 hectares from tube wells. Thus percentage of net area irrigated to net area sown worked out to 92.0 per cent for this district during 1990-91. Also during 1990-91 out of 838,000 hectares gross cropped area 786,000 hectares was irrigated. During 1990-91 percentage of gross irrigated area to gross cropped area worked out to 93.8 per cent for Bathinda.
However, during the year 2000-01 the net irrigated area reported was 294,900 hectares, out of which 2,30,500 hectares from government canals and 64,400 hectares from tubewells. Thus percentage of net area irrigated to net area sown worked out to 98.6 per cent for this district during 2000-01. Also during 2000-01 out of 562,000 hectares gross cropped area '557,800 hectares was irrigated. During 2000-01 the percehtage of gross irrigated area to gross cropped area worked out to 99.3 per cent for Bathinda.
Horticulture:
Horticulture is gaining popularity in the district for the last few years. During 2000-01, an area of 2119 hectares was reported under various fruit trees. The break up of area under various fruit is as follows: Kinnows 670 hectares, Grapes 806 hectares, Orange

and Malta 173 hectares, Ber 271 hectares, Guava 249 hectares, other miscellaneous fruit 50 hectares. The area under orchards is very limited due to various factors such as high temperature, stormy wind conditions, and unsuitability of sub-soil water for irrigation and inadequacy of canal water. In spite of these limited factors the district has reported sizeable area under grapes and kinnows. The area under grapes would have been much more had there been efficient arrangements for procurement of grapes, the farmers had to make their own arrangements for marketing these fruit. The farmers have persistently demanded the setting up of some factory to process their produce to bring them remunerative returns from grapes, which require very delicate handling before disposal. Day by day the attitude of the farmers is changing and horticulture has become very popular in the district.
The vegetables are also grown in the district. An area of 5,645 hectare was reported under vegetables during 2000-01. The break up of area is as follows. , (1) Potatoes 3350 hectares, (2) Onions 113 hectares,(3) winter vegetables 1072 hectares and summer vegetables 1110 hectares. The demand for vegetables is picking up in the district as the urban centres have grown over the years. The establishment of various colonies etc. under various central and state projects increased the demand for vegetables.
Besides compost (both in urban and rural), cattle dung, green manures and chemical fertilizers are increasingly being used in this district. During 2000-01, 68,000 tonnes of chemical fertilizers mainly nitrogenous (50,000 tonnes) and phosphatic (17,000 tonnes) were consumed in the district for growing improved varieties of wheat, paddy sugarcane, cotton, etc. The farmers are, however, becoming conscious of the deleterious effects of reckless use of chemical fertilizers in their farms. The farming scientists are required to provide them with some alternative nutritive soil agents so that crop yields do not suffer.
Animal Husbandry :
Livestock, the back bone of the peasantry and the farmer, has traditionally been depending upon drau"ght animals for plouging and on milch cattle, mainly cows and buffaloes, for milk and other dairy products for domestic use and for supplementing their farm income.
12
DISTRICT CENSUS HANDBOOK: BATHINDA
The data on live stock in Punjab is available for the year 1997. It reveals that there are 1,31,700 cows, 2,28,900,.. buffaloes, 2700 horses and ponies, 2,100 donkeys, 300 mules, 77, I 00 sheep, 53,700 goats, 21,400 camels and 2,700 pigs, totalling 5,20,600 animals. Cows (25.3%) and Buffaloes (44.0%), as else where, are the two most dominant milch animals in the district. The district can boast of a fairly rich cattle wealth. The decline in the number of cattle is attributable to the mechanization of agriculture and transportation, which makes lesser demand of draught cattle. However, the ever- increasing demand of milk in the urban centres and the state has increased demand of milch buffaloes, which are mainly of good breads (murrah and nili).
In 2000-0 I there were 87 veterinary Hospitals, 87 veterinary dispensaries and 3 sheep and wool extension centres and insemination units in the district wherein 72 veterinary officers and 147 veterinary pharmacists were posted.
The poultry birds had recorded 9.9 per cent increase from 288,100 birds in 1990 to 316,600 birds in 1997. The poultry farming is now being practiced on scientific lines, which is evident from the large number of poultry farms located in the district. This has been made due to acceptability of egg as a vegetarian food.
In order to provide good quality meat to the general public, 11 recognized slaughterhouses were functioning in the district during 2000-01 where 28,771 animals (26,099 sheep and goats, 2,672 pigs) were slaughtered.
A 1.25-lakh litre capacity milk plant is located at Bathinda. It had 5 chilling centres attached to it which not only collect milk from the villagers at the remunerative price, but process and supply milk and various milk products also to the general public throughout the year at reasonable prices.
Fisheries:
Pisciculture has been taken up in a big way in the district. An area of 552 hectares was stocked with fish wherein 7940 th0l:lsand fingerlings were raised. An income of Rs. 61,000 accrued at the fisheries department in the district during 2001. One fish seed farm and one fish seed nursery were located in the district where seeds were produced for distribution among the fish farmers of the district.

ANALYTICAL NOTE
Tenancy:
The areas now constituting this district were earlier in Patiala state, where feudal institutions like Jagirdari and Biswedari were prevalent which had since been abolished under various land reforms measures introduced after independence. As a result many occupancy tenants had become proprietors. Similarly tenancies at will that were able to purchase land under the law also became proprietors. Also ceilings on land resulted in surplus lands, which were distributed among the landless cultivators on payment of,compensation. For fear of being deprived of their land many landlords have taken to self- cultivation and have introduced mechanization in agriculture in a big way. The farmers generally cultivate their land themselves or through servants. This system is known as Khudkasht (Selfcultivation). In some cases the land is leased out to other marginal farmers or tenants on Batai (share cropping) or Theka (contract). The general rate of Theka (contract) varies from time to time depending
~
upon the provision of irrigation, fertilizers etc. However, the rate of Theka (contract) varies from time to time depending upon the quality of land and the period of contract. As a large number of farmers own tractors, some of them offer services for various agricultural operations against cash payments. This system is gaining popularity in the rural areas.
Agriculture is now being carried on commercial lines as cash crops like cotton and paddy are being raised in the farms with the help of contractual labour which is available locally or from outside. This has imbibed a scientific outlook among the farmers resulting in a vast and fast development of agriculture in the district.
Industry :
During the princely times there was not much industrial activity in the district. Village industries like hand loom weaving, oil extraction by wooden Kohlus, manufacture of agricultural implements, juti making, baan making, gur and shaker manufacture, calico printing and phulkari making were in vogue in the rural areas. Durries in floral designs were manufactured in the urban centres like Bathinda, Rampura Phul etc. Calico printing was popular in Talwandi Sabo. There was a colony of potters· (Kumhars) at Bathinda who produced quality
earthenware, especially surahis. Desi juties (country shoes )of good qual ity were produced at Bathinda. Ban making was done at Bathinda. Phulkaries were produced at Rampura Phul.
13
Day by day industry is also developing in this backward area. The following kinds of industrial units in the small scale sector are now active in the district: Agricultural implements, Guru Gobind Singh #Jil refinery, sewing machines parts, steel rolling mill, wood and screws, electric goods, radio transistors and sound equipment, condume pipe and plastic goods. Between the medium and large-scale industrial units there has been quite an expansion. The various medium and large-scale units located in the district are as follow:
l.Milk Plant : A Milk plant is located at Bathinda in the public sector. The Plant has a capacity to process 1.25-lakh litre of milk daily during 2000-01. It has 3 chilling centers and number a of collection centres attached to it in the district.
2.National Fertilizer Plant: A chemical Fertilizer Plant of National Fertilizer Plant Ltd. engaged in the manufacture of Urea, has been set up to meet the needs of the district and other southern districts of the state.
3.Cement Plant: A Cement plant is fast coming up (since completed) in the private sector at Bathinda. It will utilize coal ash from Guru Nanak Dev Thermal Plant for the manufacture of cement. Gujrat Ambuja Group of Companies is installing the plant. It will go a long way in meeting demand of cement of southern district in the state.
4.Rice shellers : There are a large number of rice shellers located in the district, which meet the local demands for dehuskihg of paddy.
S.Dal manufacturing units : The district is a big producer of gram. Hence, a number of units are engaged in the manufacture of dal etc. in the district.
Transports :
An efficient network of roads and railway is an essential requirement for development of any area as it is the backbone of any development activities. The district is well served by both roads and railway. The Bathinda Railway Junction is one of the biggest

junctions in the State. It is from here that railway lines fan out towards various directions in this district such as :
(1) Bathinda-Firozpur railway line : It serves Bathinda tahsil. It is a broad gauge line.
(2) Bathinda-Sri Ganganagar railway line: It also serves Bathinda tahsil. It is a broad gauge line.
(3) Bathinda-Jakhal-Delhi railway line: It serves Bathinda and Talwandi Sabo tahsils. It is a broad gauge line.
(4) Bathinda-Rajpura railway line: It serves Bathinda and Rampura Phul tahsils. It is a broad gauge line.
(5) Bathinda-Kot Kapura-Fazilka railway line : It serves Bathinda tahsil. It was originally a metre gauge line but has recently been converted into broad gauge railway line under the gauge conversion programme.
(6) Bathinda-Hanumangarh-Bikaner railway line: It serves southern part of Bathinda and western part of Talwandi Sabo tahsils. It was originally a metre gauge line but has been converted into broad gauge railway line under the gauge conversion programme.
(7) Bathinda-Sirsa-Rewari railway line: It serves Bathinda and Talwandi Sabo tahsils. It was originally a metre gauge line but has since been converted into broad gauge railway line under the gauge conversion programme undertaken by the railways.
The following railway stations are located in the district : (1) Gehri Bhagi, (2) Shergarh, (3) Bangi Nihalsingh, (4) Raman, (5) Gurusar Sainewala, (6) Sangat, (7) Bagwali, (8) Bathinda, (9) Kartar Singhwala, (10) Kot Fateh, (11) Maisar Khana, (12) Maur, (13) Balluana, (14) Behman Dewana, (15) Phus Mandi, (16) Bhucho, (17) Rampura Phul, (18) Lehra Mohabat.
In the year 2000-01 there were 2,177 Km. of roads maintained by PWD (B & R), in Punjab, out of which 110 Km. was under the National Highways (NH-15), whereas the remaining 2,067 Km. was provincial highway. Besides, there was 417 Km. of municipal roads maintained by the civic bodies.
Taking 2594 Km. of road length into consideration, there were 77.4 Km. of roads per 100 Sq. Km. of area and 219.2 Km. of roads per lakh population in the district in the year 2000-01. But in 1990-91, there
14
DISTRICT CENSUS HANDBOOK: BATHINDA
were 59 Km. of roads per 100 Sq. Km. of area and 199 Km. of roads per lakh population.
The important roads in the district are: (1) Bathinda- Malout road, (2) Bathinda-Kot Kapura road, (3) Bathinda-Talwandi Sabo road, (4) BathindaMuktsar road, (5) Bathinda-Dabwali road, (6) Bathinda- Sunam road, (7) Bathinda- Barnala road, (8) Rampura Phul-Moga road etc.
In the year 2000-2001 (31 5t March, 2001) 141,609 vehicles were registered in the district. The break up of on road vehicles is as follows: 565 buses; 7,479 station wagons; 1489 jeeps; 150 taxis; 75166 two wheelers, 282 three wheelers. Besides, there were 3149 goods vehicles, 53207 tractors and 122 others. It is pertinent to mention here that the number of tractors was the second highest in the district next only to Firozpur district (55,174), in the State.
The district is well served by the Public Road Transport system. The district being part of erstwhile PEPSU, State, the bus routes are mainly with the Pepsu Road Transport Corporation (PRTC), which has following two depots operating in the district: (l) Bathinda -I (It has 93 buses in 2000-2001, against 98 in 1990-91); and (2) Bathinda-II (It operated 90 buses in 2000-01, against 99 in 1990-91). Thus it would be seen that fleet of buses has decreased in the district on the whole during the 1991-2001 decade due to Mansa tahsil becoming a separate district in 1992. The Government has also been hiring buses from private sector on kilometer basis. The other depots of PRTC and Punjab Roadways also operate buses on various routes in the district. There are a number of private operators also, w~o provide transport services in areas not served by Government transport operators.
The increase in vehicles has resulted in increase of accidents in the district. In 1990 there were 90 accidents in which 44 persons were killed and 71 injured. But in 2000, 150 accidents took place, which resulted in loss of97 precious lives and caused injuries to 178 persons in the district.
Post and Telegraph and ~dio:
There is a good net work of post and telegraph offices in the district. The telephone facilities have also been greatly improved throughout the district. Mobile and land line telephone have reached almost all villages of the district.

ANALYTICAL NOTE
There is a Relay Station of All India Radio (Akashvani) at Bathinda which relays programmes of Jalandhar Station and caters to the needs of local residents as well as residents of the adjoining districts.
Electricity and Power:
The erstwhile rulers were well aware of the technological changes taking place in the world. They therefore, were the first to introduce electricity in their areas in the beginning of the present century.
, The state government Public Works Department replaced the private suppliers of elect~icity. However, after some time, the responsibility of supplying electricity as bestowed upon the Punjab State Electricity Board, Patiala.
In the year 2000-01, Bathinda district consumed 595.8 million units of electricity. The break up by various sectors of electricity consumed in the district is as follows: (1) Domestic 171.3 million units, (2) Commercial 3404 million units, (3) Industrial 18104 million units, (4) Agricultural 157.7 killion units (5) and Others 51.0 million units. During 2001-02, the district consumed 3.09 per cent of the total state's consumption. If we study 1990-91 figures we find that Bathinda district consumed 459.1 million units of electricity. The break up of electricity consumed by various sectors was as follows: (1) Domestic 98.9 million units, (2) Commercial 14.1 million units, (3) Industrial 21204 million units, (4) Agricultural 111.6 million units, (5) and Others 22.2 million units showing a decadal growth of 29.8 per cent. Also the district consumed 3.9 per cent of state's total consumption of electricity during 1990-91.
The government has set up a thermal plant (Guru Nanak Dev Thermal Plant) at Bathinda to make available electricity to various types of consumers as the district was distantly located from the hydro power stations of Satluj and Beas river system. Further thermal power generation was necessitated to avoid fluctuations during the winter months when less electricity was generated in the hydro power station. This plant has come up in three stages. The first stage envisaged setting up of two units (110 x 2MW) of220 Mega Watt capacities, the second (200 x 2MW) 400 Mega Watts and the third one (210 x 2) of 420 Mega Watts capacity. The first two stages had been completed since long whereas the third stage has also
been completed a late. Thus the GNDTP, Bathinda has a total installed capacity of 1040 Mega Watts in all. The average piant load factor achieved during the year 1986-87 was 58.8 per cent. The total generation during the year 1986-87 was 226,721 Million Units.
It was felt by the Energy Planners that to meet over increasing demand for electricity, another thermal plant should be set up, Consequently work was started on the Guru Hargobind Sahib Thermal Plant at village Lehra Mohabat, in this district. This thermal plant will have a capacity of 220 MW. Bathinda is one of the leading districts in generating the electricity in the state.
Trade and Commerce:
15
The areas constituting present day Bathinda district were known as "Jungle" where desert like conditions prevailed. But it being an important centre of halt, enroute Delhi, assumed importance as a centre of both administration and trade and commerce. It further developed into an important centre of railways as seven broad gauge railway lines met here from different directions. The extension of canal irrigation with building of Sirhind Canal and Bhakra Canal systems ushered in prosperity. The agricultural development resulted in the emergence of grain markets all over the district, which gave much-needed fillip to the trade and commerce in the district. The position further developed when government built up an excellent road network in the district.
,'~ As per the data available for the year 2000-200 I, out of 144 regulated markets in the state, 9 are located in Bathinda and on an average, each regulated market is serving 32 villages in the district compared with 88 villages in the state as such. These nine regulated markets are at Bathinda, Bhucho, Goniana, Maur, Raman, Rampura Phul, Sangat, Bhagta Bhaika and Talwandi Sabo. In the year 2000-01 there were arrival of 67~,600 tonnes ?f agricultural produce in the Mandis (Markets) of the district. Out of the total arrivals of agricultural commodities, wheat and paddy accounted for 101,400 tonnes (15.,1 %) and 35,000 tonnes (5.2%) respectively. There were, however, total arrivals of 1,569,400 tonnes of agricultural commodities in the district during 1990-91, out of which wheat, paddy and maize accounted for 655,000 tonnes and 2,50,000 tonnes respectively, thus showing a 57.3 per cent

decrease in total arrivals in 2000-01 awing to diversification towards other crops and formation of Mansa district out of Bathinda district.
Though the wholesale and retail trade is mostly in the private hands in the district, there is a wholesale Co-operative Marketing and Supply Society at Bathinda, which undertakes wholesale supplies of agricultural implements, seeds, fertilizers, pesticides, kerosene oil, sugar, edible oil, etc. to the farmers/ members.
During 2000-01 there were 8 marketing cooperatives, 236 milk supply co-operatives, 287 weavers' co~operatives, 6 consumer's co-operatives, 56 housing co-operatives, 164 agricultural cooperatives societies and 47 non agricultural cooperatives societies in the district. Besides, there were a number of co-operatives consumer stores in the district. In order to ensure availability of essential commodities, such as wheat, wheat flour, rice, sugar, kerosene oil and cheap cloth to poorer sectiops of the society in rural as well as in urban areas at reasonable rates, the government introduced State trading. Under this scheme, a large number of fair price shops are being run either through co-operative societies or private traders where essential commodities are supplied to general public at subsidized rates under the scheme of Public Distribution System (PDS).
Goods are also traded at various places in the district on the occasion of fairs participated by a large number of visitors. Cattle fairs are also held at various places in the district where cattle/animals change hands. Bathinda being centrally located between Bangar (Haryana), Bagar (Rajasthan) and Punjab, attracts a large number of cattle traders.
On 31 st December 2000, there were 185 branches of various banks, operating in the district. The break up of these branches is as follows; State Bank of India (SBI) 17, State Bank of Patiala (SBP) 47, Punjab National Bank (PNB) 19, Co-operative Banks 51, and Other Commercial Banks 51. As against th is in 1980,141 bank branches were functioning in the district (SBlI6, SBP 33, PNB 15, Co-operative Banks 47, Other Commercial Bank 30). Thus, it would be noted that Bathinda district has not made notable progress in the number of bank branches during the last two decades.
16
DISTRICT CENSUS HANDBOOK: BATHINDA
MisceIJaneous Activities :
Though this district was declared industrially backward a long time ago but it could not make rapid progress in this field due to its location. The government has made special efforts to generate sufficient power for supply to industries and agriculture. Besides expanding the Guru Nanak Dev Thermal Plant at Bathinda, efforts are afoot for setting up a second thermal plant (Guru Har Krishan Thermal Plant) at Lehra Mohabat located on Bathinda- Rajpura railway line. With its completiop the district will emerge as the biggest centre of power generation in the State surpassing even Rupnagar District.
Special stress is being laid on the development of this district in education. The State Government has set up an Engineering College at Bathinda. The University has also opened Guru Kashi Institute at Bathinda and a Regional Campus at Damdama Sahib (Talwandi Sabo). This Regional Campus will serve as a nucleus centre for professional courses in the district.
(v) Census concepts
Building:
A 'Building' is generally a single structure on the ground. Sometimes it is made up of more than one component unit which are used or likely to be used as dwellings (residences) or establishments such as shops, business houses, offices, factories, workshops, worksheds, Schools, places of entertainment, places of worship, godowns, stores etc. It is also possible that buildings which have component units may be used for a combination of purposes such as shopcum-residence, workshop-cum-residence, office-cumresidence etc.
Usually a structure will have four walls and a roof. But i~ some areas the very nature of construction of houses is such that there may not be any wall. Such is the case of conical structures where entrance is also provided but they may not have any walls. Therefore, such of the conical structures are also treated as separate buildings.
Permanent houses :
Houses, the walls and roof of which are made of permanent materials. The material of walls can be
',.

ANALYTICAL NOTE
anyone from the following, namely, galvanized iron sheets or other metal sheets, asbestos sheets, burnt bricks, stones or concrete. Roof may be made of from anyone of the following materials, namely, tiles, slate, galvanized iron sheets, metal sheets, asbestos sheets, bricks, stones or concrete.
Semi-permanent Houses :
Houses in which either the wall or the roof is made of permanent materi~l and the other is made Of temporary material.
Temporary Houses :
Houses in which both walls and roof are made of materials, which have to be replaced frequently. Walls may be made from anyone of the following temporary materials, namely, grass, thatch, bamboo, plastic, polythene, mud, unburnt bricks or wood. Roof may be made from anyone of the following temporary materials, namely, grass, thatch, bamboo, wood, mud, plastic or polythene.
Dwelling Room :
A room is treated as a dwelling room if it has walls with a doorway and a roof and should be wide and long enough for a person to sleep in, i.e. it should have a length of not less than 2 meters and a breadth of at least 1.5 meters and a height of 2 meters. A dwelling room would include living room, bedroom, dining room, drawing room, study room, servant's room and other habitable rooms. Kitchen, bathroom, latrine, store room, passageway and verandah which are not normally usable for living are not considered as dwelling rooms. A room, used for mUltipurpose such as sleeping, sitting, dining, storing, cooking, etc., is regarded as a dwelling room. In a situation where a census house is used as a shop or office., etc., and the household also stays in it then the room is not considered as a dwelling room. But if a garage or. servant quarter is used by a servant and if she/he also lives in it as a separate household then this has been considered as a dwelling room available to the servant's household. Tent or conical shaped hut if used for living by any household is also considered as dwelling room.
A dwelling room, which is shared by more than one household, has not been counted for any of them. If two households have a dwelling room each but in
addition also share a common dwelling room, then the common room has not been counted for either of the households.
Census House .".
, A 'census house' is a building or part ofa building used or recognised as a separate unit because of having a separate main entrance from the road or common courtyard or staircase, etc. It may be
. occupied or vacant. It may be used for residential or non- residential purpose or both.
In certain peculiar situations, the manner in which buildings and census houses were identified for numbering in the field by the enumerators is described hereunder:
17
Sometimes a series of different buildings are found along a street which are joined with one another by common walls on either side looking like a continuous structure. These different units are practically independent of one another and are likely to have been built at different times and owned by different persons. In such cases, though the whole structure with all the adjoining units apparently appears to be one building, each portion was treated as a separate building and its constituent units as separate census houses.
On the other hand, one may come across cases, particularly in large cities of multi-storeyed ownership flats. In these cases while the structure looks like one building, different persons own the flats. In case of such multi-storeyed structures, having a number of flats owned by different persons, the entire structure was treated as one building and each flat as a separate census house.
Ifwithin a large enclosed area, there are separate buildings owned by different persons then each such building is treated as a separate building. There can be a situation where within an enclosed compound there are separate buildings owned by an undertaking or company or even government that are actually in occupation of different persons. For example, Indian OiJ Corporation colony where the buildings are owned by the Corporation but these are in occupation of their employees. Each such building was treated as a separate building. But ifin anyone of these buildings there were flats in occupation of different households, each such flat was reckoned as a separate census house.

Sometimes it becomes difficult to apply the definition of census house strictly in certain cases. For example, in an urban area, if a flat has five rooms, each room having direct entrance from the common staircase or courtyard. By definition, this has to be treated as five census houses. If all these five rooms are occupied by a single household it was not realistic to treat them as five census houses. In such a case, 'singleness' of use of these rooms along with the main house should be considered and the entire flat was treated as one census house. On the other hand, if two independent households occupy these five rooms, the first household living in 3 rooms and the second household occupying 2 rooms, then considering the use, the first three rooms together were treated as one census house and the remaining rooms as another census house. But if each room was occupied by an independent household, then each such room was treated as a -separate census house.
In case of hostels, hotels, etc., even if the door of each room in which an inmate lives openS'to a common verandah, staircase, courtyard or a common room, as it happens almost invariably, the entire hostel/ hotel building was treated as one census house. but if such hostels/hotels have out-houses or other structures used for different purposes or the same purpose, then each such structure attached to the main hostel/hotel was treated as a separate census house.
In some parts of the country, in rural areas, the pattern of habitation is such that a group of huts, located in a compound, whether enclosed or unenclosed, is occupied by one household. While the main residence may be located in one hut, other huts may be used for sleeping, as a kitchen, bath room, baithak, etc. Though each of the huts was a separates structure, they form a single housing unit and therefore, have to be treated collectively as one building and one census house. If some of the huts are used by one household and the others by a second household as residence, then the two groups of huts were treated as separate census houses. However, if there were also other huts in the compound used for other purposes and not as part of the household's residence such as, cattle shed, workshed, etc., these were treated as separate census houses.
On the other hand, in urban areas, where more than one structure within an enclosed or open
18
DISTRICT CENSUS HANDBOOK: SATHINDA
compound (premises) belonging to the same person, e.g., the main house, the servant's quarter, the garage, etc., only one building number was given for this group and each of the constituents a separate census house number.
Only cases where a structure with roof and pillars has come up was treated as a building.
Villa~e :
The basic unit for rural areas is the revenue village, which has definite surveyed boundaries. The· revenue village may comprise of one or more hamlets but the entire village is treated as one unit for presentation of data. In unsurveyed areas, like villages within forest areas, each habitation area with locally recognized boundaries is treated as one village.
Rural-Urban Area:
The data in tables on Houses, Household Amenities and Assets are presented separately for rural and urban areas. The unit of classification in this regard is 'town' for urban areas and 'village' for rural arellS': In the Census ofIndia 2001, the definition of urban area adopted is as follows :
a) All places with a municipality, corporation, cantonment board or notified town area committee, etc.
b) A place satisfying the following three criteria simultaneously:
i) a minimum population of 5,000;
ii) at least 75 per cent of male working popUlation engaged in non-agricultural pursuits; and
iii) a density of popUlation of at least 400 per sq. km.(1,OOO per sq. mile).
For identification of places which would qualify to be classified as 'urban' all Villages, which, as per the 1991 Census had a population of 4,000 and above, a popUlation density of 400 persons per sq. km. and having at least 75 per cent of male working population engaged in non-agricultural activities were considered. To work out the proportion of male working population referred to above against b) (ii), the data relating to main workers were taken into account.
Apart from these, the outgrowths (OGs) of cities and towns have also been treated as urban under

ANALYTICAL NOTE
'Urban Agglomerations'. Examples of out-growths are railway colonies, university campuses, port areas, military camps, etc., that may have come up near a statutory town or city but within the revenue limits of a village or villages contiguous to the town or city. Each such individual area by itself may not satisfy the demographic criteria laid down at (b) above to qualify it to be treated as an independent urban unit but may deserve to be clubbed with the towns as a continuous urban spread. Thus, the town level data, wherever presented, also includes the data for outgrowths of such towns:
City :
Towns with population of 100,000 and above are called cities.
Urban Agglomeration
An Urban Agglomeration is a continuous urban spread constituting a town and its adjoining urban outgrowths (OGs) or two or more- physically contiguous towns together and any adjoining urban outgrowths of such towns. In some cases, railway colonies, university campuses, port areas, etc., may come up near a city or statutory town outside its statutory limits but within the revenue limits of a village or villages contiguous to the town or city. Each sUGh individual area by itself may not satisfy the minimum population limit to qualify it to be treated as an independent urban unit but may deserve to be clubbed with the town as a continuous urban spread.
For the purpose of delineation of Urban Agglomerations during Census of India 2001, following criteria are taken as pre-requisites:
(a) The core town or at least one of the constituent towns of an urban agglomeration should necessarily be a statutory town; and
(b) The total population of all the constituents (Le., towns and outgrowths) of an Urban Agglomeration should not be less than 20,000 (as per the 1991 Census).
With these two basic criteria having been met, the following are the possible different situations in which Urban Agglomerations would be constituted:
i) a city or town with one or more contiguous outgrowths;
ii) two or more adjoining towns with their outgrowths; and
iii) a city and one or more adjoining towns with their outgrowths all of which form a continuous spread.
Household:
A 'household' is usually a group of persons who normally live together and take their meals from a common kitchen unless the exigencies of work prevent any of them from doing so. Persons in a household may be related or unrelated or a mix of both. However, if a group of unrelated persons live in a census house but do not take their meals from the common kitchen, then they are not constituent of a common household. Each such person was to be treated as a separate household. The important link in finding out whether it was a household or not was a common kitchen. There may be one member households, two member households or multi-member households.
19
Institutional Household :
A group of unrelated persons who live in an institution and take their meals from a common kitchen is called an Institutional Household. Examples of Institutional Households are boarding houses, mc;:sses, hostels, hotels, rescue homes, jails, ashrams, orphanages, etc. To make the definition more clearly perceptible to the enumerators at the Census 2001, it was specifically mentioned that this category or households would cover only those households where a group of unrelated persons live in an institution and share a common kitchen.
Houseless Household :
Households who do not live in buildings or census houses but live in the open on roadside, pavements, in huge pipes, under flyovers and staircases, or in the open ir places of worship, mandaps, railway platforms, etc., are treated as Houseless Households.
List of Scheduled Castes and Scheduled Tribes:
The Government oflndia by Gazette Notification under Article 314( 1) of Indian Constitution has declared some castes, races or tribes or parts of or groups within castes, races or tribes as Scheduled Castes as there is no standard definition of Scheduled Castes. Similarly, Scheduled Tribes mean all such

tribes or tribal communities or parts of or groups within such tribes or tribal communities as are declared by the President of India to be treated as Scheduled Tribes under Article 342(1) of the Indian Constitution. There is slight change in the definition of Scheduled Castes in 1991. Before that, Scheduled Castes could belong to Hindu or Sikh religion. But from 1990, in addition to Hindu and Sikh religions, Scheduled Castes may belong to Buddhists religion also. The list of Scheduled Castes and Scheduled Tribes are notified for each State and Union Territory and are valid only within the jurisdiction of that State or Union Territory and not outside. In Punjab State, 37 castes were notified by the State Government as Scheduled Castes at the 1991 Census and there is no change at the 2001 Census. Following 37 castes have been notified as scheduled castes in Punjab;
1. 2.
3. 4.
5. 6. 7. 8. 9.
10. 11. 12. 13. 14. 15.
16.
17.
Ad Dharmi Balmiki, Chura, Bhangi Bangali Barar, Burar or Berar Batwal Bauria, Bawaria Bazigar Bhanjra Chamar, J atia Chamar, Rehgar Raigar, Ramdasi or Ravidasi Chanal Dagi Darain Deha, Dhaya, Dhea Dhanak Dhogri, Dhangri, Siggi Dumna, Mahasha, Doom Gagra
18. Gandhilla, Gandil, Gondola
19. Kabirpanthi, Julaha
20. Khatik 21. Kori, Koli 22. Marija,
Marecha 23. Mazhabi 24. Megh 25. Nat 26. Od 27. Pasi 28. Perna 29. Pherera 30. Sanhai 31. Sanhal 32. Sansi, Bhedkut,
Manesh 33: Sansoi 34. Sapela 35. Sarera 36. Sikligar 37. Sirkiband
Language and Mother Tongue :
As per the census concept, each language is a group of mother tongues. The census questionnaire collects information on the mother tongue of each person and mother tongue is defined as the language spoken in childhood by the person's mother to the
20
DISTRICT CENSUS HANDBOOK: BATHINDA
person. If the mother died in infancy, the language mainly spoken in the person's home in childhood will be the mother tongue. In the case of infants and deaf mutes, the language usually spoken by the mother is considered as mother tongue. It is not necessary that the language spoken as mother tongue should have a script. The mother tongues returned by the respondents in censu~'are classified and grouped under appropriate languages according to their linguistic characteristics.
Literate:
A person aged 7 years and above who can both read and write with understanding in any language is taken as literate. A person who can only read but cannot write is not literate. It is not necessary that to be considered as literate, a person should have received any formal education or passed any minimum educational standard. Literacy could also have been achieved through adult literacy classes or through any non-formal educational system. People who are blind and can read in Braille are treated as literates ..
Literacy Rate :
Literacy rate of the population is defined as the percentage of literates in the age-group seven years and above. For different age-groups the percentage of literates in that age-group gives the literacy rate.
Educational Level :
The highest level of education a person has completed.
Work:
Work is defined as participation in any economically productive activity with or without compensation, wages or profit. Such participation may be physical and I or mental in nature. Work involves not only actual work but also includes effective supervision and direction of work. It even includes part time h~lp or unpaid work on farm, family enterprise or in any other economic activity. All persons engaged in 'work' as defined above are workers. Persons who are engaged in cultivation or milk production even solely for domestic consumption are also treated as workers. .,.
Reference period for determining a person as worker and non-worker is one year preceding the date of enumeration.

ANALYTICAL NOTE
Main worker :
A person who has worked for major part of the reference period (i.e. six months or more during the last one year preceding the date of enumeration) in any economically productive activity is termed as 'Main worker'.
(vi) Non-Census Concepts
Improved drinking water :
If the household had access to drinking water supplied from a tap, hand pump, tub~ well or well (protected or covered) situated within or outside the premises, it is considered as having access to improved drinking water.
It may be mentioned that such uniform definition may not be valid across all States.
System of sewerage :
Generally, a sewerage system would mean a network of mains and branches of underground conduits for the conveyance of sewerage to the point of disposal. Sewers that carry only household and industrial wastage are called separate sewers; those that carry storm water from roofs, streets and other surfaces are known as storm water drains, while those carrying both sewage and storm water are called combined sewers. However, in some towns, which are not provided with such underground sewerage system, it is served by open surface drain, box drain, sylk pattern drain, etc., in these towns.
Type of latrine and Method of disposal of night soil.
There are three prevalent systems of disposal of human wastes, viz.
(i) underground sewerage,
(ii) sanitary water flush latrines with individual disposal systems, like septic tank, leaching cess pool and collecting well, and
(iii) dry type of latrines with manual scavenging.
The system of underground sewerage provide. for the street sewerage with which are connected the sanitary latrines constructed in the houses having water closets and fitted with flushing cistern (or hand flushing). Through this sewer the fecal matter is transported' without the need for scavenging. This system generally exists in cities and big towns.
Where the street sewer does not exist, these sanitary water flush latrines are connected to a local septic tank with a sub-soil dispersion system or a leaching pit. Here the liquid wastes from the water closet is disposed of locally in leaching pit, a septic tank with a soil dispersion system is constructed. This dispersion requires an optimum travel through the pores of the soil, which renders the harmful liquid bacteriaUy innocuous by the slow process offiltration
. through the soil iraversed,
21
Where the soil is impermeable, collecting wells are constructed and the sanitary water flush latrines are connected with them. These wells are cleaned at periodic intervals by a suitable device. The dry type of latrines are of service type latrines from where human excreta is removed by scavengers from house to house, in most cases carrying it on their heads or shoulders or in baskets with handle or wheel barrows. These are then collected in bullock carts or trucks or tractors and trolleys for being carried to the dumping grounds.
Fertility :
In demography, the word fertility is used in relation to the actual production of children or occurrence of qirths specially live births. Fertility is a measure of rate at which population adds to itself by births and normally assessed by relating the number of births to a full or part of the population, such as number of married women or number of women of child-bearing age. The definitions of the terminology used in computing different fertility rates are mentioned below:
Crude birth rate (CBR) :
Ratio of the number of I ive births in a year to the mid year population, normally expressed per 1,000 population.
Number of live births during the year CBR = x 1,000
Mid-year Population
Crude death rate (CDR) :
Ratio of the number of deaths in a year to the mid year popUlation, normally expressed per 1,000 population.
Number of deaths during the year CDR = x 1,000
Mid-year Population

Natural growth rate :
Growth rate is obtained as the difference between crude birth rate and crude death rate in the absence of migration.
Age specific fertility rate (ASFR)
Number of live births in a year to female population in any specified age-group normally expressed per 1,000 women.
Number of live births in a particular age-group
ASFR = x 1,000
Mid-year female population of the
same age-group
Age specific marital fertility rate (ASMFR)
Number of live births in a year to married female population in any specified age-group normally expressed per 1,000 married women.
Number of live births in a particular age-group
ASMFR = x 1,000 Mid-year married female population of
the same age-group
General fertility rate (GFR) :
Number of live births per 1,000 women in the reproductive age-group (15-49) years in a given year.
Number of live births in a year GFR = x 1,000
Mid-year female population in the
age-group (15-49) years
General marital fertility rate (GMFR) :
Number of live births per 1,000 married women in reproductive age-group (15-49) years in a given year.
Number of live births in a year GMFR = ------------ x 1,000
Mid-year married female population in
the age-group (15-49) years
Total fertility rate (TFR) :
It is obtained as the total of the age specific fertility rates (number of children born per woman of
22
DISTRICT CENSUS HANDBOOK: BATHINDA
the particular age) for the entire reproductive age span. It provides the average number of children that will be born to a woman under the fertility levels indicated by the age specific fertility rates assuming that there is no mortality of women till the completion of reproductive period.
45-49
5 x I ASFR 15-19
TFR = -------
1,000
Total marital fertility rate (TMFR) :
Average number of children that would be born to a. married woman if she experiences the current fertility pattern throughout her reproductive span (15-49) years assuming that there is no mortality of women till the completion of reproductive period.
45-49 5 x I ASMFR
15-19 TMFR = -------
1,000
Age-specific mortality rate (ASMR)
Number of deaths in a particular age and sex group per 1000 population of the same age-group.
.~ Number of deaths in a particular
age-group ASMR = x 1,000
Mid-year population of the same
age-group
ql :
Probability of dying between birth and age 1. This can be used as approximate value of Infant Mortality Rate (IMR) which gives the ratio of number of deaths in a year of children aged less than one year to the number of births in that year.
q2
Probability of dying bet\~een birth and age 2.
q5 :
Probability of dying between birth and age 5. This indicator is also known as Under Five Mortality Rate (U5MR).

ANALYTICAL NOTE
Infant mortality rate (IMR) :
Ratio of the number of infant deaths (deaths of children below one year) in a year to the number of live births in that year.
Number of infant deaths during the year IMR = x 1,000
Number of live birthsduring the year
Infant mortality rate comprises of two parts, viz., Neo-natal mortality rate and Post neo-natal mortality rate. The neo-natal mortality rate also comprises of two parts viz., Early neo-natal mortality rate and late neo-natal mortality rate. These are defined as:
Neo-Datal mortality rate (NMR) :
Number of infants dying within the first month of life (28 days or under) in a year per 1,000 live births of the same year.
Number of infant deaths aged 28 days or under during the year
NMR = ------------ x 1,000 Number of live births during the~year
i) Early neo- natal mortality rate:
, Number of infant deaths of less than 7 days During the year
------------- x 1,000 Number of live births during the year
ii) Late neo-natal mortality rate :
Number of infant deaths of 7 days to less than 29 days during the year
------------- x 1,000 Number of live births during the year
Post neo-natal mortality rate (PNMR) :
Number of deaths of 29 days to less than One year during the year
------------- x 1,000 Number of live births during the year
Peri-natal mortality rate (PMR) :
Number of still births plus deaths within 1 st week
of delivery per 1000 births in a year.
Number of still births and infant deaths of less than 7 days during the year
PMR = x 1,000 Number of live births and still births
during the year
23
Still birth rate (SBR) :
Number of still births during the year SBR = x 1,000
Number of live births and still births during the year
Maternal mortality rate (MMR) :
Number of deaths of women in the age-group
1;>-49 while pregnant or within 42 days of
. 'termination of pregnancy from any cause related
to pregnancy and child birth per 100,000 live births
in a given year.
Number of maternal deaths to women in the age group 15-49
MMR = ----------- x 100,000
Number of live birth
Eligible couple (Couples per 1,000 population):
Number of currently married females in the agegroup 15-44 years per 1000 persons of all ages.
Child woman ratio (0-4) :
1. Number of children in the age-group 0-4 years
per 1000 women in the age-group 15-49 years.
Child woman ratio (5-9) :
2. Number of children in the age-group 5-9 years
per 1000 women in the age-group 15-49 years.
1) Migration
2) Internal and International Migration
3) Rural - Vrban component of migration
Civic status of urban units :
Civic Status of a town/city is determined on the basis of Civic Administrative authority of the town e.g., Municipal Corporation/Corporation, Municipal Committee/Municipal council, Municipality etc.
Size class of VA/town:
Size-class of VA/Town is based on the population size of the VA/City/Town VAs/Towns with 100,000 and above population are classified as Class I VAs/Towns. These Class I VAs.lTowns are now further sub classified into seven sub classes ~amely M 1 to M7 depending on the population size 'of VACity/Town. These are:

M7 (5,000,000 and above) M6 (2,000,000 to 4,999,999) M5 (1,000,000-1,999,999) M4 (500,000-999,999) M3 (300,000-499,999) M2 (200,000-299,999) and Ml (100,000-199,999)
Towns with 50,000 to 99,999 population are classified as Class II towns', 20,000 to 49,999 population are Class III towns, population with 10,000-19,999 are Class IV towns, population with 5,000 and 9,999 are Class V towns and towns with less than 5,000 population are Class VI towns.
Slum area:
The Slum Areas (Improvement and Clearance) Act, 1956, which was enacted by the Central Government defined slums as a) Areas where buildings are in any respect unfit for human habitation; or b) are by reasons of dilapidation, overcrowding, fault arrangement and design of such buildings,
DISTRICT CENSUS HANDBOOK' BATHINDA
narrowness or faulty arrangement of streets, lack of ventilation, light or sanitation facilities, or any combination of these factors, are detrimental to safety, health or morals.
Mega city:
The concept of 'Mega city' is a recent phenomenon in the Urban Sociology and is defined in term of metropolitan city in the form of large size, problem of management of civic amenities and capacity to absorb the relatively high growth of popUlation. Indian Census in 1991 treated the population size of 5 million and above as the cut off point to identify a place as
the mega city. Whereas, for the purpose of inclusion in Centrally Sponsored Scheme for Infrastructure Development in Mega cities the Ministry of Urban Affairs and employment, Department of Urban Development adopted the criteria of 4 million and above population as per 1991 Census for Mega Cities. In 2001 Census, cities with 10 millions and above population have been treated as Mega cities.
(vii) 200t-Census Findings-Population and its distribution
The following table shows distribution of rural and urban population by tahsils in the district.
POPULATION, NUMBER OF VILLAGES AND TOWNS, 2001
Name of Po ulation Tahsil Total Rural 'r- Urban Number of No. of
p M F P M F' P M F Villages Towns Total Inhabited
2 3 4 5 6 7 8 9 10 11 12 13
Rampura Phul 2~3,606 150,,259 133,347 238,941 126,567 112,374 44665 23,692 20,973 76 76
Bathinda 63i,475 340,083 291,392 371,480 200,120 171,360 259995139,963 120,032 120 116 6
Talwandi Sabo 268,214 142,467 125,747 221,120 117,431 103,689 47094 25,036 22,058 88 88 2
District total 1,183,295 632,809 550,486 831,541 444,1l8 387,423 351,754188,691 163,063 284 280 9
Bathinda district has a population of 1,183,295 including 632,809 males and 550,486 females. This makes 4.9 per cent of State's population.
Among the tahsils, Bathinda with a population of 631,475 is the most populous while Talwandi Sabo with a population of268,214 is the least populous tahsil in the district. In other words, tahsil with the highest population is more than twice the tahsil having least population. The population of other tahsil (Rampura Phul) is 283,606. A tahsil in the district on an average has a population of 394,432 compared with 338,319 in the State as a whole.
24
Out of the total population in the district 831,541 (70.3%) is residing in rural and 351,754 (29.7%) in urban areas. The corresponding percentages of rural and urban population in the State are 66.1 and 39.9 respectively. The rural population spreads over 280 inhabited villages and urban population is distributed over 9 towns in the district An -inhabited village in the district on an average has a population of 2,970 as against 1,311 in the state signifying that the villages in Bathinda district are much larger in size. Towns, on the other hand, are comparatively smaller in the
district as compared with that of the State; a town

ANALYTICAL NOTE
in Bathinda district on an average has a population of 39,084 as against 52,627 in the state. Among the towns in the district, Bathinda MCI (217,256) is the most populous while Bhisiana C.T (4,775) is the least populous town in the district.
Size Class & Status of a Town:
The methodology of urbanization can be better understood in terms of distribution of urban population among towns of different size classes. It has been the tradition for the Census organization to classifY towns according to their population size. A town with a population of 100,000 or more is termed as 'city' in Indian census.
Class Population size No. of Towns
2 3
Class - I 100,000 and above (Generally referred to as city) 1
Class - II 50,000 to 99,999 0
Class - III 20,000 to 49,999 2
Class - IV 10,000 to 19,999 3
Class - V 5,000 to 9,999 2
Class - VI Less than 5,000
Bathinda City with a population of217,256 is the only class I town in the district. There is no Class II town in the district, two fall in the population size class III, three are class-IV towns, the two are Class V towns, and remaining one is Class VI town. Nearly three-fifth (61.8%) of the urban population in the district is residing in Class I town and 20.5 per cent is residing in Class III towns in the district. The share of Class IV towns is 13.0 per cent, while class V and VI towns accommodate only 3.4 per cent and 1.3 per cent respectively of the urban population in the district.
During this decade the number of towns has gone up from 8 in 1991 to 9 in 2001. There has been an addition of 1 town, with a population of 4,775, which is 1.3 per cent of the urban population ofthe district. The new town added, Bhisiana C.T., falls in the category of Class VI towns. No town of 1991 has been declassified at the 2001 Census.
Population Growth, Density and Sex Ratio
Population Growth :
During 1991-2001, population of Bathinda district has increased from 985,301 in 1991 to 1183,295 in
200 I resulting in a net addition of 197,994 persons during this decade. In percentage terms the Bathinda district has recorded a decadal growth rate of 20.1 per cent. Among the districts, Bathinda ranks 7th and this growth rate is at par with that of state (20.1 %).
Density:
,.i" Bathinda district with a population of 1,183,295 and an area of 3,353 sq.km has a density or-353 persons per sq. km, which is significantly lower than
. that of the State (484) and ranks 13 th among the districts in the state.
Within the district, Bathinda (416) is the most densely populated tahsil and Talwandi Sabo (275) is the least populated tahsil. Likewise, rural density varies between 267 in Bathinda and 231 in Talwandi Sabo tahsil. The urban density is the highest in Rampura Phul (5,030) tahsil and the lowest in Bathinda (2,015) tahsil.
Sex Ratio:
25
Sex ratio is derived as the number of females per 1,000 males. Generally speaking differentials in mortality conditions of males and females, male-female ratio at birth and sex selective migration are the key factors, which determine the sex composition. It reflects the socio-economic and demographic characteristic of the population, and unfolds the status of women in the society and care of the girl child in particular.
Significant feature of Punjab's population is the preponderance of males over females. According to Census 2001, out of the total population of24,358,999 in the State, 12,985,045 are males and 11,373,954 are females resulting in an overall sex ratio of(876) which is significantly lower than the country as whole (933).
The sex ratio in the State and its constituent districts has remained to be low throughout. At the begin,ning of the 20th century, the sex ratio was 832 in 190 I, which declined to 780 in 191 I. Ever since, the sex ratio in the state gradually improved till 1991 when the sex ratio in the state reached 882. However, it has declined to 876 at 200 I, exhibiting a fall of 6 points in the State.
,i" In Bathinda district details prior to 1951 census are not available. Ever since 1951 the sex ratio in the district has gradually improved from 833 in 1951

to 870 in 2001. Within the State the districts among themselves show considerable disparity which is the highest in Hoshiarpur District (935) and the lowest in Ludhiana (824).Bathinda district with a sex ratio of 870. ranks 14th among the districts in the State exceeding only three districts namely Patiala, Ludhiana and Fatehgarh Sahib. Apparently, sex ratio in the district is significantly lower than the State, which in itself is marked with a low sex ratio.
Among the tahsils in the district the sex ratio is the highest in Rampura Phul (887) and the lowest in Bathinda (857). The rural sex ratio varies between 888 in Rampura Phul and 856 in Bathinda tahsil, the urban sex raiio fluctuates between 885 in Rampura Phul and 858 in Bathinda tahsil. The towns among themselves exhibit significant disparity in this regard; it varies between 893 in Kot Fatta and 683 in Bhisiana.
The sex ratio of child population in age group 0-6 in the State and its constituent districts is quite low and this has become a matter of deep concern. i>unjab has a child sex ratio of 798; it is almost identical in its rural (799) and urban (796) areas. In Bathinda district, the child sex ratio (785) is even lower than that of the State. Within the district, the tahsils among themselves display a considerable disparity in their child sex ratio; it is the maximum in Rampura Phul (795) and the minimum in Bathinda (780).
Likewise, the disparity in the rural and urban child sex ratio among the tahsils is also quite marked; the rural child sex ratio varies between 798 both in Rampura Phul and Bathinda and 786 in Talwandi Sabo, while the variation in urban child sex ratio is to the extent of 794 in Talwandi Sabo and 752 in Bathinda.
Literacy:
Any person who is able to read and write with understanding in any language is recorded as literate. As in 1991 all the children below 7 years of age have been treated as illiterates.
69.7 per cent of the state's population is literate which is higher than that of the country as such (64.8%). Among the StateslUnion Territories, Punjab ranks 16th in terms of literacy.
In Bathinda district 61.2 per cent of the population is recorded as literate which is significantly lower than the state by 8.5 percentage points. It ranks quite low
26
DISTRICT CENSUS HANDBOOK: BATHINDA
among the districts in the State. Firozpur, Muktsar, Sangrur and Mansa are the only other four districts which have literacy rate lower than that of Bathinda. Among the tahsils in the district, Bathinda (65.8%) ranks at the top while Talwandi Sabo (53.4%) is placed at the bottom. However, none of these tahsils in the district has literacy rate higher than the overall literacy rate in the state.
Between the two sexes, the gap in the literacy rate among males and females in the district is more significant as compared to that of the State. In Bathinda district 67.8 per cent among males and 53.7 per cent among females are literate, while the corresponding figures for the State are 75.2 and 63.4 per cent respectively.
Likewise, the rural-urban literacy rates also exhibit significant disparity. In the district 55.1 per cent of the rural population and 75.4 per cent of the urban population is literate. The urban literacy is higher than the rural in all the tahsils and the gap in urban literacy rate is maximum in Bathinda (19.6 percentage points) and minimum in Talwandi Sabo (16.4 percentage points). The corresponding gap in male and female literacy rate in rural areas is highest in Bathinda (16.5 percentage points) and lowest in Rampuya"Phul (11.4 percentage points). Similarly for urban areas, this gap is 15.2 percentage points in Talwandi Sabo and 12.0 percentage points in Bathinda
Work Participation Rate
Definition of Work and Classification of Workers:
How the 'work' is defined by the Census needs to be understood properly. Work is defined as the participation in any economically productive activity with or without compensation, wages or profit. Such participation may be physical and/or mental in nature. Work involves not only the actual work but also ' includes effective supervision and direction of work. It even incl~des part time help or unpaid work on farm, family enterprise or in any other economic activity. The scope of definition of work was expanded at the Census of India 2001, which includes production of milk even for domestic consumption. In the 1991 Census cultivation of certain crops even for one's self-consumption was treated as an economic activity. The scope of the term cultivation was expanded in this census to include certain other crops such as

ANALYTICAL NOTE
tomatoes, all types·offlowers, fruit and tuber potatoes, chilies and turmeric, viper, cardamoms, vegetables etc, in other words plantation of tea, coffee, rubber, coconut and betel nuts have been classified under plantation and not included in cultivation.
The reference period for recording the economic activity of any person is preceding one year from the date of enumeration. AU those persons who had worked for six months or more during the last year are recorded as main workers while those who had worked for less then six months during the last one year are treated as marginal workers. A person who had not worked at all during the last one year falls in the category of non- worker. Workers have been further classified into four categories viz. Cultivators, Agricultural labourers, workers in Household Industries and other workers.
Punjab, with a work participation rate of37.5 per cent, ranks 24th among the StateslUnion Territories in the Country and thus, the work participation rate in the Stat~ is lower than that of India (39.1 %). Among the districts in the State, the proportion of workers varies between 44.9 per cent in Nawanshahr district and 33.3 per cent in Gurdaspur district. In all 10 out of 17 districts in the State have shown work participation above the state average and among them five districts have two-fifths of their population reported as worker. Besides Nawanshahr, they include Bathinda (42.3%), Mansa (40.9%), Sangrur (40.7%) and Moga (40.1%).
Main Workers and Marginal Workers
32.2 per cent of Punjab's population has been recorded as Main Workers and 5.3% as Marginal Workers. The corresponding figures for 1991 Census were 30.1 per cent and 0.8 per cent respectively. In Bathinda district Main Workers and Marginal Workers constitute 34.6 per cent and 7.8 per cent of the total population respectively. Among the tahsils in the district the percentage of workers varies between 46.9 in Rampura Phul and 39.3 in Talwandi Sabo tahsil. The percentage of Marginal Workers varies between 23.5 in Talwandi Sabo tahsil and 14.0 in Bathinda tahsil.
The work participation rate in Bathinda district (42.3%) is better than the state average (37.5%). Among the tahsils in the district, it varies between 47.0 per cent in Talwandi Sabo and 39.4 per cent in
Bathinda. In the district 55.2 per cent among males and 27.5% among females are reported as workers showing a significant reduction in the gap between the two. In Talwandi Sabo, one-third of the females (36.7 per cent) are recorded as workers.
.,.. Out of the total workers, 34.6 per cent are main workers and 7.8 per cent are marginal workers. The proportion of main workers is the highest in Talwandi Sabo (36.0%) and the lowest in Bathinda tahsil
.(33.9%). However, the proportion of marginal workers is significantly higher in Talwandi Sabo tahsil (1.0%) followed by Rampura Phul (9.6%) and Bathinda (5.5%). Further, the incidence of marginal workers is observed to be more among females compared with males. The proportion of marginal workers in the district among females (12.2%) is excelled only by district Mansa (12.4%) and is more than thrice that of males (3.9%). By and large, a similar pattern is observed among all the tahsils in the district. In Talwandi Sabo, 19.0 per cent of females are marginal workers as against 4.0 per cent among male counterparts. Rampura Phul (15.1 %) and Bathinda (7.9%) too, have a higher proportion of female marginal workers.
27
Religion:
It has been customary for the Indian Census to provide information on religious persuations of its people. Religion is one of the basic cultural characteristics of population and several religions have thrived in the secular state of India. Apparently, information on various religious communities in the country has been of great interest and useful to the Anthropologists, Sociologists, Demographers, Administrators, Planners and the public at large. Question 7 of the household schedule canvassed at the 2001 Census pertained to religion. The instructions to enumerators were to record faithfully the religion of each member of the household as returned by the respondent in reply to this question.
The six main religions in the country were recorded by using following codes in Census 2001:-
Hindus Muslims 2 Christians 3 Sikhs 4 Buddhists 5 Jains 6

For all others, actual religion as stated was recorded fully. Further more, if any individual stated that he had no religion, the answer was recorded accordingly.
The instructions for recording this information are by and large the same as in 1991. A brief analysis based on 2001 Census data is given under annexure V.
Mother Tongue :
Question 10 of the Household Schedule canvassed at the 2001 Census pertained to 'Mother Tongue'. It is the language spoken in the childhood by the person's mother to the person. If the mother died in infancy, the language mainly spoken in the person's home in childhood will be the mother-tongue. In the case of infants and deaf mutes the language usually spoken by the mother should be recorded. In case of doubt, the language mainly spoken in the household may be recorded. Since the household may consist of persons related by blood or of unrelated persons or a mix of both, every person in the househ;ld is asked about herlhis mother tongue because the mother tongue of each member of a household need not necessarily be the same. It may be different for different members in the household. The definition of 'Mother Tongue' is the same as in 1991.
Question 11 of the Household Schedule was aimed to collect information on 'other languages known' (up to two languages in order of proficiency).
A brief note along with table based on 1991 & 2001Census data is given in Annexure VIII.
DISTRICT CENSUS HANDBOOK ': BATHINDA
Scheduled Castes and Scheduled Tribes:
Out of the total popUlation of 24,358,999 in the state 7,028,723 belong to scheduled castes as per 2001 Census. As such 28.9 % of the state's population belongs to scheduled castes and 30.0 % of the district popUlation belongs to scheduled castes.
Among the tahsils it is the highest in Talwandi Sabo (30.9%), while Bathinda (29.3 %) is the lowest and Rampura Phul (30.7%) falls in-between Talwandi Sabo ,and Rampura Phul tahsils and both of these have recorded higher percentage than that of the district average.
In consonance with the general trends in the state, scheduled castes are more rural by residence. In the district 32.7 per cent of population in rural area belongs to scheduled castes while the corresponding percentage in urban areas is 23.5 per cent. In Bathinda tahsil scheduled castes comprise one-third (34.0%) of rural population and this percentage is the highest among all the tahsils in the district. On the other hand it is the lowest in Talwandi Sabo (31.0%) outdone by Rampura Phul (32.2%).
Durin& the 1991-2001 scheduled castes population in the state has increased by 22.4 per cent which is marginally higher than that of Bathinda district (22.1 %). In the district 41.5 per cent of the scheduled castes popUlation is literate which is significantly lower than that of the state (56.2%).37.2 per cent of scheduled castes population in rural areas and 55.3 per cent in urban areas of Bathinda district is literate.
There is no scheduled tribe population in the State.
(viii) Brief Analysis Based on Primary Census Abstract
TABLE 1 : DECADALCHANGE IN POPULATION OFTAHSILS BY RESIDENCE, 1991-2001
Serial Tahsil PopUlation Percentage decadal Percentage urban
number 1991 2001 variation 1991-200 I population
Total Rural Urban Total Rural Urban Total Rural Urban 1991 2001
I 2 3 4 5 6 7 ~ 9 to II 12 I3
1 Rampura Phul 241,634 206,104 35,530 283,606 238,941 44,665 17.4 15.9 25.7 14.7 15.7
2 Bathinda 507,651 319,846 187,805 631,475 371,480 259,995 24.4 16.1 38.4 37.0 41.2
3 Talwandi Sabo 236,016 193,561 42,455 268,214 221,120 47,094 13.6 14.2 10.9 18.0 17.6
District Total: 985,301 719,511 265,790 1,183,295 831,541 351,754 20.1 15.6 32.3 27.0 29.7
During 1991-2001, the district recorded a growth cent in Bathinda and 13.6 percent in Talwandi Saba.
rate of 20.1 per cent, which is at par with the state Besides, Talwandi Sabo, the decadal growth rate is lower
average. Among the tahsils, it varies between 24.4 per than that of the district in Rampura Phul (17.4%) also.
28

ANALYTICAL NOTE
Only Bathinda tahsil in the district has witnessed the higher growth rate than that of the state average.
The urban population in the district grew by 32.3 per cent, which is double than that of the rural growth rate (15.6%). The urban growth rate is 38.4 per cent in Bathinda tahsil followed by 25.7 per cent in Rampura Phul. The urban (10.9%) as well rural (14.2%) growth rates are the lowest Talwandi Sabo. The other two tahsils experienced slightly higher rural growth rate than that of the district average.
29.7 per cent of the population in the district is urban as against 27.0 per cent in 1991. Except Talwandi Sabo tahsil, the other two tahsils have noted increase in their urban population as compared to 1991 census. This increase is the maximum in Bathinda where 41.2 per cent of the population is recorded as urban as against 37.0 per cent in 1991 and this increase is marginal in Rampura Phul tahsil where the proportion of urban population has improved froin 14.7 per cent
. in 1991 to 15.7 per cent in 2001.
TABLE 2: NUMBERAN~ PERCENTAGE OF INHABITED VILLAGES IN SPECIFIED POPULATION SIZE RANGES WITH THE RELATED POPULATION, 2001
Serial District/C.D.block Total number Total rural popUlation Number and Population less number of inhabited percentage of than 200
villages Persons Males Females villages Males Females
1 2 3 4 5 6 7 8 9
1 Phul 46 147,312 77,740 69,572 o (0.0) 0 0 2 Rampura 30 91,629 48,827 42,802 o (0.0) 0 0 3 Nathana 32 129,025 72,059 56,966 o (0.0) 0 0 4 Bathinda 54 164,204 86,984 77,220 o (0.0) 0 0 5 Sangat 38 100,681 52,909 47,772 1 (2.6) 103 96 6 Talwandi Sabo 47 ' 129,364 68,664 60,700 o (0.0) 0 0 7 Maur 33 69,326 36,935 32,391 o {O.O} 0 0
Districts {Rural} Total: 280 831,541 444,118 387,423 1 { 0.4} 103 96
Serial District/C.D. block Number and Population Number and Population Number and PopUlation
number percentage 200-499 percentage 500-999 percentage 1000-1999
of villages Males Females of villages Males Females of villages Males Females
2 10 11 12 13 14 15 16 17 18
Phul o (0.0) 0 0 3 (6.5) 1,306 1,212 19 (41.3) 16,098 14,366 2 Rampura o (0.0) 0 0 2 (6.7) 941 844 II (36.7) 8,059 6,910
3 Nathana 1 (3.1) 195 174 1 (3.1) 527 469 8 (25.0) 6,960 6,209
4 Bathinda I (1.9) 22'1 225 4 (7.4) 1,486 1,259 14 (25.9) 11,741 10,421
5 Sangat o (0.0) 0 0 2 (5.3) 1,007 862 13 (34.2) 10,353 9,400
6 Talwandi Sabo o (0.0) 0 0 5 (10.6) 1,749 1,497 17 (36.2) 14,250 12,795
7 Maur 1 (3.0) 257 230 6 (18.2) 2,672 2,343 11 (33.3) 8,943 7,890
Districts {Rural} Total: 3 { I.1} 681 629 23 ( 8.2) 9,688 8,486 93 { 33.2) 76,404 67,991
Serial District/C.n. block Number and Population Number and Population Number and Population
number percentage 2000-4999 percentage 5000-9999 percentage 10000 and above
of villages Males Females of villages Males Females of villages Males Females
2 19 20 21 22 23 24 25 26 27
1 Phul 16 (34.8) 27,369 24,615 6 (13.0)' 19,703 17,540 2 (4.3) 13,264 11,839
2 Rampura 12 (40.0) 20,518 18,305 5 (16.7) 19,309 16,743 o (0.0) 0 0
3 Nathana 15 (46.9) 24,448 21,453 6 (18.8) 22,006 19,555 1 (3.1) 17,923 9,106
4 Bathinda 28 (51.9) 48,908 43,750 7 (13.0) 24,620 21,565 o (0.0) 0 0
5 Sangat 20 (52.6) 34,223 30,818 2 !S.3) 7,223 6,596 o (0.0) 0 0
6 Talwandi Sabo 22 (46.8) 36,939 32,590 Z (4.3) 6,816 5,974 I (2.1) 8,910 7,844
7 Maur 15 (45.5) 25,063 21,928 o (0.0) 0 0 o (0.0) 0 0
Districts (Rural) Total: 128 ( 45.7) 217,468 193,45928 ( 10.0) 99,677 87,973 4 ( 1.4) 40,097 28,789
Out of 284 villages in the district, 4 are un- village on an average has a population of 2,970 in
inhabited and all of them fall in Bathinda tahsil. A the district, the corresponding size of the inhabited
29

village in the State, as a whole is 1311. Evidently, the inhabited villages in Bathinda district are much larger in population size as compared to the State. Among 280 inhabited villages, 1(0.4%) village has a population of less than 200, 3(1.1%) fall in the population size Class of200-499, 116(41.4%) in the category 500-1999, 128(45.7%) in the range of 2000-4999, 28 (10.0%) are having population varying between 5000-9999 and the remaining 4 (1.4%) villages have a population of 10,000 and above. In other words 27 villages are small sized with a population of less than 1000 and they contain 2.4 per cent of the rural population of the district, 221 villages are medium sized having population 1000-4999 and they contain 66.8 per cent of rural population of the district, 32 villages in the district are large sized having population 5000+ and they contain 30.8 per cent of the rural population of the district. Among them 4 are exceptionally large sized and they accommodate 8.3 per cent of the district rural population.
DISTRICT CENSUS HANDBOOK: BATHINDA
TABLE 3 : NEW TOWNS, DE-NOTIFIED,
DECLASSIFIED AND MERGED TOWNS IN 2001
Serial Name of town number
2
New Towns
1 '~
Bhisiana I
Declassified and Merged Towns
Nil
Urban status
of town
3
cr
This table exhibits new towns added, denotified, and merged in the district for the 2001 Census.
There are 9 towns in the district and 8 of them are statutory in status and only 1 is a census town i.e. Bhisiana which is newly added to the district at the 2001 Census. .
Further, in the district, no town of 1991 Census has either been de-notified or merged at the 2001 Census.
TABLE 4: DISTRIBUTION OF VILLAGES BY POPULATION DENSITY, 2001
Range of population density
(per square kilometer)
0-10
11-20
21-50
51-100
101-200
201-300
301-500
501 +
Not known
District Total:
Total number of villages
in each popUlation density range
2
o
o 50
150
73
5
o 280
Population Density (Rural) of the district:
This table shows distribution of villages according
to density of population. The district on an average has a rural density of 260 persons per Sq. km. The villages however display a significant variation among themselves. As many as 2 (0.8%) villages have a low density of 100 or below persons per sq. km. and they contain barely 0.1 per cent of district's rural population. 50 villages which constitute 17.9 per cent
30
Percentage of villages Population Percentage
in each population distribution density range of population
3 4 5
0.0 0 0.0
0.4 199 0.0
0.4 1,076 0.1
0.0 0 0.0
17.9 99,800 12.0
53.6 464,966 55.9
26.1 218,374 26.3
1.8 47,126 5.7
0.0 0 0.0
100.0 831,541 100.0
260
of the total villages and 12.0 per cent of the total population have density of population in the range of 101-200. The average density in the range of 201-300 is the characteristics of 150 (53.6 %) villages and they accommodate 55.9 per cent of the district populat~on.
73 villages fall in the density range of 301-500. This is to say that more than one-fourth

ANALYTICAL NOTE
(26.1 %) of the villages have high density varying Very high density of more than 500 is the between 301 and 500 and accommodate more than characteristics of 5 (1.8 %) villages. These villages one-fourth (26.3%) of the district's rural account for 5.7 per cent of the rural population of population. the district.
TABLE 5: SEX RATIO OF STATE AND DISTRICT, 1901-2001
Census State District Year Total Rural Urban Total Rural Urban
2 3 4 5 6 7
1901 832 836 804 NA NA 712
1911 780 785 740 NA NA 657
1921 799 808 735 NA NA 644
1931 815 832 721 NA NA 693
1941 836 855 750 NA NA 783
1951 844 854 807 839 845 812
1961 854 865 817 834 837 824
1971 865 868 856 851 850 852
1981 879 884 865 861 869 843
1991 882 888 868 884 888 873
2001 876 890 849 870 872 864
Note: Sex Ratio has been defined as number of,females per 1000 males.
Sex Ratio reflects the socio-economic and demographic characteristics of population. It unfolds the status of women in society and the care for the girl child in particular. Unfortunately, in consonance with the overall patterns of the State, the sex ratio in the district has remained low throughout except in 1991. The sex ratio declined from 832 in 1901 to 780 in 1911 in the state. Ever since 1911, the sex ratio showed a gradual improvement, uninterruptedly, till 1991 when it reached 882. During 1991-2001, the sex ratio has declined by 6 points, from 882 to 876.
The population census data are not available for Bathinda district prior to 1951 Census other than urban areas. Bathinda district had a sex ratio of 839 in 1951, which declined to 834 in 1961, and improved to 851 in 1971, 861 in 1981 and 884 in 1991 and further decreased to 870 in 2001 However, likewise the overall state patterns, the sex ratio in the district has declined by 14 points; from 884 in 1991 to 870 in 2001. This decline is more noticeable in urban areas in comparison with the rural. In the state, the urban sex ratio has declined from 868 in 1991 to 849 in 2001 while the corresponding decline in the urban sex ratio of the district is from 873 to 864. The rural sex ratio in the state has increased by 2 points from 888 in 1991 to 890 in 2001, while in the district it has
·31
shown 16 point decrease from 888 to 872 during this decade. Similarly urban sex ratio of the district had been shooting up from 644 in 1921 to 852 in 1971 ,and after that it continued to go down and up during every census and tumbled down from 873 in 1991 to 864 in 2001 to stand at 1 ph position among all the districts in the state.
TABLE 6 : SEX RATIO BY TAHSILS, 2001
Serial Name of Sex ratio number Tahsil Total Rural Urban
2 3 4 5
1 Rampura Phu1 887 888 885
2 Bathinda 857 856 858
3 Talwandi Sabo 883 883 881
District Total: 870 872 864
Among the tahsils, the sex ratio varies between 887 in Rampura Phu\ and 857 in Bathinda, which is the lowest among all the tahsils followed by 883 in Talwandi Sabo tahsil.
The rural sex ratio varies between 888 in Rampura Phul and 856 in Bathinda tahsil, and the urban sex ratio fluctuates between 885 in Rampura Phul and 858 in Bathinda tahsil. The rural sex ratio is better than their urban counterparts in Rampura Phul and Talwandi Sabo tahsil. The rural

and urban sex ratios in these two tahsils are 888 & 885 and 883 & 881 respectively. The position is vice versa in Bathinda tahsil where urban (858)
DISTRICT CENSUS HANDBOOK: BATHINDA
sex ratio exceeds rural (856). District as a whole, rural (872) sex ratio excels urban (864) by 8 points.
TABLE 7 : SEX RATIO BY CD BLOCKS, 2001
Serial number
2
3
4
5
6
7
Name of CD block
2
Phul Rampura Nathana
Bathinda
Sangat
Talwandi Sabo
Maur
District (Rural) Total:
Table 7 exhibits CD blockwise sex ratio in the district. Among the CD.blocks sex ratio varies between 903 in Sangat and 791 in Nathana. In six CD blocks sex ratio is higher than that of the sex ratio of district. Whereas in C.D. Block Nathana
Sex ratio
3
895
877 791
888 903
884
877
872
(791) it is below the district average of 872. A vital contrast is screened while comparing sex ratio of these two CD blocks. Whereas Sangat boasts of crossing 900 mark, Nathana is exhibiting a poor below 800 mark.
TABLE 8 : SEX RATIO OF RURAL POPULATION BY RANGES, 2001
Range of Number of Percentage Population Percentage sex ratio inhabited villages of villages 2001 distribution
for villages in each range of population
2
Less than 700
700-749 1
750-799 0
800-849 31
850-899 134
900-949 99
950-999 14
1000-1099 0
1100+ 0
District Total: 280
Sex ratio (Rural) for District: 872
Sex ratio of rural population by ranges is
portrayed in Table 8. The district as such is marked
with a relatively low sex ratio (872). This is rather low (less than 800) in 2 villages. The villages with low sex ratio comprise 0.8 per cent of the total villages in the district and contain 3.6 per cent of district rural population. 31 villages (11.1 %) are marked with a rural sex ratio of 800-849 and they contain 7.1 per cent ofthe district rural population. Maximum number of 134 villages exhibit a rural sex ratio in the range of 850-899. These make a little less than one-half
3 4 5
0.4 27,029 3.3
0.4 2,657 0.3
0.0 0 0.0
11.1 59,286 7.1
47.9 420,960 50.6
35.4 303,708 36.5
5.0 17,901 2.2
0.0 0 0.0
0.0 0 0.0
100.0 831,541 100.0
32
(47.9%) of the total villages and more than one-half (50.6%) of the rural population.
As many as 99 villages are marked with a high sex ratio of 900-949 and they constitute 35.4 per cent of the total villages and account for 36.5 per cent of the district rural population. Male-female ratio is quite close to parity in the range of 950-999 in 14 (5.0%) villages having 2.2 per cent of the rural population of the district.
Not even a single village in Bathinda district falls in
the sex ratio ranges of 1000-1099 and 1100 and above.

ANALYTICAL NOTE
Serial
number
2
3
4
5
6
7
8
9
TABLE 9 : SEX RATIO OF URBAN AGGLOMERATlONSrrOWNS, 2001
Name of U.A.I Urban status Town+· of town
2 3
Bathinda (M CI)
Bhisiana (CT)
Bhucho Mandi (M CI)
Goniana (M CI)
Kot Fatta (M CI)
Maur (M CI)
Raman (M CI)
Rampura Phul UA·
(i) Rampura Phul (M CI+OG)
(ii) Rampura Phul (M Cl)
Sangat (M CI)
Sex ratio (Urban) for the district:
Sex ratio
4
858
683
888
866
893
877
887
885
885
886
887
864
+ Towns arranged in alphabetical order.
• In case of towns having outgrowth an asterisk mark has been placed against their names to indicate that they have outgrowths which
are not separate towns.
Sex ratio in urban agglomeratibns/towns is exhibited in Table 9. The district on an average has an urban sex ratio of 864, which is higher than that of the urban sex ratio of the state (849).
Among the towns/VAs, the sex ratio varies between 683 in Bhisiana and 893 in Kot Fatta. As
many as in 7 towns the sex ratio is higher than that of the district average and is below the district average in Bhisiana CT. (683) and Bathinda MCI (858). The deplorable part of the sex ratio is that
J3hisiana Census town is exhibiting sex ratio ever below 700 mark.
TABLE 10 : SEX RATIO OF POPULATION IN THE AGE GROUP 0-6 FOR TAHSILS, 2001
Serial Name of Tahsil Total/ Total population in Sex ratio
number Rura1/ 0-6 age group for 0-6
Urban Persons Males Females age group
2 3 4 5 6 7
Rampura Phul Total 36,412 20,283 16,129 795
Rural 30,830 17,150 13,680 798
Urban 5,582 3,133 2,449 782
2 Bathinda Total 77,551 43,568 33,983 780
Rural 47,432 26;377 21,055 798
Urban 30,119 17,191 12,928 752
3 Talwandi Sabo Total 35;395 19,805 15,590 787 Rural 29,209 16,357 12,852 786 Urban 6,186 3,448 2,738 794
District Total: Total 149,358 83,656 65,702 785
Rural 107,471 59,884 47,587 795
Urban 41,887 23,772 18,115 762
33

The sex ratio of child population in age-group 0-6 is shown in Table 10. The State and its districts are marked with a very low child sex ratio and this has become a matter of deep concern. Punjab has a child sex ratio of (798) as compared to India (927) and Bathinda district has even lower child sex ratio of785.
Within the district, the tahsils among themselves display a considerable disparity in their child sex ratio; it is the maximum in Rampura Phul (795) and the minimum in Bathinda (780).
DISTRICT CENSUS HANDBOOK: BATHINDA
Likewise, the disparity in the rural and urban child sex ratio among the tahsils is also quite marked; the rural child sex ratio varies between Rampura Phu] and Bathinda (798 each) and in Talwandi Sabo (786), while the variation in urban child sex ratio is between 794 in Talwandi Sabo and 752 in Bathinda. ,
Tersely educing, Bathinda district ranks 13 th
among other districts in child sex ratio and startling point is that neither district nor any tahsil crosses 800 mark which is some thing serious to ponder over.
TABLE 11 : SEX RATIO OF POPULATION IN THE AGE GROUP 0-6 FOR C.D. BLOCKS, 2001
Serial Name ofC.D. Total population in 0-6 age group Sex ratio
number block Persons
2 3
1 Phul 19,128
2 Rampura 11,702
3 Nathana 16,270
4 Bathinda 20,764
5 Sangat 13,349
6 Talwandi Sabo 17,295
7 Maur 8,963
District (Rural) Total: 107,471
Table 11 shows CD Blockwise sex ratio of popUlation in the age-group 0-6.The gap in the child sex ratio in rural areas (795) and the over all rural sex ratio (872) in the district is alarming; showing a gap of 77 points between the two. This is a cause of concern and looks for possible remedial measures in bridging the gap between
Males Females for 0-6 age group
4 5 6
10,544 8,584 814
6,606 5,096 771
9,060 7,210 796
11,560 9,204 796
7,377 5,972 810
9,661 7,634 790
5,076 3,887 766
59,884 47,587 795
the two, and also in improving the prevailing low levels of sex ratio. More so, three CD blocks viz. Talwandi Saba (790), Rampura (771) and Maur (766) are marked with child sex ratio even lower than the district average. Phul (814) , and Sangat (810) are the only two CD blocks crossing 800 marks.
TABLE 12 : SEX RATIO OF RURAL POPULATION IN
THE AGE GROUP 0-6 BY RANGES, 2001
Range of sex ratio Number of inhabited Percentage distribution PopUlation Percentage distribution
for villages villages of villages 2001 of population
2 3 4 5
Less than 700 41 14.6 12,178 11.3
700-749 48 17.1 13,639 12.7
750-799 66 23.6 32,261 30.0
800-849 51 18.2 26,391 24.6
850-899 32 11.4 11,095 10.3
900-949 20 7.1 6,710 6.2
950-999 10 3.6 2,722 2.5
1000-1099 9 3.2 2,162 2.0
1100+ 3 1.1 313 0.3
District (Rural) Total 280 100.0 107,471 100.0
Sex ratio (Rural) (or District: 795
34

ANALYTICAL NOTE
The district (Rural) is marked with a very 5,low child sex ratio (795).41 (14.6 %) villages are marked with excessively low child sex ratio of less than 700. These villages together constitute (11.3%) of the child population in age group 0-6 of the district. The rural child sex ratio is equally low in the range of 700-749 in 48 (17.1 %) villages constituting 12.7 per cent of rural child population. Another 66 (23.6 %) villages fall in the range of750-799 and they contain (30.0%) of the rural child population of the district. Barely 125 villages (out of 280), which make less than (44.6%) of the villages and contain slightly bette'r percentage (45.9%) of rural child population have crossed 800 mark. Among them, 51 (18.2% of the total rural
villages) fall in the range of 800-849 and possess 24.6 per cent of district rural child population. Another 32 (11.4%) villages having 10.3 per cent of child popUlation are in the range of850-899. The rural child sex ratio is fairly high in the range of 900-949 in 20 (7.1 %) villages containing 6.2 per cent of the rural child population, and another 10 villages (3.6%) having 2.5 per cent of the rural child population display a very high sex ratio of950-999. 12 villages in the district are female biased, out of which, 9 villages fall in the
.range of 1000-1099 and 3 in the range of 1100+. These 12 villages together make 4.3 per cent of the total villages and share 2.3 per cent of the rural child population of the district.
TABLE13 : SEX RATIO OF POPULATION IN THE AGE GROUP 0-6 OF
URBAN AGGLOMERATIONSrrOWNS, 2001
Serial Name of UNTown+* number
2
Bathinda
2 Bhisiana
3 Bhucho Mandi
4 Goniana
5 Kot Fatta
6 Maur
7 Raman
8 Rampura Phul
(i) Rampura Phul * (ii) Rampura Phul
9 Sangat
District (Urban) Total
+ Towns arranged in alphabetical order.
Urban status
of town
3
(M tl) (eT)
(M el)
(M el)
(M el)
(M el)
(M el)
UA
(M el+OG)
(M el)
(M el)
Total population in 0-6 age group Sex ratio for
Persons Males Females 0-6 age group
4 5 6 7
24,496 13,980 10,516 752
731 416 315 757
1,726 979 747 763
1,544 .,.
911 633 695
876 476 400 840
3,640 2,041 1,599 783
2,546 1,407 1,139 810
5,582 3,133 2,449 782
5,582 3,133 2,449 782
5,321 2,999 2,322 774
746 429 317 739
41,887 23,772 18,1l5 762
* In case of towns having outgrowth an asterisk mark has been placed against their names to indicate that they have outgrowths which
are not separate towns.
Sex ratio of child population in age-group 0-6 in urban area of the district (762) is significantly lower than that of the overall urban sex ratio (864) in the
district. Among the towns/UAs, child sex ratio is the
highest in Kot Fatta (840) and the lowest in Goniana (695).4 out of9 towns show urban sex ratio of child population lower than that of the district average. In
35
other five towns it exceeds the district average. Besides. Kot Fatta (840), these include Raman (810), Maur (783), Rampura Phul (782) and Bhucho Mandi (763). The most assertable part of urban child sex ratio in Bathinda district is that it is badly superated by all districts except Gurdaspur (762) to whom it equals. Ludhiana excepts with 8 19 child. Sex ratio in urban areas exceeding Bathinda (762) by 57 points.

DISTRICT CENSUS HANDBOOK: BATHINDA
TABLE 14: NUMBER AND PERCENTAGE OF SCHEDULED CASTES AND SCHEDULED TRIBES POPULATION IN TAHSILS, 2001
Serial Name of Tahsil Total/ Total Total Total Percentage of Percentage of number Rural! population Scheduled Scheduled Scheduled Castes Scheduled Tribes
Urban Castes Tribes population to population to population poplilation total population total population
2 3 4 5 6 7 8
Rampura Phul Total 283,606 87,066 30.7
Rural 238,941 77,046 32.2
Urban 44,665 10,020 22.4
2 Bathinda Total 631,475 184,729 29.3
Rural 371,480 126,337 34.0
Urban 259,995 58,392 22.5
3 Talwandi Sabo Total 268,214 82,857 30.9
Rural 221,120 68,508 31.0
Urban 47,094 14,349 30.5
District Total: Total 1,183,295 354,652 30.0 Rural 831541 271891 32.7
Urban 351754 82761 23.5
30.0 per cent of the population in the qistrict belongs to scheduled castes as compared to 28.9 per cent in the state as such. Among the tahsils it is the highest in Talwandi Sabo (30.9 %) and the lowest in Bathinda (29.3 %). Rampura Phul has 30.7 per cent scheduled castes. Rural scheduled castes population percentage is higher than the district average.
In consonance with the general trends in the state, scheduled castes are more rural by residence. In the district 32.7 per cent of rural population belongs to scheduled castes while the corresponding percentage in urban areas is 23.5 per cent. In Bathinda tahsil scheduled castes comprise one-third (34.0%) of rural population and it is the highest among all the tahsils in the district. On the other hand it is the lowest in Talwandi SabQ (3l.0%) followed by Rampura Phul (32.2%). There is no scheduled tribe population in the State.
75.7 per cent Scheduled castes are rural by residence in the state in comparison with the district percentage of 76.7 per cent.
TABLE 15 : NUMBER AND PERCENTAGE OF SCHEDULED CASTES AND SCHEDULED TRIBES POPULATION IN CD. BLOCKS, 2001
Serial Name"of C.D. block Total Total Total Percentage of number population Scheduled Scheduled Scheduled Castes
Castes Tribes population to total population population population
2 3 4 5 6
Phul 147,312 48,186 32.7
2 Rampura 91,629 28,860 31.5
3 Nathana 129,025 37,821 29.3
4 Bathinda 164,204 60,798 ',.. 37.0
5 Sangat 100,681 34,332 34.1
6 Talwandi Sabo 129,364 40,727 31.5
7 Maur 69,326 21,167 30.5
District (Rural) Total: 831,541 271,891 32.7
36
Percentage of Scheduled Tribes
population to total population
7

ANALYTICAL NOTE
Table 15 gives CD blockwise distribution of scheduled castes population in the district. CD blocks among themselves exhibit disparity in the proportion of scheduled castes population; it is the maximum in Bathinda (37.0%) closely followed by Sangat (34.1 %)
while Phul (32.7%) is at par with the district rural average. The remaining four CD blocks fall below the district rural average and among them the percentage varies between 29.3 per cent in Nathana and 31.5 per
cent each in Rampura and Talwandi Sabo.
TABLE 16 : PROPORTION OF SCHEDULED CASTES POPULATION TO TOTAL POPULATION IN VILLAGES,.2001
Percentage range of Number of Scheduled Castes villages
population to total population
1 2
Nil 0
Less than 5 2
5-10 3
11-20 23
21-30 82
31-40 115
41-50 43
51-75 11 ~
76 and above
District Total 280
All villages in the district have scheduled castes population. In 2 villages the proportion of scheduled castes comprises 0.4 per cent of the total population. Another 3 villages have scheduled castes population in the range of 5-10 per cent and they contain 0.1 per cent of the scheduled castes population in the district.All these 5 villages make 1.8 per cent of the total villages having a small population size of 0.5 per cent. Less than one-tenth 8.2 per cent of the village fall in the range of 11-20 per cent and they account for 2.3 per cent of the scheduled castes population of the district. 29.3 per cent of the villages have scheduled castes population in the range of21-30 per cent. In absolute terms they number 82 and contain 25.3 per cent of the district's scheduled castes population residing in rural areas.
Percentage
3
0.0
0.7
1.1
8.2
29.3
41.1
15.4
3.9
0.4
100.0 ';-
Scheduled Castes
Population
4
o 1,067
266
6,219
68,864
132,499
47,742
14,254
980
271,891
Percentage
5
0.0
0.4
0.1
2.3
25.3
48.7
17.6
5.2
0.4
100.0
115 (41.1 %) villages having 48.7 per cent of the district's rural scheduled castes population, which is the highest among' all the categories, exhibit high scheduled castes population in the range of 31-40 per cent. Another 43 villages that comprise 15.4 per cent of the total villages and 17.6 per cent of rural scheduled castes population of the district fall in the range of 41-50 per. cent.
As many as 12 villages which constitute 4.3 per cent of the total villages and 5.6 per cent of rural scheduled castes population have more than one-half of their population belonging to scheduled castes. Further, within this group, 11 villages fall in the range of 51-75 per cent while in 1 village the proport,ion of scheduled castes population exceeds 75 per cent.
TABLE 17 : PROPORTION OF SCHEDULED TRIBES POPULATION TO TOTAL POPULATION IN VILLAGES, 2001
Percentage range of Scheduled Tribes Number of villages population to total population
1 2
Percentage
3
Scheduled Tribes Population
4
There are no Scheduled Tribes in Punjab State.
37
Percentage
5

DISTRICT CENSUS HANDBOOK: BATHINDA
TABLE 18: NUMBER AND PERCENTAGE OF SCHEDULED CASTES AND SCHEDULED TRIBES POPULATION IN URBAN AGGWMERATIONSrrOWNS, 2001
Serial Name ofUAI Total Total Scheduled Total Scheduled Percentage of Scheduled Percentage of Scheduled number Town+* population Castes Tribes Castes population to Tribes population to
population population total population total population
2 3 4 5 6 7
Bathinda (M CI) 217,256· 46,295 21.3
2 Bhisiana (CT) 4,775 683 14.3
3 Bhucho Mandi (M CI) 13,246 4,163 31.4
4 Goniana (M CI) 12,813 2,886 22.5
5 Kot Fatta (M CI) 6,504 2,691 41.4
6 Maur (M CI) 27,543 8,411 30.5
7 Raman (M Cl) 19,551 5,938 30.4 8 Rampura Phul (UA) 44,665 10,020 22.4
(i) Rampnra Phul * (M CI+OG) 44,665 10,020 22.4
(ii) Rampura Phul (M CI) 42,823 9,482 22.1
9 Sangat (M Cl) 5,401 1,674 31.0
District(Urban) Total 351,754 82,761 23.5
+ Towns arranged in alphabetical order.
* In case of towns having outgrowth an asterisk mark has been placed against their names to indicate that they have outgrowths which are not separate towns.
In urban areas scheduled castes comprise more than one-fifth (23.5%) of the population of the district. The towns among themselves show wide disparity in this regard. In Kot Fatta 41.4 per cent of the population belongs to scheduled castes while in Bhisiana this percentage is barely 14.3 per cent. Bhucho Mandi (31.4%), Sangat (31.0%), Raman
00.4%) and Maur (30.5%) are the other towns having more than one-fourth of their population belonging to scheduled castes. On the other hand Rampura Phul (22.4%), Goniana (22.5 %%) and Bathind~ (21.3%) are the three towns having population of scheduled castes lower than that of the district average.
TABLE 19: SEX RATIO AMONG SCHEDULED CASTES AND
SCHEDULED TRIBES IN C. D. BLOCKS, 2001
Serial
number
Name of
C.D. block
Scheduled Castes
sex ratio
Scheduled Tribes
sex ratio
1
2
3
4
5
6
7
2
Phul
Rampura
Nathana
Bathinda
Sangat
Talwandi Saba
Maur
District (Rural) Total
Table 19 exhibits Sex ratio in Scheduled Castes population among CD blocks in the district. The rural Sex ratio among CD block is better than the over all sex ratio of 870 in the district as a whole. Among CD
38
3
901
875
893
889
902
886
889
891
4
blocks it varies between 902 in Sangat and 875 in Rampura. Sangat (902), Phul (901) and Nathana (893) CD blocks exhibit higher sex ratio than that of district
average (891). There is no scheduled tribe population.

ANALYTICAL NOTE
TABLE 20: SEX RATIO AMONG SCHEDULED CASTES AND SCHEDULED TRIBES IN URBAN AGGWMERATIONSrrOWNS, 2001
Serial number Name of U .A.lTown+* Scheduled Castes sex ratio Scheduled Tribes sex ratio
2
3 4
5
6
7
8
9
2
Bathinda (M CI)
Bhisiana (CT)
Bhucho Mandi (M CI)
Goniana (M CI)
Kot Fatta (M CI)
Maur (M CI)
Raman (M CI)
Rampura Phul (UA)
(i) Rampura Phul * (M CI+OG)
(ii) Rampura Phui (M CI)
Sangat (M CI)
Sex ratio (Urban) for the district:
+ Towns arranged in alphabetical order.
3
892 887
'889 891 860
883
894 887
887
885 926
890
4
• In case of towns having outgrowth an asterisk mark has been placed against their names to indicate that they have outgrowths which are not separate towns.
Scheduled Castes population in urban areas of the district has a sex ratio of 890, which is better than that of the overall urban sex ratio~ (864) of the district. As compared to other districts of the State, Bathinda ranks 11 th among all the districts in urban
sex ratio of scheduled castes. The situation is more
encouraging in the towns of Sangat (926), Raman (894), Bathinda (892) and Goniana (891). In all, four towns show an urban sex ratio above the district urban while five towns below the district average where it varies between 860 in Kot Fatta and 889 in Bhucho Mandi.
TABLE 21 : NUMBER AND PERCENTAGE OF LITERATES AND ILLITERATES BY TAHSILS, 2001
Serial Name of Total! Number of literates and illiterates Gap in
number Tahsil Rurall Number of literates Number of illiterates Percentage of literates male-female Urban Persons Males Females Persons Males Females Persons Males Females Ii teracy rate
2 3 4 5 6 7 8 9 10 11 12 13
Rampura Phul Total 143,949 82,819 61,130 139,657 67,440 72,217 58.2 63.7 52.2 ' 11.5
Rural 115,273 66,525 48,748 123,668 60,042 63,626 55.4 60.8 49.4 11.4
Urban 28,676 16,294 12,382 15,989 7,398 8,591 73.4 79.2 66.8 12.4
2 Bathinda Total 364,245 215,042 149,203 267,230 125,041 142,189 65.8 72.5 58.0 14.5
Rural 186,796 113,386 73,410 184,684 86,734 97,950 57.6 65.3 48.8 16.5
Urban 177,449 101,656 75,793 82,546 38,307 44,239 77.2 82.8 70.8 12.0
3 Talwandi Sabo Total 124,376 74,367 50,009 143,838 68,100 75,738 53.4 60.6 45.4 15.2
Rural 96,995 58,368 38,627 124,125 59,063 65,062 50.5 57.7 42.5 15.2
Urban 27,381 15,999 11,382 19,713 9,037 10,676 66.9 74.1 58.9 15.2
District Total: Total 632,570 372,228 260,342 550,725 260,581 290,144 61.2 67.8 53.7 14.1
Rural 399,064 238,279 160,785 432,477 205,839 226,638 55.1 62.0 47.3 14.7
Urban 233,506 133,949 99,557 118,248 ~4,742 63,506 75.4 81.2 68.7 12.5
61.2 per cent of the district's population is literate
compared with 69.7 per cent for the state as such. In other words, three out of every five persons in the district are literate and this ratio is somewhat lower
than that of the state.
one-half of its population as literate is placed at the bottom. However, none of the tarsils in the district has literacy rate higher than the overall literacy rate in the state.
Bathinda (65.8%) is the most literate among the tahsils. By contrast, Talwandi Sabo (53.4%) with only
39
,
Between the two sexes, the literacy rate in the district varies between 67.8 per cent among males and 53.7 per cent among females, and, thus, exhibiting a gap of 14.1 percentage points. Among the tahsils,

this gap is the widest (15.2 percentage points) in Talwandi Sabo tahsil (male 60.6 per cent and female 45.4 per cent) and the narrowest (11.5 percentage points) in. Rampura Phul (male 63.7 per cent and female 52.2 per cent).
Likewise, the rural-urban literacy rates also exhibit significant disparity. 55.1 per cent of the population in
DISTRICT CENSUS HANDBOOK: BATHINDA
rural areas and 75.4 per cent of the population in urban areas of the district are literate. The urban literacy is higher than that of the rural in all the tahsils; and the gap in the rural urban literacy rate is the widest (19.6 percentage poirits) in Bathinda (urban 77.2% and rural 57.6%) and the closest (16.4 percentage points) in Talwandi Sabo (urban 66.9% and rural 50.5%).
TABLE 22 : NUMBER AND PERCENTAGE OF LITERATES AND ILLITERATES BY SEX IN C.D. BLOCKS, 2001
Serial Name of Number of literates and illiterat~s Percentage of Gap in number C.D.block Number of literates Number of illiterates literates male-female
Persons Males Females Persons Males Females Persons Males Females Ii teracy rate
2 3 4 5 6 7 8 9 10 II 12
Phul 72,419 41,245 31,174 74,893 36,495 38,398 56.5 61.4 51.1 10.3
2 Rampura 42,854 25,280 17,574 48,775 23,547 25,228 53.6 59.9 46.6 13.3
3 Nathana 72,668 45,257 27,411 56,357 26,802 29,555 64.4 71.8 55.1 16.7
4 Bathinda 77,940 46,535 31,405 86,264 40,449 45,815 54.3 61.7 46.2 15.5
5 Sangat 46,314 27,700 18,614 54,367 25,209 29,158 53.0 60.8 44.5 16.3
6 Talwandi Sabo 56,264 33,877 22,387 73,100 34,787 38,313 50.2 57.4 42.2 15.2
7 Maur 30,605 18,385 12,220 38,721 18,550 20,171 50.7 57.7 42.9 14.8
District (Rural) Total: 399,064 238,279 160,785 432,477 205,839 226,638 55.1 62 47.3 14.7
Rural areas of the district are marked with a relatively low literacy rate as can be seen from table 22. A little over one-half (55. 1%) of the ruralities in the district are literate compared with 75.4 per cent in urban areas.
the other CD block displaying literacy levels better than the district. ·r
Lit~racy rate in all other CD blocks in the district is more than one half of their population but lower than that of the district average i.e. (55.1). Amazingly,
Among the CD blocks, rural literacy varies none of the CD blocks exceeds the rural literacy rate between 64.4 per cent in Nathana and. 50.2 per cent (64.7%) of the state. Only Nathana has a decorous in Talwandi Sabo. Besides Nathana, Phul (56.5%) is percentage of 64.4.
TABLE 23: DISTRIBUTION OF VILLAGES BY LITERACY RATE RANGE, 2001
Range of literacy rate Number of inhabited Percentage distribution Populatio~ Percentage distribution for villages villages of villages of population
I 2 3 4 5
0 0 0.0 0 0.0
1-10 0 0.0 0 0.0
11-20 0 0.0 0 0.0
21-30 0.4 1,758 0.2
31-40 4 1.4 5,212 0.6
41-50 69 24.6 202,956 24.4
51..(j() 174 62.1 526,552 63.3
61-70 30 10.7 66,639 8.0
71-80 0.4 1,395 0.2
81-90 0 0.0 0 0.0
91-99 1 0.4 27,029 3.3
100 0 0.0 0 0.0
District Total: 280 100.0 831,541 100.0
Literacy rate for District: (Rural) 55.1
40

ANALYTICAL NOTE
Table 23 shows distribution of villages by ranges of literacy rate. Very low literacy rate between 21-30 per cent is reported in 1 village having a very small population (0.2%). 4 villages (1.4%), which contain 0.6 per cent of the district's rural population, have literacy rate in the range of 31-40 per cent. One forth (24.6%) of the total villages, which number 69 and contain 24.4 per cent of rural population are in the literacy range of 41-50.
The maximum number of villages (174), which comprise two-third (62.1 %) of the tQtal villages and 63.3 per cent of the rural popUlation of the district,
are placed in the literacy range of 5 I -60 per cent. Further more, 30(10.7%) villages containing 8.0 per cent of the district rural population fall in the range 61-70 per cent. High literacy varying between 51 and 7() per cent is the main characteristic of more than two-third (72.8%) of the villages and these villages account fox 71.3 per cent of the rural population of the district.
Only 2 villages show a very high literacy rate of 71 to 99 per cent. These villages make 0.8 per cent of the total villages and 3.5 per cent of the rural population.
TABLE 24: NUMBERAND PERCENTAGE OF LITERATES AND ILLITERATES BY SEX
IN URBAN AGGLOMERATIONSrrOWNS, 2001
Serial Name and urban Number of literates and illiterates Percentage of Gap in
number status of Number of literates Number of illiterates literates male-female
UAffown +* Persons Males Females Persons Males Females Persons Males Females literacy rate
2 3 4 5 6 7 8 9 10 II 12
Bathinda (M CI) 150,479 85,979 64,500 66,777 30,967 35,810 78.1 83.5 71.8 11.7 , 2 Bhisiana (CT) 3,541 2,214 1,327 1,234 623 611 87.6 91.4 81.8 9.6
3 Bhucho Mandi (M CI) 8,369 4,838 3,531 4,877 2,179 2,698 72.6 80.1 64.4 15.7
4 Goniana (M Cl) 9,053 5,139 3,914 3,760 1,727 2,033 80.3 86.3 73.7 12.6
5 Kot Fatta (M CI) 3,305 1,945 1,360 3,199 1,490 1,709 58.7 65.7 51.0 14.7
6 Maur (M CI) 15,810 9,276 6,534 11,733 5,399 6,334 66.1 73.4 58.0 15.4
7 Raman (M CI) 11,571 6,723 4,848 7,980 3,638 4,342 68.0 75.1 60.2 14.9
8 Rampura Phul (VA) 28,676 16,294 12,382 15,989 7,398 8,591 73.4 79.3 66.8 12.5
(i) Rampura Phul·
(MCI+OG) 28,676 16,294 12,382 15,989 7,398 8,591 73.4 79.3 66.8 12.5
(ii)Rampura Phul (M CI) 27,823 15,765 12,058 15,000 6,941 8,059 74.2 80.0 67.8 12.2
9 Sangat (M CI) 2,702 1,541 1,161 2,699 1,321 1,378 58.0 63.3 52.3 11.0
District(Vrban) Total 233,506 133,949 99,557 118,248 54,742 63,506 75.4 81.2 68.7 12.5
+ Towns arranged in alphabetical order.
• In case of towns having outgrowth an asterisk mark has been placed against their names to indicate that they have outgrowths which
are not separate towns.
Table 24 reveals that 75.4 per cent of the urban popUlation in the district is literate. Among the towns it varies between 87.6 per cent in Bhisiana and 58.0 per cent in Sangat. In all, three towns are having literacy rate higher than that of the urban literacy of the district. Besides Bhisiana, they include Goniana (80.3%) and Bathinda (78.1 %) As many as 6 towns
f
fall below the district average. Among these the literacy rate, in addition to Sangat, is significantly low in Kot Fatta (58.7%).
Between the two sexes, 81.2 per cent among
41
males and 68.7 per cent among females are literates. Likewise the total literacy rate, male literacy (91.4%) is also the highest in Bhisiana and the lowest in Sa,ngat (63.3%). On the other hand the female literacy is again the highest in Bhisiana (81.8%) and the lowest in Kot Fatta (51.0%).
Male-Female lite~acy rates in urban show a sizeable gap of 12.5 percentage points. This gap is the widest (15.7 percentage points) in Bhucho Mandi. On the other hand it is relatively narrow in Bhisiana (9.6%).

DISTRICT CENSUS HANDBOOK: BATHINDA
TABLE 25: NUMBER AND PERCENTAGE OF SCHEDULED CASTES LlTERATESAND
ILLITERATES BY SEX IN CD. BLOCKS, 2001
Serial Name ofC.D. Number of literates and illiterates Percentage of Gap in
number block Number of literates Number of illiterates literates male/female
Persons Males Females Persons Males Females Persons Males Females literacy rate
2 3 4 5 6 7 8 9 10 11 12
Phul 15,628 9,379 6,249 32,558 15,975 16,583 38.7 44.1 32.7 11.4
2 Rampura 8,932 5)524 3,408 19,928 9,872 10,056 37 43 30.1 12.9
3 Nathana 13,143 7,951 5,192 24,678 12,029 12,649 41 47 34.3 12.7
4 Bathinda 19,654 12,203 7,451 41,144 19,978 21,166 38.2 44.9 30.7 14.2
5 Sangat 10,167 6,321 3,846 24,165 11,728 12,437 35.5 42 28.2 13.8
6 Talwandi Sabo 11,115 6,893 4,222 29,612 14,700 14,912 32.7 38.3 26.3 12.0
7 Maur 6,271 3,838 2,433 14,896 7,365 7,531 35.3 40.8 29.1 11.7
District(Rural)Total: 84,910 52,109 32,801 186,981 91,647 95,334 37.2 43.2 30.4 12.8
Scheduled Castes population in the district rural has a literacy rate of 37.2 per cent compared with an overall rural literacy rate of 55.1 per cent in the district. Nathana (41.0%), Phul (38.7%) and Bathida (38.2%) are the only three CD blocks
~
where nearly two-fifth of the scheduled castes population is literate. In the remaining CD blocks it is below the district average and ranges between 37.0 per cent in Rampura and 32.7 per cent in Talwandi Sabo.
Less than one-half(43.2%) of the male scheduled castes and one-third (30.4%) of the female scheduled castes in the district are literates. In other words,
every fifth male and every third female scheduled castes in the rural areas in the district are literates. Among the CD blocks male literacy rate varies between 47.0 per cent in Nathana and 38.3 per cent in Talwandi Sabo.
Likewise male the scheduled castes female literacy shows wide variation among the CD blocks, it is the Jfighest (34.3%) in Nathana and the lowest (26.3%) in Talwandi Sabo CD blocks.
The male-female scheduled castes literacy rate shows a gap of 12.8 percentage points in the rural areas of the district. The gap is to the extent of 14.2 percentage points in Bathinda CD block.
TABLE 26: DISTRIBUTION OF VILLAGES BY LITERACY RATE RANGE FOR SCHEDULED CASTES POPULATION, 2001
Range of literacy rate Number of inhabited Percentage distribution of Scheduled Castes Percentage distribution
for villages villages villages Population of population
I 2 3 4 5
0 0 0.0 0 0.0
1-10 1 0.4 371 0.1
11-20 8 2.9 2,915 1.l
21-30 41 14.6 39,163 14.4
31-40 129 46.1 142,478 52.4
41-50 81 28.9 74,555 27.4
51-60 17 6.1 10,399 3.8
61-70 2 0.7 988 0.4
71-80 I 0.4 1,022 0.4
81-90 0 0.0 0 0.0
9\-99 0 0.0 0 0.0
100 0 0.0 ° 0.0
District Total: 280 100.0 271,891 100.0
Literacy rate for District (Rural): 37.2
42

ANALYTICAL NOTE
The table shows distribution of villages by ranges of literacy rate. 9 villages, which make 3.3 per cent of the total villages and accommodate 1.2 per cent of district's rural scheduled castes population fall in the range of 1-20, Another 41 villages which constitute 14.6 per cent of the total villages and 14.4 per cent of the district rural scheduled castes population have literacy rate in the range of21-30. All these villages have low literacy rate.
The maximum number of villages (129), which make 46.1 per cent of the total villages and 52.4 per cent of the rural scheduled castes population, fall in the range of 31-40 per cent; another 81(28.9%)
villages containing 27.4 per cent of the district rural scheduled castes population fall in the range of 41-50 per cent. 17 villages making 6. I per cent oftQtal villages and having 3.8 per cent of population exhibit a high literacy of 51-60 per cent. It is quite high between 61-70 per cent in 2 (0.7%) villages containing 0.4 per cent of the rural scheduled castes population of the district.
Very high literacy rate (in the range of 71-80) is noticed in 1 village. However, the share of its population in district rural scheduled castes population is quite negligible (0.4%) as in the previous range.
TABLE 27: NUMBERAND PERCENTAGE OF SCHEDULED CASTES LITERATES AND ILLITERATES BY SEX IN TOWNS, 2001
Serial Name and urban Number of literates and illiterates Percentage of Gap in
number status of Number of literates Number of illiterates literates male/female Town+* Persons Males Females Persons Males Females Persons Males Females literacy rate
2 3 4 5 6 7 8 9 10 11 12
Bathinda (M CI) 24,315 14,419 ' 9,896 21,980 10,044 11,936 61.1 69.1 52.2 16.9
2 Bhisiana (CT) 306 178 128 377 184 193 52.9 59.7 45.7 14.0
3 Bhucho Mandi (M CI) 1,841 1,132 709 2,322 1,072 1,250 52.2 60.9 42.5 18.4
4 Ooniana (M CI) 1,497 906 591 1,389 620 769 60.8 70.4 50.3 20.1
5 Kot Fatta (M CI) 1,046 651 395 1,645 796 849 45.7 52.9 37.3 15.6
6 Maur (M CI) 3,179 1,980 1,199 5,232 2,487 2,745 45.1 52.9 36.2 16.7
7 Raman (M CI) 2,232 1,414 818 3,706 1,721 1,985 44.9 53.8 35.0 18.8
8 Rampura Phul* VA
(M CI + 00) 4,142 2,501 1,641 5,878 2,809 3,069 49.0 56.3 41.0 15.3
9 Sangat (M CI) 459 258 201 1,215 611 604 33.2 36.2 30.1 6.1
Bathinda (Urban) 39,017 23,439 15,578 43,744 20,344 23,400 55.3 63.2 46.6 16.7
+ Towns arranged in alphabetical order.
• In case of towns having outgrowth an asterisk mark has been placed against their names to indicate that they have outgrowths which are
not separate towns.
In urban area of the district more than one-half (55.3%) of the scheduled castes population has the ability to read and write. Among the towns it is highest in Bathinda (61.1 %), the district headquarters town and Goniana (60.8%) is the second best in the district. Bhisiana (52.9%) and Bhucho Mandi (52.2%) are the other two towns where more than one half of the scheduled castes population is literate.By contrast, urban scheduled castes literacy rate is the lowest in Sangat (33.2%), 63.2 per cent of scheduled castes males and 46.6 per cent of females in urban areas are literate reflecting a gap
43
of 16.6 percentage points. Male-female disparity in this regard is quite conspicuous. Among the towns urban male literacy rate of scheduled castes popula~ion varies between 70.4 per cent in Goniana and 36.2 per cent in Sangat, while the corresponding pt;rcentage for females is 52.2 per cent in Bathinda and 30.1 per cent in S~ngat.
Furthermore, male-female differential in scheduled castes literacy rate is the maximum in Goniana (20.1 %) and the minimum in Sangat (6.1 %) and this difference is up to 14 or more percentage points in 8 out of 9 towns which is deplorable.

Serial
number
DISTRICT CENSUS HANDBOOK: BATHINDA
TABLE 28: NUMBER AND PERCENTAGE OF SCHEDULED TRIBES LITERATES AND ILLITERATES BY SEX IN C. D. BLOCKS, 2001
Number of literates and illiterates Percentage of Gap in Name of
C. D. block Number of literates Number of illiterates literates male/female
2
Persons Males Females Persons Males Females Persons Males Females literacy rate
3 4 5 6 7 .,.. 8 9 10 II 12
There are no Scheculed Tribes in Punjab State
TABLE 29: DISTRIBUTION OF VILLAGES BY LITERACY RATE RANGE FOR SCHEDULED TRIBES POPULATION, 2001
Range of literacy rate
for villages
Number of inhabited villages
Percentage distribution of villages
Scheduled Tribes Population
Percentage distribution of population
2 3 4
There are no Scheduled Tribes in Punjab State
TABLE 30: NUMBER AND PERCENTAGE OF SCHEDULED TRIBES LITERATES AND ILLITERATES BY SEX IN TOWNS, 2001
Serial Name and urban
number status of Town
Number of literates and illiterates
Number of literates Number of illiterates
Percentage of
literates
5
Gap in
male/female
Persons Males Females Persons Males Females Persons Males Females literacy rate
2 3 4 5 6 7 8, 9 10 II 12
There are no Scheduled Tribes in Punjab State
44

ANALYTICAL NOTE
TABLE 31: NUMBER AND PERCENTAGE OF MAIN WORKERS, MARGINAL WORKERS, AND NON-WORKERS BY SEX IN TAHSILS, 2001
Serial Name of Persons/ Total Main workers Marginal workers Total workers Non workers number Tahsil Males! population (Main and
Females marginal workers) Number Percentage Number Percentage Number Percentage Number Percentage
2 3 4 5 6 7 8 9 10 II 12
Rampura Persons 283,606 98,340 34.7 27,304 9.6 125,644 44.3 157,962 55.7 Phul Males 150,259 76,283 50.7 7,174 4.8 83,457 55.5 66,802 44.5
Females 133,347 22,057 16.5 ~0,130 15.1 42,187 31.6 91,160 68.4
2 Bathinda Persons 631,475 214,124 33.9 34,799 5.5 248,923 39.4 382,552 60.6 Males .340,083 173,982 51.2 11,808 3.5 185,790 54.6 154,293 45.4 Females 291,392 40,142 13.8 22,991 7.9 63,133 21.7 228,259 78.3
3 Talwandi Persons 268,214 96,460 36 29,640 11.0 126,100 47.0 142,114 53.0 Sabo Males 142,467 74,271 52.1 5,710 4.0 79,981 56.1 62,486 43.9
Females 125,747 22,189 17.7 23,930 19.0 46,119 36.7 79,628 63.3
District Persons 1,183,295 408,924 34.6 91,743 7.8 500,667 42.3 682,628 57.7 Total: Males 632,809 324,536 51.3 24,692 3.9 349,228 55.2 283,581 44.8
Females 550,486 84,388 15.3 67,051 12.2 151,439 27.5 399,047 72.5
The work participation rate in Bathinda district tahsil (11.1%) and the lowest in Bathinda (5.5%). (42.3%) is better than that of the state average Further, marginal workers are more among females (37.5%). Among the tahsils in the district, it varies in comparison with males. The proportion of female between 47.0 per cent in Talwandi Sabo and 39.4 per marginal workers in the district (12.2%) is thrice cent in Bathinda. In the district 55.2 per cent among than that of males (3.9%). By and large, a similar males and 27.5 per cent among females are reported pattern is observed among all the tahsils in the as workers showing a significant reduction in the gap district. In Talwandi Sabo, 19.0 per cent of females between the two as compared to 1991 census. In are marginal workers as against 4.0 per cent among Talwandi Sabo, one-third of the females (36.7%) are male counterpart. Rampura Phul (15.1%) and recorded as workers. Bathinda (7.9%) have also reported higher proportion
Out of the total population, 34.6 per cent are main of female marginal workers than that of male workers and 7.8 per cent are marginal workers. The marginal workers. Amazingly Bathinda district with proportion of main workers is the highest in Talwandi 12.2 per cent female marginal workers stands next Sabo tahsil (36.0%) and the lowest in Bathinda tahsil only to Mansa di~trict (12.4%) in the state in Census (33.9%). However, the proportion of marginal 2001 whereas it ranked atop with 7.2 per cent in workers is significantly highest in Talwandi Sabo Census 1991.
TABLE 32: NUMBER AND PERCENTAGE OF MAIN WORKERS, MARGINAL WORKERS, AND NON-WORKERS BY SEX IN C.D. BLOCKS, 2001
Serial Name of Persons! Total Main workers Marginal workers Total workers Non workers
number C.D. block Males/ Population (Main and
Females marginal workers)
Number Percentage Number Percentage Number Percentage Number Percentage
2 3 4 5 6 7 8 9 10 II 12
I Phul Persons 147,312 51,208 34.8 15,254 10.3 66,462 45.1 80,850 54.9
Males 77,740 39,559 50.9 3,789 4.9 43,348 55.8 34,392 44.2
Females 69,572 11,649 16.7 11,465 16.5 23,114 33.2 46,458 66.8
2 Rampura Persons 91,629 34,049 37.2 9,933 10.8 43,982 48.0 47,647 52.0
Males 48,827 25,455 52.1 2,344 4.8 27,799 56.9 21,028 43.1
Females 42,802 8,594 20.1 7,589 17.7 16,183 37.8 26,619 62.2
45

DISTRICT CENSUS HANDBOOK: BATHINDA
TABLE 32: NUMBER AND PERCENTAGE OF MAIN WORKERS, MARGINAL WORKERS, AND NON-WORKERS BY SEX IN C.D. BLOCKS, 2001 concld. ..
Serial Name of Personsl Total Main workers Marginal workers Total workers Non workers
number C.D. block Malesl Population (Main and
Females marginal workers)
Number Percentage Number Percentage Number Percentage N urn ber Percentage
2 3 4 5 6 7 8 9 10 11 12
3 Nathana Persons 129,025 48,340 37.5 8,293 6.4 56,633 43.9 72,392 56.1
Males 72,059 39,647 55.0 3,017 4.2 42,664 59,2 29,395 40.8
Females 56,966 8,693 15.2 5,276 9.3 13,969 24.5 42,997 75.5
4 Bathinda Persons 164,204 57,276 34.9 14,192 8.6 71,468 43.5 92,736 56.5
Males 86,984 45,424 52.2 3,798 4.4 49,222 56.6 37,762 43.4
Females 77,220 11,852 15.3 10,394 13.5 22,246 28.8 54,974 71.2
5 Sangat Persons 100,681 39,474 39.2 9,954 9.9 49,428 49.1 51,253 50.9
Males 52,909 27,620 52.2 2,543 4.8 30,163 57.0 22,746 43.0
Females 47,772 11,854 24.8 7,411 15.5 19,265 40.3 28,507 59.7
6 Talwandi Sabo Persons 129,364 46,651 36.1 16,175 12.5 62,826 48.6 66,538 51.4
Males 68,664 35,685 52.0 3,331 4.8 39,016 56.8 29,648 43.2
Females 60,700 10,966 18.1 12,844 21.1 23,810 39.2 36,890 60.8
7 Maur Persons 69,326 25,535 36.9 10,206 14.7 35,741 51.6 33,585 48.4
Males 36,935 19,297 52.2 1,537 4.2 20,834 56.4 16,101 43.6
Females 32,391 6,238 , 19.2 8,669 26.8 14,907 46.0 17,484 54.0
District Persons 831,541 302,533 36.4 84,007 10.1 386,540 46.5 445,001 53.5
(Rural) Total: Males 444,118 232,687 52.4 20,359 4.6 253,046 57.0 191,072 43.0
Females 387,423 69,846 18.0 63,648 16.5 133,494 34.5 253,929 65.5
46.5 per cent of the rural population in the district picture of female work participation. The female work is economically active comprising 36.4 per cent as main participation rate (19. 1%) recorded at the 200 I Census workers and 10.1 per cent as marginal workers. is more than four times than that of (4.4%) in 1991 Among the CD blocks the work participation rate varies Census. between 51.6 per cent in Maur and 43.5 per cent in
In the district rural females are reported as 18.0 Bathinda. Besides Maur, in other CD blocks less than one half of their population is recorded as workers.
per cent main workers and 16.5 per cent marginal workers. This percentage is quite high in itself and
The percentage of main workers is the highest in stands comparable with the male counterparts having Sangat C.D. block (39.2%) and the lowest in Phul 52.4 per cent main and 4.6 per cent marginal workers (34.8%). However, the proportion of marginal respectively. The participation of females in marginal workers is the maximum in Maur CD block (14.7%) work is greater than that of males. In rural areas of and the minimum in Nathana (6.4%). the district female work participation rate (16.5%) is
Punjab State, in General is characterized by low almost four times higher than that of the males
female work participation rate. It was the lowest (4.6%). A.mong 53.5 per cent non-workers in (4.4%) among all the States/Union Territories in the Bathinda rural, 43.0 per cent are males and 65.5 per country at the 1991 Census. It was so due to non- cent are females. Bathinda CD block has the reporting of female's work by the respondent. Special maximl;lm number of non-workers (56.5%) and Maur efforts were made in 200 I Census to get the true CD block the least (48.4%r
46
-

ANALYTICAL NOTE
TABLE 33: NUMBER AND PERCENTAGE OF MAIN WORKERS, MARGINAL WORKERS,AND
NON-WORKERS BY SEX IN URBAN AGGLOMERATlONSrrOWNS, 2001
Serial Name and urban Persons! Total Main workers Marginal workers Total workers Non workers number status of UN Males! Population (Main and
Town +* Females marginal workers)
Number Percentage Number Percentage Number Percentage Number Percentage
2 3 4 5 6 7 8 9 IO II 12
I Bathinda (M CI) Persons 217,256 65,892 30.3 3,519 1.6 69,411 31.9 147,845 68.1 . Males 116,946 55,977 47.9 2,357 2.0 58,334 49.9 58,612 50.\ Females 100,310 9,915 9.9 1,162 1.1 11,077 11.0 89,233 89.0
2 Bhisiana (CT) Persons 4,775 1,888 39.6 11 0.2 1,899 39.8 2,876 60.2 Males 2,837 1,776 62.6 8 0.3 1,784 62.9 1,053 37.1 Females 1,938 112 5.8 3 0.1 115 5.9 \,823 94.1
3 Bhucho Mandi (M CI) Persons 13,246 4,111 31.0 250 1.9 4,361 32.9 8,885 67.1 Males 7,017 3,534 50.4 135 1.9 3,669 52.3 3,348 47.7 Females 6,229 577 9.3 115 1.8 692 Il.I 5,537 88.9
4 Goniana (M CI) Persons 12,813 3,908 30.5 163 1.3 4,071 31.8 8,742 68.2 Males 6,866 3,433 50.0 95 1.4 3,528 51.4 3,338 48.6 Females 5,947 475 8.0 68 1.1 543 9.1 5,404 90.9
5 Kot Fatta (M CI) Persons 6,504 1,743 26.8 396 6.1 2,139 32.9 4,365 67.1 Males 3,435 1,684 49.0 204 6.0 1,888 55.0 1,547 45.0 Females 3,069 59 1.9 192 6.3 251 8.2 2,818 91.8
6 Maur (M CI) Persons 27,543 ~
8,244 29.9 874 3.2 9,118 33.1 18,425 66.9 Males 14,675 7,311 49.8 298 2.1 7,609 51.9 7,066 48.1 Females 12,868 933 7.3 576 4.4 1,509 11.7 11,359 88.3
7 Raman (M CI) Persons 19,551 5,906 30.2 'r
332 1.7 6,238 31.9 13,313 68.1 Males 10,361 5,351 51.7 147 1.4 5,498 53.1 4,863 46.9 Females 9,190 555 6.1 185 2.0 740 8.1 8,450 91.9
8 Rampura Phul UA Persons 44,665 13,083 29.3 2,117 4.7 15,200 34.0 29,465 66.0 Males 23,692 11,269 47.6 1,041 4.4 12,310 52.0 11,382 48.0 Females 20,973 1,814 8.7 1,076 5.1 2,890 13.8 18,083 86.2
(i) Rampura Phul* Persons 44,665 13,083 29.3 2,117 4.7 15,200 34.0 29,465 66.0 (M CI+OG) Males 23,692 11,269 47.6 1,041 4.4 12,310 52.0 11,382 48.0
Females 20,973 1,814 8.7 1,076 5.1 2,890 13.8 18,083 86.2
(ii) Rampura Phul Persons 42,823 12,402 29.0 1,922 4.4 14,324 33.4 28,499 66.6 (M CI) Males 22,706 10,771 47.4 967 4.3 .11,738 51.7 10,968 48.3
Females 20,117 1,631 8.1 955 4.8 2,586 12.9 17,531 87.1
9 Sangat (M CI) Persons 5,401 1,616 29.9 74 1.4 1,690 31.3 3,711 68.7
Males 2,862 1,514 52.9 48 1.7 1,562 54.6 1,300 45.4
Females 2,539 102 4.0 26 1.0 128 5.0 2,411 95.0
District (Urban) Persons 351,754 106,391 30.2 7,736 2.2 114,127 32.4 237,627 67.6
Total: Males 188,691 91,849 48.7 4,333 2.3 96,182 51.0 92,509 49.0
Females 163,063 14,542 8.9 3,403 2.1 17,945 11.0 145,118 89.0
+Town arranged in alphabetical order.
• In case of towns having outgrowth an asterisk mark has been placed against their names to indicate that they have outgrowths which are . not separate towns.
Female work participation rate among the CD The work participation rate in urban areas of the
blocks varies between 46.0 per cent in Maur and district (32.4%) is almost identical with that of the State
24.5 per cent in Nathana. Besides Maur, Sangat (33.5%). Among the towns, the participation rate is
(40.3%) and Talwandi Sabo (39.2%) are the other the highest in Bhisiana (39.8%) and the lowest in Sangat
two CD blocks where at least two out of every five (31.3%), Out of9 towns, five fall above and four below
females are reported as workers. In all, four CD the district average. The participation in marginal work
blocks fall above and three below the district average is comparatively quite less. In the district 2.2 per cent
(34.5%) of female workers. of the urban population is reported as marginal worker
47

DISTRICT CENSUS HANDBOOK: BATHINDA
compared with 30.2 per cent reported as main worker. among males. Among the towns the female work The percentage of population reported as marginal participation rate is the highest in Rampura Phul workers shows a variation of 6.1 per cent in Kat Fatta (l3.8%1i-and the lowest in Sangat (5.0%). In all, and 0.2 per cent in Bhisiana. The vice versa female work participation rate is more than the urban corresponding proportion of main workers is 39.6 per female participation rate of the district in four towns cent in Bhisiana and 26.8 per cent in Kot Fatta. and in other five towns female work participation
The urban female work participation rate in the rate is less than the urban female participation rate district is 11.0 per cent compared with 51.0 per cent of district.
TABLE 34: DISTRIBUTION OF WORKERS BY SEX IN FOUR CATEGORIES OF ECONOMIC ACfIVITY IN TAHSILS, 2001
Serial Name of Tahsil Persons/ Total Total number of Category of workers
number Males/ Population workers Cultivators Agricultural Household Other
Females (Main+Marginal) Labourers Industry workers workers
2 3 4 5
Rampura Phul Persons 283,606 125,644 (44.3)
Males 150,259 83,457 (55.5)
Females 133,347 42,187 (31.6)
2 Bathinda Persons 631,475 248,923 (39.4)
Males 340,083 185,790 (54.6)
Females 291,392 63,133 (21. 7)
3 Talwandi Sabo Persons 268,214 126,100 (47.0)
Males 142,467 79,981 (56.1)
Females 125,747 46,119 (36.7)
District Total: Persons 1,183,295 500,667 (42.3)
Males 632,809 349,228 (55.2)
Females 550,486 151,439 (27.5)
Note: Percentage of Workers to total workers are given in brackets
Table 34 shows distribution of workers by sex in four categories of economic activity by tahsils with
in the district.
Among the total workers in the district 29.8 per cent are cultivators, 21.4 per cent are agricultural labourers, 3.1 per cent are household industry workers and 45.7 per cent are reported as other workers. This signifies that 51.2 per cent of the total workers in the district are engaged in agricultural sector, while 48.8 per cent are in non-agricultural sector of economy.
48
6 7 8 9
42,383 28,397 4,958 49,906 (33.7) (22.6) (3.9) (39.7)
34,820 19,008 1,763 27,866 (41.7) (22.8) (2.1) (33.4) 7,563 9,389 3,195 22,040 (17.9) (22.3) (7.6) (52.2)
56,536 45,904 6,068 140.415 (22.7) ( 18.5) (2.4) (56.4)
48,351 33,026 3,299 101,114 (26.0) (17.8) ( 1.8) (54.4) 8,185 12,878 2,769 39,301 ( 13.0) (20.4) (4.4) (62.2)
50,157 33,136 4,354 38,453 (39.8) (26.3) (3.4) (30.5)
36,410 20,724 1,291 21,556 ( 45.5) (25.9) ( 1.6) (27.0) 13,747 12,412 3,063 16,897 (29.8) (26.9) (6.7) (36.6)
149,076 107,437 15,380 228,774 (29.8) (21.4) (3.1) (45.7)
119,581 72,758 6,353 150,536 (34.3) (20.8) (1.8) (43.1)
29,495 34,679 9,027 78,238 (19.5) (22.9) (5.9) (51.7)
Among the tahsils, the percentage of cultivators is the highe,st in Talwandi Saba (39.8%) and the lowest in-Bathinda (22.7%). Likewise, the proportion of workers reported as agricultural labourers varies between 26.3 per cent in Talwandi Sabo tahsil and 18.5 per cent in Bathinda tahsil.
The proportion of workers engaged in household industry is the highest in Rampura Phul (3.9%) and the lowest in Bathinda (2.4%). In all, two tahsils fall above while one below the district average (3.1 %).

ANALYTICAL NOTE
The participation of females in non-agricultural agricultural workers (HHI- 5.9 % and OW-51.7%) sector is greater than that of males. In the district, as compared to 44.9 per cent males (HHI-1.8% and 57.6 per cent of the female workers are non- OW-43.1%).
TABLE 35 : DISTRIBUTION OF WORKERS BY SEX IN FOUR CATEGORIES OF
ECONOMIC ACTIVITY IN CD. BLOCKS, 2001
Serial Name ofC.D. Persons! Total Total number of Category of workers
number block Males! Population workers Cultivators Agricultural Household Other· Females (Main+Marginal) Labourers Industry workers workers
2 3 4 5 6 7 8 9
Phul Persons 147,312 66,462 23,750 17,545 3,248 21,919 (45.1) (35.7) (26.4 ) (4.9) (33.0)
Males 77,740 43,348 19,766 11,804 1,076 10,702 (55.8) ( 45.6) (27.2) (2.5) (24.7)
Females 69,572 23,114 3,984 5,741 2,172 11,217 (33.2) (17.2) (24.9) (9.4) ( 48.5)
2 Rampura Persons 91,629 43,982 17,787 9,784 1,314 15,097 (48.0) (40.4) (22.3) (3.0) (34.3)
Males 48,827 27,799 14,272 6,457 408 6,662 (56.9) (51.3) (23.2) (1.5) (24.0)
Females 42,802 16,183 3,515 3,327 906 8,435 (37.8) (21. 7) (20.6) (5.6) (52.1)
3 Nathana Persons 129,025 56,633 14,008 10,627 1,196 30,802 (43.9) (24.7) ( 18.8) (2.1) (54.4)
Males 72,059 42,664 12,893 8,194 613 20,964 (59.2) (30.2) (19.2) (1.4 ) (49.2)
Females 56,966 13,969 1,115 2,433 583 9,838 (24.5) (8.0) (17.4) (4.2) (70.4)
4 Bathinda Persons 164,204 71,468 26,131 21,156 1,899 22,282 (43.5) (36.6) (29.6) (2.6) (31.2)
Males 86,984 49,222 22,245 15,168 910 10,899 (56.6) (45.2) (30.8) ( 1.9) (22.1)
Females 77,220 22,246 3,886 5,988 989 11,383 (28.8) (17.5) (26.9) (4.4) (51.2)
5 Sangat Persons 100,681 49,428 21,559 14,752 891 12,226 (49.1 ) (43.6) '(29.9) ( \.8) (24.7)
Males 52,909 30,163 15,418 9,187 452 5,106 (57.0) (51.1 ) (30.5) (1.5) (16.9)
Females 47,772 19,265 6,141 5,565 439 7,120 (40.3) (31.9) (28.9) (2.3) (36.9)
6 Talwandi Sabo Persons 129,364 62,826 25,400 18,802 2,007 16,617 (48.6) (40.4) (29.9) (3.2) (26.5)
Males 68,664 39,016 19,149 11,633 712 7,522 (56.8) (49.1) (29.8) ( \.8) (19.3)
Females 60,700 23,810 6,251 7,169 1,295 9,095 (39.2) (26.3) (30.1) (5.4) (38.2)
7 Maur Persons 69,326 35,741 15,717 9,312 1,889 8,823
(51.6) • (44.0) (26.1) (5.3) (24.7)
Males 36,935 20,834 11,456 5,921 346 3,111
(56.4) (55.0) (28.4) ( 1.7) (14.9)
Females 32,391 14,907 4,261 3,391 1,543 5,712
( 46.0) (28.6) (22.7) (10.4) (38.3)
District (Rural) Persons 831,541 386,540 144,352 101,978 12,444 127,766
Total; (46.5) (37.3) (26.4) (3.2) (33.1)
Males 444,118 253,046 115,199 68,364 4,517 64,966
(57.0) (45.5) (27.0) (1.8) (25.7)
Females 387,423 133,494 29,153 33,614 7,927 62,800
(34.5) (21.8) (25.2) (5.9) (47.1)
Note: Percentage of Workers to total worker are given in brackets
49

Among CD Blocks the proportion of rural workers recorded as cultivators is the highest in Maur (44.0%) and the lowest in Nathana (24.7%). Likewise the proportion of Agricultural labourers shows a variation of 29.9 per cent in Talwandi Sabo and 18.8 per cent in Nathana CD blocks. It is observed that in Sangat (73.5%), Talwandi Sabo (70.3%) and Maur CD block (70.0%) of the workers are in agricultural sector, while the corresponding percentage is only (43.5) per cent in Nathana CD block.
The proportion of rural workers engaged in household industry also exhibits significant variation at CD block level; it is the highest in Maur (5.3%),
DISTRICT CENSUS HANDBOOK: BATHINDA
followed by Phul (4.9%). By contrast it is the lowest in Sangat (1.8%). In all, two CD blocks fall above four CD blocks below and one CD block is equal to the district average (3.2%).
Other workers constitute more than one-half of the rural workers in Nathana (54.4%) CD block. On the other hand in Maur and Sangat nearly one out of four workers (24.7%) is reported as other worker.
Table 35 further reveals that participation of females in agricultural s.ector is 47.0 per cent only (Cultivators-21.8% and Agricultural Labourers-25.2%). 53.0 per cent (Household Industry Workers 5.9% and Other Workers 47.1 %) are in nonagricultural sector.
TABLE 36: DISTRIBUTION OF WORKERS BY SEX IN FOUR CATEGORIES OF ECONOMIC ACfNITY OF URBAN AGGLOMERATIONSrrOWNS, 2001
Serial Name and urban. Persons! Total Total number of Category of workers
number status of UN Males! Population workers Cultivators Agricultural Household Other
Town+* Females (Main+Marginal) Labourers Industry workers workers
2 3 4 ~ 5 6 7 8 9
Bathinda (M CI) Persons 217,256 69,411 823 1,414 2,077 65,097 (31.9) ( 1.2) (2.0) (3.0) (93.8)
Males 116,946 58,334 713 1,244 1,295 55,082
(49.9) ( 1.2) (2.2) (2.2) (94.4 ) Females 100,310 11,077 110 170 782 10,015
( 11.0) ( 1.0) (1.5) (7.1 ) (90.4 )
2 Bhisiana (CT) Persons 4,775 1,899 26 61 6 1,806 (39.8) ( 1.4) (3.2) (0.3) (95.1)
Males 2,837 1,784 24 55 5 1,700
(62.9) (1.3 ) (3.1) (0.3) (95.3 )
Females 1,938 1I5 2 6 I 106
(5.9) (1.7) (5.2) (0.9) (92.2)
3 Bhucho Mandi Persons 13,246 4,361 87 125 59 4,090
(M C1) (32.9) (2.0) (2.9) (1.3) (93.8)
Males 7,017 3,669 82 119 39 3,429
(52.3) (2.2) (3.2) (1.1 ) (93.5)
Females 6,229 692 5 6 20 661
(11.1) (0.7) (0.9) (2.9) (95.5)
4 Goniana (M CI) Persons [2,813 4,07[ 2[ 159 99 3,792
(31.8) (0.5) (3.9) (2.4) (93.2)
Males 6,866 3,528 , i- 20' 139 68 3,301
(51.4 ) (0.6) (3.9) ( 1.9) (93.6)
Females 5,947 543 1 20 31 491
(9.1) (0.2) (3.7) (5.7) (90.4 )
5 Kot Fatta (M CI) Persons 6,504 2,139 699 646 21 773
(32.9) (32.7) (30.2) ( 1.0) (36.1)
Males 3,435 1,888 690 514 18 666
(55.0) (36.5) (27.2) ( 1.0) (35.3)
Females 3,069 251 9 132 3 107
(8.2) (3.6) (52.6) ( 1.2) (42.6)
50

ANALYTICAL NOTE
TABLE 36: DISTRIBUTION OF WORKERS BY SEX IN FOUR CATEGORIES OF ECONOMIC ACTIVlTY OF URBAN AGGLOMERATIONSrrOWNS, 2001 conr~ C .(':{-:I.
Serial Name and urban. Persons/ Total Total number of Category of workers
number status of UN Males/ Population workers Cultivators Agricultural Household Other
Town+* Females (Main+Marginal) Labourers Industry workers workers
2 3 4 5 6 7 8 9
6 Maur (M CI) Persons 27,543 9,118 1,284 . 806 120 6,908 (33.1) (14.1) (8.8) ( 1.3) (75.8)
Males 14,675 7,609 1,158 593 50 5,808 (51.9) (15.2) (7.8) (0.7) (76.3)
Females 12,868 1,509 126 213 70 1,100 (I 1.7) (8.4 ) (14. I) (4.6) (72.9)
7 Raman (M CI) Persons 19,551 6,238 525 780 135 4,798 (31.9) (8.4) ( 12.5) (2.2) (76.9)
Males 10,361 5,498 504 593 63 4,338 (53.1 ) (9.2) (10.8) (I.I ) (78.9)
Females 9,190 740 21 187 72 460 (8.1 ) (2.8) (25.3) (9.7) (62.2)
8 Rampura Phul UA Persons 44,665 15,200 846 1,068 396 12,890 (34.0) (5.6) (7.0) (2.6) (84.8)
Males 23,692 12,310 782 747 279 10,502 (52.0) (6.4) (6.1) (2.2) (85.3)
Females 20,973 2,890 64 321 1I7 2,388
... (13.8) (2.2) (11.1) (4.1) (82.6)
(i) Rampura Phul* Persons 44,665 15,200 846 1,068 396 12,890 (M Cl+OG) (34.0) (5.6) (7.0) (2.6) (84.8)
Males 23,692 12,310 782 747 279 10,502 (52.0) (6.4) (6.1) (2.2) (85.3)
Females 20,973 2,890 64 321 117 2,388 (13.8) (2.2) (11.\) (4.1 ) (82.6)
(ii) Rampura Phul Persons 42,823 14,324 773 701 387 12,463
(M CI) (33.4) (5.4) (4.9) (2.7) (87.0) Males 22,706 11,738 725 520 274 10,219
(51. 7) (6.2) (4.4) (2.3) (87.1) Females 20,117 2,586 48 181 113 2,244
(12.9) (1.8) (7.0) (4.4) (86.8)
9 Sangat (M CI) Persons 5,401 1,690 413 400 23 854 (31.3) (24.4 ) (23.7) (1.4) (50.5)
Males 2,862 1,562 409 390 19 744 (54.6) (26.2) (25.0) ( 1.2) (47.6)
Females 2,539 128 4 10 4 110
(5.0) (3.1) (7.8) (3.1 ) (86.0)
District (Urban) Persons 351,754 114,127 4,724 5,459 2,936 101,008
Total: (32.4) (4.1) (4.8) (2.6) (88.5)
Males 188,691 96,182 4,382 4,394 1,836 85,570
(51.0) (4.5) (4.6) (1.9) (89.0)
Females 163,063 17,945 342 1,065 1,100 15,438
(11.0) (1.9) (6.0) (6.1) (86.0)
Note : Percentage of workers to total workers are given in brackets.
+ Towns arranged in alphabetical order. * In case of towns having outgrowth an asterisk mark has been placed against their names to indicate that they have outgrowths which
are not separate towns.
As per the above table 8.9 per cent of the labourer, and the remaining 91.1 per cent are engaged
workers in urban areas in the district are engaged in in non-agricultural pursuits either as household industry
agricultural activities either as cultivator or agricultural workers or other workers. Among the towns, the
51

DISTRICT CENSUS HANDBOOK: BATHINDA
proportion of agricultural workers (cultivator and The percentage of m~les (89.0%) and females
agricultural labourer) is the highest in Kot Fatta (86.0%) engaged in other work is quite comparable
(62.9%) and the lowest in Bathinda. (3.2%). Sangat and on the contrary, there is a vide disparity in males
is the only other town which has 48.1 per cent (1.9%) and females (6.1%) as household industry
agricultural workers. workers in the urban area of the district.
(ix) Brief Analysis of the Village Directory and Town Directory Data
TABLE 37: DISTRIBUTION OF VILLAGES ACCORDING TO AVAILABILITY OF DIFFERENT AMENITIES, 2001
Serial Name of C.D. Number of Type of amenity available
number block inhabited Education Medical Improved Post Telephone Transport Banks Agricultural Approach Power villages drinking Office # communi- Credit by pucca supply
water· cations $ Societies road
2 3 4 5 6 7 8 9 10 II 12 13
Phul 46 46 40 46 26 46 46 9 34 46 46 (100) (100.0) (87.0) (100.0) (56.5) (100.0) ( 100.0) ( 19.6) (73.9) (100.0) (100.0)
2 Rampura 30 30 19 30 18 30 30 6 18 30 30 . (\ 00) (100.0) (63.3) (100.0) (60.0) (100.0) (100.0) (20.0) (60.0) (100.0) (100.0)
3 Nathana 32 32 2S 32 20 32 32 9 20 32 32 (I00) (100.0) (78.1 ) (100.0) (62.5) (100.0) (100.0) (28.1 ) (62.5) (100.0) (I00.0)
4 Bathinda 54 54 34 54 31 51 54 II 34 53 54 (100) (100.0) (63.0) (I00.0) (57.4) (94.4) ( 100.0) (20.4) (63.0) (98.1)(100.0) ,
5 Sangat 38 38 24 38 21 38 38 6 22 38 38
(100) (100.0) (63.2) (100.0) (55.3) (100.0) (100.0) (15.8) (57.9) (100.0) (100.0)
6 Talwandi Sabo 47 47 21 47 20 47 47 5 30 47 47 > (100) (100.0) (44.7) (100.0) ( 42.6) (I00.0) (100.0) (I0.6) (63.8) (100.0) (100.0)
7 Maur 33 33 18 33 12 33 33 I 22 33 33 (100) (100.0) (54.5) (100.0) (36.4) (100.0) (100.0) (3.0) (66.7) (100.0) (100.0)
District Total: 280 280 181 280 148 277 280 47 180 279 280
(100) (100.0) (64.6) (100.0) (52.9) (98.9) ( 100.0) (16.8) (64.3) (99.6) (100.0)
Note :- Percentages are given in brackets. * Based on the improved drinking water source, drinking water supply has,..been classified as 'Improved' or otherwise. If the
household has access to drinking water supplied from a tap or a hand pump/tube well situated within or outside the premises it is considered as having access to 'Improved drinking water source'. However, the concept of improved drinking water is state
specific and this is to be considered accordingly. # Post office includes Post office, telegraph office and Post and telegraph office. $ Transport communication includes bus service, rail facility and navigable waterways.
This table shows distribution of villages according to availability of different amenities by CD blocks.
Education:
Educational amenity is available to all the (280) villages in the district comprising 7 CD blocks namely Phul, Rampura, Nathana, Bathinda, Sangat, Talwandi
Sabo and Maur.
Medical:
64.6 per cent of the villages in the district are equipped with one or the other type of medical facility. This percentage is as high as 87.0 per cent in Phul. Apart from this, 78.1 per cent villages of CD blocks
52
Nathana, 63.3 per cent of Rampura, 63.0 per cent of Bathinda, 63.2 per cent of Sangat and 54.5 per cent ofMaur are having medical facility within the village. The proportion of villages in the CD block having medical facili~ is low in Talwandi Sabo (44.7%).
Improved Drinking Water :
The availability of improved drinking water refers to availability of drinking water through tap, hand pump and tubewell. It is available to all the villages in the district.
Post Office
52.9 per cent of the villages in the district have

ANALYTICAL NOTE
the facility of post office within the village. More than one half of the villages in each of five CD blocks have the availability of post office. They include CD blocks Nathana (62.5%), Rampura (60.0%), Sangat (55.3%), Bathinda (57.4%) and Phul (56.5%). In Talwandi Sabo (42.6%) and Maur (36.4%) the proportion of villages availing this facility is less than that of the district average (52.9%).
of villages having bank facility is the maximum in Nathana (28.1%) and the minimum in Maur (3.0%).
In this regard as many as four CD blocks fall above
and three below the district average (16.8%).
, Agricultural Credit Societies :
Telephone:
In the district telephone facility is available in 98.9 per cent of the villages, w.hich by all means, is a very high percentage. The position is the best in 6 CD blocks where cent percent of the villages are enjoying this facility with the exception of Bathinda (94.4%).
Two out of every three villages (64.3%) in the district have agricultural credit societies. Among the CD blocks it varies between 73.9 per cent villages in Phul and 57.9 per cent in Sangat. Maur (66.7%), Talwandi Sabo (63.8%), Bathinda (63.0%), Nathana (62.5%) and Rampura (60.0%) are having this facility by and large nearer to district average
Approach by pucca Road :
Transport and Communication :
All the villages in the district are fairly well equipped with transport and communication facility.
In the district 99.6 per cent of the villages are approachable by pucca roads. Only one village in C.D. Block Bathinda is deprived of this facility.
Banks: Power Supply :
Every ~ixth village (16.8%) in the di~trict has the banking facility. Among the CD blocks the percentage
All the villages in the district are having power
supply.
TABLE 38: NUMBER AND PERCENT OF RURAL POPULATION SERVED BY DIFFERENT AMENITIES, 2001
Serial Name of Total Type of amenity available number C.O, block population Education Medical Improved Post Tele- Transport Banks Agricultural Approach Power
of inhabited drinking Office # phone communi- Credit by pucca supply villages water* cations $ Societies road
2 3 4 5 6 7 8 9 10 11 12 13
I Phul 147,312 147,312 138,753 147312 110672 147312 147312 60555 126734 147312 147312
(100) (100,0) (94.2) (100.0) (75.1 ) (100.0) (100,0) (41. I ) (86,0) ( 100.0) (100.0)
2 Rampura 91,629 91,629 75,001 91629 73562 91629 91629 26745 76125 91629 91629
(100) ( 100.0) (81.9) (100.0) (80.3) ( 100.0) ( 100.0) (29.2) (83.1 ) (l 00 .0) (100.0)
3 Nathana 129,025 129,025 113,453 129025 108708 129025 129025 70358 83069 129025 129025
(100) (l00.0) (87.9) (l00.0) (84.3) (100.0) (100.0) (54.5) (64.4) (100.0) (100.0)
4 Bathinda 164,204 164,204 119,178 164204 120892 152044 164204 50037 129857 162175 164204
(100.0) (100.0) (72.6) (100.0) (73.6) (92.6) (100.0) (30.5) (79.1) (98.8) (100.0)
5 Sangat 100,681 100,681 72,240 100681 67963 100681 100681 25687 74621 100681" 100681 (100) (100,0) (71.8) (100.0) (67.5) (100.0) (100.0) (25.5) (74.1 ) (100.0) ( 100,0)
6 Talwandi 129,364 129,364 75,966 129364 81537 129364 129364 33021 102614 129364 129364
Sabo (100) (100,0) (58.7) (100.0) (63.0) (100.0) (100.0) (25.5) (79.3) ( 100.0) (100.0)
7 Maur 69,326 69,326 44499 69326 34497 69J26 69326 4241 52425 69326 69326
(100) (100.0) (64.2) (100.0) (49.8) ( 100.0) (100 0) (6.1 ) (75.6) (J 00.0) (100.0)
District 831,541 831,541 639090 831541 597831 819381 831541 270644 645445 829512 831541
Total: (100) (100.0) (76.9) (100.0) (71.9) (98.5) (l00.0) (32.5) (77 .6) (99.8) (100.0)
Note :- Percentages are given in brackets. * Based on the improved drinking water source, drinking water supply has been classified as 'Improved' or otherwise. If the household
has access to drinking water supplied from a tap or a hand pump/tube well situated within or outside the premises it is considered
as having access to 'Improved drinking water source'. However, the concept of improved drinking water is state specific and this is to be considered accordingly.
# Post office includes Post office, telegraph office and Post and telegraph office.
$ Transport communication includes bus service, rail facility and navigable waterways.
53

Table 38 shows number and percentage of rural population served by different amenities by CD blocks in the district. It is very satisfying that the entire rural population in the district and so in its constituents CD blocks is being served by educational institutions. The same is the position in case of safe drinking water supply transport and communication and power supply facilities.
As regards availability of medical facility, it is available to more than three forth (76.9%) of the rural population. Among the CD blocks, the proportion of population served by medical institutions is the highest in Phul (94.2%) and the lowest in Talwandi Sabo (58.7%). The position is fairly good in Nathana (88.4%), Rampura (81.9%) and Bathinda (74.2%) also where almost three-fourth of the rural population is enjoying these services. Out of 7 CD blocks 4 fall below and 3 above the district average.
Post offices are serving 71.9 per cent of the rural population in the district and this percentage of
DISTRICT CENSUS HANDBOOK: BATHINDA
population varies between 83.0 per cent in Nathana and 49.8 per cent in Maur CD block.
Telephone facility is available to 98.5 per cent of population. It is cent per cent in six CD blocks except
Bathinda where 92.3 per cent of population is availing the facility.
Banks cater to the needs of 32.5 per cent population. Among the 7 CD blocks, the proportion of population served by bank is the highest in Nathana (55.2%) whereas it is the lowest in Maur (6.1%).
A large number of people are having the facility of agricultural credit societies and in CD blocks Phul
Or-
(86.0%).' Rampura (83.1%), Bathinda (79.5%) and Talwandi Sabo (79.3%), it surpasses district average (77.6%).
The entire population is served by Pucca road in all CD blocks except in CD block Bathinda (98.7%)
which is also not much below the district average (99.8%).
TABLE 39: DISTRIBUTION OFVlLLAGES NOT HAVING CERTAIN AMENITlES,ARRANGED BY
DISTANCE RANGES FROM THE PLACES WHERE THESE ARE AVAlLABLE, 2001
Village not having the
amenity of
Distance range of place from the villages where the amenity is available Less than 5-10 kilometres 10+ kilometres Total
5 kilometres (Col. 2 to 4)
2 3 4 5
1. Education :-
(a) Primary School 0 (b) Middle School 'if!
(c) Degree College 34 2. Medical :-
(a) Hospital 54 (b) PHC 51
3. Post Office 96 4. Telephone 3
5. Bus Service 0 6. Banks
(a) Commercial Bank 99 (b) Cooperative Bank 70
7. Agricultural Credit Societies 84
This table shows distribution of villages, which are not having certain amenities, by distance ranges from the places where these are available.
Education:
All the 280 inhabited villages are having Primary educational facility where as 95 villages in the district
54
0 0 0 8 0 95
66 179 279
122 95 271 170 38 259 34 2 132 0 0 3
0 0 0
132 10 241 147 40 257
16 0 100
do not have middle schools. However, among them, this facility is available at a distance of less than five
kilometers in case of 87 villages and for the remaining
8, the same is available at a distance of 5-10 kms.
279 villages do not have Degree Colleges. This
is to say that only 1 village in the district has a degree

ANALYTICAL NOTE
college. However, this facility is available to 34 villages within five kilometers, in case of 66 villages at a distance of 5-10 kms. and for the remaining 179, this facility is available at a distance of 10+ kms.
Medical
271 villages in the district do not have availability of a Hospital within the village. Among them the same is available to 54 villages at a distance of less than 5 kms, in 122 villages it is avail~ble at 5-10 kms and the remaining 95 villages have to cover a distance of more than 10 kms to avail the facility of hospital.
Likewise, out of 259 villages which do not have PHC, the same is available at a distance of less than 5 kms. in respect of 51 villages, at a distance of 5-10 kms. in case of 170 villages and at a distance of more than 10 kms. to 38 villages.
Post office :
In the district 132 villages do not have the Post
Office facility. Among them in 96 villages, it is available at a distance of less than 5 kms, in 34 villages, at a distance of5-lO kms and the remaining 2 villages avail this facility by covering more than 10 kms.
Telephone:
The district is well equipped with this facility as barely 3 ,(out of 280) villages do not have this facility and same is available at a distance of less than 5 kms from the village itself.
Bus Service.:
The district is well served with this facility and aU villages are having this facility within the village.
Bank:
Of the 280 villages, Commercial Bank facility is available in 39 villages only. 99 villages can avail Commercial Bank service at a distance of less than 5 kms, 132 villages at a distance of 5-10 kms and 10 villages at 10 +kms.
Likewise, the Co-operative banking facility to 70 villages is available at less than 5 kms from the village, to 147 villages it is available at 5-10 kms while for remaining 40 villages, the people have to cover a distance of more than 10+ kms.
Agricultural Credit Societies :
Agricultural Credit Societies are not available in 100 villages of which for 84 villages, it is available at a distance of less than 5 kms while for other 16 villages it is available at a distance of 5-10 kms.
TABLE 40: DISTRIBUTION OF VILLAGES ACCORDING TO THE DISTANCE FROM
THE NEAREST STATUTORY TOWN AND AVAILABILITY OF DIFFERENT AMENITIES, 2001
Distance range Number of Type of amenity available
from the nearest inhabited Education Medical Post Telephone Transport Banks Agricultural Approach statutory town villages in Office # communi- Credit by pucca (in kilometres) each range cations $ Societies road
1 2 3 4 5 6 7 8 9 10
less than 5 50 50 36 24 49 50 7 30 49
(100.0) (100.0) (72.0) (48.0) (98.0) (100.0) (14.0) (60.0) (98.0)
5 -15 193 193 125 109 191 193 36 128 193
(100.0) (100.0) (64.8) (56.5) (99.0) (100.0) (18.7) (66.3) (100.0)
16-50 37 37 20 15 37 37 4 22 37
(100.0) (100.0) (54.l) (40.5) (loo.b) (100.0) (10.8) (59.5) (100.0)
51+ 0 0 0 0 ',. 0 0 0 0 0
0 0 0 0 0 0 0 0 0
Unspecified 0 0 0 0 0 0 0 0 0
0 0 0 0 0 0 0 0 0
District total: 280 280 181 148 277 280 47 180 279
(100.0) (100.0) (64.6) (52.9) (98.9) (100.0) (16.8) (64.3) (99.6)
# Post office includes Post office, Telegraph office and Post and telegraph office. $ Transport communication includes bus service, rail facility and navigable waterways.
55

DISTRICT CENSUS HANDBOOK: BATHINDA
Table 40 shows that 50 villages in the district are availability of telephone. Apart from this, transport located within a distance of less than 5 kms, 193 and communication facility is available to 193 (100%) villages in the distance range of 5-15 Kms and 37 villages in the distance range of 5-15 kms., 36 (l8. 7%) villages within 16-50 Kms from the nearest statutory villages have banks, 128 (66.3%) villages have town. agricultural credit societies and all (100%) villages
Maximum number of villages (193) fall in the are approachable by pllcca road. Each of the 37
distance range of 5-15 Kms and educational facility villages located at a district range of 16-50 kms from
is available to cent percent villages, medical facility the nearest town has the facility of education, is available to 125 (64.8 %) villages, post office to telephone, transport, communication and is duly 109 (56.5%) villages and 191 (99.0%) villages have connected by Pucca Road.
TABLE 41: DISTRIBUTION OFVILL~GESACCORDING TO POPULATION RANGE AND AMENITIES AVAILABLE, 2001
Population Number of Type of amenity available range inhabited Education Medical Improved Post Telephone Transport Banks Agricultural Approach Power
villages in drinking Office # communi- Credit by Pucca supply each range water* cations $ Societies road
2 3 4 5 6 7 8 9 10 11 12
1-499 4 4 1 4 0 4 4 0 2 4 4 (100.0) (100.0) (25.0) (100.0) (0.0) (100.0) (100.0) (0.0) (50.0) (100.0) (100 0)
500-999 23 23 6 23 2 23 23 0 7 23 23 (100.0) (100.0) (26.1) (l00.0~ (8.7) ( 100.0) (100.0) (0.0) (30.4 ) (100.0) (100.0)
1000-1999 93 93 48 93 27 93 93 4 36 93 93 (100.0) (100.0) (51.6) (100.0) (29.0) (100.0) (100.0) (4.3) (38.7) (100.0) (1000)
2000-4,999 128 128 96 128 87 126 128 24 104 127 128 (100.0) (100.0) (75.0) (100.0) (68.0) (98.4) (100.0) (18.8) (81.3) (99.2) (100.0)
5000-9999 28 28 26 28 28 27 28 15 28 28 28 (100.0) ( 100.0) (92.9) (100.0) (l00.0) (96.4) (100.0) (53.6) ( 100.0) (100.0) (100.0)
10000 + 4 4 4 4 4 4 4 4 3 4 4 (100.0) (100.0) (100.0) (100.0) (100.0) (100.0) (100.0) (100.0) (75.0) (100.0) (100.0)
District total 280 280 181 280 148 277 280 47 180 279 280
(100.0) (100.0) (64.6) (100.0) (52.9) (98.9) (100.0) (16.8) (64.3) (99.6) (100.0)
# Post office includes Post office, Telegraph office and Post and telegraph office.
$ Transport communication includes bus service, rail facility and navigable waterways.
* Based on the improved drinking water source, drinking water supply has been classified as 'Improved' or otherwise. If the household has access to drinking water supplied from a tap or a hand pump I tube well situated within or outside the premises it is considered as having access to 'Improved drinking water source'.
However, the concept of improved drinking water is state specific and this is to be considered accordingly.
Table 41 presents distribution of villages by to 1 (2'5%) villages in size class 1-499, 6(26.1 %) population range and amenities available. villages in the range of 500-999, 48 (51.6%) of the
Out of 280 villages, 4 have a population of less than 500, 23 fall in size class 500-999, 93 have population in the range of 1000-1999, 128 are in the range of 2000-4999, 28 villages comprise the size class 5,000-9,999 and 4 villages are having population of
10,000 or more.
Educational facility is available to cent per cent villages under various size classes.
Medical facility is available to 30 villages having popUlation of 5,000 or more. This facility is available
56
villages with popUlation 1,000-1,999, and 96 (75.0%) villages in size class 2,000-4,999. .
Improved drinking water is available to all the villages in the district.
Post office facility is availaple to 32 villages having popUlation of 5,000 or more. This facility is available to 2 (8.7%) villages in the range of- 500-999, 27 (29.0%) villages with population 1,000-1,999, and 87 (68.0%) villages in size class 2,000-4,999.
All the villages under size class 1-499, 500-999,

ANAL YTJCAL NOTE
1000-1,999, and 10,000 + are having telephone facility. Only 3 villages, 2 in the range of 2000-4999 and 1 in
the range of 5000-9999 are deprived of this facility.
Transport and communication facility is available
to all the villages in the district.
Availability of banks is predominantly the
characteristic of larger villages. All the 4 (100.0%)
villages with population 10,000 or more have banks.
Likewise, 15(53.6%) villages out of 28 in size class 5,000-9,999 and 24(18.8%) villages out of 128 with
population in the range of 2,000-4,999 have the
villages with population below 2,000 only 4.3 per cent . viBages in size class 1,000-1,999 have banking facility.
Agricultural credit societies are available in all the villages under size 5,000-9,999 and in 75.0 per cent of villages with population 10,000 +, in 81.3 per cent of villages with popUlation 2,000-4,999, in 38.7 per cent villages in size class 1000-1999, to 30.4 per cent villages having population between 500-999 and to 50.0 per cent villages with population below 500.
All the villages in the district are approachable by pucca road.
All the villages in the district have the availability availability of banks. Among the remaining 120 of power supply.
TABLE 42 : DISTRIBUTION OF VILLAGES ACCORDING TO LAND USE, 2001
Serial Name of Number of Total area Percentage of cultivable Percentage of irrigated
number C. D. block inhabited villages in hectares area to total area area to total cultivable area
I
2
3
4
5
6
7
2 3 4
Phul 46 54,408
Rampura 30 33,199
Nathana 32 39,903
Bathinda 54 63,364 ~
Sangat 38 46,187
Talwandi Sabo 47 54,020
Maur 33 28278
District Total: 280 319359 '1-
Note: - Cultivable area = irrigated area + unirrigated area'
5 6
90.1 90.1
87.8 93.0
84.9 85.4
89.1 85.2
92.3 80.3
87.5 83.2
91.8 92.1
89.0 86.4
CD blockwise villages, according to land use are given in Table 42. Bathinda CD block (63,364 hectares)
Nathana. Four out of 7 CD blocks have percentage of cultivable area greater than that of the district average.
is the largest in area and is more than twice than that 86.4 per cent of the cultivable area in the district of Maur (28,278 hectares), the smallest CD block in is irrigated. All the CD blocks have fairly high area. In the district 89.0 per cent ofthe area is cultivable proportion of cultivable area under irrigation and this and among the CD blocks this percentage varies percentage varies between 93.0 per cent in Rampura between 92.3 per cent in Sangat and 84.9 per cent in and 80.3 per cent in Sangat.
TABLE 43: PER CAPITA RECEIPT AND EXPENDITURE IN STATUTORY TOWNS
Serial Class, name & Per capita receipt Per capita expenditure
number urban status of Total Through From all Total General Public Publk Public Other(s) the Town taxes other Administration health and works institutions
sources convenience
2 3 4 5 6 7 8 9 10 II
I I Bathinda (M.CJ) 722.2 631.1 91.1 738.2 90.1 414.8 117.7 0.0 115.6 2 VI Bhisiana (C.T) 10.5 0.0 10.5 10.5 0.0 10.5 0.0 0.0 0.0 3 IV Bhucho Mandi (M.CI) 738.0 310.3 427.6 706.8 48.1 0.0 5.5 8.1 693.2 4 IV Goniana (M.CJ) 651.6 595.4 56.2 591.4 438.0 0.0 131.4 0.0 22.0 5 V Kot Fatta (M.CJ) 125.4 7.4 117.9 88.7 25.8 26.4 29.7 0.0 6.8 6 III Maur (M.CI) 358.9 278.8 80.1 359.9 254.8 77.1 . 0.6 0.0 27.4 7 IV Raman (M.CI) 466.5 33.2 433.3 438.1 35.2 69.2 11.3 0.0 322.4
,8 III Rampura Phul (U.A) 470.2 24.7 445.5 424.4 336.2 0.0 83.5 0.0 4.8 III Rampura PhuJ (M.CJ) 470.2 24.7 445.5 424.4 336.2 0.0 83.~ 0.0 4.8
9 V Sangat (M.CI) 287.5 130.3 157.2 272.2 90.9 12.8 28.5 0.0 140.0
District Total: 618.2 452.1 166.1 616.5 139.9 266.9 90.0 0.3 121.2
57

Table 43 shows per capita receipt and expenditure
incurred for all the statutory towns in Bathinda district.
The per capita receipt in the district is Rs 60.2 out
of which Rs 40.4 comes through taxes and Rs 19.8
through all other sources. The per capita receipt is as high as Rs 73.8 in Bhucho Mandi and as low as Rs 12.5 in Kot Fatta.
As against the per capita receiptof Rs 60.2 the
DISTRICT CENSUS HANDBOOK: BATHINDA
district is incurring per capita expenditure ofRs 59.6 The per capita expenditure on general administration is to the extent of Rs. 16.2, on Public health and conveniences (Rs 23.7), public works (Rs. 8.9), and per capita expenditure on public institutions is only Rs. 0.3, while it is Rs. 10.8 for all other types of activities. Interestingly, per capita expenditure exceeds per capita receipts in Bathinda, Bhucho Mandi and
Maur.
TABLE 44: SCHOOLS/COLLEGES PER 10,000 POPULATION IN STATUTORY TOWNS, 2001
Serial Name and urban status Type of educational institution number of Town Primary Junior Secondary/ Secondary/ Senior College
Middle Matriculation Secondary
2 3 4 5 6 7
Bathinda (M.C!) 1.9 1.0 0.7 0.5 0.2 2 Bhucho Mandi (M.cI) 4.5 3.0 1.5 0.8 0.0
3 Goniana (M.CI) 11.7 7.0 4.7 0.8 1.6 4 Kot Fatta (M.CI) 6.2 3.1 1.5 0.0 0.0
5 Maur (M.el) 4.0 2.2 1.5 0.4 0.0
6 Raman (M.CI) 6.1 3.6 2.6 1.0 0.0
7 Rampura Phul (M.CI) 4.0 2.2 1.8 0.4 0.2
8 Sangat (M.C!) 9.3 5.6 3.7 1.9 0.0
District Total 3.3 1.8 1.3 0.5 0.2
Table 44 shows number of schools/colleges In other words, there is a primary school after per 10,000 of population for towns. In the district a population 3,030, junior secondary/middle school there are 3.3 primary schools, 1.8 junior for every 5,556 persons, and secondary/ secondary/middle schools, 1.3 secondary/ matriculation school for 7,692 persons, senior matriculation schools, 0.5 senior secondary secondary school for 20,000 population and a schools and 0.2 colleges per 10,000 population. college for a population of 50,000.
TABLE 45 : NUMBER OF BEDS IN MEDICAL INSTITUTIONS IN TOWNS, 2001
Serial number
2 3 4
5
6
7
8 9
Name and urban status of the Town
2
Bathinda (M.Cl)
Bhisiana (C.T)
Bhucho Mandi (M.Cl)
Goniana (M.C!)
Kot Fatta (M.Cl)
Maur(M.Cl)
Raman (M.Cl)
Rampura Phul (M.CJ)
Sangat (M.Cl)
Distrct Total:
Table 45 shows number of beds in medical institutions in towns per 10,000 of population. The district on an average has 20 beds per 10,000 of population. Among the towns, Sangat has 93 beds per 10,000 population and this is the highest among
58
Number of beds in medical institutions per 10,000 population
3
18
o 26 T7
6
23 18
22
93
20
all the towns in the district. Besides Sangat, Maur (23), Goniana (27), Bhucho Mandi (26) and Rampura Phul (22) are the other towns, which have more beds per 10,000 populations, than that of the district average Kat Fatta has only 6 beds per 10,000 population

ANALYTICAL NOTE
Serial number
2
3 4
5
6
TABLE 46 : PROPORTION OF SLUM POPULATION IN TOWNS, 2001
Name of the Town Total population Slum population Percentage of slum (approximately) population to total population
2 3 4 5
Bhucho Mandi 13,246 5,381 4006
Goniana 12,813 3,000 2304 Kot Fatta 6,504 980 1501 Maur 27,543 11,760 4207 Raman 19,551 7,260 37:1 Sangat 5,401 746 1308
District Total 85,058 29,127 34.2
Table 46 shows proportion of slum population living in statutory towns in the district. Bhucho Mandi, Goniana, Kot Fatta, Maur, Raman and Sangat are the six towns which have reported slum population. In absolute terms 29,127 persons are living in slums which accounts for 34.2 per cent of
the total urban popUlation of these six towns. In the towns of Bucho Mandi (40.6%) and Maur (42.7%), more than two-fifth of the total population of the towns is residing in slums. Goniana, Kot Fatta and Sangat towns have less than 25.0 per cent slum population
Serial number
2
3
4
5
6
7
8
9
TABLE 47: MOST IMPORTANT COMMODITY EXPORTED OUT OF AND
MANUFACTURED IN TOWNS, 2001
Name and urban status of town
2
Bathinda (M.C\.)
Bhisiana (C.To)
Bhucho Mandi (M.C!,)
Goniana (MoCl.)
Kot Fatta (M.Cl.)
Maur (MoC!.)
Raman (MoC!.)
Rampura Phul (M.C!,)
Sangat (M.Cl.)
Most important commodity Manufactured Exported
3 4
Fertilizer SoW.Pipe Seeds
Mustard Oil Buckets Agricultural Implements
Shoes Agriculturallinplements
Agricultural Implements Shoes Furniture
Plastic Shoes Electrical Material (Wooden)
Zarda
Cotton Bales, Agricultural Implements Mustard Oil
Thread Agricultural Implements Transformers
Agricultural Implelpents Shoes Wooden Furniture
59
Fertilizer Vanaspati Oil SoW.Pipe
Wheat Cotton Green Fodder
Cotton Seed Oil Cake Agricultural Implements
Raw Cotton Wooden Furniture Oil Seeds
Cotton Wheat Soda
Processed Cotton Mustard Oil Wheat
Cotton Bales Vegetable Oils Mustard Oil
Agricultural Implements Cotton Washing Soap
Wheat Pulses Agricultural Implements
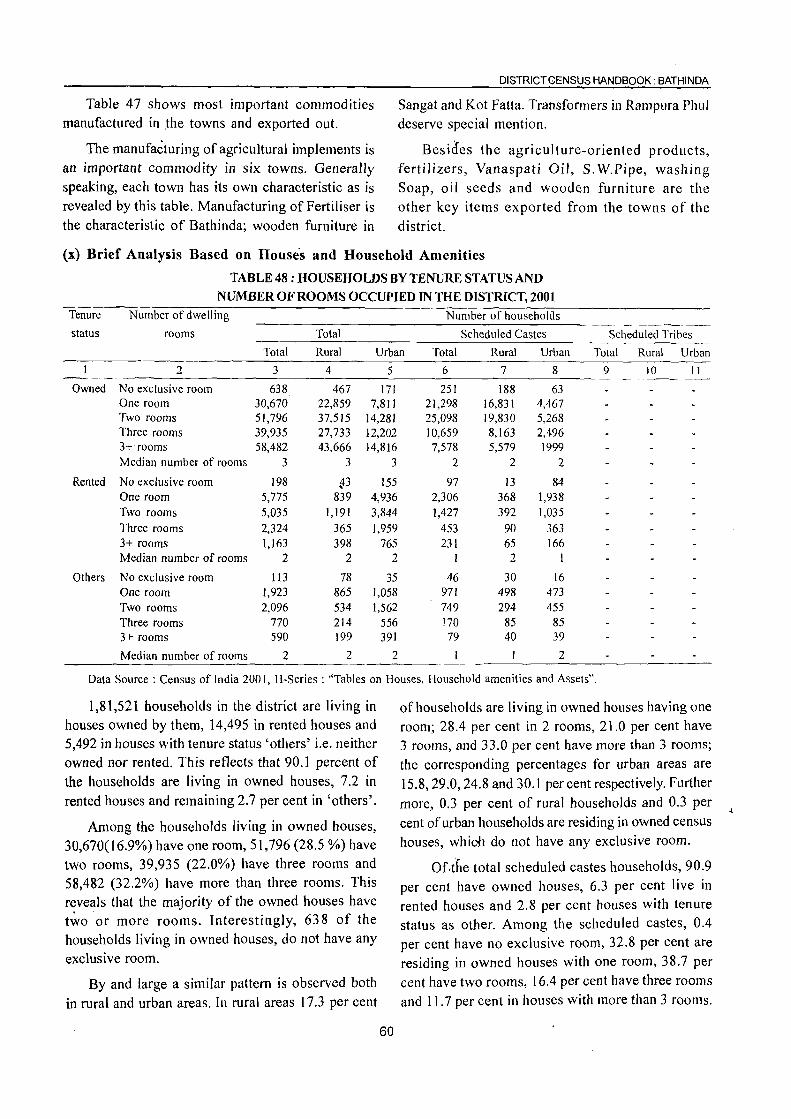
Table 47 shows most important commodities manufactured in .the towns and exported out.
The manufacturing of agricultural implements is an important commodity in six towns. Generally speaking, each town has its own characteristic as is revealed by this table. Manufacturing of Fertiliser is the characteristic of Bathinda; wooden furniture in
DISTRICT CENSUS HANDBOOK: BATHINDA
Sangat and Kot Fatta. Transformers in Rampura Phul deserve special mention.
Besides the agriculture-oriented products, fertilizers, Vanaspati Oil, S. W.Pipe, washing Soap, oil seeds and wooden furniture are the other key items exported from the towns of the district.
(x) Brief Analysis Based on Houses and Household Amenities
TABLE48:HOUSEHOLDSBYTENURESTATUSAND
NUMBER OF ROOMS OCCUPIED IN THE DISTRICT, 2001 Tenure Number of dwelling Number of households
status rooms Total Scheduled Castes Scheduled Tribes
Total Rural Urban Total Rural Urban Total Rural Urban
2 3 4 5 6 7 8 9 10 11
Owned No exclusive room 638. 467 171 251 188 63 One room 30,670 22,859 7,811 21,298 16,831 4,467 Two rooms 51,796 37,515 14,281 25,098 19,830 5,268 Three rooms 39,935 27,733 12,202 10,659 8,163 2,496 3+ rooms 58,482 43,666 14,816 7,578 5,579 1999 Median number of rooms 3 3 3 2 2 2
Rented No exclusive room 198 ~3 155 97 13 84 One room 5,775 839 4,936 2,306 368 1,938 Two rooms 5,035 1,191 3,844 1,427 392 1,035 Three rooms 2,324 365 1,959 453 90 363 3+ rooms 1,163 398 765 231 65 166 Median number of rooms 2 2 2 2 I
Others No exclusive room 113 78 35 46 30 16 One room 1,923 865 1,058 971 498 473 Two rooms 2,096 534 1,562 749 294 455 Three rooms 770 214 556 170 85 85 3+ rooms 590 199 391 79 40 39
Median number of rooms 2 2 2 I 2
Data Source: Census of India 2001, H-Series : "Tables on Houses, Household amenities and Assets".
1,81,521 households in the district are living in houses owned by them, 14,495 in rented houses and 5,492 in houses with tenure status 'others' i.e. neither owned nor rented. This reflects that 90.1 percent of the households are living in owned houses, 7.2 in rented houses and remaining 2.7 per cent in 'others'.
Among the households living in owned houses, 30,670(16.9%) have one room, 51,796 (28.5 %) have two rooms, 39,935 (22.0%) have three rooms and 58,482 (32.2%) have more than three rooms. This reveals that the majority of the owned houses have two or more rooms. Interestingly, 638 of the households living in owned houses, do not have any exclusive room.
By and large a similar pattern is observed both in rural and urban areas. In rural areas 17.3 per cent
60
of households are living in owned houses having one room; 28.4 per cent in 2 rooms, 21.0 per cent have 3 rooms, and 33.0 per cent have more than 3 rooms; the corresponding percentages for urban areas are 15.8,29.0,24.8 and 30.1 percent respectively. Further more, 0.3 per cent of rural households and 0.3 per cent of urban households are residing in owned census houses, whioh do not have any exclusive room.
Of.the total scheduled castes households, 90.9 per cent have owned houses, 6.3 per cent live in rented houses and 2.8 per cent houses with tenure status as other. Among the scheduled castes, 0.4 per cent have no exclusive room, 32.8 per cent are residing in owned houses with one room, 38.7 per cent have two rooms, 16.4 per cent have three rooms and 11.7 per cent in houses with more than 3 rooms.

ANALYTICAL NOTE
In other words 66: 8% of scheduled castes households are having two or more rooms. Among
rented households, 51.1 per cent have one room and 31.6 per cent have two rooms.
TABLE 49: PERCENTAGE DISTRIBUTION OF HOUSEHOLDS LIVING IN PERMANENT, SEMI PERMANENT AND TEMPORARY HOUSES, 2001
Serial District/ Total Rural Urban
number Tahsil Permanent Semi- Temporary Permanent Semi- Temporary Permanent Semi- Temporary
permanent permanent permanent
, I 2 3 4 5 6 7 8 9 10 II
Bathinda 170,129 19,879 11,486 110,663 16,733 9,558 59,466 3,146 1,928
(100.0) (100.0) (100.0) (100.00) . (100.00) (l00.00) (100.00) (100.00) (100.00)
Rampura Phui 42,021 5,226 1,,507 34,485 4,840 1,402 7,536 386 105 .,. (24.7) (26.3 ) (13.1) (31.2) (28.9) (14.7) (12.7) (12.3) (5.5)
2 Bathinda 91,204 9,354 6,636 46,625 7,170 4,989 44,579 2,184 1,647
(53.6) (47.0) (57.8) (42.1) (42.9) (52.2) (75.0) (69.4) (85.4 )
3 Talwandi Sabo 36,904 5,299 3,343 29,553 4,723 3,167 7,351 576 176
(21.7) (26.7) (29.1 ) (26.7) (28.2) (33.1 ) (12.3) ( 18.3) (9.1)
This table shows percentage distribution of households by tahsils living in permanent, semi permanent and temporary houses. Out of 170,129 households
• living in permanent houses in the district, 53.6 per cent are in Bathinda, 24.7 per cent in Rampura Phul,
and 21.7 per cent are in Talwandi Sabo, The percentage share of households living in semi-permanent houses of the district shows a variation of 47.0 per cent in Bathinda and 26.3 per cent in Rampura Phul. There are 11,486 households living in temporary houses and these makes 5.7 per cent of the total households. Bathinda Tahsil constitute 57.8 per cent
of the total households living in temporary houses; the share of the remaining Tahsils is Talwandi Sabo (29.1%) and Rampura Phul (13.1).
Out of the total households living in permanent houses, 11,0663 (65.0%) are in rural areas and 59466 (35.0%) in urban areas. Likewise percentage of households living in semi-permanent houses in rural and urban area is 84.2 per cent and 15.8 per cent respectively. There are 11486 households living in temporary houses and among them 9558 (83.2%) are in rural and 1928 (16.8%) in urban areas of the district.
TABLE 50: PERCENTAGE OF HOUSEHOLDS HAVING IMPROVED DRINKING WATER SOURCE,. ELECTRICITY, BATHROOM, TOILET AND DRAINAGE FACILITY, 2001
Serial Tahsil Total! Number of Number and percentage of households having
number Rural! households Improved Electricity Bathroom Toilet Drainage
Urban drinking water*
2 3 4 5 6 7 8 9
Bathinda Total 201,508 196,481 179,409 159,275 160,004 146,838 (97.5) (89.0) (79.0) (79.4) (72.9)
Rural 136,966 133,035 18,122 104,976 102,816 90,244 (97.1) (86.2) (76.6) (75.1 ) (65.9)
Urban 64,542 63,446 61,287 54,299 57,188 56,594 (98.3) (95.0) (84.1) (88.6) (87.7)
Rampura Phul Total 48,755 47,449 43,156 J5,809 32,248 36,672 (97.3) (88.5) (73.4 ) (66.1) (75.2)
Rural 40,728 39,637 35,505 29,693 25,634 29,537 (97.3) (87.2) (72.9) (62.9) (72.5)
Urban 8,027 7,812 7,651 6,116 6,614 7,135 (97.3 ) (95.3 ) (76.2) (82.4 ) (88.9)
61

DISTRICT CENSUS HANDBOOK: BATHINDA
TABLE 50: PERCENTAGE OF HOUSEHOLDS HAVING IMPROVED DRINKING WATER SOURCE, ELECTRICITY, BATHROOM, TOILET AND DRAINAGE FACILITY, 2001 concld ....
Serial Tahsil Total! Number of Number and percentage of households having
number Rural/ households Improved Electricity Bathroom Toilet Drainage
Urban drinking water*
2 3 4 5 6 7 8 9
2 Bathinda Total 107,207 104,946 96,917 87,569 91,038 81,369 (97.9) (90.4 ) (81. 7) (84.9) (75.9)
Rural 58,795 57,185 50,917 45,842 46,879 38,023 (97.3) (86.6) (78.0) (79.7) (64.7)
Urban 48,412 47,761 46,000 41,727 44,159 43,346 (98.7) (95.0) (86.2) (91.2) (89.5)
3 Talwandi Sabo Total 45,546 44,086 39,336 35,897 36,718 28,797 (96.8) (86.4 ) (78.8) (80.6) (63.2)
Rural 37,443 36,213 31,700 29,441 30,303 22,684 (96.7) (84.7) (78.6) (80.9) (60.6)
Urban 8,103 7,873 7,636 6,456 6,415 6,113
(97.2) (94.2) (79.7) (79.2) (75.4)
Data source: Census of India 2001, H-Series: "Tables on Houses, Household amenities and Assets."
* Based on the improved drinking water source, drinking water supply has been classified as 'Improved' or otherwise. If the household
has access to drinking water supplied from a tap or a hand pump/tube well Situated within or outside the premises it is considered
as having access to 'Improved drinking water source'. However, the concept of improved drinking water is state specific and this
is to be considered accordingly.
Note : Percentage is given in brackets after the number of households.
Bathroom means bathroom within the house
Toilet means toilet within the house
Drainage means closed and open drainage
This table shows proportion of household having improved drinking water source, electricity, Bathroom, toilet and drainage activity.
Improved drinking water
Households having tap, hand pump, and tubewell as the source are grouped as having improved drinking water facility. In the district it is available to 97.5 per cent of the households. The corresponding figures for the rural and urban areas are being 97.1 per cent and 98.3 per cent respectively. The trends are, by and large, the'same among the tahsils in the district.
Electricity:
Electricity as the source of lighting is available to 89.0 per cent of the households in the district; the corresponding figures for rural and urban areas are 86.2 per cent and 95.0 per cent respectively signifying that the rural areas do not lag behind the urban much in this regard. The trends are, by and large, the same for all the tahsils barring Talwandi Sabo where 86.4 per cent of the households have electricity and this
62
percentage is significantly lower in the rural parts (84.7%) as compared with the urban (94.2%).
Bathroom:
Bathroom is available 'to more than three-fourths (79.0%) of the households in the district. Even in rural area this facility is available to 76.6 per cent of the households as compared to 84.1 per cent urban households.Among the tahsils, Bathinda (81. 7%) is at the first place and Rampura Phul (73.4%) is at the
tail.
Toilet
Four out of every five households (79.4%) have toilet facility. Among the tahsils this percentage varies between 84.9 per cent in Bathinda and 66.1 per cent in Rampura Phul. Besides Bathinda, Talwandi Sabo tahsils (80.6%) has higher percentage than that of the district as such.Three fourth (75.1 %) of the rural households have toilet facility as compared to 88.6 per cent in urban. Bathinda tahsil ranks first and Rampura Phul tashil occupies the last position.

ANALYTICAL NOTE
Drainage: and 87.7 per cent in urban. In rural, Rampura Phul
72.9 per cent of the households have closed or tahsil (72.5%) and in urban. Bathinda tahsil (89.5%)
open drainage facility comprising 65.9 per cent in rural stand atop.
TABLE 51: DISTRIBUTION OF HOUSEHOLDS BY AVAILABILITY OF
TYPE OF FUEL USED FOR COOKING
Serial District / Total! Total Type of fuel used for cooking number Tahsil Rural! household Firewood Crop Cowdung Coal, Kerosene Cooking Elect- Biogas Others No
Urban residue cake Lignite, gas ricity cooking charcoal (LPG)
2 3 4 5 6 7 8 9 10 11 12 13 14
Bathinda Total 201,508 64,613 52,350 16,162 240 6,149 60,134 225 790 134 711
(32.1)' (26.0) (8.0) (0.1 ) (3.0) (29.8) (0.1) (0.4) (0.1) (0.4)
Rural 136,966 53,116 49,535 14,261 36 1,178 17,577 198 629 88 348
(38.8) (36.2) (10.4) (0.0) (0.9) (12.8) (0.1 ) (0.5) (0.1 ) (0.2)
Urban 64,542 11,497 2,815 1,901 204 4,971 42,557 27 161 46 363
(17.8) (4.4) (2.9) (0.3) (7.7) (65.9) (0.0) (0.3) (0.1 ) (0.6)
Rampura Total 48,755 16,208 11,095 8,672 24 1,084 10,977 72 390 24 209
Phul (33.2) (22.8) (17.8) (0.1) (2.2) (22.5) (0.1 ) (0.8) (0.1) (0.4)
Rural 40,728 14,673 10,471 8,340 15 585 6,002 69 376 16 181
(36.0) (25.7) (20.5) (0.0) (1.4 ) ( 14.7) (0.2) (0.9) (0.1 ) (0.5)
Urban 8,027 1,535 624 332 9 499 4,975 3 14 8 28
( 19.1) , (7.8) (4.1) (0.1 ) (6.2) (62.0) (0.0) (0.2) (0.1) (0.4)
2 Bathinda Total 107,207 29,671 23,002 6,780 202 4,755 41,873 97 309 89 429
(27.7) (21.4 ) (6.3) (0.2) ( 4.4) (39.1 ) (0.1) (0.3) (0.1 ) (0.4)
Rural 58,795 22,850 21,243 5,307 13 469 8,490 82 174 52 115
(38.9) (36.1) (9.0) (0.0) (0.8) ( 14.5) (0.1) (0.3) (0.1 ) (0.2)
Urban 48,412 6,821 1,759 1,473 189 4,286 33,383 15 135 37 314
(14.1 ) (3.6) (3.0) (0.4) (8.9) (69.0) (0.0) (0.3) (0.1 ) (0.6)
3 Talwandi Total 45,546 18,734 18,253 710 14 310 7,284 56 91 21 73
Sabo (41.1) (40.1) ( 1.6) (0.0) (0.7) (16.0) (0.1 ) (0.2) (0.0) (0.2)
Rural 37,443 15,593 17,821 614 8 124 3,085 47 79 20 52
( 41.6) (47.6) ( 1.7) (0.0) (0.3) (8.3) (0.1 ) (0.2) (0.1 ) (0.1 )
Urban 8,103 3,141 432 96 6 186 4,199 9 12 21
(38.8) (5.3) ( 1.2) (0.1 ) (2.3) (51.8) (0.1 ) (0.1 ) (0.0) 0.3
Data source: Census of India 2001, H-Series: "Tables on Houses, Household amenities and Assets."
Firewood is the main fuel used for cooking in the Crop,. residue is the third main fuel being used for
district as it is being used by 32.1 per cent households. cOdking. In the district more than one-forth households
This percentage is as high as 41.1 per cent in Talwandi (26.0%) are using crop residue; the corresponding
Sabo tahsil. In rural areas 38.8 per cent of households figure for rural and urban areas are 36.2 per cent
are using firewood and this percentage is more than and 4.4 per cent respectively. The use of crop residue
double than that of the urban (17.8) percentage. as fuel for cooking in rural areas is four to eleven
The use of cooking gas (LPG) is also fairly high. times more than urban areas in tahsils.
It is being used by 29.8 per cent of the total 6,149 households (3.0%) in the district are using
households in the district. In Bathinda tahsil 39.1 per kerosene as fuel for cooking and its use is more in urban
cent of the households are using LPG while the (7.7%) in comparison with the rural (0.9%) households.
corresponding percentage is only 16.0 per cent in This trend holds true for all the tahsils in the district.
Talwandi Sabo,65.9 per cent of the urban households Cowdung Cake (8.0 %) still exceeds kerosene and
are using LPG for cooking, while it is only 12.8 per all other types of fuel available to households in Bathinda
cent in case of the rural households. district other than firewood, LPG and crop residue.
63

DISTRICT CENSUS HANDBOOK: BATHINDA
TABLE 52: NUMBER OF HOUSEHOLDS AVAILING BANKING SERVICES AND NUMBER OF HOUSEHOLDS HAVING EACH OF THE SPECIFIED ASSET
Serial Districtl Total/ Total Total Availability of assets
number Tahsil Rural! number of number of Radio, Television Telephone Bicycle Scooter. Car, Nonc of
Urban households households Transistor Motorcycle, Jeep, the availing Moped Van specilicd
banking service assets
2 3 4 5 6 7 8 9 10 II 12
Bathinda Total 201,508 73,687 58,944 121,902 42,091 130.280 50,138 10,787 34,847
Rural 136,966 41,495 35,561 70,009 18,396 84,366 25,073 5,088 29,706
Urban 64,542 32,192 23,383 51,893 23,695 45,914 25,065 5,699 5,141
Rampura Total 48,755 15,134 12,747 26,232 8,667 32,530 10,583 2,013 9,012
Phul Rural 40,728 11,638 10,343 20,175 5,973 27,591 8,005 1,472 8.062
Urban 8,027 3,496 2,404 6,057 2,694 4,939 2.578 541 950
2 Bathinda Total 107,207 46,120 35,076 71,502 26,347 72,982 32,113 7.084 14,709
Rural 58,795 19,870 16,235 31,529 7,928 37,066 11,492 2,389 11.592
Urban 48,412 26,250 18,841 39,973 18,,419 35,916 20,621 4,695 3,117
3 Talwandi Total 45,546 12,433 11,121 24,168 7.077 24,768 7,442 1,690 11,126
Sabo Rural 37,443 9,987 8,983 18,305 4,495 19,709 5,576 1,227 10.052
Urban 8,103 2,446 2,138 5,863 2,582 5,059 1,866 463 1,074
Data source: Census of India 200 I, H-Series: "Tables on Houses, Household amenities and Assets "
Out of 20 1 ,508 households in the district, 73,687 (36.6%) are availing banking services; 58,944 (29.3%) have Radiol Transistor; 121,902 (60.5%) have
television; 42,091 (20.9%) have telephone; 130,280
(64.7%) have bicycle; 50,138 (24.9%) have scooter,
motorcycle, moped and 10,787 (5.4%) have car, jeep
and van. The over all scenario of availability of assets
in the district can be graded as fairly good. Nevertheless 34,847 (17.3%) of the households have
reported none of these assets available to them which
is unbelievable keeping into mind present day standard
ofliving.
As regards banking service available to
households at tahsil level, only Bathinda tahsil (43,0%)
excels Bathinda district and Talwandi Sabo tahsil
(27.3%) is badly outshot.
(xi)Places of tourist, religious, historical or archeological importance
Bathinda :
Bathinda, the principal town and headquarters of
the district/sub divisionltahsil of the same name, is a
big railway junction of Northern railway. It is well
connected by road with Chand igarh (210 km),
Ludhiana (136 km), Faridkot (63 km) and Firozpur
(101 km). Its population as per 2001 Census is
1,183,295 persons.
64
It is also called Gobindgarh, because Guru Gobind Singh, the tenth Guru of the Sikhs, is said to have
stayed in the fort of Bathinda. A Gurudwara in the
memory of the Guru was also constructed here by Maharaja Narinder Singh of Patiala State.
The Rose Garden is today one of the attractive
spots in the town. It has been developed into a
beautiful picnic spot and is visited by a large number
of people.
There is also a traffic Park for the children situated
in the heart of the city.
At a distance of 6 km from Bathinda, there is a zoological park called 'Bir Talab Forest and Tourist
Complex.
The Guru Nanak Dev Thermal Plant at Bathinda
is another important landmark. Amongst the other big
industries in the town are the units of National
Fertilizt:rs Limited and a Milk Plant in the co-operative
sector.
There is a historic gurudwara known as Gurudwara Haj i Rattan named after Haji Rattan, a
sadhu who used to meditate here. It is also associated with the visits of Guru Nanak Dev, Guru Hargobind
and Guru Gobind Singh.
There are 3 colleges in the town, viz. Government
Rajindra College, Shri Sanatan Dharam Girls College,

ANALYTICAL NOTE
D.A.V. (Mata Gunwanti) College. Besides, there are 4 higher secondary schools. 6 high schools, 13 middle schools, 23 primary schools, 3 hospitals, I.T.B. Clinic, 10 dispensaries and 2 public libraries.
Goniana Mandi :
It is situated at a distance of 12 km from Bathinda on the Bathinda-Faridkot road. It falls on the Bathinda-Firozpur railway line. Its population as per 2001 Census is 12,813 persons.
. Goniana Mandi is well known for Tikana Bhai Jagta Ji, the dera (seat) of the seva Panthi Addan Shahi Sect. It is said that this sect pioneered by Bhai Ghanaia is an old and supreme institution similar to the International Red Cross Society. Bhai Ghanaia presented an ideal of selfless and unique service of offering drinking water to the friends and foes alike in the battle field. Guru Gobind Singh was much impressed by his service and blessed that his mission would be run after him.
Har Raipura (Bhokari) :
Har Raipura or Bhokari lies west of Bathinda on the Bathinda-Nathana road. It falls in the Bathinda tahsil and is about 19 km from the tahsil headquarters and about 5 km form Goniana Mandi.
Gurudwara Jand Sahib has been built here in the memory of Guru Har Rai's visit to this place. It is said that the Guru who was at that time staying at Kiratpur Sahib (district Rupnagar) had an intuition that the inhabitants of the village Bhokari remembered him. He went there and stayed for a few days under a Jand tree. The tree still stands in the premises of the gurudwara. The issueless women of the area come to this place and tie a thread around the tree with the hope that their desire will be fulfilled.
This place is also said to have been visited by Guru Gobind Singh. )
/ Jassi Bagwali :
Jassi Bagwali falls in Bathinda Tahsil and lies about 26 km. south of Bathinda on the BathindaDabwali road. The nearest town is Sangat which is II km. from the village.
Gurudwara Bagsar has been built here in the memory of Guru Gobind Singh who is said to have visited this place while on his way to Talwandi Sabo.
65
It is said that Guru Gobind Singh stayed here for ten days under a tree. It is also said that a small pond existed at this place. When Guru Gobind Singh riding on his horse crossed through this pond, the horse and the dark brown dress of Guru Gobind Singh became white. When asked by his followers, the guru told that it was a sacred tirath and had been visited by Lord Rama while fighting with Lav and Kush. The Guru further added that whosoever would take bath in this tank, all his sins would be washed.
A fair is held here on the first Magh (JanuaryFebruary) known as 'Maghi fair'. It lasts for three days. Besides, a fair is held on every Amavas. People in large numbers visit the place on these occasions and take bath in the sacred tank.
Maisar Khana :
Tllis village falls in tahsil Talwandi Sabo on the Ne~ Delhi-Bathinda-Firozpur railway line and is about 30 km from Bathinda, the district headquarters. It is connected with Maur Mandi, another town of the district and is about 10 km from this place.
About 500 years ago, a Sadhu who was Brahim by caste used to live in village Maisar Khan. He was a staunch follower of Lattan Wali, goddess ofKangra. Once he asked the people of the village to accompany him to pay homage to the goddess at Kangra. Some of the villagers accompainied him to the place and were so much impressed at the sight of the flames erupting in the temple that they prayed to the goddess for the appearance of similar flames in their own village. Next year, similar flames appeared at the spot in the village, where a temple was constructed by the villagers.
A fair is held here in September-October for one day in the memory of the Sadhu. On this day, offerings of Halwa and cash are made to the deity. Religious preachers give sermons to the people on the occasion.
Maur Mandi :
Situtated on Bathinda-Mansa road at a distance of 42 km from Bathinda, the district headquarters, Maur Mandi is a railway station on the FirozpurBathinda-New Delhi railway line. It falls in tahsil Talwandi Sabo whose headquarters are 18 km from here. It is well connected by road with the state

headquarters Chandigarh (187 km), Patiala (122 km)
and Talwandi Sabo (18 km). It has a class II Municipal
Committee. Its population as per 2001 Census is
27,543.
The town is said to have been founded by one
Maur, a Jat of Mann sub-caste. There exists a
gurudwara which is associated with the visit of Guru
Teg Bahadur, the ninth Guru of the Sikhs. It is said
that the Guru stayed here for a few days to get rid
the villagers of a ghost. A fair is held here on every
Amavas.
Mehma Sarja :
This village falls in Bathinda Tahsil and the nearest
town is Goniana Mandi which is 6 km. from this
place.
The historic Gurudwara Lakhi Jangal was built
in this village in the memory of Guru Nanak Dev
who is said to have recited Japji Sahib one lakh times
at this place. It is also said that Guru Hargobinq, Guru
Har Rai and Guru Gobind Singh, the 6th, 7th and 10th
Gurus, respectively, also visited this place.
A big fair is held here on Baisakhi day. Besides,
fairs are held on the occasion of Maghi and every
Puranmashi. People in large number visit the place
during these fairs and take a dip in the holy tank.
Patti Karam Chand (Mehraj) :
It falls in Rampura Phu[ Tahsil and is 5 km from
Rampura Phul, the tahsil headquarters.
A gurudwara called 'Gurudwara Gurusar' stands
here. It is associated with Guru Hargobind, the 6th
Guru of the Sikhs and his fight with the Muslim
Commander, Lalla Beg. A fair is held here (January
February) for one day which is attended by a large
number of people. People take bath in the holy tank
on this day.
Rampura Phul :
Headquarters of the tahsil and sub-division of the
same name, Rampura Phul is situated at a distance
of26 km from Bathinda, the district headquarters on
the Bathinda -Patiala road. It is also a railway station
on the Ambala-Bathinda railway line. It is a Class II
Municipal Committee. Its population as per 2001
Census is 44,665 persons.
66
DISTRICT CENSUS HANDBOOK: BATHINDA
Formerly, the town of Rampllra PhllJ was in
BarnaJa District of PEPSU. But in 1954, it was
transferred to Bathinda District. These are the twin
towns, Rampura and Phul, part of the town was
founded by Phul, an ancester of the Phulkian family,
in 1770 B.K. (A.D. 1827). Rampura was founded by
Rama, the son of Phul. These towns are now called
Rampura Phul. Phul was earlier a part of the Nabha
State. The Fort at Phul was constructed by Chaudhri
Phui. Even in 1904, there existed a Vernacular Middle
School at Phui. The town had, at that time, a garden
too.
The town is famous for the manufacture of ginning
blades, cotton thread and soap. The important
agricultural commodities are foodgrain, cotton and
oilseeds.
Talwandi Sabo :
Headquarters of the tahsil/sub-division of the
same name. Talwandi Sabo is situated at a distance
of 28 km from Bathinda on the Bathinda - Sardulgarh
road.
It is also popularly known as Damdama Sahib is
named after one Sahabo, a Gujar girl. It is said that
in 1149, it was inhabited by Hindu Gujars, who were
converted into Muslims during the reign of Sgamsh
ud-din IIIutmish and given forty -eight villages. Since
the head of Gujras did not have any male issue, his
daughter Sahabo became the head of these villages
and in this way the area came to be known as
Talwandi Sahabo, which is now called Talwandi Sabo.
It is also said that Guru Nanak Dev, the first Guru
of the Sikhs, came here during his Second Journey
(Udasi). The Guru blessed the place that one day it
will emerge as an important pilgrim center. There is
a SaroV<lr called Nanak Sar associated with guru
Nanak.
The pla~e is also said to have been visited by
Guru Teg Bahadur, the ninth Guru of the Sikhs. He
bowed before the raised mound and sat beneath it.
When asked about it by his followers, he said that
this place had been visited by the first Guru, and it
will be visited by the tenth Guru and develop as a
great tirath (pilgrim centre).
Talwandi Sabo is one of the five takhats of the
Sikhs. After his fierce battles with the Mughals at

ANALYTICAL NOTE
Anandpur, Chamkaur and Muktsar, Guru Gobind Singh retired to the jungles ofMalwa. Talwandi Sabo where the Guru took rest (dam) came to be known as damadama Sahib. The Guru stayed here for more than nine months. During this period, he redicated the Adi Granth, and made Damdama Sahib a centre for spreading his mission. He called the place Khalsa Da Takhat (throne of the Khalsa).
At Gurudwara Damdama Sahib, some sacred weapons of Guru Gobind Singh are preserved. Besides .Gurudwara Damdama Sahib, there are a number of gurudwaras in Talwandi Sabo su~h as Manji Sahib, Jand Sar, Mata Sahib Kaur and Mata Sundri, Ber Sahib etc.:
(xii)Scope of Village and Town Directory
Village Directory :
The "Village Directory" is one of the traditional compilations of the Census. It gives the list of villages, their location numbers, their area, population, number of households, amenities such as educational, medical, drinking water, post and telegraph, commercial and co-operative banks, agricultural non-agricultural and other credit societies, recreational and cultural facilities, communication, approach to village, nearest town with a distance, power- supply availability of newspaper and magazines, most important commodity manufactured and land use of each village.
, Village is a statutory recognized unit having a definite boundary and separate land records. In case, a complete village is treated as an outgrowth of urban agglomeration, data on amenities for that village, have not been given in the Village Directory but shown along with the urban component. The villages which are considered as a Census Town , the amenities data are shown in the Town Directory. For those
• villages which have partly merged in an outgrowth of U.A., the amenities data are shown in the Village Directory for that particular village.
The 'uninhabited' villages (villages with no population) have been indicated as such after furnishing details in columns 1 to 3 i.e., Serial number, Name of village & location code number and area of the village against column no. 4 to 18. The land use data for such villages are shown in col. 19 to 23.
67
Town Directory :
The Town Directory is presented for each town covering different aspects of urban life. Like 1991 census, in the present census also there are seven Statements included in the District Census Handbook for presentation of data. The seventh Statement relates to slums which was numbered as IV - A in 1991 Census. Statements I to VI contain data about growth, density, sex ratio, physical aspects of towns, communications, municipal finances, civic, medical, educational and other amenities and trade, commerce, Industry, Banking facilities etc.Hence the data for the towns of Bathinda has been presented in these six Statements. Similarly the seventh Statement presents the data for slums.
S~atement I shows status and growth history of the towns of Bathinda District. Column 2 in this Statement indicates class, name and civic administration status of a town (as in 2000). Class of the town indicated under this column has been introduced to facilitate the analysis of town directory data at the State/U.T. and at the national level. Column 6 presents area in Sq. kms. while Column 7 presents number of households including houseless households. Columns 8 to 18 give population and growth rate of towns since 1901. Column 19 presents density and Columns 20 to 22 present sex-ratio.
Statement II shows physical aspects and location of each town as in 1999. Column 2 shows the class, name Civic Status of Town. Columns 3 to 5 show the rainfall and maximum and minimum temperature. Columns 6 to 13 show the name and distance of State HQ, district HQ, Tahsil HQ, nearest city with a population of one lakh and more, nearest city with a population of five lakh and more, Railway Station, Bus facility and Navigable river/canal from town.
Statement ITI shows the municipal finance of the Towns of Bathinda District. The income and expenditure for the towns of Bathinda have been presented in this Statement.
Statement IV provides information for civic and other amenities available to the Town. This Statement presents general population as well as the scheduled castes/scheduled tribes population as per 2001 census under Columns 3, 4 and 5. Columns 6 to 20 present

data regarding road length, system of sewerage, number of latrines, method of disposal of night soil, protected water supply, fire fighting service, electric connections for domestic, industrial and commercial as well as road lighting (points) and others amenities.
Statement V gives information regarding medical, educational, recreational and cultural facilities available in the town. Population figures for 2001 census have also been presented for the towns of Bathinda which will facilitate in analyzing data on facilities available to the people. Data pertaining to medical facilities have been obtained from towns and shown under Columns 4 and 5. The information on educational facilities has been shown under Column 6-15.
68
DISTRICT CENSUS HANDBOOK: BATHINDA
This Statement also shows, number of working women's hostels, recreational and cultural facilities available in the town under Columns 16 to 20.
Statement VI presents information in respect of trade, commerce, industry and banking services in the town. Columns 3 to 8 indicate three most important commodities exported and manufactured in the Town. Information on number of banks available in the town has been presented under column 9 whereas Columns 10 and 11 show the number of agricultural and nonagricultural credit societies in the town.
Statement VII shows the civic amenities available to all the 6 towns having slums falling in the jurisdiction of Bathinda District.

Part -A VILLAGE AND TOWN DIRECTORY


VILLAGE DIRECTORY
Section-I
Village Directory
NOTE EXPLAINING THE ABBREVIATIONS USED IN THE VILLAGE DIRECTORY
The Village Directory format has 25 columns and the details given under each column are for the village are as follows :
Column 1 : Serial Number:
Self explanatory. All the villages within the CD Block are presented serially in the ascending order of their location code number.
Column 2 : Name and Location Code Number of village:
The name and location code number of the village , is shown against this column. This also includes the forest and uninhabited villages.
Column 3 : Area of the village :
The area of the villages in hectares is given. Wherever the area figures were not furnished by the concerned department, the column is left blank.
Column 4 : Total population :
The total population of the village as per 2001 Census is given against this column.
Column 5 : Number of households
The number of households as per 2001 Census is given in this column.
Amenities:
In column 6 to 23, availability in respect of different amenities such as education, medical, drinking water, post, telegraph, banks, credit societies, communication, power, approach road etc. in each village has been depicted with appropriate codes against the column concerned. Wherever the amenities are not available in the village, a dash (-) is shown in the column and next to it, in brackets, the distance in broad ranges viz. < 5 kms., 5-10 kms. and 10+ kms. of the nearest place where the facility
is available is given. Column wise details are given below:
Column 6 : Educational:
Classes upto class V are included in Primary School comprising nursery school, kindergarten school, Pre-basic school, pre-primary school and junior basic school.
Classes from VI to VIII are included in the middle school.
Classes from IX and X are included in High secondary school. Classes XI and XII are in;;,iuded in senior secondary school.
In case of composite schools like middle school with primary school or secondary school with middle school, these are also included in the number of primary and middle schools, respectively.
Accordingly any of the following types of institutions if exists within the village is shown as per codes given below :
(i) Primary School P
(ii) Middle School M
(iii) Secondary School S
(iv) Senior Secondary School PUC
{~) College C
(vi) Industrial School I
(vii) Training School Tr.
(viii) , Adult literaoy class/centre AC
(ix) Others (specify) e.g. Sanskrit 0 Pathshala, Senior basic school, Navodaya Vidya'laya, Makhtab, etc.
More than one institution of a type in the village is indicated by the number within brackets against the abbreviation, e.g. P (3), M (4), etc.

Column 7 : Medical :
Availability of medical facility within the village is indicated by following codes:
(i) Allopathic Hospital
Ayurvedic Hospital
Unani Hospital Homeopathic Hospital
(ii) Allopathic Dispensary
Ayurvedic Dispensary
Unani Dispensary
Homeopathic Dispensary
(iii) Maternity & Child Welfare
(iv) Maternity Home
(v) Child Welfare Centre
(vi) Health Centre
(vii) Primary Health Centre
(viii) Primary Health Sub-Centre
(ix) Family Welfare Centre
(x) T.B. Clinic
(xi) Nursing Home
(xii) Registered Private Medical
Practitioner
(xiii) Subsidised Medical
Practitioner
(xiv) Community Health Worker
(xv) Others
H
HA
HU H Hom
D
DA
DU
D Hom
MCW
MH
CWC
HC
PHC
PHS'
FWC
TB
NH
RMP
SMP
CHW
o More than one institution of a type in the village
is indicated by the number within brackets against the abbreviations, e.g. H(3), D(4), etc.
Column 8 : Drinking Water:
The type of drinking water supply sources available within the village is indicated by codes as
follows:
(i) Tap Water T
Oi) Well Water W
(iii) Tank Water TK
(iv) Tubewell Water TW
72
DISTRICT CENSUS HANDBOOK: BATHINDA
(v) Bandpump HP ~
(vi) River Water R
(vii) Canal C
(viii) Lake L
(ix) Spring S
(x) Others 0
(xi) Summer Source SS
Column 9 : Post, Telegraph and Telephone :
It is indicated by following codes:
(i) Post Office PO
(ii) Telegraph Office
(iii) Post & Telegraph Office
(iv) Telephone Connection
TO
PTO
PH
Column 10 : Commercial and Co-operative Banks :
If the village is served by any banking service, commercial bank, co-operative bank etc.the same is indicated in codes mentioned below along with the number of banks in brackets. If not available within the village, distance of the nearest place where the facility exists is given:
(i) Commercial Bank
(ii) Co-operative Bank
Column 11 : Credit Societies :
CM
CP
If the village enjoys the services of Credit Societies i.e. Agricultural Credit Societies, Non Agricultural Credit Society or Other Credit Societies, the same is indicated in codes mentioned below along with the number of such societies in brackets. In case the facility is not available within the village, the distance of the nearest place where such facility exists is given. I ';'-
(i)
(ii)
(iii)
Agricultural Credit Society ACS
Non-Agricultural Credit Society NCS
Other Credit Society . OCS
Column 12 : Recreational and cultural facilities:
If facilities such as CinemaiVideo hall, Sports Club, Stadium! Auditorium are available in the village, the same is recorded in these columns. Ifnot available,

VILLAGE DIRECTORY
the particulars of the nearest place with the facility exists is recorded. The information is indicated in codes mentioned below along with the number of such facilities in brackets :
(i) CinemalVideo Hall
(ii) Sports Club
(iii) Stadium! Auditorium
Column 13 : Communications:
CV
SP
ST
If the village is served by any mode of publici private transport like ,Bus, Railway station or Navigable water ways, they are to be mentioned as follows:
(i) Bus
(ii) Railway Station
(iii) Navigable Waterway
Column 14 : Approach to village: ~
BS
RS
NW
Approach to village refers to the state of road leading to village. The approach to the village is indicated in following codes:
(i) Paved Road PR
(ii) Mud road MR
(iii) Foot path FP
(iv) Navigable River NR
(v) Navigable Canal NC
(vi) Navigable waterways
other than River, Canal NW
Column 15 : Nearest Town and distance:
The distance is given in kilometers in brackets against the name of the town nearest to the village.
Column 16 : Power supply:
Availability of Power Supply in the village, whatever may be the form of its use, is given by using following codes:
(i) Electricity for domestic use
(ii) Electricity for agricultural use
(iii) Electricity for other purposes
(iv) Electricity for all purposes
ED
EAG
EO
EA
Column 17 : News PaperlMagazine :
If village receives any News Paper/Magazine the same is noted in this column using following codes:
(i) News Paper
(ii) Magazine
N
M
Column 18 : Most important commodities manufactured :
The name of three most important commodities manufactured in the village is recorded against this column.
Column 19 to 23 : Land use i.e. area under different types of land use :
73
Land use data maintained by the StatefUT Govts. are furnished against these columns. The data concerning area under Forest, Irrigated land (by source), Un:irrigated land, Culturable waste and Area not
r
available for cultivation in the village are shown against these columns. The area figures are given in hectare (s) up to one decimal. Desh '-' is recorded wherever the information is not made available by the concerned department. The codes used for different types of irrigation facilities available in the village are indicated below:
(i) Government Canal GC
(ii) Private Canal PC
(iii) Well (without electricity) W
(iv) Well (with electricity) WE
(v) Tubewell (without electricity) TW (vi) Tubewell (with electricity) TWE
(vii) Tank TK
(viii) River R
(ix) Lake L
(x) Waterfall WF . (xi) Others 0
(xii) Total T
The village directory also carries the following appendices.
Appendix-I It gives the abstract of educational, medical and other amenities available in villages CD Block wise of the district.

Appendix-I-A Indicates number of villages CD Block wise having one or more primary schools.
Appendix-I-B Indicates number of villages CD Blockwise having primary, middle and secondary schools.
Appendix-I-C Shows number of villages CD Block wise with different sources of drinking water facilities.
Appendix-II Indicates the list of villages with 5,000 and above population which do not have one or more important amenities.
Appendix-ll-A Indicates list of Census Towns which do not have one or more amenities.
Appendix-III It gives the land utilization data in respect of Census Towns/non-municipal Towns.
DISTRICT CENSUS HANDBOOK: BATHINDA
1\ppendix-IV CD Block wise list of inhabited villages where no amenity other than drinking water facility is available.
Appendix-V Summary showing number of villages not having Scheduled Castes population.
Appendix-VI Summary showing number of villages not having Scheduled Tribes population.
Appendix-VII A and B The appendices show the list of villages according to proportion of the Scheduled castes and Scheduled Tribes to the total population by ranges.
Appendix-VIII Indicates CD Block wise number of villages.
Appendix-IX Shows number of different types of girls schools in a village.
LIST OF VILLAGES TREATED AS TOWNS AT 2001 CENSUS
Serial No. Name of village'
2
Bhisiana
74
Status
of town
3
N.P.

Map of CD Block Phul


0 \-
BOUNDARY,DISTRICT TAHSIL
<\
C.D. BLOCK
G \ ,..
~ / 1'0
• 37iI
~ .' :174 • «C
is \. Q,
~ CO ;..;~
VILLAGE WITH P.L.C.NUMBER
T
r · \
. '. :m! \
PO
HEADQUARTERS: C.D.BLOCK . . .. .,
~
, 0 \
1 0l0Jll00) 1
• POPULATION SIZE CLASS OF VILLAGES:BELOW 200,200- 499,500-999,1000-4999,5000 AND ABOVE 0 ••••
UNINHABITED VILLAGE WITH P.L.C.NUMBER . . L-I ----''------'
STATE HIGHWAY. . .... . IMPORTANT METALLED ROAD , . . . , POST OFFICE/ TELEPHONE OFFICE/ POST AND TELEGRAPH OFFICE . . . SECONDARY OR SENIOR SECONDARY SCHOOL. PRIMARY HEALTH CENTRE . BANK
SH 16A
PO/ TO/ PTO S ~
B
Based upon Survey of India map wilh l he permission of the Surveyor General of India.
INDIA PUNJAB
CENSUS Of' INDIA.2001.
C.D. BLOCK PHUL TAHSIL RAMPURA PHUL
DISTRICT BATHINDA Km. I 0 I 2 3 4 5 6 Km.
I I 1
HEADQUARTERS OF CD. BLOCK PHUL ARE AT RAMPURA PHUL .
BOUNDARIES ARE UPDATED UPTO 1.1.2000.
TOTAL AREA OF CD. BLOCK (In Sq KID} 544.06
TOTAL POPULATION OF CD. BLOCK. 147,312 TOTAL NUMBER OF TOWNS IN CD. BLOCK NIL TOTAL NUMBER OF VILLAGES IN C.D. BLOCK . 46 DISTANCE FROM DISTRICT HEADQUARTERS (In Kms). 33
© Government or India Copyrighl.2005,


VILLAGE DIRECTORY
ALPHABETICAL LIST OF VILLAGES (CD. BLOCK WISE)
Name of the District : Bathinda
Serial Name of 2001 Census 1991 Census Serial Name of 2001 Census 1991 Census number village location location number village location location
code number code number code number code number 2 3 4 2 3 4
Name of CD Block: Phul (0001) 23 Hamirgarh 01037900 110010001000100014
Name of Tahsil: Rampura Phul (0001) 24 Harnam Singhwala 0 I 043600 110010001000100034
Adampura 01038500 110010001000100024 25 1alal 01038000 110010001000100013
2 Aklialalal 01037700 110010001000100016 26 Kangar 01038300 110010001000100022
3 Allike 01040000 110010001000100043 27 Kauloke 01039200 110010001000100011
4 Bhagta 01037100 110010001000100004 28 Kesar Singhwala 01037200 110010001000100003
29 Koer Singhwala 01037600 110010001000100020 5 Bhai Rupa 01038800 110010001000100028
30 Kotha Guru 01036700 110010001000100008 6 Bhodipura 01037300 110010001000100017
31 Maluka 01036600 110010001000100006 7 Bugran 01040200 110010001000100044
37'" Neor 01036500 110010001000100007 8 Burj Gill 01039300 110010001000100029
33 Patti Kala Mehraj 0 I 044000 110010001000100038 9 Burj Ladha
Singhwala 01037000 110010001000100002 34 Patti Karam Chand Mehraj 01042900 110010001000100039
10 Burj Mansa 01043400 110010001000100046 35 Patti Sandli
II Burj Thror 01036800 IIOOIOO~IOOOI00005 Mehraj 01043800 110010001000100036 12 Chotian 01040100 110010001000100045 36 Patti Saol Mehraj 01043900 110010001000100037
13 Dayalpura Mirza 01039000 110010001000100009 37 Phul (Rural) 01043500 110010001000100040
14 Dhapali 01039400 110010001000100033 38 Phulwal 01039700 110010001000100032
15 Dhingar 01039900 110010001000100041 39 Raiya Urf
16 Dulewala 01038700 110010001000100026 Hardaspura 01039800 110010001000100042
17 Dyalpura Bhaika 01038100 110010001000100027 40 Rajgarh 01038600 110010001000100025
18 Gaunspura 01038200 110010001000100021 41 Ramuwala 01037400 110010001000100018
19 Ghandawna 01039500 110010001000100030 42 Sadhana 01043700 110010001000100035
20 Gumti Kalan 01038900 110010001000100012 43 Salabatpura 01038400 110010001000100023
21 Gurusar 01037800 110010001000100015 44 Sandhu Khurd 01039600 110010001000100031
22 Hakam 45 Selbrah 01039100 110010001000100010
Singhwala 01037500 110010001000100019 46 Siriewala 01036900 110010001000100001
77

DISTRICT CENSUS HANDBOOK: BATHINDA
Census of India 2001 -
CD block Phul (0001) Amenities and
Amenities available (if not available within the village, a dash (-) is shown in the column and next to it in brackets the distance in broad ranges viz. < 5 kms., 5-10 kms. and 10+ kms ofthe nearest place
where the facility is ava:ilable is given)
~
~ '" '" ;l J2 1:: <> <> Vl 0 B r:: § '0 '0
~ <> Q.
8 u u ~ § Vl <> :> 0'
r:: ..c: '" <> <> "@ ~~ .2 r:: 0 r:: > u g " 0 0 .~ E! ..c: E E~ ta U C:!- ..c:
u <> Q. <> "3 o :> <> ~ 0
~ 0 '" <> Q. u ~ ~ '§ ~ i:
....:l 0 '0 ~ 9 'r: CIl
C:!- o E! > .': :> <> Od .;; ..c: '0 0 l?J'.~ _ '0 Sct1
§ u C: !) :l O! :l
~ <> r:: <> ;g ~. V> '0 U E -< -5 0 :> .._
§ 0'-
.... .~ 0 ~ ..c: r:: g ~~E o c
<> '- ..c: go • Vl '.g .9 ~ .;; 0 "3 '- til OJ til e·,: cd .- =' E d Q. 0 r:: ~ 51 .~ r:: u·- ,~ !! :l '- <> 0 .... 0 bO <> :>'0 0~'O r:: Vl c:: 0 til Q. 2 .~ til c:: ~ E .=:: ~ .~.~ ~ g ~ ] <> U :Q :> u
§ Jg Jg E u :a U .... ~.~ " :> c _- E 'C <l) E ~
'" u::..c
<> 0 0 :> '0 <> .;:: 0 0 bO-5 <> U :> 0:;::
>Q Z t: t: Z IJ.l ~ Cl 0- !;.i ~ Q ~<!Su U ~ 2 3 4 5 6 7 8 9 10 II 12 J3
Tahsil: Rampura Phul (0001)
I Neor 515.0 1,738 291 PM PHS H(5-10) THP PH(35) OCS BS (01036500) C(lO+) MCW«5) SS-T PO(lO+) CM(5-10) ACS« 5) CV«5) RS(5-10)
PHC«5) CP«5) NCS« 5) SP(lO+) NW(IO+) ST(lO+)
2 Maluka 2,093.0 6,069 1,036 P(3) HDMH THP PO CP ACS BS (01036600) M(2) S CWCHC SS-T PH(125) CM(5-10) NCSOCS CV« 5) RS«5)
1(4) AC MCW(5,_I0) SP(lO+) NW(lO+) C(lO+) PHC(5-10) ST(IO+)
3 KothaGuru 3,078.0 8,915 1,544 P(4) M(2) CWC HC THP PO CM ACS SPST BS (01036700) S(2) FWCRMP SS-T PH(65) CP(S-IO) NCS OCS CV«5) RS(5-10)
C(1O+) CHW H(5-IO) NW(lO+) MCW(S-IO) PHC(5-10)
4 Bury Thror 331.0 1,477 243 PM HC H« 5) THP PH(42) ACS BS (01036800) C(IO+) MCW« 5) SS-T PO« 5) CM« 5) OCS CV« 5) RS(lO+)
PHC«5) CP«5) NCS(5-10) SP(IO+) NW(lO+) ST(lO+)
5 Siriewala 1,295.0 4,675 755 PMS PHSH(5-10) THP PO ACS BS (01036900) C(IO+) MCW« 5) SS-T PH(120) CM(5-10) NCSOCS CV«5) RS(IO+)
PHC«5) CP(5-10) SP(IO+) NW(lO+) ST(5-10)
6 Burj Ladha 608.0 1,936 332 PM RMP H(5-10) THP PH(70) OCS BS
Singhwala C(lO+) MCW(S-IO) SS-T PO«5) CM(5-10) ACS« 5) CV«5) RS(IO+)
(01037000) PHC(5-1O) CP(5-10) NCS« 5) SP(IO+) NW(IO+) ST(5-10)
7 Bhagta 2,163.0 11,809 2,038 P(6) M(3) MCW MH THP PO CM(2)CP ACS SP ST BS
(01037100) S PUC CWCPHC SS-T PH(125) NCS OCS CV« 5) RS(IO+) C(lO+) FWCNHRMP NW(lO+)
H(5-10)
8 Kesar 401.0 1,235 208 P(2) M S CHW H(5-10) THP PH(61) ACSOCS BS
Singhwala 1 C(10+) MCW(5-10) SS-T PO« 5) CM(5-10) NCS«5) CV« 5) RS(IO+)
(01037200) PHC(5-10) &(5-10) SP(IO+) NW(lO+) ST(5-10)
9 Bhodipura 1,019.0 3,179 537 P(2) M S DDHMCWMH THP PH(93) OCS SP BS
(01037300) PUC CWCHCPHC SS-T PO«5) CM(S-IO) ACS« 5) CV«5) RS(IO+)
C(lO+) PHS FWCTB CP(5-10) NCS(IO+) ST(IO+) NW(lO+)
H(lO+)
10 Ramuwala 468.0 1,585 262 PM AC DCWC HC THP PO OCS BS
(01037400) C(lO+) CHWH(IO+) TW PH(45) CM(S-IO) ACS« 5) CV«5) RS(IO+)
MCW(5-10) SS-T CP(5-10) NCS(IO+) SP(IO+) NW(IO+)
PHC(5-10) ST(IO+)
78

VILLAGE DIRECTORY
Village Directory
Land Use (As on 1999)
Land use (i.e. area under different types ofland use in hectare)
."" § a u
] ..c:: c ."" u 0 0
" U til .~
C e, OJ)
c OJ) ;.- 0 'p .~
8 u :a .5 ;; u .5 0 ."" u 0
~ § " t;j "0 ... -.....l
u .., <8 ~ :a gp 0 u e- u
o(j u ....
::E " :g ~ ~ o(j
~] ~ ~ c ;., .._ ';l ~ ... S ;!: Ci. ... € il;
u ., o ... ."" iU '> or>
g B p.. ~ p.. .g, ., ., E
" 'O! .... - '" .§ ~ ."" :i3,...._ '0 " '" p..
~ OJ) 0 c e 0) ...
'" 'iii 'E e '" c ., a ~ - :; a ~ til OJ p.. il; cs § ~ OJ) § p.. 0) 0 ., ] '2 - 0
., ·c ~ z; z ~ 5 0
~ " ... ~ .,
e" !*. I.! OJ) Z C/l
14 15 16 17 18 19 20 21 22 23 2 .,_
PR Rampura EA NM GC(357.0) 86.0 40.0 Neor Phul (8) TW(lIO) (01036500)
TWE(210) T(389.0)
PR Rampura EA NM GC(1485.0) 81.0 202.0 Maluka 2 Phul (12) TW(l65.0) (01036600)
TWE(160.0) T(181O 0)
PR Rampura EA NM GC(2331.0) 49.0 65.0 286.0 KothaGuru 3 Phul (27) TW(l97.0) (01036700)
TWE(150.0) T(2678.0)
PR Rampura EA NM GC(I72.0) 9.0 37.0 Burj Thror 4 Phul (8) TW(410) (01036800)
TWE(72.0) T(285.0)
PR Rampura EA NM GC(771.0) 145.0 95.0 Siriewala 5 Phul (2) TW(142.0) (01036900)
TWE(142.0) T(l055.0)
PR Rampura EA NM GC(156.0) 16.0 310 Burj Ladha 6 Phul (7) TWE(405.0) Singhwala
T(5610) (01037000)
PR Rampura EA NM TW(915.0) 274.0 Bhagta 7 Phul (20) TWE(974.0) (01037100)
T(1889.0)
PR Jaitu (16) EA NM Wheat, GC(124.0) 37.0 28.0 92.0 Kesar 8 Rice, TWE(1:20.0) Singhwala
Cotton T(244.0) (01037200)
PR Rampura EA NM GC(584.0) 6.0 45.0 Bhodipura 9
Phul (16) TWE(384.0) (01037300)
T(9680)
PR Rampura EA NM GC(327.0) 4.0 40.0 Ramuwala 10
Phul (22) TW(23.0) (01037400) TWE(74.0) T(424.0)
79
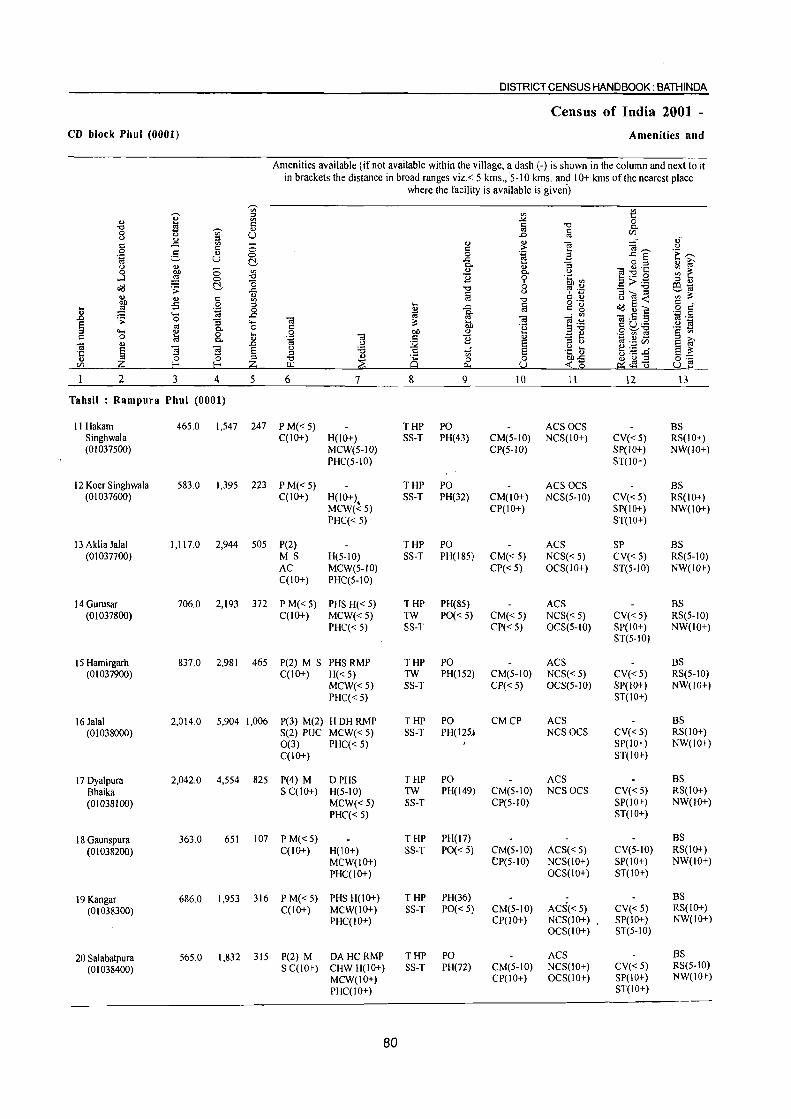
DISTRICT CENSUS HANDBOOK: BATHINDA
Census of India 2001 -
CD block Phul (0001) Amenities and
Amenities available (if not available within the village, a dash (-) is shown in the column and next to it in brackets the distance in broad ranges viz.< S kms.,·S-IO kms. and 10+ kms of the nearest place
where the facility is available is given)
~
~ '" ~ 51 '" OJ
OJ .>c: 0 ~ <= § "0 "0 ~ 0) 0.
8 t) '" U .0 § VJ 0) :> 0)"
<= ..<:: '" 0) 0) til =a~ u 0 §
<= 0 c > a ·E~ 'i 0) 0 0 .~ ..c E u !::!, ..<::
0) iO' u 0) - C- O) :i o :> 0 ,g 0 '"
0) C- u e ~'§ ~ ~ ...l 0 "0 11 9 .~ ~ "0 a >.<: :> 0)
o(! .;;; !::!, ..<:: "0 0 C? ';:; _ "0
6~ § u :> O! :> <!) <!) c 0) c 0) Vl ;l:
Vl "0 u E ~ ~ -s .9 :> ... §
0·- <= ... _g M ..<:: c g a'd OJ ] o c"
..8 ~ ..... til ~ ~.~ til .s ·i·9 0 til til E '"3 ..... ;l: c u·- .S:! E os C- o c '§ :>""
0 ____ "0 :> .....
~ 0 ... 0 OIl .£ ~ ~ ._ VI c:$ C '"
C 0 0. 0) .~ til <= .Y 0)
- OJ- :> >. til <!) .0 ~ :Q E :> u os ._ VJ
~ ~ § 3 3 E u .5 tf E .~ ~ ~.1:: <-
·c :> u;.:.c OJ 0 0 :> "0 OJ
Ci 0 0 0Jl;S OJ 0 :> 0'"= VJ 6 ~ ~ 6 U.l ~ Q, S,J :"l: Q ~~u U ~
2 3 4 S 6 7 & 9 10 II 12 13
Tahsil : Rampura Phul (0001)
II Hakam 465.0 1,547 247 P M« 5) THP PO AC50C5 B5 5inghwala C(lO+) H(lO+) 55-T PH(43) CM(5-10) NC5(10+) CV«5) R5(lO+) (01037500) MCW(5-10) CP(5-10) SP(lO+) NW(IO+)
PHC(5-10) 5T(IO+)
12 Koer Singhwala 583.0 1,395 223 P M« 5) THP PO ACS OCS BS (01037600) C(lO+) H(lO+) SS-T PH(32) CM(IO+) NC5(5-10) CV«5) RS(IO+)
MCW(~5) CP(IO+) SP(IO+) NW(IO+) PHC« 5) ST(IO+)
13 Aklia Jalal 1,117.0 2,944 505 P(2) THP PO ACS SP BS (01037700) MS H(5-10) SS-T PH(l85) CM« 5) NCS« 5) CV« 5) R5(5-10)
AC MCW(5-10) CP« 5) OC5(10+) ST(5-1O) NW(10+) C(10+) PHC(5-10)
14 Gurusar 706.0 2,193 372 P M«5) PHSH«5) THP PH(85) ACS BS (01037800) C(IO+) MCW«5) TW PO« 5) CM« 5) NCS« 5) CV«5) RS(5-1O)
PHC« 5) SS-T CP«5) OC5(5-10) SP(10+) NW(IO+) ST(5-10)
15 Hamirgarh 837.0 2,981 465 P(2) M S PHSRMP THP PO ACS BS (01037900) C(IO+) H« 5) TW PH(l52) CM(5-10) NCS« 5) CV«5) RS(5-1O)
MCW«5) SS-T CP«5) OCS(5-1O) SP(IO+) NW(IO+) PHC« 5) ST(lO+)
16 Jalal 2,014.0 5,904 1,006 P(3) M(2) H DH RMP T HP PO CMCP ACS BS (01038000) S(2) PUC MCW« 5) SS-T PH(125.) NC50CS CV« 5) RS(IO+)
0(3) PHC« 5) SP(lO+) NW(IO+) C(lO+) ST(lO+)
17 Dyalpura 2,042.0 4,554 825 P(4) M DPH5 THP PO AC5 BS Bhaika 5 C(lO+) H(5-10) TW PH(149) CM(5-10) NCSOC5 CV« 5) RS(IO+) (01038100) MCW«5) 55-T CP(5-1O) 5P(IO+) NW(IO+)
PHC« 5) ST(IO+)
18 Gaunspura 363.0 651 107 P M« 5) THP PH(17) BS
(01038200) C(IO+) H(10+) S5-T PO«5) CM(5-10) AC5« 5) CV(5-10) RS(IO+) MCW(lO+) CP(5-iO) NCS(IO+) SP(lO+) NW(lO+) PHC(IO+) OCS(IO+) 5T(10+)
19 Kangar 686.0 1,953 316 P M«5) PHS H(IO+) THP PH(36) BS
(01038300) C(lO+) MCW(IO+) SS-T PO« 5) CM(5-10) ACS«5) CV«5) RS(lO+) PHC(IO+) CP(IO+) NCS(lO+) SP(IO+) NW(lO+)
OCS(IO+) ST(5-10)
20 Salabatpura 565.0 1,832 315 P(2) M DAHC RMP THP PO ACS BS
(01038400) S C(10+) CHW H(IO+) SS-T PH(72) CM(5-10) NCS(lO+) CV« 5) R5(5-10)
MCW(IO+) CP(10+) OCS(10+) SP(IO+) NW(IO+)
PHC(IO+) ST(10+)
80

VILLAGE DIRECTORY
Village Directory
Land Use (As on 1999)
Land use (i.e. area under different types o( land use in hectare)
"0
a a <>
E ..c c "0 0 0 0 ::l 0
-"= " .~
~ b1) c
.q b1) ·E 0 c .~
8 .., 't:l 'B "3 0 .5 0 0 0 a E ::l t;j U
... ....l <> t; E ~ <E <> 2- Oi:! ~ 'B gp 0 0 ...
:::! 0 :; :c ~ .;; Oi:! ~-g
0 B " c ~ VI ~ 'a ~ ...
.9 :l: ... ;.., il= <> 0.. ... o ... e "0 ~
.;; .J:> ..c .9 0..
~ 0..-8 <> ... E
~ ::s "0 til ~';;;' g .... ::s - VI ,§ 43 '" .. 0..
~ ,~ 0 c e ~ VI - .., .., _ ::s VI t:: B ~ -a 0.. :l: :l:
~ ~ ~ bl) " § 0.. .., 0
.., 0 ] '2 - 0 ~
'I::
< Z p., Z ::J ::s ... Z <> fl- o bI) IZl
14 15 16 17 18 19 20 21 22 23 2
PR Rampura EA NM GC(3150) 27.0 11.0 Hakam II Phul (21) TWE(112.0) Singhwala
T(427.0) (01037500)
PR Rampura EA NM GC(488.0) 30.0 10.0 Koer Singhwala 12 Phul (19) TWE(55.0) (01037600)
T(543.0)
PR Rampura EA NM GC(284.0) 147.0 2.0 66.0 Aklia Jalal 13 Phul (19) TWE(618.0) (01037700)
T(9020)
PR Rampura EA NM GC(358.0) 14.0 77.0 Gurusar 14 Phul (18) TWE(257.0) (01037800)
T(615.0)
PR Rampura EA NM GC(430.0) 46.0 62.0 Hamirgarh 15 Phul (22) TWE(299.0) (01037900)
T(729.0)
PR Rampura Phul EA NM GC(218.0);.- 688.0 488.0 Jalal 16 (19) TW(402.0) (01038000)
TWE(218.0) T(838.0)
PR Bhadaur (24) EA NM GC(541.0) 1323.0 77.0 101.0 Dyalpura 17 T(54 1.0) Bhaika
(01038100)
PR Rampura Phul EA NM GC(49.0) 96.0 18.0 Gaunspura 18
(30) TW(108.0) (01038200) TWE(92.0) T(249.0)
PR Rampura Phul EA NM GC(264.0) 136.0 17.0 730 Kangar 19
(3) TW(85.0) (01038300) TWE(I I 1.0) T(460.0)
PR Rampura Phul EA NM GC(246.0) 23.0 61.0 Salabatpura 20
(3) TW(l33.0) (01038400) TWE(102.0) T(481.0)
81

DISTRICT CENSUS HANDBOOK: BATHINDA
Census of India 2001 -
CD block Phul (0001) Amenities and
Amenities available (ifnot available within the village, a dash (-) is shown in the column and next to it in brackets the distance in broad ranges viz.< 5 kms., 5-10 kms. and 10+ kms of the nearest place
where the fucilily is available is given)
'"""' '"' '" '" t: :::l .. ~ '" -'" 0 c C '0 '0 !:! '"""' .. ,. ·c C-
o u '" U ~ ,. VJ u '" :::l
<Ll " C ..c: '" <Ll e OJ,...., u .9
c 0 c oS 'E ~ .5 <Ll 0 0 a .c E 'i;j '-' u c:!- ..c: E :; o :::l <Ll ;... U ~
C-" e~ .§ '" ,.
0 0 '" ~ C- .>! '" ~ ...J :§ 0 "" ~ 9 6b~ :::l ..
a:d c:!- o 0 B> .-= tIl_ .;;: .c "<:) ~ ''::: _ '0
'-' ,. u a OJ -< " c 1;l c C <Ll '" ;l: " ,. "" "" -s 0 :::l .... C
o ._
~~E ,9 c .... ~ .~ 0 ~ ..c: ,. C g " .... ..c '"
C- ...r'" _ 0
~ .;;: 0 OJ f OJ '" ._ :; .... ;l: £! .-= =._ ::s .>! E E
~ 0 C "" .~ C u·_ ..... c. aas 0,-,"" :::l 0 .... .9 OJ "" " .~ -2 ~ C '" C 0 " C B " - .... e ~ "
,. C-~ 'i;j u :;.;; E :::l u
~ E 'E ] E u ~ ..:- E .g ~ ~a .ci' E ;l: :::l '2 Vl <Ll
,. ~ 0 :::l "" " & 0 ""-5 " U :::l o~
VJ 6; C: 6; w ~ Cl U ~ Q O::<f'l";;1 ~ ~
2 3 4 5 6 7 8 9 10 II 12 13
Tahsil: Rampura Phul (0001)
21 Adampura 586.0 1,917 317 P(2) M PHSRMP THP PH(45) ACS BS (01038500) S C(10+) H« 5) SS-T PO« 5) CM(5-10) OCS CV«5) RS(lO+)
MCW(lO+) CP(5-lO) NCS(5-10) SP(lO+) NW(IO+) PHC(IO+) ST(5-10)
22 Rajgarh 667.0 1,554 251 PM PHS H« 5) THP PH(80) BS (01038600) C(IO+) MCW(IO+) SS-T PO« 5) CM(5-10) ACS« 5) CV« 5) RS(10+)
PHC(lO+) CP(lO+) NCS(5-10) SP(10+) NW(IO+) OCS(5-10) ST(IO+)
23 Dulewala 640.0 2,231 376 PM PHS H« 5) THP PH(48) ACS BS (01038700) C(IO+) MCW(1O+) SS-T PO«5) CM(IO+) NCS« 5) CV« 5) RS(IO+)
PHC(IO+) CP(lO+) OCS(5-10) SP(10+) NW(IO+) ST(5-10)
24 Bhai Rupa 4,567.0 13,294 2,232 P(5) MCWPHC THP PO CM CP(lO+) ACS SPST BS (01038800) M(3) H(lO+) SS-T PH(250) NCSOCS CV«5) RS(10+)
S(2) PUC NW(lO+) C(5-10)
25 Gumti Kalan 2,025.0 5,367 854 P(3) DDACWC THP PO ACS BS (01038900) M(2) H(IO+) TW PH(l25) CM«5) NCSOCS CV«5) RS(5-IO)
S C(1O+) MCW(5-10) SS-T CP« 5) SP(lO+) NW(IO+) PHC(5-10) ST(IO+)
26 Dayalpura 2,162.0 4,609 832 P(2) HADMH THP PO ACS BS Mirza M S CWCHC TW PH(l27) CM(lO+) NCSOCS CV«5) RS(IO+) (01039000) C(IO+) H(5-10) SS-T CP(5-1O) SP(IO+) NW(IO+)
MCW(5-10) ST(IO+) PHC(5-10)
.~
27 Selbrah 1,539.0 4,637 801 P(2) HC RMP(2) THP PO CM ACS SP BS (01039100) MS H(lO+) TW PH(120) CP« 5) NCS CV«5) RS(IO+)
PUC I MCW«5) SS-T OCS(2) ST(IO+) NW(IO+) Tr C(5-10) PHC« 5)
28 Kauloke 353.0 876 159 PM«5) THP PO ACS BS
(01039200) C(5-IO) H(lO+) TW PH(30) CM(5-10) NCS« 5) CV(5-10) RS(IO+) MCW«5) SS-T CP« 5) OCS(5-10) SP(IO+) NW(IO+) PHC« 5) ST(IO+)
29Burj Gill 528.0 2,127 388 PM PHS RMP THP PH(55) ACS SP BS
(01039300) C(5-10) H(lO+) TW PO(5·10) CM(5·10) NCS« 5) CV«5) RS(5-10)
MCW«5) SS-T CP(lO+) OCS(5·10) ST(5-10) NW(lO+)
PHC« 5)
30 Dhapali 2,485.0 5,654 927 P(2) M HADMCW THP PO CMCP ACS SP BS
(01039400) S C«5) MHPHC SS-T PH(125) NCS OCS CV«5) RS(5·10)
H(lO+) ST(IO+) NW(IO+)
82

VILLAGE DIRECTORY
Village Directory
Land Use (As on 1999)
Land use (i.e. area under different types ofland use in hectare)
"0
!a la " E
..<:: c "0 <.)
0 0
'" <.) .><: .. .~ c: ~
bI)
~ bI) > 0 .+:: °i
8 c: :;
" :a <.)
c: 0 <.) 0
~ E '" .~ "0 ... ....l
~ ~ ~ .,
2- cE: Od :a ~ " Od ~
~"O '" ~ :c ~ .. s; 0 ..
c: >. ...... VI
~ ,g ... .9 ~ Q. ... ~ >. ~ " "0 > .s; .0
.9 Q. " ~~, e E ..c: g- " ., .. ~
::I "0 'O! ~V> g ..... ::I 'Vi '" c:..
~ '6 0 c: e ~
.... til
._ .... 'Vi " c:.. ~ ~ '§ ~ ~ CIl a ~ .. § O!
c:.. " ~ z 0 '6 '2 - 0 ~ '1:
<: z :::E E ;:? '" .... z " f,!., ..., CJ on <n
14 15 16 17 18 19 20 21 22 23 2
PR Bhadaur(7) EA NM GC(141.0) ',.. 12.0 46.0 Adampura 21 TW(l210) , (01038500) TWE(266.0) T(528.0)
PR Rampura Phul EA NM GC(344.0) 5.0 59.0 Rajgarh 22 (29) TW(1700) (01038600)
TWE(89.0) T(603.0)
PR Rampura Phul EA NM GC(285.0) 50.0 53.0 Dulewala 23 (26) TW(132,0) (01038700)
TWE(1200) T(537,0)
PR Rampura Phul EA NM GC(2205,0) 496,0 25,0 362,0 Bhai Rupa 24 (12) TW(986,0) (01038800)
TWE(4930) T(3684,0)
PR Rampura Phul EA NM GC(279 ,0) 55,0 139.0 Gumti Kalan 25 (IS) TW(82 1.0) (01038900)
TWE(7310) T(l831.0)
PR Bhadaur (13) EA NM GC(783.0) 242.0 24.0 153.0 Dayalpura 26 TW(540.0) Mirza TWE(420.0) (01039000) T(1743.0)
PR Rampura Phul EA NM GC(856,0) 320.0 40.0 Selbrah 27
(8) TW(268.0) (01039100) TWE(55.0) T(1l79.0)
PR Rampura Phul EA N • Wheat GC(I710) 73.0 25.0 Kauloke 28
(6) TW(84.0) (01039200)
T(255 9)
PR Rampura Phul EA NM GC(1880) 10.0 BUlj Gill 29
(10) TW(285.0) (01039300)
TWE(45.0) T(518.0)
PR Rampura Phul EA NM GC(1238.0) 8.0 2310 Ohapali 30
(5) TW(478.0) (01039400)
TWE(5300) T(2246.0)
83

DISTRICT CENSUS HANDBOOK: BATHINDA
Census of India 2001 -
CD block Phul (0001) Amenities and
Amenities available (if not available within the village, a dash (-) is shown in the column and next to it in brackets the distance in broad ranges viz.< 5 kms., 5-10 kms. and 10+ kms of the nearest place
where the facility is available is given) .,.. -;;;-
~ '0 '" '" ., '" ..>: 0 '0 ~
c g '0 Co
8 -;;;- ., !a C/)
II '" U .0 .;-
C Vl ;:; ., <l) ""§ =a~ 0 c c ,.. ()
.~ 3 '" 0 0 .~ .: .c E 't ~ u t!, ..c 0 <l) Co :; o ::: OJ ~
OJ <l) 0; ~·c :;: ~ 0
:W 0 Vl Co ()
....l 0 '0 ] 9 ·c V) """,._ 0
"0 .: >.<;:: ::: <l)
~ .;;: t!, ..c "0 8 ~.g _ '0 001;; <l) § '" O! ::: ';;'~
~ <l) c Vl '0 c: 0 o E --< .,s 0 '" ... o ._ c: .... .!!1 .~ 0 OJ ..c g c: g ~o] o d' 0
~ .... ..c 1;; ~ - Vl 0; .5
._ 0 .0 0 0; 0; ca.~
;;._ E :; .... ~ c: U ._ .~ IS .. 0 c: bll '0 ~'O '" .... 0 Co .... .9 01) 0 .... .9 'V)-g c: '" c: 0 ~ 0
0 0; ] ] ~
;: ~ -0-
~f Co 1;; u .§ ~ ~:.e (/)" 0; 0 .0
§ ]i ]i E u 'i3 .t:: ::: .5 ~ .... 0 (,):-=..0 0 0 0 '" "t:) 0
Q 0 0 bll;S o () ::: o·_ !Q 6, != ~ 6, b!l ~ "" 1.2 :;: Q i=<:~11 1.2?:
2 3 4 5 6 7 8 9 10 II 12 13
Tahsil : Rampura Phul (0001)
31 Ghandawna 837.0 2,569 433 P(2) M(2) HH D DH THP PO PH(45) ACS SP BS (01039500) S PUC H(lO+) TW CM{5-10) NCS{< 5) CV{< 5) RS{5-10)
C(S-IO) MCW{5-10) SS-T CP(5-10) OCS(5-10) ST(lO+) NW(lO+) PHC(5-1O)
32 Sandhu Khurd 424.0 1,388 234 P(2) D H(lO+) THP PH(60) BS (01039600) M«5) MCW(5,10) TW PO«5) CM(5-10) ACS{< 5) CV{<5) RS(IO+)
C(IO+) PHC{5-10) SS-T CP(lO+) NCS{< 5) SP(lO+) NW(lO+) OCS{5-IO) ST(lO+)
33 Phulwal 657.0 1,924 337 P(2) PHS H{5-IO) THP PH(75) ACS BS (01039700) M{<5) MCW(5-10) TW PO«5) CM«5) NCS{< 5) CV«5) RS(IO+)
C(5-10) PHC{5-1O) SS-T CP{<5) OCS{5-IO) SP(IO+) NW(10+) ST{5-IO)
34 Raiya Urf 1,399.0 4,053 6S7 P(3) M DCWCHC THP PO ACS NCS SP CV« 5) BS Hardaspura S C(IO+) CHW H{5-10) TW SS- PH(l20) CM(5-10) OCS{5-10) SI(5-10) RS(lO+) (01039800) MCW(5-10) T CP« 5) NW(IO+)
PHC{S-IO)
35 Dhingar 385.0 1,379 207 PM PHS H(5-10) THP PO ACS BS (01039900) C(S-IO) MCW{5-10) SS-T PH(20) CM«5) NCS(5-10) CV«5) RS(IO+)
PHC(5-1O) CP« 5) OCS(5-10) SP(lO+) NW(lO+) ST(IO+)
36 Allike 604.0 2,057 367 P(2) M DA H{5-10) THP PO BS (01040000) S C(lO+) MCW(S-IO) SS-T PH(lO) CM(S-IO) ACS(S-IO) CV« S) RS(IO+)
PHC{5-1O) CP(S-IO) NCS(lO+) SP(IO+) NW(lO+) OCS(lO+) SI(S-IO)
37 Chotian 409.0 1,625 27S PM« 5) PHS H(5-10) THP PH(76) BS (01040100) C(5-10) MCW(5-10) TW PO« 5) CM(5-10) ACS(S-IO) CV«S) RS(5-1O)
PHC{5-lO) SS-T CP(5-lO) NCS(5-10) SP(lO+) NW(lO+) OCS(S-IO) ST(lO+)
38 Bugran 490.0 1,836 317 PM PHSRMP THP PH(90) ACSOCS BS
(01040200) C(5-10) H(lO+) SS-T PO«5) CM«5) NCS(5-1O) CV« 5) RS(lO+)
MCW(IO+) cI>(IO+) SP(lO+) NW(10+)
PHC(IO+) SI(10+}
39 Patti Karam 2,163.0 5,334 939 P( 4) M(2) MH PHS FWC THP PO ACS NCS OCS SP BS
Chand Mehraj S(2) PUC CHW H« 5} TW PH(125) CM« 5) CV« 5} RS(5-10)
(01042900) C« 5) MCW(5-10) SS-T .~ CP(5-1O) ST(lO+) NW(10+)
PHC(5-10)
40Burj Mansa 294.0 991 17S PM« 5) PHS H« 5) THP PH(70) SP BS
(010434oo) C« 5) MCW{5-10) TW PO« 5) CM« 5) ACS{< 5) CV(IO+) RS(S-IO)
PHC(5-10) 8S-1 CP« 5) NCS«5) SI(10+) NW(lO+) OCS(5-10)
84

VILLAGE DIRECTORY
Village Directory
Land Use (As on 1999)
Land use (i.e. area under different types ofland use in hectare)
." § a " ]: .c c: ." 0 8 ::> 0 d .~ c: g bO
0 bO i 0
8 :;:; c .~
" 0 :;:; 0
~ .5 e ::> 0
t:3 Q ... .....l
" e ~ <B " 5 Od 1 :;:; ~ 0 ~ " 0
Od 2 ~13
is ~ ~ " .;;: bO C .Q - Vl ';i ::§ ...
g ,.., " i3: 0. ... i3: .0
" 8.2 e ." ~ .;;:
.c g 0. 0. 0 .., e ~
::l d e.g ." 1;; ~~ 8 .... ::l ~ Vl 0.
%1 bO 0 '" e ... ._ "" -~ " Vl
_ ::l Vl 'E 2 ~ " OJ 0. i3: i3: ~ tii ~ bO d
~ 0. " 0 " 0 'E 'c - 0 ~ .t::
:( z p.., z :; e f!, ;:J ::> ... Z " ,_, o bO V)
14 15 16 17 18 19 20 21 22 23 2
PR Bhadaur (12) EA NM GC(4840) 38.0 Ghandawna 31 TW(2470) (01039500) TWE(68.0) T(799.0)
PR Bhadaur (II) EA NM GC(350.0) 27.0 15.0 Sandhu Khurd 32 TW(12.0) (01039600) TWE(20.0) T(382.0)
PR Rampura Phul EA NM GC(SS2.0) 6.0 Phulwal 33 (15) TW(IO.O) .,.. (01039700)
TWE(89.0') T(6SI.0)
PR Rampura Phul EA NM Wheat, GC(613.0) 9.0 IIS.O 148.0 Raiya Urf 34 (7) Cattle TW(219.0) Hardaspura
Feed, TWE(29S.0) (01039800) Desi Ghee T(II27.0)
PR Rampura Phul EA NM Wheat, GC(352.0) 9.0 Dhingar 35 (8) Gur TW(21.0) (01039900)
TWE(30) T(376.0)
PR Tappa (8) EA NM Cloth, GC(433.0) 17.0 1.0 76.0 Allike 36 Cloth, TW(62.0) (01040000) Cloth TWE(15.0)
T(Sto.O)
PR Rampura Phul EA NM GC(287.0) 3.0 15.0 18.0 Chotian 37 (6) TW(34.0) (01040100)
TWE(52.0) T(373.0)
PR Rampura Phul EA NM GC(200.0) 21.0 48.0 Bugran 38
(3) TW(86.0) (01040200) TWE(I35.0) T(42 1.0)
PR Rampura Phul EA NM Bricks GC(129S.0) 42.0 157.0 285.0 Patti Karam 39
(7) TW(234.0) Chand Mehraj TWE(lSO.O) (01042900) T(1679.0)
PR Rampura Phul EA NM Bricks GC(1570) 1.0 21.0 Bud Mansa 40
(I) TW(40.0) (01043400) TWE(75.0) T(272.0)
85

DISTRICT CENSUS HANDBOOK: BATHINDA
Census of India 2001 -
CD block Phul (OOOI) Amenities and
Amenities available (if not available within the village, a dash (-) is shown in the column and next to it in brackets the distance in broad ranges viz.< 5 kms., 5-10 kms. and 10+ kms of the nearest place
where the facility is available is given)
"" ~ ~ ::;
~ ., '" 0 c § -0 .., ~
., p,
8 tS '" U .0 § tI) ., ::; 1{ C .J: VI ;:; ., .,
1'l ~~ .9 g c c > ·E~ .,
0 0 .~ a .J:= 1;1 U C!, .J: U ., P, ., "3 o ::; ., ~ 0 :W
;:; '" .,
p, u 03 ~.I: :;: ~ ...l 0 -0 ] 'i' l3 ..... _ 0
"0 i3 > .t: '" ., a(j .;;: C!, -0 0 s~ .J: u _ -0
~ ., c ... § -0
C ., ::;"til ::; '" ;!: '" u=~ £ .9 ::; ... §
o .- t: ... ..!l! 0 '" .J: C g Od ... ~ o C ., ~
..... 1;1 .J: OJ ~ _" '" 03 .5 .~ .9 .0 0 03 03 E "3 ..... ;!: r: .~ '2 ~ os 0 c .~ c u·-::; ..... ., p,
0 OD ., .fl~ o~-o c 0 03 0 _g . ~ 03 c ] ... .~ ~ s E ~ p,
03 u u
~ E '" u ~.- CI)
~ 'is '3 = u 'i5 'if E .g b ~.t: " E ;!: '1: '" u:o=.c ., 0 0 ::; -0
., 0 0 0 OD£ ., u ::; 0'-:
!ll 6 t: t: 6 H,l ~ P-. \..1 ::;; Q Q;;~(j ~ ~ 2 3 4 5 6 7 8 9 10 11 12 13
Tahsil : Rampura Phul (OOOI)
41 Phul (Rural) 3,560.0 1,076 172 P(5) M(2) H D THP PO CP ACS SPST BS (01043500) S(2) PUC MCW(5-10) TW PH(30) CM(5-10) NCS(5-1O) CV(IO+) RS(5-IO)
1(2) 0(3) PHC(5-10) SS-T OCS(5-IO) NW(10+) C«5)
42Hamam 595.0 1,146 190 PM HP PH(30) ACS NCS BS Singhwala C« 5) H(10+) , TW PO{< 5) CM(5-IO) OCS(5-IO) CV(IO+) RS(5-IO) (01043600) MCW(1O+) SS-HP CP(5-10) SP(IO+) NW(10+)
PHC(IO+) ST(5-1O)
43 Sadhana 679.0 1,921 331 PM« 5) PHS H(IO+) THP PH(98) BS (01043700) C(5-10) MCW(5-10) TW PO{< 5) CM«5) ACS(5-1O) CV«5) RS(5-10)
PHC(5-10) SS-T CP(S-IO) NCS(S-IO) SP(lO+) NW(IO+) OCS(5-1O) ST(5-10)
44 Patti Sandli 1,230.0 2,360 381 PM MH HC PHS THP PO ·r ACS BS Mehraj C« 5) FWC TW PH(98) CM«5) NCS(5-10) CV«5) RS(lO+) (01043800) CHWH«5) SS-T CP«5) OCS(5-10) SP(IO+) NW(IO+)
MCW(5-IO) ST(5-IO) PHC(5-10)
45 Pani Saol 1,362.0 3,618 638 P M«5) MCWMH THP PH(75) ACS BS Mehraj C« 5) PHC PHS TB TW PO(5-10) CM«5) NCS« 5) CV«5) RS(5-IO) (01043900) CHWH«5) SS-T CP«5) OCS(5-10) SP(IO+) NW(IO+)
ST(10+)
46 Patti Kala 2,419.0 3,197 560 P(2) CWCRMP THP PO CMCP ACS SP BS Mehraj M(2) H« 5) TW PH(130) NCS« 5) CV« 5) RS(5-IO) (01044000) C«5) MCW(5-10) SS-T OCS(5-10) ST(IO+) NW(10+)
PHC(5-IO)
Block Total 54408.0 147312 24977 P(90) H(3) HA(2) HH T(4S) PO(26) CM(S) ACS(34) ST(4) BS(46) M(46) D(ll) DA(3) HP(46) PH(3834) CP(6) NCS(14) SP(14) S(27) DH(3) MCW(S) TW(22) OCS(23) PVC(8) MH(8) CWC(9) 10 Tr HC(IO) PHC(S) AC(3) PHS(20) 0(6) FWC(S) TO(2)
NH RMP(12) CHW(S)
86

VILLAGE DIRECTORY
Village Directory
Land Use (As on 1999)
Land use (i.e. area under different types of land use in hectare)
.",
§ liI ..,
'8 ..c .:: .", (.)
0 0 ::> (.) _,. '" .~ c:: OJ)
5 0 OJ) .~ 0
8 'B c:: "3 .~ .., 'B (.)
c:: 0 (.) 0
~ E ::> .~ '0
.... ....J .., E V ~
<S o(l
~ 'B ~ 0 ~ ..,
:::s <> B :c (!) .;;: o(l §.", 0 '" ~ .:: ;>.. '" ~ ~
.... .., .9 ~ 0.. .... 1:: ~ ;>..
"0 ~ ~ .;;: ..c
..c .9 c.. ... 8.B e .., (!) E
(.) ::> §' .", 'Ol :c~ 0 '- ::>
'" - '" c.. .e..s ~ OJ) 0 c:: e '" ... - I:! '" .:: (!) .., '" - ::> '" 'E :3 ~
(!)
~ c.. liI ~ ~ Cl § ~ CD '" § c.. .., 0
.., 0 ] 'a - 0 ~ ..,
~ 6 6 ~ !;i ;:J ::> ... ~ 6 0... [±, o b;Q ell
14 IS 16 17 18 19 20 21 22 23 2
PR Rampura Phul EA NM GC(l619.0) 106.0 443.0 Phul (Rural) 41 (5) TW(S97.0) (01043S00)
TWE(795.0) T(30110)
PR Rampura Phul EA NM Vegetable GC(162.0) 69.0 Hamam 42 (2) TW(l62.0) Singhwala
TWE(202.0) (01043600) T(S26.0)
PR Rampura Phul EA NM Milk GC(324.0) 263.0 39.0 Sadhana 43 (12) Products TWE(530) (01043700)
T(377.0)
PR Rampura Phul EA NM Milk GC(8010) 210 15.0 132.0 Patti Sandli 44 (7) Products TW(123.0) Mehraj
TWE(138.0) (01043800) T(1062.0)
PR Rampura Phul EA NM Milk GC(S76.0) 62.0 1010 Patti Saol 45 (2) Products TW(62JO) Mehraj
T(II990) (01043900)
PR Rampura Phul EA NM Milk GC(654.0) 54.0 142.0 Patti Kala 46 (2) Products TW(SI30) Mehraj
TWE(7560) (01044000) T(2223.0)
PR(46) EA.(46) N(46) 0.0 GC(24849) 4844.0 547.0 4817.0 M(45) TW(9390)
TWE(9961) T(44200)
87


Map of CD Block Rampura


INDIA PUNJAB
C.D,BLOCK RAMPURA TAHSIL RAMPURA PHUL
DISTRICT BA THINDA Km.l 0 1 2 3 4 5 6 Km.
I i I I I
H U L
., / S /. ;'. PO j
422
. I ., • . '-(.
. 423 ... ~-. -.~' ~
BOUNDARY, DISTRICT. . . . . . . . TAHSIL . . . . CDBLOCK VILLAGE WITH P.L.C.NUMBER
HEADQUARTERS: CD. BLOCK. . . POPULATION SIZE CLASS OF VILLAGES:BELOW 200,200-499,500-999,1000-4999,5000 AND ABOVE UNINHABITED VILLAGE WITH P.L.C.NUMBER URBAN AREA WITH LOCATION CODE. NATIONAL HIGHWAY . . . . . . . . IMPORT ANT METALLED ROAD . . . . . . RAILWAY LINE WITH STATION,BROAD GAUGE . POST OFFICE/TELEPHONE OFFICE/ POST AND TELEGRAPH OFFICE SECONDARY OR SENIOR SECONDARY SCHOOL. PRIMARY HEALTH CENTRE BANK .
---_ .. I Ql~2?OO
• 0 ••••
I
BH 61
RS
PO/TO/ PTO S ~
B
Based upon Survey of India map with the permission of the Surveyor General of India.
CENSUS OF INDlA,Zoot
40~ PO S. \
. ", . I \,. ... " . . "_.
III RAMPURA PHUL M.e]
CD. BLOCK BOUNDARY EXCLUDES STATUTORY TOWN (S)
BOUNDARIES ARE UPDATED UPTO 1.L2000.
TOTAL AREA OF' C.D. BLOCK (In Sq. Km) TOTAL POPULA TION OF C.D. BLOCK . TOTAL NUMBER OF' TOWNS IN C.D. BLOCK TOTAL NUMBER OF VILLAGES IN c.D. BLOCK DISTANCE FROM DIS'I'RICT HEADQUARTERS (In Kms)
33199 91,629
1 30 31
©Government of India Copyrighl,2005


VILLAGE DIRECTORY
ALPHABETICAL LIST OF VILLAGES (C.D. BLOCK WISE)
Name of the District: Bathinda
Serial Name of 2001 Census 1991 Census Serial Name of 2001 Census 1991 Census number village location location number village location location
code number code number code number code number 2 3 4 2 3 4
Name of CD Block: Rampura (0002) 15 laidan 01040900 110010002000200050 .~
Name of Tahsil: Rampura Phul (0001) 16 leondan 01040600 110010002000200068
Badlala 01040800 110010002000200067 17 lethuke 01040300 1100100020002Q0049
2 Balianwala 01042600 110010002000200055 18 Jhanduke 01042200 110010002000200059
3 Balloh 01040700 110010002000200071 19 Kararwala 01043200 110010002000200048
4 Bhaini Chuhar 01041400 110010002000200075 20 Khokhar 01041100 110010002000200073
5 Bhunder 01042700 110010002000200053 21 Kotra Korianwala 01042800 110010002000200054
6 Chaoke 01041200 110010002000200072 22 Mandi Kalan 01041000 110010002000200066
7 Daulatpura 01042500 110010002000200056 23 Mandi Khurd 01041900 110010002000200062
8 Dhade 01041700 110010002000200065 24 Mansa Khurd 01042300 110010002000200060
9 Dikh 01041600 110010002000200064 25 Nandgarh Kotra 01042100 110010002000200058
10 Ghurela 01040500 110010002000200070 26 Pirkot 01041300 110010002000200076
II Ghureli 01040400 110010002000200069 27 Pitho 01043100 110010002000200051
12 Gill Kalan 01043300 110010002000200047 28 Ram Niwas 01041800 110010002000200063 , 13 Gill Khurd 01042400 110010002000200057 29 Rampura(Rural) 01043000 110010002000200052
14 Har Kishanpura 01042000 110010002000200061 30 Sooch 01041500 110010002000200074
91

DISTRICT CENSUS HANDBOOK: BATHINDA
Census of India 2001 -
CD block Rampura (0002) Amenities and
Amenities available (if not available within the village, a dash (-) is shown in the column and next to it in brackets the distance in broad ranges viz.< 5 kms., 5-10 kms. and 10+ kms of the nearest place
where the facility is available is given) ~
~ '" € iil '" 0 ~ _,.
0
"" ~ " " "" 0. 'Vi' " to " 0 U ..c to VJ <.) 0 ::I o' c ..c '" " " "§ '" 0 c .::: .,~ u
.~ 5 " 0 0 e E! ..c E .~ ~ U ~ ..c
0. :; o " " >, <.) " '" " v
- QJ .- '" to 0 "" 0 0. u e:-g (5 '" ~ .....l ~ 0 "" 11 0 .~ ~ ~ '0 6 E! > .<;:: " v ~ .;;: ..c "" ~ "C - "" Ill-
" <.) ,,';;, " ~tO .,
V '" 1A " "" g .~ (.) E ~ '" ~ "" ;S 0 " .. ..c " ':~ c • ..
~ .~ 0 ~ to ~gE o " '" "" ..c 0. '.p 0 ..c .;;: 0 ., to e ., e~
to .-S :; "" ~
ce·_ ::s "2 ~ to 0. 0 " "" .~
"u ._ " "" e 0 .. 0 "" v £1 e o~""
" 0 .~ OJ .5 '2 v .- Vl t":S " >, to 0. " 1;j .~ V5
OJ " ..c .~ ..., E " u E to E 19 19 E u <.) .. t a .0 ·c " "0 .5 ..I' E "t: 0 E ~ '" 0) to 0
~ " "" 0)
Q 0 0 ""..c ., u " 0:': CIl 6; f::: 6 .u ~ 0.. U ~o ~~o u e
2 3 4 5 6 7 8 9 10 II 12 13
Tahsil : Rampura Phul (0001)
1 lethuke 982.0 2,612 472 P(3) M D H(5-10) THP POPH(45) CM ACS BS (01040300) S PUC MCW(5-10) SS-T CP(IO+) OCS(2) CV«5) RS
C(5-10) PHC(5-10) NCS{lO+) SP(IO+) NW(IO+) ST(IO+)
2 Ghureli 316.0 975 176 PAC THP PH(84) BS (01040400) M«5) H(5-10) , TW PO« 5) CM(5-10) ACS« 5) CV(IO+) RS(lO+)
C(lO+) MCW(5-10) SS-T CP(S-IO) NCS(IO+) SP(IO+) NW(IO+) PHC(5-10) OCS(IO+) ST(5-10)
3 Ghurela 424.0 1,000 163 PM THP PH(76) BS (01040S00) C(lO+) H(5-10) TW PO« S) CM(5-10) ACS(S-IO) CV(S-IO) RS(IO+)
MCW(S-IO) SS-T CP(S-IO) NCS(IO+) SP(IO+) NW{lO+) PHC(S-IO) .~ OCS(IO+) ST(5-1O)
4 leondan 1,313.0 2,903 506 P(2) PHS THP PH(12S) ACS BS (01040600) M(2) S RMPH«S) TW PO« S) CM(S-IO) NCS(5-10) CV«5) RS(lO+)
C(IO+) MCW(S-IO) SS-T CP(IO+) OCS(IO+) SP(IO+) NW(IO+) PHC(5-10) ST(IO+)
5 Balloh 1,326.0 4,111 696 P(2) D H(lO+) THP PO ACS BS (01040700) M(2) S MCW(S-IO) SS-T PH(120) CM(lO+) NCS CV«5) RS(lO+)
C(5-10) PHC(S-IO) CP(IO+) OCS SP(IO+) NW(lO+) ST(IO+)
6 Badlala 650.0 1,837 323 P M«5) THP PH(85) CP SP BS (01040800) C(5-10) H(5-10) TW PO«S) CM«S) ACS(S-IO) CV«S) RS(IO+)
MCW(5-10) SS-T NCS(S-IO) ST(10+) NW(IO+) PHC(S-IO) OCS(S-IO)
7 laidan 4S7.0 1,250 202 PAC THP PO PH(9S) ACS BS (01040900) M«5) H« 5) TW CM(IO+) NCS(S-IO) CV«S) RS(5-10)
C(IO+) MCW«S) SS-T CP«S) OCS(S-IO) SP(IO+) NW(10+) PHC« S) ST(IO+)
8 Mandi Kalan 2,498.0 8,429 1,484 P(4) DMCW THP PO ACS SPST BS (01041000) M(2) PHC TW PH(165) C¥(5-10) NCS CV«5) RS(5-10)
S(2) PUC H« 5) SS-T CP«S) OCS NW(lO+) C(IO+)
9 Khokhar 1,172.0 2,105 468 PM PHS THP PH(40) ACS SP BS
(01041100) C(lO+) RMP H(5-10) TW PO«5) CM(5-10) NCS(lO+) CV«5) RS(S-IO) MCW(5-10) SS-T CP«S) OCS(IO+) ST(lO+) NW(IO+) PHC(5-1O)
IOChaoke 3,013.0 8,280 1,353 P(2) M(2) D HC THP PO CMCP ACS SPST BS
(01041200) S PUC SMP H(IO+) SS-T PH(120) NCS CV«5) RS(lO+) 1(3) AC(3) MCW(5-10) OCS NW(IO+)
0(3) PHC(5-10) C(IO+)
92

VILLAGE DIRECTORY
Village Directory
Land Use (As on 1999)
Land use (Le. area under different types of land use in hectare)
"'" <:: " a ..
E .<:: c: "'" <.)
0 0
.::< B .~ OJ
e- O!) c: .f' O!) 'E .~
" "tl c: :;
0 .. 0 :0 t)
" .S E '" t) 0
.s ~ '"' u ... ....:I 0> Vl E .. <8 OJ) :;:; ell 0 u ~ .. <>d
::§ ~ 0 ... o(l '" .':l ::c .. .:;:
~"'a 0 _!g "" c >. ~ <To '" ~ ... os .;
.9 ~ c.. ... >. 3: .. .. 8.a e "'" > .;;: .0
.c S Co. go ~ ., " a
<.) ::> ""' " ~ '" .§ ~ "0 ::c~ '0 '" Vl ... Co. .':l ·s 0 c: e ~ ~ '" ~ ::II 1n " t! '" C 0>
c.. " 3: '" c e Ol) a ~ os e ~ c.. .. 0 ., o os '6 'a - 0 ~ :;;: z z :? a 0 :::J ::> ... .. ..
p... fl_, .. u Ol) Z VJ
14 15 16 17 18 19 20 21 22 23 2
PR Rampura Phul EA NM GC(456.0) 80.0 Jethuke (15) TW(125.0) (01040300)
TWE(32 10) T(902.0)
PR Tappa (2) EA NM GC(105.0) 15.0 21.0 Ghureli 2 TWE(175.0) (01040400) T(2S0.0)
PR Tappa (4) EA NM GC(285.0) 9.0 30.0 Ghurela 3 TW(48.0) (01040500) TWE(52.0) T(385.0)
PR Rampura Phul EA NM GC(515.0) 120.0 93.0 145.0 Jeondan 4 (10) TW(SO.O) (01040600)
TWE(360.0) T(955.0)
PR Tappa (10) EA NM GCfJ89.0) 141.0 114.0 Balloh 5 TW(l21.0) (01040700) TWE(\6l.0) 1(1071.0)
PR Rampura Phul EA NM GC(295.0) 48.0 44.0 Badlala 6
(12) TW(142.0) (01040800) TWE(121.0) T(558.0)
PR Rampura Phul EA NM GC(378.0) 34.0 45.0 Jaidan 7
(10) T(378.0) (01040900)
PR Rampura Phu! EA NM GC(1774.0) 220.0 187.0 MandiKalan 8
(6) TW(168.0) (01041000) TWE(149.0) . T(209\.0)
PR Rampura Phul EA NM Gur, Food GC(885.0) 100.0 127.0 Khokhar 9
(II) Grains, TW(25.0) (01041100)
Milk TWE(35.0~ T(945.0)
PR Rampura Phul EA NM , GC(2024.0) 459.0 94.0 Chaoke 10
(20) Gur TW(21O.0) (01041200)
TWE(226.0) T(2460.0)
93

DISTRICT CENSUS HANDBOOK: BATHINDA
Census of India 2001 -
CD block Rampura (0002) Amenities and
Amenities available (if not available within the village, a dash (-) is shown in the column and next to it in brackets the distance in broad ranges viz. < 5 kms., 5-10 kms. and 10+ kms of the nearest place
where the facility is available is given)
~
--;n ~ ::I .l:l ., .,
Vl 0 a c: § "tl "tl ~ .,
§ 0-
0 '0 Vl U .J:l C/)
" ., ::I 8 c .s::: '" ., d) Ol 'ia~ 0 c 0 c :> ... ·E ~ e, <I) 0 0 .~ a ..c E .~ u c:!- .c Q. "5 o ::> ., iO' u ., .,
Cd .g "C 0
:W 0 Vl " 0- " ;;; i: -l 0 .", 1i 'i' 'C: til """,- 0
"0 a> .t: ::s d)
<>'<l .;;;: c:!- oJ: "tl 0 ~)~ _ "'" ~~ § u ::I 'til ::s
" ., c: .,
"tl g.~ '" ;;:: '" U E -<t: E -s 0 ::s ... § c: ... .c c u <>'<lOB o Ii .~ 0 OJ _" ~ .B ~
.... oJ: t;J !! ._ 0
0 "5 ..... Ol ;;:: Ol f.:! .~ Ol·S ::s rl .i1 E o:s 0 c OJ) .~ c u·_ .... §' a"S 0'-"'"'"
._ ... ::I ~ ... 0 OJ) ., c: '" c 0 0- ., ·a ca
~ 1i <I) - .... .~.~ t5 ~f ca ° E ~ E .g ~ § "$ "$ " ...: E ~.~ . .r:: ::I '" t) :-:::: ..0 .,
~ 0 ::I "'" ~
.r:: ~
0 OJ)-:;j 0) U ::I a .~ III ~ ~ ~ bY Q U :'!: Q ~..su
2 3 4 5 6 7 8 9 10 11 12 13
Tahsil: Rampura Phul (0001)
II Pirkot 862.0 1,377 220 P M« 5) THP PO PH(l6) BS (01041300) C(lO+) H(lO+) S8-T CM«S) ACS« 5) CV« 5) RS(IO+)
MCW(S-IO) CP« 5) NCS(IO+) SP(lO+) NW(lO+) PHC(5-10) OC8(1O+) ST(IO+)
12 Bhaini Chuhar 621.0 1,668 277 PMI DPHS THP PO PH(79) BS (01041400) Tr AC H(IO+) S8-T CM(S-IO) AC8« 5) CV« 5) RS(5-1O)
o C(lO+) MCW(~-IO) CP(5-10) NCS(IO+) SP(lO+) NW(IO+) PHC(5-10) OCS(IO+) ST(IO+)
13 Sooch 617.0 1,533 267 PM PHS H« 5) THP PH(35) BS (01041500) C(IO+) MCW«5) TW PO« 5) CM«5) ACS« 5) CV«5) RS(IO+)
PHC« 5) SS-T ,.. CP(5-10) NCS«5) SP(IO+) NW(IO+)
OCS(IO+) ST(IO+)
14 Dikh 1,752.0 3,284 557 P(2) M PHS H(5-IO) THP PO PH(80) ACS BS (01041600) C(lO+) MCW(5-10) SS-T CM(5-10) OCS CV«5) RS(5-10)
PHC{S-lO) CP«5) NCS« 5) SP(IO+) NW(lO+) ST(IO+)
15 Dhade 1,260.0 2,830 463 PMS D H(5-10) THP PO PH(65) CP ACS BS (01041700) C(IO+) MCW(5-10) TW CM(5-10) OCS CV«5) RS(5-10)
PHC{5-10) SS-T NCS« 5) SP(IO+) NW(10+) ST(IO+)
16 Ram Niwas 669.0 2,153 369 PM DMHCWCHC THP PO PH(40) ACSOCS BS (01041800) C(IO+) PHS FWC TB SS-T CM(5-1O) NCS« 5) CV«5) RS(IO+)
NH H«5) CP« 5) SP(lO+) NW(IO+) MCW(-"5) ST(IO+) PHC{< 5)
17 Mandi Khurd 479.0 1,261 211 PM THP PH(25) BS
(01041900) C(IO+) H«5) SS-T PO« 5) CM«5) ACS« 5) CV« 5) RS(5-10) Mc..W(5-10) CP(5-10) NCS« 5) SP(IO+) NW(IO+) PHC(5-10) OCS(5-10) ST(10+)
18 Har Kishanpura 500.0 810 149 P M«5) THP PH(30) BS
(01042000) C(IO+) H(5-10) SS-T PO«S) CM(5·10) ACS« 5) CV(S-IO) RS(5-10) MCW(S-IO) CP(5-10) NCS« 5) SP(IO+) NW(IO+) PHC{5-10) OCS(5-1O) ST(IO+)
19 Nandgarh Kotra 529.0 1,358 257 PM«5) THP PH(50) BS
(01042100) C(lO+) H(5-lO) SS-T PO« 5) CM«5) ACS« 5) CV«5) RS(5-10)
MCW(S-IO) CP(5-lO) NCS« 5) SP(lO+) NW(IO+)
PHC(5-10) OCS« 5) ST(IO+)
20 jhanduke 886.0 2,423 406 P(2) D H« 5) THP PO PH(30) ACSOCS SP BS
(01042200) M S I MCW(S-IO) SS-T CM«5) NCS«5) CV«5) RS(5-10)
Tr C(10+) PHC(5-10) CP(5-10) ST(5-10) NW(IO+)
94

VILLAGE DIRECTORY
Village Directory
Land Use (A~ on 1999:)
Land use (i.e. area under di fferen! types of land use in hectare)
"'" iii l;l u
E .<:: c: " " 0 0
"'" g '':: "
g ell '" c b CJl .~ 0
.., '" 'B .S :; '~
u 0 -,j <..J {)
~ ·S E :I 0
~ 0' ~ ..J
j t<> E " 2.-cE ~
'ii " 0 ~ .!!! " :; «I ~ ~"O ~
..c 5l, g '" ~
,., 1i ~ tl Ei 0. ... t:: 1:: '" -0 !l= ?i ;: .c
B C- o 8.B e § .<:: a. ., " u a '" '0 'i:i ~- (5 ....
" Vi '-p. .§,r:! ~ 01) 0 c
'2 " - '" \'l c:
" "' ... :I '" " 'E " ;a 8: );; ~ ~ ~ ~ f: 011 ~ " oj
~ u 0 " 'E 'c gg. " .;::
0 ~ " ::!: :1;, !l. 6 6i fl ~ .. ::;. 6 <I:l
14 15 16 17 IS 19 20 21 22 23 2
.~
PR Maw (IS) EA NM Gur, GC(6gg 0) 2&.0 3\1.0 Pirkot " Wheat TW(290} (OI041300] TWE(7&.OI T(795.0)
PR Maur(IO} EA NM Shoes, GqSl LO) 39.0 Bhaini Chunar 12 Wheat, TW(34.0) (01 ()414CO) Sp3~ , TWE(37.0)
1(582.0)
PR Rampura Phul EA NM GC(526.0) 9.0 42.0 Sooch 13 (16) TW(340) (01041500)
lWEi()O) T(5~~·.C.1
PR Rar..pural'l1ul EA NM GC(1218.0) 86.0 112.0 216.0 Oikh 14 OJ) TWE[120.0) 10 IM1 600)
T(13111.0)
FR Rampura Phu\ EA NM Bricks, GC(tC:,!J} no Dhacl~ \5 (10) Ghee nV(J510) (01041700)
TWE(228 0) T(\182[1)
PR Bhadaur (to) EA NM GCl494.0) 54.0 Ram Niwns 16 TWE(12LO) (01 041 iWIJ) T(6150)
PR RamllUIIo Phu\ EA NM Stich GC(25 10) 123.0 26.0 Mandi Khurd 17
(22) nv(79.0) (OJ 041900)
TPJO.Q) ~~
PR Kol Fatta (10) EA M Bricks Germ.O) 56.0 16.1) H~{ KishanllllTR 1& nv(50.0) (OJ 042000) TI'JE(SI.O) 1(4IS.0)
PR Bhucho [6) EA NM Bricks GC(350.0) 9S.G 41U Nandgarh Kotra 19 nv(24.01 (O1042100) nvE(170) T(3910}
PR Dathinda (5) EA NM Bricks nv(55U» 17.0 63.0 lhanduke 20
TWE(25S 0) (01042200) 1(806.0)
95

DISTRICT CENSUS HANDBOOK: BATHINDA
Census of India 2001 -
CD block Rampura (0002) Amenities and
Amenities available (if not available within the village, a dash (-) is shown in the column and next to it in brackets the distance in broad ranges viz.< 5 kms., 5-10 kms. and 10+ kms of the nearest place
where the facility is available is given)
~
~ '" ~ ::s ~ <lJ '" Q) !a c:: til "0 0 "0 ~ Q) 0..
8 t> '" U .0 1ii Vl .., ::s ,; c= ..c: Vl ;; ., ..,
""§ :;a~ c:: c:: > OJ 0 g ·E ~ ·fa u 0 _g .'e a .<: E u t) ... ~ 0.. .., "3 o ::s ., G-o
~ ;; V>
., c.. .::! ] ~'§ :;: ~ ...J "" 11 9 0 (5 ~.~ a> .';:: ;:; <u
"Il .;;: ~ .<: "0 8 _ "0
~~
~ u c
.., ~ c " ::s O! ::s '" ::. Vl "0 ue:<t .;; 0 ::s .... .<: § g 'g c: ... o c::
<u ~ .~ 0 ~ e- ~.,~ '';:: 0 ..c: ~.~ _ c::
~ .;; 0 "3 ~ O! ::. O! ",.- ",.-., 0 c:: ff' 'e c:: u·_ u'Oj
e ..... ~
0.. .9 OJ! E] o~"" '2 Vi 0 0 .8 O! 11 ';: ~ S
0.. 'OJ c ... S G-O!
., OJ :J2 E ::s u oj .- Vl
~ S S E u ;a .5 ~ E .~ b ~ ~.o §~ .t:; ;:; ... 0 0 ::s "" u
Q ~ 0 OJ!';; Q) OJ ;:;
sa b !:= !:= b f:!l ~ S.1 ~ Q ~~1! S.1 ~ 2 3 4 5 6 7 8 9 10 II 12 13
Tahsil: Rampura Phul (0001)
21 Mansa Khurd 702.0 1,245 216 P M«5) THP PH(30) BS (01042300) C(lO+) H(5-IO) SS-T PO«5) CM(5-10) ACS« 5) CV« 5) RS(5-1O)
MCW(5-10) CP(5-10) NCS(5-10) SP(IO+) NW(lO+) PHC(5-1O) OCS(5-1O) ST(IO+)
22 o ill Khurd 448.0 1,1 !O 191 P M« 5) PHS H(5-IO) THP PH(55) BS (01042400) C(10+) MCW(S-IO) TW SS- PO« 5) CM(5-10) ACS« 5) CV(lO+) RS(5-10)
PHC(5-10l. T CP(S-IO) NCS« 5) SP(IO+) NW(lO+) OeS(5-10) ST(5-10)
23 Daulatpura 403.0 1,330 245 P M« 5) THP PH(65) BS (01042500) C(lO+) H(5-10) TW PO« 5) CM(5·tO) ACS« 5) CV«5) RS(5·to)
MCW(5-10) SS-T CP(S-IO) NCS(5-10) SP(IO+) NW(IO+) PHC(5-10) OCS(5-to) ST(1O+)
24 Balianwala 2,392.0 • 7,169 1,233 P(S) MCW THP PO CM ACS SP BS (01042600) M(3) S PHC SS-T PH(198) CP« 5) NCS CV« 5) RS(5-10)
PUC RMP H(5-1O) oes ST(5-10) NW(IO+) C(lO+)
2S Bhunder 1,548.0 4,185 702 P(2) M THP PO ACS BS RS(5-(01042700) C(5-10) H« 5) TW PH(12S) CM(S-tO) NCS CV« 5) 10)
MCW« 5) SS-T I .~ CP(5-10) ocs SP(IO+) NW(IO+) PHC« 5) ST(s-lO)
26 Kotra 1,084.0 3,964 705 PMS PHS RMP THP PO ACS BS Korianwala C{5-10) H(S-IO) TW SS- PH(120) CM(5-10) NCS(S-IO) CV« 5) RS(5-10) (01042800) MCW(S-IO) T CP(S-IO) OCS(S-IO) SP(IO+) NW(IO+)
PHC(5-10) ST(5-10)
27 Rampura(Rural) 1,984.0 6,883 1,210 P(3) M HDCWC THP PO ACS SP BS (01043000) 8 C(5-10) MeW(S-IO) TW PH(125) CM(S.IO) Nes CV«S) RS(S-IO)
PHC(S-IO) SS-T CP(S-IO) OCS ST(5-10) NW(IO+)
28 Pitho 1,948.0 5,291 906 P(2) M DPHS THP PO ACS SP BS
(01043100) S C(lO+) RMP H(S-IO) TW PH(l2S) CM(S-IO) NCS CV«S) RS(5-IO) MCW(S-IO) SS-T CP« 5) OCS ST(5-10) NW(10+) PHC(S-IO)
29 Kararwala 1,192.0 4,017 686 P(2) MCWMH THP PO CM ACS NCS SP BS
(01043200) MSO CWCHCPHC TW PH(135) CP« 5) OCS(5-10) CV« 5) RS« 5) C(5-10) PH8NHRMP SS-T 8T(5-1O) NW(JO+)
CHW H(S-IO)
96

VILLAGE DIRECTORY
Village Directory
Land Use (As on 1999)
Land use (i.e. area under different types ofland use in hectare)
"0
iii liI OJ
]: .<: c "0 (.)
0 0 :I u os .~ c g OJ)
0 OJ) .:: 0
8 '6 c -3 .~
OJ '6 (.) c 0 (.) 0
~ .~ § :I .... ....l ... ~ u <8 ... e, ~ 1 '6 ~ 0 ~. ... ~
u :s ~ OJ
~ O?l ~13
0 ~ OJ)
c >. ~ '" 'ij ~ .... B ~ Q. .... >. ~
u
,~ o .... e "0 1; .;; ..c
.c B 0. o.~ OJ ... E u :s "0 til ~- g ..... :s os '" 0- .5.e 0
'" .... u bJ) c e ... " '"
_ :s 1;; til 'E a ~ OJ OJ 0. la ~ ~ cg § ~ OJ) os § 0. ... 0 OJ 0 'E '2 - 0 ~
·c ~ z p., z ~ E [.!., ;:? :I .... Z OJ ,_, (.) bf) til
14 15 16 17 18 19 20 21 22 23 2
PR Bhucho (12) EA NM Bricks GC(2310) 202.0 Mansa Khurd 21 TW(93.0) (01042300) TWE(l76.0) T(500.0)
PR Rampura Phul EA NM Bricks GC(156.0) 14.0 45.0 Gill Khurd 22 (6) TW(148.0) (01042400)
TWE(85.0) T(389.0)
PR Rampura Phul EA NM Bricks GC(280.0) 41.0 8.0 Daulatpura 23 (23) TW(25.0) (01042500)
TWE(49.0) T(354.0)
PR Rampura Phul EA NM Bricks, GC(1420.0) 264.0 190.0 Balianwala 24 (10) Biscuits, TW(257.0) (01042600)
Wheat TWE(261.0) T(1938.0)
PR Rampura Phul EA NM Bricks GC(809.0) 93.0 Bhunder 25 (6) TW(3aO) (01042700)
TWE(323.0) T(l455.0)
PR Rampura Phul EA NM Bricks GC(650.0) 8.0 304.0 Kotra Korianwala 26 (6) TW(81.0) (01042800)
TWE(41.0) T(772.0)
PR Rampura Phul EA NM Bricks GC(916.0) 4.0 267.0 639.0 Rampura(Rural) 27 (I) TW(77.0) (01043000)
TWE(81.0) T(1074.0)
PR Rampura Phul EA NM Bricks GC(1377.0) 122.0 189.0 Pitho 28 (5) TW(l17.0) (01043100)
TWE(143.0) T(1637.0)
PR Rampura Phul EA NM Bricks GC(850.0) 246.0 Kararwala 29 (6) TW(45.0) (01043200)
TWE(51.0) T(946.0)
97

DISTRICT CENSUS HANDBOOK: BATHINDA
Census of India 2001 ~
CD block Rampura (0002) Amenities and
Amenities available (if not available within the village, a dash (-) is shown in the column and next to it in brackets the distance in broad ranges viz,< 5 kms" 5-10 kms, and 10+ kms oCthe nearest place
where the facility is available is given) ....., Vl Vl
¥ ::s ~ 1::
<!) '" 0 c: § -0 0. -0 ~ '" § C/l 8 '" U .0 <!) ::s oi c: .c: '" <!)
.., ~ :;a....., () c: 0 c: > 0 e. u 0 0 '~ .a ..c:: E 'E .-, 'iii ..c:: C!- o. ::; o ::s ... ~
tJ ., - ., -a .g 'C:: ~ ~ 0 :2 0 '" <!) 0. ,~ -0 ~ '""' ._ 0 ....l 0
"0 '(
~.~ .a ;;> '':: ::s <!)
a(! ';;: C!- ..c:: -0 0 _ -0 CO;;;
a u 8ta~ ';;;'~
~ <!) c: <!) -0 c: <!)
'" o ,-~ g'E c::
-5 0 ::s ... ..c:: § c: g o d' ... ~ '.g 0 ~ <!) '- .c: <d ~ -a .....:'" .~ .g .0 ';;: 0 "5 .... Ol ~ ~ .~
t'jo_ =' E OJ) 'Q c: U ,- ,~ e3 '" 0. 0 c 213 o~-o ::s '- ~ 0 OJ) <I.J c:: Vl
c: 0 0
~ 'iii Ol ~ ] ... - .... '';: ~ .s e~ <!)
0. u E ::s u a1 'a V) -a § ] ] S u :.0 ·2 1i E .~ t ..... _ " ez 'C:: ::s u:-:::..c <!) 0 0 ::s -0 <!)
0 0 OJ)-5 <!) u ::s o ,-!a :?; f::: f::: ;?; bY ~ g Q" \.i ~ Q ~<Ss:l U ~
2 3 4 5 6 7 8 9 10 II 12 13
Tahsil Rampura Phul (0001)
30 o ill Kalan 1,172.0 3,636 680 P M S HU OH(5-10) THP PO ACS BS (01043300) C« 5) MCW(5-IO) TW PH(125) CM«5) NCS« 5) CV«5) RS(5-10)
PHC(5-10) SS-T CP« 5) OCS« 5) SP(IO+) NW(lO+) ST(lO+)
Block Total 33199.0 91629 15793 P(49) H HU D(ll) T(30) PO(IS) CM(4) ACS(IS) ST(2) BS(30) M(l7) MCW(3) MH(2) HP(30) PH(2508) CP(3) NCS(8) SP(9) RS S(14) CWC(3) HC(3) TW(17) OCS(13) PUC(4) PHC(J) PHS(IO) 10 Tr(2) FWC TB NH(2) AC(6) RMP(6) SMP 0(5) CHW
98

VILLAGE DIRECTORY
Village Directory
Land Use (As on 1999)
Land use (i.e. area under different types of land use in hectare)
" 1ij l;l ..,
]: ..c:: c: " u 0 0
'" u '" .~ c: <:>n g C <:>n .~ 0
:a c: :; .~ .., .., '6 <.)
<.) c: 0 u 0
~ 'ij § '" ... ...J .., ~ u <8 <>'d .., g
:W 'i5 gp 0 ~ .. u <>'d :::8
~~ '" ~ :c ..,
.;;: 0 '" E c: >- Vl ~
... .., E ~ Q. ... >- ~ 's: .J:J o ... e " ~ B Q.
.., Q.~
.., § ] It ..,
'" "0 'i<I :c~ " ..... - '" .5..s 0 Vl ... Q. .., <:>n i:! '" c: c:
2 .. .., .", _ :::l
1:;; (;j '6 a ~ '" u "iii
Q. l;l ~ ~ ; ~ ~ <:>n '2 ~ § ·c Q. ..,
0 ..,
0 :§ - 0 .., ~ e :::l ...
~ z; 0... z; ~ ;:::J u !1!l z; <Il
14 15 16 17 18 19 20 21 22 23 2
PR Rampura Phul EA NM GC(837.0) 34.0 163.0 Gill Kalan 30 (3) TW(57 0) (01043300)
TWE(81.0) T(975 0)
PR(30) EA(30) N(29) 0.0 GC(20160) .~
2047.0 472.0 3592.0 M(30) TW(3094)
TWE(3834) T(27088)
99


Map of CD Block Nathana


INDIA PUNJAB
C.D.BLOCK NATHAN A TAHSIL BATHINDA
DISTRICT BATHINDA Km. 1 0 1 Z 3 4 50 6 Km.
II I I I I
IV BHUCHO MANDl M.CL
I
TAHSIL BOUNDARY, TAHSIL , -, _. - . -
C.D.BLOCK. . . .. - - - -VILLAGE WITH PL.CNUMBER I 010461iOO l
HEADQUARTERS C,D, BLOCK , • POPULATION SIZE CLASS OF VILLAGESBELOW 200,200-499,500-999,1000-4999,5000 AND ABOVEo • ••• UNINHABITED VILLAGE WITH P.LC.NUMBER URBAN AREA WITH LOCATION CODE NATIONAL HIGHWAY, , . . , . STATE HIGHWAY
RAILWAY LINE WITH STATION,BROAD GAUGE POST OFFICE/TELEPHONE OFFICE/POST AND TELEGRAPH OFFICE ." SECONDARY OR SENIOR SECONDARY SCHOOL PRIMARY HEALTH CENTRE· BANK
NH 64
SH l6.
RS
PO/TO/PTO S (I)
B
Based upon Survey of India map with the p€rmiss]()n of the Surveyor General of India.
..... . ,. .
\,
...
I . /
C.D, BLOCK BOUNDARY EXCLUDES ST ATUTORY TOWN (S)
BOUNDARIES ARE UPDATED UPTO 1.1.2000.
CENSUS OF INDIA,2oo!.
TOTAL AREA OF CD, BLOCK (In Sq.Kml· , 410.67 TOTAL POPULATION OF C.D. BLOCK. , 129.025 TOTAL NUMBER OF TOWNS IN CD BLOCK 2 TOTAL NUMBER OF VILLAGES IN C.D. BLOCK 32 DISTANCE FROM DISTRICf HEADQUARTERS (In KillS). 25
© Government of India Copyright,2005.


VILLAGE DIRECTORY
ALPHABETICAL LIST OF VILLAGES (C.D. BLOCK WISE)
Name of the District : Bathinda
Serial Name of 2001 Census 1991 Census Serial Name of 2001 Census 1991 Census number vUlage location location number village location location
code number code number code number code number 2 3 4 2 3 4
Name of CD Block: Nathana (0003) 15 Gobindpura 01045400 110020004000400105
Name of Tahsil : Bathinda (0002) 16 Joganand 01046900 110020004000400106
1 Bajoana 01044700 110020004000400091 17 KaHan Maika 01044500 110020004000400093
2 Bath 01045700 110020004000400118 18 Kalian Sadda 01044400 110020004000400094
3,Bhaini 01044300 110020004000400095 19 Kalian Sukha 01044600 110020004000400092
4 Bhucho Kalan 010463.00 110020004000400109 20 Lehra Bega 01046200 110020004000400117
5 Bhucho Khurd 01046500 110020004000400110 21 Lehra Dhul Kot 01045800 110020004000400121
6 Bibiwala 01046800 110020004000400107 22 Lehra Khana 01046100 110020004000400115
7 Burj Ualla 01044200 110020004000400097 23 Lehra Mohabat 01046000 110020004000400119
8 Burj Kahan 24 Lehra Sondha 01045900 110020004000400120
Singhwala 01046400 110020004000400116 25 Mari 01044100 110020004000400096
9 Chak Bakhtu 01052800 110020004000400114 26 Mehna 01046700 110020004000400108
10 Chak Fateh 27 Nathana 01045100 110020004000400100
Singhwala 01052700 110020004000400112 28 Nathpura 01044900 110020004000400098
11 Chak Ram Singhwala 01052900 110020004000400113 29 Ptlohla 01045600 110020004000400101
12 Dhilwan 01045300 110020004000400103 30 Poohli 01045200 110020004000400102
13 Ganga Nathana 01045000 110020004000400099 31 Seman 01045500 110020004000400104
14 Giddar 01044800 110020004000400090 32 Tungwali 01052600 110020004000400111
103

DISTRICT CENSUS HANDBOOK: BATHINDA
Census of India 2001 -
CD block Nathana (0003) Amenities and
Amenities available (if not available within the village, a dash (-) is shown in the column and next to it in brackets the distance in broad ranges viz.< 5 kms., 5-10 kms. and 10+ kms of the nearest place
where the facility is available is given)
";;;' ~ ]' " 12 ., '" <:> c: ~ "0 "0 ,....._ 0 ~ 0.
8 <> :; U .D Vl ., .;
'" ..c:: '" 0 0 <IJ -;;; 'ia~ '-'
.~ 2-c: c: > .... 'E r--c3 0 0 .~ 2 ..c:: E
C ..c:: <.) j
0. <IJ :; o " oi;;> <:> 0 '" 0 c.. .~
-;;;~.t: ~ f: ....J 0 -0 "E 9 L.. ...... 0 "0 00 '" 2 >.<;: " 0)
~ ~ C ..t: "0 8 ~ .~ _ -0
E9.ta
~ -5 c: ., ~ "0 § .~ ""<:3 ::s i'3 ~ • '" <>S~ 0 ::s .... fa .... 'a 0 %l i ~~ ~~E ·3 g ., ..... ..c:: .0 .:;; 0 -;;; -;;; r:d ._ ::3 os'~
E :; ..... ::t tin r: .~ <::u·_ utij os 0 <:: .~ :s .....
~ Q. 0 on 0 E~ 0'-'"'" '§ 'Vi c: 0 0
~ .~ ~ c: "E ., - '" .~.~ b3 0
Q. :Q E ::s () E i;;> -;;;
§ ~ ~ <..> '0 c: J E .~ '"" ~;~ " §~ ·c ::s Vl l;i,-5 CJ ::: ..Q ., 0 0 " -0
., ~ 0 0 <> Q ::1
rn 6 ~ t:: 6 [,!,l ~ Q" <;.1 :S Q ~.z!<3 <;.1~
2 3 4 5 6 7 8 9 10 11 12 13
Tahsil : Bathinda (0002)
1 Mari 653.0 996 163 P M« 5) THP PH(80) BS (01044100) C(lOt) H(tO+) SS-T PO« 5) CM(5-10) ACS« 5) CV(5-IO) RS(lOt)
MCW(5-IO) CP(5-IO) NCS(5-10) SP(lOt) NW(IO+) PHC(5-IO) OCS(5-10) ST« 5)
2 Bur) Dalla 284.0 369 62 P M I THP PH(20) BS (01044200) Tr(2) H(5-10) SS-T PO.«5) CM(IO+) ACS(5-10) CV(5-IO) RS(lOt)
C(IOt) MCW(5-10) CP(5-IO) NCS(5-IO) SP(lo+) NW(IO+) PHC(5-lb) OCS(5-10) ST(IO+)
3 Bhaini 587.0 2,778 447 PM S OPHS THP PO PH(60) ACS BS (01044300) C(IO+) H(IO+) SS-T CM(5-1O) NCS«5) CV« 5) RS(5-10)
MCW(5-10) CP«5) OCS« 5) SP(10+) NW(IO+) PHC(5-10) ST(IO+)
4 Kalian Sadda 524.0 1,734 274 P M« 5) SMP H(5-10) THP PH(30) SP BS (01044400) C(IO+) MCW(S-tO) SS-T POtS-tO) CM(5-1O) ACS(5-IO) CV«5) RS(tOt)
PHC(5-tO) CP(S-IO) NCS(5-tO) ST(IO+) NW(IO+) OCS(5-1O)
5 Kalian MaIka 822.0 1,617 271 P(3) THP PH(58) ACS BS (01044500) M(5-IO) H(S·IO) SS-T PO(5-10) CM(5-IO) NCS(5-IO) CV«5) RS(IOt)
C(lOt) MCW«5) CP« S) OCS(5-10) SP(lO+) NW(IO+) PHC« 5) ST(IO+)
6 Kalian Sukha 2,358.0 3,853 626 P(2) THP PO PH(87) CM CP ACS SP BS (01044600) M S H(5-10) TW NCS(5-IO) CV« 5) RS(IO+)
C(lo+) MCW(S-IO) 5S-T OCS(5-IO) S1'(lO+) NW(IO+) PHC(5-10)
~
7 Bajoana 633.0 t,826 307 PM DMH PHS HIP PO PH(30) SP CV« 5) as (01044700) AC(2) H(5-10) TW CM« 5) ACS« 5) ST(IO+) RS(IO+)
C(lO+) MCW(5-IO) 5S-T CP(5-1O) NCS(5-10) NW(lO+) PHC(5-10) OCS(5-10)
8 Giddar 1,029.0 2,383 403 PM S D H« 5) THP PH(45) NC5 as (01044800) C(IO+) MCW«5) TW rO«5) CM(5-10) ACS«5) CV«5) RS(IO+)
PHC«5) 5S-T CP«5) OCS(5-10) SP(IO+) NW(lO+) . 5T(10+)
9 Nathpura 1,032.0 2,565 412 PM OAPHS THP PO PH(38) AC5 BS (01044900) AC(2) H(IO+) 5S-T CM(5-10) NCS« 5) CV«S) RS(IO+)
C(lO+) MCW«5) CP(S-lO) OCS(5·10) SP(IOt} NW(10+} PHC«5) 5T(10+)
\0 Ganga Nathan? 862.0 2,563 44S P M«S) D PHS H« 5) THP PH(30) SP BS
(01045000) C(lOt) MCW(5-1O) 5S-T PO(5-10) CM(5-10) ACS«5) CV«5) R5(5-10) PHC(5-lO) CP« 5) NCS« 5) ST(IO+) NW(IO+)
OCS« 5)
104

VILLAGE DIRECTORY
Village Directory
Land Use (As on 1999)
Land use (i.e. area under different types of land use in hectare)
""" a l;l .,
]: ..c: § "0 U 0 :::> u gb .~
I':
5 ~ OJ) :> 0
., '0 c ~ .~ 0) '0 (.) u c 0 u 0
§ .~ ~ :::> ... ....J ., U u <8 en gp e- o<:!
~ '0 0 ~ " u o<:! ::E
~-g :::>
m ~ E ";; 0 I': 2:-
en =a ... ., .9 ~ Co ... e "0 ~ ~ "'" . ., o ... ~ -5 .9 . Co
~ Co~ " ., E :::> "0 t;! ~~ '0
._ :::> 01 t; '" c. .94S ~ en 0 I': e ... t; c
~ 0)
~ .... :::> '" 'e 2 ~ 01 ~ OJ c. ~ ~ a ~ en
c. ., 0 " 0 'e '" - 0
., .;:
« z z ;:;$ E :::J :::> ... ~ z ., p.., f+, ...... u bQ r:n
14 15 16 17 18 19 20 21 22 23 2
PR Rampura Phul EA NM GC(38 1.0) 4.0 88.0 Mari (13) TWE(180.0) (01044100)
T(56 1.0)
PR Rampura Phul EA GC(85.0) 124.0 25.0 Burj Dalla 2 (20) TWE(500) (01044200)
T(l35.0)
PR Rampura Phul EA NM GC(2S2.0) 93.0 54.0 Bhaini 3 (3) TWE(188.0) (01044300)
T(440.0)
PR Maur (4) EA NM Khadar, GC(225.0) 100.0 144.0 Kalian Sadda 4 Cosmetic TW(25.0) (01044400)
TWE(300) T(280 0)
PR Maur (10) EA NM Shoes, GC(2IS.0) 28.0 54.0 KalianMalka 5 Khadar TW(348.0) (01044500)
TWE(I77.0) T(7400)
PR Maur (10) EA NM Shoes, GC(740.0) 10000 124.0 Kalian Sukha 6 Khadar TW(4940) (01044600)
T(1234.0)
PR Maur (8) EA NM GC(196.0) 87.0 47.0 Bajoana 7 TW(283.0) (01044700) TWE(20.0) T(499.0)
PR Maur (4) EA NM Shoes, GC(263.0) 45.0 53.0 Giddar S Khadar, TW(647.0) (01044S00) Wheat TWE(21.0)
T(93 1.0)
PR Maur(5) EA NM GC(496.0) 61.0 86.0 Nathpura 9 TW(32S.0) (01044900) TWE(61.0) T(885.0)
PR Maur(2) EA NM Shoes, GC(S02.0) 44.0 Ganga Nathana 10
Khadar, TW(l6.0) (01045000) Wheat T(8IS.0)
105

DISTRICT CENSUS HANDBOOK: BATHINDA
Census of India 2001 -
CD block Nathana (0003) Amenities and
Amenities available (if not available within the village, a dash (-) is shown in the column and next to it in brackets the distance in broad ranges viz.< 5 kms., 5-10 kms. and 10+ kms of the nearest place
where the facility is available is given)
~ til til
~ ::> J.l t::
" til 0 t: fa "0 "0 ~ Q) 0.
0 " til U .L> fa Vl
" 1! ::s oJ
'" C:l a.> '" -a ~~ " 0 '" > .~ e '" 0 _g '§ ....
~S 'E ~ u a '"
t!- o. "3 o ::> '" ~ u 0 '" Q) -a~t: ~ l: 0 ~ :Sl 0. " ....l 0 ] <;> '~'"
..... _ 0
t!- _g a >- .-=: ~8 a(j .s: "0 8 (f3 .2 _ "0
~<.<$
~ fa C: u ::> ca ::> '" ~ ~ " t: "0 "e-< -6 .Q .... .<:: fa g "g <= -.. _g rJ o'd"s .9 6
" ~ "'" 'O! ~ - til ..0 0 -a -a e·-=: -a.S ;:1 t;j._
e '3 ..... ~ 01 .~ IS "" 0 § .~ '" u·_ Q. all o~"O ::s ...... '" 0 .... "" '" '= Gj 5 § '" <= 0 l<l Q. _g .~ -a <= ] '" - .... Q) " J;l e ::s " ~:e en.. e ~ -a 'El 'El § :a u ....
.t: § ::I '" tf E '~.s u:=.c e ~ " 0 0 "'"
u is 0 0 Q) U ::s 0:-::: Vl 6 t: t: 6 b!l ~ eo ~ ~ Q ~~1:i u ~
2 3 4 5 6 7 8 9 10 II 12 13
Tahsil : 8athinda (0002) 'r-
II Nathana 2,383.0 7,197 1,215 P(5) M(2) HDMCW THP PO TO CM(2)CP ACS SPST BS (01045100) S(2) PUC PHCPHS SS-T PTO NCS CV« 5) RS(5-10)
TrC(IO+) PH(175) OCS NW(IO+)
12 Poohli 1,168.0 4,012 671 P(2) M S THP POPH(25) ACS BS (01045200) C(1O+) H« 5) SS-T CM(5-10) NCS CV« 5) RS(1O+)
MCW(5-IO) CP(5-IO) OC5(1O+) SP(IO+) NW(IO+) PHC(5-10) ST(5-1O)
13 Dhilwan 448.0 1,747 299 PM THP PH(10) SP BS (01045300) C(IO+) H(5-10) 5S-T PO(5-10) CM(5-10) Aq«5) CV«5) RS(1O+)
MCW« 5) CP(5-10) NCS(5-10) ST(IO+) NW(IO+) PHC« 5) OCS(5-10)
14 Gobindpura 2,791.0 7,233 1,170 P(2) M S DMHCWC THP PO PH(85) ACS SP BS (01045400) PUC HC PHS FWC 5S-T CM(5-IO) NCS CV« 5) RS(5-IO)
AC(2) RMPSMP CP(S-IO) OCS ST(5-1O) NW(IO+) C(lO+) CHW H(IO+)
MCW(S-IO) PHC(5-IO)
'15 Seman 1,105.0 3,959 691 P M S D PHS H(IO+) THP PO PH(10) ACS B5 (01045500) AC(3) MCW(5-10) SS-T CM(5-IO) NCS(5-IO) CV«5) RS(IO+)
C(1O+) PHC(5-IO) CP(S-IO) OCS(5-10) SP(S-IO) NW(IO+) ST(5-10)
16Poohla 2,249.0 5,523 967 P(Z) M S D H« 5) THP PO ACS BS (01045600) C(1O+) MCW(5-10) SS-T PH(8S) CM« 5) NCS CV« 5) RS(5-10)
PHC(5-IO) CP« 5) OCS SP(IO+) NW(10+) ST(IO+)
17 Bath 217.0 1,124 187 PM DH(5-10) THP PH(24) BS (01045700) C(lO+) MCW(5-10) SS-T PO« 5) CM(5-1O) ACS«5) CV(IO+) RS(5-10)
PHC(5-10) CP(5-10) NCS(5-10) SP(IO+) NW(IO+) OCS(5-1O) ST(5-1O)
\ 8 Lehra Dhul Kot 728.0 2,SSI 478 PM S D H(1O+) THP PO PH(3S) • ACS BS
(01045800) C(lO+) MCW(5-10) TW CM(5-10) NCS« 5) CV« 5) RS(5-1O) PHC(5-IO) SS-T CP(5-tO) OCS« 5) SP(IO+) NW(IO+)
ST(IO+)
19 Lehra Sondha 738.0 1,459 244 PM D PHS H(S-tO) THP PH(30) BS RS(5-
(01045900) C(tO+) MeW(5-10) TW PO«5) CM(5-1O) ACS« 5) CV«5) 10) PHC(5-tO) SS-T CP(5-IO) NCS« 5) SP(IO+) NW(lO+)
OCS« 5) ST(IO+)
20 Lehra Mohabat 2,670.0 8,966 1,701 peS) M(2) MCWCWC THP PO TO CMCP ACS NCS SP ST BS RS
(01046000) S C(IO+) PHC PHS SS-T PTO OC5 CV«S) NW(tO+) H(lO+) PH(120)
106

VILLAGE DIRECTORY
Village Directory
Land Use (As on 1999)
Land use (i.e. area under different types ofland use in hectare)
""0 § la 0
E ..c: c: ""0 U 0 0 :l 0 os OJ g bl) c
c- on .f; 0
8 '6 c "3 .~
0 ~ 0 .5 0 <.>
~ ~ :l 0
~ u .. ....l ., '" OJ g <E ~ E :.a gp 0 ~ ..2
::2 u 0
.~ ~ ~"3 Sl ~ j ,g
~ ~ - .. 8 ... ;., it 'Cd 0
P- o 8..9, e ""0 Fd .;: .D
..c: 8 P- g- o 0 8 0 :l ~ '-~ '" .§~ ""0 ~~ § :l os '" P- ~ bl) 0 c e ., ..
'" ~ 'E a ~ .,
'" ~ '" !1 '" OJ
"" OJ ~ ~ ~ § on os fii "" 0 0 0 'E '2 - 0 ~ ·c
<I; Z p.., z A E \.1-0 Q '" ... <I; z '" H O!?!) <J1
14 15 16 17 18 19 20 21 22 23 2
PR Bhucho (12) EA NM Khadar, GC(1976.0) 32.0 232.0 Nathana II Painted TW(810) (01045100)
Bed Sheat TWE(62.0) T(2119.0)
PR Bhucho (8) EA NM GC(584.0) 212.0 114.0 Poohli 12 TW(25S.0) (01045200) T(842.0)
.,. PR Bhucho (6) EA NM GC(255.0)
, 12.0 42.0 Dhilwan 13
TW(139.0) (01045300) T(394.0)
PR Bhucho (10) EA NM GC(1465.0) 9.0 667.0 Gobindpura 14 TW(328.0) (01045400) TWE(322.0) T(2115.0)
PR Bhucho (6) EA NM GC(732.0) 111.0 35.0 Seman 15 TW(227.0) (01045500) T(959.0)
PR Bhucho (3) EA NM GC(I130.o) 156.0 196.0 Poohla 16 TW(360.0) (01045600) TWE(407.0) T(1897.0)
PR Bhucho (8) EA NM GC(211.0) 6.0 Bath 17 T(2110) (01045700)
PR Rampura Phul EA NM Milk, OC(260.0) 1010 1010 Lehra Dhul Kot 18
(3) Dhan TW(l7I0) (01045800) TWE(95.0) T(526.0)
PR Rampura Phul EA NM 0C(146.0) 28.0 256.0 Lehra Sondha 19
(7) TW(206.0) (01045900) TWE(1020) T(454.0)
PR Bhucho (7) EA NM OC(l194.0) 714.0 178.0 Lehra Mohabat 20 TWE(584.0) (01046000) T(I778.0)
107

DISTRICT CENSUS HANDBOOK: BATHINDA
Census of India 2001 -
CD block Nathana (0003) Amenities and
Amenities available (ifnot available within the village, a dash (-) is shown in the column and next to it in brackets the distance in broad ranges viz.< 5 kms., 5-10 kms. and 10+ kms of the nearest place
where the facility is available is given)
-v:; ~ ~ 5l '" .., ..,
-'" 0 a c a -0 -0 OJ 0. 0 U -v:;
U or> § t/l 0 OJ ::s 8" c ..c '" ;; .., 0 e 'iii~ .52 g_ c c > .i: ~ 0 0 0 .~ Z ..c e 05 U !:! ..c o ~ 0. "3 o ::s ° OJ ;; '" 0
.., e~'§ ~ ~ 0
~ 0- 0
...J 0 -0 B 9 ".: til "0 Z >.~ ::s OJ
0'6 .;:;: !:! ..c -0 0 ~.~ _ -0
CCl 05 0 § ° ::s., ::s ';;;'~ ..,
0 c '" -0 C " °e<t: 1 -5 0 ::s .... a o ._ c
] .~ 0 ~ ..c c g 0'6 0 ]
o d" ~
..... ..c ~ .....:'" OJ .5 ._ 0
0 OJ :"§ O5._ S "3 ..... ~ . f·~ c u·- u 1;j
..... '" 0- 0 C ° ::s-O o~-O ._ ...
::s 0 0 l:l 0 bll OJ .... .=:: ~ .'" ~ $S c '" c 0 a 0- 'i OJ .5 ~ 0 ::s >-.
] 0 or> 0 § ::s ° ~._ C/}
e '" ]j 3 e ° '6 -'" . g t 12·~ • ~ ::s c
'" 0:-: ..c a ~
0 0 0 ::s -0 0
~ 0': 0 bll£ " u ::s 0:-':: t/l 6 f::: f::: 6 [,!l ~ S.1 :<;; Q r::;;~~ ~ ~
2 3 4 5 6 7 8 9 10 11 12 13
Tahsil : Bathinda (0002)
21 Lehra Khana 1,367.0 2,063 355 PM D PHS H(10+) THP POPH(12) SP BS (01046100) C(IO+) MCW«5) SS-T CM«5) ACS« 5) CV«5) RS(5-to)
PHC« 5) CP« 5) NCS« 5) ST« 5) NW(10+) OCS« 5)
22 Lehra Bega 1,168.0 2,922 522 PM S CWC H(IO+) THP PO PH(l3) ACS BS (01046200) AC(2) MCW(5-10) SS-T CM(5-10) NCS« 5) CV«5) RS(5-10)
C(lO+) PHC(5..J0) CP(5-to) OCS(5-10) SP(10+) NW(lO+) ST(10+)
23 Bhucho Kalan 3,290.0 6,349 1,093 PM S HAD THP PO CM ACS SP ST BS (01046300) PUC AC PHS H(IO+) SS-T PH(125) CP(5-10) NCS CV«5) RS(5-10)
C(IO+) MCW«5) OCS NW(IO+) PHC« 5)
24Butj Kahan 437.0 1,778 320 P M«5) DPHS THP PH(30) ACS SP BS Singhwala C(IO+) H(IO+) TW SS- PO« 5) CM«5) NCS(IO+) CV« 5) RS« 5) (01046400) MCW(5-10) T CP« 5) OCS(10+) ST«5) NW(to+)
PHC(5-10)
25 Bhucho Khurd 1,810.0 4,446 801 PM DPHS THP PO CM ACS NCS SP BS (01046500) C(IO+) RMP H(1O+) TW PH(160) CP« 5) OCS CV«5) RS«5)
MCW(5-l0) SS-T ST(IO+) NW(lO+) PHC(5-10)
26 Mehna 835.0 27,029 5,171 P(8) PHS H(5-10) T lIP PO CM NCS CVSPST BS (01046700) M(5) S(3) MCW(5-10) SS-T PH(155) CP(5-10) ACS« 5) RS(5-10)
PUC(2) PHC(5-10) OCS(10+) NW(lO+) C« 5)
27 Bibiwala 885.0 2,657 463 P(2) PHS H(5-10) THP POPH(60) CM ACS BS (01046800) M C« 5) MCW(5-10) SS-T CP(5-10) NCS(5-10) CV«5) RS(5-10)
PHC(5-10) OCS(5-1O) SP(IO+) NW(IO+) ST(10+)
28 Joganand 524.0 1,824 313 PM D H(5-10) THP PH(82) ACS BS (01046900) C(5-10) MCW«5) SS-T PO« 5) CM« 5) NCS« 5) CV« 5) RS(5-l0)
PHC« 5) CP(5-to) OCS« 5) SP(1O+) NW(to+) ST(10+)
29 Tungwali 3,206.0 6,293 1,040 PM S D H(IO+) THP PO CM ACS BS (01052600) C(lO+) MCW(5-10) TW PH(l20) CP(IO+) NCS CV«5) RS(IO+)
PHC(5-10) SS-T oes SP(IO+) NW(IO+) ST(IO+)
30 Chak Fateh 1,450.0 3,568 619 P M« 5) MHPHS THP PO PII(70) CP ACS BS
Singhwala C(IO+) H(IO+) SS-T CM«5) NCS(5-10) CV« 5) RS(IO+)
(01052700) MCW(5-10) OCS(5-10) SP(IO+) NW(lO+) PHC(5-10) ST(IO+)
108

VILLAGE DIRECTORY
Village Directory
Land Use (As on 1999)
Land use (i.e. area under different types of land use in hectare)
"d
16 til .,
]' -" '"
", 0 0 0 a '.;:l 0
co «I '" g .£ co > a
~ '.;:l .~ ., ., ", :; 0 0
'" 0 0 0 § .~ E .fi .... ...J ., ~ E ~ <8 ., '" a(!
~ :a tijl 0 0 ~ ., 0 ....
a(! ~ ~-g
:l
~ ~ ~ .;; 0 c: '" '" ~
.... . '" .,
.9 i:t -a ~ &2 e "C) i:I' ~ ;; .c
..c: .9 c.. " 4) E ~
:> .5 JS ", 'iii ~~ '8 '- :l
~ '" .... c.. ~ on 0 '" e ~ <U ~ '§ §'
~ 'E .a ~ «I '" til c.. i:t e on ~ c.. '" 0 .,
0 'E .;:; -s e ~
.;:
<t: Z Z ~ E ::> Z .,
p.. J,!., ,_, o on r:n
14 15 16 17 18 19 20 21 22 23 2
PR Bhucho (4) EA NM Tools, GC(606 0) 193.0 121.0 Lehra Khana 21 Khad, TW(157.0) (01046100)
Furniture TWE(290.0) T(l053.0)
PR Bhucho (5) EA NM Bricks GC(482.0) 405.0 109.0 Lehra Bega 22 TWE(172.0) (01046200) T(654.0)
')00
PR Bhucho (2) EA NM Khadar, GC(l282.0) 229.0 1218.0 Bhucho Kalan 23 Furniture TW(278.0) (01046300)
TWE(283.0) T(1843.0)
PR Bhucho (I) EA NM Furniture GC(250.0) 11.0 139.0 Burj Kahan 24 TW(21.0) Singhwala TWE(16.0) (01046400) 1(287.0)
PR Bhucho (4) EA NM Milk, GC(586.0) 134.0 830.0 Bhucho Khurd 25 Tailring, TW(98.0) (01046500)
Shoes TWE(162.0) T(846.0)
PR Bathinda (4) EA NM GC(255.0) 500.0 80.0 Mehna 26 T(255.0) (01046700)
PR Bathinda (5) EA NM GC(290.0) 40.0 470.0 Bibiwala 27 TWE(85.0) (01046800) T(375.0)
PR Bathinda (5) EA NM GC(107.0) 101.0 2.0 36.0 Joganand 28 TW(1980) (01046900) TWE(80.0) T(385.0)
PR Bathinda (10) EA NM GC(21700) 266.0 260.0 Tungwali 29 TW(5IO.0) (01052600) T(2680.0)
PR Bhucho (3) EA NM GC(906.0) 114.0 106.0 Chak Fateh 30 TW(2030) Singhwala TWE(121.0) (01052700) T(l230.0)
109

DISTRICT CENSUS HANDBOOK: BATHINDA
Census of India 2001 -
CD block Nathana (0003) Amenities and
Amenities available (if not available within the village, a dash (-) is shown in the column and next to it in brackets the distance in broad ranges viz.< 5 kms., 5-10 kms. and 10+ kms of the
nearest place where the facility is available is given)
~
'" '" e ~ =
-8 '" ~ 0 c § "" Q.
8 <> Vi' 8 J:> § VJ <1) '" 1{ c ..c '" <; ., .,
1! =a~ .£ c c > 'E ~ g '" 0 0 .~ 2 ..c E ta U ..c t!- o. :; o = 0.) ~ u '" <1) til -8 ·c 0
~ <; '"
., 0. u ~ ~
....l "" 1] 'i' ·c 1-0'- 0 <:> "0 ~.~ 2> .t= '" ., o(oj .s: t!- "" 0 - "" E9-~ ..c
§ U '" Ol '" '" ~ 0.) c
., c '"
~ ., Vl ""
o ._ u e -< c _ oS .£ '" .... ..c § c g ... _g 0.) OIl"'l o c
0.) ..... t;j t;j §- . '" til .8 ._ 0
J:l ~ 0 til til 1! .~ ta·_ :; ..... ~ .... .~ 19 E '" 0 c eo 'Q c U'_ 0. ="" 0'-''''' = .....
~ 8- .... .£ eo " ~ ~ ._ V) co;1
C '" C 0 til c E ., ~ :€ ci5~ ~ ~ ., .E t;j u :;;; § = u
~ § ]I ]I E u :a c 1;[ ,t:: ~ = 0:-::: ..0
'" 0 0 = "" <1J ·c 0 0 eo oS CI) ~ = 0:;::::
VJ 6; C: C: 6; b!,l ~ g Q, ~ ::!: Q ~~O ~ ~ 2 3 4 5 6 7 8 9 10 II 12 13
Tahsil Bathinda (0002)
31 Chak Bakhtu 890.0 2,918 475 PM THP PO PH(60) ACS SPCV« 5) BS (01052800) C(5-10) H(5-10) SS-T CM«5) NCS« 5) ST(10+) RS(10+)
MCW«5) CP«5) OCS« 5) NW(10+) PHC«5)
32ChakRam 760.0 2,663 443 P(2) M S D H(1O+) THP PH(IO) BS Singhwala C(IO+) MCW(5-IO) S5-T PO«5) CM(5-10) ACS« 5) CV«5) RS(IO+) (01052900) PHC(5-IO) CP«5) NCS(IO+) SP(IO+) NW(IO+)
~ OCS(IO+) ST(IO+)
Block Total 39903.0 129025 2264S P(55) H HA D(IS) T(32) PO(20) CM(9) ACS(20) CV ST(4) 8S(32) M(J2) DA MCW(2) HP(J2) TO(2) CP(4) NC8(10) SP(l4) RS S(IS) MH(3) CWC(3) TW(S) PTO(2) OC8(7) PUC(5) I HC PHC(2) PH(1974) T1"(3) PHS(16) FWC AC(12) RMP(2) SMP(2)
CHW
110

VILLAGE DIRECTORY
Village Directory
Land Use (As on 1999)
Land use (i.e. area under diflerent types of land use in hectare)
"t:I § til " .<:: = "t:I
]' u 0 0 ::l U
'" .~ = OIl e- o bll > 0 '.;::l .~ :a = :3 u .5 :a u u 0 u 0
§ § ::s ... -l ,u [;j 0- U <8 cIIJ '" l1P g :W :a 0 ~ ~
:::E u ::s
~ .g ~ '> cIIJ ~1l 5l
~ .._ '&i ...
= u .9 i3: 0- ... »
"t:I i3: ~ '> ~ u o ... e e .<:: .9 0- §- 0.£ u u
~ i;l "t:I 1;! ~~ '0 ""' ::l - 0. .5 <I:l ~ OIl 0 = e '" ... 1;; = ~ <I) '"
_ ::l
'E ... " '" " OJ 0. i3: i3: ~ a ~ OIl '2 a > ., § '1: 0- " 0 ~ 0 'E - 0
~ <I)
::!: 6; ~ Ei ::J ::l ... Z Q" ... "'" U !<!l Vl
14 15 16 17 18 19 20 21 22 23 2
PR Bhucho (3) EA NM Furniture, GC(845.0) 45.0 Chak Bakhtu 31 Cloth, T(845.0) (01052800)
Agri.lmpJ
PR Bhucho (4) EA NM GC(442.0) 50.0 72.0 ChakRam 32 TW(l15.0) SinghwaJa TWE(81.0) (01052900) T(638.0)
PR(32) EA(32) N(31) 0.0 GC(19829) 4960.0 2.0 6032.0 M(31) TW(5491)
TWE(3589) T(28909)
111


Map of CD Block Bathinda


INDIA PUNJAB
C.D.BLOCK BATHINDA . TAHSIL BATHINDA DISTRICT BATHINDA
Kill. 1 •
II I ·Km. I t>-~
<\ S .... " . _. '.
:::s:; -............. .......... ! .,._;.:.'-.... '
I GONlANA II.CI. II BHISIANA <:'T.
C.D. BLOCK BOUNDARY EXCLUDES STATUTORY TOWN (3)
BOUNDARIES ARE UPDATED UPTO 11.2000.
BOUNDARY, DISTRICT. " TAHSIL
C.D.BLOCK.· . VILLAGE WITH P.L.CNUMBER
HEADQUARTERS: C.D. BLOCK POPULATION SIZE CLASS OF VILLAGES:BELOW 200. 200-499,500-999.1000-4999,5000 AND ABOVE. UNINHABITED VILLAGE WITH P L.C.NUMBER URBAN AREA WITH LOCATION CODE NATIONAL HIGHWAY ... STATE HIGHWAY . . . . IMPORTANT METALLED ROAD. . . RAILWAY LINE WITH STATION,BROAD GAUGE POST OFFICE/TELEPHONE OFFICE/ POST AND TELEGRAPH OFFICE . SECONDARY OR SENIOR SECONDARY SCHOOL PRIMARY HEALTH CENTRE . BANK .. . . .
I
- - ---I OI04iiiD I
• 0 ....
fx 01041'100 I t ' V.;; I
NH.!5 SH IZA
RS
"
PO/TO/PTO S ~ B
Based upon Survey 01 India map wilh the permission of lhe Surveyor General of India.
N GAT
TO'I'AL AREA OF C.D BLOC!( (In Sq. Km) TO'I'AL POPULATION OF C.D. BLOCK . . TOTAL NUl/SOl or TOWNS IN CD. BLOC!< TOTAL NUl/SOl or VILLAGES Iii C.D BLOCK DISTANCE FROII DISTRICT HEADQUARTERS (In Kmsl·
606.00 164.204
3 57
NIL
CENSUS OF IIfDlA.200L
z
10 Government of India Copyrighl.2005.


VILLAGE DIRECTORY
ALPHABETICAL LIST OF VILLAGES (CD. BLOCK WISE)
Name of the District: Bathinda
Serial Name of 2001 Census 1991 Census Serial Name of 2001 Census 1991 Census number village location location number village location location
code number code number code number code number 2 3 4 2 3 4
Name of CD Block: Bathinda (0004) 29 Goniana Kalan 01047900 110020003000300080
Name of Tahsil: Bathinda (0002) 30 "Goniana Khurd 01048000 110020003000300079 ,
1 Ablu 01049500 110020003000300065 31 Gulabgarh Urf
2 Akalia Kalan 01048900 110020003000300075 Naiwala 01052500 110020003000300036
3 Akalia Khurd 01049000 110020003000300074 32 Har Raipur Urf Bhokhri 01047300 110020003000300084
,4 Amargarh 01048300 110020003000300081 33 Jandanwala 01047400 110020003000300088
5 Baho Jattri 010$1900 110020003000300050 34 Jassi Pauwali 01052300 110020003000300032
6 Baho Sibian Patti Basawa Singh 01051700 110020003000300048 35 Jeeda 01047600 110020003000300087
7 Baho Sibian Patti 36 Jhumba 01051100 110020003000300055
Dharam Singh 01051800 110020003000300049 37 Jodhpur Romana 01052200 110020003000300031
8 Balahar Mehma 01049100 110020003000300070 38 Karamgarh Sattran 01050800 110020003000300057
9 Balahar Vinjhu 01048200 110020003000300077 39 Katar Singhwala 01053200 110020003000300037
10 Baluana 01050500 110020003000300053 40 Khemuana 01047500 110020003000300089
II Behman Dewana 01050200 110020003000300043 41 Khialiwala 01047200 110020003000300083 , 12 Bhagu 01046600 110020003000300039 42 Killi Nihal
13 Bhokhra 01047100 110020003000300082 Singhwali 01049800 110020003000300064
14 BirBehman 01050300 110020003000300044 43 Kot Shamir 01053100 110020003000300034
15 Birtalab Urf Talab 44 Mehma Bhagwana 01049700 110020003000300063
Neehar 01051400 110020003000300045 45 Mehma Sarja 01048600 110020003000300067
16 Buladewala 01050100 110020003000300042 46 Mehma Sarkari 01049600 110020003000300066
17 Burj Mehma 01049900 110020003000300061 47 Mehma Sawai 01048700 110020003000300069
18 Chak Goniana Kalan 01048100 110020003000300078 48 Mian 01051600 110020003000300047
19 Chak Goniana Khurd 01048800 110020003000300076 49 Multania 01051300 110020003000300046
20 Chak Jandanwala 01047700 110020003000300085 50 Naruana 01051500 110020003000300030
21 Chak Jeeda 01047800 110020003000300086 '51 Nehianwala 01048400 110020003000300068
22 Chugha Khurd 01050400 110020003000300052 52 Phus Mandi 01052400 110020003000300038
23 Dan Singhwala 01049200 110020003000300071 53 Sardargarh 01050900 110020003000300056
24 Deon 01050000 110020003000300062 54 Sibian 01048500 110020003000300041
25 Ganga 01049400 110020003000300072 55 Teona 01051200 110020003000300051
26 Gehri Devi nagar 01053300 110020003000300033 56 VirkKalan 01050600 110020003000300059
27 Ghugha Kalan 01051000 110020003000300054 57 Virk Khurd 01050700 110020003000300058
28 Gill Patti 01047000 110020003000300040 58 Warkandi 01049300 110020003000300073
115

DISTRICT CENSUS HANDBOOK: BATHINDA
, Census of India 2001 -
CD block Bathinda (0004) Amenities and
Amenities available (if not available within the village, a dash (-) is shown in the column and next to it in brackets the distance in broad ranges viz.< 5 kms., 5-10 kms. and 10+ kms of the nearest place
where the facility is available is given)
~ <I)
~ ~
::> ~ <I) <I) 0 c § '0 '0 ~ .,
§ 0.
0 0 <I) U ..0 1/J u ., ::> ,; c .c <I) ;:; ., " "§ ~~ u c c ;>
.~ e- " 0 0 .~ il .c a 'E ~ u .c ~ 0. -= o ::> <I) ~ u ... ;:; " " OJ ~'r: :;; ~ 0
~ <I) 0. .~
-l 0 :9 ]] 9 ~.~ ~ ._ 0 il > .':: ::> .,
o:d ~ 0 8 61d .:;: .c '0 _ '0
! <I) c <I) § C <I) ::> til ::> <I) ~
<I) '0 o .- uS~ C • .;:; .9 " .... ..c: § C g ... 0 ~ ~gE o C ., ..... 1;j .c ~ • Vl '.::: 0 ..0 .:;: 0 -;; OJ ~ .'::
cd ,-< ;::) ... -S .. :; .....
C ~ on .~ C u·- .~ 19 " .....
~ 0. 0
0 on <\) ::>'0 o~'O C '" C 0 8. 1i 'i -;; C ]] " .:::: ~ ';j ~ 5 ~ ~ <I) u :.!2 a " u ~ :.e CI'J" OJ
~ ~ ~ a u ~ C a ,~ t a ~ ·c " Vl u:::::.o
" " '0 <I)
~ 0 0 on.;:; ~~-5 a] 1/J 6; C: C: 6; ~ ~ p... \.1 ~ Q
2 3 4 5 6 7 8 9 10 II 12 13
Tahsil Bathinda (0002)
I Bhagu 1,164.0 1,905 331 PM HCRMP THP PH(IO) CM SP BS (01046600) (5-10) H(5-10) SS-T PO«5) CP(5-10) ACS(5-10) CV«5) RS« 5)
MCW(5-10) NCS(5-10) ST(5-10) NW(IO+) PHC(5-10) OCS(5-10)
2 Gill Patti 883.0 2,957 529 PM S DH MH CWC TB T HP SP BS (01047000) C(5-10) NHOH(5-10) SS-T PO«5) CM(5-10) ACS« 5) CV«5) RS(5-10)
MCW(5-l0) PH«5) CP(5-10) NCS(5-10) ST(lO+) NW(lO+) PHC(5-1O) OCS(5-10)
3 Bhokhra 1,180.0 3,786 664 P(2) HHD THP ACS BS (01047100) MS PHS H(lO+) SS-T PO«5) CM(5-10) NCS« 5) CV« 5) RS«5)
C(5-10) MCW«5) PH«5) CP(5-10) OCS« 5) SP(IO+) NW(IO+) PHC« 5) ST(IO+)
4 Khialiwala 1,045.0 2,542 415 P(2) M THP PO 'l- ACS BS (01047200) C{lO+) H(IO+) SS-T PH(45) , CM(5-IO) NCS(5-IO) CV« 5) RS(5-10)
MCW(5-10) CP(5-10) OCS(5-10) SP(lO+) NW(lO+) PHC(5-10) ST(IO+)
5 Har Raipur Urf 1,877.0 3,948 639 P(2) M S PHS H(IO+) THP PO CM ACS SP BS Bhokhti C(lO+) MCW(IO+) SS-T PH(75) CP(5-1O) NCS(5-10) CV«5) RS(IO+) (01047300) PHC(IO+) OCS(5-IO) ST(IO+) NW(IO+)
6 Jandanwala 2,346.0 4,737 780 PM S DCWCHC THP PO ACS SP BS (01047400) C{lO+) RMPH(lO+) TW PH(70) CM(5-IO) NCS CV«5) RS(lO+)
MCW(5-10) SS-T CP«5) OCS ST(5-10) NW(lO+) PHC(5-10)
7 Khemuana 768.0 2,724 454 PM S D H(IO+) THP PO ACS BS (01047500) C(IO+) MCW(5-IO) SS-T PH(45) CM(5-IO) NCS(5-IO) CV«5) RS(IO+)
PHC(5-IO) CP(5-IO) OCS(5-IO) SP(IO+) NW(IO+) ST(IO+)
8 Jeeda 1,651.0 5,134 838 P(3) M S HDMCW THP PO ACS SP CV«5) BS (01047600) C(lO+) PHC PHS SS-T PH(l65) CM« 5) NCS ST(5-10) RS(5-1O)
RMP CP~< 5) OCS NW(lO+)
9 Chak 43.0 Jandanwala -------- Uninhabited -----------(01041700)
10 Chak Jeeda 364.0 (01047800) -------- Uninhabited -----------
II Goniana Kalan 713.0 1,801 323 P M« 5) THP PH(47) BS
(01047900) C(lO+) H(lO+) SS-T PO«5) CM(5-10) ACS« 5) CV«5) RS(5-10) MCW(5-10) CP(5-10) NCS(5-10) SP(IO+) NW(lO+) PHC(5-10) OCS(5-10) ST(IO+)
116

VILLAGE DIRECTO.RY
Village Directory
Land Use (As on 1999)
Land use (i.e. area under different types ofland use in hectare)
"0 § til '"
~ ..c:: c "0 {j 0 ::l 0 (j
'" 'g e OIl c
.q OIl .~ .~ ., ... "0 .5 '3 u 0 "0 U
~ C
~ ::l u 0
.~ 'U ... ...J <!)
'" <J c <B clI:l ~ :a Rf 0 e v '" ~
u ::l
~ ::c ... .s; o'd
~'3 0 '" ~ c » -.... '" :;; ...
.9 ~ is. ... >. ~ ...
~ o ... e "0 ~ 'S; .0
..c .9 0. Q..g
... .!! § u ::l "0 'OJ a ""' '" 1;; '" 0. .5.r:! ... OIl ~~ 0 c e ~ ...
'" 1;; a E a ~ c:: ... _ ::l'
'" <!) O! Q. ~ at ~ § ~ OIl ~ Q. '" 0 ~ 0 'E '2 3 e '" ·c
::!: 6; ~ Ei ~ ~ ... eo. &!o "" U !1!l ;;;:; <;!l
14 15 16 17 18 19 20 21 22 23 2
PR Bathinda (12) EA NM GC(3090) 33.0 528.0 Bhagu TWE(294.0) (01046600) T(603.0)
PR Bathinda (7) EA NM GC(S29.0) 190.0 11.0 90.0 Gill Patti 2 TWE(63.0) (01047000) T(592.0)
PR Goniana (3) EA NM Wheat, GC(797,0) 12,0 93.0 Bhokhra 3 Milk TW(198.0) (01047100)
TWE(80.0) T(l07S.0)
PR Goniana (S) EA NM GC(701.0) 17,2 770 Khialiwala 4 TW(169,0) (01047200) TWE(81.0) T(95 1.0)
PR Goniana (S) EA NM GC(1213.0) 208.0 112.0 Har Raipur Urf 5 TW(180.0) Bhokhri TWE(I64.0) (01047300) T(15STO)
PR Goniana (10) EA NM TW(16.0) 2004,0 140,0 Jandanwala 6 TWE(186.0) (01047400) T(202.0)
PR Goniana (13) EA NM GC(506.0) 95.0 75.0 Khemuana 7 TW(51,0) (01047500) TWE(41.0) T(5980)
PR Goniana {I 0) EA NM GC(837.0) 206.0 130.0 Jeeda 8 TW(284,0) (01047600) TWE(194.0) T(I3IS,O)
Chak Jandanwala 9 ------- Uninhabited ----------- (01047700)
Chak Jeeda 10
-------- Uninhabited ------------ ." (01047800)
PR Goniana(S) EA NM 0,0,0 GC(377.0) 3S.2 61.0 Goniana Kalan II TW(120.0) (01047900) TWE(120.0) T(617.0)
117

DISTRICT CENSUS HANDBOOK: BATHINDA
Census of India 2001 -
CD block Bathinda (0004) Amenities and
Amenities available (if not available within the village, a dash (-) is shown in the column and next to it in brackets the distance in broad ranges viz. < 5 kms., 5-10 kms. and 10+ kms of the nearest place
where the facility is available is given)
~ ~ '" 12 1::
'" '" 0 c: § " """ ~ e Q..
8 t> '" .c § Vl U :::I .;
c: .J: '" '" .,
OJ ~~ c: 8 c: > <.)
·i 3 '" _g .~ ~ ..c E ·E ~ u ~ fr o :::I '" ~ .., '" '" 0 l 0 '" 0. .~ C; .g -c ;;; ~ ....l " ~ 9
1-0 ._ 0 0
"0 i> .~ a;> .-=: :::I .,
o(! .;;: ~ ..c "" 0 - """ Sed ~ § u C 0 :::I Ol :::I ;g 1l= ~ '" c: " "'s"'< -5 .9 :::I .... § o .-.. !l _g ., .<:: c~ ~ o'd ue o d"
'" ~ ..... t;! t;! §' .~ .9 .c 0 to OJ e:ii OJ.5 :::I
S "3 ""' 1l= on c: U .- .., t;! os 0. 0 c: 'g 0'-"''' ·5 1;; :::I ""' ~ 0 "" d) E ~ c: 0 0 ~ .~ to c: ~
.~ ~.5 0.
.~ :Q E :::I U ~:~ en" E ~ to ~ l'l 5 E u " c: 1i E .~ t E 1l= ·c :::I u:-== ..0
'" 0 0 :::I " .,
~ 0 0 ""-5 ~~-§ 0::: !a Z E:: E:: Z bY ~ e, \",.1 ~ Q \,.l ~
2 3 4 5 6 7 8 9 10 II 12 13
Tahsil Bathinda (0002)
12 Goniana Khurd 530.0 2,029 326 P(2) M THP PH(30) BS (01048000) C(lO+) H«5) SS-T PO«5) CM(5-10) ACS« 5) CV« 5) RS(5-10)
MCW(5-10) CP(5-10) NCS(IO+) SP(IO+) NW(IO+) PHC(5-10) OCS(lO+) ST(5-10)
13 Chak Goniana 100.0 Kalan -------- Uninhabited -----------(01048100)
14 Balahar Vinjhu 547.0 1,849 311 P(2) DMHHCPHS THP PH(32) ACS BS (01048200) M«5) NHRMPH«5) TW PO« 5) CM« 5) NCS CV«5) RS(5-lO)
C(IO+} MCW(5-10} SS-T CP« 5} OCS(5-10} SP(JO+) NW(lO+} PHC(5-10) ST(lO+)
15 Amargarh 496.0 1,054 195 PM PHS H(IO+) THP PO BS (01048300) C(IO+) MCW«5) SS-T PH(20) CM« 5) ACS« 5) CV« 5) RS«5)
PHC« 5) CP«5) NCS« 5) SP(IO+) NW(IO+) OCS« 5) ST(IO+)
16 Nehianwala 1,702.0 6,083 1,059 P(3} M HHDDADH THP PO CM ACS SP CV« 5) BS (01048400) C(IO+) MH HC PHS TW PH(l25) CP(5-JO) NCS ST(lO+) RS(5-10)
NHRMPSMP SS-T OCS NW(IO+} MCW«5) PHC« 5)
17 Sibian 1,374.0 5,417 945 P(3) M S HUDDAMH THP PO CM ACS SP BS (01048500) PUC CWCTBNH SS-T PH« 5) CP(5-10) NeS eV« 5) RS(IO+)
C(lO+) o H« 5) oes ST(IO+) NW(10+) MCW(5-10) PHC(5-10)
18 Mehma Sarja 2,773.0 7,060 1,263 P(5) M S THP PO CMCP ACS SP ST BS (01048600) PUC AC H(5-10) TW PH(155) NCS CV«5) RS(5-IO)
C(IO+) MCW(5-10) SS-1 OCS NW(IO+) PHC(5-10)
19 Mehma Sawai 1,637.0 4.699 758 P(4) THP PO ACS BS (01048700) AC(2) H(lO+} SS-T PH(50) CM(5-10) NCS CV«5) RS(5-10}
M«S} MCW(S-IO) CP(S-IO) OCS SP(IO+} NW(IO+) C(IO+) PHC(S-IO) ST(5-10}
20 Chak Goniana 126.0 Khurd -------- Uninhabited -----------(01048800)
21 Akalia Kalan 1,578.0 4,179 691 P(3) DPHS THP PO ACS AS
(01048900) MS H(5-10) SS-T PH(41) CM(5-10) NCS CV« 5) RS« 5) C(lO+) MCW(S-IO) CP(5-lO) OCS SP(lO+) NW(IO+)
PHC(5-10) ST(5-10)
118

VILLAGE DIRECTORY
Village Directory
Land Use (As on 1999)
Land use (i.e. area under different types of land use in hectare)
" [;j liI '" 5 ..c c: " u
'" 0 0
"'" os .~ <.>
g OJ) c: Q OJ) .:::: 0
tl OJ :;;; .5 .!§ .~
c: 0 " u u
~ ~ '" 0 .~
¥ u ..s -l
OJ g <Ill :W :;;; ~ 0 OJ
::E u
'" ::0 OJ .;; <Ill ~i3
o· ~ os OJ)
c: ..Q '" ~ ,g ... B ~ ... >. ~
OJ Q,
OJ o ... e " ~ .;; D
~ B Q, §' E'~
OJ OJ § '" 'iii .... ~ '" " ~~ '0 ... . Q,
~ OJ) 0 c: e .- ... t; c:
~ '" - '" 'E a ~ OJ Ol 0- ~ ~ [ij ~ OJ) os § Q, OJ ~
OJ 0 'E '2 - 0 ~ .t:
..;; Z Z ::E E ~ '" ... OJ (.!., = (.) !?!) z '"
14 15 16 17 18 19 20 21 22 23 2
Goniana(3) EA NM GC(41S.0) 62.0 42.0 Goniana Khurd 12 TW(11.0) (01048000) T(426.0)
Chak Goniana 13 -------- Uninhabited ----------- Kalan
(01048100)
PR Goniana(l) EA NM 0,0,0 GC(383.0) 23.0 134.0 Balahar Yinjhu 14 TWE(7.0) (01048200) T(390.0)
PR Goniana (2) EA NM Wheat GC(360 0) 18.0 44.0 Amargarh 15 TW(400) (01048300) TWE(34.0) T(434.0)
PR Goniana(l) EA NM GC(1144.0) 173.0 188.0 Nehianwala 16 TW(101.0) (01048400) TWE(96.0) T(1341.0)
PR Bathinda (7) EA NM GC(975.0) 128.0 Sibian 17 TW(2710) (01048500) T(1246.0)
PR Goniana (7) EA NM GC(2277.0) 180.0 214.0 Mehma Sarja 18 TWE(102.0) (01048600) T(2379.0)
PR Goniana (7) EA NM GC(1210.0) 125.0 302.0 MehmaSawai 19 T(l21O.0) (01048700)
Chak Goniana 20
-------- Uninhabited ----------- Khurd (01048800)
.,_
PR Goniana (7) EA NM 0,0,0 GC(952.0) . 125.0 141.0 Akalia Kalan 21 TW(251.0) (01048900) TWE(109.0) T(l312.0)
119

DISTRICT CENSUS HANDBOOK: BATHINDA
Census of India 2001 -
CD block 8athinda (0004) Amenities and
Amenities available (if not available within the village, a dash (-) is shown in the column and next to it in brackets the distance in broad ranges viz.< 5 kms., 5-10 kms. and 10+ kms of the nearest
place where the facility is available is given)
-;i;' t! .. ~ !il ~ 0 co @ -co P-"Q <n ..
Q u U ..c ~ <fl u <1.> '" oJ c: .c U) ;; '"' ..
i =a~ (.)
0 co c: ;.. ·E ~ ·i 2- d ~ 0 .~ .c E .c
(.) .. P- o '" .. i;' U) 0)
., Ol ~.I: U) ~ 0 OIl 0 P- .::! !(l ~ ::§ 0 -0 1l 9 .... - B o(j t!- "0 ~.~ ;: >.- c:l~ .;;; .c "0 0
_ -0 ~O:I
~ @ <.:J , - "(;j~ ~ :::, 4> .. c: "0 c: ., (.) S
.& .s .9 '" .... o .-I; _g ° .c § c: g o(jO] .~ g ..c ~
..... ~ ~ fil- • U) 1'3.S ~._.
e 0 "3 ..... Ol ::: ... 1'3 e·t:: .;! e ~ 0 co OIl .~ c:: u·-:s ....
~ P-
.~ on '" ","0 .g ~"N co '" c:: 0 0
~ 1'3 co B ., ~ ~ ~ ~ P-
Ol '" (.) :S2 E :::l <.> ~ :€ <fl.
~ ~ "5 (.) :.a t;f u .... .c:: :s c:: 6 ~~
u:::..o S}; 4> 0 ::> .", ~
. .: 0 0 ~~~ 0·-10 ;?; ~ ~ b !,Y Q p.. \.i U:
2 3 4 5 6 7 8 9 10 II 12 13
Tahsil : Bathinda (0002)
22 Akalia Khurd 314.0 522 89 P M« 5) THP PH(9) BS (01049000) C(lO+) H(IO+) SS-T PO« 5) CM(5-1O) ACS« 5) CV(S-IO) RS« 5)
MCW«5) CP(5-10) NCS(5-10) SP(lO+) NW(IO+) PHC« 5) OeS(5-10) ST(lO+)
23 Balahar Mehma 668.0 1,584 277 PM THP PH(25) BS (01049100) C(IO+) H(5-10) SS-T PO«5) CM(5-10) ACS« 5) CV«5) RS(S-IO)
MCW,-S-IO) CP(S-IO) NCS« 5) SP(IO+) NW(10+) PHC(5-IO) OCS« 5) ST(IO+)
24 Dan Singhwala 1,492.0 2,863 470 P(2) M DDA PHS THP PH(40) ACS BS (01049200) C(lO+) H(lO+) SS-T PO«5) CM(5-IO) NCS« 5) CV« 5) RS« 5)
MCW(IO+) CP(S-IO) OCS« 5) SP(to+) NW(tO+) PHC(IO+) .~ ST(tO+)
25Warkandi 377.0 1,299 216 PM« 5) THP PH(16) BS (01049300) C(IO+) H(IO+) SS-T PO« 5) CM(IO+) ACS« 5) CV« 5) RS(IO+)
MCW(IO+) CP(IO+) NCS(IO+) SP(IO+) NW(IO+) PHC(IO+) OCS(IO+) ST(IO+)
26 Ganga 1,171.0 2,844 475 PMS DRMP THP PO ACS SP BS (01049400) C(1O+) H(IO+) SS-T PH(37) CM(lO+) NCS(IO+) CV«S) RS(tO+)
MCW(S-IO) CP(lO+) OCS(lO+) ST(IO+) NW(lO+) PHC(5-10)
27 Ablu 3,S24.0 6,690 1,074 P(6) M DPHS THP PO ACS BS (01049500) C(1O+) H(lO+) SS-T PH(50) CM(lO+) NCS CV« S) RS(IO+)
MCW(IO+) CP(IO+) OCS. SP(IO+) NW(lO+) PHC(LO+) ST(IO+)
28 MeJuna Sarkari 607.0 I,S71 257 P(3) D H(5-JO) THP PH(20) ACS BS (01049600) M«5) MCW(5-10) SS-T PO«5) CM« 5) NCS(5-IO) CV« 5) RS(S-IO)
C(5-10) PHC(5-10) CP« 5) OCS(S-IO) SP(lO+) NW(lO+) ST(lO+)
29 Mehma 637.0 1,389 247 P M« 5) THP PO BS
Bhagwana C(10+) H(lO+) SS-T PH(lS) CM« 5) ACS« 5) CV« 5) RS(IO+)
(01049700) MCW(5-10) <;:P« 5) NCS(S-tO) SP(lO+) NW(lO+) PHC(S-IO) OCS(5-10) ST(IO+)
30 Kitli Nihal 575.0 2,385 397 PM S DPHS THP PH(50) NCS BS Singhwali C(lo+) H(IO+) SS-T PO«5) CM«5) ACS« 5) CV«5) RS(5-IO)
(01049800) MCW(5-IO) CP(S-IO) OCS(5-10) SP(IO+) NW(IO+) PHC(5-10) ST(lO+)
31 Burj Mehma 1,222.0 3,518 615 PM S DDA THP PO ACS SP BS (01049900) C(lO+) PHS H(lO+) SS-T PH(60) CM« 5) NCS(S-IO) CV«5) RS(5-JO)
MCW(5-IO) CP« 5) OCS(5-10) ST(IO+) NW(IO+) PHC(5-10)
120

VILLAGE DIRECTORY
Village Directory
Land Use (As on 1999)
Land use (i.e. area under different types ofland use in hectare)
.",
ta til <I)
j .c: c -0 U 0 0 :::s (.)
'" .~
e, 00 c a Oll .E; 0
<I) :a c "3 .~ ... :a u u .5 0 u 0
§ ~ :::s .. ....l ... !;j ~ u ~
'" <I) c <:11.!
~ :a gp 0 u '0 ., u ..
<:11.! ~ !l.", .::s <I) ~ <I)
.;; 0 ~
Oll
C ;>-. '" ~ ~ .. .9 ~ 0. .. t: ~ ;>-. ~
0)
e "" ~ .;;
~ -5 .9 0. ~ 8.5 ., <I) ::s i! ._
1;; '" .§ <f! "'" ~- 0 '" 0. Q) bll 0 C e .. c ~ u '"
_ ::s 1;; i! 'E B ~ ...
~ 0. ~ ~ ~ a ~ bll <IS ~ ."" .,
0 .,
0 'E .;:;
- 0 ~ u ..; Z p... Z ~ E J,l., ;:) :::s .. < z ,_, o bQ en 14 15 16 17 18 19 20 21 22 23 2 1
PR Goniana (8) EA N GC(229.0) 24.0 Akalia Khurd 22 TW(41.0) (01049000) TWE(20.0) T(290.0)
PR Goniana (8) EA NM GC(445.0) 135.0 88.0 Balahar Mehma 23 T(44S.0) (01049100)
PR Kot Fatta (3) EA NM GC(102S.0) 2S0.0 217.0 Dan Singhwala 24 T(102S.0) (01049200)
PR Goniana (18) EA NM GC(202.0) 950 Warkandi 25 TW(400) (01049300) TWE(40.0) T(282.0)
PR Goniana (13) EA NM GC(965.0) , 12S.0 81.0 Ganga 26 T(96S.0)" (01049400)
PR Goniana (IS) EA NM GC(23730) 811.0 7l.0 Ablu 27 TW(12LO) (0 I 049S00) TWE(148.0) T(2642.0)
PR Goniana (8) EA NM GC(478.0) 11.0 42.0 Mehma Sarkari 28 TW(76.0) (01049600) T(5S4.0)
PR Goniana (IS) EA NM GC(4S6.0) 82.0 50.0 Mehma 29 TW(49.0) Bhagwana T(SOS.O) (01049700)
PR Goniana (19) EA NM GC(452.0) 49.0 66.0 KilliNihal 30 TWE(8.0) Singhwali T(460.0) (01049800)
',..
PR Bhucho (21) EA NM GC(9S0.0) 120.0 IS2.0 Burj Mehma 31 T(9S0.0) (01049900)
121

DISTRICT CENSUS HANDBOOK: BATHINDA
Census of India' 2001 -
CD block Bathinda (0004) Amenities and
Amenities available (if no! available within the village, a dash (-) is shown in the column and next to it in brackets the distance in broad ranges viz.< 5 kms., 5-10 kms. and 10+ kms of the
nearest place where the facility is available is given)
~ ~ ]' ::l Vl .., <.n "'" 0
"'" t: § " 0-
~ ..,
0 t) <.n U .0 ai C/J 0 .., ::l 8' t: ..c C'l <; " ~ 1!! =a~ 'g 2-
t: 'i! ~ .., 0 0 '! a ..c S u t!. ..c
0 .., 0. .., :; o ::l .., 1;' 0
~ :5 Vl " 0. U (;j .g 'C ;;: ~ ,.J 0 "0 ~ 'i' .~ V>
'- ._ 0
c:!- o a > ."!::: ::l ..,
cl1I '> ..c "'" 0 cp .~ - "'" 6~ § 0 ::l Cil ::l .., ..,
'" ..,
"0 <= OJ '" i!= <.n us"':: OD .£ 0 ::l .... § o ,_ c: • .... ~ .~ 0
.., ..c t: g <id,,] .9 § ..8 ~
.... ..c tij §- ...:'" til ,5 0 til til tij._ e: :; ""' i!= 6h e·~ <= u·- .2 !9 ol 0. 0 c: .~ ","0 0,-,"0 ::l ""' <.> 0 ... 0 on ..!:! ~~
._ til ~ t: '" c:: 0 ~ 0. 0) .~ til <= B .., ;; .~ ci5 ~ ~ -;; .., .0 0 :;;: S ::l <:>
§ '$ '$ s '-' :a t: s .g ~ ~.-=:: "' ·c '" 1;;; (,,)::::..0 .., 0 0 ::l " .., ·c 0 0 OD£ .., U ::l 0==
C/J 6; t:: t:: b H,l :::; g p.. ~ ::0:: Q a:;~u ~ ~ 2 3 4 5 6 7 8 9 10 11 12 13
Tahsil : Bathinda (0003)
32Deon 2,162,0 6,487 1,124 P(2) M(2) DDAHC THP PO ACS BS (0 I 05OOOO} S C(lO+} PHSFWC SS-T PH(88} CM(5-10} NCS CV« 5) RS(IO+)
RMP(2) H(1O+) CP(5-IO) OCS SP(lO+) NW(lO+) MCW(5-10) ST(5-10} PHC(5-10)
33 Buladewala 708,0 2,345 416 PM S THP PH(50) BS (01050100) C(5-10) H(5~0) TW PO(5-1O) CM(5-10) ACS« 5) CV« 5) RS(5-10)
MC (5-10) SS-T CP(5-10) NCS(5-10) SP(IO+) NW(IO+) PHC(5-10) OCS(5-10) ST(IO+)
34 Behman 1,749,0 4,981 875 P(3) o PHS THP PO ACS BS RS Dewana M(2) S H(5-10) TW PH(65) CM(5-10) NCS CV«5) NW(IO+) (01050200) PUC MCW(5-10) SS-T ',,_ CP(5-10) OCS SP(1O+)
C« 5) PHC(5-10) ST(5-10)
35 Bir Behman 699,0 2,224 370 PM DPHS THP PO ACS BS (01050300) C(IO+) H(5-10) TW PH(45) CM« 5) NCS(5-10) CV«5) RS« 5)
MCW(S-IO) SS-T CP(5-10) OCS(5-10) SP(IO+) NW(lO+) PHC(5-lO) ST(5-10)
36 Chugha Khurd 844.0 2,245 407 PM AC THP PH(16) BS (01050400) C(1O+) H(10+) TW PO« 5) CM«5) ACS«5) CV« 5) RS« 5)
MCW(lO+) SS-I CP« 5) NCS(IO+) SP(IO+) NW(10+) PHC(IO+) OCS(IO+) ST(10+)
37 Baluana 1,798,0 4,449 796 PM S DMCW THP PO CMCP ACS SP BS (01050500) PUC HCPHC SS-T PH(65) NCS CV« 5) RS
C(IO+) PHS H(IO+) OCS ST(IO+) NW(IO+)
38 Virk Kalan 1,329.0 2,520 445 PM S HDPHS THP PO CM ACS BS (01050600) PUC MCW(5-10) TW PH(60) CP(5-10) NCS(5-tO) CV« 5) RS(IO+)
C(1O+) PHC(5-10) SS-T OCS(5-10) SP(1O+) NW(lO+) ST(IO+)
39 Virk Khurd 720,0 1,850 313 P M«S) THP PO BS (01050700) C(lO+) H(lO+) TW PH(46) CM« 5) ACS« 5) CV« 5) RS(IO+)
MCW(5-10) SS-T . CP(5-10) NCS(S-to) SP(IO+) NW(lO+) PHC(5-10) OCS(5-10) SI(5-10)
40 Karamgarh 478.0 1,371 209 P M«5) THP PH(41) BS , Sattran C« 5) H(IO+) SS-T PO«5) CM« 5) ACS« 5) CV« 5) RS(5-IO)
(01050800) MCW«5) CP(5-10) NCS« 5) SP(IO+) NW(IO+)
PHC« 5) OCS«5) ST(10+)
41 Sardargarh 989,0 2,109 350 P(2) M S DPHS THP PO BS
(01050900) C(1O+) H(lO+) SS-T PH(81) CM«5) ACS« 5) CV« 5) RS MCW(5-IO) CP(5-10) NCS« 5) SP(IO+) NW(10+) PHC(5-10) OCS« 5) ST(5-10)
122

VILLAGE DIRECTORY
Village Directory
Land Use (As on 1999)
Land use (i.e. area under different types of land use in hectare)
"0
a a <I)
]' .<: r= "0 0 0 0 &l
~~ 0
g Ol) c
~ Ol) 0 c -3 .~
8 <> :a 0
.~ 0 ::> 0 0
~ E U ..... .....l
<> E ~ <B ., g o):f ~ :a ~ 0 0 '" 0 .... =: o):f
~-g ::>
m ~ 1;h .;;: 0 c: >- ~
Vl 'ia ~ .... .9 ~ 0. .... ;., ~ " <> 8.2 e "0 ~
.;;: J:J .<: .9 0- 0- 0 0 E
.0 ::> '" .5.s "0 0; :g~ '0 ""' ::> '" - <n 0- B Ol) 0 c e ~
.... Vl - 'E a ~ c
" 0 - ::> Vl '" '" <a 0- ~ ~ ~ a' ~ Ol) '2 i!::! § ·c 0- .,
0 .,
0 'E - 0 " ~ ;;:;; ;;:;; ~ S :2 ::> ....
~ 6 e, '" = u Ol) '" 14 15 16 17 18 19 20 21 22 23 2
PR Goniana (9) EA NM OC(19020) 162.0 79.0 Deon 32 TW(19.0) (01050000) T(1921.0)
PR Bathinda (11) EA NM GC(495.0) 88.0 55.0 Buladewala 33 TW(55.0) (01050100) TWE{15.0) T(565.0)
PR Bathinda (10) EA NM 0C(1402.0) 193.0 69.0 Behman Dewana 34 TW(85.0) (01050200) T(1487.0)
PR Bathinda (7) EA NM 0C(622.0) 33.0 39.0 BirBehman 35 TW(S.O) (01050300) T(627.0)
PR Bathinda (17) EA NM GC(737.0) 23.0 62.0 Chugha Khurd 36 TW(22.0) (01050400) T(759.0)
PR Oiddarbaha EA NM Cloth, 0C(1415.0) 213.0 139.0 Baluana 37 (13) Tools For TW(31.0)
.,. (01050500) .
Culti., T(1446.0) .Furniture
PR Giddarbaha EA NM GC(846.0) 336.0 77.0 VirkKalan 38 (12) TW(l7.0) (01050600)
TWE(53.0) T(916.0)
PR Oiddarbaha EA NM GC(654.0) 43.0 VirkKhurd 39 (10) TW(21.0) (01050700)
TWE(2.0) T(677.0)
PR Oiddarbaha EA NM GC(4IS.0) 3.0 54.0 Karamgarh 40 (10) TW(3.0) Sattran
T(42 1.0) (01050800)
PR Giddarbaha (7) EA NM 0C(788.0) 97.0 79.0 25.0 Sardargarh 41 T(788.0) (01050900)
123

DISTRICT CENSUS HANDBOOK: BATHINDA
Census of India 2001 -
CD block Bathinda (0004) Amenities and
Amenities available (ifnot available within the village, a dash (-) is shown in the column and next to it in brackets the distance in broad ranges viz.< 5 kms., 5-10 kms. and 10+ kms of the
nearest place where the facility is available is given)
~ <Ii'
~ " ~ VI .., lil ,;:: "'" 0
""0 <Ii' .., § ""0 C.
8 t> § r:/) .., ::I U .0 ai c ..c ~ u " 03 =a~ .~
<:> ,;:: >- u
2- .., <:> _g .~ .... ·E~ u ~ Z .c E
u .., C. .... '8 o ::I .., ~ 0 [;f <5 VI
.., .., 03 .g .';:: ;;: ~ c. ,....l 0 ""0 11 '( '~.g B·- 0 :=
~ 0- >.1:0 ::I ..,
0<3 .> .c .""0 0 _ ""0 e:.~ ~ c '" , ~§ u ::I O! ::I '" ~ .., VI ""0 ,;:: <II
U E-< £ .9 ::I .... o .- c • ] ::l 0 '" .c § c g 0<3,",] .9 5 '- 'OJ ~ .> 0 .c 'OJ • VI 03 .5 'OJ.-a "3 ._ 03 ~ 03 ~.;:: u'Oj
'" C. 0 C 01) .~ ,;:: u·-::I '- ~ .9 bJ) .., zll o~""O .§ t; ,;:: 0 8. ~ 'OJ
03 c 11 '" - .... 0.:1 a3 !S 03 ~
.0 u :;;; ~ ::I <.> ~:e ":. ~ ~ "B "B a u 'i3 tf .~ 0 ·c ::I ,;::
::I '"' i5 Q:-=.c
'" 0 0 ""0 0 0 bJ)£ '" Q ::I o~ !a 6 C: C: 6 1,!,l ~ eo 1..1 ~ Q ~<iSu ~'"
2 3 4 5 6 7 8 9 10 II 12 13
Tahsil : Bathinda (0003)
42 Ghugha Kalan 1,847.0 3,734 703 P(2) M(2) o PHS H(lO+) THP PO ACS BS (01051000) S PUC MCW(5-10) SS-T PH(97) CM«5) NCS«5) CV«5) RS«5)
C(IO+) PHC(5-10) CP«5) OCS« 5) SP(IO+) NW(IO+) ST(IO+)
43 Jhumba 1,819.0 4,069 720 PM S DH(lO+) THP PO CM CP(5- ACS NCS BS (01051100) C(10+) MCW(5-10) SS-T PH(40) 10) OCS(5-IO) CV« 5) RS(5-10)
PHC(5-10) SP(IO+) NW(lO+) • ST(5-10)
44 Teona 1,329.0 3,605 S99 PM S DMCW THP PO CP ACS BS (010SI2oo) C(lO+) HC PHC PHS SS-T PH(7S) CM(S-IO) NCS(S-IO) CV« S) RS(IO+)
RMP H(lO+) OCS(S-IO) SP(1O+) NW(10+) ST(IO+)
45 Multania 796.0 1,320 235 P(2) M(2) PHS H(5-10) THP PO BS (01051300) S PUC MCW(5-10) SS-T PH(35) CM« 5) ACS« 5) CV« 5) RS(5-10)
C(5-10) PHC(5-10) CP(5-IO) NCS(5-IO) SP(IO+) NW(lO+) OCS(5-IO) ST(IO+)
46 Birtalab Urf 529.0 4,507 798 P(3) M THP PH(40) ACS BS Talab Neehar C(S-IO) H(S-IO) SS-T PO(5-1O) CM« 5) NCS CV«5) RS« 5) (01051400) MCW«S) CP(S-IO) OCS SP(1O+) NW(lO+)
PHC« 5) ST(IO+)
47 Naruana 1,438.0 3,550 624 P(3) M(2) o HC H(S-IO) THP PO ACS BS
(01051500) S PUC MCW(S-IO) SS-T PH(25) CM(5-10) NCS(5-IO) CV« 5) RS C(5-IO) PHC(5-10) CP(5-10) OCS(5-IO) SP(IO+) NW(IO+)
ST(IO+)
48Mian 403.0 796 139 PM THP PH(IO) BS (01051600) . C(5-1O) H(5-10) SS-T PO(5-10) CM« 5) ACS« 5) CV(5-10) RS(IO+)
MCW(IO+) CP(S-IO) NCS(5-IO) SP(lO+) NW(lO+) PHC(IO+) OCS(S-IO) ST(10+)
49 Baho Sibian 178.0 454 78 PM THP PH(20) ACS BS
Patti Basawa C(IO+) H(IO+) TW PO(5-IO) CM(S-IO) NCS(S-IO) CV(S-IO) RS(S-IO)
Singh MCW(5-10) SS-T CP(5-10) OCS(5-1O) SP(lO+) NW(IO+)
(01051700) PHC(5-10) ST(IO+)
50 Baho Sibian 183.0 516 79 P(2) THP PH(20) ACS BS
Patti Dharam M«5) H(IO+) TW P0(5-1O) CM(5-1O) NCS(5-1O) CV(5-10) RS(5-10)
Singh C(IO+) MCW(5-10) SS-T CP(5-10) OCS(5-10) SP(IO+) NW(IO+)
(01(l51800) PHC(5-1O) ST(IO+)
51 Baho] attri 374.0 911 163 PM o H(5-1O) THP PH(30) ACS BS
(01051900) C(lO+) MCW(5-10) TW PO(5-10) CM(S-IO) NeS(5-IO) CV(IO+) RS(5-10)
PHC(5-1O) SS-T CP(5-1O) OCS(5-1O) SP(IO+) NW(lO+) ST(10+)
124

VILLAGE DiRECTORY
Village Directory
Land Use (As on 1999)
Land use (i.e. area under different types of land use in hectare)
-0 § til Q)
E .<:: c:: -0 u a 0
~ til .~ u
g OJ} = .q OJ} .f: 0
8 0) -0 .S :; .~
0 -0 u u
~ .S E ;::I 0 ... -l ~ ~ (3 <8 j ~
E Q) g ~ ~ 0 u 0)
<> ... 'S' ~ ::E
~-o ;::I
~ ~ 1 = .0 ~ .5l
~ ...
sa € Q)
~ "" .. a ~ -0 ~ ~ '> .D .<:: sa "" ~ "".a 0) 0) e u ::I E U -0 1;1
~~ '8 ""' ::I .. ~ '" c:>- .- ~ %l bJl 0 = e ~ ..
'" ~ 'E 0) 0) - ::I .a ~ '" ~ "'" ~ ~ o ;j e OJ} § "'" 0) 0 z 0 'E '2 - 0 ~ " ..; Z p" ::E E .... ;:? ::I .. Z t=! U b9 (/)
14 15 16 17 18 19 20 21 22 23 2
PR Bathinda (21) EA NM Khadar GC(l626.0) 98.0 123.0 Ghugha Kalan 42 Cloth, T(1626.0) (01051000) Iron
Works
PR Giddarbaha EA NM Wood GC(13240) 181.0 287.0 Jhumba 43 (13) Works TWE(27.0) (01051100)
T(1351.0)
PR Bathinda (II) EA NM GC(10470) 91.0 163.0 28.0 Teona 44 T(1047:0) (01051200)
PR Bathinda (10) EA NM GC(701.0) 31.0 64.0 Multania 45 1(701.0) (01051300)
PR Bathinda (3) EA NM GC(362.0) 47.0 75.0 Birtalab Urf 46 TW(40.0) Talab Neehar TWE(5.0) (01051400) T(407.0)
PR Bathinda (10) EA NM GC(1225.0) 55.0 81.0 Naruana 47 TW(37.0) (01051500) TWE(400) T(l3020)
PR Bathinda (12) EA GC(345.0) 28.0 30.0 Mian 48 1(345.0) (01051600)
'r
PR Bathinda (13) EA GC(155.0) 14.0 9.0 Baho Sibian 49 T(l55.0) Patti Basawa
Singh (01051700)
PR Bathinda (13) EA NM GC(161.0) 9.0 13.0 Baho Sibian 50 1(161.0) Patti Dharam
Singh (01051800)
PR Bathinda (14) EA NM GC(317.0) 23.0 34.0 Baholattri 51 T(317.0) (01051900)
125

DISTRICT CENSUS HANDBOOK: BATHINDA
Census of India 2001 -
CD block Bathinda (0004) Amenities and
Amenities available (ifnot available within the village, a dash (-) is shown in the column and next to it in brackets the distance .in broad ranges viz.< 5 kms., 5-10 kms. and 10+ kms of the
nearest place where the facility is available is given)
'Vi' t! ~ iil '" ... ~ -'" 0 c ~ "0 "0 ~ ~ ... 0-0 '" U .s;, ~ '" <.> II ::l oJ C ~ 0 ... ~ 03 ~~ <> 0 g ... c
.~ ... 'E ~ 0 0 ;3 .c E 'i u C!. .c ... 0- "3 o ::l ... i:i' <.> 0 '" .!! ... - ... ·c :;; ~ 0
~ 0- .8
....l 0 "0 ~ 9 ~.~
~:s! 0 "0 >."!::: ::l ...
o"I:! .;;: C!. .c "0 0 _ "0
e~ ... ~ <.> ::l til ::l ~ <!: • ... ... c '" "0 C ...
U E"':: ~ ;S 0 ::l ...
~ o ._
i ',g .8 ~ .c ~"' ~ o"I:! ... "§ .9 § .... §- 03 .5 .;;: 0 03 03 ""§ ."!:::
'OJ._ :; .... <!: ... c u·_ .85 .. 0- 0 C OJJ 'e B-g o~"O .... fa 0 ... .9 03 OIl .!! 'a ~ 5 c '" c 0 0- ..8 (;j c g ~
- ... ~ ~ ] ... .~ ~
::l U ~ :E tf).,
§ 1'i 1'i § <.> "0 tf .g ~ ::l u:-=J:;J ... 0 0 "0 ~ ·c 0 0 0Il;S ... <.> ::l 0'::
~ 6 f:::. f::: 6 ~ Q Q.., ~ ~ Q e:;t.S"O ~ ~ 2 3 4 5 6 7 8 9 10 II 12 13
Tahsil : Bathinda (0003)
52 Jodhpur 1,012.0 2,083 363 P(2) THP PH(IO) BS Romana MS H(5-10) SS-T PO« 5) CM(5-10) ACS« 5) CV«5) RS (01052200) C« 5) MCW(5-10)
.~ CP(lO+) NCS« 5) SP(IO+) NW(IO+)
PHC(5-10) OCS« 5) ST(5-10)
53 Jassi Pauwali 1,028.0 2,7S9 498 PMS o H« S) THP PO ACS SP BS (01052300) C(5-1O) MCW(S-IO) SS-T PH(20) CM(5-10) NCS(IO+) CV« 5) RS(lO+)
PHC(S-W) CP(lO+) OCS(IO+) ST(lO+) NW(IO+)
54 Phus Mandi 404.0 1,667 297 PM THP PH(26) CM BS (01052400) C(5-10) H« 5) TW PO«5) CP(IO+) ACS« 5) CV« 5) RS(5-10)
MCW(S-IO) SS-T NCS(5-10) SP(IO+) NW(IO+) PHC(5-IO) OCS(5-10) ST(10+)
55 Gulabgarh Urf 573.0 1,636 282 PM S DHC THP PO BS Naiwala C(S-IO) PHS H(5-10) TW PH(46) CM(5-10) ACS« 5) CV« 5) RS(5-10) (01052500) MCW(5-JO) SS-T CP(JO+) NCS« 5) SP(IO+) NW(IO+)
PHC(5-1O) OCS« 5) ST(IO+)
56 Kot Shamir 4,607.0 9,314 1,580 P(3) M(2) DDA THP PO CM(2) ACS SPST BS (01053100) S PUC MCWHC TW PH(90) CP(5-10) NCS CV« 5) RS(5-IO)
AC C(IO+) PHC PHS SS-T OCS NW(IO+) RMP H(5-IO)
57 Katar 564.0 1,866 313 PM DHC PHS THP PH(40) ACS BS Singhwala C(5-1O) H(5-1O) SS-T PO(5-10) CM(5-1O) NCS(IO+) CV« 5) RS (01053200) MCW«5) CP(5-10) OCS(IO+) SP(IO+) NW(IO+)
PHC« 5) ST(5-10)
58 Gehri Devi 1,953.0 4,267 729 PM S THP PO ACS SP BS Nagar C(5-10) H(5-10) TW PH(IO) CM(5-10) NCS CV« 5) RS(lO+)
(01053300) MCW(5-10) SS-T CP(S-IO) OCS ST(IO+) NW(IO+) PHC(5-10)
Block Total 63.997.0 164.20428.143 P(96) H(3) HA(2) T(54) PO(31) CM(ll) ACS(34) ST(2) BS(54) M(SO) HU HH(2) HP(54) PII(2423) CP(3) NCS(17) SP(14) RS(6) S(28) D(29) DA(6) TW(17) OCS(14) PUC(9) 011(2) MCW(4) AC(5) MH(4) CWC(3)
HC(ll) PHC(4) PHS(23) FWC TB(2) NU(4) RMP(10) SMP 0(2)
126

VILLAGE DIRECTORY
Village Directory
Land Use (As on 1999)
Land use (i.e. area under different types of land use in hectare)
"<j
§ a .,
]; .<:: c "<j u 0 0 :; u oS .~
C OJ) g .€ OJ) > 0 .;:; -~ c "3 8 '" ." '6 u c 0 :; u 0
!i . t:j E u ... ...J
'" '" E ., 2- <Z o(j
:W '6 W 8 2 '" o(j ~ ::l
~ ~ '" .;;: ~1i
0 OJ)
'" ~ ... c ..0 .._ '0;; '" .9 ~ e. ... >, v ~ 1; .;;: ..0
'" o ... e ii .9 e. ~ e.g '" '" E
i;! ." 'O! 11 a 4-< :; "l t; e. .5 t)S '" OJ) 0 c Q ~
... '" t; 'O! 'E c
'" '" _' ::l "l 'a c.. ~ ~ ~ § e OJ) 'c ., ~ ·c c.. '" 0 '" 0 'E - 0 -< .;; z z ~ E ;:J ::l ... Z '" p.., (.!" ..... u t?I) <Il
14 15 16 17 18 19 20 21 22 23 2
PR Bathinda (10) EA NM GC(700.0) 54.0 93.0 Jodhpur Romana 52 TW(l50.0) (01052200) TWE{15.0) T{865.0)
PR Bathinda (7) EA NM GC{510.0) 363.0 102.0 Jassi Pauwali 53 TWE{53 0) .~ (01052300) T{563.0) ,
PR Bathinda (6) EA NM GC{275.0) 17.0 112.0 Phus Mandi 54 T{275.0) (01052400)
PR Bathinda (6) EA NM GC(425.0) 68.0 65.0 Gulabgarh 55 TWE{15.0) UrfNaiwala T{440.0) (01052500)
PR Bathinda (12) EA NM GC(2365.0) 1585.0 247.0 315.0 Kot Shamir 56 TWE{95.0) (01053100) T(2460.0)
PR Bathinda (9) EA NM GC(450.0) 44.0 50.0 Katar Singhwala 57 TWE{20.0) (01053200) T(470.0)
PR Bathinda (II) EA NM GC(I338.0) 162.0 170.0 Gehri Devi Nagar 58 TW(121.0) (01053300) TWE{162.0) T(1621.0)
PR(53) EA(54) N(52) 0.0 GC(43165) 8348.4 1259.0 5678.0 M(51) TW(2625)
TWE(2289) T(48079)
127


Map of CD Block Sangat

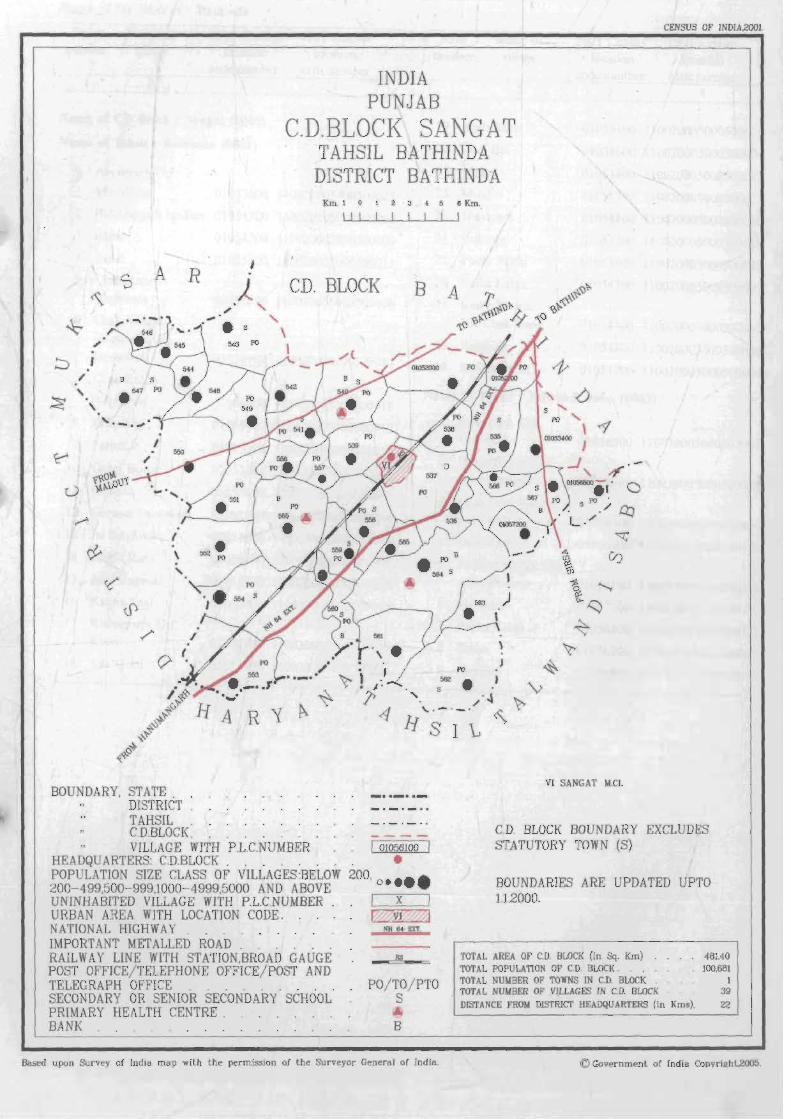
CENSUS OF JNDJA,200l.
INDIA PUNJAB
C.D.BLOCK SANGAT TAHSIL BATHINDA DISTRICT BATHINDA
Km. 1 0 1 2 3 , ~ 6 Km.
\ I I
A R J
S j <'\
CD. BLOCK B "
*"' " . :::J
/ . , ~ ,
BOUNDARY, STATE _ •• _ •• _ DISTRICT _. _. _ " TAHSIL . _ . _ . _ .. C.D.8LOCK. . . ___ _ VILLAGE WITH P.L.C.NUMBER I 01056100 I
HEADQUARTERS: C.D.BLOCK . . . . . . . • POPULATION SIZE CLASS OF VILLAGES :BELOW 200, •• 200- 499,500- 999.1000- 4999,5000 AND ABOVE 0 ••
UNINHABITED VILLAGE WITH P.L.C.NUMBER I X I URBAN AREA WJTH LOCATlON CODE . . , r Jr:::I NATIONAL HIGHWAY . . . . . KlI64EJ!1
IMPORTANT METALLED ROAD.. . RAILWAY LINE WITH STATION,BROAD GAUGE POST OFFICE/ TELEPHONE OFFICE/ POST AND TELEGRAPH OFFICE . . . . . . . . . SECONDARY OR SENIOR SECONDARY SCHOOL PRIMARY HEALTH CENTRE . BANK
liS
PO/ TO/ PTO S
B
Based upon Survey of India map with the permlsslon of the Surv eyor General of India.
VI SANGAT M.el .
C.D. BLOCK BOUNDARY EXCLUDES STATUTORY TOWN (S)
BOUNDARIES ARE UPDATED UPTO 1.1.2000.
TOTAL AREA OF' C.D. BLOCK (In Sq. Km) 461.40 TOTAL POPULATION OF CD. BLOCK. . 100.681 TOTAL NUMBER OF TOWNS IN C.D. BLOCK . I TOTAL NUMBER OF VILLAGES IN CD. BLOCK 39
DISTANCE FROM OISTRICI' HEADQUARTERS (In Kms). 22
© Government or India Copvri.l!hl,2005.


VILlAGE DIRECTORY
ALPHABETICAL LIST OF VILLAGES (C.O. BLOCK WISE)
Name of the District : Bathinda
Serial Name of 2001 Census 1991 Census Serial Name of 2001 Census 1991 Census number village location location number village location location
code number code number code number code number 2 3 4 2 3 4
Name of CD Block : 8angat (0005) 19 Kotli Sabo 01055100 110020005000500014
Name of Tahsil: Bathinda (0002) 20 Lool Bai 01054600 110020005000500003
Ancorgarh Urf 21 Mehta 01053400 1I002000500Q500027
Machhana 01053600 110020005000500025 22 Muhlan 01055700 110020005000500021
2 Bahadargarh Jandian 01054500 110020005000500002 23 Nandgarh 01054100 110020005000500011
3 Bajak 01054200 110020005000500009 24 Pathrala 01055400 110020005000500016
4 Bandi 01055500 110020005000500013 25 Phulo Mithi 01053800 110020005000500023
5 Chak Attar 26 Raike Kalan 01054700 110020005000500001
Singhwala 01054900 110020005000500008 27 Raike Khurd
6 Chak Kharak Urf Chak Dana 01054400 110020005000500005
Singhwala Urf 28 Rambiha 01054800 110020005000500006 Doomwali 01055300 110020005000500017 29 Sangat Kalan 01053700 110020005000500024
7 Chak Ruldu
Singhwala 01056000 110020005000500018 Name of Tahsil: Talwandi Saho (0003)
8 Dhunike 01055600 110020005000500012 Amarpura Urf
'I- Gurthuri 01056500 110030005000500001 9 Faridkot 01055200 110020005000500015
2 Bhagwangarh Urf 10 Gehri Buttar 01053500 110020005000500026 Bhukhianwali 01056700 110030005000500021 11 Ghudda 01054000 110020005000500010 3 Chak Hira Singhwala 12 Gurusar Sainewala 01052\00 110020005000500028 urr Pakka Khurd 01056300 110030003000500004
13 1ai Singhwala 01052000 110020005000500029 4 Dunewala 01056600 110030005000500022
14 JanghiRana 01054300 110020005000500004 5 Jodhpur Bagga Singh
15 Jassi Bagwali 01055800 110020005000500020 Alias Phalran 01056100 110030005000500003
16 Kaljha Rani 01055000 110020005000500007 6 Malwala 01057200 110030005000500020
17 Kishanpura Urf 7 Pakka Kalan 01056400 110030005000500002
Kutti 01055900 110020005000500019 8 Sekho 01056200 110030005000500007
18 Kot Guru 01053900 110020005000500022 9 Shergarh 01056800 110030005000500023
131

DISTRICT CENSUS HANDBOOK: BATHINDA
Census of India 2001 -
CD block Sangat (0005) Amenities and
Amenities available (ifnot available within the village, a dash (-) is shown in the column and next to it in brackets the distance in broad ranges viz.< 5 kms .. 5-10 kms. and 10+ kms of the
nearest place where the facility is available is given)
~
'" '" t! ~
::s Q) '" -'< 0 c:: § '" 0. '" ~
.., § rfJ 8 t) .0 Q) ::s U .., ~. c:: .<:: ~ 0
... > OJ 'iii~ c ... 'E ~ . ~ ~ a 0 .8 '';:: a ..c e c:!- o. E! :3 o ::s ~ ~ 0 ., ... OJ Q)._
0
~ 0 <Il ..,
Q.. . ~ '" ... '" i: "" B 'i' '""" ._ 0 ...l 0 ~.g a > .-;,: ::s Q) o'I:! .;;: c:!- o '" Q - "" 6t;l ..c § u ::s OJ ::s on il: ... § .~ Q) ., c:: '" "0 °e-< c on -E 0 ::s i ..c Iii c g o d
~ ..
.~ ,g ~ o'I:!Q)-g ._ 0
;;; ...... OJ
• V> OJ .5 <ta ._ > 0 :; '- ta il: e .1;:: c u·_ u 'O! e
~ 0. 0 C on .~ a"" o~"O ._ -
E! .... .9 on Q) 'J:l ~ !3 c '" 0 8. i OJ
~ B .., _ e ~ ~ <ta 0
~ ::s () ~:e cr: ~ ~ '5 '5 u '6 1;[ .~ ki ::s u;,::..c Q) ·c Q on-;9 ., 0 ::s 0== ., Q 0 "0
~ 0
III Z. E:::: E:::: Z. If] g Q" \,,1 ~ Q ~~g ~ ~ 2 3 4 5 6 7 8 9 10 II 12 13
Tahsil Bathinda (0002)
I Jai Singhwala 1,838.0 4,549 724 P(2) DMHHCPHS THP PO PH(42) ACS SP BS (010520oo) M«5) RMPH(IO+) SS-T CM(5-10) NCS CV«5) RS« 5)
C(IO+) MCW(5-10) CP(5-10) OCS ST(IO~) NW(tol) PHC(5-10)
2 Gurusar 988.0 2,468 413 PM«5) THP PO PH(55) ACS BS Sainewala C(5-1O) H(S-IO) TW CM(IO+) NCS OCS« 5) CV« 5) RS(IO+) (01052100) MCW(5-IO) SS-T CP(IO+) SP(IO+) NW(IO+)
PHC(S-IO) ST{5-10)
3 Mehta 1,204.0 2,637 478 P(3) M(2) MHCWC THP PO ACS SP OS (01053400) S C(IO+) PHS H(5-10) TW PH(102) CM(5-tO) NCS(5-tO) CV« 5) RS«5)
MCW(S-tO) PHC(5-IO)
SS-T 'fr
CP(5-10) OCS(5-10) ST(IO+) NW(IO+)
4 Gehri Buttar 1,223.0 3,485 588 P(3) M S o H« 5) THP PO ACS SP BS (01053500) C(10+) MCW« 5) TW PH(70) CM« 5) NCS« 5) CV«5) RS«5)
PHC« 5) SS-T CP« 5) OCS« 5) ST(IO+) NW(IO+)
5 Ancorgarh Urf 484.0 1,263 225 PM« 5) o H« 5) THP PH(38) SP OS Machhana C(lO+) MCW«5) TW PO« 5) CM« 5) ACS« 5) CV«5) RS(5-1O) (01053600) PHC« 5) SS-T CP«5) NCS(5-10) ST(IO+) NW(IO+)
OCS(5-IO)
6 Sangat Kalan 1,799.0 199 38 PM«5) DMHCWC THP PH(15) ACS SP BS (01053700) C(IO+) FWCNH TW PO« 5) CM(5-10) NCS« 5) CV(5-lO) RS
RMP H« 5) SS-T CP(5-1O) OCS« 5) ST(IO+) NW(IO+) MCW(5-10) PHC(5-10)
7 Phulo Mithi 1,694.0 3,692 630 P(2) THP PH(70) ACS BS (01053800) M«5) H« 5) TW PO« 5) CM«5) NCS(5-10) CV« 5) RS« 5)
C(IO+) MCW(5-10) SS-T CP(5-10) OCS(5-10) Sp(IO+) NW(IO+) PEC(S-to) ST(IO+)
8 Kot Guru 965.0 2,373 412 P M« 5) THP PO PH(20) ACS OS (01053900) C(lO+) H« 5) TW CM(5-IO) NCS« 5) CV«5) RS«5)
MCW«5) SS-T ,CP«5) OCS« 5) SP(IO+) NW(lO+) PHC« 5) ST(5-10)
9 Ghudda 1,890.0 4,649 855 PM S DDA THP PO PII(73) CPCM« 5) ACS SP BS (01054000) C(IO+) MCW SS-T NCS CV« 5) RS(5~10)
PHC PHS OCS ST(IO+) NW(IO+) H(IO!-)
10 Nandgarh 667.0 1,734 310 PM S o DA H(IO+) THP PO PII(32) ACS BS (01054100) PUC MCW(S-IO) SS-T CM(S-IO) NCS« 5) CV«5) RS(IO+)
C(lO+) PHC(5-10) CP(5-10) OCS«5) SP(10+) NW(10+) ST(IO+)
--~---
132
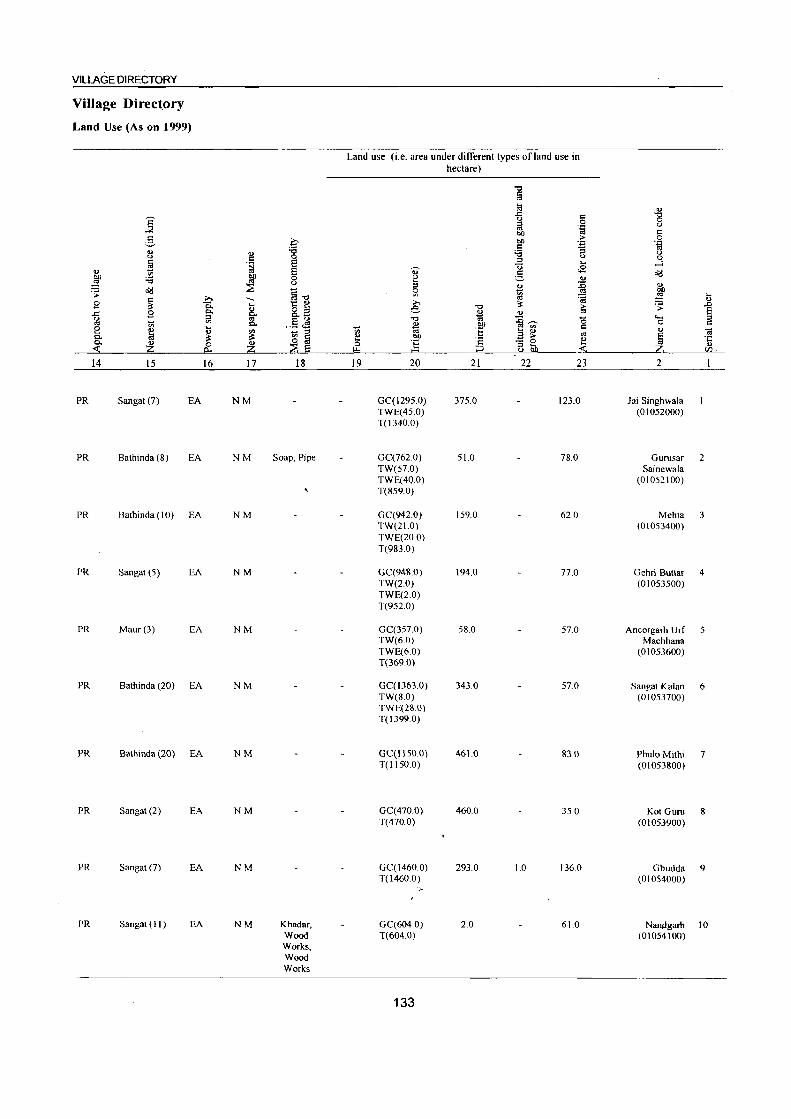
VILlAGE DIRECTORY
Village Direct.ory
Land Use (As on 1999)
Land use (i.e. area under different types of land use in hectare)
"0 § til Q)
..t:: = "0
]' U 0 0 ::s u
'" 'i = bll
Z- .E- bll > 0
= ~ '~ Q) .., "0 'i3 u u C 0 ::s u 0
~ '~ e '0 ... ...4 .., e '., g ..s o'i3 ~ 'i3 ~ 0 ~ 1l ::E
u ::s ~
Q)
';; o'i3 ~i5 Sl ~ :W ....
c b -- ';3 Q)
9 ;l: Q.. .... >. "0 ;l:
~ ';;: .c
~ o ~ e e ..t:: S Q.. Q,B
ou ou ~ a "0 'Oi ~~ g '- g 1;:; Q, ,.5 <!S B 'S
0 2 ~ ~ '" ~ ::; 1;:; ., a ~ ., Q) O! Q, ;l: ~ ~ 1ii ~ bll ';:: Q) ~ 'j:; Q,
~ Q) 'E - 0 0 0 ::s .... ~ " ~ Q" 6 ;;ga O!o ." ~ u bll 6 CIl.
14 15 16 17 18 19 20 21 22 23 2
PR Sanga! (7) EA NM GC(1295.0) 375.0 123.0 Jai Singhwala TWE(45.0) (01052000) T(1340.0)
PR Bathinda (8) EA NM Soap, Pipe GC(762.0) 51.0 780 Gurusar 2 TW(57.0) Sainewala TWE(40.0) (01052100) T(859.0)
PR Bathinda (10) EA NM GC(942.0) 159.0 62.0 Mehta 3 TW(21.0) (01053400) TWE(20.0) T(983.0)
PR Sangat (5) EA NM GC(948.0) 194.0 77.0 Gehri Buttar 4 TW(2.0) (01053500) TWE(2.0) T(952.0)
PR Maur (3) EA NM GC(357.0) 58.0 57.0 Ancorgarh Urf 5 TW(6.0) Machhana TWE(60) (01053600) T(369.0)
PR Bathinda (20) EA NM GC(13630) 343.0 57.0 Sangat Kalan 6 TW(8.0) (01053700) TWE(28.0) T(1399.0)
PR Bathinda (20) EA NM GC(1150.0) 461.0 83.0 Phulo Mithi 7 T(1I50.0) (01053800)
PR Sangal (2) EA NM GC(470.0) 460.0 35.0 Kot Guru 8 T(470.0) (01053900)
PR Sangal (7) EA NM GC(1460.0) 293.0 1.0 136.0 Ghudda 9 T(l460 0) (01054000)
.,..
PR Sangat (II) EA NM Khadar, GC(604.0) 2.0 61.0 Nandgarh 10 Wood T(604.0) (01054100) Works, Wood Works
133

DISTRICT CENSUS HANDBOOK: BATHINDA
Census of India 2001 -CD block Sangat (0005) Amenities and
Amenities available (if not available within the village, a dash (-) is shown in the column and next to it in brackets the distance in broad ranges viz.< 5 kms., 5-10 kms. and 10+ kms of the
nearest place where the facility is available is given)
'Vi' f:! ~ f;l '" '"
-'< 0 c::: § "8 ~ 'Vi' '-' """ 0-U .D § rJ)
'" ::s 1-1 c::: ,.c:; lfl 0 '-' '-'
~ =a~ c::: :> 0 e '" 0 0 .~ 'E~ .~ u f::!,. ..<:: S ..<:: e 0- .... ::; o ::s '" ~ (.) '-' 0)
j ~ 0 '" '-' 0- 0 c;l ~ .;:; ;;: i: 0 "" B 'i' l~
..... _ 0
-0 Z ;;> .~ ::s <1J
<ill ':;; f::!,. "" 0 e~ ..<:: <J - "" j .£l c::: <1J 1'3 "0 r::: 0)
::s~ ::s V) i;!: VI °e~ ,9 ::s .... §
o ,- r::: • .. 0 ~ ..<:: r::: g <ill",] o c:::
.8 ~ ..... lil ..<:: §" _" VI <a ,10
,_ 0
·0 ta ta 'ta.-S "3 ..... ~ i:! .';:l .~ !
~ 0 c::: bO '13 c:: U·_
0- s"8 .g~] ::s .... 0 .. .9 ell '-' ~ § '" r::: 0 0-
~ 'ta 03 c::: B "3 t> ~
<J
~ § a'l ';:l f/) § ~ 03 19 3 () 'i3 tf .~ b ..... _ ... '13 .g 0:-:::.0
~ 0 ::s ... .;:; 0 0 bOoS ... u ::s 8] ra b ~ b [,1,l ~ Q Q; \,.l ~ Q ~..:sQ
2 3 4 5 6 7 8 9 10 11 12 13
Tahsil : 8athinda (0002)
II Bajak 1,091.0 2,444 402 PM THP PH(l8) ACS BS (01054200) C(1O+) H(lO+) SS-T PO«5) CM(5-10) NCS(5-10) CY« 5) RS(IO+)
MCW(S-IO) CP(5-10) OCS(S-IO) SP(IO+) NW(IO+) PHC(5-10) ST(5-10)
12 Janghi Rana 1,764.0 3,795 631 P(2) M S THP PO PH(55) ACS BS (01054300) C(1O+) H(5-10) SS-T CM(5-10) NCS(5-10) CY« 5) RS(10+)
MCW<_5-IO) CP(5-IO) OCS(5-10) SP(JO+) NW(JO+) PHC(5-10) ST(IO+)
13 Raike Khurd 384.0 1,118 195 P M« 5) THP PH(20) BS UrfChak Dana C(IO+) H(5-10) SS-T PO«5) CM«5) ACS« 5) CY« 5) RS(IO+) (01054400) MCW(S-IO)
';-CP(5-10) NCS« 5) SP(IO+) NW(IO+)
PHC(S-IO) OCS« S) ST(5-10)
14 Bahadargarh 641.0 1,487 272 P M« 5) THP PH(25) BS Jandian C(IO+) H« 5) SS-T PO« 5) CM« 5) ACS« 5) ey« 5) RS(5-10) (01054500) MCW(5-10) CP(5-10) NCS(lO+) SP(10+) NW(lO+)
PHC(5-10) OCS(10+) ST(1O+)
ISLool Bai 467.0 1,436 222 PM THP PH(40) BS (01054600) C(IO+) H(IO+) SS-T PO« 5) eM« 5) ACS« 5) CY«5) RS(5-10)
MCW«5) CP« 5) NCS(5-10) SP(IO+) NW(IO+) PHC«5) OCS(5-10) ST(10+)
16 Raike Kalan 1,743.0 4,434 784 P(2) CWC THP PO PH(25) CM CP ACS SP BS (010547oo) MS H(S-IO) SS-T NCS CY« 5) RS(5-10)
C(IO+) MCW(S-IO) OC3 ST(IO+) NW(IO+) PHC(5-10)
17 Rambiha 1,34\'0 2,8\6 472 P M«5) D lI(S-IO) TlIP PH(75) SP BS (01054800) C(IO+) MCW(S-IO) TW PO«5) CM«5) ACS« 5) CY« 5) RS(IO+)
PHC(5-1O) SS-T CP«5) NCS(S-IO) ST(IO+) NW(10+) OCS(5-IO)
18Chak Attar 936.0 2,478 449 P M« 5) DH(5-10) THP PO PH(45) BS
Singhwala C(IO+) MCW(S-IO} SS-T CM(5-10) ACS« 5) CV«S) RS(IO+}
(01054900) PHC(5-10) ~P(5-10} NCS(S-IO) SP(IO+) NW(lO+) OCS(S-IO) ST(10+)
19 Kaljha Rani 1,501.0 3,357 S47 PMS D H(IO+) THP PH(55) ACS BS
(01055000) C(IO+) MCW(S-IO) SS-T PO« 5) CM(5-10} NCS(5-10) CY«5} RS(1O+) PHC(S-IO) CP(5-1O) OCS(5-1O) SP(IO+) NW(IO+)
ST(IO+)
20 Kotli Saba 616.0 1,072 183 P M« 5) THP PO PH(20} BS
(01055100) C(5-1O) H(5-10) TW CM« 5) ACS« 5) CY(\O+) RS(IO+) MCW(IO+} SS-T CP(IO+} NeS(S-IO) SP(IO+) NW(IO+)
PHC(IO+) OCS(5-10) ST(S-IO)
134

VILLAGE QIRECTORY
Village Directory
Land Use (As on 1999)
Land use (i.e. area under different types ofland use in hectare)
"0 § ~ .g
E ..<: c:: <.> 0 0 ::::I <.>
"'" 0:1 .~
g OIl c:: c- OIl > .~
8 '6 c:: :!5 ., '6 <.> .5 0 <.> 0
~ E :::l
~ "'i3 ... -l
0 E d) g <2 c(! ~ :;:; 0 2 .,
~ u ::::I :E ...
~ c(!
~13 0 ~ 0:1 OIl
c:: ~ -... '" ~ ~ ... B ~ ... .;.,
~ .,
0- 0 8.~ e "0 1U .;:;
~ ] B ~ 0-., .,
0:1 "0 ... ~- g .... :::l
t; 0. .5 <is 2 'E 0 c::
~ ~ ...
'" 1;; a ~ ., ., ~ § '" 03
~ ~ ~ OIl 0:1 § .'t '" 0
., 0 '6 'c - 0 ~
·c Z Z ~ E ;::J ::::I ... Z
., p., "" '=' (.) bl) ell
14 15 16 17 18 19 20 21 2i 23 2
PR Giddarbaha EA NM Khadar, GC(883.0) 106.0 76.0 Bajak 11 (14) Wood TW(26 0) (01054200)
Works, T(909.0) Iron Item
PR Giddarbaha EA NM Cloth, GC(l5130) . 1380 langhi Rana 12 (14) Wood TW(ll3.0) (01054300)
Works, Iron '
T(l626.0)
PR Giddarbaha EA NM GC(309.0) 25.0 34.0 RaikeKhurd l3 (11 ) TW(16.0) UrfChak Dana
T(325.0) (01054400)
PR Giddarbaha (8) EA NM GC(544.0) 60.0 15.0 Bahadargarh 14 TW(20.0) Jandian TWE(20) (01054500) T(566.0)
PR Giddarbaha (6) EA NM GC(3330) 104.0 30.0 Lool Bai 15 T(3330) (01054600)
PR Giddarbaha (8) EA NM GC(1559.0) 134.0 Raike Kalan 16 TW(16.0) (01054700) TWE(34.0) T(1609.0)
PR Giddarbaha EA NM GC(I077.0) 119.0 88.0 Rambiha 17 (13) TW(53.0) (01054800)
TWE(4.0) T(1134.0)
PR Sangat (12) EA NM Shoes, GC(800.0) 55.0 81.0 Chak Attar 18 Bricks, T(800.0) Singhwala Wheat (01054900)
PR Sangat (IS) EA NM , Bricks GC(l323.0) 75.0 97.0 KaljhaRani 19 TWE(6.0) (01055000) T(1329.0)
'r-
PR Sangat(15) EA NM GC(574.0) 32.0 Kotli Sabo 20 TW(6.0) (01055100) TWE(4.0) T(584.0)
135

DISTRICT CENSUS HANDBOOK: BATHINDA
Census of India 2001 -
CD block Sangat (0005) Amenities and
Amenities available (if not available within the village, a dash (-) is shown in the column and next to it in brackets the distance in broad ranges viz.< 5 kms., 5-10 kms. and 10+ kms of the
nearest place where the facility is available is given)
-;;, t! '<>' ::I <Il
-8 ... '" "" 0
'" r:: § -0 0. <U
8 '13 <Il U .c § (/l <U " 1{ co ..c <Il <; Q) <U i! 'ia~ co '" ;> .g .g 8 0 c '~ E! ..c E 'E~
1il C!- o<: 0 <U 0- u "3 o " u 1;' 0
~ 8 <Il Q) 0- Q ta ~.t: ~ l: ..J -0 11 'i' '~.~ ]a ;;: .g
o(j (::!, '0 !Xl.!:! .;; ..c -0 8 _ -0
& ., co <IJ !Oi .", '" ., '" O! ::I -:;;
-B .g ;g .... fa gOg " S ~ '" ... ,.!g 0 ~ 1 dddJ~ C C .8 ~
.... ~ ..c "" ~.~ ta .S 'iii .2 0 Ol Ol E :::s .... ~ c: u·- 01;1
'" 0 c: 'g " .....
~ 0- 0 bIl ., il~ o~'O '2 1;) is.. .. c:: 0
~ .~ Ol
~ 'Ii ~ 'i.~ ~ :::s >.
'" I 0 " 0 ~ ~ 1S 1S 0 ;;:; .J .g U ~.,::: -'r: ::I .g ., '"
:-;:: ..c CI) 0 c g 0 0 0Jl£ .., 0 ::I 0<=
5!;l t: t: 6 Hl ~ ~ S.l 5 Q ~4S~ s.1 jg 2 3 4 5 6 7 8 9 10 II 12 13
Tahsil : Bathinda (0002)
21 Faridk<>t 1,068.0 1,859 341 PM« 5) THP PH(30) BS (01055200) C(S-IO) H(S-IO) TW PO« 5) CM« 5) AC5« S) CV« 5) R5(10+)
MCW(5-10) 55-T CP(lO+) NC5« 5) 5P(l0+) NW(lO+) PHC(5-10) OC5« 5) 5T(5-10)
22 Chak Kharak 1,183.0 3,181 574 P M(5-1O) THP PH(60) AC5 BS 5inghwala Urf C« 5) H(IO+) 5S-T PO« 5) CM(5-10) NCS(5-10) CV«S) R5« 5) Doomwali MCWao+) CP(5-10) OC5(5-10) SP(lO+) NW(IO+) (01055300) PHC(IO+) ST(IO+)
23 Pathrala 2,926.0 6,233 1,022 P(3) M(2} HA 0 PH5 THP PO PH(50) ACS SP BS (01055400) S C(lO+) H(S-IO) 5S-T CM« 5) NCS CV« 5} R5(S-10}
MCW«5) .,_ CP(5-10) OCS 5T(10+) NW(10+) PHC« 5)
24 Bandi 2,136.0 3,913 697 P(2) M DDAMCW THP POPH(2S) CM AC5 85 (01055500) C(lO+) CWCPHC SS-T CP(S-IO) NCS« 5) CV«5) RS«5)
PHSFWCNH OCS« 5) SP(IO+) NW(lO+) CHW H(1O+) ST(IO+)
25 Dhunike 607.0 1,085 200 P M« 5) THP PH(l2) BS (01055600) C«5) H(5-10) S5-T PO« 5) CM« 5) AC5«S) CV« 5) RS(S-10)
MCW(5-10) CP(S-IO) NC5« 5) SP(IO+) NW(lO+) PHC(5-10) OCS« 5) 5T(5-10)
26 Muhlan 437.0 904 138 P M«5) THP PH(20) BS (01055700) C« 5) H(5-10) SS-T PO« 5) CM« 5) ACS« 5) CV(5-10) RS(5-1O)
MCW(5-10) CP(IO+) NCS« 5) SP(IO+} NW(lO+) PHC(S-IO) OCS« 5) ST(IO+)
27 Jassi Bllgwali 1,798.0 3,193 520 P(2) M S HADDAHC THP PO PH(20) ACS BS (01055800) C(IO+) PHS H{S·IO) S5-T CM(S-IO) NCS« 5) CV« 5) RS(lO+)
MCW(5-10) CP(5-10) OCS« 5) SP(lO+) NW(IO+) PHC(5-10) ST(IO+)
28 Kishanpura Urf 740.0 1,527 240 P(2) M S THP PO PH(50) SP BS Kutti PUC H«5) 5S-T CM«5) ACS(5-10) CV«5) RS(5-10) (01055900) C(5-10) MCW(5-10) 0'(5-10) NCS« 5) ST(lO+) NW(IO+)
PHC(5-10) OCS« 5}
29 Chak Ruldu 1,145.0 2,845 511 P(2) M(2) DMHHC THP PO PH(60) CM SP BS Singhwala S PUC PHS H(5-10) 5S-T CP(S-IO) ACS« 5) CV« 5) RS« 5) (OI056000) AC MCW(S-IO) NC5« 5) ST(IO+) NW(IO+)
C(5-10) PHC(5-10) OCS« 5)
30 Jodhpur Bagga 817.0 1,967 312 P M« 5) RMP H(S-IO) THP PH(55) ACS BS Singh Alias C(lO+) MCW«5) SS-T PO«5} CM(5-10) OC5 CV« S) RS(5-10)
Phalran PHC« 5) CP(S·IO) NCS(5-10) SP(lO+) NW(10+)
(01056100) ST(5-1O)
136

VILLAGE DIRECTORY
Village Directory
Land Use (As on 1999)
Land use (i.e. area under different types ofland use in hectare)
-0 a a .,
]' ..<:
'" -0
~ 0 0 .~ 0
2-OIl c:
a .0 .. 0 .'" .~
u 'i3 c: :l u .,
0 'i3 " (.)
§ '" E :l 0 .~ -0
... -l
" 1;\ E ~ ..8 '" '" O?j l1f 'i3 l1f 0 ~ ;::, '" ~ ::E u
~ ~ c(!
~i3 0 B
'" >. ~ <1> ~ 'a ...
sa ;!: Q.. ~ € i:t "
8.~ "0 ~
.;;: € ..<: g Q, ., ., ,(.) ~ "'" tii :o~ g .... § d :;; Q. ,5 ~ ~ co 0 e ~ ~ <Il
- :::I' 1;\ :~ ::: '" .,
Ol Q. i:t ;S [;J ~ OIl a ~ '" § "- 11) 0 .,
0 'E '" - 0 ~ 'r:
:( Z p.., z ::E E fL, :::> :::I ... Z " ...., u AA CIl
14 15 16 17 18 19 20 21 22 23 2
PR Sangat (15) EA NM GC(1025.0) 30.0 Faridkot 21 lW(S.O) (01055200) lWE(50) T(1038.0)
PR Dabwali (4) EA NM GC(492.0) 502.0 33.0 76.0 Chak Kharak 22 lW(40.0) Singhwala Urf lWE(400) Doomwali T(572.0) (01055300)
PR Dabwali (6) EA NM GCCI420.0) 1330.0 176.0 Pathrala 23 T(1420.0) (01055400)
PR Sangat(ll) EA NM GC(12350) 850.0 51.0 Bandi 24 T(1235.0) (01055500)
PR Sangat(9) EA NM GC(572 .. 0) 27.0 Dhunike 25 lW(4.0) (01055600) lWE(40) T(580,O)
PR Sangat(7) EA NM GC(2IS0) 19S.0 270 Muhlan 26 T(215.0) (01055700)
PR Sangat(2) EA NM GC(IIOO.O) 505.0 193.0 Jassi Bagwali 27 T(IIOOO) (01055800)
PR Maur (3) EA NM GCC385.0) 265.0 90.0 Kishanpura Urf 28 T(385.0) Kutti
(01055900)
PR Maur (2) EA NM Dhan. 0C(505.0) 512.0 128.0 Chak Ruldu 29 Rice, T(505.0) Singhwala
Cotton .~
(01056000)
PR Dabwali (10) EA NM GC(7540) 2.0 61.0 Jodhpur Bagga 30 T(754.0) Singh Alias
Phalran (01056100)
137

DISTRICT CENSUS HANDBOOK: BATHINDA
Census of India 2001 -
CD block Sangat (0005) Amenities and
Amenities available (ifnot available within the village, a dash (-) is shown in the column and next to it in brackets the distance in broad ranges viz. < 5 kms., 5-10 kms. and 10+ kms of the
nearest place where the facility is available is given)
'[ ~ '" e .., '" "'" 0 '0 c:: ;j -0 Q, -;;- ..,
~ 8 0 u .c Vl .., ::l 1{ c:: ..c 19 - .., .., til 'ie~ . 9 0 '" ;> ... .~ ~ g ..,
0 0 .~ ~ ..c:: e:
'OJ u ~ ..c u
~ Q, .., o ::l .., ~
0 0 '" ..,
Q, u til ~ .c; ~ i:. ._J 0 '0 '§ 'i' l3 ... ,_ 0
'0 :a ;;:...~ ::l ..,
<!d .;;: ~ '0 0 _ '0 61d ..c § u ::l 'al ::s .., .., '"
.., '0 '" .., '" ~ '" (,) E -< on .,s 0 ::l .... §
o ._ c:: ,
i ~ "i 0 <!) .<:: r:: g <!dO] o r:: .... .c 'oj ~ ta ' Vl ta .S .~ ,9 ';;: 0 :; .... ta ~ e·~
'" 0 '" "e r:: u,_ "2 ~ .... ~
g. .... .~ on .., BOO 0'--''0 0 Q, .., til .5 '§ 0 - ~ '=: ~ .s
~ ~ ta I "E (,)
~ E ::l u '" ._ (/)
1ii 1ii u 'i3 'Of E .~ ~ ~ ~..6 'r: ::l
~ 0 0 ::l '0
.., ·c 0 0 on.,s \I) OJ ::s 0:":: C: C: 6; b!l ~ g A. 1..2 ~ Q ~~Sl 1..2 ~
2 3 4 5 6 7 8 9 10 II 12 13
Tahsil Bathinda (0002)
31 Sekho 1,919.0 4,078 724 P(2) M S DHC THP PO ACS BS (01056200) C(IO+) RMP H(5-10) TW PH(125) CM« 5) NCS CV« 5) RS(lO+)
MCW(s-IO) SS-T CP(5-10) OCS SP(IO+) NW(IO+) PHC(5-10) ST(5-10)
32 Chak JIira 869.0 1,901 340 PM« 5) RMPH(5-10) THP PJI(70) OCS SP BS Singhwala Urf C(IO+) MCW(.s..IO) 5S-T PO« 5) CM«5) ACS« 5) CV«5) RS(IO+) Pakka Khurd PHC(5-10) CP(5-10) NCS« 5) ST(5-10) NW(10+) (01056300)
33 Pakka Kalan 3,153.0 7,586 1,301 P(3) M(2) o MCWCWC THP PO 'r- CMCP ACS SP BS (OIOS64oo) 5 PUC HC PHCPHS 5S-T PH( 17IJ) NCS CV«5) RS(5-IO)
C(IO+) FWeRMP oes ST(s-IO) NW(IO+) CHWH(5-10)
34 Amarpura Urf 596.0 1,615 285 P(2) RMP H«5) THP PH(35) oes BS Gurthuri M«5) MCW« 5) TW PO(S-IO) CM(5-10) ACS« 5) CV«S) RS(5-IO) (010S6Soo) C(1O+) PHC« 5) SS-T CP«S) NCS(5-IO) SP(IO+) NW(lO+)
ST(IO+)
3SDunewaia 487.0 965 171 PM«S) CWC H(5-10) THP PO PH(30) OCS BS (OIOS66oo) C(IO+) MCW(5-10) TW CM(5-10) ACS« 5) CV(IO+) RS(5-IO)
PHC(5-10) 5S-T CP(IO+) NCS(5-10) SP(IO+) NW(IO+) ST(IO+)
36 Bhagwangarh 1,395.0 2,260 389 PM S RMP(2) THP PO PH(54) CM ACS OCS SP BS Urf C(IO+) H(5-10) TW CP(5-1O) NCS«5) CV«5) RS« 5) Bhukhianwali MCW(S-IO) SS-T ST(IO+) NW(10+) (010S67oo) PHC(S-IO)
37 Shergarh 89S.0 1,689 293 P M«S) RMP(2) H(IO+) THP PO PH(20) OCS ACS« 5) BS RS (01056800) C(IO+) MCW(IO+) SS-T CM(s-IO) NCS(s-IO) eV« 5) NW(IO+)
PHC(IO+) CP(1O+) SP(IO+) ST(IO+)
38 Malwala 780.0 2,394 412 P AC M(5- HC RMP THP PH(52) ACSOCS BS
(01057200) 10) C(IO+) H(lO+) TW PO(S-IO) CM(5-10) NCS(5-1O) CV«5) RS« 5) MCW(5-10) SS-T CP(IO+) SP(IO+) NW(IO+) PHC(5-10) ST(IO+)
Block Total 46187.0 100681 17300 P(56) HA(2) D{IS) T(38) PO(21) CM{S) ACS(22) SP(14) BS(38) M(21) DA(4) MCW(3) HP(38) PU(1833) CP(3) NCS(7) RS(2)
S(14) MU(4) CWC(6) TW(IS) OCS(13) PUC(4) HC(6) PUC(3) AC(2) PHS(8) FWC(3)
NU(2) RMP(12) CHW(2)
138

VILLAGE DIRECTORY
Village Directory
Land Use (As on 1999)
Land use (i.e. area under different types of land use in
~ hectare)
"0 § l'3 '" E
..c: c:: "0 (.)
0 0 ::l (.)
~ til .~ c:: b!) g .q b!) :E 0 c:: .~
'" u "0 :0 :::> (.) u c:: 0 u 0
~ E ::l 'fJ U .... .-l
~ E ~ ~ ... 2- o(l :0 ~ 0 ~ '"
~ ::E (.)
::l
~ ~ 1?n o"i:l ~-g o·
c:: >. V> ~ ~ l:;
.$ Q. >. :l: :l: 8. o ... e "0 ~ .;;: .l:>
..c: E 0.. 0..5
'U u E ~
:::> til "0 Cii ::c~ g '- :s l7i '" .§ ..s 0 ... 0..
~ b!) e ~ = ~ ~ u '"
_ :s l7i 'E til
u ~ :l: :l: cs § !:! b!) ,3.> § <- u 0 u 0 ] 'c -0 ~ Z p... z ::E E ~ ;::? :::> ... Z Q)
u Ol) en
14 15 16 17 18 19 20 21 22 23 2
PR Raman (2) EA NM Tools For GC(I455.0) 342.0 122.0 Sekho 31 Culti.V, T(14550) (01056200) Making
Mud Pot, Cloth
PR Raman (13) EA NM GC(675.0) 139.0 5S.0 Chak Hira 32 T(675.0) Singhwala Urf
Pakka Khurd (01056300)
PR Raman (IS) EA NM Furniture, GC(232S.0) 430.0 398.0 Pakka Kalan 33 Foot T(2325.0) (01056400) Wear
PR Sangat (7) EA NM GC(350.0) 190.0 56.0 Amarpura Urf 34 T(350.0) Gurthuri
(OIOS6500)
PR Sangat (S) EA NM GC(350.0) 8S.0 Dunewala 3S TW(4.0) (01056600) TWE(48.0) T(402.0)
PR Sangat (8) EA NM GC(1201.0) 174.0 Bhagwangarh 36 TW(8.0) Urf TWE(120) Bhukhianwali T(1221.0) (01056700)
PR Sangat (10) EA NM GC(399.0) 340.0 116.0 Shergarh 37 TWE(40.0) (01056800) T(439.0)
PR Sangat (10) EA NM GC(7040) 34.0 Malwalll 38 TW(6.0) (01057200) TWE(36.0) T(746.0)
PR(38) EA(38) N(38) GC(33428) 'r- 8412.0 164.0 3393.0 M(38) TW(414)
,
TWE(376) T(34218)
139


Map of CD Block Talwandi Sabo


INDIA PUNJAB '
C.D.BLOCK TAL W ANDI SABO TAHSIL TAL W ANDI SABO
DISTRICT BA THINDA Km.. l 0 J 2 3 4 5 5 KID.
C,D, BLOCK BOUNDARY EXCLUDES STATUTORY TOWN (5)
BOUNDARIES ARE UPDATED UPTO 1.1.2000.
TOTAL AREA OF C,P. BLOCK (In Sq. Km) 540.20 TOTAL POPULATION or C.D. BLOCK . 129,364
TOTAL NUIIBER OF TOWNS IN C.D. BLOCK
TOTAL NUMBER OF VILLACES IN C.D. BLOCK 47 PlsrANCE FROII DlsrRICT HEADQUARTERS (In Km.), 32
BOUNDARY, STATE . _ •• _ •• _. DISTRICT . _._._._ TAH~L _ . _._._ C.D, BLOCK . , , , . " ___ _ VILLAGE WITH PLC,NUMBER 1 ..... 810 I
HEADQUARTERS: CD. BLOCK , • POPULATION SIZE CLASS OF VILLAGES:BELOW 200,200- 499,500- 999.1000-4999,5000 AND ABOVE o • ... UNINHABITED VILLAGE WITH PLC.NUMBER , x URBAN AREA WITH LOCATION CODE to:: W.n21 STATE HIGHWAY . , , . SH 17 IMPORTANT METALLED ROAD RAILWAY LINE WITH STATION.BROAD GAUGE POST OFFICE/ TELEPHONE OFFICE/ POST AND TELEGRAPH OFFICE ., . SECONDARY OR SENIOR SECONDARY SCHOOL PRIMARY HEALTH CENTRE , BANK
RS
PO/ TO/ PTO S ~ B
&sed upon Survey of India map with the permission of lhe Surveyor General of India
f
) 7'.1 HSIL ' / BATHIlVD .i
. FROII A, I. , SA THINDA ( "" • •
A
CENSUS OF INDlA,200I.
... ...
\ .6... I
~ , L1'. '$
" E-< -. ~ • I ~ I
_-" [!2 I 0
© Governmenl of India Copyrighl.2005.


VILLAGE DIRECTORY
ALPHABETICAL LIST OF VILLAGES (C.D. BLOCK WISE)
Name of the District : Bathinda
Serial Name of 2001 Census 1991 Census Serial Name of 2001 Census 1991 Census number village location location number village location location
code number code number code number code number 2 3 4 2 3 4
Name of CD Block: Talwandi Sabo (0006) 22 Kamalu 01058700 110030006000600016
Name of Tahsil : Talwandi Sabo (0003) 23 Kanakwal Urf Rattangarh 01057900 110030006000600011
Bagha 01057600 110030005000500008 24 Kaureana 01064200 110030006000600081 2 Bangi Dipa Singh 01057300 110030005000500019
25 Kot Bakhtu 01057000 110030005000500025 3 BangiNihal
2fJ Lehri 01063800 110030006000600077 Singh 01058800 110030005000500018
27 Leleana 01059000 110030006000600066 4 Bangi Rughu 01057400 110030005000500005
28 Lelewala 01062700 110030006000600034 5 Bangi Ruldu 01058900 110030005000500017
29 Mahi Nangal 01059100 110030006000600065 6 Behman Jassa
Singh 01063500 110030006000600072 30 Malkana 01058500 110030006000600015 31 Manwala Urf
7 Behman Koer Singh 01063600 110030006000600073 Kishangarh 01057100 110030005000500024
8 Bhagibandar 01062500 110030006000600064 32 Menuana 01063900 110030006000600078
9 Fatah Balu 01064500 110030006000600085 33 Mirziana 01064000 110030006000600079
10 Fatehgarh 34 Nangla 01064800 110030006000600075
Nouabad 01063100 I 10030006000600061 35 Natheha 01064700 110030006000600076
II Gadhianwala Urf 36 PhuloKhari 01058000 110030006000600012
Bhagwanpura 01062900 110030006000600059 37 Ram Tirath Jaga 01063000 110030006000600060
12 Gatwali 01058200 110030006000600014 .,.
, 38 Ramsara 01057800 1100300060006000 1 0
13 Gehlewala 01064100 110030006000600080 39 Raya 01064300 110030006000600082
14 Giana 01058100 110030006000600013 40 Sangat Khurd 01063300 110030006000600068
15 Golewala 01064600 110030006000600084 41 Shekhpura 01062800 110030006000600058
16 Gurusar Joga 01063200 110030006000600062 42 Singo 01063700 110030006000600074
17 Jaljal 01058600 110030006000600067 43 Sukhladhi 01057500 110030005000500006
18 Jeon Singhwala 01059200 110030006000600027 44 Talwandi Sabo 01062600 110030006000600063
19 Jogewala 01058300 110030006000600071 45 Tarkhanwala 01057700 110030005000500009
20 Kaile bandar 01056900 110030005000500026 46 Teona Pujarian 01063400 110030006000600069
21 Kalalwala 01064400 110030006000600083 47 Tungwali 01058400 110030006000600070
143

DISTRICT CENSUS HANDBOOK: BATHINDA
Census of India 2001 -
CD block Talwandi Sabo (0006) Amenities and
Amenities available (if not available within the village, a dash (.) is shown in the column and next to it in brackets the distance in broad ranges viz.< 5 kms., 5·10 kms. and 10+ kms of the nearest place
where the facility is available is given)
~
'" '" ., " 12 t: u '" 0
.", 10 '" § .", c. 8 t> -;i;' u § VJ
u " U ,D .; <:: .r: '" <; g- OJ e :a~ u .9 <:: > 'E ~ g u 0 '0 .~ 2 ~ § til u C! .r:
OJ ~ U OJ <; 0- 0) "3
e~'§ ;;: ~ 0
~ '" OJ 0.. u -l 0 .", Ii 'i' or:: Vl
] 2> .<::: " u o(! .;; C! g 0 ~.~ - .", COt;: u :l 'at :l ";;;'~
~ -5 .:: ~ .", § .2 u 8--< '" .9 " .... § ... ~ _g ~ ..c: t:: g o(!uS o d
u ..... t;: §" - '" .~ .9 .&:; .;;: 0 ca .. -a e~ -a.S " 8 "3 ..... ~ .~ a oj 0 c: bfi '0 t:: U,-
s ..... ~
0-
.~ bfi <!) _g ~ 0'-'''0 '" '" 0 0 .... ca '" :§ ~ .: ~ 5
~ ~ U 0.. _g u :.;;a " u ~:E~ -a § Zi Zi 8 '6 <:: 8 .~ t E ~ ·c :l
'" 0:-:::.0
0 0 " "0 OJ ·c 0 bn£ OJ u " 0:::: <!)
6 0 fa :?; C: C: 6 ~ Cl Q, U ~ Q ~<$lu U ~
2 3 4 5 6 7 8 9 10 II 12 13
Name of Tahsil: Talwandi Sabo (0003)
1 Kaile Bandar 1,732.0 3,917 657 P M« 5) CWC H(lO+) THP PO PH(29) ACS'OCS BS (01056900) C(1O+) MCW(10+) SS-T CM(5-10) NCS«5) CV«5) RS(5-10)
PHC(IO+) CP(IO+) SP(lO+) NW(IO+) ST(lO+)
2 KotBakhtu 1,743.0 4,345 698 P(2) M HCPHS THP PO ACS BS (01057000) C(lO+) H(5-10) TW PH(lIO) CM(5-10) NCS CV« 5) RS
MCW(~-IO) SS-T CP(lO+) OCS SP(lO+) NW(lO+) PHC(5-10) ST(lO+)
3 Manwala Ur[ 675.0 1,833 317 P M(5-1O) THP PH(76) OCS BS Kishangarh C(IO+) H(IO+) TW PO« 5) CM(5-1O) ACS« 5) CV« 5) RS«5) (01057100) MCW(lO+) SS-T CP(5-1O) NCS(5-10) SP(1O+) NW(10+)
PHC(IO+) ST(5-1O)
4 Bangi Dipa 601.0 1,866 316 P M« 5) THP PH(S2) OCS BS Singh C(5-10) H(5-10) SS-T PO« 5) CM(5-10) ACS(5-10) CV«S) RS(IO+) (01057300) MCW(5-10) CP« 5) NCS(S-IO) SP(IO+) NW(lO+)
PHC(5-10) ST(5-10)
5 Bangi Rughu 565.0 1,502 268 PM D H(5-10) THP PO PH(48) ACS SP BS (01057400) C(IO+) MCW(5-10) SS-T CM(5-10) OCS CV« 5) RS(5-10)
PHC(5-10) CP(5-10) NCS« 5) ST(IO+) NW(IO+)
6 Sukhladhi 800.0 2,405 378 P M« 5) THP PH(71) OCS BS (01057500) C(lO+) H(5-10) TW PO« 5) CM(5-10) ACS« 5) CV« 5) RS(IO+)
MCW(5-10) SS-T CP(5-10) NCS« 5) SP(lO+) NW(IO+) PHC(5-10) ST(IO+)
7 Bagha 1,153.0 2,931 516 PM PHS H« 5) THP PH(62) ACS BS (01057600) C(IO+) MCW«5) SS-T PO« 5) CM«5) OCS CV«5) RS«5)
PHC« 5} CP«5} NCS« 5) SP(lO+) NW(lO+) ST(lO+}
8 Tarkhanwala 1,220.0 1,758 282 P M(5-10) THP PH(37) OCS BS (01057700) C(IO+) H(5-10) SS-T PO(5-10) CM«5) ACS« 5) CV« 5) RS(IO+)
MCW« 5) CP(S-to) NCS(5-10) SP(IO+) NW(lO+)
PHC« 5) ST(10+)
9 Ramsara 576.0 2,412 403 PM THP PH(80) OCS BS
(01057800) C(IO+) H«5) SS-T PO« 5) CM« 5) ACS« 5) CV«S) RS« 5) MCW(5-10) CP« 5) NCS« 5) SP(IO+} NW(IO+) PHC(5-10) ST(lO+)
10 Kanakwal Ur[ 1,189.0 1,687 287 P M(5-10) THP PH(35) OCS BS
Rattangarh C(5-10) H« 5) TW PO« 5) CM« 5) ACS(5-10} CV« 5} RS« 5)
(01057900) MCW(5-10) SS-T .;- CP(S-IO) NCS(S-IO) SP(lO+) NW(lO+) PHC(5-10) ST(IO+)
144

VILLAGE DIRECTORY
Village Directory
Land Use (As on 1999)
Land use (i.e. area under different types of land use in hectare)
"0
~ ~ <J
E ..c:: c: "0 0 0 0 ::I 0
..;.: '" .~ c 5
OJ)
.€ OJ) .~ 0 .;::l
C ""3 '" 0) III "0 :a 0 0
~ 0
~ .5 ::I 0
~ u .... -l 0) .,
3 <E d<l ~ :a 1!Jl 0 0 III ....
::2 0 ::I
~ ::0 III .;; d<l
~1l 0 '"
OJ)
c >, ..... Vl ~ ~ ...
.9 ~ c.. .... >, ~ III
III 8.2 e "" ~ .;; ~
.c .9 c.. [if dJ ., E ~
::I
'.5 JS ."0 'ii:I ~- "0 ""' ::I - Vl Vl c..
~ .~ 0 c: e ~ ....
Vl t;; .... Vl c: III III t;; ::I t:: E ~ '" OJ c.. ~ ~ ~ OJ) § c.. III 0 III ~ ~ 0 '6 ·s - 0 ~ ·c
~ 6 ~ 6 ::> G~ 6-<J
I!; >=! <Il
14 15 16 17 18 19 20 21 22 23 2
PR Talwandi Sabo EA NM GC(877.0) 749.0 106.0 Kaile 8andar (15) T(877.0) (01056900)
PR Raman (12) EA NM GC(830.0) 620.0 102.0 Kot 8akhtu 2 TW(14S.0) (01057000) TWE(46.0) T(10210)
PR Raman (13) EA NM GC(248.0) 22S.0 370 16S.0 ManwalaUrf 3 T(248.0) Kishangarh
(01057100)
PR Raman (10) EA NM Wheat, GC(S43.0) ,.. 7.0 SIO 8angi Oipa 4 Rice, Milk· T(S43.0) , Singh
(01057300)
PR Raman(S) EA NM GC(516.0) 4.0 45.0 Bangi Rughu 5 T(516.0) (01057400)
PR Raman (6) EA NM GC(743.0) 57.0 Sukhladhi 6 T(743.0) (01057500)
PR Raman (2) EA NM GC(8SI0) 210.0 92.0 8agha 7 T(85 1.0) (01057600)
PR Raman (5) EA NM GC(917.0) 229.0 74.0 Tarkhanwala 8 T(9170) (01057700)
PR Raman (2) EA NM GC(490.0) 310 10.0 45.0 Ramsara 9 T(490.0) (01057800)
PR Raman (6) EA NM Khaddar, TWE(52.0) 11110 26.0 Kanakwal Urf 10 Furniture T(S2.0) Rattangarh
(01057900)
145

DISTRICT CENSUS HANDBOOK: BATHINDA
Census of India 2001 -
CD block Talwandi Sabo (0006) Amenities and
Amenities available (if not available within the village, a dash (-) is shown in the column and next to it in brackets the distance in broad ranges viz.< 5 kms., 5-10 kms. and 10+ kms of the nearest place
where the facility is available is given)
';;) '" '0 ::0 12 t::
v '" 0
~ c:: ~ '" P-
"8 ,-. OJ
'" U 'r- ..c fa rJl _g ::0 oJ
c:: '" - . <> <> 0; :;a ___ u . 2 g c:: 0 c: > ... 't ""' v 0 0 .~ a .r;; E 'iii U ~ ..c: .., ~ Q. "3 o ::0 <.)
9 ;:; <> <> e ~'§ ;;: ~ .3 '" P- o 0 '" ] l' 'C (I') :s .., ~ "0 ~.~
a > .e co 'iii a<:l .;;: .::: '" 8 - "" E .s c:: 1;l §
'" c .., 1'l<a~ ',;;'~
.2 :s ... § o ._
o'I35 e c:: • ... 0 ~ .r;; c g .g § .,
~ ...... 'iii .::: e _" '" .c 0 0; 0; 0; .5 ::0 ",._
"3 ...... ~ e .~ .~ ! E '" 0 t: on '8 c:: u·~ P- ::0'" 0'-'"" :s ...... .., 0 .8 .~ 0; t>Il .£ ~ ~ ';:J ~ El c:: '" c:: 0 til P- c:: u E E ~ ., (.) :Q ::I U '" .~ rJl 0;
~ '5 'IS E U :;:; c:: •. r E .~ ~ ~.~ ~ g~ ·c ::s '"
o:-:::...c .., 0 0 :s "0 ~ ~ 0 0 t>Il-5 .., (.) ::I CI) 6 C C 6 bY Q" ~ ~ Q ~<lSo ~ ~
2 3 4 5 6 7 8 9 10 II 12 13
Name of Tahsil: Talwandi Sabo (0003)
II Phulo Khari 1,193.0 1,912 318 PMS THP PH(55) BS (01058000) C(lO+) H«5) TW PO«5) CM« 5) ACS« 5) CV« 5) RS(5-10)
MCW«5) SS-T CP« 5) NCS« 5) SP(lO+) NW(IO+) PHC« 5) OCS« 5) ST(5-10)
12 Giana 1,875.0 3,984 706 PM S PHS H(IO+) THP PO PH(SI) ACS 5P BS (01058100) C(S-IO) MCW(lo+) TW CM« 5) OC5 CV« 5) RS(IO+)
PHC(W+) SS-T CP«5) NCS« 5) ST(5-10) NW(lO+)
13 Gatwali 701.0 1,834 325 PM D H(5-10) THP PH(49) ACS OCS SP BS (01058200) C(5-1O) MCW(5-10) TW PO«5) CM«5) NCS(5-10) CV« 5) RS(IO+)
PHC(5-10) SS-T CP« 5) ST(5-1O) NW(lO+)
14 Jogewala 431.0 1,057 177 P M« 5) THP PH(20) B5 (01058300) C(1O+) H(10+) TW PO(5-10) CM« 5) ACS« 5) CV(IO+) RS(5-1O)
MCW(lO+) 5S-T CP(IO+) NCS«5) SP(10+) NW(lO+) PHC(lO+) OCS« 5) ST(10+)
15Tungwali 308.0 617 109 P M« 5) THP PH(12) BS (01058400) C{S.IO) H(10+) TW PO(S-IO) CM« 5) AC5« 5) CV(S-IO) R5(10+)
MCW(5-10) 55-T CP(1O+) NCS« 5) SP(10+) NW(lO+) PHC(5-10) OCS« 5) ST(IO+)
16 Malkana 2,448.0 4,250 728 P(2) M S THP PO CP ACS BS RS (01058500) C(5-10) H«5) TW PH(120) CM« 5) NCS CV« 5) NW(IO+)
MCW(S-IO) 5S-T OCS SP(lO+) PHC(5-10) ST(10+)
17 Jaiial 838.0 2,944 487 P M« 5) THP PH(26) ACS SP BS (01058600) C(5-10) H(5-10) TW PO(lO+) CM« 5) NCS CV« 5) RS(5-10)
MCW(S-IO) 5S-T CP(5-1O) OCS 5T(5-10) NW(lO+) PHC(5-10)
18 Kamalu 600.0 1,808 284 P M« 5) THP PH(S2) B5 (01058700) C(lO+) H« 5) 5S-T PO«S) CM« 5) ACS(S-IO) CV« 5) R5«5)
MCW« 5) CP« 5) NCS(5-10) 5P(IO+) NW(lO+) PHC«5) OCS(5-10) 5T(IO+)
19 Bangi Nihal 1,475.0 3,306 505 P M« 5) THP PH(70) ACS BS Singh C(1O+) H(5-1O) SS-T PO«5) CM«5) OC5 CV« 5) RS (01058800) MCW(5-10) CP« 5) NCS(5-IO) SP(IO+) NW(IO+)
PHC(5-10) ST(lO+)
20 Bangi Ruldu 1,610.0 3,911 659 P I Tr THP PO CM AC5 5P B5
(01058900) M«5) H(lO+) $$-T PH(l2~) CP« 5) OCS CV« 5) R5(5-10)
C(IO+) MCW(S-IO) NC5« 5) ST(lO+) NW(lO+)
PHC(5-IO)
146

VILLAGE DIRECTORY
Village Directory
Land Use (As on 19(9)
Land use (i.e. area under different types of land use in hectare)
-0 f.j l<l .g
E .c c " 0 0 ::l '-' _,. '" '~ c: b() g
~ b() > 0
'p .~
8 .5 '3 ... .", '-' c 0 " 0
~ .~ ~ ::l ... ...l
j V>
?Jl " g <8 o(l :a 0 ~ d)
~ " ::l ~ ~ II)
~ o<l ~-g ~ ~ c: Z> -- ~ "§ ...
;>, II)
B ~ 0- .... -0 ~ ~ .;: J:l
] B go §. &~ e {1 II) § .", :c~ g .... iii VI 0. .§ oS ~ M 0 C e "
... iii 'S '" '" II)
" '" 'I;; ::: ... ., '" 0- 10 ~ ~ ~ M .i3 > .. § o § '0 ~ ·c 0. II) 0 II) 0 'S -0 II)
~ ;;::; Q" ;;::; ~!;; .." >=! ;;;2 a ~ ;;::; VJ
14 15 16 17 18 19 20 21 22 23 2
PR Raman (4) EA NM Khaddar, TW(24.0) 510.0 602.0 56.0 PhuloKhari II Furniture TWE(I 0) (01058000)
T(25 0)
PR Raman (10) EA NM TW{79.0) 1717.0 77.0 Giana 12 TWE(20) (01058100) T(8LO)
PR Raman (12) EA NM 0C(25.0) 202.0 420.0 29.0 Gatwali 13 TW(23.0) (01058200) TWE{2.0) T(50.0)
PR Raman (12) EA NM OC(3240) 107.0 Jogewala 14 T(324.0) .~ (01058300) ,
PR Ooniana (12) EA N OC(l46.0) 63.0 51.0 Tungwali 15 TWE(48.0) (01058400) T(l94.0)
PR Raman (6) EA NM OC(1699.0) 405.0 259.0 Malkana 16 TWE(8S.0) (01058500) T(1784.0)
PR Raman (8) EA NM GC(616.0) 71.0 70.0 Jajjal 17 TWE(8LO) (01058600) T(697.0)
PR Raman (3) EA NM GC(5260) 30.0 44.0 Kamalu 18 T(5260) (01058700)
PR Raman (4) EA NM GC(1369.0) 46.0 60.0 Bangi Nihal 19 T(1369.0) Singh
(01058800)
PR Raman (6) EA NM 0C(1492.0) 23.0 95.0 Bangi Ruldu 20 T(l492.0) (01058900)
147.

DISTRICT CENsus HANDBOOK: BATHINDA
Census of India 2001 -
CD block Talwandi Sabo (0006) Amenities and
Amenities available (if not available within the village, a dash (-) is shown in the column and next to it in brackets the distance in broad ranges viz.< 5 kms., 5-10 kms. and 10+ kms of the nearest place
where the facility is available is given)
~
~ '" '" ~ :l d)
0 '" ~ 0 la c ~ """ "0 ~ ° fa "" 8 t) '" U .£> CIl
° :l 8' c ..c: ~ ,..... 0 II) 03 :;a~
. ~ e- o c .::: .... 'E~ ° 0 0 1<j a ..c: E u C!- ..c:
0. ~ "3 o ::> ., i;' 0 ., -- "@ -8 'C ~ ~ 0
~ 0 '" ~ "" .8 .....l 0 "0 '(
~.~ ..... - 0
"0 a > .~ '" ., OIl C!- o c:o~ .;: ..c: "1:) - .", ___ '"
1;l iii 0 ::l 03 ::> '" ~ ~ ., c:
~ c: .., ° 6 "", o ._ t:: .;:; .9 ::l .... ..c:: c: g o C .... !:! 0 ° Od o ] ° ""' ~ ~ ~
._ 0
~ ~ ..c: (;l . '" (;l .5 ~._
0 "3 ""' (;l ;:: ~ .~ .~ !9 '" 0 c: OJ) .~ c u·_
::> ..... ~
0- 0 OJ) ° ::>"0 O._.-.",
t:: '" C 0 0 t ''J 03 c "B ~ .::: ~ .~.~ ~
~J 0-
~ u :.:;a ::I U
03 I [3 s U :.a ..: .g t) ~.,= -·c ::> c (.)~..o
° ·c '" 0 0 0 ::> "0 ~
0 0 en.;:; ., U ::I o·_ CIl 1= 1= ~ f:!:l Cl p... \.1 ::!: Q Q;;<S1l 1.1 ~
2 3 4 5 6 7 8 9 10 II 12 I3
Name of Tahsil: Talwandi Sabo (0003)
21 Leleana 1,131.0 3,41S 613 PM MH H(5-1O) THP PO ACS BS (01059000) C(5-IO) MCW(S-IO) SS-T PH(\26) CM(5-10) OCS CV«5) RS(5-10)
PHC(5-1O) CP« 5) NCS« 5) SP(lO+) NW(lO+) 8T(10+)
22 Mahi Nangal 1,081.0 2,494 411 P MC(5- THP PH(85) ACSOCS SP BS (01059100) 10) H(S-IO) SS-T PO(5-10) CM«S) NCS« 5) CV«5) RS(S-IO)
MCWr-IO) CP« 5) ST(\O+) NW(lO+) PHC( -10)
23 Jeon Singhwala 1,463.0 3,207 574 P MC(5- D H(S-IO) THP PO ACS BS (01059200) 10) MCW«5) SS-T PH(35) CM«5) OCS CV« S) RS(IO+)
PHC« 5) CP(S-IO) NCS(5-10) SP(lO+) NW(IO+) ST(IO+)
24 Bhagibandar 2,528.0 6,S78 1,093 P(3) M(2) DHC PHS THP PO ACS BS (01062500) S PUC RMP H(5-IO) SS-T PH(l20) CM«5) NCS OCS CV«5) RS(S-IO)
C«5) MCW(5-tO) CP(5-10) SP(lO+) NW(IO+) PHC(S-IO) ST(S-IO)
.,_
25 Talwandi Sabo 4,422.0 16,7S4 3, liS P(IO) M(6) H D MCW THP para CM(S) ACS CVSP BS (01062600) S(4) PUC PHC PHS SS-T PTa CP(2) NCS OCS ST RS(lO+)
C(2) PH(350) NW(IO+)
26 Lelewala 1,270.0 4,004 665 PM DARMP THP PH(76) ACS OCS BS (01062700) C(5-10) H(5-10) SS-T PO(5-10) CM« 5) NCS(5-10) CV« 5) RS(5-10)
MCW(5-10) CP« S) SP(IO+) NW(IO+) PHC(5-10) ST(5-10)
27 Shekhpura 1,95S.0 4,S02 826 P(4) M(2) HADA THP PO CMCP ACS BS (01062800) S C(10+) H(S-IO) SS-T PH(120) NCS CV«S) RS(IO+)
MCW(S-IO) OCS SP(IO+) NW(IO+) PHC(S-IO) ST(5-IO)
28 Gadhianwala 505.0 704 124 P M«5) DDA THP PH(30) BS Ur[ C(5-10) H(S-IO) S5-T PO(S-IO) CM«S) ACS«5) CV(5-10) RS(lO+)
Bhagwanpura MCW«S) ~P« 5) NCS« 5) SP(IO+) NW(JO+)
(01062900) PHC« 5) OCS« 5) ST(IO+)
29 Ram Tirath Jaga 2,986.0 6,212 1,011 P(3) M(2) THP PO PH(40) ACS BS (01063000) S C(5-10) H(S-IO) SS-T eM« 5) NCS CV« 5) RS(lO+)
MCW(5-10) CP(5-10) OCS SP(IO+) NW(IO+) PHC(S-IO) ST(IO+)
30 Fatehgarh S77.0 1,667 298 P M«5) THP PH(45) ACS OCS BS
Nouabad C«5) H«5) SS-T PO«S) CM«5) NCS(5-10) CV« 5) RS(lO+)
(01063100) MCW«S) CP(5-10) SP(lO+) NW(IO+) PHC« 5) ST(lO+)
148

VILLAGE DIRECTORY
Village Directory
Land Use (As on 1999)
Land use (i.e. area under different types of land use in hectare)
"" §
.-.. jg c: ~ ~ g .~ 8 ~
OJ) c: .f' OJ) > .~ .5 :E
~ <> "" " 0 "" t) t)
.5 § " ... 0
1;j U ...J <> 1;:;
~ ,.,
§ S cl<!!
:W '6 0 (.) <> :::E
(.) :; :0
~ .;; cl<!! §""
0 ~ '" c: >, </)
~ _g B ~ 0. ... t:: ~ .>, ~ .,
8.B e "" ~ .;;
..c: B 0- 0-., ., S
~ " '" "" til :o~ '2 ""' " 1;:; '" 0- .§ <S rJ OJ) 0 c: 8 ~
... '" ~ 'E e! '" <> ..., " ;3 ~ '"
<> 03 0- ~ ~ ~ ~ e OJ) f,j 0- <> 0 <> 0 'E 'c - 0 ~
.;::
-< Z p.., z :::E E iJ., ;:> " ... Z <> ,_., t.) OJ) rn
14 15 16 17 18 19 20 21 22 23 2
PR Talwandi Saba EA NM GC(1041.0) 90.0 Leleana 21 (7) T(l041.0) (01059000)
PR Talwandi Sabo EA NM GC(977.0) 3.0 101.0 Mahi Nangal 22 (7) T(977.0) (01059100)
PR Talwandi Sabo EA NM GC(l136.0) 9.0 127.0 Jean Singhwala 23 (9) TWE(l91.0) (01059200)
T(1327.0)
PR Talwandi Sabo EA NM GC(23070) 28.0 9.0 150.0 Bhagibandar 24 (5) TW(34.0) (01062500)
T(2341.0)
PR Raman (12) EA NM GC(4015.0) 74.0 333.0 Talwandi Sabo 25 T(4015.0) (01062600)
PR Talwandi Sabo EA NM GC(1172.0) 41.0 57.0 Lelewala 26 (5) T(II72.0) (01062700)
PR Talwandi Sabo EA NM GC(1790.0) 35.0 130.0 Shekhpura 27 (9) T(1790.0} (01062800)
PR Talwandi Sabo EA N GC(340.0) 86.0 34.0 Gadhianwala 28 (II) TW(45 0) Urf
T(385.0) Bhagwanpura (01062900)
PR Talwandi Sabo EA NM GC(2604.0) 104.0 200.0 Ram Tirath 29 (8) TW(62 0) Jaga
TWE(16.0) (01063000) T(26820)
PR Talwandi Sabo EA NM GC(528.0) 2.0 47.0 Fatehgarh 30 (5) T(5280) Nouabad
(01063100)
149

DISTRICT CENSUS HANDBOOK: BATHINDA
Census of India 2001 -
CD block Talwandi Sabo (0006) Amenities and
Amenities available (if not available within the village, a dash (-) is shown in the column and next to it in brackets the distance in broad ranges viz.< 5 kms., 5-10 kms. and 10+ kms of the nearest place
where the facility is available is given)
Vi' t! ]' :; J2 ., v> 0
'" § "0 "0 ,.-., ., 0.
8 ~ v> U .D Iii CI)
_g :; .; t: v> - U u E! 'B~ t: 0 C > u 0 5 'E ~ .~ e 0 0 .~ B -= E t!.- -= u
~ 0. u "3 o ::s u ~
0 <3 v> U 0. U c;j .g ·c ~ ~ -l 0 "'=' ~ l' .~ ~ ~ ._ 0
~ "0 B > .~ ::s u o(l t!.- -= "0 0 ~ ",p - "'=' E£.tti
§ u ::s'til ::s
~ .s c ~ "'=' c u U e -< '" ~
.9 ... § o .- c _
] _g %l ..c c g ~1:l6 .g § ..... Cd 0. - '" .S; 0 c;j r: c;j E!.~ C'::S .- =' '" .-
~ "3 ..... ~ .S:? ! '" 0 c OJ) '13 c u·-0. ::s"'=' o~"'=' ....
~ 0 ... 0 OJ) u ... .:!: ~ ._ tI) ~ c '" 0 0. II .~ c;j c ~ u -u- ::s >,
c;j u u :;;l E ::s u ~ :e v:. E '" ~ S "3 § u :a c ..r E
u ... E ~ ·c ::s '" '~.s u~.o ., 0 ~ "'=' u ·c 0 0 ., u ::s 0:-::
sa 6, f:: 6, [,!,l ~ 0 Q, s.1 ~ Q ~<S-U s.1 ~ 2 3 4 5 6 7 8 9 10 11 12 13
Name of Tahsil : Talwandi Sabo (0003)
31 Gurusar J oga S58.0 1,344 232 P M« 5) THP PH(40) BS (01063200) C«5) H«5) SS-T PO« 5) CM« 5) ACS« 5) CV« 5) RS(10+)
MCW«5) CP(5-10) NCS« 5) SP(10+) NW(IO+) PHC« 5) OCS«5) ST(IO+)
32 Sangat Khurd 394.0 1,516 237 P M« 5) THP PH(22) ACSOCS BS (01063300) C« 5) H« 5) SS-T PO« 5) CM(S-IO) NCS(S-IO) CV« 5) RS(1O+)
MCW«'.5) CP(5-10) SP(IO+) NW(IO+) PHC«S) ST(10+)
33 Teona Pujarian 1,178.0 2,262 390 P(3) M(3) DHC PHS THP POPH(60) ACS OCS BS (01063400) S(2) PUC H(lO+) SS-T CM(5-10) NCS(S-IO) CV« 5) RS(lO+)
C«5) MCW(5-10) CP(5-10) SP(IO+) NW(10+) PHC(5-1O) ST(5-1O)
34 Behman Jassa 1,167.0 1,815 287 PM« 5) PHS H(IO+) THP PO PH(40) ACS OCS BS Singh C(IO+) MCW(1O+) SS-T CM(S-IO) NCS« 5) CV« S) RS(10+) (01063500) PHC(IO+) CP(IO+) SP(1O+) NW(IO+)
.,_ ST(IO+)
3S Behman Koer 1,156.0 2,066 344 P MC(S- HC H(S-IO) THP PO PH(45) ACSOCS BS Singh 10) MCW(5-10) SS-T CM(S-IO) NCS(5-10) CV« 5) RS(IO+) (01063600) PHC(5-10) CP«5) SP(10+) NW(IO+)
ST(IO+)
36 Singo 1,419.0 3,304 505 P(2) DCWCHC THP PO PH(60) CM CP ACSOCS BS (01063700) M« 5) H(IO+) SS-T NCS(5-10) CV« 5) RS(1O+)
C« 5) MCW(lO+) SP(10+) NW(lO+) PHC(IO+) ST(10+)
37 Lehri 1,278.0 2,527 444 PM S D H(lO+) THP PO PH(46) OCS BS (0 1 063S00} PUC MCW(lO+) SS-T CM(S-tO) ACS« S) CV« S) RS(IO+)
C(IO+) PHC(lO+) CP« 5) NCS(<;5) SP(1O+) NW(10+) ST(IO+)
38 Menuana 378.0 509 76 P M« 5) THP PHiS) OCS BS
(01063900) C(IO+) H(10+) SS-T PO«5) CM« S) ACS(S-IO) CV(S-IO) RS(S-IO) MCW(10+) CP(JO+) NCS« 5) SP(10+) NW(lO+) PHC(lO+) ST(10+)
39 Mirziana 656.0 1,311 215 P(2) M S PHS H(IO+) THP PH(17) BS
(01064000) C(IO+) MCW(1O+) SS-T PO« S) CM« 5) ACS« 5) CV«5) RS(5-1O) PHC(10+) CP(5-IO) NCS« 5) SP(lO+) NW(lO+)
OCS«S) ST(IO+)
40 Gehlewala SS2.0 1,141 203 P M« S) THP PH(20) ACS BS
(01064100) C(1O+) H(lO+) SS-T PO«5) CM(5-10) NCS(S-IO) CV«5) RS(IO+) MCW(1O+) CP(S-IO) OCS(5-IO) SP(IO+) NW(IO+)
PHC(IO+) ST(5-10)
150

VILLAGE DIRECTORY
Village Directory
Land Use (As on 1999)
Land use (i.e. area under different types of land use in hectare)
"" 1i3 til 0)
E ..c c: "" 0 0 0 :> 0
~ 01 .~ c: OJ)
._§, .~ OJ) .:: 0 .~
8 0) "" .5 -3 0
.5 0 "" 0 0
~ ~ :> ... ..-l
l ~ '0 u <8 o'd
~ ~ 0 e g 0)
::E 0 :> :E 0)
.;;: o'd ~"E 0 m 01 OJ)
c: ;>, ..._ '" '"ij ~ ... 0)
2 ;I: Q. ... ;>, -0 ;I:
~ .;;: .0
0) 0'" e -ti 2 0- g. o-B ~ 0) E :>
"" ~~ '0 ..... :>
01 t; '" c. .5 <!! ~ OJ) 0 c: e ~ ...
'" t; 'E c: 0) 0)
''gi § 01 ... 0) 01 03
0- ;I: ~ ~ OJ) E > § c.. <1) 0 ... 0 ] 'c - 0 i':! ·c -< Z z ::E E ::::> :> ... -< Z
<1)
0.. J,.!., o I?ll V)
14 15 16 17 18 19 20 21 22 23 2
PR Talwandi Sabo EA NM 0C(438.0) 92.0 28.0 Gurusar Joga 31 (5) T(438.0) (01063200)
PR Talwandi Sabo EA NM 0C(302.0) 62.0 30.0 Sangat Khurd 32 (5) T(302.0) (01063300)
PR Talwandi Sabo EA NM 0C(605.0) 501.0 72.0 Teona Pujarian 33 (6) T(6050) (01063400)
PR Talwandi Sabo EA NM GC(754.0) 356.0 57.0 Behman Jassa 34 (12) T(754.0) Singh
(01063500)
PR Talwandi Sabo EA NM Wheat, 0C(969.0) 134.0 53.0 Behman Koer 35 (13) Sarson, T(969.0) Singh
Narma (01063600)
PR Talwandi Sabo EA NM 0C(1329.0) 18.0 72.0 Singo 36 (II) T(1329.0) (01063700)
PR Talwandi Sabo EA NM OC(617.0) 497.0 84.0 Lehri 37 (3) TWE(80.0) (01063800)
T(697.0)
PR Raman (28) EA N 0C(229.0) 119.0 25.0 Menuana 38 TW(5.0) (01063900) T(234.0)
PR Raman (30) EA NM 0C(55 1.0) 65.0 40.0 Mirziana 39 T(551.0) (01064000)
PR Raman (18) EA NM OC(4490) 80.0 23.0 Gehlewala 40 T(449.0) (01064100)
.,..
151

DISTRICT CENSUS HANDBOOK: BATHINDA
Census of India 2001 -
CD block Talwandi Sabo (0006) Amenities and
Amenities available (if not available within the village, a dash (-) is shown in the column and next to it in brackets the distance in broad ranges viz.< 5 kms., 5-10 kms. and 10+ kms of the
nearest place where the facility is available is given)
'VI t! ~ '" ~ '" '" '" 0 8 '" § -0 -0 ~ '"
Q. 0 <:> '" u .J::> § C/) 0
'" '" ..; .c '" - '" '" (ij =ia,..... '" '" 0 '" > u . 9 g '" 0 .~
.... 'E ~ 0 B ..c:: S Ol U ~ ..c::
0- "3 o '" ~ ~ 0 '" - '" (ij .g 'c 0 01J 0 '" '" Q. 0 '" ~ .....l ~ 0 -0 11 l' 'C til ...... _ 0
"0 B >.';: '" '" o(! ~ 0 ~·3 CQ-.;:;: .c -0 u _ -0 ,-," § ::> 'Cis ::>
~ '" '" 1;l -0 '" '" oS"': '" ~ .s ·i ::> ... § gOg t: .... _g ~ ..c:: ~~E
o ",0
'" "-' g- o '" '':: 0
.J::> .;:;: 0 (ij (ij E.:g ro·_" :;j ".-S "3 "-' ~ ... .~ t: U'- 00l
" Q. 0 t: OJ) 0'-''0 .- -::> "-' ~ 0 .8 .9 (ij
01J '" B ~ .~.~ bl c: '" c: 0 Q. Ol c: 11 '" E~ '" 0 :I2 S ::> 0
(ij § 'IS '5 s 0 :a tf s .~ tl ~.-:: ~ S ~ 'c .g c: 0:-=.0
'" 0 0 ::> '" 'c 0 0 tih.s 4) U ::> 0::= {/) Z t= t= Z If! ~ Q Q, \.2 ~ Q ~<lSo \.2~
2 3 4 5 6 7 8 9 10 11 12 13
Tahsil : Talwandi Sabo (0003)
41 Kaureana 798.0 1,982 326 PM THP PO PH(40) ACSOCS BS (01064200) C(lO+) H(lO+) SS-T CM(5-10) NCS(5-10) CV« 5) RS(5-10)
MCW(IO+) CP(5-10) SP(lO+) NW(IO+) PHC(IO+) ST(5-10)
42 Raya 534.0 1,012 177 PM« 5) THP PH(20) ACS BS (01064300) C(5-10) H(lO+) SS-T PO« 5) CM(5-10) NCS« S) Cv(lO+) RS(IO+)
MCW~IO+) CP(5-10) OCS(S-IO) SP(lO+) NW(IO+) PHC(IO+) ST(lO+)
43 Kalalwala 998.0 2,257 405 PM PHS H(5-10) THP PO PH(51) ACSOCS BS (01064400) C(10+) MCW(IO+) SS-T CM« 5) NCS« S) Cv« 5) RS(5-10)
PHC(IO+) CP(5-10) SP(lO+) NW(IO+) ST(5-10)
44 Fatah Balu 483.0 661 109 P M«5) THP PH(28) BS (01064500) C(lO+) H(lO+) SS-T PO« S) CM«S) ACS« S) Cv(S-IO) RS(IO+)
MCW(lO+) .,.
CP(S-IO) NCS« 5) SP(IO+) NW(IO+) PHC(IO+) OCS(5-10) ST(lO+)
45 Golewala 490.0 755 134 PM THP PH(26) ACS OCS BS (01064600) C(lO+) H(lO+) SS-T PO« 5) CM« 5) NCS(5-10) CV(5-10) RS(S-IO)
MCW(lO+) CP(S-IO) SP(IO+) NW(IO+) PHC(lO+) ST(IO+)
46 Natheha 1,114.0 2,444 412 P(2) M S DMCW THP PO PH(3S) ACS OCS BS (01064700) C(IO+) PHC PHS SS-T CM«S) NCS(S-IO) CV« S) RS(5-10)
H(IO+) CP(5-10) SP(lO+) NW(IO+) ST(S-IO)
47 Nangla 1,216.0 2,339 422 P M« 5) THP PH(S5) BS (01064800) C(IO+) H(lO+) SS-T PO«S) CM«S) ACS« 5) CV«5) RS(IO+)
MCW(IO+) CP(5-10) NCS« 5) SP(lO+) NW(lO+) PHC(IO+) OCS(S-IO) ST(IO+)
Block Total 54020.0 129364 22071 P(70) H HA D(10) T(47) PO(20) CM(8) ACS(30) CV ST BS(47) M(34) DA(3) MCW(2) HP(47) TO PTO CP(5) NCS(7) SP(7) RS(3) S(15) MH CWC(2) TW(ll) PH(2817) . OCS(36) PUC(4) HC(5) PHC(2) C(2) I Tr PHS{IO)
RMP(2)
152

VILLAGE DIRECTORY
Village Directory
Land Use (As on 1999)
Land use (i.e. area under different types of land use in hectare)
." c
'" ... '" " ..c c ."
E u 0 0 ::s u
-'" '" .~
"" c e .E' "" .~ .2 c :; ~
" " ." :; u u c 0 ::s u 0 c ·S E ... ....J
~ ~ u <8 " E " ~ o<! OIl :; OIl 0 ~ " ~ ~ u ::s ~
::0 " .s: o<! ="8
0 ,.:g OIl Vl ~ ... c .0 -- '" .; .,
B ~ 0- ... ~ ... » -0 ~ ;;. .s: ..c
" e ..c B 0. 0. 8.~ 8 " '" E u ::s
'" ." '" ::o~ 0 '"' ::s .. "in Vl 0- .6 ~ 8 Of) 0 c ... ' e Vl c e ~ " Vl _ ::s
"in '" 'E E ~ '" " 0; c.. ;!: ;!: '" c " Of) E ... '2 " .;:: c.. " & " o .. 0 'E - 0
-< '" ., <: z z ::? E ;:? ::s ... Z H-< H U bJ) (()
14 IS 16 17 18 19 20 21 22 23 2
PR Raman (20) EA NM GC(279.0) 486.0 14.0 Kaureana 41 TW(160) (01064200) TWE(30) T(298.0)
PR Raman (24) EA NM GC(501.0) 33.0 Raya 42 T(5010) (01064300)
PR Raman (25) EA NM GC(661.0) 327.0 10.0 Kalalwala 43 T(6610) (01064400)
PR Raman (27) EA N GC(341.0) 100.0 30.0 Fatah Salu 44 TW(120) (01064500) T(353.0)
PR Raman (23) EA N GC(358.0) 78.0 2.0 52.0 Golewala 45 T(358.0) (01064600)
PR Raman (35) EA NM G€(538.0) 303.0 89.0 79.0 Natheha 46 TW(IOS.0) (01064700) T(643.0)
PR Talwandi Sabo EA NM GC(1026.0) 105.0 Nangla 47 (20) TW(85.0) (01064800)
T(lII1.0)
PR(47) EA(47) N(41) 0.0 GC(38069) 7947.0 3075.0 3687.0 M(42) TW(635)
TWE(607) T(39311)
153


Map of CD Block Maur


CENSUS OF INDIA,2001.
INDIA PUNJAB
C.D.BLOCK MA UR . TAHSIL TAL W ANDI SABO
DISTRICT BATHINDA Km.1 0 I 2 3 4 5 6 Km.
, ~ I ........ .
"" o " . \ ...... 1
FROM RAMAN ,
RAMPURA ./J
j ...... _ ......... « .~' 607 -;' U/ '.. \.. . \
S .
612 ."
" \ . . ( SABa ....
\
, ........ I
.", .
. ,,' DIS T tz
BOUNDARY, DISTRICT TAHSIL : : : : : : : : c. D. BLOCK. . . . . . VILLAGE WITH P.L.C.NUMBER .
HEADQUARTERS: C.D. BLOCK POPULATION SIZE CLASS OF VILLAGES:BELOW 200,200-499,500-999,1000-4999,5000 AND ABOVE UNINHABITED VILLAGE WITH P.L.C.NUMBER . URBAN AREA WITH LOCATION CODE STATE HIGHWAY . . . . . . . . . . IMPORTANT METALLED ROAD . . . . . . RAILWAY LINE WITH STATION,BROAD GAUGE POST OFFICE/ TELEPHONE OFFICE/ POST AND TELEGRAPH OFFICE . . . . . . . . . SECONDARY OR SENIOR SECONDARY SCHOOL PRIMARY HEALTH CENTRE . BANK
-----I 01061200 )
• o ••••
x )
fj SH 12A
RS
PO/ TO/ PTO S a B
Based upon Survey of India map with the permission of the Surveyor General of India.
C.D. BLOCK BOUNDARY EXCLUDES 3T ATUTORY TOWN (S)
BOUNDARIES ARE UPDATED UPTO 1.12000.
TOTAL AREA OF CD. BLOCK (In Sq Km) . 282.78
TOTAL POPULATION OF C.D. BLOCK . . 69.326 TOTAL NUMBER OF TOWNS IN C.D. BLOCK 1 TOTAL NUMBER OF VILl.AGES IN C.D. BLOCK 33
DISTANCE FROM DISTRICT HEADQUARTERS (In Kms). 42
© Government of India Copyright,200!


VILLAGE DIRECTORY
ALPHABETICAL LIST OF VILLAGES (CD. BLOCK WISE)
Name of the District : Bathinda ',_
Serial Name of 2001 Census 1991 Census Serial Name of 2001 Census 1991 Census number village location location number village location location
code number code number code number code number 2 3 4 2 3 4
Name of CD Block: Maur (0007) 15 Kishangarh Urf
Chinarthal 01060000 110030006000600041 Name of Tahsil: Bathinda (0002)
16 Kot Bhara 01059400 110030006000600029 Dhan Singh 17 Kotli Khurd 01061200 110030006000600054 Khana 01053000 110020006000600035 18 Kutiwal Kalan 01060600 110030006000600045
Name of Tahsil: Talwandi Sa:bo (0003) 19 Kutiwal Khurd 01060800 110030006000600046
1 Arai Khana 01059900 110030006000600040 20 Maisar Khana 01060200 110030006000600043
2 Bangher Charat 21 Manak Khana 01059800 110030006000600039
Singh 01062300 110030006000600032 22 Mansa Kalan 01061800 110030006000600051
3 Bangher Mohabat 23 Mari 01061900 110030006000600050 Singh 01062200 110030006000600031 24 Maur Charat
4 Bhai Bakhtour 01059600 110030006000600037 Singh 01060400 110030006000600048
5 Btuj 01061700 110030006000600052 25 Natt 01062400 110030006000600033 6 Burj Serna 01062100 l100300Qti000600036 26 Rajgarh Kuba 01061500 110030006000600053 7 Chathewala 01059300 110030006000600028 27 Ramgarh 8 Gehri Bara Singh 01060100 110030006000600042 Bhundar 01059500 110030006000600030
9 Ghaso Khana 01059700 110030006000600038 28 Ramnagar Urf
10 Ghuman Kalan 01061000 110040009000900002 Kasaiwara 01060500 110030006000600047
II Ghurnan Khurd 01060900 11004000900090000 1 29 Sandoha 01061600 1 10030006000600057
12 Jatri 01060300 110030006000600049 30 Sukha Singhwala 01061100 110040009000900004
13 Jodhpur Pakhar 01062000 110030006000600035 31 Swaich 01061400 110030006000600056
14 Kamalu 01061300 110030006000600055 32 Thamangarh 01060700 110030006000600044
157

DISTRICT CENSUS HANDBOOK: BATHINDA
Census of India 2001 -
CD block Maur (0007) Amenities and
Amenities available (if not available within the village, a dash (-) is shown in the column and next to it in brackets the distance in broad ranges viz.< 5 kms., 5-10 kms. and 10+ kms of the nearest place
where the facility is available is given)
~ € j ::l '" <> '" .!« 0 ..." C § ..." a. 8 ~ '" § r/l (.) U ..0
<1J ::l oJ c: ..c: '" ;; <1J <I) e =a~ .~
c: c: ;> (.)
g <1J 0 0 .~ .2 ..c: E "E ~ u t!, ..c: <:> '" 0- ., ::; o ::l 0) i;-0 OJ) <3 '"
0) 0- (J -;a ~·c ~ ~ ,_l ~ 0 ..." "§ 'i' 'C: Vl ..... - a "0 .2 > .-::: ::l 0)
~ .;; t!, ..c ..." 0 ~.~ _ ""0 6ta <1J §
(.) b 0:> ::l"Ol ::l '" ::. ~
<1J C '" ..." (J E -0:: -s .9 ::l .... § o .- c ... 0 ~
..c: r=~ £ ~"§ o C <I) .... 1<1 ..c: §" - c 'z 0
..0 .;; 0 "3 .... til ::. .... til ~:a '" .- ",.-
S ., 0 c: OJ) .~ c: u·- ~S g .... <I) 0.. on <I) o~""O 0 .. .9 .!::~ 'C ~ g C '" 0 l;j 0.. .8 til til c "§ E 8 i;-til <I) (.) 3:2 ::l (.) ~:e Ui"
§ S S E (J '0 c: ..: E .~ t E ::. .t: ::l '" u~..c <> 0 0 ::l ..." <1J .t: 0 0 @>-s <I) (J ::l 0=-= sa Z; E:: E:: Z; >!l ~ Cl e" s.i :;:: Q cx:~u ~ ~
2 3 4 5 6 7 8 9 lO II 12 13
Tahsil: Bathinda (0002)
I Ohan Singh 1,142.0 2,025 372 P(2) 0(2) DARMP THP PH(45) BS Khana M«5) H(lO+) SS-T PO(5-IO) CM(5-10) ACS« S) CV«S) RS(IO+) (01053000) C(lO+) MCW(5-10) CP(5-10) NCS(5-IO) SP(lO+) NW(IO+)
PHC(S-IO) OCS(5-IO) ST(5-10)
Tahsil: Talwandl Sabo (0003)
2 Chathewala 1,123.0 2,590 430 P(2) M(2) -~ THP PH(38} ACS OCS BS (01059300) S C(5-10) H(S-IO) SS-T PO(5-10) CM(S-IO) NCS« S) CV« S) RS(lO+)
MCW(IO+) CP(S-IO) S P(l 0+) NW(IO+) PHC(IO+) ST(IO+)
3 Kot Bhara 989.0 2,45S 444 P(2) M(2) o PHS THP PH(68) ACSOCS BS (01059400) S PUC H(5-10) SS-T PO(S-IO) CM«5) NCS(S-IO) CV« 5) RS(S-IO)
C(IO+) MCW(IO+) CP(S-IO) SP(IO+) NW(IO+) PHC(IO+) ST(5-10)
4 Ramgarh 606.0 1,721 276 PM THP PH(79) ACS OCS BS Bhundar C(S-IO) H(5-10) SS-T PO(S-IO) CM«5) NCS(S-IO) CV« 5) RS(S-IO) (010S9500) MCW(S-IO) CP(lO+) SP(IO+) NW(IO+)
PHC(5-10) ST(lO+)
5 Bhai Bakhtollr 811.0 2,396 407 PM THP PH(9S) ACS(2) BS (01059600) C(IO+) H« 5) SS-T PO(S-lO) CM«S) OCS CV«5) RS(S-lO)
MCW(1O+) CP(lO+) NCS« S) SP(IO+) NW(IO+) PHC(IO+) ST(lO+)
6 Ghaso Khana 313.0 834 148 P M«S) D H(1O+) THP PH(37) OCS BS (01059700) C(10+) MCW(IO+) SS-T PO(5-10) CM(5-10) ACS« 5) CV(5-10) RS(IO+)
PHC(IO+) CP(IO+) NCS(S-IO) SP(lO+) NW(IO+) ST(lO+)
7 Manak Khana 263.0 487 76 P M« S) THP PH(17) OCS BS (01059800) C(IO+) H(5-10) SS-T PO«5) CM(5-IO) ACS« 5) CV(5-10) RS(5-10)
MCW(IO+) CP(5-10) NCS« 5) SP(lO+) NW(IO+) PHC(IO+) ST(lO+)
8 Arai Khana 1,178.0 1,851 307 PM HC H(5-10) THP PO PH(50) • ACS(2) BS (01059900) C(IO+) MCW(5-10) TW CM(5-10) NCS« 5) CV« 5) RS« 5)
PHC(5-IO) SS-T CP« 5) OCS(5-10) SP(!O+) NW(lO+) ST(5-10)
9 Kishangarh Ur[ 872.0 2,181 352 PM«5) o H(5-10) THP PO ACSOCS BS Chinarthal C(IO+) MCW«5) TW PH(40) CM(5-10) NCS(5-10) . CV« 5) RS(5-10)
(01060000) PHC« 5) SS-T CP«5) SP(10+) NW(IO+) ST(S-IO)
I 0 Gehri Bara 691.0 1,413 249 PM THP PO OCS BS
Singh C(S-IO) H« 5) ss-r PH(30) CM« 5) ACS« 5) CV«5) RS« 5)
(01060100) MCW(S-IO) CP«5) NCS« S) SP(IO+) NW(IO+) PHC(5-10) ST(IO+)
158

VILLAGE DIRECTORY
Village Directory
Land Use (As on 1999)
Land use (i.e. area under different types ofland use in hectare)
"'" " " a .. E
-" " "'" <.) 0 ::s 0 <.)
""" " .~ 00 s::
e- .€' 00 'E 0
'" .~
II) II) "'" '5 -= 0 0 0 u s:: s:: E ::s .... 0
.~ ....:I II) !l E 0' U <.E
'" ~ o(j 00 ;; 00 0 ~ II)
,g .. u ::0 ~ ::s
* ..
.;;: o(j CiS 0 .!: 00
~ '" ,g .... s:: " '@ II)
.s :l: .... fL. ;;., ~ 0. e "'" > .;; .0
.s 0. II) 8..2 ~ " .. E -" 0.
u ::s .. EHl "'" :o~ a .... ::s .. tl '" 0. ~ bll 0 s:: e e ....
'" ._ "'"
t; § e '" s:: II) II) _ ::s
a ~ .. ·2 0. .. :l: ~ '" s:: e bll E 0. .. ... o .. '6 c - 0 ~ .. « z ~ z ~ E 0 ;::? ::s .... Z
.. ... ...., o bQ III
14 15 16 17 18 19 20 21 22 23 2
PR Goniana (1 0) EA NM GC(805.0) 115.0 112.0 Dhan Singh TW(210) Khana TWE(89.0) (01053000) T(915.0)
PR Talwandi Sabo EA NM ~ GC(932.0) 33.0 85.0 Chathewala 2 (9) TWE(73.0) (01059300)
T(1005.0)
PR Kot Fatta (5) EA NM GC(8530) 28.0 1080 Kot Bhara 3 T(853.0) (01059400)
PR Kot Fatta (6) EA NM GC(537.0) 37.0 32.0 Ramgarh 4 T(537.0) Bhundar
(01059500)
PR Maur (12) EA NM Oarian, GC(543.0) 234.0 Bhai Bakhtour 5 Khes TW(26.0) (01059600)
TWE(80) T(577.0)
PR Maur (12) EA NM Oarian, GC(276.0) 4.0 Ghaso Khana 6 Khes TW(25.0) (01059700)
TWE(80) T(309.0)
PR Maur (14) EA NM Oarian, GC(172.0) 49.0 Manak Khana 7 Khes TW(24.0) (01059800)
TWE(18.0) T(214.0)
PR Bhucho (10) EA NM GC(9210) .~ .68.0 93.0 Arai Khana 8 TWE(960~ (01059900) T(1017.0)
PR Bhucho (12) EA NM GC(658.0) 93.0 60.0 610 Kishangarh Urf 9 T(658.0) Chinarthal
(01060000)
PR Maur (13) EA NM OC(524.0) 105.0 7.0 55.0 Gehri Bara 10 T(524.0) Singh
(01060100)
159

DISTRICT CENSUS HANDBOOK: BATHINDA
Census of India 2001 -
CD block Maur (0007) Amenities and
Amenities available (if not available within the village, a dash (-) is shown in the column and next to it in brackets the distance in broad ranges viz. < 5 kms., 5-10 kms. and 10+ kms of the nearest place
where the facility is available is given)
'Vi ~
I ::l 12
'" '" 0
"'" c § '" c.
8 'Vi '" § C/l
'" ::l U .D oJ c ..c '" OJ '" ca ~~ u
0 C 0 C > .... t~ g .,
0 0 .~ 2 .r:: E 'iii u t!. .r:: c. "'3 o ::l '" ~ t) ., :0 '"
., Ci! .g ·c :;; ~ 0
~ '" c. u ....l 0 "'" '8 'i' '~.~
..... - 0 '0 2 > . ." ::l .,
o'IJ .;; t!. "'" 0 - "'" m-.r::
§ u ::l -.a ::l ,-,,'" ., ., c ., c ., '" ;l:
E '" "'" o ._ U E < c _ -5 .S! ::l .... .r:: § c ~ .... ..8
., o'/j",] .S! § u ~
...... OJ OJ ~ - '" Ci! .5 .D 0 "'3 ._ ca ::: Ci! e·'" OJ ._
E c u·_ .~ i3 '" c.. 0 c '0 ::l"'" o~"'" ::l ._ ~ 8. .... 0 bD '" .... .:: ~ ';:: ~ S § '" c 0 '" 'fj -;a c 1i u ... .0 .::! :.;;a § ::l U ~:€ c/) .. § f Ol
~ 13 13 E (.)
"'" .5 'ii .g ~ ·c ::l u:o;:..o ... 0 0 ::l "'" ~ g 0 0 bD-5 '" (.) ::l 0::: sa 6 t: t: 6 I!,l r;;, ~ ~ Q o:;..;':!u ~ ~
2 3 4 5 6 7 g 9 10 II 12 13
Tahsil : Talwandi Sabo (0003)
II Maisar Khana 2,002.0 4,241 714 P(2) M(2) MCW THP PO CM AC5 NC5 B5 (01060200) 5 PUC HC 55-T PH(l67) CP(S-IO) OC5 CV«S) R5
C« 5) PHC SP(IO+) NW(IO+) H(5-10) ST(IO+)
12 Jatri 385.0 1,081 196 P M« 5) THP PH(31) ACSOCS BS (01060300) C(S-IO) H(5-1O) SS-T PO« S) CM« S) NCS(S-IO) CV«S) RS(IO+)
MCW(S-IO) ,..
CP(IO+) SP(IO+) NW(IO+) PHC(5~lO) ST(IO+)
13 Maur Charat 907.0 2,398 406 PM THP PO OCS BS Singh C« 5) H(5-10) SS-T PH(40) CM(S-IO) ACS(5-1O) CV« S) RS(5-10) (01060400) MCW«5) CP« 5) NCS(S-IO) SP(IO+) NW(lO+)
PHC«5) ST(5-10)
14 Ramnagar Urf 1,767.0 4,027 718 P(2) D H(5-1O) THP PO ACSNCS BS Kasaiwara MS MCW(5-IO) SS-T PH(l60) CM«S) OCS CV« S} RS(lO+} (OI06OS00) C« 5) PHC(S-IO) CP(S-IO) SP(IO+) NW(lO+)
ST(S-IO)
15 Kutiwal Kalan 769.0 1,897 326 P(2) HADA THP PO ACSOCS BS (01060600) MS H(S-IO) SS-T PH(94) CM(S-IO) NCS(S-IO) CV«S) RS(S-IO}
PUC MCW(S-IO) CP(S-IO} SP(IO+} NW(IO+) C(S-IO) PHC(S-IO) ST(S-IO}
16 Thamangarh S27.0 9S3 ISO PM«S) THP PH(12) OCS BS (01060700) C« S) H(S-IO) SS-T PO(S-IO) CM(S-IO) ACS(S-IO) CV(S-IO) RS(lO+)
MCW(S-IO) CP(S-IO) NCS(S-IO) SP(IO+) NW(IO+} PHC(S-IO) ST(S-IO}
17 Kutiwal Khurd 567.0 1,617 261 PM DH(5-10) THP PH(46) ACSOCS BS RS(S-(01060800) C(5-10) MCW(5-10) SS-T PO«5) CM(5-10) NCS« 5) CV« 5) 10)
PHC(S-IO) CP(5-10) SP(lO+) NW(IO+) ST(IO+)
18 Ghuman Khurd 614.0 812 126 PM«S) THP PH(IS) ACSOCS BS (01060900) C(IO+) H«S) SS-T PO(S-IO} CM« S) NCS(S-IO) CV(S-lO) RS(S-IO}
MCW(S-IO) CP(S-IO) SP(IO+) NW(lO+) PHC(S-IO) . ST(IO+)
19 Ghuman Kalan 1,520.0 4,644 763 P(2) M DA H«5) THP PO PH(90) ACSNCS BS (01061000) C« 5) MCW«5) TW CM«5) OCS CV« 5) RS(IO+)
PHC« 5) SS-T CP(S-IO) SP(IO+) NW(IO+) ST(5-10)
20Sukha 18S.0 637 109 PM«5) THP PI:-!(I0) ACSOC5 BS 5inghwala C(S-IO) H(5-10) SS-T PO(5-10) CM(S-IO) NCS« 5) CV(S-IO) RS(IO+)
(01061100) MCW(S-IO) CP(IO+) SP(IO+) NW(IO+) PHC(S-IO) ST(IO+)
160

VILLAGE DIRECTORY
Village Directory
Land Use (As on 1999)
Land use (i.e. area under different types of land use in hectare)
"" c .. .... .. Q)
E ..c c "" <.)
0 0 ::l 'a <.)
-'" .. OJ) .. c g .~ Ol) -s .2 c 'iii Q) Q) "0 :.a :;
<.) <.) .5 0 ::l
<.) 0 c § .... !S ~ ~ "0 <8
,_J Q) <I> OJ) " ~ o<l t>Il :.a 0 ~ " ~ '" ~ <.) ::l ~ :0 Q)
.;;: o<l c"B 0 ~ t>Il » <I> '" ~ ....
c .. '<;j .9 ~ Q. .... iL. » ~ " " e "0 > .;;: .D
..c .9 0. 0. 8.§ ~ " '" E g ~ .. "t:l os :o~ '0 .... ::l
<;; .... 0. ,g .a ~ oJ) f! <I> C
0 c 2 ~ " <I> _ ::l t:: :§ B ~ " 0; 0. ~ ~ <I> C ~ t>Il .. E 0. " a " o '" 0 'E c - 0 ~ <IS
.;:
..;:; Z Z ~ E ;:J ::l .... Z " p., f.t., H U bJ) co
14 15 16 17 18 19 20 21 22 23 2
PR Maur (7) EA NM GC(1386.0) 301.0 2.0 162.0 Maisar Khana 11 TW(900) (01060200) TWE(61.0) T(1537.0)
PR Maur(5) EA NM GC(314.0) 61.0 Jatri 12 TW(4.0) (01060300) TWE(6.0) T(324.0)
PR Maur (3) EA NM GC(683.0) 80.0 Maur Charat 13 TW(41.0) Singh TWE(103.0) (01060400) T(827.0)
PR Maur(5) EA NM GC(I~80.0) 111.0 81.0 Ramnagar Urf 14 TW(l14.0) Kasaiwara TWE(181.0) (01060500) T(1575.0)
PR Maur (10) EA NM Wheat, GC(567.0) 60.0 47.0 Kutiwal Kalan 15 Gur,Milk TW(95.0) (01060600)
T(662.0)
PR Maur (10) EA NM ,Gur GC(223.0) 199.0 34.0 Thamangarh 16 TW(710) (01060700) T(294.0)
PR Maur (1) EA NM GC(4610) 32.0 42.0 Kutiwal Khurd 17 TW(32.0) (01060800) T(4930)
PR Maur (5) EA NM GC(SOO.O) 210 37.0 Ghuman Khurd IS TW(56.0) (01060900) T(556.0)
.;-
PR Maur (2) EA NM GC(1322.0) 19.0 47.0 Ghuman Kalan 19 TWE(132.0) (01061000) T(1454.0)
PR Maur (10) EA NM GC(7S.0) 21.0 19.0 Sukha 20 TW(67.0) Singhwala T(l45.0) (01061100)
161

DISTRICT CENSUS HANDBOOK: BATHINDA
Census of India 2001 -
CD block Mallr (0007) Amenities and
Amenities available (if not available within the village, a dash (-) is shown in the column and next to it in brackets the distance in broad ranges viz.< 5 kms., 5-10 kms. and 10+ kms of the nearest place
where the facility is available is given)
~
'" ~
I ~ '" U "'" 0 c: § "0 Cl. "'" 'V;' U a 0 u .D C/l <.) U ::>
" c: .c '" U U co :a ___ u
. 2 c: 0 c: > .... 'E~ e- o 0 _g .~ ] .c S 1<j U !:j, 0. o ::> U ~ U 0 U ] ~'§ 0 ! 0 '"
., 0. '" ~
-l 0 "'" ]2 'i' ~.~ ~ 0
!:j, -0 a:> .<:: t:Q~ o<:! .;;: .c "'" 0 _ "0
~~ u ::l <I ;:l
E U c: ., §
"'" § .2 ;g Ue<t: c: .s .2 ... .c iii c: g o ti ... _g ~ o<:!U] _g ~
..... 'O! ., ~ , '" «1.9 .~ .sa E
0 "3 .... <;! ~ <;! Ol~ c: u·~ u1<j
'" 0. 0 .§ bJl 'u B~ o~"O '2 1;; ::l .... ~ .~
U ... C 0 0 _g 03 11 OJ ~ ~ 'l:l ~ ~ :l >, 0. 11 u § '" u
"'._ r/l § ~ ~ 0 ~ .g ~ ~.t:: , ~ ]l ]l E '"
'i3 ,§ tf ~~.g <1) 0 0 ;:l '0 OJ 0 0 bJl£ 0:::::
!!l 6; t: t: 6; ~ ~ g Q" \.2 ~ Q £!;;~"Q IJ : 2 3 4 5 6 7 8 9 10 II 12 13
Tahsil : Talwandi Sabo (0003)
21 Kotli Khurd 1,195.0 2,867 465 PM THP PH(85) ACSOCS BS (01061200) Q5-10) H(5-IO) SS-T PO(5-10) CM(5-10) NCS(5-10) CV«5) RS(5-10)
MCW(5-10) CP(5-10) SP(IO+) NW(IO+) PHC(5-IO) ST(IO+)
22 Kamalu 537.0 1,898 349 PM S DH(5-10) THP PO PH(75) ACSOCS BS (01061300) Q5-IO) MCW(5-10) TW CM(5-10) NCS(5-IO) CV«5) RS(5-IO)
PHC(5-IO) SS-T CP(5-IO) SP(lO+) NW(lO+) "- ST(5-10)
23 Swaich 598.0 1,342 222 P M«5) THP PH(80) ACS BS (01061400) C(S-IO) H(S-IO) TW PO(5-IO) CM« 5) NCS« 5) CV«S) RS(\O+)
MCW(S-IO) SS-T CP(S-IO) OCS« 5) SP(IO+) NW(IO+) PHC(5-10) ST(10+)
24 Rajgarh Kuba 1,388.0 4,108 716 P(2) M S THP PO PH(95) ACS NCS BS (01061500) C« 5) H(5-10) SS-T CM(5-IO) OCS CV«5) RS(IO+)
MCW(5-IO) CP(5-10) SP(IO+) NW(IO+) PHC(S-IO) ST(IO+)
25 Sandoha 1,64\.O 3,665 592 PM o PHS THP PH(52) ACS NCS SP BS (01061600) S Q< 5) H«5) SS-T PO« 5) CM(5-10) OCS CV« 5) RS(IO+)
MCW(5-10) CP(5-10) ST(IO+) NW(IO+) PHC(5-10)
26 Burj 73\.0 2,248 379 P M« 5) OH(S-IO) THP PH(68) OCS BS (01061700) C« 5) MCW(S-IO) SS-T PO«5) CM«S) ACS« 5) CV« 5) RS(5-IO)
PHC(5-10) CP(5-10) NCS« 5) SP(IO+) NW(10+) ST(IO+)
27 Mansa Kalan 909.0 2,914 486 P M« S) OHC T HP PH(40) DCS BS (01061800) C« 5) PHS H« 5) TW PO«5) CM(5-10) ACS« S) CV« 5) RS(S-IO)
MCW(S-IO) SS-T CP(S-IO) NCS(5-IO) SP(IO+) NW(IO+) PHC(5-10) ST(IO+)
28Mari 249.0 956 159 P M(S-IO) DRMP THP PH(40) ACS BS (01061900) C« 5) H«5) SS-T PO« 5) CM(5-10) OCS CV(5-10) RS«5)
MCW(5-1O) CP«5) NCS« 5) SP(IO+) NW(IO+) PHC(5-IO) ST(IO+)
29 Jodhpur Pakhar 1,966.0 4,232 684 P(3) M(2) Mew THP PO ACS NCS BS (01062000) S PUC PHC SS-T PH(125) CM(5-10) OCS CV« 5) RS(5-10)
C(5-10) PHS CP(5-10) SP(IO+) NW(IO+) H(5-IO) ST(IO+)
30Burj Serna 561.0 1,607 27S PM DMHCWCHC THP PO PH(40) OCS BS (01062100) C(1O+) PHS H(S-IO) SS-T CM(5-IO) ACS« S) CV« 5) RS(IO+)
MCW(5-10) CP(5-10) NCS(5-IO) SP(lO+) NW(IO+) PHC(5-10) ST(lO+)
162

VILLA~E DIRECTORY
Village Directory
Land Use (As on 1999)
Land use (i.e. area under different types of land use in hectare)
.", c: .. ... .. .,
E ..c: c: "0 u 0 0 :::s ''; u _,. .. c: OJ)
6 c OJ) .~ .S :;5 c: -; 'oj
" ., :;5 u u c: 0 :::s u 0 c: . ~ § ... .....:I ~ ~ OJ ..g
~ " :§, di3 :a OJ) 0 ~ " ~ .. u :0
o(l ~ :::s ~ Q)
.;;: Cog 0 ~ OJ)
c >. - V> ~ ,g ... .. Q)
8 ~ Q. ... ~ ... >. "0 ~ 1:; .;; ~
Q. .,
8. t e E ~ B Q. ~ " :::s .. "0 .. :o~ 0 ..... :::s
1;; V> .5 <S 0 ... Q. ~ OJ) ~ V> c: c: e ~ Q) V> _ :::s
1:;; " 'E a ~ .. ., ] Q. .. ~ ~ '" c e OJ) E
"" Q) 0' Q) ,0 .. 0 'E '2 - 0 e ..
~ z z ~ E ;:? :::s ... ~ z Q)
e. .... H Y bD Vl
14 15 16 17 18 19 20 21 22 23 2
PR Maur (10) EA NM GC(80S.0) 223.0 2.0 84.0 Kotli Khurd 21 TW(810) (01061200) T(886.0)
PR Maur (10) EA NM GC(4400) 27 ° 42.0 Kamalu 22 TW(28,0) (01061300) T(4680)
PR Maur(5) EA NM GC(504.0) 56.0 38.0 Swaich 23 T(5040) (01061400)
PR Maur (5) EA NM Khes, GC(995.0) 290.0 88.0 Rajgarh Kuba 24 Oarian TW(l50) (01061500)
T(IOIQ.O)
PR Maur (7) EA NM GC(1501.0) 29.0 Sandoha 25 TW(105.0) (01061600) TWE(6.0) T(1612.0)
PR Maur (12) EA NM Oarian, GC(41Q,0) 80.0 12.0 34.0 Burj 26 Khes TW(178.0) (01061700)
TWE(17.0) T(605.0)
r-
PR Maur (8) EA NM GC(831 0) 3.0 70.0 Mansa Kalan 27 TWE(5.0) (01061800) T(8360)
PR Maur (4) EA N GC(214.0) 35.0 Mari 28 T(214.0) (01061900)
PR Maur (9) EA NM GC(1705.0) 67.0 185.0 Jodhpur Pakbar 29 TW(7.0) (01062000) TWE(2.0) T(l714.0)
PR Maur (12) EA NM Oarian, GC(41D.O) 80.0 43.0 BUfj Serna 30
Khes TW(l2.0) (01062100) TWE(16.0) T(438.0)
163

DISTRICT CENSUS HANDBOOK: BATHINDA
Census of India 2001 -CD block Maur (0007) Amenities and
Amenities available (if not available within the village, a dash (-) is shown in the column and next to it in brackets the distance in broad ranges viz.< 5 kms., 5-10 kms. and 10+ kIllS ufthe nearest place
where the facility is available is given)
~
'" ~ fl " '" '" ~ 0
E g "0 "-"" ~ '" ;a GIl 0 u U .0 <> .,
" OJ " ::::i' oJ c .c '" u
C 0 " ;> .... ,,~ E ~, 0 -3 ., 0 0 .~ E .c 8 .~ u ~
.c o ;:I 0) >. U "
0.. " ;:I ] ~.§ '" " .3 ~ 0 .; ~ "- (.) "' E 0 ~ 0 .6b '" E>~ ;:I 'f)
ok! ~ ~ 0 "" " ~ .~ e,&j .c g (.) g",.:ji "' ~ " OJ C " ] 0: "
~ o .- ok! 8---: 0: • 00 -B 0 .... .c 0: g o 0: .... .."l .~ 0 '" g- " E il .S " ~ ""' .c .. " ].~ <a .S ;:I E 0 "3 ""' <a ~ l;b u 1a .~ 0: U·-
" 0 § ,all o ~"O .§ 11-'" "- ~
"- '"' " 0 .... O! .- "' ;3 0: 0 "- " .~ 0: ] 'l) - .... <;! .~ CIl § ~. .S! :i2 § ;:I u
" " .0 (.) .... " -§ -;:; '3 8 u "" .§ <i .6b " O~..c .J:: '0 ;l
" " 0 ;:I "0 6 0 0 ~~ " (.) '" 0;'::: CIl ;?; r ~ Z; ~ Ci eo U Q:j~~ Q ~
2 3 4 5 6 7 8 9 10 II 12 13
Tahsil Talwandi Sabo (0003)
31 Bangher 337.0 823 136 PM« 5) T liP PB(81) oes BS Mohabat Singh C(5-10) H(5-10) SS-T 1'0(5-10) CM«5) ACS« 5) CV(S-IO) RS(lO+) (01062200) MCW(5-10) CP(IO+) NCS(5-IO) SP(IO+) NW(lO+)
PHC(5-10) ST(IO+)
32 Bangher Charat 442.0 l,i99 201 PM(5-10) Till' PH(60) OCS BS Singh C(5-IO) H«5) SS-T 1'0(5-10) CM« 5) ACS(5-IO) CV«" 5) RS(lO+) (01062300) MCW«5) CP(IO+) NCS(5-IO) SI'(10t) NW(IO+)
I'HC« 5) ST(5-10)
33 Natt 493.0 1,207 190 PM DA H« 5) THI' 1'11(50) ACS AS (01062400) S C« 5) MCW« 5) SS-T 1'0«5) CM« 5) NCS« 5) CV(IO+) RS(5-IO)
PHC« 5) CP«5) OCS« 5) SP(10 1) NW(IOI) SI(5-IO)
Block Total 28278.0 69326 11684 P(43) JlA 0(11) T(33) 1'0(12) CM ACS(24) SP BS(33) M(23) DA(4) MCW(2) IIP(33) PII(2055) NCS(6) ns S(10) Mil ewc TW(6) OCS(29) PUC(4) HC(4) YHC(2) 0(2) PIIS(5) RMP(2)
164

VILLAGE DIRECTORY
Village Directory
Land Use (As on 1999)
Land use (i.c. area under different types orland use in hectare)
-0 a ~ " t:: -0
]: 'J 0 0 g .~ u
QJ) t:: ,g .f' .~ :> .8 ~ Ol
" " -0 -0 u u .5 0 ::l u
.3 ~ § ... i ~ u <E
~ " -3 ~ '0 0 u '" '" '" u ... :c '" ~ ::E ::> " ~
~1l 5; jj ~ QJ) ... t:: » - .;; ~ " .s ::: 0- ... »
-0 ::: > '> ..0
" &~ e E {i E 0. 0. " " oj
a '" -0 '" :c~ b to-. ::l
'" "' 0. .~ 'E " 00 0 t:: .... oj on t:: 8 ~ " '" ~ OJ :~ li ~ oj " «l 0. ::: ::: ~ a co " ~ .t:
~ " 0 '" 0 E - 0 ~ " ~ ~ ~ ~ 5 ~ I=! ~ a !ib ~ 00
14 15 16 17 18 19 20 21 22 23 2
PR Kot Falla (12) EA NM GC(288.0) 19.0 30.0 Bangher 31 T(288.0) Mohahat Singh
(01062200)
PR Kot Falla (12) EA NM GC(403.0) 39.0 Bangher Charat 32 T(403.0) Singh
(01062300) ..
PR Talwandi Sabo EA NM GC(444.0) 49.0 Nail 33 (6) T(444.0) (01062400)
PR(33) EA(33) N(33) 0.0 GC(21985)" 2051.0 120.0 2209.0 M(l2) TW(I092)
TWF.(S21) T(23898)
165

DISTRICT CENSUS HANDBOOK: BATHINDA
APPENDIX I-ABSTRACT OF EDUCATIONAL, MEDICAL AND
Serial Name of Total Total Educational number C.D.block number of population Primary Middle Matriculation!
inhabited of C.D. school school Secondary villages block school
Villages Institutions ViUages Institutions Villages Institutions
2 3 4 5 6 7 8 9 10
Phul 46 147,312 46 90 34 46 22 27
2 Rampura 30 91,629 30 49 21 27 13 14
3 Nathana 32 129,025 32 55 26 32 15 18
4 Bathinda 54 164,204 54 96 44 50· 28 28
5 Sangat 38 100,681 38 56 17 21 14 14
6 Talwandi Sabo 47 129,364 47 70 24 34 II 15
7 Maur 33 69,326 33 43 19 23 10 10
District(Rllral): 280 831,541 280 459 185 233 113 126
Serial Name of Medical
number C.D.block Hospital Dispensary Primary Primary Health
Health Centre/ Sub-centre Health Centre
Villages Institutions Villages Institutions Villages Institutions Villages Institutions
2 20 21 22 23 24 25 26 27
Phul 6 6 14 17 14 15 20 20
2 Rampura 2 2 11 11 5 6 10 10
3 Nathana 2 2 19 19 3 3 16 16
4 Bathinda 5 8 30 37 12 15 23 23
5 Sangat 2 2 15 19 8 9 8 8
6 Talwandi Sabo 2 2 12 13 7 7 10 10
7 Maur IS IS 5 6 S 5
District(Rural): 20 23 116 131 54 61 92 92
166

VILLAGE DIRECTORY
VILlAGE DIRECfORY OTHER AMENlTIES IN VILLAGES - CO. BWCK LEVEL
Institutions Name of Serial
Higher Secondary/ College Adult literacy Others No C.D.block number
PUC/Intermediate/ (graduate and above) classes/centres educational
Junior college facilities
Villages Institutions Villages Institutions Villages Institutions Villages Institutions
11 12 13 14 15 16 17 18 19 2 I
8 8 0 0 3 3 5 15 0 Phul
4 4 0 0 4 6 4 12 0 Rampura 2
4 5 0 0 6 12 2 4 0 Nathana 3
9 9 0 0 4 5 0 0 0 Bathinda 4
4 4 0 0 2 2 0 0 0 Sangat 5
4 4 2 0 0 2 0 Talwandi Sabo 6
4 4 0 0 0 0 2 0 Maur 7
37 38 2 19 28 13 35 0 District(Rural)
Name of Serial
Maternity and Child Welfare Family Welfare Community Health Others No. C.D.block number
Centre! Maternity Home! Centre Workers medical
Child Welfare Centre facilities
Villages Institutions Villages Institutions Villages Numbers Villages Institutions
28 29 30 31 32 33 34 35 36 2
14 22 5 5 8 8 13 15 6 Phul
5 8 8 10 II Rampura 2
6 8 3 4 7 Nathana 3
9 11 0 0 11 19 20 Bathinda 4
9 13 3 3 2 2 II 14 14 Sangat 5
5 5 0 0 0 0 2 2 26 Talwandi Saba 6
3 4 0 0 0 0 2 2 15 Maur 7
51 71 11 11 12 12 50 66 99 District(Rural):
167

Serial Name of
number C.D.block Tap Well
2 37 38
Phul 45 0
2 Rampura 30 0
3 Nathana 32 0
4 Bathinda 54 0
5 Sangat 38 0
6 Talwandi Saba 47 0
7 Maur 33 0
District(Rural): 279 0
Serial Name of
number C.D.block Villages
2 57
DISTRICT CENSUS HANDBOOK. BATHINDA
APPENDIX 1-
ABSTRACT OF EDUCATIONAL, MEDICAL AND
Drinking water source ______ .. _
Tank TubeweII River Fountain Canal Others More than No drinking
one source water
facilities
39 40 41 42 43 44 45 46
0 22 0 0 0 46 46 0
0 17 0 0 0 30 30 0
0 8 0 0 0 32 32 0
0 17 0 0 0 54 54 0
0 15 0 0 0 38 38 0
0 II 0 0 0 47 47 0
0 6 0 0 0 33 33 0 ----_-------~-.----------
0 96
Banks
Number of
commercial and
co-operative
banks
58
0 0 0 280 280 0
Power supply Credit _-- ----_ -----_----------Available Not available Villages Number of
59 60 61
agricultural
credit societies
62 ---.. ------~------.. ----.-.------ ... _-------_._-_._,.---_. __ .-_ .. _ .. _ .... _------_._ .. _-----....... _._ .. _ .... -.-------......... ... -_._ .. _-----_ ..... __ ..... ... ........... .- ................ __ .. __ .. -...... _
Phul 9 14 46 0 34 34
2 Rampura 6 7 30 0 18 18
3 Nathana 9 13 32 0 20 20
4 Bathinda 11 14 54 0 34 34
5 Sangat 6 8 38 0 22 22
6 Talwandi Saba 5 13 47 0 30 30
7 Maur 33 0 22 24
District(Rural): 47 70 280 0 180 182
168

VILLAGE DrREqORY
VILLAGE DIREcroRY
OTHER AMENITIES IN VILLAGES - C.D. BLOCK LEVEL
Post, Telegraph & Telephone Transport communications Name of Serial _._-----------_ .. _----------_--_ .. _-_ .. _ .. _-
Post Telegraph Post & Post Telegraph Post, Phone Bus Railway Navigable C.D.block number
office office telegraph office & office & telegraph service station waterway
office phone phone office &
phone
47 48 49 50 51 52 53 54 55 56 2
26 0 0 26 0 0 46 46 0 0 Phul
18 0 0 18 0 0 30 30 0 Rampura 2
20 2 2 20 2 2 32 32 0 Nathana 3
31 0 0 30 0 0 51 54 6 0 Bathinda 4
21 0 0 21 0 0 38 38 2 0 Sangat 5
20 20 47 47 3 0 Talwandi Sabo 6
12 0 0 12 0 0 33 33 0 Maur 7 . __ ... _----
148 3 3 147 3 3 277 280 14 o District(Rura1}:
societies Recreational facility Newsp;mer/Magazine Name of Serial
Villages Number of Villages Number Cinema! Sports Stadium/ News Magazine News C.D.block number
non- of other Video club Auditorium/ paper paper &
agricultural credit hall Community Magazine
credit societies societies hall
63 64 65 66 67 68 69 70 71 72 2
14 14 22 23 0 14 4 46 .45 45 Phu1
8 8 12 13 0 9 2 29 30 29 Rampura 2
10 10 7 7 14 4 31 31 31 Nathana 3
17 17 14 14 0 14 2 52 51 51 Bathinda 4
7 7 13 13 0 14 0 38 38 38 Sangat 5
7 7 36 36 7 . 47 42 42 Talwandi Sabo 6
6 6 29 29 0 0 33 32 32 Maur 7
69 69 133 135 2 73 13 276 269 268 District(Rural):
169 .

DISTRICT CENSUS HANDBOOK: BATHINDA ~
APPENDIX lA - VILLAGE DlRECfORY VILLAGES BY NUMBER OF PRIMARY SCHOOLS
Serial Name of Total number Number of primary schools number C. D. block of inhabited
villages None One
1 Phul 46 0 22 14 4 6 2 Rampura 30 0 18 8 2 2
3 Nathana 32 0 22 6. 3
4 Bathinda 54 0 30 12 9 3 5 Sangat 38 0 24 10 4 0 6 Talwandi Saba 47 0 37 5 3 2 7 Maur 33 0 24 8 1 0
District Total: 280 0 177 63 24 16
APPENDIX IB - VILLAGE DIRECTORY VILLAGES BY PRIMARY, MlDDLEANDSECONOARY SCHOOLS
Serial Name of C.D. block Total number Type of educational institutions available number of inhabited No School At least one At least one At least one
villages primary school and primary school and middle school and
no middle school one middle school secondary school
2 3 4 5 6 7
Phul 46 0 12 34 22
2 Rampura 30 0 9 21 13
3 Nathana 32 0 6 26 15
4 Bathinda 54 0 10 44 28
5 Sangat 38 0 21 17 \4
6 Talwandi Saba 47 0 23 24 II
7 Maur 33 0 14 19 10
Total: 280 0 95 185 113
APPENDIX IC - VILLAGE DIRECTORY VILLAGES WITH DIFFERENT SOURCES OF DRINKING WATER FACILITIES AVAILABLE
Serial Name of Number of villages with different sources of drinking water available
number C.D. block Only tap Only well Only Only More than one source tube well handpump only from tap, well,
tube well, handpump
2 3 4 5 6 7
I Phul 0 0 0 0 46
2 Rampura 0 0 0 0 30
3 Nathana 0 0 0 0 32
4 Bathinda 0 0 0 0 54
5 Sangat 0 0 0 0 38
6 Talwandi Sabo 0 0 0 0 47
7 Maul' 0 0 0 0 33
District Total: 0 0 0 0 280
170

VILLAGE DIRECTORY
APPENDIX 11- VILLAGE DlRECI'ORY VILLAGES WiTH 5,000 AND ABOVE POPULATION WHICH DO NOT HAVE ONE OR MORE AMENITIES
Serial Name of number village
2
I Maluka
2 Kotha Guru
3 Bhagta
4 Jalal
5 Bhai Rupa
6 Gumti Kalan
7 Ohapali
8 Patti Karam
Location code
nwnber
3
Name of C.O. block
4
01036600 Phu]
01036700 Phul
0103710Q Phul
01038000 Phul
01038800 Phul
01038900 Phul
01039400 Phul
Chand Mehraj 0 1042900 Phul
9 Mandi Kalan
10 Chaoke
01041000 Rampura
01041200 Rampura
II Balianwala 0 I 042600 Rampura
12 Rampura(Rural} 0 I 043000 Rampura
13 Pitho 0 1043100 Rampura
14 Nathana 0 I 0451 00 Nathana
15 Gobindpura 0 I 045400 Nathana
16 Poohla 0 1045600 Nathana
17 Lehra Mohabat 0 I 046000 Nathana
18 Bhucho Kalan 0 I 046300 Nathana
19 Mehna
20 Tungwali
21 Jeeda
22 Nehianwala
23 Swian
24 Mehma Sarja
25 Ablu
26 Deon
27 Kot Shamir
28 Pathrala
01046700 Nathalia
01052600 Nathana
01047600 Bathillda
01048400 Bathinda
01048500 Bathinda
01048600 Bathinda
01049500 Bathinda
01050000 Bathinda
01053100 13athinda
01055400 Sangat
01056400 Sangat
Pop ulat ion -;;---:,--_-;;--;;-~~A~m-;e:..:.n:..:.i t:..:.ie:..:.s_a_v_a-;;il,,-ab_le_a_n_d_n_o~t _a_v_al ___ ·la~b:-le:........_-.----;c::--:-....___ Senior College Primary Tap Bus Approach Comm-
Secondary Health drinking facility by Pucca ercial School Sub Centre water road Bank
5 6 7 8 9 .10 II 12
6069 NA
8915 NA
NA
NA
11809
5904
13294
5367
5654
Available N.A.
Available N.!\.
Available· NA
NA NA
NA NA
5334 Available NA
8429 Available NA
8280 Available NA
7169
6883
5291
7197
7233
5523
8966
Available N.!\.
NA N.A.
NA NA~
Available N.t..
Available N.A.
N.A.
N.A.
NA
N.A.
6349 Available NA
27029 Available N.A
6293
5134
6083
N.A.
N.A.
NA
NA
NA
NA
5417 Available N.1\.
7060
6690
6487
9314
6233
7586
Available N.A.
N.A. N.A.
N.A. NA
Available N.1\.
NA NA
Available N.1\.
N.A.
NA
NA
N.A.
NA
NA
NA
Available Available Available N.A.
Available Available Available Available
Available Available Available Available
Available Available Available Available
Available Available Available Available
Available Available Available N.A.
Available Available Available Available
Available Available Available Available N.A.
NA
NA
Available Available Available NA
Available Available Available Available
N.!\. Available
NA Available
Available Available
Available Available
Available Available
N.!\. Available
Available Available
Available Available Available
Available Available NA
Available Available NA
Available Available Available
Available Available NA
Available Available NA
Available Available Available
Available Available Available Available Available
Available Available Available Available Available
N.!\. Available
Available Available
Available Available
Available Available Available
Available Available NA
Available Available Available
NA Available Available Available Available
N.A. Available
Available Available
Available Available
Available Available
Available Available
Available Available
Available Available Available
Available Available NA
Availahle Available N.A.
Available Available Available
Available Available N.!\.
Available Available Available 29 Pakka Kalan
30 Bhagibandar 01062500 Talwandi Sabo 6578 Available N.i\. Available Available Available Available NA
31 Talwandi Sabo 0 I 062600 Talwandi Sabo 16754 Available Available Available Available Available Available Available
32 Ram Tirath JagaOl063000 TalwandiSabo 6212 N.A. N.A. NA Available Available Available N.A.
Note: NA Stands for not available.
171

Serial number
Serial number
DISTRICT CENSUS HANDBOOK: BATHINDA
APPENDIX II -A VILLAGE DIRECTORY
CENSUS TOWNS WHICH DO NOT HAVE ONE OR MORE AMENITIES
Name of Location Name of Population Amenities available/not available Census code C. D. block town number Senior College Health Tap Bus Approach Bank
Secondary Centre drinking facility by Pucca School water road
2 3 4 5 6 7 8 9 10 II 12
NIL
APPENDIX 111- VILLAGE DIRECTORY
LAND UTILISATION DATA IN RESPECT OF CENSUS TOWNS / NON-MUNICIPAL TOWNS
Name of Census Land use {i.e., area under different ti:~es of land use in hectare} town and C.D. block Total Forest Irrigated by Un irrigated Culturable waste Area not available
within brackets area source (including gauchar & for cultivation & groves)
2 3 4 5 6 7 8
NIL
APPENDIX IV - VILLAGE DIRECTORY
CD. BLOCK WISE LIST OF INHABITED VILLAGES WHERE NO AMENITY OTHER THAN
DRINKING WATER FACILITY IS AVAILABLE
Serial number Location code number Name of village
2 3
There is no such village under this Appendix
172

VILLAGE DIRECTORY
APPENDIX V - VILLAGE DIRECTORY SUMMARY SHOWING NUMBER OF VILLAGES NOT HAVING SCHEDULED CASTES POPULATION
Serial Name of C.D. block Total villages Uninhabited Inhabited Number of inhabited number villages villages villages having no
Scheduled Castes population
2 3 '4 5 6
1 Phul 46 0 46 0
2 Rampura 30 0 30 0
3 Nathana 32 0 32 0
4 Bathinda 58 ·4 54 0
5 Sangat 38 0 38 0
6 Talwandi Sabo 47 0 47 0
7 Maur 33 0 33 0
District Total: 284 4 280 0
APPENDIX VI - VILLAGE DIRECTORY
SUMMARY SHOWING NUMBER OF VILLAGES NOT HAVING SCHEDULED TRIBES POPULATION
Serial Name of Total villages Uninhabited Inhabited Number of inhabited
number C. D. block villages villages villages having no Scheduled Tribes population
2 3 4 5 6
Phul 46 0 46 46
2 Rampura 30 0 30 30
3 Nathana 32 0 32 32
4 Bathinda 58 4 54 54
5 Sangat 38 0 38 38
6 Talwandi Sabo 47 0 47 47
7 Maur 33 0 33 33
District Total: 284 4 280 280
173

DISTRICT CENSUS HANDBOOK: BATHINDA
APPENDIX VlIA- VILLAGE DlR~CTORY LIST OF VILLAGES ACCORDING TO THE PROPORTION OF THE SCHEDULED CASTES TO THE TOTAL POPULATION BY RANGES
Name of the District: Bathinda
Range of Scheduled Location Name of village Range of Scheduled Location Name of village Castes population code Castes population code
(percentages) number (percentages) number
1 2 3 1 2 3
Name of CD Block: Phul 01036900 Siriewala
01039300 Burj Gill
11-20 01037800 Gurusar 01038300 Kangar
01043500 Phul (Rural) 01038600 Rajgarh
01039200 Kauloke
01043400 Burj Mansa 51-75 01037200 Kesar Singhwala
01039600 Sandhu Khurd 01037000 Burj Ladha Singhwala
21-30 01039800 Raiya Urf
Hardaspura 76 and above 01043600 Harnam Singhwala
01037700 Aklia lalal
01037400 Ramuwala Name of CD Block: Rampura
01039400 Dhapali
01038800 Bhai Rupa 11-20 01041700 Dhade
01037600 Koer Singhwala 01041800 Ram Niwas
01038900 Gumti Kalan
01038400 Salabatpura 21-30 01042700 Bhunder
01037100 8hagta 01040900 laidan
01040100 Chotian 01040400 Ghureli
01039900 Dhingar 01040500 Ghurela
01036700 Kotha Guru 01042000 liar Kishanpura
01037500 Hakam Singhwala 01042300 Mansa Khurd
01041600 Dikh
31-40 01037300 Bhodipura 01041500 Sooch
01043800 Patti Sand Ii Mehraj 01042600 Balianwala
01038200 Gaunspura 01043100 Pitho
01039500 Ghandawna 01041200 Chaoke
01038500 Adampura 01042400 Gill Khurd
01039100 Selbrah 01041400 Bhaini Chuhar
01039700 Phulwal 01041100 Khokhar
01043900 Patti Saol Mehraj
01038700 Dulewala 31-40 01040600 leondan
01043700 Sadhana 01042200 lhanduke
01038000 lalal 01041900 Mandi Khurd
01042900 Patti Karam Chand 01040800 Badlala
Mehraj 01040300 lethuke
01038100 Dyalpura Bhaika 01040700 8alloh
01039000 Dayalpura Mirza 01043200 Kararwala
01040200 Bugran 01043300 Gill Kalan
01036600 Maluka 01042500 DauJatpura
01037900 Hamirgarh 01042800 Kotra Korianwala
01036800 Burj Thror 01041000· Mandi Kalan
41-50 01036500 Neor 41-50 01041300 Pirkot
01040000 All ike 01043000 Rampura(Rural)
01044000 Patti Kala Mehraj 01042100 Nandgarh Kotra
174

VILLAGE DIRECTORY
APPENDIX VII A- VILLAGE DIRECTORY LIST OF VILLAGES ACCORDING TO THE PROPORTION OF THE SCHEDULED CASTES TO THE TOTAL POPULATION BY RANGES
Name of the District : Bathinda
Range of Scheduled Location Name of village Range of Scheduled Location Name of village Castes population code Castes population code
(percentages) number (percentages) number
I 2 3 I 2 3
Name of CD Block: Nathana 21-30 01051900 Baho Jattri 01047900 Goniana Kalan
Less than 5 01046700 Mehna 01051800 Baho Sibian Patti Dharam Singh
11-20 01044200 Burj Dalla 01053300 Gehri Devi Nagar 01049500 Ablu
21-30 01044500 Kali~ Maika 01049600 Mehma Sarkari
01044700 Bajoana 01050600 Virk Kalan
01046800 Bibiwala 01051100 Ihumba
01044800 Giddar 01051000 Ghugha Kalan
31-40 01052600 Tungwali 31-40 01050400 Chugha Khurd
01046200 Lehra Bega 01052500 Gulabgarh Urf
01045100 Nathana Naiwala
01046300 Bhucho Kalan 01049200 Dan Singhwala
01046100 Lehra Kh!l,na 01047400 Jandanwala
01044600 Kalian Sukha 01049400 Ganga
01046000 Lehra Mohabat 01052300 Jassi Pauwali
01052900 Chak Ram Singhwala 01053100 Kot Shamir
01045900 Lehra Sondha 01051200 Teona
01045400 Gobindpura 01053200 Katar Singhwala
01052800 Chak Bakhtu 01047300 Har Raipur Urf
01046900 Joganand Bhokhri
01045600 Poohla '01047200 Khialiwala
01044100 Mari 01051500 Naruana
01045300 Dhilwan 01049100 Balahar Mehma
01044900 Nathpura 01052200 Jodhpur Romana
01045700 Bath 01048600 Mehma Sarja 01 048300 Amargarh
41-50 01045500 Seman 01050500 Baluana
01045000 Ganga Nathana 01047600 Jeeda
01045800 Lehra Dhul Kot 01048900 Akalia Kalan
01046500 Bhucho Khurd 01048400 Nehianwala
01044300 Bhaini 01047100 Bhokhra
01052700 Chak Fateh 01046600 Bhagu
Singhwala 01048000 Goniana Khurd
01050300 Bir Behman
51-75 01044400 Kalian Sadda 01050000 Dean
01045200 Poahli 01048500 Sibian
01046400 Burj Kahan Singhwala 41-50 01048200 Balahar Vinjhu
01048700 Mehma Sawai
Name of CD Block: Bathinda 01047500 Khemuana
01049700 Mehma Bhagwana
11-20 01049000 Akalia Khurd 01047000 Gill Patti
01051700 Baho Sibian Patti 01050700 Virk Khurd
Basawa Singh 01050200 Behman Dewana
175

DISTRICT CENSUS HANDBOOK: BATHINDA
APPENDIX VII A- VILLAGE DIRECTORY LIST OF VILLAGES ACCORDING TO THE PROPORTION OF THE SCHEDULED CASTES TO THE TOTAL POPULATION BY RANGES
Name of the District : Bathinda
Range of Scheduled Location Name of village Range of Scheduled Location Name of village Castes population code Castes population code
(percentages) number (percentages) number
1 2 3 I 2 3
01050900 Sardargarh 01053500 Gehri Buttar 01051300 Multania 01052000 Jai Singhwala 01050800 Karamgarh Sattran 01054700 Raike Kalan 01051400 Blrtalab Urf Talab 01056300 Chak Hira Singhwala
Neehar Urf Pakka Khurd 01049800 Killi Nihal Singhwali
01051600 Mian 41-50 01054900 Chak Attar 01050100 Buladewala Singhwala
01054100 Nandgarh
51-75 01049900 Burj Mehma 01057200 Malwala
01049300 Warkandi 01054500 Bahadargarh landian
01052400 Phus Mandi 01054400 Raike Khurd Urf Chak Dana
Name of CD Block: Sangat 01054600 Lool Bai
11-20 01056600 Dunewala 51-75 01053900 Kot Guru
01055100 Kotli Sabo 01052100 Gurusar Sainewala
01054800 Rambiha 01056000 Chak Ruldu Singhwala
21-30 01056500 Amarpura Urf 01055600 Dhunike
Gurthuri
01054000 Ghudda Name of CD Block: Talwandi Sabo
01055700 Muhlan
01055500 Bandi Less than 5 01064000 Mirziana
01056700 Bhagwangarh Urf Bhukhianwali 5-10 01058300 logewala
01056400 Pakka Kalan
01056200 Sekho 11-20 01064600 Golewala 01054200 Bajak 01064400 Kalalwala 01054300 Janghi Rana
01055800 Jassi Bagwali 21-30 01057700 Tarkhanwala 01055200 Faridkot 01063700 Singo 01053600 Ancorgarh Urf 01058000 Phulo Khari
Machhana 01059100 Mahi Nangal
01064200 Kaureana 31-40 01055000 KaljhaRani 01058600 Ja:iial
01053800 Phulo Mithi 01063900 Menuana 01053700 Sangat Kalan 01063000 Ram Tirath Jaga 01053400 Mehta 01056900 Kaile Bandar 01055900 Kishanpura Urf 01063500 Behman Jassa Singh
Kutti 01063400 Teona Pujarian 01055400 Pathrala 01058500 'Malkana 01056800 Shergarh 01058400 Tungwali 01056100 Jodhpur Bagga Singh
01057000 Kot Bakhtu Alias Phalran
01055300 Chak Kharak 01057400 Bangi Rughu
Sirighwala Urf 01062500 Bhagibandar
Doomwali 01064500 Fatah Balu
176

VILLAGE DIRECTORY
APPENDIX VlIA- VILLAGE DIRECTORY
LIST OF VILLAGES ACCORDING TO THE PROPORTION OF THE
SCHEDULED CASTES TO THE TOTAL POPULATION BY RANGES Name of the District : Bathinda
Range of Scheduled Location Name of village Range of Scheduled Location Name of village Castes population code Castes population code
(percentages) number (percentages) number
1 2 3 1 2 3
31-40 01062700 Lelewala 01059300 Chathewala 01058700 Kamalu 01059900 Arai Khana
01064700 Natheha 01060800 Kutiwal Khurd 01058200 Gatwali 01057500 Sukhladhi 21-30 01060900 Ghuman Khurd 01058900 Bangi Ruldu 01062400 Nat! 01057100 Manwala Urf 01061600 Sandoha
Kishangarh 01060200 Maisar Khana 01062800 Shekhpura 01060600 Kutiwal Kalan 01057900 Kanakwal Urf 01061000 Ghuman Kalan
Rattangarh 01061800 Mansa Kalan 01063300 Sangat Khurd 01062100 Burj Serna 01064100 Gehlewala 01057800 Ramsara 31-40 01060000 Kishangarh Urf 01063800 Lehri '~
Chinarthal 01064300 Raya 01061200 Kotli Khurd 01064800 Nangla 01061500 Rajgarh Kuba 01062600 Talwandi Sabo , 01061900 Mari 01058100 Giana 01060300 Jatri 01059000 Leleana
01053000 Dhan Singh Khana 01063100 Fatehgarh Nouabad 01059200 Jeon Singhwala
01060700 Thamangarh 01059600 Bhai Bakhtour
41-50 01063200 Gurusar Joga 01059400 Kot Bhara
01063600 Behman Koer Singh 01062000 Jodhpur Pakhar
01057600 Bagha 01059500 Ramgarh Bhundar
01062900 Gadhianwala Urf . 01062200 Bangher Mohabat
Bhagwanpura Singh
01057300 Bangi Dipa Singh 41-50 01061100 Sukha Singhwala
51-75 01058800 Bangi Nihal Singh 01060400 Maur Charat Singh 01061300 Kamalu
Name of CD Block: Maur 01059700 Ghaso Khana 01060500 Ramnagar Urf
5-10 01059800 Manak Khana Kasaiwara
01061400 Swaich 01060100 Gehri Bara Singh
11-20 01062300 Bangher Charat Singh 51-75 01061700 Burj
Note:- Villages having NIL Scheduled Castes Population have been excluded
APPENDIX VII B - VILLAGE DIRECTORY
LIST OF VILLAGES ACCORDING TO THE PROPORTION OFTHE SCHEDULED TRffiES
TO THE TOTAL POPULATION BY RANGES
Name of the District : Bathinds
Range of Scheduled Tribes population (percentages)
Location code number
2
There are no Scheduled Tribes in the district
177
Name of village
3

DISTRICT CENSUS HANDBOOK: BATHINDA
APPENDIX VIII - Village Directory NUMBER OF VILLAGES UNDER EACH GRAM PANCHAYAT (CD BLOCK WISE)
Sr. Name of Gram Area of Number of villages Number of Total Total Total Income and Expenditure no. Panchayat and Gram with location House- PopuIaiton Scheduled Scheduled of Gram Panchayat
location Code panchayat in code number holds Castes Tribes (in Rs. '000') Number Hectares Number Location ;- Population Population Total Total
Code Number Income Expenditure
2 3 4 5 6 7 8 9 10 11
Not Available
APPENDIX IX - Village Directory STATEMENT SHOWING NUMBER OF GIRLS SCHOOlS IN THE VILLAGES
Sr. Name of Village Name of Number of girls school No. CO Block Location Village Primary Middle Matriculation/Secondary Higher Secondary/PUC/
Code Number School School School Intermediate/ Jun ior Colle e
2 3 4 5 6 7 S
NIL
178

TOWN DIRECTORY
Section-II Town Directory
NOTE EXPLAINING THE ABBREVIATIONS USED IN THE TOWN DIRECTORY
Town Directory statements (I to VII)
, Statement I : Status and Growth History
Column 2 : Class, name and civic administration status of town
Class has been introduced to facilitate analysis of town directory data at the state and all India levels.
It is presented according to 200 J Census Population of the town as follows :
Population Class 100,000 and above I 50,000-99,999 II 20,000-49,999 111 10,000-19,999 IV 5,000-9,999 V' Below 5000 VI
Town with a population of one hundred thousand (1,00,000) and above is treated as a city.
The civic administration status of the towns is indicated within bracket against the name of the town. The following abbreviations are used to denote civic status of town.
(i) Municipal Corporation (ii) Municipal Committee (iii) Municipal Council (iv) City Municipal Council (v) Town Municipal Council
(vi) Municipal Board (vii) Municipality (viii) Cantonment Board/Contonment (ix) Notified Area (x) Notified Town (xi) Notified Area Committee/
M.Corp. MC
MCI CMC TMC
MB M
CB NA NT
Notified Area Council NAC (xii) Notified Town Area NTA (xiii) Industrial Notified Area INA (xiv) Industrial Township ITS (xv) Township TS (xvi) Town Panchayat TP (xvii) Nagar Panchayat NP (xviii) Town Committee/Town Area Committee TC (xix) Small Town Committee ST
(xx) Estate office (xxi) Gram Panchayat
o (xxii) Census Town Others columns need no comments.
EO GP CT
Statement II : Physical Aspects and Location of towns, 1999
Column 3 to 5 : Physical Aspects :
In these colunms thc Rainfall and Maximum & Minimum Temperature of the town is recorded.
Column 6, 7 & 8 :
Name or the State headquarters, District headquarters and Tahsil headquarters with distance from the referent town in kilometers, is to be recorded respectively. If the names mentioned in these columns are the same as the referent town itself, the distance is recorded as (0) zero.
Column 9 & 10 :
Name of the nearest city with one lakh and more and five Iakh and more population are recorded.
Column 11, 12 and 13 :
If referent town enjoys the facility of railway station, bus route facility or navigable river/canal. Its name is to be mentioned. If not available, then the name of nearest place with distance, where such facility exists is mentioned.
Statement III : Municipal Finance 1998·1999
Item-wise amount of receipt and expenditure in thousand rupees, relating to municipal finance of the town for the ycar 1998-99 is recorded.
Statem~nt IV : Civic and Other amenities, 1999
Column 1 to 5 : Self explanatory
Column 6 : Road length (in kms.)
Information about kutchalpucca road is to be recorded separately for the roads within the limits of the referent tovvn.
(i) Pucca Road (ii) Kutcha Road
PR KR

Column 7 : System of Sewerage :
Generally, sewerage system is implied by the network of mains and branches of underground conduits for the conveyance of sewerage to the point of disposal. Sewers that carry only household and industrial wastes are called separate sewers, those that carry storm water from roofs, streets and other surface are known as storm water drains, while those carrying both sewage and storm water are called combined sewers.
The codes used for different types of drainage system are as follows:
(i) Sewer (ii) Open Surface Drains (iii) Box Surface Drains (iv) Sylk Drains (v) Cesspool method (vi) Pit System (vii) Others
Column 8 to 11 : Number of latrines:
S OSO BSD SO CP Pt o
Number of various types of latrines both Public and Private are given in these columns.
Column 12 : Method of disposal of night soil :
The various prevalent methods of disposal of night soil are. given below with codes:
Head Loads HL Basket B Wheel Barrows WB Septic Tank ST Pit System Pt Sewerage S Others 0
Column 13 and 14 : Water supply
Source and capacity of storage system. The following codes are used in these columns:
Column 13 :
(i) Tap water T (ii) Tube-well water TW (iii) Tank Water TK (iv) Well water W
Column 14 :
(v) Over Head Tank OHT
(vi) Service Reservoir SR (vii) River Infiltration Gallery RIG
(viii) Bore Well Pumping System BWP
(ix) Pressure Tank PT
The information on major sources of water supply is given in column 13 and the storage capacity against each in kilo~litres (in bracket) is presented in column 14.
DISTRICT CENSUS HANDBOOK: BATHINDA
Column 15 : Fire Fighting Service :
In case the fire fighting service is available in the referent town 'yes' is recorded. If the facility is not available within the town, the name of the nearest place having this facility with its distance from the referent town has been recorded.
Column 16 to 20 : Electrification (Number of connections) :
Different types of electric connections have been shown in these columns, i.e. Domestic, Industrial, Commercial, Road lighting (points) & others.
180
Statement V : Medical, Educational, Recreational and Cultural Facilities, 1999
Column 1 to 3 : Self explanatory.
Column 4 & 5 :
The data covers all such medical institutions run by or aided by Government/Semi Government/Local bodies and Charitable institutions or Social agencies like the Missionaries. Where the family planning centres are attached to hospitals or maternity and child welfare centres or Primary Health Centres, they may be treated as independent units and counted separately using foHowing codes:
(i) Hospital H (ii) Dispensary 0 (iii) Health Centre HC (iv) Family Welfare Centre FWC (v) T.B. Clinic TB (vi) Nursing Home NH (vii) Others 0
In case of more than one institutions of any type, it is indicated within brackets the number of such institution (s) e.g. 0(3), NH(8), etc. The institutions have further been distinguished by providing additional codes within the bracket as. given below:
Ayurvedic Unani HOl11oeopathic
Column 6 to 9 :
A U Hom
The codes used for these columns are as follows:
(i) Arts only A (ii) Science only S (iii) Commerce only C (iv) Arts & Science only AS (v) Arts & Commerce only AC (vi) Combined for all categories-Arts,
Science and Commerce ASC (vii) Law L
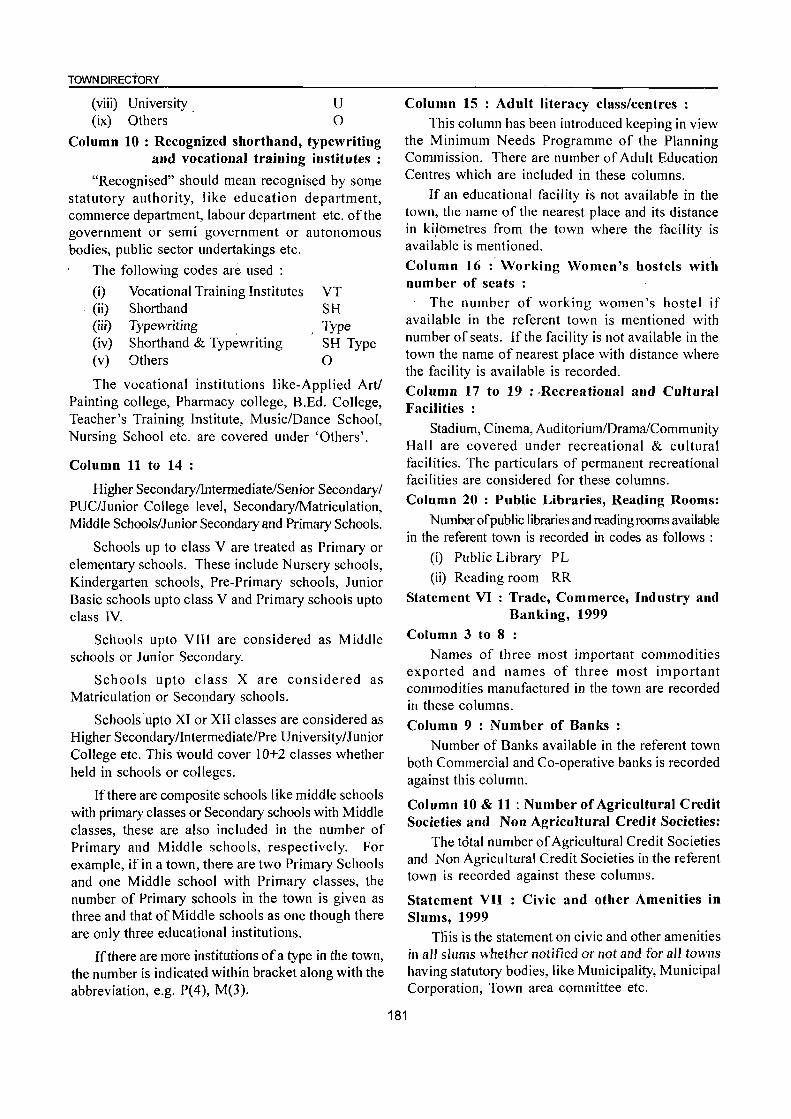
TOWN DIRECTORY
(viii) University. (ix) Others
U o
Column 10 : Recognized shorthand, typewriting and vocational training institutes :
"Recognised" should mean recognised by some statutory authority, like education department, commerce department, labour department etc. of the government or semi government or autonomous bodies, public sector undertakings etc.
The following codes are used :
(i) Vocational Training Institutes . (ii) Shorthand
(iii) Typewriting (iv) Shorthand & Typ~writing (v) Others
VT SH Type SH Type o
The vocational institutions like-Applied Art/ Painting college, Pharmacy college, B.Ed. College, Teacher's Training Institute, Music/Dance School, Nursing School etc. are covered under 'Others'.
Column 11 to 14 :
Higher SecondarylIntermediate/Senior Secondary/ PUC/Junior College level, SecondarylMatriculation, Middle Schools/Junior Secondary and Prima!)' Schools.
Schools up to class V are treated as Primary or elementary schools. These include Nursery schools, Kindergarten schools, Pre-Primary schools, Junior Basic schools upto class V and Primary schools upto class IV.
Schools upto VIII are considered as Middle schools or Junior Secondary.
Schools upto class X are considered as Matriculation or Secondary schools.
SchooJs" upto XI or XII classes are considered as Higher Secondary/Intermediate/Pre University/J unior College etc. This would cover 10+2 classes whether held in schools or colleges.
If there are composite schools like middle schools with primary classes or Secondary schools with Middle classes, these are also included in the number of Primary and Middle schools, respectively. For example, if in a town, there are two Primary Schools and one Middle school with Primary classes, the number of Primary schools in the town is given as three and that of Middle schools as one though there are only three educational institutions.
Ifthere are more institutions of a type in the town, the number is indicated within bracket along with the abbreviation, e.g. P(4), M(3).
Column 15 : Adult literacy class/centres: This column has been introduced keeping in view
the Minimum Needs Programme of the Planning Commission. There are number of Adult Education Centres which are included in these columns.
If an educational facility is not available in the town, the name of the nearest place and its distance in ki,lometres from the town where the facility is available is mentioned.
Column 16 :' Working Women's hostels with number of seats :
The number of working women's hostel if available in the referent town is mentioned with number of seats. If the facility is not available in the town the name of nearest place with distance where the facility is available is recorded.
Column 17 to 19 : ·Recreational and Cultural Facilities :
Stadium, Cinema, Auditorium/Drama/Community Hall are covered under recreational & cultural facilities. The particulars of permanent recreational facilities are considered for these columns.
Column 20 : Public Libraries, Reading Rooms:
Number of public libraries and reading rooms available in the referent town is recorded in codes as follows :
(i) Public Library PL
(ii) Reading room RR
181
Statement VI : Trade, Commerce, Industry and Banking, 1999
Column 3 to 8 : Names of three most important commodities
exported and names of three most important commodities manufactured in the town are recorded in these columns.
Column 9 : Number of Banks :
Number of Banks available in the referent town both Commercial and Co-operative banks is recorded against this column.
Column 10 & 11 : Number of Agricultural Credit Societies and Non Agricultural Credit Societies:
The total number of Agricultural Credit Societies and Non Agricultural Credit Societies in the referent town is recorded against these columns.
Statement VII : Civic and other Amenities in Slums, 1999
This is the statement on civic and other amenities in all slums whether notified or not and for all towns having statutory bodies, like Municipality, Municipal Corporation, Town area committee etc.

DISTRICT CENSUS HANDBOOK: BATHINDA
STA1EMENT
STAnJS AND
Serial Class, name and civic Location Namc of Name of CD. Area Number of Population and growth rate number status of to'Ml code Tahsil block (in sq. households
number km.) incl. houseless
households
(200 I Census) 1901 1911 1921 1931 2 3 4 5 6 7 8 9 10 II
IV Goniana (M.CI) 41401000 Bathinda 4.0 2,312
2 VI Bhisiana (CT) 41402000 Bathinda 6.8 1,164
3 III Rampura Phul (U.A) 41403000 Rampura NA 8,234 4,964 4,515 4,943 6,836 Phul (-9.0) (+9.5) (+38.3)
4 III Rampura 41403000 Rampura 8.9 8,234 4,964 4,515 4,943 6,836 Phul (M.CI) Phul ( -9.0) (+9.5) (+38.3)
5 IV Bhucho 41404000 Bathinda 4.2 2,284 Mandi (M.CI)
6 I Bathinda (M.CI) 41405000 Bathinda 110.0 42,130 13,185 15,037 20,154 22,771 (+14.0) (+34.0) (+13.0)
7 V Sangat (M.CI) 41406000 Bathinda 2.0 939
8 IV Raman (M.CI) 41407000 Talwandi 4.0 3,398
Sabo
9 V Kot Fatta (M.CI) 41408000 Bathinda 2.0 1,150
10 III Maur (M.CI) 41409000 TahVclndi 14.1 4,766
Sabo
STA'IEMENT
PHYSICAL ASPECTS AND
Serial Class, name and civic status Ph y sical aspect s Name of and road distance
number of to\\n Rainfall Temperature (in centigrade) State BQ. District I-IQ.
(in mm) Maximum Minimtun
2 3 4 5 6 7
IV Goniana (M.cI) 886 44 7 Chandigarh Bathinda
(220) (II )
2 VI Bhisiana (C.T) 876 42 5 Chandigarh Bathinda
(240) (20)
3 III Rampura Phul (U.A) 975 41 5 Chan'digarh Bathinda
(183) (30)
4 III Rampura Phul (M.CI) 975 41 5 Chandigarh Bathinda
( 183) (31 )
5 IV Bhucho Mandi (M.CI) 780 4l.2 5.1 Chandigarh Bathinda
( 198) ( 16)
6 I Bathinda (M.CI) 876 41 5 Chandigarh Bathinda
(220) (0)
7 V Sangat (M.CI) 420 41 5 Chandigarh Bathinda
(232) (22)
8 IV Raman (M.CI) 876 41 5 Chandigarh. Bathinda
(238) (45)
9 V Kot Fatta (M.CI) 876 41 5 Chandigarh Bathinda
(207) (26)
10 III Maur (M.el) 876 41 5 Chandigarh Bathinda
(187) (42)
182

TOWN DIRECTORY
- I GROWrn HlSlDRY
(in brackets) of the tov.n at the Censuses of Density Sex ratio Class, name and civ ic Serial (2001 status oftov.n number Census)
1941 1951 1961 1971 1981 1991 2001 1981 1991 2001 12 13 14 15 16 17 18 ~19 20 21 22 2
, 3,948 8,054 6,408 8,596 10,415 12,813 3,203.3 868 908 866 ' IV Goniana (M.el)
(+104.0) (-29.4) (+34.1) (+21.2) (+23.0) 4,775 698.1 - 683 VI Bhisiana (CT) 2
9,515 14,409 19,700 23,406 31,890 35,530 44,665 879 898 885 III Rampura Phul (U.A) 3 . (+39.2) (+51.4) (+36.7) (+18.8) (+36.2) (+11.4) (+25.7)
9,515 14,409 19,700 23,406 31,~90 35,530 44,665 5,029.8 879 898 885 III Rampura 4 (+39.2) (+51.4) (+36.7) (+18.8) (+36.2) (+11.4) (+25.7) Phul (M.Cl)
1,624 2,277 2,945 7,820 10,006 13,246 3,184.1 853 900 888 IV Bhucho 5 (+40.2) (+29.3) (+165.5) (+28.0) (+32.4) Mandi (M.CI)
24,833 34,991 52,253 65,318 127,363 159,042 217,256 1,975.1 819 865 . 858 I Bathinda (M.CI) 6 (+9.1) (+40.9) (+49.3) (+25.0) (+95.0) (+24.9) (+36.6)
933 2,874 3,531 2,859 2,731 5,401 2,700.5 883 930 887 V Sangat (M.CI) 7 (+208.0) (+22.9) (-19.0) (-4.5) (+97.8)
6,446 9,507 11,574 14,318 17,275 19,551 4,900.0 866 868 887 IV Raman (M.CI) 8 (+47.5) (+21.7) (+23.7) (+20.7) (+13.2)
640 3,808 4,308 4,973 5,611 6,504 3,252.0 865 888 893 V Kot Fatta (M.CI) 9 (+495.0) (+13.1) (+15.4) , (+12.8) (+15.9)
3,847 10,944 13,407 18,853 25,180 27,543 1,956.2 892 863 877 1I1 Maur (M.Cl) 10 (+184.5) (+22.5) (+40.6) (+33.6) (+9.4)
-II LOCATION OFlDWNS. 1999
in kilometer (5) from Class, name and civic Serial
Tahsil H.Q. Nearest city with Nearest city with Railv.ay station Bus facility Navigable riverl status of tov.n number
population of one population of five canal (if within
lakh and more lakh and more ten kilometers)
8 9 10 11 12 13 2
Bathinda Bathinda Goniana Goniana 0 IV Goniana (M.CI)
(II) (11 ) (0) (0) (0) Bathinda Bath in da Baluana Bhisiana 0 VI Bhisiana (C.T) 2
(20) (20) (8) (0) (0)
Rampura Phul Bathinda Rampura Phul Rampura Phul 0 III Rampura Phul (U.A) 3
(0) (32) (0) (0) (0)
Rampura Phul Bathinda Rampura Phul Rampura Phul 0 J\l Rampura Phul (M.CI) 4
(0) (33) (0) (0) (0)
Bathinda Bathinda Bhucho Mandi Bhucho Mandi 0 IV Bhucho Mandi (M.CI) 5
(16) (16) (0) (0) (0)
Bathinda Abohar Bathinda Bathind& 0 I Bathinda (M.CI) 6
(0) (88) (0) (0) (0) Bathinda Bathinda San gat San gat 0 V Sangat (M.CI) 7
(22) (22) (0) (0) (0)
TalW<lIldi Sabo Bathinda Raman Raman 0 IV Raman (M.CI) 8
(13) (45) (0) (0) (0)
Bathinda Bath in da Kot Fatta K..,(Fatta 0 V Kot Fatta (M.CI) 9
(26) (26) (0) (0) (0)
Talv.andi Saba Bathinda Maur Maur 0 III Maur (M.CI) 10
(19) (42) (0) (0) (0)
183

Serial number
2
3
4
5
6
7
8
9
10
Serial number
2
3
4
5
6
7
8
9
10
Class, name and civic status of town Receipt Revenue derived
through from municip al taxes, etc. properties and
power apart from taxation
2 3 4
IV Goniana (M .CI) 7,629
VI Bhisiana (C.T)
III RampuraPhul (U.A) 1,104 579
III RampuraPhul (M.C]) 1,104 579
IV BhucilO Mandi (M.CI) 4, III 3,582
1 Bathinda(M.Cl) 137,110 11,042
V Sangat (M.Cl) 704 721
IV Raman (M.CI) 649 2,729
V Kot Fatta(M.CI) 48 320
III Maur (M.CI) 7,679 1,011
Class, name and civic status of town
PopUlation Population 2001 Census (2001 SchedUled Scheduled
Census) Castes Tribes
2 3 4 5
IV Goniana (M.el) 12,813 2,886
VI Bhisiana (C.T) 4,775 683
III Rampura Phul (U.A) 44.665 10,020
III Rampura Phul (M.el) 44,665 10,020
IV Bhucho Mandi (M.Cl) 13,246 4,163
I Bathinda (M.el) 217,256 46,295
V Sangat (M.C1) 5,401 1,674
IV Raman (M.el) 19,551 5,938
V Kot Fatta (M.el) 6,504 2,691
III Maur (M.el) 27,543 8,411
184
DISTRICT CENSUS HANDBOOK: BATHINDA
STATEMENT MUNICIPAL FINANCE,
Receipt (in Rs.'OOO) Government Loan Advance
grant
5 6 7
720
50
3,209 3,000 1,022
310
25 503
Other Total sources receipt
(specify)
8 9
8,349
50
19,319 21,002
19,319 21,002
2,082 9,775
1,518 156,901
128 1,553
5,743 9,121
138 815
668 9,886
STATEMENT
CIVIC AND OTHER
Road ' System of Number of latrines --------------~~~-----length (in sewerage Total Water Service Others
km. (s) ) borne
6 7 8 9 10 II
KR(2) OSD, S 2,234 1,198 1,036
PR(17) PR(2) OSD. Pt. 100 100
KR(5) S.05O 3,986 2,356 1,630
PR(31) KR(5) S,05O 3,986 2,356 1,630
PR(3 I) KR(2.2) S,05O 1,785 1,785
PR(21.6) PR(178.7) S.,OSD 29,375 19,325 10,050
PR(2) OSD,S 295 25 270
KR(7.1) S,OSD 2,787 773 2,014
PR(15) KR(1.3) OSD, PI.. 84 84
PR(0.8) PR(29) S, PI 3,200 1,625 1,575

TOWN DIRECTORY
-m 1998-99
General
administration
10
5,612
15,015
15,015
637
19,568
491
688
167
7,019
-IV
Public
safety
11
282
3,512
19,473
2,128
378
~rrU[8, 1999
Expenditure (in Rs.'OOO)
Public health Public Public
and
conveniences
12
50
90,121
69
1,353
171
2,123
works institutions
13 14
1,683
3,728
3,728
74 107
25,581
154
221
193
16
~
Others
(specifY)
15
215
215
5,670
5,637
756
4,176
46
378
Total
expenditure
16
7,577
50
18,958
18,958
10,000
160,381
1,470
8,566
577
9,914
Method Water supply Fire Electrification (number of connections)
of Source of System of fighting Domestic Industrial Comm- Road Others
disposal supply storage with service· ercial ligJ-tting
ofnigJ-tt capacity in (points)
soil kilolitres (in
12 13 15 16 17 18 19 20
S, Pt. TK,T OHT Bathinda 2,042 57 808 245 25
(590) (11)
Pt.,O TW,T OHT Yes 208 5 46 30
(100)
S, Pt. T,TW OHT Yes 6,200 300 1,800 1,500 5
(910)
S, Pt. T,TW OHT Yes 6,200 300 1,800 1,500 5
(910)
S T,TW OHT Bathinda 2,683 89 673 293 15
(450) (16)
s,St TW,T OHT Yes 35,540 705 6,852 8,554 50
(4540)
S, Pt. T,TW OHT Bathinda 1,774 17 220 59 2
(275) (22)
S, Pt T,TK OHT Bathinda 3,237 140 9AS 361 5
(590) (45)
ST,O TK OHT Bathinda 1,142 12 75
(225) (26)
S, Pt TW,T OHT Rampura 7,550 141 1,429 765 174
185
Class, name and civic
status of town
2
IV Goniana (M .CI)
VI Bhisiana(C.T)
III Rampura Phul (U .A)
III RampuraPhul(M.CI)
IV Bhucho Mandi (M.CI)
I Bathinda (M .CI)
V San~t (M .CI)
IV Raman (M.CI)
V Kot Fatta(M.CI)
III Maur(M.CI)
Class, name and civic
status of town
2
IV Goniana (M.el)
VI Bhisiana (C.T)
III Rampura Phul (U.A)
1Il Rampura Phul (M.el)
IV Bhucho Mandi (M.el)
I Bathinda (M.CI)
V Sangat (M.CI)
IV Raman (M.el)
V Kot Fatta (M.c1)
III Maur (M.e!)
Serial
number
2
3
4
5
6
7
8
9
10
Serial
number
2
3
4
5
6
7
8
9
10

DISTRICT CENSUS HANDBOOK: BATHINDA
STATEMENT MEDICAL, EDUCATIONAL, RECREATIONAL
Serial Class,name and civic Population Medical facilities· Educational number status oftO\\fl
(2001 Hospitals/ Beds in Arts/ Medical Engineering Polytechnics Recognised Cens us) Dis pens aries/ T.B. medical Science! colleges colleges shorthand,
clinics etc. ins titutio ns Commerce! type mit ing noted in law Other and
column 4 colleges (of vocational degree level training and above) ins titutio ns .,..
2 3 4 5 6 7 8 9 XJ
IV Goniana (M.CI) 12813 H D«A-~I) HC FWC 35 A AS Faridkot (74) Bathinda( II) Bathinda( II) NH TB-Bathinda(lI)
2 VI B his iana (C.T) 4775 H-Bathinda( 18) 0 Bathinda (18) F aridkot (55) Bathinda( 18) Bathinda(18)
O-VJIk(4) I1C-BUljMahman «2)
HC-Burj Mahman «2) TB-Bathinda(18) NH-Bathinda(18)
3 ill Rampura P hul(U.A) 44665 H D«A-~Hom-U» 97 AC Faridkot (77) Bathinda (33) Bathinda(33 ) FWC NH(5) HC-Bhagta (Xl)
TB-Bathinda (33)
4 ill Rampura P hul 44665 H D«A-tHom-U)) 97 AC Faridkot (77) Bathinda (33) Bathinda(33) (M.CI) FWC NH(5)
HC-Bhagta (XJ)
TB-Bathinda (33)
5 IV Bhucho Mandi 13246 D NH(2) 35 Bathinda(16) Faridkot (75) Bathinda( 16) Bathinda( 16) (M.CI) H-Bathinda(16)
HC-Nathana (14)
HC-Nathana (14) TB-Bathinda(16)
6 1 Bathinda (M.el) 217256 H(H(A-1,4» D«A- 391 A(2) ASC(2) Faridkut(63) Vr(2) 2,Hom-1,9» F\\C SHType(2) TB NH(6) Other HC-Goniana (II)
7 V Sangat (MD) 5401 HC FWC 50 Bathinda (22) Faridkot (85) Bathinda (22) Bathinda (22) H-Raman
0-0
TB-Bathinda (22)
NH-Bathinda((22)
8 IV Raman (M.CI) 19551 H O«A -I) FWC TB 36 Faridkat Bathinda(45) Talwlndisabo NH(5) (llS) (13) HC-Talw.lndi Sabo(13)
9 V Kat FaUa (M.CI) 6504 D«A-I,I) 4 Bathinda (26) Faridkot Bathinda (26) Bathinda (26) H-Maur(XJ} (XJ8)
HC--
HC-Bathinda (26)
TB-Bathinda (26)
NH-Maur(Xl)
Xl ill Maur(M.CI) 27543 H D«A-I,I) FWC 64 Faridkot Bathinda( 42) Talwlndisabo NH(7) (llS) (19) HC-Talwlndi Sabo(J9) TB-Bathinda (42)
, • If a medical or Educational facility is not available in the town, the name of the nearest place and its distance in kilometer (s)
from the town where the facility is available is given
186

TOWN DIRECTORY
-v AND CULTURAL FACILITI~, 1999 facilities
Higher secondaryl
Intennediate! Senior
Secondaryl POC (preuniversity collegey
Junior co lie e level
11
2
2
10
2
Bathinda (26)
Secondary! Matricula-
tion
12
6
8
8
2
15
2
5
4
Junior Primary Adult literacy secondary schools clas sesl
and centres, Middle others
schools (specify)
I3 14 15
9 15
2
18
D 18
~
4 6
21 41
3 5
7 12
2 4
6 11
Working \\Omen's
hos tels mth nurnberof
seats
16
B athinda( II)
Bathinda(18)
Bathinda (33)
Bathinda (33)
Bathinda(16)
1(48)
Bathinda
Bathinda (45)
Bathinda (26)
Bathinda (42)
Numberofrecreationaland cultural fucilities
Stadium Cinema Auditorium! Public Drama! hbraries
community including Halls reading
rooms
17 18 19 20
PL RR
2 PL RR
2 PL RR
PL RR
'i-
3 6 3 PL(2) RR(3)
PL
PL RR
187
Class,name and Serial civic status 0 fto \\11 number
2
N Goniana (M.CI)
VI Bhisiana (CT) 2
m RampuraPhul 3 (VA)
m Rampura P hul 4 (M.CI)
N Bhucho Mandi 5
I Bathinda (M.CI) 6
V Sangat (M.CI) 7
N Raman (M.CI) 8
V KotFatta(M.CI) 9
ill Maur(M.CI) 10

Serial Class, name and civic status number of tON!
1st
2 3
IV Goniana (M.C!) Raw Cotton
2 VI Bhisiana (C.T) Wheat
3 III' Rampura Phul (U.A) Agricultural Implements
4 III Rampura Phul (M.CI) Agricultural Implements
5 IV Bhucho Mandi (M.CI) Cotton Seed
6 I Bathinda (M.CI) Fertiliser
7 V Sangat (M.CI) Wheat
8 IV Raman (M.CI) Cotton Bales
9 V Kot Fatta (M.CI) Cotton
10 III Maur (M.CI) Procsessed Cotton
188
DISTRICT CENSUS HANDBOOK: BATHINDA
STATEMENT TRADE, COMMERC~ INDUSTRY
Name of three most important commodities exported
2nd 3rd 4 5
Wooden Furniture Oil Seeds
Cotton Green Fodder
Cotton Washing Soap
Cotton Washing Soap
Oil Cake Agricultural Implements
Vanaspati Oil S.W.Pipe
Pulses Agricultural Implements
Vegetable Oils Mustard Oil
Wheat Soda
Mustard Oil Wheat

189

Serial Class and name of Name of the slwn nwnber tOM
2 3
IV Goniana Bhagw.ln Dass Chare Table Area
Bhai Block Nagar
Bhoopa Singh $ohi Area
Bus Stand Area
Dashmesh Nagar
Hospital Area A Block
Prem Nagar
Pseb Area Abad
Raja B~sti 2 IV Bhucho Manill Basti Ram Vilas
Bastistehan
Kothe Lehrakhana
3 V Sangat Ward No.4
Ward No.17
4 V Kot Faua Ward No.3
Ward No.4
Ward No.8
5 IV Raman Dhanak Basti
Nai Basti
Regar Basti
6 III Maur Dhanak Basti Maur Khurd
Gandhi Basti
Ghwn ar Basti
Harijan Basti Maur Kalan
Harijan Basti Maur Khurd
Master Colony
Rarndasia Basti (Maur Kalan)
DISTRICT CENSUS HANDBOOK: BATHINDA
STATEMFNT CIVIC AND OTHFR AWNmES
Is it No. of Population of the Paved System of
se\\erage notified households Slwn roads (in
(approximate) (approximate) kilometers)
4 5 6 7 8
Yes 14 90 OSD Yes 119 740 OSD Yes 15 96 S Yes 15 87 OSD
Yes 25 133 S
Yes 12 70 S Yes 150 912 OSD
Yes 1O 57 S
Yes 140 815 OSD
Yes 503 3,025 S
Yes 430 2,150 OSD
Yes 30 206 OSD
No 86 451
No 51 295
No 74 372
No 72 363
No 49 245
Yes 497 2,753 3 OSD, PI.
Yes 314 1,790 3 OSD, Pt.
Yes 503 2,717 2 OSD, Pt.
Yes 200 1,040 2 OSD, PI.
Yes 640 3,200 2 OSD, PI.
Yes 415 2,100 2 OSD, PI.
Yes AOO 2,000 OSD, Pt.
Yes 140 700 OSD, Pt.
Yes 205 1,020 OSD, PI.
Yes 350 1,700 OSD, Pt.
190
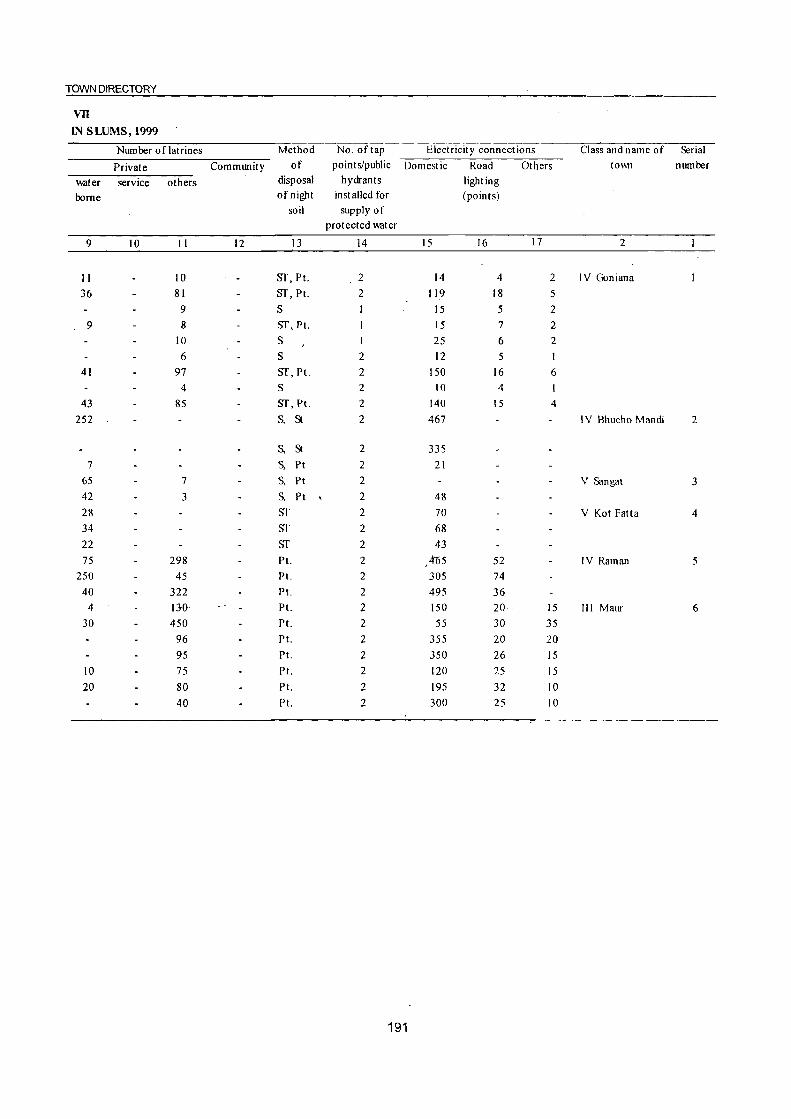
TOWN DIRECTORY
vn IN SLUMS, 1999
Number of latrines Method No. of tap Electricity connections Class and name of Serial
Private Community of points/public Domestic Road Others to\\Tl number
Wclter service others disposal hydrants lighting
borne of night installed for (points)
soil supply of
protected Wclter
9 10 11 12 13 14 15 16 17 2
II 10 Sf, Pt. 2 14 4 2 IV Goniana
36 81 Sf, PI. 2 119 18 5 9 S 15 5 2
9 8 Sf, PI. 15 7 2 10 S I 25 6 2 6 S 2 12 5
41 97 Sf, Pt. 2 150 16 6 4 S 2 10 4
43 85 Sf, PI. 2 140 15 4 252 S, St 2 467 IV Bhucho Mandi 2
S, St 2 335 7 S, Pt 2 21
65 7 S, Pt 2 V Sangat 3 42 3 S, Pt , 2 48 28 Sf 2 70 V Kot Fatta 4 34 Sf 2 68 22 Sf 2 43 75 298 PI. 2 ,4l55 52 IV Raman 5
250 45 PI. 2 305 74 40 322 PI. 2 495 36 4 no PI. 2 150 20 15 III Maur 6
30 450 PI. 2 55 30 35 96 PI. 2 355 20 20 95 PI. 2 350 26 15
10 75 PI. 2 120 25 15 20 80 PI. 2 195 32 10
40 PI. 2 300 25 10
191


PART - B PRIMARY CENSUS ABSTRACT


Brief note on Primary Census Abstract
,......,.e first census of the third millennium and twenty 1. first century the Census of India, 2001 was the
14th continuous and uninterrupted Indian census since '1872. Thus, 2001 Census will provide data on population and its characteristics marking transition from one century and millennium to another.
The gigantic operation of'Population Enumeration (considered by many to be the single largest and complex peace time administrative exercise in the world) was made possible due to the door to door universal canvassing of the Household Schedule by about 2 million enumerators and supervisors covering 593 districts, 5,463 sub-districts, 5,161 towns and 638,588 villages. The comprehensive Household Schedule which replaced the individual slip had three parts and two sides A and B. Part I contained the Location Particulars; Part II related to the Individual Particulars and Part III contained questions for Household engaged in Cultivation/Plantation. The part II of the Household Schedule had 39 columns and 23 questions all of which were universally canvassed and no sampling was resorted to during enumeration.
Data Processing
A quantum leap was made in the technology front while processing the Census 2001 data both for Houselisting and Population Enumeration. The Census schedules for both the phases were scanned through high speed scanners in fifteen data centers across the country and hand-written data from the schedules were converted into digitized form through Intelligent Character Reading (ICR) software for creation of ASCII records for further processing. The designing and formatting of the Household Schedule had to be done very carefully using specialized software so as to ensure uniformity, which was an essential prerequisite for scanning. The selection of appropriate state-of-art technology in data processing has made it possible to produce all the Houselisting as well as Population Enumeration tables on full count basis for the first time in the history of Census. For Census
2001, about 202 million schedules consisting of about 1,028 million records were scanned and processed within a span of only 10 months starting from October, 2002.
Task Force on Quality Assurance
After the data is processed, it is expedient on the part of the data producing agency to satisfy itself about its quality before putting the same in public domain. This has to be done mainly through the process of internal consistency, comparison with similar data in the past and also through validation with likewise data if available, from external sources. Quite often the local knowledge and perception has to be brought into play to understand both the existing and the new emerging trends of population distribution and characteristics. The other very important aspect of the data quality is to ensure complete coverage of all geographical areas especially for the population enumeration phase where the data is disseminated right up to the village level in the rural areas and the ward level in the urban areas. Thus ensuring the complete coverage and correct geographical linkage of each enumeration block was one of the major planks of the quality control, specially for small area population statistics.
A very comprehensive check and edit mechanism was put in place to objectively examine the preliminary Census 2001 Population Enumeration results and finally clear them for use. The responsibility of the final clearance of data was with the Task Force on Quality Assurance (TFQA), headed by the Registrar General and Census Commissioner, India. The other members of the TFQA were the Heads and senior officers of the Census Division, Data Processing Division, Map Division, Demography Division and Social Studies Division. The Directors of Census Operations were co-opted as members whenever the TFQA discussed the data for their StateslUnion territories. The Directors and their senior officers were required to make detailed presentations of data for their own state both in respect to the

quality and the coverage and only after the full possible satisfaction of the TFQA, the population data was cleared.
There has been a major departure in Census 2001 from the past in respect of the procedure followed for finalization of the Scheduled Castes and the Scheduled Tribes population. In the earlier censuses, the total Scheduled Castes and Scheduled Tribes populations were finalized at the time of the manual compilation of the Primary Census Abstracts (PCA) at the Regional Tabulation Offices which were specially set up for this purpose. The individual Scheduled Caste and the Scheduled Tribe population for each state was finalized much later based on manual coding done by the coders. In 200 I Census, each individual Scheduled Caste and the Scheduled Tribe have been coded directly on the computers by the Data Entry Operators through a process known as Computer Assisted Coding (CAC) and taken up along with the processing of PCA data. The CAC process involves pulling down, from the relevant dictionary of the Scheduled Castes and the Scheduled Tribes, on the computer screen and coding from the dictionary by referring to the image of the specific individual entry in the Household Schedule appearing on the screen. The CAC of the response on Religion wherever required, was also undertaken along with the processing ofPCA. This is because the Scheduled Castes status had to be determined in relation to the religion of the individual. Two Special Task Forces, one on Religion and the other on Scheduled Castes/ Scheduled Tribes were constituted for scrutiny and appropriate classification of these responses.
The main task of the Special Task Force on Religion was to appropriately merge or group the new responses encountered and code it into the appropriate religious community based on available literature and local knowledge. The Special Task Force on Scheduled Castes and Scheduled Tribes examined the different Scheduled Castes and Scheduled Tribes entries encountered and classified these into appropriate category of the Scheduled Castes or the Scheduled Tribes principally based on the Presidential Notification and the available literature. Thus a very systematic and scientific mechanism was operationalised to firm up the individual religion and the individual Scheduled Caste/Tribe returns. The Scheduled Castes and the Scheduled Tribes population in 2001 Census, is thus
DISTRICT CENSUS HANDBOOK: BATHINDA
being finalized by aggregating the population data for individual Scheduled Castes and the Scheduled Tribe at appropriate geographical levels.
The ,e'"ntire work relating to the data validation and scrutiny was completed by all the States/Union Territories under the overall supervision and monitoring of the Census Division of the Office of the Registrar General, India with active cooperation and support of the Social Studies Division, Data Processing Division, Data Dissemination Division and Map Division.
Primary Census Abstract
196
The Primary Census Abstract which is yet another important publication of 2001 Census gives basic information on Area, Total Households, Total population, Scheduled Castes and Scheduled Tribes population, Population in the age group 0-6, Literates, Main workers and Marginal workers classified by the four broad industrial categories, namely, (i) Cultivators, (ii) Agricultural laborers, (iii) Household Industry Workers, and (iv) Other workers and also Non-workers. The characteristics of the Total Population includes Scheduled Castes, Scheduled Tribes, Institutional and Houseless population and are presented by sex and rural-urban residence. This data is presented at different levels, namely, India, States/Union territories, Districts, Cities and Urban Agglomerations (Population 1,00,000 and above) in three different tables. In addition, the Appendix of said publication provides Houseless and Institutional Households and their population by residence and sex for 200 I for India, State and Union territory.
Apart from the India and State/Union Territory volumes for Primary Census Abstract, the District Census Handbook contains District Primary Census Abstract, Appendix to District Primary Census Abstract, Primary Census Abstract for Scheduled Castes, Primary Census Abstract for Scheduled Tribes, Village Primary Census Abstract and Urban Primary Census Abstract of the concerned district in the state. .
It Wa$ for the first time at the 1981 Census that the Prirrlary Census Abstract (PCA) was brought out for the Scheduled Castes and the Scheduled Tribes separately on the pattern of General Primary Census Abstract. This practice was continued in 1991 also. In the 1961 and 1971 Censuses, such data were made available in Table C-VIII-Social and Cultural table and to some extent in the series 'Special Tables for Scheduled Castes/Scheduled Tribes'.

PRIMARY"CENSUSABSTRACT
The fonnat of Primary Census Abstract has been restructured slightly in the 2001 Census as compared to that of 1991 Census. The nine-fold industrial classification of main workers given in the Primary Census Abstract of 1991 Census has been discontinued and in its place, four-fold industrial classification of both 'main workers' and 'marginal workers' are included. In 1981 census only main workers were presented into four categories. One of the novel features of the primary
Name of the Primary Census Abstract
1. District Primary Census Abstract
census abstract of 199 I census was the presentation of data of the population of age group 0-6 is continued in 2001 Census also. This will help the data users in better analysis and understanding of literacy data.
Level of presentation in District Census Handbooks
The Primary Census Abstract data in different PCAs are presented at different levels. The level of presentation of Primary Census Abstracts are as under:
Level of presentation
2. Primary Census Abstract for Scheduled Castes
District/CD Block/UA/City/Town
District/CD Block/Town
District/CD Block/Town 3. Primary Census Abstract for Scheduled Tribes
4. Village Primary Census Abstract
5. Urban Primary Census Abstract
The PCA Data for villages was presented CD Block wise for the first time in 1991 Census. This practice is continued in 2001 Census also. The data for each CD Block is presented both for rural and urban areas separately. All the villages within the CD Block constitute the rural portion and the Census Towns and Outgrowths are shown under the urban portion of the CD Block. In case a CD Block is spread over two or more districts, than portion which falls within the district is presented, the data pertaining to remaining portion of the CD Block is presented in the concerned District Census Handbook. The data in the Urban Primary Census Abstract for each town as well as for town with outgrowths in the district are presented. The data for all the wards and the outgrowths of the town(s) are also presented separately below the concerned town(s).
The District Primary Census Abstract is presented in 59 columns. The Primary Census Abstract for Scheduled Castes and Primary Census Abstract for Scheduled Tribes are presented in 52 columns. The Village Primary Census Abstract and Urban Primary Census Abstract are presented in 58 columns.
The concepts and definitions used in the column heading are explained under the sub heading 'Census Concepts' in the Analytical Note. The tenn 'Total Population' includes the Scheduled Castes, the Scheduled Tribes, the Institutional and the Houseless populations. The explanation regarding area figures
CD BlockIVillagewise
Town/Ward level
presented at various level in the Primary Census Abstracts are as follows:
Area Figures
The area figures supplied by local revenue authorities of the district in respect ofTahsils, Police Stations and by the local bodies in respect of towns are given in square kilometers. The area figures of the villages supplied by the Tahsildars in acres have been converted and shown in hectares. The area figures of the CD Block is the total of the village areas coming under each CD Block. The area figures for the district are the same as adopted by the Surveyor General of India to maintain uniformity at the national level. The total area figures of all the Tahsils/CD Blocks within the district may not tally with area figures of the district because former represents land use area only. Similarly, the total of all the villages may not tally with the entire rural of Police Station/Tahsil. The"difference may be due to the fact that while the area covered by hills, forests and rivers etc, have been accounted in the Tahsils and P.S. level the same may not be covered under the area of the villages. Apart from this it may also differ due to varying methods of computation adopted at different levels.
. An appendix to District Primary Census Abstract has also been furnished showing urban enumeration, b.lock-wise particulars on Total Population, the Scheduled Castes Population and the Scheduled Tribes Population for each town.
197

DISTRICT CENSUS HANDBOOK: BATHINDA
DISTRICT PRIMARY
Location District! CD Block! TotaV Area of Number of Total population (incLuding PopuLation in the code U.A.! City! Town RuraV Town! househoLds institutionaL and houseLess age-group 0-6
number Urban Ward in popuLation) square
kilometre Persons Males Females Persons MaLes FemaLes
2 3 4 5 6 7 8 9 LO L1
14 Bathinda Total 208,993 1,183,295 632,809 550,486 149,358 83,656 65,702 Rural 142,616 831,541 444,118 387,423 107,471 59,884 47,587 Urban 66,377 351,754 188,691 163,063 41,887 23,772 18,115
0001 Phul Total 25,109 148,034 78,135 69,899 19,238 10,592 8,646 Rural 24,977 147,312 77,740 69,572 19,128 10,544 8,584 Urban 132 722 395 327 110 48 62
41403000 Dashrr.esh Nagar on Urban 132 722 395 327 110 48 62 Rampura - Mehraj Road (OG) - Ward No.19
0002 Rampura Total 15,856 91,989 49,025 42,964 11,752 6,629 5,123 Rural 15,793 91,629 48,827 42,802 11,702 6,606 5,096 Urban 63 360 198 162 50 23 27
41403000 Outgrowth of Gandhi Urban 63 360 198 162 50 23 27
Nagar on Pi tho Road (OG) - Ward No.20
0003 Nathana Total 22,78~ 129,785 72,452 57,333 16,371 9,123 7,248
Rural 22,648 129,025 72,059 56,966 16,270 9,060 7,210
Urban \37 760 393 367 101 63 38
41403000 Jawahar Nagar on Urban 137 760 393 367 101 63 38
Rampura - Bathinda Road (OG) - Ward No.18
0004 Bathinda Total 29,307 168,979 89,821 79,158 21,495 11,976 9,519
Rural 28,143 164,204 86,984 77,220 20,764 11,560 9,204
Urban 1,164 4,775 2,837 1,938 731 416 315
41402000 Bhisiana (CT) Urban 1,164 4,775 2,837 1,938 731 416 315
0005 Sangat Total 17,300 100,681 52,909 47,772 13,349 7,377 5,972
Rural 17,300 100,681 52,909 47,772 13,349 7,377 5,972
Urban 0006 Talwandi Sabo Total 22,071 129,364 68,664 60,700 17,295 9,661 7,634
Rural 22,071 129,364 68,664 60,700 17,295 9,661 7,634
Urban 0007 Maur Total 11,684 69,326 36,935 32,391 8,963 5,076 3,887
Rural 11,684 69,326 36,935 32,391 8,963 5,076 3,887
Urban URBAN
50170000 Rampura Phul UA Urban 8,234 44,665 23,692 20,973 5,582 3,133 2,449
50170100 Rampura Phul (M Urban 8,234 44,665 23,692 20,973 5,582 3,133 2,449
CI+OG)
50170101 (i) Rampura Phul Urban 7,902 42,823 22,706 20,117 5,321 2,999 2,322
(MCI)
50170102 (ii) Jawahar Nagar Urban 137 760 393 367 101 63 38
on Rampura-Bathinda Road (OG)
50170103 (iii) Dashmesh Urban 132 722 395 327 110 48 62
Nagar on Rarnpura -Mehraj Road (OG)
50170104 (iv) Outgrowth of Urban 63 360 198 162 50 23 27
Gandhi Nagar on Pitho Road (OG)
198

PRIMARY CENSUS ABSTRACT
CENSUS ABSTRACT
Total! District! CD Block/
.,. RuraV UAI Cityl Town Scheduled Castes population Scheduled Tribes population Literates Urban
Persons Males Females Persons Males Females Persons Males Females
12 13 14 15 16 17 18 19 ' 20 3 2
354,652 187,539 167,113 632,570 372,228 260,342 Total Bathinda -
271,891 143,756 128,135 399,064 238,279 160,785 Rural 82,761 43,783 38,978 '233,506 133,949 99,557 Urban 48,271 25,396 22,875 72,782 41,474 31,308 Total Phul 48,186 25,354 22,832 72,419 41,245 31,174 Rural
85 42 43 363 229 134 Urban 85 42 43 363 229 q4 Urban Dashmesh Nagar on
Rampura - Mehraj Road (OG) - Ward No.19
28,934 15,436 13,498 43,040 25,395 17,645 Total Rampura 28,860 15,396 13,464 42,854 25,280 17,574 Rural
74 40 34 186 liS 71 Urban
74 40 34 186 115 71 Urban Outgrowth of Gandhi Nagar on Pi tho Road (OG) - Ward No.20
38,200 20,179 18,021 i. 72,972 45,442 27,530 Total Nathana 37,821 19,980 17,841 72,668 45,257 27,411 Rural
379 199 180 304 185 119 Urban
379 199 180 304 185 119 Urban jawahar Nagar on Rampura - Bathinda Road (OG) - Ward No.18
6\,481 32,543 28,938 81,481 48,749 32,732 Total Bathinda
60,798 32,181 28,617 77,940 46,535 3 I ,405 Rural 683 362 321 3,541 2,214 1,327 Urban 683 362 321 3,541 2,214 1,327 Urban Bhisiana (CT)
34,332 18,049 16,283 46,314 27,700 18,614 Total Sao gat
34,332 18,049 16,283 46,314 27,700 18,614 Rural Urban
40,727 21,593 19,134 56,264 33,877 22,387 Total Talwandi Sabo
40,727 21,593 19,134 56,264 33,877 22,387 Rural Urban
21,167 11.203 9,964 30,605 18,385 12,220 Total Maur
21,167 11,203 9,964 30,605 18,385 12,220 Rural Urban
URBAN 10,020 5,310 4,710 28.676 16,294 12,382 Urban Rampura Phul UA
10,020 5,310 4,710 28,676 16,294 12,382 Urban Rampura Phul (M CI+OG)
9,482 5,029 4,453 27,823 15,765 12,058 Urban (i) Rampurn Phul (Mel)
379 199 180 304 185 119 Urban (ii) Jawahar Nagar on Rampura-Bathinda Road (OG)
85 42 43 363 229 134 Urban (iii) Dashmesh Nagar on Rampura -Mehraj Road (OG)
74 40 34 186 115 71 Urban (iv) Outgrowth of ',. Gandhi Nagar on Pitho Road (OG)
199

DISTRICT CENSUS HANDBOOK: BATHINDA
DISTRICT PRIMARY
Location District! CD Block! TotaV code U.A.I Cityl Town RuraV
number Urban lIliterates Total workers Main workers
Persons Males Females Persons Males Females Persons Males Females 2 3 21 22 23 24 25 26 27 28 29
14 Bathinda Total 550,725 260,581 290,144 500,667 349,228 151,439 408,924 324,536 84,388 Rural 432,477 205,839 226,638 386,540 253,046 133,494 302,533 232,687 69,846 Urban 118,248 54,742 63,506 114,127 96,182 \7,945 106,391 91,849 14,542
0001 Phul Total 75,252 36,661 38,591 66,745 43,586 23,159 51,455 39,774 11,681 Rural 74,893 36,495 38,398 66,462 43,348 23,114 SI,208 39,559 11,649 Urban 359 166 193 283 238 45 247 215 32
41403000 Dashmesh Nagar on Urban 359 166 193 283 238 45 247 215 32 Rampura. Mehraj Road (00) - Ward No.19
0002 Rampura Total 48,949 23,630 25,319 44,154 27,918 16,236 34,221 25,574 8,647 Rural 48,775 23,547 25,228 43,982 27,799 16,183 34,049 25,455 8,594 Urban 174 83 91 172 119 53 172 119 53
41403000 Outgrowth of Gandhi Urban 174 83 91 172 119 53 172 119 53
Nagar on Pitho Road (OG) - Ward No.20
0003 Nathana Total 56,813 27,010 29,803 57,054 42,879 14,175 48,602 39,811 8,791 Rural 56,357 26,802 29,555 56,633 42,664 13,969 48,340 39,647 8,693 Urban 456 208 248 421 215 206 262 164 98
41403000 Jawahar Nagar on Urban 456 208 248 421 215 206 262 164 98
Rampura - Bathinda Road (00) - Ward No.IS
0004 Bathinda Total 87,498 41,072 46,426 73,367 51,006 22,361 59,164 47,200 11,964 Rural 86,264 40,449 45,815 71,468 49,222 22,246 51,276 45,424 11,852
Urban 1,234 623 611 1,899 1,784 115 1,888 1.776 112
41402000 Bhisiana (CT) Urban 1,234 623 611 1,899 1,784 115 1,888 1,776 112
0005 Sangat Total 54,367 25,209 29,158 49,428 30,163 19,265 39,474 27,620 11,854
Rural 54,367 25,209 29,158 49,428 30,163 19,265 39,474 27,620 II ,854
Urban
0006 Talwandi Sabo Total 73,100 34,787 38,313 62,826 39,016 23,810 46,651 35,685 10,966
Rural 73,100 34,787 38,313 62,826 39,016 23,810 46,651 35,685 10,966
Urban
0007 Maur Total 38,721 18,550 20,171 35,741 20,834 14,907 25,535 19,297 6,238
Rural 38,721 18,550 20,171 35,741 20,834 14,907 l5,535 19,297 6,238
Urban
URBAN 50170000 Rampum Phul UA Urban 15,989 7,398 8,591 15,200 12,310 2,890 13,083 11,269 1,814
50170100 Rampura Phul (M Urban 15,989 7,398 8,591 15,200 12,310 2,890 13,083 11,269 1,814
CI+OO)
50170101 (i) Rampura Phul Urban 15,000 6,941 8,059 14,324 11,738 2,586 12,402 10,77t 1,631
(M CI)
50170102 (ii) Jawahar Nagar Urban 456 208 248 421 215 206 262 164 98
on Rampura-Bathinda Road (00)
50170103 (iii) Dashmesh Urban 359 166 193 283 238 45 247 215 32
Nagar on Rampura -Mehraj Road (00)
50170104 (iv) Outgrowth of Urban 174 83 91 172 119 S3 172 \19 53
Gandhi Nagar on
Pitho Road (OG)
200

CENSUS ABSTRACT
Industrial cate60!:X of main workers TotaY Districti CD Block!
RuraY U.A.I Cityl Town
Cultivators Agricultural labourers Household industry
Other workers Urban workers
Persons Males Females Persons Males Females Persons Males Females Persons Males Females
30 31 32 33 34 35 36 37 38 39 40 41 3 2
131,136 116,132 15,004 75,225 60,967 14,258 10,179 5,769 4,410 192,384 141,668 50,716 Total Bathinda 126,541 111,792 14,749 71,069 57,271 13,798 7,530 4,012 3,518 97,393 59,612 37,781 Rural
4,595 4,340 255 4,156 3,696 460 2,649 1,757 892 94,991 82,056 12,935 Urban 21,483 19,204 2,279 12,454 9,879 2,575 1,919 923 996 15,599 9,768 5,831 Total Phul 21,452 19,181 2,271 12,403 9,840 2,563 1,917 922 995 15,436 9,616 5,820 Rural
31 23 8 51 39 12 2 1 163 152 11 Urban 31 23 8 51 39 ' 12 2 I 163 152 11 Urban Dashmesh Nagar on
Rampura - Mehraj Road (00) - Ward No.19
15,217 13,722 1,495 6,818 5,393 1,425 876 348 528 11,310 6,111 5,199 Total Rampura 15,182 13,690 1,492 6,784 5,368 1,416 873 345 528 11,210 6,052 5,158 Rural
35 32 3 34 25 9 3 3 100 59 41 Urban 35 32 3 34 25 9 3 3 100 59 41 Urban Outgrowth ofOandhi
Nagar on Pitho Road (00) - Ward No.20
13,350 12,619 731 7,612 6,617 995 804 542 262 26,836 20,033 6,803 Total Nathana 13,345 12,617 728 7,416 6,483 933 804 542 262 26,775 20,005 6,770 Rural
5 2 3 196 134 6~ 61 28 33 Urban 5 2 3 196 134 62 61 28 33 Urban Jawahar Nagar on
Rampura - Bathinda Road (OG) - Ward No.18
24,244 21,792 2,452 15,847 13,241 2,606 1,293 821 472 \7,1&0 11,346 6,434 Total Bathinda 24,218 21,768 2,450 15,787 13,187 2,600 1,288 817 471 15,983 9,652 6,331 Rural
26 24 2 60 54 6 5 4 I 1,797 1,694 103 Urban 26 24 2 60 54 6 5 4 I 1,797 1,694 103 Urban Bhisiana (CT)
18,819 15,033 3,786 10,408 7,598 2,810 672 423 249 9,575 4,566 5,009 Total Sangat 18,819 15,033 3,786 10,408 7,598 2,810 672 423 249 9,575 4,566 5,009 Rural
Urban 20,779 18,323 2,456 12,186 9,821 2,365 1,190 651 539 12,496 6,890 5,606 Total Talwandi Sabo 20,779 18,323 2,456 12,186 9,821 2,365 1,190 651 539 12,496 6,890 5,606 Rural
Urban 12,746 11,180 1,566 6,085 4,974 1,111 786 312 474 5,918 2,831 3,087 Total Maur 12,746 11,180 1,566 6,085 4,974 1,111 786 312 474 5,918 2,831 3,087 Rural
Urban URBAN
795 766 29 733 592 141 293 251 42 11,262 9,660 1,602 Urban Rampura Phul UA
795 766 29 733 592 141 293 251 42 11,262 9,660 1,602 Urban Rampura Phul (M CI+OO)
724 709 IS 452 394 58 288 247 41 10,938 9,421 1,517 Urban (i) Rampura Phul (Mel)
5 2 3 196 134 62 61 28 33 Urban (ii) Jawahar Nagar on Rampura-Bathinda Road (OG)
31 23 8 51 39 12 2 , 163 152 11 Urban (iii} Dashmesh Nagar on Rampura -Mehraj Road (OG)
35 32 3 34 25 9 3 3 100 59 41 Urban (iv) Outgrowth of Gandhi Nagar on Pitho Road (OG)
201

DISTRICT CENSUS HANDBOOK: BATHINDA
DISTRICT PRIMARY
Location District! CD Block! TotaV Industrial cate~o!!
code U .A.I City! Town RuraV
number Urban Marginal workers Cultivators Agricultural labourers
Persons Males Females Persons Males Females Persons Males Females
2 3 42 43 44 45 46 47 48 49 50
14 Bathinda Total 91,743 24,692 67,051 17,940 3,449 14,491 32,212 11,791 20,421 Rural 84,007 20,359 63,648 17,811 3,407 14,404 30,909 11,093 19,816 Urban 1,736 4,333 3,403 129 42 87 1,303 698 605
0001 Phul Total 15,290 3,812 11,478 2,298 585 1,713 5,151 1,968 3,183 Rural 15,254 3,789 11,465 2,298 585 1,713 5,142 1,964 3,178 Urban 36 23 13 9 4 5
41403000 Dashmesh Nagar on Urban 36 23 13 9 4 5 Rarnpura • Mehraj Road (00)· Ward No.19
0002 Rampura Total 9,933 2,344 7,589 2,605 582 2,023 3,000 1,089 1,911 Rural 9,933 2,344 7,589 2,605 582 2,023 3,000 1,089 1,911 Urban
41403000 Outgrowth of Gandhi Urban Nagar on Pitho Road (OG) • Ward No.20
0003 Nathana Total 8,452 3,068 .. 5,384 665 276 389 3,288 1,736 1,552 Rural 8,293 3,017 5,276 663 276 387 3,211 1,711 1,500 Urban 159 51 108 2 2 77 25 52
41403000 Jawahar Nagar on Urban 159 51 108 2 2 77 25 52 Rampura • Bathinda Road (OG) - Ward No.18
')-
0004 Bathinda Total 14,203 3,806 10,397 1,913 477 1,436 5,370 1,982 3,388
Rural 14,192 3,798 10,394 1,913 477 1,436 5,369 1,981 3,388
Urban II 8 3 I I 41402000 Bhisiana (CI) Urban II 8 3 I I 0005 Sangat Total 9,954 2,543 7,411 2,740 385 2,355 4,344 1,589 2,755
Rural 9,954 2,543 7,411 2,740 385 2,355 4.344 1,589 2,755
Urban 0006 Talwandi Saba Total 16,175 3,331 12,844 4,621 826 3,795 6,616 1,812 4,804
RUIllI 16,175 3,331 12,844 4,621 826 3,795 6,616 1,812 4,804
Urbl1l1 0007 Maur Total 10,206 1,537 8,669 2,971 276 2,695 3,227 947 2,280
Rural 10,206 1,537 8,669 2,971 276 2,695 3,227 947 2,280
Urban URBAN
50170000 RampuraPhul VA Urbl1l1 2,117 1,041 1,076 51 16 35 335 155 180
50170100 Rampura Phul (M Urban 2,117 1,041 1,076 51 16 35 335 155 180
CI+OG)
50170101 (i) Rampura Phul Urban 1,922 967 955 49 16 33 249 126 123
(MCI)
50170102 (ii) Jawahar Nagar Urban 159 51 108 2 2 77 25 52
on Rarnpura -Bathinda Road (OG)
50170103 (iii) Dashmesh Urban 36 23 13 9 4 5
Nagar on Rampura -Mehraj Road (OG)
50170104 (iv) Outgrowth of Urban Gandhi Nagar on Pitho Road (00)
202

PRIMARY CENSUS ABSTRACT
CENSUS ABSTRACT
of marginal workers TotaV District! CD Block! Location RuraV U.A.I Cityl Town code
Household industry Other workers Non-workers Urban number workers
Persons Males Females Persons Males Females Persons Males Females
51 52 53 54 55 56 57 58 ,59 3 2
5,201 584 4,617 36,390 8,868 27,522 682,628 283,581 399,047 Total Bathinda - 14 4,914 505 4,409 30,373 5,354 25,019 445,001 191,072 253,929 Rural
287 79 208 6,017 3,514 2,503 237,627 92,509 145,118 Urban 1,333 154 1,179 6,508 1,105 5,403 81,289 34,549 46,740 Total Phu1 0001 1.331 154 1,177 6,483 1,086 5,397 80,850 34,392 46,458 Rural
2 2. 25 ' 19 6 439 157 282 Urban 2 2 25 19 6 439 157 282 Urban Dashmesh Nagar on 41403000
Rampura • Mehraj Road (OG) - Ward No.19
441 63 378 3,887 610 3,277 47,835 21,107 26,728 Total Rampura 0002 441 63 378 3,887 610 3,277 47,647 21,028 26,619 Rural
188 79 109 Urban 188 79 109 Urban Outgrowth of Gandhi 41403000
Nagar on Pitho Road (OG) • Ward No.20
394 72 322 4,105 984, 3,121 72,731 29,573 43,158 Total Nathana 0003 392 71 321 4,027 959 3,068 72,392 29,395 42,997 Rural
2 I 78 25 53 339 178 161 Urban 2 1 78 25 53 339 178 161 Urban Jawahar Nagar on 41403000
Rampura - Bathinda Road (00) - Ward No.18
612 94 518 6,308 1,253 5,055 95,612 38,815 56,797 Total Bathinda 0004 611 93 518 6,299 1,247 5,052 92,736 37,762 54,974 Rural
I I 9 6 3 2,876 1,053 1,823 Urban I I 9 6 3 2,876 1,053 1,823 Urban Bhisiana (CT) 41402000
219 29 190 2,651 540 2,111 51,253 , '~2,746 28,507 Total Sangat 0005 219 29 190 2,651 540 2,111 51,253 22,746 28,507 Rural
Urban 817 61 756 4,121 632 3,489 66,538 29,648 36,890 Total Talwandi Sabo 0006 817 61 756 4,121 632 3,489 66,538 29,648 36,890 Rural
Urban 1,103 34 1,069 2,905 280 2,625 33,585 16,101 17,484 Total Maur 0007 1,103 34 1,069 2,905 280 2,625 33,585 16,101 17,484 Rural
Urban URBAN
103 28 75 1,628 842 786 29,465 11,382 18,083 Urban Rampura Phul UA 50170000 103 28 75 1,628 842 786 29,465 11,382 IS,083 Urban Rampura Phul (M 50170100
CI+OG)
99 27 72 1,525 798 721 28,499 10,968 17,531 Urban (i) Rampura Phul 50170101 (MCI)
2 78 25 53 339 178 161 Urban (ii) Jawahar Nagar 50170102 on Rampura-Bathinda Road (OG)
2 2 25 19 6 439 157 282 Urban (iii) Dashmesh 50170103 Nagar on Rampura • Mehraj Road (OG)
188 79 to9 Urban (iv) Outgrowth of 50170104 Gandhi Nagar on Pitho Road (OG)
203

DISTRICT CENSUS HANDBOOK: BATHINDA
APPENDIX TO DISTRICT PRIMARY CENSUS ABSTRACT TOTAL, SCHEDULED CASTES AND SCHEDULED TRIBES POPULATION - URBAN BLOCKWISE
Location Code Name of town Ward number Boundaries of Total Scheduled Scheduled urban block / EB population Castes Tribes
number population population
2 3 4 5 6 7
41403000 Rampura Phul (M CI+OG) Ward No. 1 EBNo.1 632 585
EB No.2 646 412
EB No.3 462 340
EBNo.4 593 307
Ward No. 2 EB No.5 559 22
EBNo.6 536 4
EB No.7 577
EB No.8 621 31
Ward No. 3 EB No.9 525 16
EBNo.1O 639 1
EB No. 11 388 6
EB No. 12 472 14
Ward No. 4 EB No. 13 616 123
EB No. 14 515 124
EB No. 15 634 119
EB No. 16 581 61
EB No. 17 701 ·282
EB No. 18 475 41
Ward No. 5 EB No. 19 646 44
EB No. 20 608 101
EB No. 21 626 89
EB No. 22 666 33
Ward No.6 EB No. 23 661 557
EB No. 24 676 580
EB No. 25 726 604
EB No. 26 600 316
EB No. 27 550 213
Ward No.7 EB No. 28 715 295
EB No. 29 520 47
EB No. 30 441 54
EB No. 31 565
Ward No.8 EB No. 32 445 287
EB No. 33 857 695
EB No. 34 520 108
EB No. 35 651 28
Ward No. 9 EB No. 36 525 184
EBNo.37 556 227
EB No. 38 589 .378
EBNo.39 505 434
Ward No. 10 EB No. 40 707 42
EB No. 41 606 26
EB No. 42 722 12
204

PRIMARY CENSUS ABSTRACT
APPENDIX TO DISTRICT PRIMARY CENSUS ABSTRACT
TOTAL, SCHEDULED CASTES AND SCHEDULED TRIDES POPULATION· URBAN BLOCKWISE
Location Code Name of town Ward number Boundaries of ,.. Total Scheduled Scheduled
urban block. / EB population Castes Tribes number population popuhltiotl
2 3 4 5 6 7
41403000 Rampura Phul (M Cl+OG) Ward No. 10 EB No. 43 723 35
EBNo.44 787 84
Ward No. 11 EB No. 45 725
EB No. 46 424 29
EBNo.47 475
EB No. 48 519 7
Ward No. 12 EBNo.49 . 530 184
EB No. 50 397 11
EBNo.51 515
EB No. 52 481
Ward No. 13 EBNo.53 615
EBNo.54 531 34
EBNo.55 640 40
EBNo.56 653
EB No. 57 519 64
Ward No. 14 EB No. 58 763 II
EB No. 59 664
EB No. 60 352
EB No. 61 508
EB No. 62 733 6
Ward No. 15 EB No. 63 600 58
EBNo.64 552
EBNo.65 539 74
Ward No. 16 EB No. 66 626 30
EB No. 67 645
EB No. 68 461
Ward No. 17 EB No. 69 607 60
EB No. 70 487 146
EB No. 71 711 402
EB No. 72 494 277
EB No. 73 692 88
Ward No. 18 EB No. 74 760 379
Ward No. 19 EBNo.75 722 85
Ward No. 20 EB No. 76 360 74 41401000 Gouiaua (M CI) Ward No. 1 EBNo.I 718 376
EB No.2 484 322
Ward No.2 EB No.3 621 372
EB No. 4,;- 364 344 Ward No. 1 EBNo.'5 465 . 41
EBNo.6 337 52
Ward No. 4 EBNo.7 420 ' 5
EBNo.8 504 180
205

DISTRICT CENSUS HANDBOOK: BATHINDA
APPENDIX TO DISTRICT PRIMARY CENSUS ABSTRACT
TOTAL, SCHEDULED CASTES AND SCHEDULED TRIBES POPULATION - URBAN BLOCKWISE
Location Code Name of town Ward number Boundaries of Total Scheduled Scheduled urban block I EB popUlation Castes Tribes
number population population
2 3 4 5 6 7
41401000 Goniana (M CI) Ward No.5 EB No.9 645 4 Ward No. 6 EB No. 10 502 24
EB No. II 565 24 Ward No.7 EB No. 12 547
EB No. 13 413 19 Ward No.8 EB No. 14 758 96
EBNo.15 579 106
Ward No. 9 EB No. 16 605 4
EB No. 17 638 42 Ward No. 10 EB No. 18 500 39
EB No. 19 636 42 Ward No. II EB No. 20 401 247
EB No. 21 499 370 Ward No. 12 EB No. 22 450 4 ,
EBNo.25 362
Ward No. 13 EB No. 23 416 116
EB No. 24 302 57
EB No. 26 82
. 41402000 Bhisiana (CT) Ward No. I EB No. I 551 287
EB No.2 165 56
EB No. 201 467 65
EB No. 202 438 95
EB No. 203 558 8
EB No. 204 520 4
EB No. 205 493 126
EB No. 206 526 40
EB No. 207 445
EB No. 208 612 2
41404000 Bhucho Mandi (M CI) Ward No. I EBNo.1 54 II
EB No.2 496 110
EB No.3 471 3
Ward No.2 EB No.4 423 22
EB No.5 559 39
EB No.6 48 19
Ward No.3 EB No.7 487
EB No.8 446 14
Ward No.4 EB No.9 424
EB No. 10 407
Ward No.5 EB No. II 442 352
EB No. 12 610 371
Ward No.6 EB No. 13 557 318
EB No. 14 534 218
206

PRIMARY CENSUS ABSTRACT
APPENDIX TO DISTRICT PRIMARY CENSUS ABSTRACT
TOTAL, SCHEDLLED CASTES AND SCHEDULED TRIBES POPULATION - URBAN BLOCKWISE
Location Cooe Nameoftown Ward number Boundaries of Total Scheduled Scheduled urban block ( EB population Castes Tribes
number population population 2 3 4 S 6 7
41404000 Bhucho Mandi (M el) Ward No. 7 EB No. 15 491 313 EB No .. 16 562 151
Ward No. 8 EBNorl7 803 541 Ward No. 9 EB No. 18 438
EB No. 19 370 Ward No. 10 EBNo.20 517 363
EBNo.21 532 289 Ward No. 11 EB No. 22 52& 347
EB No. 23 553 279 Ward No. 12 EB No. 24 753 116
EE No. 25 607 151 Ward No. 13 EB No. 26 573
EB No. 27 551 136 41405000 Bathinda (M CI) Ward t{o. 1 EB No. I 954 221
EB No.2 300 114
EB No.3 556 130 EB No.4 37& 78
EBNo.5 324 69 EB No.6 365 123
EB No. 101 887 255 EB No. 102 932 153
EB No~ 103 692 246 EB No. 104 486 58
EB No. 105 368 42
Ward No.2 EB No.7 517 5 EB No.8 611 125
EB No.9 515 68 EB No. 10 699 312
EBNo.11 602 32
Ward No.3 EBNo.1 756 133
EB No. 2 757 113
EB No.3 700 40
EBNo.4 602 55
EBNo.S 721 199
EBNo.6 568 73
EBNo.7 616 44
EBNo.8 605 105 EBNo, 9 • 451 162
EB No. 10 517 150
EBNo.ll 577
Ward No. 4 EBNo.12 635 91
EB No. 13 697 . 102
207

DISTRICT CENSUS HANDBOOK: BATHINDA
APPENDIX TO DISTRICT PRIMARY CENSUS ABSTRACT
TOTAL, SCHEDULED CASTES AND SCHEDULED TRIBES POPULATION - URBAN BLOCKWISE
Location Code Name of town Ward number Boundaries of Total Scheduled Scheduled urban block / EB population Castes Tribes
number population population
2 3 4 5 6 7
41405000 Bathinda (M el) Ward No.4 EBNo.14 705 n EBNo.15 620 III
EBNo.16 662 145
EBNo.17 1,054 152
EB No. 18 901 149
EBNo.19 635
EBNo.20 492 33 EB No. 21 482 53 EB No. 22 775 237
EB No. 23 571 134
EB No. 24 639 103
Ward No. 5 EB No. 25 692 60
EB No. 26 651 95
EB No. 27 644 235
EB No. 28 675 141
EB No. 29 602 69
EB No. 30 650 403
EB No. 31 717 10
EB No. 32 656 66 EB No. 33 495 41
EBNo.34 649 36
EB No. 35 517 268
Ward No.6 EB No. 36 566 11
EB No. 37 730 47
EB No. 38 736 31
EB No. 39 629 137
EB No. 40 687 95
EB No. 41 638 6
EB No. 42 800 203
EB No. 43 881 20
Ward No.7 EB No. 44 698 245
EB No. 45 849 319
EB No. 46 739 113
EB No. 47 690 383
EB No. 48 850 540
EB No. 49 579 347
EB No. 50 369 53
EB No. 51 1,332 522
Ward No. 8 EB No. 52 468 31
EB No. 53 359 24
EB No. 54 622 43
EB No. 55 694 295
208

PRIMARY CENSUS ABSTRACT
APPENDIX TO DISTRICT PRIMARY CENSUS ABSTRACT
TOTAL, SCHEDULED CASTES AND SCHEDULED TRIBES POPULATION - URBAN BLOCKWISE
Location Code Name of town Ward number Boundaries of Total Scheduled Scheduled urban block I EB population Castes Tribes
number population population
2 3 4 5 6 7
41405000 Bathinda (M CI) Ward No. 8 EB No. 56 469 18
EB No. 57 635 41 . .,. EB No. 51t 771 68 EB No. 59 656 35
EB No. 60 673 9
EB No. 61 638 36 EB No. 62 719 28
EB No. 63 699 32 EB No. 64 273 23
EB No. 65 1,087 41
EB No. 66 387 9 Ward No.9 EB No. 67 685 27
EB No. 68 710 21
EB No. 69 610 7
EB No. 70 758 10
EB No. 71 707
EB No. 72 773
EB No. 73 701 7
EB No. 74 620
EB No. 75 575 6
EB No. 76 582
Ward No. 10 EB No. 77 757 49
EB No. 78 779 72
EB No. 79 657 13
EB No. 80 652
EB No. 81 792 88
EB No. 82 589 42
EB No. 83 715 14
EB No. 84 668 2
EB No. 85 809 27
EB No. 86 703 23
Ward No. 11 EB No. 87 667 19
EB No. 88 542 42
EB No. 89 518 94
EB No. 90 677 454
EB No. 91 484 104
EB No. 92 616 346
EB No. 93 398 23
EBNo.94 460 5
EB No. 95 668
Ward No. 12 EBNo.96 678 26
EB No. 97 517 104
209

DISTRICT CENSUS HANDBOOK: BA THINDA
APPENDIX TO DISTRICT PRIMARY CENSUS ABSTRACT
TOTAL, SCHEDULED CASTES AND SCHEDULED TRIBES POPULATION - URBAN BLOCKWISE
Location Code Name of town Ward number Boundaries of Total Scheduled Scheduled urban block I EB population Castes Tribes
number population population 2 3 4 5 6 7
41405000 Bathinda (M CI) Ward No. 12 EBNo.98 490 171
EBNo.99 477 13
EBNo.100 514 32
EBNo.101 539 13 EBNo.102 731 19
EBNo.103 691
EBNo.l04 625 29 EB No. 105 644 10
EBNo.106 361 3
EBNo.107 575 135
EB No. 108 520 120
EBNo.109 469 88 EB No. 328 282 37
Ward No. 13 .. EBNo.11O 773 82
EBNo. III 548 31
EBNo. tl2 458 6S
EBNo.1I3 660 25
EBNo.114 700 89 Ward No. 14 EB No. 115 673 141
EB No. 116 551 191
EB No. 117 605 40
EBNo.118 713 III EB No. 119 653 M
EBNo.120 642 161
EB No. 121 673 6
EB No. 122 546 126
EB No. 123 565 79
Ward No. 15 EBNo.124 606 78
EB No. 125 735 129
EBNo.126 753 405
EBNo.127 733 350
EB No. 128 777 488
EBNo.129 649 476
EB No. 130 616 465
EBNo.131 597 168
EBNo.132 712 621
EBNo.133 650 637
Ward No. 16 EBNo.134 620 3
EBNo.135 590
EBNo.136 519 132
EB No. 137 487 77
EBNo.138 686 241
210

PRIMARY CENSUS ABSTRACT
APPENDIX TO DISTRICT PRIMARY CENSUS ABSTRACT
TOTAL, SCHEDULED CASTES AND SCHEDULED TRIBES POPULATION - URBAN BLOCKWISE
Location Code Name of town Ward number Boundaries of Total Scheduled Scheduled urban block { EB population . Castes Tribes
number population population
2 3 4 5 6 7
41405000 Bathinda (M CI) Ward No. 16 EBNo.139 664 119 EBNo.140 703
Ward No. 17 E~No.141 467 13 EB No. 142 574 69
EB No. 143 561 19 EB No. 144 534 280 EBNo.145 509 305 EB No. 146 479 147
EBNo.147 611 21 Ward No. 18 EBNo.148 563 40
EB No. 149 728 113
EBNo.150 629 192
EBNo.151 636 6 EB No. 152 640 26
EB No. 153 747 . 126
EB No. 154 730 55 EB No. 155 764
Ward No. 19 EB No. 156 646 8 EB No. 157 633 94
EB No. 158 612 295
EB No. 159 575 14
EB No. 160 691 II
EB No. 161 720 59
EB No. 162 780 14 EB No. 163 560
EB No. 164 467
Ward No. 20 EB No. 165 716
EB No. 166 634
EB No. 167 731 16
EB No. 168 729 3
EB No. 169 680
EB No. 170 645
EB No. 171 553
EB No. 172 636
Ward No. 21 EB No. 173 728 9
EBNo.174 752 55
EB No. 175 774 570
EB No. 176 667 . 371
EB No. 177 597 46
EB No. 178 711 62
EB No. J79 698
EB No. 180 617
211

DISTRICT CENSUS HANDBOOK: BATHINDA
APPENDIX TO DISTRICT PRIMARY CENSUS ABSTRACT
TOTAL, SCHEDULED CASTES AND SCHEDULED TRIBES POPULATION - URBAN BLOCKWISE
Location Code Name of town Ward number Boundaries of Total Scheduled SCheduled urban block I EB population Castes Tribes
number population population
2 3 4 5 6 7
41405000 Bathinda (M CI) Ward No. 22 EB No. 181 748 55 EB No. 182 478
EB No. 183 674 II
EB No. 184 675 32 EB No. 185 . 628 56
EB No. 186 515 45
EB No. 187 703 376 EB No. 188 535 292
EB No. 189 506 21 I
EB No. 190 617 183
Ward No. 23 EB No. 191 726
EB No. 192 564 IS
EB No. 193 469
EB No. 194 588
EB No. 195 463
EB No. 196 517
EB No. 197 480 5
EB No. 198 584 9 Ward No. 24 EB No. 199 547
EB No. 200 613
EB No. 201 742 101
EB No. 202 581 95
EB No. 203 395
EB No. 204 631 28 EB No. 205 688 to
EBNo.206 558 Ward No. 25 EB No. 207 535 528
EB No. 208 667 624
EB No. 209 929 230
EB No. 210 606 515
EBNo.211 683 496
EB No. 212 523 437
EB No. 213 690 214
EB No. 214 532 201
Ward No. 26 EB No. 215 533 208
EB No. 216 536 394
EB No. 217 452 154
EB No. 218 633 34
EB No. 219 526 74
EB No. 220 588 69
EB No. 221 554 93
EB No. 222 729 174
212

PRIMARY CENSUS ABSTRACT
APPENDIX TO DISTRICT PRIMARY CENSUS ABSTRACT
TOTAL, SCHEDULED CASTES AND SCHEDULED TRIBES POPULA nON - URBAN BLOCKWISE
Location Code Name of town Ward number Boundaries of Total Scheduled Scheduled urban block I EB population Castes Tribes
number '1- population population
2 3 4 5 6 7
41405000 Bathinda (M CI) Ward No. 26 EB No. 223 402 132 EB No. 224 811 259 EB No. 225 655 288
EB No. 226 708 373 Ward No. 27 EBNo.227 642 278 ,
EBNo.228 593 360
EB No. 229 680 350 EB No. 230 672 388
EB No. 231 692 322
EB No. 232 527 339 EB No. 233 657 221
EBNo.234 731 280 EB No. 235 745 469 EB No. 236 872 450 EBNo.237 752 625
Ward No. 28 EBNo.238 448 119
EBNo.239 557 190
EB No. 240 584 172
EB No. 241 607 196
EB No. 242 731 212
EBNo.243 440 68
EBNo.244 400 84
EB No. 245 534 301 EB No. 246 633 233
EB No. 247 631 253
EB No. 248 676 288
EB No. 249 721 371
Ward No. 29 EB No. 250 608 344
EB No. 251 518 244
EBNo.252 553 393
EBNo.253 606 389
EBNo.254 764 514
EBNo.255 772 288
EBNo.256 719 432
EB No. 257 627 553
EB No. 258 558 357
EB No. 259 689 443
EBNo.260 406 34
EBNo.261 561 9
EBNo.262 509
EBNo.263 311 40
EBNo.264 597 35
213

DISTRICT CENSUS HANDBOOK: BATHINDA
APPENDIX TO DISTRICT PRIMARY CENSUS ABSTRACT
TOTAL, SCHEDULED CASTES AND SCHEDULED TRIBES POPULATION - URBAN BLOCKWISE
Location Code Name of town Ward number Boundaries of Total Scheduled Scheduled urban block / EB population Castes Tribes
number population population
2 3 4 5 6 7
41405000 Bathinda (M CI) Ward No. 30 . EB No. 265 337 102 EB No. 266 678 100
EB No. 267 645 106 EB No. 268 803 151
EB No. 269 470 103
EB No. 270 684 160
EB No. 271 858 282
EBNo.272 625 123
EB No. 273 668 218
EB No. 274 577 121
EB No. 275 535 131
Ward No. 31 EB No. 276 601 91
EB No. 277 728 118
EB No. 278 660 90
EB No. 279 674 167
EB No. 280 741 161
EB No. 281 741 230
EB No. 282 686 46
EB No. 283 563 129
EB No. 284 884 239
EB No. 285 723 241
EB No. 286 570 91
Ward No. 32 EB No. 287 676 151
EB No. 288 627 31
EB No. 289 479 38
EB No. 290 629 119
EB No. 291 . 817 68
EB No. 292 696 84
EB No. 293 623 57
EB No. 294 856 228
EB No. 295 660 118
EB No. 296 675 S6
Ward No. 33 EB No. 297 603 97
EB No. 298 607 69
EB No. 299 54S 42
EB No. 300 716 147
EB No. 301 629 62
EB No. 302 599 138
EB No. 303 799 151
EB No. 304 749 174
EB No. 305 688 334
EB No. 306 660 166
214

PRIMARY CENSUS ABSTRACT
APPENDIX TO DISTRICT PRIMARY CENSUS ABSTRACT
TOTAL, SCHEDULED CASTES AND SCHEDULED TRIBES POPULATION - URBAN BLOCKWISE
Location Code Name of town Ward number Boundaries of Total Scheduled Scheduled urban block / EB popUlation Castes Tribes
number popUlation popUlation
2 3 4 5 6 7
41405000 Bathinda (M CI) Ward No. 33 EBNo.307 814 147 Ward No. 34 EDNo.308 895 349
EB No. 309 686 215
EB No. 310 661 103 EB No. 311 634 283
EB No. 312 780 483 EB No. 313 614 182
EB No. 314 558 97
EB No. 315 468 197
EB No. 316 434 46
Ward No. 35 EB No. 317 259
EB No. 318 580
EB No. 319 544 4
EB No. 320 360
EB No. 321 624
EB No. 322 715
EB No. 323 765 5
EB No. 324 782
EB No. 325 751
EB No. 326 808 77
EB No. 327 539 261 41406000 Sangat (M CI) Ward No. I EB No. I 452 207
it-Ward No.2 EB No.,2 430 38
Ward No.3 EB No.3 459 8
Ward No. 4 EB No.4 483 214
Ward No.5 EB No.5 495 247
Ward No. 6 EB No.6 526 197
Ward No. 7 EB No.7 503 55
Ward No.8 EB No.8 475 26
Ward No.9 EB No.9 591 519
Ward No. 10 EB No. 10 627 105
Ward No. II EBNo.11 360 58
41408000 Kot Fatta (M CI) Ward No. I EBNo.1 644 188
Ward No. 2 EB No.2 547 117
Ward No.3 EB No.3 451 285
Ward No. 4 EB No.4 484 218
Ward No.5 EB No.5 491 480
Ward No.6 EB No.6 448'. 398
EB No.7 441 402
Ward No.7 EB No.8 451 206
Ward No. 8 EB No.9 50r 113
Ward No. 9 EB No. 10 394 23
215

DISTRICT CENSUS HANDBOOK: BATHINDA
APPENDIX TO DISTRICT PRIMARY CENSUS ABSTRACT TOTAL, SCHEDULED CASTES AND SCHEDULED TRIBES POPULA TlON - URBAN BLOCK WISE
Location Code Name of town Ward number Boundaries of Total Scheduled Scheduled urban block / EB population Castes Tribes
number population population
2 3 4 5 6 7
41408000 Kot Fatta (M CI) Ward No. 10 EB No. 11 823 11
Ward No. 11 EB No. 12 829 250
41407000 Raman (M CI) Ward No. 1 EB No.1 513 84
EB No.2 543 536
EB No.3 504 504
Ward No. 2 EBNo ... 761 55
EB No.5 700 24
Ward No. 3 EB No.6 624 503
EBNo.7 500 384
EBNo.8 410 267
Ward No. 4 EBNo.9 694
EB No. 10 766 94
Ward No. 5 EB No. Jl 730
EB No. 12 569
Ward No. 6' EB No. 13 657
EB No. 14 621
Ward No. 7 EB No. 15 678 665
EB No. 16 315 139
EB No. 17 689 71
Ward No.8 EB No. 18 407
EB No. 19 573 10
EB No. 20 679 95
Ward No. 9 EB No. 21 540 48
EB No. 22 539 392
EB No. 23 521 255
Ward No. 10 EB No. 24 528 9
EB No. 25 604 76
EO No. 26 556 139
Ward No. 11 EB No. 27 643 244
EB No. 28 902 640
Ward No. 12 EO No. 29 840 112
EB No. 30 648 42
Ward No. 13 EBNo.31 499 64
EB No. 32 798 486 4140900() Maur (M el) Ward No. I EBNo.1 589 297
EB No.2 612 325
EBNo.3 641 640
Ward No.2 EB No.4 567 8
216

PRIMARY CENSUS ABSTRACT
APPENDIX TO DISTRICT PRIMARY CENSUS ABSTRACT
TOTAL, SCHEDULED CASTES AND SCHEDULED TRIBES POPULATION - URBAN BLOCKWISE
. Location Code Name of town Ward number Boundaries of Total Scheduled Scheduled
urban block r EB population Castes Tribes number population population
I 2 3 4 5 6 7
41400000 MaoT (M Cl) Ward No. 2 EBNo.5 514 78
EBNo.6 857 -261
Ward No. 3 J!B NO.7 795 365
EBNo.8 no 01
Ward No. 4 EBNo.9 635 92
ED No. I() 558
EB No. 11 805 21
Ward No. 5 EBNo.]2 71J5 346
EBNo.13 631 61
EB No. 14 585 14
Ward No.6 EB No.IS 638
EB NQ. 16 556
EB No. 17 401 13
Wa,dNo.7 EB No. 18 527 :,
EE No. 19 582 4
ED No. 20 67S 11
Ward No. 8 BBNo.21 764
ED No. 22 787 5
Ward No. 9 EB.No.23 743 519
EB No. 24 583 281
ED No. 25 485 207
Ward No. to EBNo.26 857 3S0
EBNo.27 810 435
Ward No. II EBNo.28 795 412
EBNo.29 (j77 4S9
EBND.30 (jgg 88
Ward No. 12 EBN().31 521 317
EO No. 32 618 441
EB No. 33 646 136
Ward No. :3 EBNo.34 613 lG2
EDNa. 35 447 139
EBNo.36 576 317
Ward No. 14 EBNo.37 986 819
EBNo.3i! 787 381 , Ward No. 15 EBNo.39 773 133
EBNo.40 940 106
EB No. 41 731 4
217

DISTRICT CENSUS HANDBOOK: BATHINDA
PRIMARY CENSUS ABSTRACT
Location District! CD Block! Town TotaU Number of
code RuraU households Total population (including Population in the
number Urban with at least institutional and houseless age-group 0-6
one population) Scheduled
Caste Persons Males Females Persons Males Females
2 3 4 5 6 7 8 9 10
14 Bathinda Total 63,510 354,652 J87,539 167,JJ3 55,674 29,828 25,846 Rural 48,754 271,891 143,756 128,135 43,418 23,103 20,315 Urban 14,756 82,761 43,783 38,978 12,256 6,725 5,531
0001 Phul Total 8,695 48,271 25,396 22,875 7,812 4,078 3,734 Rural 8,679 48,186 25,354 22,832 7,800 4,072 3,728 Urban 16 85 42 43 12 6 6
41403000 Das~mesh Nagar on Rampura . Urban 16 85 42 43 12 6 6 Mehraj Road (OG). Ward No.19
0002 Rampura Total 5,189 28,934 15,436 13,498 4,707 2,557 2,150 Rural 5,176 28,860 15,396 13,464 4,700 2,552 2,148 Urban 13 74 40 34 7 5 2
41403000 Outgrowth of Gandhi Nagar Urban 13 74 40 34 7 5 2 on Pitho Road (OG) - Ward No.20 .,..
0003 Nathana Total 6,824 38,200 20,179 • 18,021 5,802 3,080 2,722 Rural 6,747 ' 37,821 19,980 17,841 5,745 3,047 2,698 Urban 77 379 199 180 57 33 24
41403000 Jawahar Nagar on Rampura - Urban 77 379 199 180 57 33 24 Bathinda Road (OG)· Ward No.18
0004 Bathinda Tolal 11,189 61,481 32,543 28,938 9,512 5,087 4,425 Rural 11,046 60,798 32,181 28,617 9,407 5,023 4,384 Urban 143 683 362 321 105 64 41
41402000 Bhisiana (CT) Urban 143 683 362 321 105 64 41 0005 Sangat Total 6,133 34,332 18,049 16,283 5,655 2,995 2,660
Rural 6,133 34,332 18,049 16,283 5,655 2,995 2,660 Urban
0006 Talwandi SaOO TOlal 7,263 40,727 21,593 19,134 6,707 3,612 3,095 Rural 7,263 40,727 21,593 19,134 6,707 3,612 3,095 Urban
0007 Maur Total 3,710 21,167 11,203 9,964 3,404 1,802 1,602 Rural 3,710 21,167 11,203 9,964 3,404 1,802 1,602 Urban
URBAN 41403000 Rampura Phul (M CI+OG) Urban 1,836 10,020 5,310 4,710 1,571 861 704 41401000 Goniana (M CI) Urban 513 2,886 1,526 1,360 423 239 184 41402000 Bhisiana (CT) Urban 143 683 362 321 105 64 41 41404000 Bhucho Mandi (M CI) Urban 697 4,163 2,204 1,959 635 346 289 41405000 Balhinda (M Cll Urban 8,337 46,295 24,463 21,832 6,493 3,605 2,888 41406000 Sangal (M CI) Urban 292 1,674 869 80S 293 156 137 41408000 Kot Fatta (M el) Urban 501 2,691 1,447 1,244 402 217 185
41407000 Raman (M CI) Urban 994 5,938 3,135 2,803 972 505 467
41409000 Maur(MCI) Urban 1,443 8,411 4,467 3,944 1,362 726 636
218

PRIMARY CENSUS ABSTRACT
FOR SCHEDULED CASTES
Total! District! CD Block! Town
RuraV Literates Illiterates Total workers Urban
Persons Males Females Persons Males Females Persons Males Females
II 12 13 14 15 16 .17 1& 19 3 2
123,927 75,548 48,379 230,725 111,991 118,734 . 149,717 100,382 49,335 Total Bathinda 84,910 52,109 32,801 186,981 91,647 95,334 123,454 79,069 44,385 Rural 39,017 23,439 15,578 43,744 20,344 23,400 26,263 21,313 4,950 Urban 15,680 9,407 6,273 32,591 ' 15,989 16,602 22,179 13,908 8,271 Total Phu1 15,628 9,379 6,249 32,558 15,975 16,583 22,155 13,888 8,267 Rural
52 28 24 33 14 19 24 20 4 Urban 52 28 24 33 14 19 24 20 4 Urban Dashmesh Nagar on Rampura·
Mehraj Road (OG) - Ward No.19
8,965 5,544 3,421 19,969 9,892 10,077 13,336 8,481 4,855 Total Rampura 8,932 5,524 3,408 19,928 9,872 10,056 13,304 8,462 4,842 Rural
33 20 13 41 20 21 32 19 13 Urban 33 20 13 41 20 21 32 19 13 Urban Outgrowth of Gandhi Nagar
on Pitho Road (OG) - Ward No.20
13,256 8,021 5,235 24,944 12,158 12,786 15,725 10,775 4,950 Total Nathana 13,143 7,951 5,192 24,678 12~029 12,649 15,527 10,674 4,853 Rural
113 70 43 266 129 137 198 101 97 Urban 113 70 43 266 129 137 198 101 97 Urban Jawahar Nagar on Rampura -
I"
Bathinda Road (00) - Ward No.18
19,960 12,381 7,579 41,521 20,162 21,359 26,026 17,929 8,097 Total Bathinda 19,654 12,203 7,451 41.144 19,978 21,166 25,817 17,763 8,054 Rural
306 178 128 317 184 193 209 166 43 Urban 306 178 128 377 184 193 209 166 43 Urban Bhisiana (eT)
10,167 6,321 3,846 24,165 11,728 12,437 16,325 9,996 6,329 Total Sangat 10,167 6,321 3,846 24,165 1I,728 12,437 16,325 9,996 6,329 Rural
Urban 11,115 6,893 4,222 29,612 14,700 14,912 19,687 12,123 7,564 Total Talwandi Sabo 11,115 6,893 4,222 29,612 14,700 14,912 19,687 12,123 7,564 Rural
Urban 6,211 3,838 2,433 14,896 7,365 1,S31 10,639 6,163 4,476 Total Maur 6,271 3,838 2,433 14,896 7,365 7,531 10,639 6,163 4,476 . Rural
Urban URBAN
4,142 2,501 1,641 5,878 2,809 3,069 3,368 2,602 766 Urban Rampura Phul (M el+OG) 1,497 906 591 1,389 620 769 874 713 161 Urban Ooniana (M el)
306 178 128 377 184 193 209 166 43 Urban Bhisiana (eT) 1,841 1,132 709 2,322 1,072 1,250 1,417 1,101 316 Urban Bhucho Malldi (M CI)
24,315 14,419 9,896 21,980 10,044 11,936 14,040 11,619 2,421 Urban Bathindn (M e1) 459 258 201 1,215 611 604 491 468 23 Urban Sangat (M el)
1,046 651 395 1,645 796 849 931 759 172 Urban Kot Falta (M el) 2,232 1,414 818 3,706 1,721 1,985 2,029 1,630 399, Urban Raman (M CI) 3,179 1,980 1,199 5,232 2,487 2,745 2,904 2,255 649 Urban Maur(MCI)
219

DISTRICT CENSUS HANDBOOK: BATHINDA
PRIMARY CENSUS ABSTRACT
Location District! CD Block! Town Totall Industrial category code Rurall
number Urban Main workers Cultivators Agricultural labourers
Persons Males Females Persons Males Females Persons Males Females
2 3 20 21 22 23 24 25 26 27 28
14 Bathinda Total 111,363 86,968 24,395 5,425 4,438 987 61,204 49,575 11,629 Rural 88,457 67,544 20,913 5,236 4,262 974 58,711 47,362 11,349 Urban 22,906 19,424 3,482 189 176 13 2,493 2,213 280
0001 Phul Total 15,489 11,831 3,658 895 719 176 '10,287 8,115 2,172 Rural 15,472 11,815 3,657 895 719 176 10,286 8,114 2,172 Urban 17 16 1 I 1
41403000 Das~mesh Nagar on Rampura· Urban 17 16 Mehraj Road (OG) - Ward No.19
0002 Rampura Total 9,580 7,249 2,331 508 409 99 5,868 4,598 1,270 Rural 9,548 7,230 2,318 508 409 99 5,847 4,584 1,263 Urban 32 19 13 21 14 7
41403000 Outgrowth of Gandhi Nagar Urban 32 19 13 21 14 7 on Pitho Road (OG)· Ward No.20
0003 Nathana Total 11,702 8,910 2,792 619 549 70 6,335 5,589 746 Rural 11,574 '8,826 2,748 618 548 70 6,232 5,514 718 Urban 128 84 44 I I !O3 75 28
41403000 lawahar Nagar on Rampura - Urban 128 84 44 103 75 28 Bilthinda Road (OG) - Ward No.18
0004 Bathinda Total 19,457 15,672 3,785 831 651 180 13,296 11,142 2,154 Rural 19,251 15,508 3,743 831 651 180 13,242 11,093 2,149 Urban 206 164 42 54 49 5
41402000 Bhisiana (CT) Urban 206 164 42 54 49 5
0005 Sangat Total 11,826 8,395 3,431 .1,117 872 245 8.460 6,178 2,282 Rural 11,826 8,395 3,431 1,117 872 245 8.460 6,178 2,282 Urban
0006 Talwandi Sabo Total 13,620 10,483 3.137 907 755 152 9,638 7,764 1,874 Rural 13,620 10,483 3.137 907 755 152 9,638 7,764 1,874 Urban
0007 Maur Total 7,166 5,287 1.879 360 308 52 5,006 4,115 891 Rural 7,166 5,287 1.879 360 308 52 5,006 4,115 891 Urban
URBAN 41403000 Rampura Phu1 (M CI+oo) Urban 2,498 2,115 383 26 25 370 309 61 41401000 Goniana (M CI) Urban 814 672 142 1 95 77 18
41402000 Bhisiana (CT) Urban 206 164 42 54 49 5
41404000 Bhucho Mandi (M CI) Urban 1,289 1,037 252 59 55 4
41405000 Bathinda (M CI) Urban 12,736 10,760 1,976 36 28 8 388 315 73 41406000 Sangat (M CI) Urban 460 442 18 4 4 31 I 304 7
41408000 Kot Fatta (M el) Urban 646 619 27 66 65 322 317 5
41407000 Raman(MCl) Urban 1,812 1,521 291 22 20 2 445 372 73
41409000 Maur(M CI) Urban 2,445 2,094 351 34 33 I 449 415 34
220

PRIMARY CENSUS ABSTRACT
FOR SCHEDULED CASTES
of main workers Total! District! CD Block! Town
RuraV
Household industry workers Other workers Marginal workers Urban
Persons Males Females Persons Males Females Persons Males Females
29 30 31 32 33 34 35 36 37 3 2·
2.234 1,233 1,001 42,500 31,722 10,778 38,354 13,414 24,940 Total Bathinda 1.817 951 866 22,693 14,969 7,724 34,997 11,525 23,472 Rural
417 282 135 19,807 16,753 3,054 3,357 1,889 1,468 Urban 444 234 210 3,863 2,763 1,100 6,690 2,077 4,613 Total Phul 444 234 210 3,847 ,2,748 1,099 6,6&3 2,073 4,6\0 Rural
16 15 1 7 4 3 Urban 16 15 7 4 3 Urban Dashmesh Nagar on Rampura .
Mehraj Road (OG) - Ward No.19
132 56 76 3,072 2,186 886 3,756 1,232 2,524 Total Rampura 132 56 76 3,061 2,181 880 3,756 1,232 2,524 Rural
11 5 6 Urban II 5 6 Urban Outgrowth of Gandhi Nagar
on Pitho Road (OG) - Ward No.20
237 151 86 4,511 2,621 1,890 4,023 1,865 2,158 Total Nathana 237 151 86 4,487 2,~13 1,874 3,953 1,848 2,105 Rural
24 8 16 70 17 53 Urban 24 & 16 70 17 53 Urban Jawahar Nagar on Rampura •
Bathinda Road (OG) - Ward No.18
403 239 164 4,927 3,640 1,287 6,569 2,257 4,312 Total Bathinda 403 239 164 4,775 3,525 1,250 6,566 2,255 4,311 Rural
152 115 37 3 2 I Urban 152 115 37 3 2 I Urban Bhisiana (CT)
121 76 45 2,128 1,269 859 4,499 1,601 2,898 Total Sangat 121 76 45 2,128 1,269 859 4,499 1,601 2,898 Rural
Urban 268 137 131 2,807 1,827 980 6,067 1,640 4,427 Total Talwandi Sabo 268 137 131 2,807 1,827 980 6,067 1,640 4,427 Rural
Urban 212 58 154 1,588 806 782 3,473 876 2,597 Total Maur 2\2 58 \54 \,588 806 182 3,473 876 2,597 Rural
Urban URBAN
42 38 4 2,060 1,743 317 870 487 383 Urban Rampura Phul (M CI+OG) 37 24 13 681 570 111 60 41 19 Urban Goniana (M CI)
152 115 37 3 2 I Urban Bhisiana (CT) 11 9 2 1,219 973 246 128 64 64 Urban Bhucho Mandi (M CI)
240 154 86 12,072 10,263 1,809 1,304 859 445 Urban Bathinda (M CI) 6 5 I 139 129 10 31 26 5 Urban Sangat (M CI)
13 12 1 245 225 20 285 140 145 Urban Kot Fatta (M CI) 37 2S 12 1,308 1,104 204 217 109 108 Urban Raman(MCI) 31 15 16 1,931 1,631 300 459 161 298 Urban Maur(MCI)
221

DISTRICT CENSUS HANDBOOK: BATHINDA
PRIMARY CENSUS ABSTRACT
Location District! CD Block! Town TotalJ Industrial category code RuralJ
number Urban Cultivators AgricuJturiil labourers Household industry
workers
Persons Males Females Persons Males Females Persons Males Females
2 3 38 39 40 41 42 43 44 45 46
14 Bathinda Total 980 336 644 15,301 9,289 16,011 1,210 197 1,023 Rural 962 333 629 14,515 8,931 15,583 1,172 185 987 Urban 18 3 15 .786 357 429 48 12 36
0001 Phul Total 204 83 121 4,240 1,534 2,706 328 62 266 Rural 204 83 121 4,240 1,534 2,706 327 62 265 Urban
41403000 Da"hmesh Nagar on Rampura· Urban Mehraj Road (00) - Ward No.19
0002 Rampura Total 85 29 56 2,479' 910 1,569 68 13 55 Rural 85 29 56 2,479 910 1,569 68 13 55 Urban
41403000 Outgrowth ofOandhi Nagar Urban on Pitho Road (00) - Ward No.20
0003 Nathana Total 140 61 79 2,815 1,478 1,337 97 34 63 Rural 138 " 61 77 2,783 1,470 1,313 97 34 63 Urban 2 2 32 8 24
41403000 lawahar Nagar on Rampura - Urban 2 2 32 8 24 Bathinda Road (00) - Ward No.18
0004 Bathinda Total 140 52 88 4,232 1,595 2,637 159 34 125 Rural 140 52 88 4,23h- 1,594 2,637 159 34 125 Urban 1 I
41402000 Bhisiana (CT) Urban I I 0005 Sangat Total 198 53 145 3,541 1,314 2,227 50 II 39
Rural 198 53 145 3,541 1,314 2,227 50 II 39 Urban
0006 Talwandi Sabo Total 104 37 67 4,882 1,378 3,504 187 19 168 Rural 104 37 67 4,882 1,378 3,504 187 19 168 Urban
0007 Maur Total 93 18 75 2,359 732 1,627 284 12 272 Rural 93 18 75 2,359 732 1,627 284 12 272 Urban
URBAN 41403000 Rampura Phul (M CI+OO) Urban 10 9 166 82 84 10 2 8 41401000 Ooniana eM CI) Urban 2 I 41402000 Bhisiana (CT) Urban I 41404000 Bhucho Mandi eM CI) Urban I I 41405000 Bathinda (M el) Urban 3 2 76 65 II 35 10 25
41406000 Sangat eM C1) Urban 19 18 I
41408000 Kot Fatta (M CI) Urban 238 119 119
41407000 Raman (M CI) Urban 75 5 70
41409000 Maur(MCI) Urban 2 2 209 66 143
222

~CENSUSABSTRACT
liC)1t S~DULED CASTES
of marsinal workers Total! District! CD Block! Town Location RuraV code
Non-workers Urban number bther workers
Persons Males Females Persons Males Females
47 48 49 50 51 52 3 2
10,853 3,592 7,261 204,935 87,157 117,778 Total Bathinda 14 8,348 2,075 6,273 148,437 64,687 83,750 Rural 2,505 1,517 988 56,498 22,470 34,028 Urban 1,918 398 1,520 26,092 11,488 14,604 Tolal Phul 0001 1,9'12 394 ' 1,518 26,0'31 11,466 14,565 Rural
6 4 2 61 22 39 Urban 6 4 2 61 22 39 4£ban Dashmesh Nagar on Rampura-41403000
Mehraj Road (OG) - Ward No.19
1,124 280 844 15,598 6,955 8,643 Total Rampura 0002 1,124 280 844 15,556 6,934 8,622 Rural
42 21 21 Urban 42 21 21 Urban Oulgrowth of Gandhi Nagar 41403000
on Pitho Road (OG) - Ward No.20
971 292 679 22,475 9,404 13,071 Tolal Nalhana 0003 935 283 652 22,294
.. 9,306 12,988 Rural
36 9 27 181 98 83 Urban 36 9 27 181 98 83 Urban Jawahar Nagar on Rampura- 41403000
Bathinda Road (OG) - Ward No.18
2,038 576 1,462 35,455 14,614 20,841 Total Bathinda 0004 2,036 575 1,461 34,981 14,418 20,563 Rural
2 I I 474 196 278 Urban 2 I 1 474 196 278 Urban Bhisiana (eT) 41402000
710 223 487 18,007 8,053 9,954 Total Sangat 0005 710 223 487 18,007 8,053 9,954 Rural
Urban 894 206 688 21,040 9,470 11,570 Total Talwandi Sabo 0006 894 206 688 21,040 9,470 11,570 Rural
Urban 737 114 623 10,528 5,040 5,488 Tolal Maur 0007 737 114 623 10,528 5,040 5,488 Rural
Urban URBAN
684 402 282 6,652 2,708 3,944 Urban Rampura Phul (M el+OG) 41403000 57 39 18 2,012 813 1,199 Urban Goniano (M el) 41401000 2 I I 474 196 278 Urban Bhisiana (eT) 41402000
127 64 63 2,746 1,103 1,643 Urban Bhucho Mandi (M el) 41404000 1,190 783 407 32,255 12,844 19,411 Urban Bathinda (M el) 41405000
12 8 4 1,183 401 782 Urban Sangat (M el) 41406000 45 21 24 1,760 688 1,072 Urban Kot Falla (M ell 41408000
141 104 37 3,909 1,505 2,404 Urban Raman (M el) 41407000 247 95 152 5,507 2,212 3,295 Urban Maur(MCI) 41409000
223

DISTRICT CENSUS HANDBOOK: BATHINDA
VILLAGE PRIMARY CD Block-
Total population (including
Location Area of institutional and houseless Population in the
code Village in Number of EOEulation} age-BEouE 0-6 number Name ofVillase . hectares households Persons Males Females Persons Males Females
I 2 3 4 5 6 7 8 9 10
0001 Phul (Total) 54,408.0 25,109 148,034 78,135 69,899 19,238 10,592 8,646 0001 Phul (Rural) 54,408.0 24,977 147,312 77,740 69,572 19,128 10,544 8,584 0001 Phul (Urban) 132 722 395 327 110 48 62
Phul (Rural) 01036500 Neor 515.0 291 1,738 900 838 246 138 108 01036600 Maluka 2,093.0 1,036 6,069 3,237 2,832 727 413 314 01036700 KothaGuru 3,078.0 1,544 8,915 4,688 4,227 1,101 613 488 01036800 Bury Thror 331.0 243 1,477 782 695 180 101 79
01036900 Siriewala 1,295.0 755 4,675 2,453 2,222 613 332 281 01037000 Burj Ladha Singhwala 608.0 332 1,936 1,017 919 253 146 107 01037100 Bhagta 2,163.0 2,038 11,809 6,268 5,541 1,437 798 639 01037200 Kesar Singhwala 401.0 208 1,235 631 604 145 73 72 01037300 Bhodipllra 1,019.0 537 3,179 1,646 1,533 425 209 216
01037400 Ramuwala 468.0 262 1,585 843 742 219 119 100 01037500 Hakam Singhwala 465.0 247 1,547 818 729 214 123 91 01037600 Koer Singhwala 583.0 223 1,395 713 682 181 94 87 01037700 AkliaJalal 1,117.0 505 2,944 1,576 1,368 393 222 171 01037800 Gurusar 706.0 372 2,193 1;146 1,047 295 166 129 01037900 Hamirgarh 837.0 465 2,981 1,562 1,419 448 238 210 01038000 Jalal 2,014.0 1,006, 5,904 3,126 2,778 709 384 325 01038100 Dyalpura Bhaika 2,042.0 825 4,554 2,422 2,132 629 354 275 01038200 Gaunspura 363.0 107 651 333 318 107 57 50
01038300 Kangar 686.0 316 1,953 Iml 922 283 143 140
01038400 Salabatpura 565.0 315 1,832 945 887 223 121 102
01038500 Adampura 586.0 317 1,917 997 920 258 150 108
01038600 Rajgarh 667.0 251 1,554 835 719 206 III 95 01038700 Dulewala 640.0 376 2,231 1,160 1,071 367 198 169
01038800 Bhai Rupa 4,567.0 2,232 13,294 6,996 6,298 1,863 1,030 833
01038900 Gumti Kalan 2,025.0 854 5,367 2,810 2,557 618 323 295
01039000 Dayafpura Mirza 2,f62.0 832 4,609 2,420 2,189 566 302 264
01039100 Selbrah 1,539.0 801 4,637 2,466 2,171 637 343 294
01039200 Kauloke 353.0 159 876 445 431 85 47 38
01039300 Burj Gill 528.0 388 2,127 1.120 1,007 261 lSI 110
01039400 Dhapali 2,485.0 927 5,654 2,973 2,681 723 399 324
01039500 Ghandawna 837.0 433 2,569 1,385 1,184 308 171 137
01039600 Sandhu Khurd 424.0 234 1,388 729 659 201 110 91
01039700 Phulwal 657.0 337 1,924 1,058 866 244 134 110
01039800 Raiya UrfHardaspura 1,399.0 657 4,053 2,119 1,934 569 327 242
01039900 Dhingar 385.0 207 1,379 738, .,..
641 140 81 59 01040000 Allike 604.0 367 2,057 1,095 962 260 130 130
01040100 Chotian 409.0 275 1,625 888 737 197 117 80
01040200 Bugran 490.0 317 1,836 944 892 250 \31 119
01042900 Patti Karam Chand Mehraj 2,163.0 939 5,334 2,869 2,465 633 351 282
01043400 Burj Mansa 294.0 175 991 528 463 113 69 44
01043500 Phul (Rural) 3,560.0 172 1,076 575 501 136 76 60
01043600 Hamam Singhwala 595.0 190 1,146 618 528 223 127 96
01043700 Sadhana 679.0 331 1,921 1,036 885 254 145 109
01043800 Patti Sandli Mehraj 1,230.0 381 2,360 1,200 1,160 322 171 151
01043900 Patti Saol Mehraj 1,362.0 638 3,618 1,927 1',691 439 258 181
01044000 Patti Kala Mehraj 2,419.0 560 3,197 1.672 1,525 427 248 179
Phul (Urban)
41403000 Dashmesh Nagar on 132 722 395 327 no 48 62
Rampura - Mehraj Road OG - Ward No.19
224

PRIMARY CENSUS ABSTRACT
CENSUS ABSTRACT Phul
Scheduled Castes eOEuation Scheduled Tribes eoeulation Literates Persons Males Females Persons Males Females Persons Males Females Name ofVilla~e
II 12 13 14 . 15 16 17 18 19 2
48,271 25,396 22,875 72,782 -41,474 31,308 Phul (Total) 48,186 25,354 22,832 72,419 41,245 . 31,174 Phul (Rural)
85 42 43 363 229 134 Phul (Urban) Phul (Rural)
711 369 342 926 525 401 Neor 2,366 1,284 1,082 2,971 1,751 1,220 Maluka 2,522 1,303 1,219 4,478 2,528 1,950 KothaGuru
581 307 274 861 500 361 Burj Thror 2,086 1,094 992 2,200 1,255 945 Siriewala 1,205 631 574 883 527 356 BUlj Ladha Singhwala 3,148 1,678 1,470 6,600 3,697 2,903 Bhagta
621 316 305 758 438 320 Kesar Singhwa1a 1,032 530 502 1,475 836 639 Bhodipura
367 185 182 930 549 381 Ramuwala 445 247 198 794 443 351 Hakam Singhwala 342 183 159 874 471 403 Koer Singhwala 668 348 320 1,455 850 605 AkliaJalal 320 159 161 1,118 608 510 Gurusar
1,168 633 535 1,336 752 584 Hamirgarh 2,173 1,136 1,037 2,982 1,664 1,318 Jalal 1,735 915 820 2,098 1,205 893 Dyalpura Bhaika
219 III 108 378 210 168 Gaunspura 886 466 420 973 564 409 Kangar 466 230 236 1,059 593 466 Salabatpura 654 338 316 895 496 399 Adampura 757 414 343 736 414 322 Rajgarh 803 406 397 1,034 593 441 Dulewala
3,246 1,725 1,521 6,681 3,700 2,981 Bhai Rupa 1,316 671 645 2,732 1,523 1,209 Gumti Kalan 1,776 931 845 2,096 1,177 919 Daya1pura Mirza 1,600 838 762 2,352 1,383 969 Selbrah
149 77 72 503 284 219 Kauloke 961 501 460 883 521 362 Burj Gill
1,335 700 635 2,660 1,491 1,169 Dhapali 869 445 424 1,172 672 500 Ghandawna
269 150 119 791 468 323 Sandhu Khurd 664 360 304 910 543 367 Phulwal
887 480 407 1,748 966 782 Raiya Urf Hardaspura 374 197 177 708 415 293 Dhingar
880 443 437 905 533 372 All ike
435 226 209 733 449 284 Chotian 714 358 356 876 511 365 Bugran
1,969 1,049 920 2,416 1,428 9BB Patti Karam Chand Mehraj 187 101 86 542 330 212 Burj Mansa 166 93 73 589 352 237 Phu1 (Rural)
980 529 451 t,..
399 258 141 Hamam Singhwala 693 376 317 859 527 332 Sadhana
782 399 383 1,077 574 503 Patti Sandli Mehraj
1,262 678 584 1,685 938 747 Patti Saol MehTaj
1,397 744 653 1,288 733 555 Patti Kala Mehraj Phul (Urban)
85 42 43 363 229 134 Dashmesh Nagar on Rampura - Mehraj Road OG - Ward No.19
225

DISTRICT CENSUS HANDBOOK: BATHINDA
VILLAGE PRIMARY C DBlock-
Location
code Illiterates Total workers Main workers number Name of Village Persons Males Females Persons Males Females Persons Males Females
1 2 20 21 22 23 24 25 26 27 28
0001 Phul (Total) 75,252 36,661 38,591 66,745 43,586 23,159 51,455 39,774 1l,681 0001 Phul (Rural) 74,893 36,495 38,398 66,462 43,348 23,114 51,208 39,559 11,649 0001 Phul (Urban) 359 166 193 283 238 45 247 215 32
Phul (Rural) 01036500 Neor 812 375 437 733 477 256 578 445 133 01036600 Maluka 3,098 1,486 1,612 2,782 1,739 1,043 2,481 1,667 814 01036700 KothaGuru 4,437 2,160 2,277 3,429 2,604 825 2,771 2,364 407 01036800 Burj Thror 616 282 334 682 407 275 422 389 33 01036900 Siriewala 2,475 1,198 1,277 2,618 1,441 1,177 1,794 1,255 539 01037000 Burj L:ldha Singhwala 1,053 490 563 1,135 627 508 822 570 252 01037100 Bhagta 5,209 2,571 2,638 4,118 3,226 892 3,295 2,818 477 01037200 Kesar Singhwala 477 193 284 463 299 164 393 282 III 01037300 Bhodipura 1,704 810 894 1,019 905 114 954 890 64 01037400 Ramuwala 655 294 361 729 425 304 552 371 181 01037500 Hakam Singhwala 753 375 378 757 438 319 429 375 54 01037600 Koer Singhwala 521 242 279 459 396 63 421 389 32 01037700 AkliaJala1 1,489 726 763 1,316 Itt 7 499 1,042 796 246 01037800 Gurusar 1,075 538 537 1,146 '648 498 1,082 632 450 01037900 Hamirgarh 1,645 810 835 1,500 833 667 1,050 767 283 01038000 lalal 2,922 1,462 .. 1,460 3,110 1,816 1,294 1,941 1,434 507 01038100 Dyalpura Bhaika 2,456 1,217 1,239 1,542 1,277 265 1,218 1,113 105 01038200 Gaunspura 273 123 150 372 226 146 315 188 127 01038300 Kangar 980 467 513 969 558 411 609 492 117 01038400 Salabatpura 773 352 421 894 558 336 525 401 124 01038500 Adampura 1,022 501 521 809 538 271 620 514 106 01038600 Rajgarh 818 421 397 852 529 323 567 501 66 01038700 Dulewala 1,197 567 630 1,282 663 619 611 604 7
01038800 Bhai Rupa 6,613 3,296 3,317 6,049 3,916 2,133 5,319 3,784 1,535 01038900 Gumti Kalan 2,635 1,287 1,348 3,126 1,695 1,431 2.928 1.638 1,290 01039000 Dayalputa Mirza 2,513 1,243 1,270 2,240 1,429 811 1.679 1,331 348 01039100 Selbrah 2.285 1,083 1,202 2,003 1,372 631 1.251 1.153 98
01039200 Kauloke 373 161 212 369 259 110 367 257 110
01039300 Burj Gill 1,244 599 645 943 679 264 830 668 162
01039400 Dhapali 2,994 1,482 1,512 2,492 1,705 787 1,587 1,496 91
01039500 Ghandawna 1,397 713 684 1,092 785 307 782 694 88
01039600 Sandhu Khurd 597 261 336 621 365 256 560 351 209
01039700 Phulwal 1,014 515 499 892 563 329 675 495 180
01039800 Raiya UrfHardaspura 2,305 1,153 1,152 1,727 1,204 523 1,192 1,122 70
01039900 Dhingar 671 323 348 582 400 182 325 302 23
01040000 All ike 1,152 562 590 1,071 633 438 830 587 243
01040100 Chotian 892 439 453 684 497 187 410 400 JO
01040200 Bugran 960 433 527 751 540 211 611 504 107
01042900 Patti Karam Chand Mehraj 2.918 1,441 1,477 2,277 1,616 661 1,977 1,552 425
01043400 Burj Mansa 449 198 251 523 317 206 377 302 75
01043500 Phul (Rural) 487 223 264 369 313 56 320 306 14
01043600 Hamam Singhwala 747 360 387 400 310 90 306 295 11
01043700 Sadhana 1,062 509 553 953 571 382 567 534 33
01043800 Patti Sandli Mehraj 1,283 626 657 1,192 709 483 1,024 681 343
01043900 Patti Saol Mehraj 1,933 989 944 1,670 1,051 619 1,376 1,005 371
01044000 Patti Kala Mehraj 1.909 939 970 1,720 972 748 1,423 845 578
Phul (Urban) 41403000 Dashmesh Nagar on 359 166 193 283 238 45 247 215 32
Rampura - Mehraj Road OG - Ward No.19
226

PRIMARY CENSUS ABSTRACT
CENSUS ABSTRACT Phul
Industrial category of main workers Household industry
Cultivators Agricultural labourers workers Other workers Persons Males Females Persons Males Females Persons Males Females Persons Males Females Name of Village
29 30, 31 32 33 ' 34 35 36 37 38 39 40 2
21,483 21,452
31
194 1,045 1,180
202 488 228 966 103 454 248 237 249 545 597 469 917 545 106 179 217 268 214 3?2
2,004 1,065
597 622 182 377 907 328 305 262 713 203 346 309 260 942 190 254
42 285 418 481 377
31
19,204 19,181
23
181 735
1,106 197 435 201 909 101 436 243 218 233 506 417 323 726 526 90
170 212 266 199 331
1,635 914 570 603 170 334 876 309 225 241 690 196 323 303 248 841 184 247
42 279 389 446 355
23
2,279 2,271
8
13 310
74 5
53 27 57
2 18 5
19 16 39
180 146 191
19 16 9 5 2
15 1
369 151 27 19 12 43 31 19 80 21 23
7 23 6
12 101
6 7
6 29 35 22
8
12,454 , 12,403
51
157 868 607
91 814 441 562
91 289
63 50 91
247 251 398 409 307
63 309 34 60
308 178
1,158 215 502 297
66 217 256 230 102 183 305
19 355 29
136 410 29 13
227 171 270 334 191
51
9,879 9,840
39
145 539 529 , 84
476 286 510
90 272
53 47 88
215 141 298 349 296 45
217 34 53
272 175 856 152 479 286
40 181 238 212
63 160 287
18 192 27
122 312 28 12
218 160 182 229 172
39
2,575 2,563
12
12 329
78 7
338 155 52
I 17 10 3 3
32 JlO 100
~ 60 II 18 92
7 36
3 302
63 23 11 26 36 18 18 39 23 18 1
163 2
14 98
1 1 9
II 88
105 19
12
1,919 1,917
2
18 109 118
12 33
3 203
7 31 12 7 6 3 9
27 43 21 10 3
16 30
4 13
350 395
27 37 2
52 106
13 29 24 10 7
16 7 2
II 1
14 4 2 4
22 44
2
923 922
II 69 69 10
10 I
153 4
17 7 4 5 3 2
20 25 20
3
15 27
13 87 75 21 29
1 28 83 11 II 8 9 6 3 7 2 5 I
12 ' 4 2
4 16 8
227
996 995
7 40 49 2
23 2
50 3
14 5
3
7 7
18 1 7 2 1 3 4
263 320
6 8
24 23
2 18 16
13
6 'I" -
2
6 36
15,599 15,436
163
209 459 866 117 459 ISO
1,564 192 180 229 135 75
247 225 156 572 345 136 118 258 262
41 88
1,807 1,253
553 295 117 184 318 211 124 206 164 96
113 65
213 614 157 39 33
109 332 539 811
163
9,768 9,616
152
108 324 660 98
334 82
1,246 87
165 68
106 63 72 72
126 334 271 50
104 140 168 30 85
1,206 497 261 235
46 125 299 162 52 86
136 82 69 63
132 394
89 35 31 93
106 314 310
152
5,831 Phul (Total)' 5,820 Phul (Rural~
II Phul (Urban) Phul (Rural)
101 Neor 135 Maluka 206 Kotha Guru
19 8urj Thror 125 Siriewala 68 Burj Ladha Singhwa1a
318 Bhagta 105 Kesar Singhwa1a
1 5 Bhodipura 161 Ramuwala 29 Hakam Singhwala 12 Koer Singhwala
175 Ak1ialalal 153 Gurusar 30 Hamirgarh
238 Jalal 74 Dyalpura Bhaika 86 Gaunspura 14 Kangar
118 Sal~batpura
94 Adampura II Rajgarh 3 Dulewala
601 Bhai Rupa 756 Gumti Kal~n 292 Dayalpura Mirza
60 Selbrah 71 Kauloke 59 Burj Gill 19 Dhapali 49 Ghandawna 72 Sandhu Khurd
120 Phulwal 28 Raiya UTfHardaspura 14 Dhingar 44 Allike
2 Chotian 81 Bugran
220 Patti Karam Chand MehTaj 68 Burj Mansa
4 Phul (Rural) 2 Hamam Singhwala
16 Sadhana 226 Patti Sand Ii Mehraj 225 Patti Saol Mehraj 50 I Patti Kala Mehraj
Phul (Urban) 11 Dashmesh Nagar on
Rampura - Mehraj Road OG - Ward No.19

DISTRICT CENSUS HANDBOOK: BATHINDA
VILLAGE PRIMARY C DBlock-
Location Industrial categ0!l:
code Mar~inaI workers Cultivators A~iculturallabourers number Name ofViIla~e Persons Males Females Persons Males Females Persons Males Females
1 2 41 42 43 44 45 46 47 48 49
0001 Phul (Total) 15,290 3,812 11,478 2,298 585 1,713 5,151 1,968 3,183 0001 Phul (Rural) 15,254 3,789 11,465 2,298 585 1,713 5,142 1,964 3,178 0001 Phul (Urban) ~6 23 13 9 4 5
Phul (Rural) 01036500 Neor 155 32 123 10 7 3 ·22 19 3 01036600 Maluka 301 72 229 49 4 45 139 48 91 01036700 KothaGuru 658 240 418 118 63 55 140 96 44 01036800 Burj Thror 260 18 242 8 5 3 8 3 5 01036900 Siriewala 824 186 638 113 39 74 290 131 159 01037000 Burj Ladha Singhwala 313 57 256 20 13 7 168 34 134 01037100 Bhagta 823 408 415 33 14 19 346 210 136 01037200 Kesar Singhwala 70 17 53 6 6 4 2 01037300 Bhodipura 65 15 50 11 8 3 8 3 5 01037400 Ramuwala 177 54 123 17 10 7 56 32 24 01037500 Hakam Singhwala 328 63 265 170 2 168 133 61 72 01037600 Koer Singhwala 38 7 31 6 1 5 26 3 23 01037700 AkliaJalal 274 21 253 6 3 3 6 4 2 01037800 Gurusar 64 16 48 33 12 21 6 2 4 01037900 Hamirgarh 450 66 384 182 24 158 234 35 199 01038000 Jalal 1,169 382 787 30 17 13 466 285 181 01038100 Dyalpura Bhaika 324 164
, 160 56 20 36 195 103 92
01038200 Gaunspura 57 38 19 12 II I 6 5 01038300 Kangar 360 66 294 107 25 82 187 39 148 01038400 Salabatpura 369 157 212 2 2 101 98 3 01038500 Adampu(a 189 24 165 10 9 12 2 10 01038600 Rajgarh 285 28 257 62 5 57 203 20 183 01038700 Dulewala 671 59 612 397 36 361 235 14 221 01038800 BhaiRupa 730 132 598 210 29 181 171 38 133 01038900 Gumti Kalan 198 57 141 12 3 9 94 38 56 01039000 Dayalpura Mirza 561 98 463 72 18 54 159 44 115 01039100 Selbrah 752 219 533 84 52 32 246 90 156 01039200 Kauloke' 2 2 I I I 01039300 Burj Gill 113 11 102 5 I 4 59 4 55 01039400 Dhapa1i 905 209 696 72 32 40 220 113 107 01039500 Ghandawna 310 91 219 14 7 7 174 3S 139 01039600 Sandhu Khurd 61 14 47 9 3 6 6 1 5 01039700 Phulwa] 217 68 149 15 13 2 81 29 52 01039800 Raiya UrfHardaspura 535 82 453 34 9 25 181 49 132 01039900 Dhingar 257 98 159 10 8 2 46 38 8 01040000 Allike 241 46 195 29 9 20 59 19 40 01040100 Chotian 274 97 177 17 9 8 24 11 13 01040200 Bugran 140 36 104 8 3 5 74 25 49 01042900 Patti Karam Chand Mehraj 300 64 236 147 27 120 55 20 35 01043400 Burj Mansa 146 15 131 6 3 3 14 5 9 01043500 Phul (Rural) 49 7 42 3 3 4 4 01043600 Hamam Singhwala 94 15 79 93 15 78 01043700 Sadhana 386 37 349 18 13 5 74 12 62 01043800 Patti Sandli Mehraj 168 28 140 13 'r- 3 10 98 23 75 01043900 Patti Saol Mehraj 294 46 248 52 12 . 40 86 18 68 01044000 Patti Kala Mehraj 297 127 170 9 7 2 130 85 45
Phul (Urban) 41403000 Dashmesh Nagar on 36 23 13 9 4 5
Rampura· Mehraj Road OG - Ward NO.19
228

PRIMARY CENSUS ABSTRACT
CENSUS ABSTRACT Phu1
of mar~inal workers Location
Household indus!!l: workers Other workers Non-workers code Persons Males Females Persons Males Females Persohs Males Females Name ofVilla~e number
50 51 52 53 54 55 56 57 58 2 ,
1,333 154 1,179 6,508 1,105 5,403 81,289 34,549 46,740 Phul (Total) 0001 1,331 154 1,177 6,483 1,086 5,397 80,850 34,392 46,458 Phul (Rural) 0001
2 2 25 19 6 439 157 282 Phul (Urban) 0001 Phul (Rural}
2 2 121 6 115 1,005 423 582 Neor 01036500 14 14 99 20 79 3,287 1,498 1,789 Maluka 01036600 87 6 81 313 75 238 5,486 2,084 3,402 KothaGuru 01036700
7 J 237 10 227 795 375 420 Burj Thror 01036800 33 32 388 15 373 2,057 1,012 1,045 Siriewala 01036900
I 124 10 114 801 390 411 Burj Ladha Singhwala 01037000 120 42 78 324 142 182 7,691 3,042 4,649 Bhagta 01037100
1 I 57 12 45 772 332 440 Kesar Singhwala 01037200 24 23 22 3 19 2,160 741 1.419 Bhodipura 01037300
2 2 102 12 90 856 418 438 Ramuwala 01037400 3 3 22 22 790 380 410 Hakam Singhwala 01037500 2 2 4 I 3 936 317 619 Koer Singhwala 01037600
262 14 248 1,628 759 869 AkliaJalal 01031700 I I 24 2 22 1,047 498 549 Gurusar 01037800 5 2 3 29 5 24 1,481 729 752 Hamirgarh 01037900
78 8 70 595 72 523 2,794 1,310 1,484 Jalal 01038000 4 3 I 69 38' 31 3,012 1,145 1,867 Dyalpura Bhaika 01038100 I I 38 21 17 279 107 172 Gaunspura 01038200
66 2 64 984 473 511 Kangar 01038300 2 2 264 57 207 938 387 551 Salabatpura 01038400 3 2 164 20 144 1,108 459 649 Adampura 01038500 2 2 18 3 15 702 306 396 Rajgarh 01038600
19 5 14 20 4 16 949 497 452 Dulewala 01038700 38 2 36 311 63 248 7,245 3,080 4,165 Bhai Rupa 01038800 60 9 51 32 7 25 2,241 1,115 1,126 Gumti Kalan 01038900 25 2 23 305 34 271 2,369 991 1,378 Dayalpura Mirza 01039000 30 2 28 392 75 317 2,634 1,094 1,540 Selbrah 01039100
507 186 321 Kauloke 01039200 7 1 6 42 5 37 1,184 441 743 Burj Gill 01039300
50S 24 481 108 40 68 3,162 1,268 1,894 Dhapali 01039400 IS 14 107 48 59 1,477 600 877 Ghandawna 01039500
3 2 43 9 34 767 364 403 Sandhu Khurd 01039600 6 6 115 26 89 1,032 495 537 Phulwal 01039700
32 32 288 24 264 2,326 915 1,411 Raiya UrfHardaspura 01039800 96 36 60 105 16 89 797 338 459 Dhingar 01039900 II II 142 18 124 986 462 524 Allike 01040000 5 2 3 228 75 153 941 391 550 Chotian 01040100
58 8 50 1,085 404 681 Bugran 01040200 16 16 82 \7 65 3,051 1,253 1,804 Patti Karam Chand Mehraj 01042900
126 7 119 468 211 257 Burj Mansa 01043400 17 16 25 6 19 707 262 445 Phul (Rural) 01043500
1 746 308 438 Harnam Singhwala 01043600
5 5 289 12 277 968 465 503 Sadhana 01043700
I I 56 2 54 1,168 491 677 Patti Sandli Mehraj 01043800
II 10 145 IS 130 1,948 816 1,072 Patti Saol Mehraj 01043900
37 37 121 3~ 86 1,477 700 777 Patti Kala Mehraj 01044000
t Phul (Urban)
2 2 25 19 6 439 157 282 Dashmesh Nagar on 41403000 Rampura - Mehraj Road tOG} - want No.19
229

'DISTRICT CENSUS HANDBOOK: BATHINDA
VILLAGE PRIMARY CD Block-
Total population (including
Location Area of institutional and houseless Population in the code Village in Number of EOEulationl a~e-
PRIMARY CENSUS ABSTRACT
CENSUS ABSTRACT Rampura
Scheduled Castes EOEuation Scheduled Tribes EOEuiation Literates
Persons Males Females Persons Males Females . Persons Males Females Name ofVillase
11 12 13 14 15 16 17 18 19 2
28,934 1'5,436 13,498 43,040 25,395 17,645 Rampura (Total) 28,860 15,396 13,464 42,854 25,280 17,574 Rampura (Rural)
74 40 34 186 115 71 Rampura (Urban) Rampura (RurDl)
882 475 407 1,373 816 557 lelhuke 212 106 106 502 312 190 Ghureli 256 130 126 456 278 178 Ghurela 921 490 431 1,306 735 571 leondan
1,404 727 677 1,841 1,036 805 Balloh 611 332 279 885 538 347 Badlala 269 142 127 632 373 259 Jaidan
3,274 1,740 1,534 3,995 2,402 1,593 MandiKalan 783 414 369 1,221 752 469 Khokhar
2,340 1,243 1,097 3,644 2,128 1,516 Chaoke 598 320 278 654 412 242 Pirko! 475 2S1 224 693 422 271 Bhaini Chuhar 414 230 184 710 441 269 Sooch 880 463 417 1,420 814 606 Dikh 436 234 202 • f~409 831 578 Dhade 385 207 178 908 555 353 RarnNiwas 412 208 204 578 342 236 Mandi Khurd 211 106 105 380 215 165 Har Kishanpura 621 337 284 542 337 205 Nandgarh Kotra 787 411 376 1,110 641 469 lhanduke 331 187 144 692 402 290 MansaKhurd 316 178 138 578 356 222 Gill Khurd 496 261 235 708 431 277 Daulatpura
1,951 1,022 929 3,491 2,013 1,478 Salianwala
853 448 405 1,919 1,115 804 Shunder
1,521 828 693 1,989 1,177 812 Kolra Korianwala 3,070 1,702 1,368 3,211 1,900 1,311 Rampura(Rural)
1,445 774 671 2,371 1.401 970 Pitho 1,417 749 668 1,806 1,037 769 Knrarwala
1,289 681 608 1,830 1,068 762 Gill Kalan Rampura (Urban)
74 40 34 186 liS 71 Outgrowth of Gandhi Nagar on Pi tho Road (OG) - Ward No.20
231

DISTRICT CENSUS HANDBOOK: BATHINDA
VILLAGE PRIMARY CD Block-
Location
code llIiterates Total workerS Main workers number Name ofVilla~e Persons Males Females Persons Males Females Persons Males Females
I 2 20 21 22 23 24 25 26 27 28
0002 Rampura (Total) 48,949 23,630 25,319 44,154 27,918 16,236 34,221 25,574 8,647 0002 Rampura (Rural) 48,775 23,547 25,228 43,982 27,799 16,183 34,049 2:;,455 8,594 0002 Rampura (Urban) 174 83 91 172 119 53 172 119 53
Rampura (Rural) 01040300 Jethuke 1,239 545 694 1,009 731 278 703 606 97 01040400 Ghureli 473 219 254 505 309 196 399 274 125 01040500 Ghurela 544 258 286 401 330 71 378 319 S9 01040600 Jeondan 1,597 786 811 1,643 866 777 899 739 160 01040700 Balloh 2,270 1,100 1,170 2,630 1,386 1,244 1,088 951 137 01040800 Badlala 952 474 478 972 575 397 671 523 148 01040900 Jaidan 618 298 320 778 414 364 355 338 17 01041000 Mandi Kalan 4,434 2,150 2,284 4,459 2,616 1,843 2,964 2,393 571 01041100 Khokhar 1,484 716 768 1,502 867 635 808 767 41 01041200 Chaoke 4,636 2,311 2,325 3,647 2,524 1,123 3,061 2,322 739 01041300 Pirko! 723 326 397 666 400 266 660 396 264 01041400 Bhaini Chuhar 975 481 494 839 467 372 836 466 370 01041500 Sooch 823 398 425 739 439 300 680 414 266
01041600 Dikh 1,864 906 958 1,596 965 631 1,314 905 409 01041700 Dhade 1,421 666 755 1,479 840 639 1,355 819 536
01041800 Ram Niwas 1,245 602 643 1,056 682 374 625 583 42 01041900 Mandi Khurd 683 319
.. 364 511 359 152 288 273 15
01042000 Har Kishanpura 430 195 235 484 255 229 433 244 189
01042100 Nandgarh Kotra 816 396 420 584 391 193 393 361 32 01042200 Jhanduke 1,313 631 682 1,151 732 419 787 631 156 01042300 MansaKhurd 553 251 302 704 369 335 491 336 155 01042400 Gill Khurd 532 252 280 583 324 259 568 315 253
01042500 Daulatpura 622 274 348 527 382 145 514 370 144
01042600 Balianwala 3,678 1,773 1,905 2,771 1,995 776 2,056 1,800 256 01042700 Bhunder 2,266 1,109 1,157 1,824 1,297 527 1,762 1,264 498
01042800 Kotra Korianwala 1,975 942 1,033 1,861 1,213 648 1,688 1,168 520
01043000 Rarnpura(Rura1) 3,672 1,807 1,865 2,630 2,075 555 2,514 2,005 509
01043100 Pitho 2,920 1,424 1,496 2,494 1,670 824 2,169 1,621 548
01043200 Kararwala 2,211 1,092 1,119 2,093 1,201 892 1,935 1.182 753
01043300 Gill Kalan 1,806 846 960 1,844 1,125 719 1,655 1,070 585
Rampura (Urban) 41403000 Outgrowth of Gandhi Nagar 174 83 91 172 119 53 172 119 53
on Pitho Road tOG) - Ward No.20
232

PRIMARY CENSUS ABSTRACT
CENSUS ABSTRACT Rampura
Industrial catego!}: of main workers
Household industry
Cultivators Agricultural labourers workers Other workers
Persons Males Females Persons Males Females Persons Males Females Persons Males Females Name of Village
29 30 31 32 33 34 35 36 " 37 38 39 40 2
15,217 13,722 ' 1,495 6,818 5,393 . 1,425 876 348 528 11,310 6,111 5,199 Rampura (Total) 15,182 13,690 1,492 6,784 5,368 1,416 873 345 528 11,210 6,052 5,158 Rampura (Rural)
35 32 3 34 25 9 3 3 100 59 41 Rampura (Urban) Rampura (Rural)
363 326 37 129 112 17 21 15 6 190 153 37 Jethuke 342 230 112 8 7 I 23 18 5 26 19 7 Ghureli 189 179 10 46 42 4 4 3 139 95 44 Ghurela 437 411 26 152 136 16 13 9 4 297 183 114 leondan 664 633 31 185 176 9 12 9 3 227 133 94 Balloh 352 279 73 62 59 3 12 10 2 245 175 70 Badlala 171 170 I 90 89 I 3 3 91 76 15 Jaidan
1,147 1,078 69 711 559 152 57 33 24 1,049 723 326 Mandi Kalan 499 488 11 127 124 3 6 5 1 176 150 26 Khokhar
1,537 1,425 112 623 491 132 422 63 359 479 343 136 Chaoke 264 167 97 342 188 154 6 3 3 48 38 10 Pirko! 396 279 117 190 99 91 7 5 2 243 83 160 Bhaini Chuhar 329 256 73 163 98 65 4 2 2 184 58 126 Sooch 767 475 292 280 223 57 9 8 1 258 199 59 Dikh 507 489 18 147 139 8 4 4 697 187 510 Dhade 447 439 8 64 51 13 8 6 .;- 2 106 87 19 Ram Niwas 168 165 3 27 26 '1 93 82 11 Mandi Khurd 169 132 37 146 76 70 6 1 5 112 35 77 Har Kishanpura 287 265 22 21 19 2 3 2 1 82 75 7 Nandgarh Kotra 375 366 9 156 115 41 29 16 13 227 134 93 lhanduke
215 213 2 73 73 12 9 3 191 41 150 MansaKhurd 207 203 4 29 27 2 6 2 4 326 83 243 Gill Khurd 217 215 2 95 95 2 2 200 58 142 Daul\ltpura 902 858 44 189 165 24 67 49 18 898 728 170 Balianwala 733 7;13 20 273 262 II 18 9 9 738 280 458 Bhunder
527 502 25 274 248 26 26 13 13 861 405 456 Kotra Korianwala
851 717 134 742 645 97 51 21 30 870 622 248 Rampura(Rural)
1,000 955 45 423 345 78 IS 11 4 731 310 421 Pitho
608 574 34 648 421 227 12 8 4 667 179 488 Kararwala
512 488 24 369 258 111 15 6 9 759 318 441 Gill Kalan Rampura (Urban)
35 32 3 34 25 9 3 3 100 S9 41 Outgrowth of Gandhi Nagar on Pitho Road (OG) • Ward No.20
233

DISTRICT CENSUS HANDBOOK: BATHINDA
VILLAGE PRIMARY CD Block-
Industrial category
Location
code Maf(!!inal workers Cultivators A~iculturallabourers
number Name ofVilla8e Persons Males Females Persons Males Females Persons Males Females
1 2 41 42 43 44 45 46 47 48 49
0002 Rampura (Total) 9,933 2,344 7,589 2,605 582 2,023 3,000 1,089 1,911 0002 Ramput:ll (Rural) 9,933 2,344 7,589 2,605 582 2,023 3,000 1,089 1,911 0002 Rampura (Urban)
Rampura (Rural) 01040300 lethuke 306 125 181 6 5 ·177 100 77 01040400 Ghureli 106 35 71 7 4 3 53 23 30 01040500 Ghurela 23 11 12 5 4 1 12 6 6 01040600 Jeondan 744 127 617 189 27 162 200 69 131 01040700 Balloh 1,542 435 1,107 488 121 367 295 161 134 01040800 Badlala 301 52 249 154 13 141 92 17 75 01040900 Jaidan 423 76 347 102 44 58 71 16 55 01041000 MandiKalan 1,495 223 1,272 185 49 136 357 93 264 01041100 Khokhar 694 100 594 443 59 384 193 31 162 01041200 Chaoke 586 202 384 249 31 218 203 130 73
01041300 Pirko! 6 4 2 1 1 2 2 01041400 Bhaini Chuhar 3 1 2 2 2 01041500 Sooch 59 25 34 18 5 13 4 2 2 01041600 Dikh 282 60 222 91 29 62 113 19 94
01041700 Dhade 124 21 103 7 5 2 61 10 51
01041800 Ram Niwas 431 99 332 89 18 71 Il2 54 58
01041900 Mandi Khurd 223 86 137 99 38 61 70 24 46
01042000 Har Kishanpura 51 11 40 41 II 30 6 6
01042100 Nandgarh Kotra 191 30 161 24 2 22 141 9 132
01042200 Jhanduke 364 101 263 67 17 50 108 59 49
01042300 MansaKhurd 213 33 180 17 16 I 66 10 56
01042400 Gill Khurd 15 9 6 8 8
01042500 Daulatpura 13 12 1 7 7 6 5
01042600 Ba1ianwala 715 195 520 202 . 33 169 280 117 163
01042700 Bhunder 62 33 29 10 2 8 33 26 7
01042800 Kotra Korianwala 173 45 128 48 14 34 72 24 48
01043000 Rampura(Rura1) 116 70 46 5 4 1 59 35 24
01043100 Pilho 325 49 276 14 9 5 161 27 134
01043200 Kararwa1a 158 19 139 14 7 7 24 3 21
01043300 Gill Kalan 189 55 134 23 12 11 19 9 10
Rampura (Urban) 41403000 Outgrowth of Gandhi Nagar
on Pitho Road (OG) - Ward No.20
234

PRIMARY CENSUS ABSTRACT
CENSUS ABSTRACT Rampura
of mar~inal workers
Location
Household industry workers Other workers Non-workers code
Persons Males Females Persons Males Females Persons Males Females Name ofVi1la~e number
50 51 52 53 54 55 56 57 5.8 2 I
441 63 378 3,887 610 3,277 47,SjS 21,107 26;728 Rampura (Total) 0002 441 63 378 3,887 610 3,277 47,647 21,028 26,619 Rampura (Rural) 0002
188 79 109 Rampura (Urban) 0002 Rampura (Rural)
15 4 II 108 20 88 1,603 630 973 lethuke 01040300 7 I 6 39 7 32 470 222 248 Ghureli 01040400 I I 5 5 599 206 393 Ghurela 01040500
23 2 21 332 29 303 1,260 655 605 leondan 01040600 22 12 10 737 141 596 1,481 750 731 BaUoh 01040700 17 2 15 38 20 18 865 437 428 Badlala 01040800 4 2 2 246 14 232 472 257 215 Jaidan 01040900
77 8 69 876 73 803 3,970 1,936 2,034 Mandi Kalan 01041000 II II 47 10 37 1,203 601 602 Khokhar 01041100 45 8 37 89 33 56 4,633 1,915 2,718 Chaoke 01041200
2 711 338 373 Pirkot 01041300 I 829 436 393 Bhaini Chuhar 01041400
37 18 19 794 400 394 Sooch 01041500 2 2 76 12 64 1,688 755 933 Dikh 01041600
55 6 49 1,351 657 694 Dhade 01041700 10 9 220 26 194 1,097 475 622 Ram Niwas 01041800 3 3 51 24" 27 750 'I- 302 448 Mandi Khurd 01041900
I 3 3 326 , 155 171 Har Kishanpura 01042000 7 7 19 19 774 342 432 Nandgarh Kotra 01042100 5 2 3 184 23 161 1,272 540 732 lhanduke 01042200
11 2 9 119 5 114 541 284 257 MansaKhurd 01042300 I I 6 I 5 527 284 243 Gill Khurd 01042400
803 323 480 Daulatpura 01042500 96 10 86 137 35 102 4,398 1,791 2,607 Balianwala 01042600 3 3 16 5 II 2,361 927 1,434 Bhunder 01042700
18 18 3S 7 28 2,103 906 1,197 Kotra Korianwala 01042800 II 3 8 41 28 13 4,253 1,632 2,621 Rampura(Rural) 01043000 4 I 3 146 12 134 2,797 1,155 1,642 Pitho 01043100 4 3 116 8 108 1,924 928 996 Kararwala 01043200
41 2 39 106 32 74 1,792 789 1,003 Gill Kalan 01043300 Rampura (Urban)
188 79 109 Outgrowth of Gandhi Nagar 41403000 on Pitho Road (OG)· Ward No,20
235

DISTRICT CENSUS HANDBOOK: BATHINDA
VILLAGE PRIMARY CD Block-
Total population (including Location Area of institutional and houseless Population in the
code Village in Number of EOEulation~ ase-l[ouE 0-6 number Name of Villa Be hectares households Persons Males Females Persons Males Females
I 2 3 4 5 6 7 8 9 10
0003 Nathana (Total) 39,903.0 22,785 129,785 72,452 57,333 16,371 9,123 7,248 0003 Nathana (Rural) 39,903.0 22,648 129,025 72,059 56,966 16,270 9,060 7,210 0003 Nathana (Urban) 137 760 393 367 101 63 38
Nathana (Rural) 01044100 Mari 653.0 163 996 527 469 122 72 50 01044200 Burj Dalla 284.0 62 369 195 174 45 26 19 01044300 Bhaini 587.0 447 2,778 1,488 1,290 409 226 183 01044400 Kalian Sadda 524.0 274 1,734 895 839 253 125 128 01044500 KatianMalka 822.0 271 1,677 888 789 207 122 85 01044600 Kalian Sukha 2,358.0 626 3,853 2,066 1,787 488 258 230 01044700 Bajoaua 633.0 307 1,826 977 849 216 117 99 01044800 Giddar 1,029.0 403 2,383 1,277 1,106 270 151 119 01044900 Nathpura 1,032.0 412 2,565 1,314 1,251 383 204 179 01045000 Ganga Nathana 862.0 445 2,563 1,391 1,172 325 192 133 01045100 Nathana 2,383.0 1,215 7,197 3,696 3.501 849 462 387
01045200 Poohli 1,168.0 671 4,012 2,113 1,899 591 319 272
01045300 Dhilwan 448.0 299 1,747 921 826 242 131 111 01045400 Gobindpura 2,791.0 1,170 7,233 3,844 3,389 932 528 404 01045500 Seman 1,105.0 691 3,959 2,084 1,875 487 277 210 01045600 Poohla 2,249.0 967 5,523 2,882 2,641 615 350 265 01045700 Bath 217.0 18r 1,124 599 525 142 76 66 01045800 Lehra Dhul Kot 728.0 478 2,551 1,374 1,177 329 205 124 01045900 Lehra Sondha 738.0 244 1,459 791 668 212 125 87 01046000 Lehra Mohabat 2,670.0 1,701 8,966 4,788 4,178 957 541 416 01046100 LehraKhana 1,367.0 355 2,063 1,067 996 274 136 138
01046200 LehraBega 1,168.0 522 2,922 1,578 1,344 369 226 143
01045300 Bhucho Kalan 3,290.0 1,093 5,349 3,402 2,947 705 408 298 01046400 Burj Kahan Singhwala 437.0 320 1,778 925 853 270 162 108 01046500 Bhucho Khurd 1,810.0 801 4,446 2,324 2,122 529 288 241 01046700 Mehna 835.0 5,171 27,029 17,923 9,106 3,650 1,979 1,671
01046800 Bibiwala 885.0 463 2,657 1,530 1,127 325 179 146
01046900 Joganand 524.0 313 1,824 964 860 209 115 94
01052600 Tungwali 3,206.0 1,040 6,293 3,394 2,899 771 462 309
01052700 Chak Fateh Singhwala 1,450.0 619 3,568 1,870 1,698 440 237 203
01052800 ChakBakhlu 890.0 475 2,918 1,532 1,386 345 182 163
01052900 Chak Ram Singhwala 760.0 443 2,663 1,440 1,223 308 179 129
Nathana (Urban) 41403000 Jawahar Nagar on Rampura 137 760 393 367 101 63 38
- Balhinda Road (OG)-Ward No.18
236

PRIMARY CENSUS ABSTRACT
CENSUS ABSTRACT Nathana
Scheduled Castes EOEuation Scheduled Tribes EOEulation Literates Persons Males Females Persons Males Females Persons Males Females Name ofVilla8;e
11 ,}2 13 14 15 16 17 18 19 2
38,200 20,179 18,021 72,972 . 45,442 27,530 Nathana (Total) 37,821 19,980 17,841 72,6611 45,257 27,4 II Nathana (Rural)
379 199 180 304 185 1I9 Nathana (Urban) Nathana (Rural)
369 193 176 521 311 210 Mari 69 44 25 190 109 81 Burj Dalla
1,255 663 592 - I 1,131 668 463 Bhaini 920 481 439 694 389 305 Kalian Sadda 375 193 182 991 567 424 Kalian Maika
1,221 645 576 1,762 1,049 713 Kalian Sukha 426 224 202 941 541 400 8ajoana 685 370 315 1,246 740 506 Giddar 992 506 486 1,213 685 528 Nathpura
1,061 567 494 1,162 708 454 Ganga Nathana 2,243 1,123 l,nO 3,630 1,061 \,569 Nathana 2,130 1,101 1,029 1,894 1,154 740 Pooh1i
1163 352 311 826 503 323 Dhilwan 2,438 1,324 1,114 3,150 1,797 1,353 Gobindpura 1,628 849 779 1,821 1,099 722 Seman 2,029 1,048 981 '1.2,868 1,640 1,228 Poohla
437 229 208 .. 571 348 223 Bath 1,103 591 512 1,301 769 532 Lehra Dhul Kot
491 260 231 631 370 261 Lehra Sondha 2,856 1,529 1,327 5,351 3,103 2,248 Lehra Mohabat
647 339 308 1,064 627 437 LehraKhana 906 498 408 1,353 809 544 Lehra Bega
1,991 1,064 927 3,221 1,874 1,347 Bhucho Kalan 988 515 473 842 478 364 Burj Kahan Singhwala
1,984 . 1,035 949 2,273 1,293 980 Bhucho Khurd 1,022 530 492 22,069 15,538 6,531 Mehna
675 388 287 1,602 1,037 565 Bibiwala 656 352 304 991 575 416 Joganand
1,929 1,039 890 2,751 1,656 .1,095 Tungwalj
1,769 923 846 1,698 1,002 696 Chak Fateh Singhwala 990 526 464 1,520 914 606 Chak Bakhtu 873 479 394 1,390 843 547 Chak Ram Singhwala
Nathana (Urban)
379 199 180 304 185 119 Jawahar Nagar on Rampura - Balhinda Road (OG)-Ward No.IS
237

DISTRICT CENSUS HANDBOOK: BATHINDA
VILLAGE PRIMARY C DBJock-
Location
code Illiterates Total workerS Main workers number Name of Villa Be Persons Males Females Persons Males Females Persons Males Females
I 2 20 21 22 23 24 25 26 27 28
0003 Nathana (Total) 56,813 27,010 29,803 57,054 42,879 14,P5 48,602 39,811 8,791 0003 Nathana (Rural) 56,357 26,802 29,555 56,633 42,664 13,969 48,340 39,647 8,693 0003 Nathana (Urban) 456 208 248 421 215 206 262 164 98
Nathana (Rural) 01044100 Marl 475 216 259 294 264 30 251 224 27 01044200 Burj Dalla 179 86 93 220 115 105 136 113 23 01044300 Bhaini 1,647 820 827 1,065 793 272 734 564 170 01044400 Kalian Sadda 1,040 506 534 677 497 180 384 343 41 01044500 KalianMalka 686 321 365 660 449 211 490 393 97 01044600 Kalian Sukha 2,091 1,017 1,074 1,324 1,084 240 1,049 968 81 01044700 Baj oan a 885 436 449 1,003 560 443 924 548 376 01044800 Giddar 1,137 537 600 1,144 715 429 1,042 637 405 01044900 Nathpura 1,352 629 723 1,432 771 661 1,397 763 634 01045000 Ganga Nathana 1,401 683 718 1,105 771 334 1,066 750 316 01045100 Nathana 3,567 1,635 1,932 3,017 1,987 1,030 2,026 1,551 475 01045200 Poohli 2,118 959 1,159 1,809 1,128 681 1,230 1,009 221 01045300 Dhilwan 921 418 503 899 533 366 659 432 227 01045400 Gobindpura 4,083 2,047 2,036 3,635 2,239 1,396 3,159 2,064 1,095 01045500 Seman 2,138 985 1,153 1,990 1,167 823 1,948 1,155 793 01045600 Poohla 2,655 1,242 1,413 2,434 1,529 905 1,613 1,346 267 01045700 Bath 553 251
, 302 627 354 273 436 308 128
01045800 Lehra Dhul Kot 1,250 605 645 1,080 719 361 1,054 709 345 01045900 Lehra Sondha 828 421 407 557 464 93 556 463 93 01046000 Lehra Mohabat 3,615 1,685 1,930 3,645 2,762 883 2,966 2,636 330 01046100 LehraKhana 999 440 559 1,100 625 475 1,003 609 394 01046200 LehraBega 1,569 769 800 1,179 789 390 1,128 764 364 01046300 Bhucho Kalan 3,128 1,528 1,600 2,366 I,tf45 521 2,020 1,784 236 01046400 Burj Kahan Singhwala 936 447 489 839 519 320 743 491 252 01046500 Bhucho Khurd 2,173 1,031 1,142 1,703 1,229 474 1,046 950 96 01046700 Mehna 4,960 2,385 2,575 13,169 12,806 363 12,756 12,502 254 01046800 Bibiwala 1,055 493 562 1,125 911 214 998 830 168 01046900 Joganand 833 389 444 583 550 33 557 529 28
01052600 Tungwali 3,542 1,738 1,804 2,768 1,805 963 1,980 1,571 409
01052700 Chak Fateh Singhwala 1,870 868 1,002 1,291 1,054 237 1,269 1,042 227 01052800 Chak Bakhtu 1,398 618 780 1,010 847 163 925 836 89 01052900 Chak Ram Singhwala 1,273 597 676 883 783 100 795 763 32
Nathana (Urban) 41403000 Jawahar Nagar on Rampura 456 208 248 421 215 206 262 164 98
- Bathinda Road (OG). Ward No.18
238

239

DISTRICT CENSUS HANDBOOK: BATHINDA
VILLAGE PRIMARY C DBlock-
Industrial categ0!X Location
code Mar~inal workers Cultivators A8!iculturallabourers number Name of Village Persons Males Females Persons Males Females Persons Males Females
1 2 41 42 43 44 45 46 47 48 49
0003 Nathana (Total) 8,452 3,068 5,384 665 276 389 3,288 1,736 1,552 0003 Nathana (Rural) 8,293 3,017 5,276 663 276 387 3,211 - 1,711 1,500 0003 Nathana (Urban) -159 51 108 2 2 77 25 52
Nathana (Rural) 01044100 Mad 43 40 3 7 4 3 30 30 01044200 Burj Dalla 84 2 82 3 I 2 3 3 01044300 Bhaini 331 229 102 13 7 6 298 211 87 01044400 Kalian Sadda 293 154 139 22 10 12 224 134 90 01044500 KalianMalka 170 56 114 67 13 54 90 38 52 01044600 Kalian Sukha 275 116 159 SQ 8 42 101 56 45 01044700 Bajoana 79 12 67 1 1 14 9 5 01044800 Giddar 102 78 24 18 16 2 38 35 3 01044900 Nathpura 35 8 27 5 3 2 21 4 17 01045000 Ganga Nathana 39 21 18 5 3 2 7 7 01045100 Nathana 991 436 555 61 29 32 533 331 202 01045200 Poohli 579 119 460 49 17 32 247 46 201 01045300 Dhilwan 240 101 139 15 14 I 113 65 48 01045400 Gobindpura 476 175 301 20 13 7 213 46 167 01045500 Seman 42 12 30 4 2 2 7 5 2 01045600 Poohla 821 183 638 39 5 34 256 132 124 01045700 Bath 191 46 ~ 145 3 2 81 42 39 01045800 Lehra Dhul Kot 26 10 16 5 3 2 3 2 01045900 Lehra Sondha I 01046000 Lehra Mohabat 679 126 553 59 20 39 135 66 69 01046100 LehraKhana 97 16 81 4 3 I 5 4 01046200 LehraBega 51 25 26 12
-,. ,- 8 4 12 10 2
01046300 Bhucho Kalan 346 61 285 41 II 30 106 26 80 01046400 Burj Kahan Singhwala 96 28 68 4 I 3 78 21 57 01046500 Bhucho Khurd 657 279 378 90 48 42 359 200 159 01046700 Mehna 413 304 109 19 9 10 I 0\046800 Bibiwala 127 81 46 5 5 39 35 4 01046900 Joganand 26 21 5 4 3 4 4 01052600 Tungwali 788 234 554 20 15 5 159 132 27 0\052700 Chak Flitch Singhwala 22 12 10 4 3 I 9 7 2 0\052800 ChakBakhtu 85 II 74 10 2 8 5 4 01052900 Chak Ram Singhwala 88 20 68 4 3 20 11 9
Nathana (Urban) 41403000 Jawahar Nagar on Rampura 159 51 108 2 2 77 25 52
- Bathinda Road (OG)-Ward No.18
240

PRIMARY CENSUS ABSTRACT
CENSUS ABSTRACT Nathana
of marginal workers Location
Household industry workers Other workers Non-workers code Persons Males Females Persons Males Females Persons Males Females Name of Village number
50 51 52 53 54 55 56 57 58 2 1
394 72 322 4,105 984 3,121 72,731 29,573 43,158 Nathana (Total) 0003 392 71 321 , 4,027 959 3,068 72,392 29,395 42,997 Nathana (Rural) 0003
2 1 78 25 53 339 178 161 Nathana (Urban) 0903 Nathana (Rural)
6 6 7m 263 439 Mari 01044100 1 77 77 149 80 69 BurjDalla 01044200 8 4 4 12 7 5 1,713 695 1,018 Bhaini 01044300 5 3 2' 42
, 7 35 1,057 398 659 Kalian Sadda 01044400
2 - 2 11 5 6 1,017 439 578 KalianMalka 01044500 8 1 7 116 51 65 2,529 982 1,547 KalianSukha 01044600 I 1 63 2 61 823 417 406 Bajoana 01044700 5 3 2 41 24 17 1,239 562 677 Giddar 01044800 6 5 3 3 1,133 543 590 Nathpura 01044900
27 II 16 1,458 620 838 Ganga Nathana 01045000
31 15 16 366 61 305 4,180 1,709 2,471 Nathana 01045100 37 2 35 246 54 192 2,203 985 1,218 Poohli 01045200
112 22 90 848 388 460 Dhilwan 01045300 16 2 14 227 114 113 3,598 1,605' 1,993 Gobindpura 01045400
31 5 26 1,969 917 1,052 Seman 01045500
1 525 46 479 3,089 1,353 1,736 Poohla 01045600
12 12 95 3 ' 92 497 245 252 Bath 01045700
4 4 14 5 9 1,471 655 816 Lehra Dhul Kot 01045800
1 902 327 575 Lehra Sondha 01045900
43 13 30 442 27 415 5,321 2,026 3,295 Lehra Mohabat 01046000
27 27 61 9 52 963 A42 521 Lehra Khana 01046100
27 7 20 1,743 789 954 Lehra Bega 01046200
12 12 187 24 163 3,983 1,557 2,426 Bhucho Kalan 01046300
14 6 8 939 406 533 Burj Kahan Singhwala 01046400
71 6 65 137 25 112 2,743 1,095 1,648 Bhucho Khurd 01046500
6 2 4 387 292 95 13,860 5,117 8,743 Mehna 01046700
49 II 38 34 30 4 1,532 619 913 Bibiwala 01046800
I 17 16 1,241 414 827 Joganand 01046900
44 5 39 565 82 483 3,525 1,589 1,936 Tungwali 01052600
9 2 7 2,271 816 1,461 Chak Fateh Singhwala 01052700 69 8 61 1,908 685 1,223 ChakBakhtu 01052800
64 8 56 1,780 657 1,123 Chak Ram Singhwala 01052900 Nathana (Urban)
2 78 25 53 339 178 161 lawahar Nagar on Rampura 41403000 - Bathinda Road (OG)-Ward No.18
241

DISTRICT CENSUS HANDBOOK: BATHINDA
VILLAGE PRIMARY CD Block·
Total population (including Location Area of institutional and houseJess Population in the
code Village in Number of EOEulation~ as.e-l[ouE 0-6 number Name of Village hectares households Persons Males Females Persons Males females
I 2 3 4 5 6 7 8 9 10
0004 Bathinda (Total) 63,997.0 29,307 168,979 89,821 79,158 21,495 11,976 9,519 0004 Bathinda (Rural) 63,997.0 28,143 164,204 86,984 77,220 20,764 11,560 9,204 0004 Bathinda (Urban) 1,164 4,775 2,837 1,938 731 416 315
Bathinda (Rural) 01046600 Bhagu 1,164.0 331 1.90S 996 909 216 116 100 01047000 Gill Patti 883.0 529 2,957 1,618 1,339 338 202 136 01047100 Bhokhra 1,180.0 664 3,786 1,972 1,814 466 265 201 01047200 Khialiwala 1,045.0 415 2,542 1,363 1,179 345 200 145 01047300 Har Raipur Urf Shokhri 1,877.0 639 3.948 2,125 1,823 475 269 206 01047400 Jandanwala 2,346.0 780 4.737 2,536 2,201 595 332 263 01047500 Khemuana 768.0 454 2,724 1,435 1,289 299 166 133 01047600 leeda 1,651.0 838 5,134 2,748 2,386 632 377 255 01047700 Chak Jandanwala 43.0 -----------Un-inhabited-------------01047800 Chak Jeeda. 364.0 -------------U n- inhabited--------------01047900 Goniana Kalan 713.0 323 1,801 956 845 225 126 99 01048000 Goniana Khurd 530.0 326 2,029 1,054 975 296 152 144 01048100 Chak Goniana kalan 100,0 -------------U n- i nhabi ted--------------01048200 Balahar Vinjhu 547.0 311 1,849 987 862 244 130 114 01048300 Amargarh 496.0 195 1,054 558 496 132 79 53 01048400 Nehianwala 1,702.0 1,059 6,083 3,202 2,881 784 439 345 01048500 Sibian 1,374.0 9"5 5,417 2,871 2,546 641 332 309 01048600 MehmaSarja 2,773,0 1,263 7,060 3,832 3,228 916 SS2 364 01048700 MehmaSawai 1,637.0 758 4,699 2,487 2,212 602 333 269 01048800 Chak Goniana Khurd 126.0 ------------U n-i n habited--------------01048900 AkaliaKalan 1,578.0 691 4,179 2,209 1,970 557 295 262
01049000 Akalia Khurd 314.0 89 522 288("' 234 56 30 26
01049100 Balahar Mehma 668,0 277 1,584 8S6 728 227 134 93
01049200 Dan Singhwala 1,492.0 470 2,863 1,494 1,369 360 193 167
01049300 Warkandi 377.0 216 1,299 675 624 162 86 76 01049400 Ganga 1,17L0 475 2,844 1,492 1,352 365 200 165
01049500 Ablu 3,524,0 1,074 6,690 3,594 3,096 891 485 406
01049600 Mehma Sarkari 607,0 257 1,511 813 158 195 109 86
01049700 Mehma Bhagwana 637,0 247 1,389 722 667 194 113 81
01049800 Killi Nihal Singhwali 575.0 397 2,385 1,250 1,135 295 171 124
01049900 Burj Mehma 1,222.0 615 3,518 1,809 1,709 466 233 233
01050000 Oeon 2,162.0 1,124 6,487 3,473 3,014 809 462 347
01050100 Suladewala 708.0 416 2,345 1,216 1,129 271 140 131
01050200 Behman Dewana 1,749.0 875 4,981 2,606 2,375 651 350 301
01050300 BirBehman 699.0 370 2,224 1,174 1,050 281 157 124
01050400 Chugha Khurd 844.0 407 2,245 1,183 1,062 -249 131 118
01050500 Saluana 1,798.0 796 4,449 2,324 2,125 521 273 248
01050600 Virk Kalan 1,329.0 445 2,520 1,333 1,187 307 168 139
01050700 VirkKhurd 720.0 313 1.850 995 855 225 132 93
01050800 Karamgarh Sattran 478.0 209 1,371 718 653 203 102 101
01050900 Sardargarh 989.0 350 2,109 1,104 1,005 249 140 109
01051000 Ghugha Kalan 1,847.0 703 3,734 1,936 1,798 426 240 186
01051100 Jhumba 1,819.0 720 4,069 2,170 1,899 444 249 195
01051200 Teona 1,329.0 599 3,605 1,892 1,713 485 255 230
01051300 Multania 796.0 235 1,320 703 . 617 170 98 72
01051400 Birtalab UrfTalab Neehar 529.0 798 4,507 2,396 2,111 728 404 324
01051500 Naruana 1,438.0 624 3,550 1,854 1,696 446 245 201
01051600 Mian 403.0 139 796 441 355 103 64 39
01051700 Baho Sibian Patti 8asawa 178.0 78 454 229 225 61 35 26
Singh 01051800 Saho Sibian Patti Dharam 183.0 79 516 263 253 S6 30 26
Singh 01051900 Baho Jattri 374.0 163 911 494 417 95 53 42
01052200 Jodhpur Rornana 1,012.0 363 2,083 1,096 987 264 144 120
01052300 Jassi Pauwali 1,028.0 498 2,759 1,473 1.286 339 191 148
242

PRIMARY CENSUS ABSTRACT
CENSUS ABSTRACT Bathinda
Scheduled Castes EOEuation Scheduled Tribes EQEutation 'i- Literates Persons Males Females Persons Males Females • Persons Males Females Name ofVilla~e
11 12 13 14 15 16 17 18 19 2
61,481 32,543 28,938 81,481 48,749 32,731 Bathinda (Total) 60,798 32,181 28,617 77,940 46,535 31,405 Bathinda (Rural)
683 362 321 3,541 2,214 1,327 Bathinda (Urban) Bathinda (Rural)
746 370 376 881 509 372 Bhagu 1,314 712 602 1,281 797 484 Gill Patti 1,473 782 691 1,840 1,051 789 Bhokhra
919 489 430 1,214 748 466 Khialiwala 1,347 726 621 1,796 1,070 726 Har Raipur UrfBhokhri 1,518 820 698 2,104 1,210 894 landanwala 1,172 618 554 1,502 904 598 Khemuana 1,963 1,049 914 2,521 1,476 1,045 leeda
----Un-inhabited---------- Chak Jandanwala Un-inhabited------- Chak Jeeda
408 214 194 910 544 366 Goniana Kalan 798 414 384 874 518 356 Goniana Khurd
------Un-inhabited---- Chak Goniana kalan 761 412 349 1,019 612 407 Balahar Vinjhu 390 205 185 572 355 217 Amargarh
2,359 1,262 1,097 3,207 1,878 1,329 Nehianwala 2,154 1,141 1,013 2,800 1,665 1,135 Sibian 2,601 1,437 1,164 3,311 1,984 1,327 MehmaSarja 1,977 1,035 942 2,297 1,374 923 MehmaSawai
--------Un-inhabited------ Chak Goniana Khurd
1,600 845 755 1,817 1,089 728 AkaliaKalan
69 41 28 305 185 120 Akalia Khurd 581 310 271 787 496 291 Balahar Mehma 902 483 419 1,466 866 600 Dan Singhwala 672 345 327 537 316 221 Warkandi
913 499 414 1,338 776 562 Ganga
1,178 944 834 3,127 1,864 1.263 Ablu
428 228 200 881 508 373 Mehma Sarkari 598 308 290 685 405 280 Mehma Bhagwana
1,176 614 562 1,070 621 449 Killi Nihal Singhwali
1,799 896 903 1,434 837 597 8urj Mehma
2,562 1,350 1,212 3,046 1,846 1,200 Deon
1,169 606 563 1,235 747 488 Buladewala
2,232 1,170 1,062 2,231 1,335 896 Behman Dewana
877 466 411 1,088 654 434 BirBehman
675 358 317 992 599 393 Chugha Khurd
1,690 872 818 2,263 1,353 910 Baluana
700 372 328 1,167 694 473 VirkKalan
824 445 379 799 480 319 Virk Khurd
639 345 294 649 402 247 Karamgarh Saltra"
947 489 458 1,113 658 455 Sardargarh
1,120 538 532 1,825 1,074 751 Ghugha Kalan
1,15t 638 513 1,945 1,170 775 Jhumba
1,207 617 590 1,620 971 649 Teona
599 328 271 711 442 279 Multania
2,120 1,124 996 1,961 1,249 712 Birtalab UrfTalab Neehar
1,293 658 635 1,644 976 668 Naruana
395 229 166 374 231 143 Mian
66 27 39 221 134 87 Baho Sibian Patti Sasawa Singh
119 57 62 309 178 131 Baho Sibian Patti Oharam Singh
183 102 81 452 284 168 Saho Jattri
765 401 ' 364 1,068 633 435 Jodhpur Romana
898 485 413 1,371 833 538 lassi Pauwali
243

DISTRICT CENSUS HANDBOOK: BATHINDA
VILLAGE PRIMARY CD Block-
Location
code Illiterates Total workers Main workers number Name ofVilla~e Persons Males Females Persons Males Females Persons Males Females
2 20 21 22 23 24 25 26 27 28
0004 8athinda (Total) 87,498 41,072 46,426 73,367 51,006 22,361 59,164 47,200 11,964 0004 Bathinda (Rural) 86,264 40,449 45,815 71,468 49,222 22,246 57,276 45,424 11,852 0004 Bathinda (Urban) 1~234 623 611 1,899 1,784 115 1,888 1,776 112
Bathinda (Rural) 01046600 Bhagu 1,024 487 537 819 578 241 499 484 15 01047000 Gill Patti 1,676 821 855 1,480 947 533 804 716 88 01047100 Bhokhra 1,946 921 1,025 1,260 1,115 145 1,259 1,114 145 01047200 Khialiwala 1,328 615 713 1,127 756 371 1,082 730 352 01047300 Har Raipur Urf Bhokhri 2,152 1,055 1,097 1,580 1,184 396 1,207 1,129 78 01047400 Jandanwala 2,633 1,326 1,307 2,532 1,579 953 1,810 1,275 535 01047500 Khemuana 1,222 531 691 953 808 145 762 700 62 01047600 Jeeda 2,613 1,272 1,341 2,154 1,545 609 1,708 1,313 395 01047700 Chak Jandanwala -----------Un-inhabited-------------01047800 Chak Jeeda -----------U n-inhabi ted--------------01047900 Goniana Kalan 891 412 479 678 532 146 441 402 39 01048000 Goniana Khurd 1,155 536 619 904 608 296 860 586 274 01048100 Chak Goniana ka1an -------------Un-inhabited--------------01048200 Balahar Vinjhu 830 375 455 1,115 618 497 851 607 244 01048300 Amargarh 482 203 279 725 382 343 544 302 242 01048400 Nehianwala 2,876 1,324 1,552 2,339 1,784 555 2,067 1,689 378 01048500 Sibian 2,617 1,206 ' 1,411 2,231 1,588 643 1,426 [,288 [38 01048600 MehmaSarja 3,749 1,848 1,901 2,&04 2,064 740 2,248 1,837 411 01048700 MehmaSawai 2,402 1,113 1,289 2,330 1,409 921 2,069 1,333 736 01048800 Chak Goniana Khurd -----------Un-inhabited--------------01048900 AkaliaKalan 2,362 1,120 1,242 1,440 1;-171 269 1,349 1,120 229 01049000 Akalia Khurd 217 103 114 258 • 141 117 152 138 14 01049100 Balahar Mehma 797 360 437 557 494 63 509 488 21 01049200 Dan Singhwala 1,397 628 769 1,370 869 501 784 707 77 01049300 Warkandi 762 359 403 798 428 370 671 387 284 01049400 Ganga 1,506 716 790 1,147 830 317 867 808 59 01049500 Ablu 3,563 1,730 1,833 3,283 2,030 1,253 2,568 1,869 699 01049600 Mehma Sarkari 690 305 385 833 467 366 651 461 190 01049700 Mehma Bhagwana 704 317 387 853 460 393 500 412 88 01049800 Killi Niha1 Singhwali 1,315 629 686 747 665 82 642 597 45 01049900 Burj Mehma 2,084 972 1,112 1,238 1,023 215 1,128 1,008 120 01050000 Deon 3,441 1,627 1,814 2,765 1,955 810 2,001 1,777 224 01050100 Buladewala 1,110 469 641 1,037 659 378 773 624 149 01050200 Behman Dewana 2,750 1,271 1,479 2,396 1,480 916 IJ 619 1,323 296
01050300 BirBehman 1,136 520 616 1,077 680 397 829 639 190
01050400 Chugha Khurd 1,253 584 669 810 704 106 807 703 104
01050500 Ba1uana 2,186 971 1,215 2,245 1,305 940 1,318 1,233 85
01050600 Virk Kalan 1,353 639 714 1,291 777 514 683 655 28
01050700 Virk Khurd 1,051 515 536 785 588 197 632 582 50
01050800 Karamgarh Sallran 722 316 406 596 411 185 491 394 97
01050900 Sardargarh 996 446 550 1,038 619 419 927 597 330
01051000 Ghugha Kalan 1,909 862 1,047 1,939 1,118 821 1,693 1,036 657
01051100 Jhumba 2,124 1,000 1,124 1,520 1,357 163 1,499 1.349 150
01051200 Teona 1,985 921 1,064 1,593 1,107 486 1,290 1,093 197
01051300 Multania 599 261 338 418 358 . 60 406 355 51
01051400 Birta1ab UrfTalab Neehar 2,546 1,147 1,399 1,419 1,207 212 1,320 1,135 185
01051500 Naruana 1,906 878 1,028 1,410 996 414 998 929 69
01051600 Mian 422 210 212 344 236 108 330 231 99
01051700 Baho Sibian Patti Basawa 233 95 138 214 127 87 176 115 61
Singh 01051800 Baho Sibian Patti Dharam 207 85 122 322 157 165 320 156 164
Singh 01051900 Baho Jattri 459 210 249 406 285 121 363 277 86
01052200 Jodhpur Romana 1,015 463 552 713 617 96 640 572 68
01052300 Jassi Pauwali 1,388 640 748 1,465 841 624 1,385 826 559
244

PRIMARY CENSUS ABSTRACT
CENSUS ABSTRACT Bathinda
Industrial category of main workers
Household industry
Cultivators Agricultural labourers workers Other workers Persons Males Females Persons Males Females Persons Males Females Persons Males Females Name of Village
29 30 31 32 33 34 35 36 37 38 39 40 2
24,244 24,218
26
263 286 507 742 620 777 350 828
297 283
261 283 580 453
1,102 924
562 91
243 466 260 464
1,301 294 255 241 355 978 219 502 294 479 558 355 253 177 269 649 773 625 124 176 408 107
82
219
201 275 500
21,792 21,768
24
259 282 499 464 613 744 341 670
291 273
258 146 565 438 942 666
524 91
236 440 157 439
1,125 222 202 235 310 935 193 427 259 406 538 346 249 175 268 605 765 588 121 167 402 105
81
113
196 268 360
2,452 2,450
2
4 4 8
278 7
33 9
158
6 10
3 137
15 15
160 258
38
7 26
103 25
176 72 53 6
45 43 26 75 35 73 20 9 4 2 1
44 8
37 3 9 6 2
106
5 7
140
15,847 15,787
60
70 302 562 169 328 382 175 364
17 220
373 156 251 439 552 669
373 30
175 173 229 270 533 240 168 205 538 559 154 681 356 274 441 154 291 120 219 235 538 299 167 365 332 102
3
85
67 221 394
13,241 13,187
54
68 267 441 122 311 322 159 308
,
2,606 2,600
6
2 35
121 47 17 60 16 56
1,293 1,288
5
2 24 12 16 8
57 17 61
821 817
4
2 17 9
14 7
37 7
37 -----------Un-inhabited-----------------------Un-inhabited-------------
17 10 8 161 59 10 9
------------Un-inhabited-------------215 158 15 4
76 80 33 18 240 II 51 35 411 495 456
, 28 57
213
60 145
13
46 70 II
------------U n-inhabi ted------------346 27 46 37
16 14
472 471
1
7
3 2
20 10 24
2
II 15 16 14 75 2
9
171 144 134 258 415 154 156 190 496 517 127 574 256 244 418 151 260 119 188 207 503 249 151 344 310
4 29 95 12
7 13 24 II 67 12
6 I
98 3
38
40 192 257
118 86 12 15 42 42 27
107 100 30 23
3 31
I 31 28 35 50 16 21 22 4
47
27 29
137 •
6 14 23 40 20 50 6
16 54 6 2 4 3
41 5 4 2
73 19
10
4
9 5
10 3 11 ',. 13 9, 2
46 21 9 3 6 6
20 12 IS 39
6 16 47
6 2 2 1
21 5 3
16 12
9.
4
245
8 3
28 5
11
7
2 2
20
2. 57
7
3
8
17,780 15,983
1,797
164 192 178 155 251 594 220 455
t 17 347
202 72
1,185 474 449 463
368 30 84
132 158 122 667 105
71 182 212 424 380 386 173 38
265 168 86
190 436 768 183 362 113 706 239 121
81
12
95. 135 486
11,346 9,652 1,694
155 150 165 130 198 172 193 298
86 143
130 62
849 393 330 200
213 30 75
113 85
102 283
76 48
166 182 313 289 283 118 37
230 152 . 71
98 140 203 76
253 83
608 205 28 22
4
41 Itt 205
6,434 Bathinda (Total) 6,331 Bathinda (Rum1)
103 Bathinda (Urban) Bathinda (Rural)
9 Bhagu 42 Gill Patti 13 Bhokhra 25 Khialiwala 53 Har Raipur Urf Bhokhri
422 Jandanwala 27 Khemuana
157 Jeeda Chak Jandanwala Chak Jeeda
3 t Goniana Kalan 204 Goniana Khurd
Chak Goniana kalan 72 Balahar Vinjhu 10 Amargarh
336 Nehianwala 81 Sibian
I 19 Mehma Sarja 263 Mehma Sawai
Chak Goniana Khurd 155 Akalia Kalan
Akalia Khurd 9 Balahar Mehma
19 Dan Singhwala 73 Warkandi 20 Ganga
384 Ablu 29 Mehma Sarkari 23 Mehma Bhagwana 16 Killi Nihsl Singhwali 30 Burj Mehma
III Deon 91 Buladewala
103 Behman Dewana 5S Bir Behman
1 Chugha Khurd 3S Baluana 16 Virk Kalan IS Virk Khurd 92 Karamgarh Sattran
296 Sardargarh 565 Ghugha Kalan 107 Jhumba 109 Teona 30 Multania 98 Birtalab urr Talab Neehar 34 Naruana 93 Mian 59 Baho Sibian Patti Basawa
Singh 8 Babo Sibian Patti Dharam
Singh 54 Babo Jattri 24 Jodhpur Romana
281 Jassi Pauwali

DISTRICT CENSUS HANDBOOK: BATHINDA
VILLAGE PRIMARY C DBlock-
Industrial cate~0!X Location
code Marsinal workers Cultivators AS:!icuiturallabourers number Name ofVillase Persons Males Females Persons Males Females Persons Males Females
1 2 41 42 43 44 45 46 47 48 49
0004 Bathinda (Total) 14,203 3,806 10,397 1,913 • ~77 1,436 5,370 1,982 3,388 0004 Bathinda (Rural) 14,192 3,798 10,394 1,913 477 1,436 5,369 1,981 3,388 0004 Bathinda (Urban) 11 8 3 I 1
Bathinda (Rural) 01046600 Bhagu 320 94 226 4 2 2 70 57 13 01047000 Gill Patti 676 231 445 32 22 10 197 125 72 01047100 Bhokhra I I I 01047200 Khialiwala 45 26 19 9 7 2 II 2 9 01047300 I Har Raipur UrfBhokhri 373 S5 31B 24 7 17 193 33 160 01047400 Jandanwala 722 304 418 40 21 19 285 172 113 01047500 Khemuana 191 108 83 3 2 I 135 80 55 01047600 Jeeda 446 232 214 44 .14 30 290 181 109 01047700 Chak Jandanwala -----Un-inhabited-----------01047800 ChakJeeda ---Un-inhabited--------01047900 Goniana Kalan 237 130 107 14 5 9 98 94 4 01048000 Goniana Khurd 44 22 22 2 39 21 18 01048100 Chak Goniana kalan ---Un-inhabited------01048200 Balabar Vinjhu 264 II 253 4 4 11 4 7 01048300 Amargarh 181 80 101 73 35 38 81 38 43 01048400 Nehianwala 272 95 177 16 JO 6 75 23 52 01048500 Sibian 805 300 ~ 505 61 9 52 422 178 244 01048600 Mehma Sarja 556 227 329 68 12 56 225 160 65 01048700 MehmaSawai 261 76 185 33 14 19 110 12 98 01048800 Chak Goniana Khurd ---------Un-inhabited--------------01048900 Akalia Kalan 91 51 40 8 6 2 45 22 23 01049000 Akalia Khurd 106 3 103 1 1 6 4 4 01049100 Balabar Mehma 48 6 42 5 4 33 32 01049200 Dan Singhwala 586 162 424 32 10 22 453 142 311 01049300 Warkandi 127 41 86 35 11 24 63 14 49 01049400 Ganga 280 22 258 1 4 3 168 8 160 01049500 Ablu 715 161 554 75 21 54 188 70 118 01049600 Mehma Sarkari 182 6 176 47 3 44 6 I 5 01049700 Mehma Bhagwana 353 48 305 155 18 137 164 24 140 01049800 Killi Nihal Singhwali 105 68 37 15 14 21 9 12 01049900 Burj Mehma 110 15 95 1 I 18 4 14 01050000 Deon 764 178 586 51 18 33 187 64 123 01050100 Buladewala 264 35 229 22 II 11 22 9 13 01050200 Behman Dewana 777 157 620 296 55 241 404 67 337 01050300 BirBehman 248 41 207 51 10 41 113 21 92 01050400 Chugha Khurd 3 2 2 1 01050500 Baluana 927 72 855 44 22 22 48 18 30 01050600 Virk Kalan 608 122 486 243 28 215 310 66 244 01050700 Virk Khllrd 153 6 147 130 4 126 15 I 14 01050800 Karamgarh Sattran 105 17 88 25 3 '22 61 7 54 01050900 Sardargarh 111 22 89 3 2 61 IS 46 01051000 Ghugha Kalan 246 82 164 14 3 11 69 49 20 01051100 Jhumba 21 8 13 5 2 3 3 2
01051200 Teona 303 14 289 48 2 46 97 10 87
01051300 Multania 12 3 9 I I
01051400 Birtalab UrfTalab Neehar 99 72 27 8 6 2 6 5 01051500 Naruana 412 67 345 20 15 5 249 44 205 01051600 Mian 14 5 9 3 3 9 2 7
01051700 Babo Sibian Patti Basawa 38 12 26 2 2 12 4 8
Singh 01051800 Babo Sibian Patti Dharam 2
Singh 01051900 Babo Jattri 43 8 35 6 6
01052200 Jodhpur Romana 73 45 28 3 . .,. 2 49 35 14
01052300 Jassi Pauwali 80 15 65 4 4 13 3 10
246

PRIMARY CENSUS ABSTRACT
CENSUS ABSTRACT Bathinda
of mar~inal workers
Location Household indus!!}: workers Other workers Non-workers code Persons Males Females Persons Males Females Persons Males Females Name ofVilla~e number
50 51 52 53 54 55 56 57 58 2 1
612 94 518 6,308 1,253 5,055 95,612 38,815 56,797 Bathinda (Total) 0004 611 93 518 6,299 1,247 5,052 92,736 37,762 54,974 Bathinda (Rural) 0004
I 9 6 3 2,876 1,053 1,823 Bathinda (Urban) 0004 Bathinda (Rural)
5 5 241 35 206 1,086 418 668 Bhagu 01046600 19 3 16 428 81 347 1,477 671 806 Gill Patti 01047000
2,526 857 1,669 Bhokhra 01047100 4 3 21 16 5 1.,415 607 808 Khialiwa1a 01047200
II 11 145 IS 130 2,368 941 1,427 Har Raipur Urf Bhokhri 01047300 32 15 17 365 96 269 2,205 957 1,248 Jandanwala 01047400 6 6 47 26 21 1,771 627 1,144 Khemuana 01047500
13 4 9 99 33 66 2,980 1,203 1,777 leeda 01047600 ---Un-inhabited----- Chak landanwala 01047700 -------Un-inhabited------ ChakJeeda 01047800
7 5 2 118 26 92 1,123 424 699 Goniana Kalan 01047900 3 3 1,125 446 679 Goniana Khurd 01048000
---Un-inhabited----- Chak Goniana kalan 01048100 I I 248 7 241 734 369 365 Bslahar Vinjhu 01048200
18 2 16 9 S 4 329 176 153 Amargarh 01048300 18 I 17 163 61 102 3,744 1,418 2,326 Nehianwala 01048400 68 13 55 254 1M 154 3,186 1,283 1,903 Sibian 01048500 32 2 30 231 53 178 4,256 1,768 2,488 MehmBSarja 01048600
2 2 116 50 66 2,369 1,078 1,291 MehmaSawai 01048700 ---Un-inhabited------ Chak Goniana Khurd 01048800
5 4 I 33 19 14 2,739 1,038 1,701 Akalia Kalan 01048900 9 9 86 2 84 264 147 117 AkaliaKhurd 01049000
I 9 I 8 1,027 362 665 Ba1ahar Mehma 01049100 11 3 8 90 7 83 1,493 625 868 Dan Singhwala 01049200 6 5 23 15 8 501 'r 247 254 Warkandi 01049300
9 9 96 10 86 1,697' 662 1,035 Ganga 01049400
136 4 132 316 66 250 3,407 1,564 1,843 Ablu 01049500
13 13 116 2 114 738 346 392 Mehma Sarkari 01049600
5 2 3 29 4 25 536 262 274 Mehma Bhagwana 01049700
5 5 64 58 6 1,638 585 1,053 Killi Nihsl Singhwali 01049800
6 3 3 85 8 77 2,280 786 1,494 Burj Mehma 01049900
25 24 501 95 406 3,722 1,518 2,204 Deon 01050000
3 3 217 15 202 1,308 557 751 Buladewala 01050100
20 8 12 57 27 30 2,585 1,126 1,459 Behman Dewana 01050200
I 83 10 73 1,147 494 653 BirBehman 01050300
1 1,435 479 956 Chugha Khurd 01050400
7 3 4 828 29 799 2,204 1,019 1,185 Baluana 01050500 55 28 27 1,229 556 673 V.irkKalan 01050600
8 7 1,065 407 658 VirkKhurd 01050700 19 7 12 775 307 468 Karamgarh Sattran 01050800
1 I 46 5 41 1,071 485 586 Sardargarh 01050900
12 3 9 151 27 124 1,795 818 977 Ghugha Kalan 01051000
12 5 1 2,549 813 1,736 lhumba 01051100
2 156 1 155 2,012 785 1,227 Teona 01051200
4 4 7 3 4 902 J45 557 Multania 01051300
1 84 65 19 3,088 1,189 1,899 Birtalab UrfTalab Neehar 01051400
32 31 111 7 104 2,140 858 1,282 Naruana 01051500
2 2 452 205 247 Mian 01051600
24 6 18 240 102 138 Baho Sibian Patti Basawa 01051700
Singh 194 }06 88 Baho Sibian Patti Dharam 01051800
Singh 36 2 34 505 209 296 Baho Jaud 01051900
6 6 15 8 7 1,370 479 891 Jodhpur Romana 01052200
63 8 SS 1,294 632 662 Jassi Pauwali 01052300
247

DISTRICT CENSUS HANDBOOK: BATHINDA
VILLAGE PRIMARY CD Block-
Total population (including Location Area of institutional and houseless Population in the
code Village in Number of ~ulation} age-8!0u2 0-6 number Name of Village hectares households Persons Males Females Persons Males Females
1 2 3 4 5 6 7 8 9 10
01052400 PhusMandi 404.0 297 1,667 889 778 211 123 88 01052500 Gulabgarh UrfNaiwala 573.0 282 1,636 873 763 184 108 76 01053100 KotShamir 4,607.0 1,580 9,314 4,900 4,414 1,257 710 547 01053200 Katar Singhwala 564.0 313 1,866 1,000 866 252 148 104 01053300 Gehri Devi nagar 1,953.0 729 4,267 2,307 1,960 503 289 214
Bathinda (Urban) 41402000 Bhisiana (CT) 1,164 4,775 2,837 1,938 731 416 315
248

PRIMARY CENSUS ABSTRACT
CENSUS ABSTRACT Bathinda
Scheduled Castes EOEuation Persons Males Females
11 12 13
909 483 426 495 271 224
3,098 1,637 1,461 632 323 309
1,017 541 476
683 J62 321
Scheduled Tribes Eopulation Persons Males Females
14 15 16
249
Literates Persons Males Females Name of Village
17 . 18 19 2
770 453 317 PhusMandi 976 591 385 Gulabgarh UrfNaiwala
3,734 2,181 1,553 Kot Shamir 907 561 346 Katar Singhwala
1,883 1,148 735 Gehri Devi nagar Bathinda (Urban)
J,541 2,214 l,n7 Bhisiana (CT)

DISTRICT CENSUS HANDBOOK: BATHINDA
VILLAGE PRIMARY CD Block-
Location code Illiterates Total workers Main workers
number Name ofVilla~e Persons Males Females Persons Males Females Persons Males Females
2 20 21 22 23 24 25 26 27 28
01052400 Phus Mandi 897 436 461 663 423 240 634 409 225 01052500 Gulabgarh UrfNaiwala 660 282 378 85~ 463 389 612 423 189 01053100 Kot Shamir 5,580 2,719 2,861 3,543 2,787 756 3,268 2,655 613 01053200 Katar Singhwala 959 439 520 753 550 203 734 540 194 01053300 Gehri Devi nagar 2,384 1,159 1,225 2,299 1,340 959 2,070 1,296 774
Bathinda (Urban) 41402000 Bltisiana (CT) 1,234 623 611 1,899 1,784 liS 1,888 1,776 li2
250

PRIMARY CENSUS ABSTRACT
CENSUS ABSTRACT Bathinda
Industrial cateso!1 of main workers Household industry
Cultivators Agricultural labourers workers Other workers Persons Males Females Persons Males Females Persons Males Females Persons Males Females Name of Village
29 30 31 32 33 34 35 36 37 38 39 40 2
126 121 5 375 206 169 43 18 25 '90 64 26 Phus Mandi ' 207 184 23 46 39 7 18 14 4 341 186 155 Gulabgarh UrfNaiwala
1,582 1,508 74 940 802 138 45 37 8 701 308 393 Kot Shamir 212 199 13 155 126 29 22 J8 4 345 197 148 Katar Singhwala 780 757 23 251 219 32 29 20 9 1,010 300 710 Gehri Devi nagar
Bathinda (Urban) 26 24 2 60 54 , 6 5 4 1,797 1,694 103 Bhisiana (CT)
251

Location code Mar~inal workers
number Name ofVilla~e Persons Males Females
2 41 42 43
01052400 PhusMandi 29 14 15 01052500 Gulabgarh UrfNaiwa1a 240 40 200 01053100 Kot Shamir 275 132 143 01053200 Katar Singhwala 19 10 9 01053300 Gehri Devi nagar 229 44 185
Blithinda (Urban) 41402000 Bhisiana (CT2 11 8 3
252
Persons
44
2 38 55 2
26
DISTRICT CENSUS HANDBOOK: BATHINDA
Cultivators Males Females
45 46
2 7 31
23 32 1
,.. 12 14
VILLAGE PRIMARY CD B1ock-
Industrial category
Al2:iculturallabourers Persons Males Females
47 48 49
21 11 10 62 22 40 71 30 41
8 3 5 66 16 50

PRIMARY CENSUS ABSTRACT
CENSUS ABSTRACT Bathinda ,.. of marsinai workers
Location
Household indus!!i: workers Other workers Non-workers code Persons Males Females Persons Males Females Persons Males Females Name ofVilla~e number
50 51 52 53 54 55 56 57 58 2 1
4 3 2 2 1,004 466 538 Ph us Mandi 01052400 18 17 122 10 112 784 410 374 Gulabgarh UrfNaiwala 01052500 20 6 14 129 73 56 5,771 2,113 3,658 Kot Shamir 01053100
9 6 3 1,113 450 663 Katar Singhwala - 01053200 8 5 3 129 11 118 1,968 967 1,001 Gehri Devi nagar 01053300
Batbinda (Urban) 9 6 3 2,876 1,053 1,823 Bhisiana ~CT~ 41402000
253

DISTRICT CENSUS HANDBOOK: BATHINDA
VILLAGE PRIMARY CD Block-
Total population (including Location Area of institutional and houseless Population in the
code Village in Number of EOEulation~ age-8!0uE 0-6 number Name of Villa Be hectares households Persons Males Females Persons Males Females
1 2 3 4 5 6 7 8 9 10
0005 Sangat (Total) 46,187.0 17,300 100,681 52,909 47,772 13,349 7,377 5,972 0005 Sangat (Rural) 46,187.0 17,300 100,681 52!909 47,772 13,349 7,377 5,972 OOOS Sangat (Urban)
Sangat (Rural) 01052000 Jai Singhwala 1,838.0 724 4,549 2,385 2,164 602 341 261 01052100 Gurusar Sainewala 988.0 413 2,468 1,279 1,189 324 177 147 01053400 Mehta 1,204.0 478 2,637 1,409 1,228 262 143 119 01053500 Gehri Buttar 1,223.0 588 3,485 1,791 1,694 469 259 210 01053600 Ancorgarh Urf Machhana 484.0 225 1,263 644 619 159 74 85 01053700 Sangat Kalan 1,799.0 38 199 103 96 21 9 12 01053800 PhuloMithi 1,694.0 630 3,692 1,940 1,752 489 279 210 01053900 KotGuru 965.0 412 2,373 1,245 1,128 313 185 128 01054000 Ghudda 1,890.0 855 4,649 2,438 2,211 569 320 249 01054100 Nandgarh 667.0 310 1,734 906 828 235 125 110 01054200 Bajak 1,091.0 402 2,444 1,306 1,138 338 187 151 01054300 Janghi Rana 1,764.0 631 3,795 1,989 1,806 512 289 223 01054400 Raike Khurd UrfChak Dana 384.0 195 1,118 592 526 155 75 80 01054500 Sahadargarh Jandian 641.0 272 1,487 804 683 150 94 56 01054600 Lool Sai 467.0 222 1,436 748 688 199 105 94 01054700 Raike Kalan 1,743.0 784 4,434 2,328 2,106 551 285 266 01054800 Rarnbiha 1,341.0 472 2,816 1,477 1,339 384 229 155 01054900 Chak Attar Singhwala 936.0 449 2,478 1,297 1,181 292 165 127 01055000 KaljhaRani 1,501.0 547 3,357 1,777 'r- 1,580 483 270 213 01055100 Kotli Sabo 616.0 183 1,072 5431 529 154 87 67 01055200 Faridkot 1,068.0 341 1,859 994 865 225 140 85 01055300 Chak Kharak SinghwaJa 1,183.0 574 3,181 1,708 1,473 447 244 203
UrfDoomwali 01055400 Pathrala 2,926.0 1,022 6,233 3,251 2,982 879 493 386 01055500 Sandi 2,136.0 697 3,913 2,076 1,837 539 291 248 01055600 Dhunike 607.0 200 1,085 568 517 195 99 96 01055700 Muhlan 437.0 138 904 479 425 135 65 70 01055800 Jassi Bagwali 1,798.0 520 3,193 1,672 1,521 476 262 214 01055900 KishanpuTa UrfKutti 740.0 240 1,527 772 755 170 86 84 01056000 Chak Ruldu SinghwaJa 1,145.0 511 2,845 1,492 1,353 403 233 170 01056100 Jodhpur Bagga Singh Alias 817.0 312 1,967 1,029 938 274 162 112
Phalran 01056200 Sekho 1,919.0 724 4,078 2,134 1,944 586 318 268 01056300 Chak HiTa Singhwala Urf 869.0 340 1,901 990 911 283 143 140
PakkaKhuTd 01056400 PakkaKaJan 3.153.0 1,301 7,586 3,972 3,614 979 545 434 01056500 Amarpura UrfGurthuri 596,0 285 1,615 860 755 176 105 71 01056600 Dunewala 487.0 171 965 528 437 106 59 47 01056700 Bhagwangarh Urf 1,395.0 389 2,260 1,204 1,056 275 140 135
Bhukhianwali 01056800 Shergarh 895.0 293 1,689 903 786 223 120 103
01057200 Malwala 780.0 412 2,394 1,276 1,118 317 174 143
254

PRIMARY CENSUS ABSTRACT
CENSUS ABSTRACT Sangat
Scheduled Castes I!0l?:uation Scheduled Tribes I!0l!ulation Literates Persons Males Females Persons Males Females Persons Males Females Name ofVilla&e
I1 ,12 13 14 15 16 17 18 19 2
34,332 18,049 16,283 46,314 27,700 18,614 Sangat (Total) 34,332 18,049 16,283 46,314 27,700 18,614 Sangat (Rural)
Sangat (Urban) Sangat (Rural)
1,738 908 830 2,080 1,194 886 Jai Singhwala 1,404 732 672 1,131 662 469 Gurusar Sainewala
882 489 393 1,399 858 541 Mehta 1,292 670 622 1,619 931 688 Gehri Buttar
375 191 184 644 376 268 Ancorgarh UrfMachhana 65 32 33 106 65 41 Sanga! Kalan
1,189 618 571 1,790 1,079 711 Phu\oMithi 1,190 614 576 1,019 586 433 KotGuru 1,046 553 493 2,322 1,352 970 Ghudda
700 370 330 792 491 301 Nandgarh 684 373 311 1,226 751 475 Bajak
1,082 578 504 \,697 983 714 Janghi Rana 526 ' 279 247 570 371 199 Raike Khurd UrfChak Dana 698 377 321 721 455 266 Bahadargarh Jandian 703 372 331 597 352 245 Loo1 Bai
1,695 887 808 2,126 1,302 824 RaikeKalan 531 267 264 1,254 735 519 Rambiha 994 525 469 1,102 648 454 Chak Attar Singhwala
1,059 572 487 1,561 942 619 Kaljha Rani
197 98 99 540 314 226 Kotli Sabo
542 296 246 869 528 341 Faridkot
1,177 613 564 1,541 941 600 Chak Kharak Singhwala UrfDoomwali
2,209. 1,139 1,070 2,563 1,528 1,035 Pathrala
1,002 527 475 1,834 1,094 740 Bandi
702 367 335 469 285 184 Dhunike 217 115 102 456 274 182 Muhlan
913 475 438 1,437 865 572 Jassi Bagwali
512 247 265 618 365 253 Kishanpura UrfKulti
1,724 913 811 1,139 702 437 Chak Ruldu Singhwala
722 390 332 879 516 363 Jodhpur Bagga Singh Alias Phalran
1,125 593 532 1,877 1,102 775 Sekho
740 383 357 837 522 315 Chak Hira Singhwala Urf PakkaKhurd
2,070 1,090 980 3,582 2,099 1,483 PakkaKaian
333 181 152 785 471 314 Amarpura UrfGurthuri
118 60 58 379 244 135 Dunewala
592 310 282 1,055 659 396 Bhagwangarh Urf Bhukhianwali
617 328 289 821 501 314 Shergarh
967 517 450 877 sst 326 Malwala
255

DISTRICT CENSUS HANDBOOK: BATHINDA
VILLAGE PRIMARY CD Block-
Location
code Illiterates Total workers Main workers number Name ofVilla~e Persons Males Females Persons Males Females Persons Males Females
1 2 20 21 22 23 24 25 26 27 28
0005 8angat (Total) 54,367 25,209 29,158 49,428 30,163 19,265 39,474 27,620 II ,854 0005 8angat (Ru ra I) 54,367 25,209 29,158 49,428 30,163 19,265 39,474 27,620 11,854 0005 8angat (Urban)
Sangat (Rural) 01052000 Jai Singhwala 2,469 1,191 1,278 2,395 1,328 1,067 2,262 1,261 1,001 01052100 Gurusar Sainewala 1,337 617 720 1,119 750 369 587 454 133 01053400 Mehta 1,238 551 687 1,236 755 481 971 687 284 01053500 Gehri Buttar 1,866 860 1,006 1,590 1,040 550 1,40] 1,002 399 01053600 Ancorgarj} UrfMachhana 619 268 351 656 356 300 364 316 48 01053700 Sangat Kalan 93 38 55 71 69 2 71 69 2 01053800 PhuloMithi 1,902 861 1,041 1,375 951 424 1,233 915 318 01053900 Kot Guru 1,354 659 695 1,316 718 598 1,082 674 408 01054000 Ghudda 2,327 1,086 1,241 2,269 1,380 889 1,848 1,306 542 01054100 Nandgarh 942 415 527 1,016 531 485 1,013 529 484 01054200 Bajak 1,218 555 663 1,341 765 576 1,229 699 530 01054300 Janghi Rana 2,098 1,006 1,092 1,927 1,092 835 1,385 735 650 01054400 Raike Khurd UrfChak Dana 548 221 327 740 411 329 404 357 47 01054500 Bahadargarh Iandian 766 349 417 691 482 209 449 421 28 01054600 LooIBai 839 396 443 812 497 315 745 488 257 01054700 RaikeKalan 2,308 1,026 1,282 1,944 1,287 657 1,593 1,249 344 01054800 Rambiha 1,562 742 820 1,492 866 626 1,325 814 511 01054900 Chak Attar Singhwala 1,376 649 727 836 704 132 749 685 64 01055000 KaljhaRani 1,796 835 961 1,653 994 659 1,242 974 268 01055100 Kot1i Sabo 532 229 303 588 306 282 308 294 14 01055200 Faridkot 990 466 524 895 ii'"565 330 546 476 70
01055300 Chak Kharak Singhwala 1,640 767 873 1,032 , 896 136 799 702 97 UrfDoomwali
01055400 Pathrala 3,670 1,723 1,947 3,274 1,823 1,451 2,171 1,644 527 01055500 Bandi 2,079 982 1,097 1,849 1,221 628 1,582 1,179 403 01055600 Dhunike 616 283 333 444 313 131 321 302 19 01055700 Muhlan 448 205 243 300 250 50 247 234 13 01055800 Jassi Bagwali 1,756 807 949 1,363 960 403 ),272 940 332 01055900 Kishanpura UrfKutti 909 407 502 587 466 121 464 448 16 01056000 Chak Ruldu Singhwala 1,706 790 916 1,374 781 593 1,290 754 536 01056100 Jodhpur Bagga Singh Alias 1.088 513 .575 1,187 617 570 716 586 130
Phalran 01056200 Sekho 2,201 1,032 1,169 2,429 1,263 1,166 2,316 1,229 1,087
01056300 Chak Hira Singhwala Urf 1,064 468 596 1,100 604 496 740 549 191 PakkaKhurd
01056400 PakkaKalan 4,004 1,873 2,131 4,148 2,279 1,869 3,360 2,140 1,220
01056500 Amarpura UrfGurthuri 830 389 441 996 546 450 806 530 276
01056600 Dunewala 586 284 302 589 349 240 452 338 114
01056700 Bhagwangarh Urf 1,205 545 660 1,031 690 341 823 678 145
Bhukhianwali 01056800 Snergarh 868 396 472 584 503 81 435 372 63 01057200 Malwala 1,517 725 792 1,179 755 424 873 590 283
256

PRIMARY CENSUS ABSTRACT
CENSUS ABSTRACT Saogat
Industrial category of main workers
Cultivators Agricultural labourers Persons Males Females Persons Males Females
29 30 31 32 33 . 34
18,819 18,819
1,298 231 311 573 121 36
527 712 832 350 391 627 168 190 228 683 527 341 437 190 364 119
1,038 762 101 95
661 265 254 416
1,518 396
2,072 589 332 479
279 306
15,033 15,033
723 230 299 510 III 36
470 438 730 322 385 571 166 185 219 622 499 331 416 186 330
113
976 702
99 92
491 257 202 314
772 315
1,344 383 237
397
268 292
3,786. 3,786
575 I
12, 63 10
57 274 102 28 6
56 2 5 9
61 28 10 21
4 34
6
62 60 2 3
170 8
52 102
746 81
728 206
95 82
II 14
10,408 10,408
835 87
145 469 149 24
156 244 349 121 242
32 143 170 250 711 231 279 400 67
108 230
400 303 142 74
448 140 818 263
591 236
888 94 76
252
7 234
7,598 7,598
451 86
135 325 123 22
152 132 274 116
184 29
135 168 240 467 155 259 311
67 96
214
334 278 135 67
306 137 468 238
327 142
488 71 64
204
4 194
2,810 2,810
384
10 144 26
2 4
112 75
5 58
3 8 2
10 244
76 20 89
12 16
66 25
7 7
142 3
350 25
264 94
400 23 12 48
3 40
Household industry workers ';'
Persons Males females 3S 36 37
672 672
15 9
28 15 4
17 13 27
3 19 17 4 3 5
20 48 28 50
II 51
20 5 9
38 14 2 4
33 8
81 8
18 10
29 6
423 423
8 8
17 8 4
10 5
16 2
13 16 4 2 -3
13 24 II 24
7
35
257
8
7 36 14 2
"2
13 7
55 3
14 IO
16 5
249 249
7
II 7
7 8
II I 6
2 7
24 17 26
4
16
12 4 2 2
2
20 I
26 5 4
13 I
Other workers Persons Males Females Name of Village
38 39 40 2
9,575 9,575
114 260 487 344 90 II
533 113 640 539 577 709
89 86
262 179 519 101 355
51 63
399
713 512
69 40
149 57
214 37
174 100
319 115 26
82
120 327
4,566 4,566
79 130 236 159 78 II
283 99
286 89
117 119 52 66 26
147 136 84
223 41 43
340
326 198 61 39
129 52 82 34
117 85
253 73 23 67
84 99
5,009 Sangat (fotal) 5,009 Sangat (Rural)
Sangat (Urban) Sangat (Rural)
35 Jai Singhwala 130 Gurusar Sainewala 251 Mehta 185 Gehri Buttar
12 Ancorgarh UrfMachhana Sangat Kalan
250 Phulo Milhi 14 KotGuru
354 Ghudda 450 Nandgarh 460 Bajak 590 Janghi Rana 37 Raike Khurd UrfChak Dana 20 Bahadargarh landian
236 Lool8ai 32 Raike Kalan
383 Rambiha 17 Chak Attar Singhwala
132 Kaljha Rani 10 Kotli Sabo 20 Faridkot 59 Chak Kharak Singhwala
UrfDoomwali 387 Pathrala 314 Bandi
8 Dhunike I Muhlan
20 Jassi Bagwali 5 Kishanpura UrfKutti
132 Chak Ruldu Singhwala 3 Jodhpur Bagga Singh Alias
Phalran 57 Sekho 15 Chak Hira Singhwala Urf
PakkaKhurd 66 Pakka Kalan 42 Amarpura Urf Gurthuri
3 Dunewala 15 Bhagwangarh Urf
Bhukhianwali 36 Shergarh
228 Malwala

DISTRICT CENSUS HANDBOOK: BATHINDA
VILLAGE PRIMARY CD Block-
Industrial cate80!i: Location
code Mar8inal workers Cultivators AlEiculturallabourers nwnber Name ofVilla8e Persons Males Females Persons Males Females Persons Males Females
2 41 42 43 44 45 46 47 48 49
0005 Sangat (Total) 9,954 2,543 7,411 2,740 385 2,35S 4,344 1,589 2,755 0005 Sangat (Rural) 9,954 2,543 7,411 2,740 385 2,355 4,344 },589 2,755 0005 Sangst (Urban)
Sangst (Rural) 01052000 Jai Singhwala 133 67 66 6 2 4 127 65 62 01052100 Gurusar Sainewala 532 296 236 6 . 3 3 223 205 18 01053400 Mehta 265 68 197 24 18 6 82 32 50 01053500 Gehri Bullar 189 38 151 22 10 12 62 19 43 01053600 Ancorgarh UrfMachhana 292 40 252 12 8 4 10} )0 91 01053700 Sangat Kalan 01053800 PhuloMithi 142 36 106 34 13 21 91 10 81 01053900 KotGuru 234 44 190 135 18 117 82 21 61 01054000 Ghudda 421 74 347 118 20 98 110 28 82 01054100 Nandgarh 3 2 1 1 01054200 Bajak 112 66 46 25 21 4 20 20 01054300 JanghiRana 542 357 185 9 6 3 491 327 164 01054400 Raike Khurd UrfChak Dana 336 54 282 49 7 42 229 44 185 01054500 Bahadargarh landian 242 61 181 14 8 6 126 40 86 01054600 Lool Bai 67 9 58 10 6 4 22 2 20 01054700 RaikeKalan 351 38 313 266 19 247 45 16 29 01054800 Rarnbiha 167 52 115 60 34 26 9 3 6 01054900 Chak Attar Singhwala 87 19 68 56 3 53 7 5 2 01055000 Ka1jhaRani 411 20 391 217 10 207 182 9 173 01055100 Kotli Sabo 280 12 268 13 2 II 88 8 80 01055200 Faildkot 349 89 260 178 10 168 134 78 56 01055300 Chak Kharak Singhwala 233 194 39 5 4 3 3
UrfDoomwali .,..
01055400 Pathrala 1,103 179 924 194 38 156 313 106 207 01055500 Bandi 267 42 225 22 14 8 109 12 97 01055600 Dhunike 123 11 112 92 9 83 27 2 25 01055700 Muhlan 53 16 37 18 4 14 12 to 2 01055800 Jassi Bagwali 91 20 71 19 9 10 8 7 I
01055900 Kishanpura UrfKutti 123 18 105 116 11 105 01056000 Chak Ruldu Singhwala 84 27 57 10 3 7 67 24 43 01056100- Jodhpur Bagga Singh Alias 471 31 440 256 13 243 212 16 196
Pha1ran 01056200 Sekho 113 34 79 30 1 29 49 19 30 01056300 Chak Hira Singhwala Urf 360 55 305 212 26 186 145 29 116
PakkaKhurd 01056400 PakkaKaJan 788 139 649 305 32 273 ·442 101 341 01056500 Amarpura UrfGurthuri 190 16 174 118 4 114 35 8 27 01056600 Dunewala 137 11 126 87 2 85 39 6 33 01056700 Bhagwangarh Ur[ 208 12 196 112 3 109 95 9 86
Bhukhianwali 01056800 Shergarh 149 131 18 6 5 138 122 16 01057200 Malwala 306 165 141 302 161 141
258

PRIMARY CENSUS ABSTRACT
CENSUS ABSTRACT Sangat
of marsinal workers
Location, Household indus!!}:: workers Other workers Non-workers code Persons Males Females Persons Males Females Persons Males Females Name of Villa~e number
50 51 , 52 53 54 55 56 57 58 2 I 219 29 190 2,651 540 2,111 51,253 22,746 28,507 Sangat (Total) 0005 219 29 190 ' 2,651 540 2,111 51,253 22,746 28,507 Sangat (Rural) 0005
Sangat (Urban) 0005 Sangat (Rural)
2,f54 1,057 1,097 Jai Singhwala 01052000 303 88 215 1,349 529 820 Gurusar Sainewala 01052100
20 5 IS 139 13 126 1,401 654 747 Mehta 01053400 lOS 9 96 1,895 751 1,144 Gehri Buttar 01053500
10 3 7 169 19 150 607 288 319 Ancorgarh UrfMachhana 01053600 128 34 94 Sangat Kalan 01053700
2 2 IS 13 2 2,317 989 1,328 PhuloMithi 01053800 4 4 13 5 8 1,057 527 530 KotGuru 01053900
30 3 27 163 23 140 2,380 1,058 1,322 Ghudda 01054000 2 I 718 375 343 Nandgarh 01054100
1 1 66 24 42 1,103 541 562 Bajak 01054200 3 2 1 39 22 17 1,868 897 971 Janghi Rana 01054300
10 10 48 3 45 378 181 197 Raike Khurd UrfChak Dana 01 054400 102 13 89 796 322 474 Bahadargarh Jandian 01054500
2 2 33 32 624 251 373 Lool Bai 01054600 13 12 27 2 25 2,490 1,041 1,449 RaikeKalan 01054700 33 32 65 14 51 1,324 611 713 Rarnbiha 01054800
2 2 22 11 11 1,642 593 1,049 Chak Attar Singhwa1a 01054900 3 3 9 I 8 1,704 783 921 KaljhaRani 01055000 I I 178 2 176 484 237 247 KotiiSabo 01055100 7 7 30 I 29 964 429 535 Faridkot 01055200
18 17 207 186 21 2,149 812 1,337 Chak Kharak Singhwala 01055300 UrfDoomwali
24 1 23 572 34 538 2,959 1,428 1,531 Pathrala 01055400 6 4 2 130 12 1I8 2,064 855 1,209 Bandi 01055500
4 4 641 255 386 Dhunike 01055600 8 8 15 2 13 604 229 375 Muhlan 01055700 I 63 3 60 1,830 712 1,118 Jassi Bagwali 01055800
7 7 940 'I'" 306 634 Kishanpura UrfKutti 01055900 6 6 1,471 711 760 Chak Ruldu Singhwala 01056000 3 2 780 412 368 Jodhpur Bagga Singh Alias 01056100
Phalran 5 3 2 29 II 18 1,649 871 778 Sekho 01056200 I I 2 2 801 386 415 Chak Hira Singhwala Urf 01056300
PakkaKhurd 5 5 36 6 30 3,438 1,693 1.745 PakkaKalan 01056400
37 4 33 619 314 305 Amarpura UrfGurthuri 01056500 4 4 7 3 4 376 179 197 Dunewala 01056600
1,229 514 715 Bhagwangarh urr 01056700 Bhukhianwali
1 4 4 1,105 400 705 Shergarh 01056800 3 3 1,215 521 694 Malwala 01057200
259

DISTRICT CENSUS HANDBOOK: BATHINDA
VILLAGE PRIMARY CD Block-
Total population (including Location Area of institutional and houseless Population in the
code Village in Number of EOEulati01!2 a1!:e-~ouE 0-6 number Name ofVilla1!:e hectares households Persons Males Females Persons Males Females
I 2 3 4 5 6 7 8 9 10
0006 Talwandi Sabo (Total) 54,020.0 22,071 129,364 68,664 60,700 17,295 9,661 7,634 0006 Talwandi Sabo (Rural) 54,020.0 22,071 129,364 68,664 60,700 17,295 9,661 7,634 0006 Talwandi Sabo (Urban)
Talwandi Sabo (Rural) 01056900 Kailebandar 1,732.0 657 3,917 2,084- 1,835 477 249 228 01057000 KotBakhtu 1,743.0 698 4,345 2,30\0 2,035 619 359 260 01057100 Manwala UrfKishangarh 675.0 317 1,833 929 904 219 114 105 01057300 Bangi Dipa Singh 601.0 316 1,866 990 876 225 121 104 01057400 Bangi Rughu 565.0 268 1,502 799 703 158 92 66 01057500 Sukh1adhi 800.0 378 2,405 1,293 1,112 308 170 138 01057600 Bagha 1,153.0 516 2,931 1,542 1,389 407 225 182 01057700 Tarkhanwala 1.220.0 282 1,758 918 840 206 107 99 01057800 Ramsara 576.0 403 2,412 1,439 1,173 362 183 179 01057900 Kanakwal U rf Rattangarh 1,189.0 287 1,687 887 800 169 99 70 01058000 Phulo Khari 1,193.0 318 1,912 1,015 897 316 169 147 01058100 Giana 1,875.0 706 3,984 2,158 1,826 538 318 220 01058200 Gatwali 701.0 325 1,834 997 837 215 121 94 01058300 Jogewala 431.0 177 1,057 567 490 146 89 57 01058400 Tungwali 308.0 109 617 333 284 . 68 46 22 01058500 Malkana 2,448.0 728 4,250 2,272 1,978 542 321 221 01058600 Jajja1 838.0 487 2,944 1,546 1,398 376 211 165 01058700 Kama1u 600.0 284 1,808 948 860 237 128 109 01058800 Bangi Nihal Singh 1,475.0 505 3,306 1,715 1,591 453 238 215 01058900 Bangi Ru1du 1,610.0 659 3,911 2,064 1,847 490 271 219 01059000 Leleana 1,131.0 613 3,418 1,801 1,617 366 203 163 01059100 MahiNangal 1,081.0 411 2,494 1,326 1,168 347 205 142 01059200 Jeon Singhwala 1,463.0 574 3,207 1,708 1,499 409 226 183 01062500 Bhagibandar 2,528.0 1,093 6,578 3,505 3,073 943 534 409 01062600 Talwandi Sabo 4,422.0 3,118 16,754 8,910 7,844 2,280 1,279 1,001 01062700 Lelewala 1,270.0 665 4,004 2,088 1,916 558 285 273 01062800 Shekhpura 1,955.0 826 4,802 2,555 2.247 693 406 287 01062900 Gadhianwa1a Ur[ 505.0 124 704 376 328 99 49 50
Bhagwanpura 01063000 Ram Tirath Jaga 2,986.0 1,011 6,212 3,311 2,901 921 514 407
01063100 Fatehgarh Nouabad 577.0 298 1,667 856 811 221 134 87 01063200 Gurusar J oga 558.0 232 1,344 688 656 153 84 69
01063300 Sangat Khurd 394.0 237 1,516 804 712 197 114 83 01063400 Teona Pujarian 1,178.0 390 2,262 1,246 1,016 260 147 113
01063500 Behman Jassa Singh 1,167.0 287 1,815 969 846 237 137 100
01063600 Behman Koer Singh 1,156.0 344 2,066 1,124 942 280 171 109 01063700 Singo 1,419.0 505 3,304 1,749 1,555 475 249 226
01063800 Lehri 1,278.0 444 2,527 1,338 1,189 341 178 163
01063900 Menuana 378.0 76 509 268 241 79 49 30
01064000 Mirziana 656.0 215 1,311 689 622 153 89 64
01064100 Gehlewala 552.0 203 1,141 591 SSO 162 92 70
01064200 Kaureana 798.0 326 1,982 1,053 929 268 155 113
01064300 Raya 534.0 177 1,012 550 462 133 62 71
01064400 Kalalwala 998.0 405 2,257 1,209 1,048 302 161 141
01064500 Fatah Ba1u 483.0 109 661 357 304 101 59 42
01064600 Go1ewala 490.0 134 755 415 340 87 49 38
01064700 Natheha 1,114.0 412 2,444 1,318 1,126 348 207 141
01064800 Nan!!la 1,216.0 422 2,339 1,256 1,083 351 192 159
260

PRIMARY CENSUS ABSTRACT
CENSUS ABSTRACT Talwandi Sabo
Scheduled Castes ~o~uation Scheduled Tribes ~o~ulation Literates Persons Males Females Persons Males Females Persons Males Females Name of Village
11 12 13 14 15 16 17 18 19 2
40,727 21,593 19,134 56,264 33,877 22,387 Talwandi Sabo (Total) 40,717 21,593 19,134 56,264 33,877 22,387 Talwandi Sabo (Rural)
Talwandi Sab!, (Urban) Talwandi Sabo (Rural)
1,033 562 471 1,605 963 642 Kailebandar 1,208 629 579 1,927 1,157 770 KotBakhtu
596 308 288 787 456 331 Manwala UrfKishangarh 843 452 391 838 513 325 Bangi Dipa Singh 431 225 206 720 437 283 Bangi Rughu 744 430 314 1,161 700 461 Sukhladhi
1,247 647 600 1,089 630 459 Bagha 371 198 173 460 268 192 Tarkhanwala 803 408 395 981 595 386 Rarnsara 555 297 258 859 514 345 Kanakwal UrfRattangarh 407 218 189 774 469 305 Phulo Khari
1,507 818 689 1,612 1,011 601 Giana 557 298 259 791 493 298 Gatwali 102 54 48 463 303 160 Jogewala 170 93 77 349 220 129 Tungwali
1,160 610 550 1,842 1,090 752 Malkana 706 383 323 1,259 755 504 Jajjal 545 279 266 872 524 348 Kamalu
1,801 948 853 1,203 724 479 Bangi Nihal Singh 1,236 658 578 1,734 1,008 726 Bangi Ruldu 1,311 686 625 1,567 959 608 Leleana
546 285 261 1,076 638 438 MahiNangal 1,263 694 569 1,487 904 583 Jeon Singhwala
1,949 1,018 931 2,651 1,603 1,048 Bhagibandar 6,014 3,181 2,833 8,355 4,871 3,484 Talwandi SaOO 1,204 632 572 1,615 963 652 Lelewala 1,575 818 757 1,903 l,lI9 784 Shekbpura
314 177 137 274 175 99 Gadhianwala Urf Bhagwanpura
),627 870 757 ·~,539 1,473 1,066 Ram Tirath Jaga
656 333 323 756 426 330 Fatehgarh Nouabad
548 282 266 645 382 263 Gurusar Joga
500 264 236 827 493 334 Sangat Khurd
606 334 272 1,217 758 459 Teona Pujarian 485 258 227 780 491 289 Behman Jassa Singh
864 455 409 890 563 327 Behman Koer Singh
699 362 337 1,364 845 519 Singo. 865 460 405 1,030 638 392 Lehri 124 65 59 234 134 100 Menuana 45 25 20 688 425 263 Mirziana
378 193 185 513 319 194 Gehlewala 464 254 210 842 517 325 Kaureana
358 195 163 460 316 144 Raya 446 254 192 836 522 314 Kalalwala 197 109 88 271t 173 97 FatahBalu
97 59 38 247 162 85 Golewala
742 388 354 979 609 370 Natheha
828 427 401 893 569 324 Nangla
261

DISTRICT CENSUS HANDBOOK: BATHINDA
VILLAGE PRIMARY C DBlock-
Location
code Illiterates Total workers Main workers number Name ofVilla~e ' Persons Males Females Persons Males Females Persons Males Females
1 2 20 21 22 23 24 25 26 27 28
0006 Talwandi Sabo (Total) 73,100 34,787 38,313 62,826 39,016 23,810 46,651 35,685 10,966 0006 Talwandi Sabo (Rural) 73,100 34,787 38,313 62,826 39,016 23,810 46,651 j5,685 10,966 0006 Talwandi Sabo (Urban)
Talwandi Sabo (Rural) 01056900 Kailebandar 2,312 1,119 1,193 1,965 1,288 677 1,422 1,208 214 01057000 KotBakhtu 2,418 1,153 1,265 2,243 , ()06 937 1,666 1,244 422 01057100 Manwala Urf Kishangarh 1,046 473 573 1,149 606 543 834 478 356 01057300 Bangi Dipa Singh 1,028 477 551 608 535 73 341 311 30 01057400 Bangi Rughu 782 362 420 568 436 132 125 116 9 01057500 Sukhladhi 1,244 593 651 1,329 759 570 1,028 664 364 01057600 Bagha 1,842 912 930 1,429 914 515 1,006 907 99 01057700 Tarkhanwala 1,298 650 648 758 597 161 743 596 147 01057800 Ramsara 1,431 644 787 737 674 63 707 661 46 01057900 Kanakwal UrfRattangarh 828 373 455 643 491 152 531 459 72 01058000 PhuloKhari 1,138 546 59Z 1,026 578 448 661 543 118 01058100 Giana 2,372 1,147 1,225 2,080 1,243 837 1,367 989 378 01058200 Gatwali 1,043 504 539 734 531 203 464 440 24 01058300 Jogewala 594 264 330 372 313 59 365 310 55 01058400 Tungwali 268 113 155 259 166 93 172 155 17 01058500 Malkana 2,408 1,182 1,226 2,304 1,350 954 2,076 1,292 784 01058600 Jajjal 1,685 791 894 1,326 902 424 1,103 895 208 01058700 Kamalu 936 424 512 726 519 207 709 508 201 01058800 Bangi Nihal Singh 2,103 991 1,112 1,702 987 715 1,693 983 710 01058900 Bangi Ruldu 2,177 1,056 1,121 2,205 1,191 1,014 1,935 1,125 810 01059000 Leleana 1,851 842 1,009 1,890 1,039 851 1,237 980 257 01059100 MahiNangal 1,418 688 730 1,371 747 624 1,338 736 602 01059200 Jeon Singhwala 1,720 804 916 1,290 989 301 1,131 935 196 01062500 Bhagibandar 3,927 1,902 2,025 3,596 2,096 1,500 2,194 1,897 297 01062600 Talwandi Sabo 8,399 4,039 4,360 7,181 4,821 2,360 5,036 4,176 860 01062700 Lelewala 2,389 1,125 1,264 2,325 1,319 1,006 1,792 1,213 579 01062800 Shekhpura 2,899 1,436 1,463 2,192 1,393 799 1,486 1,326 160 01062900 Gadhianwala Urf 430 201 229 314 207 107 241 204 37
Bhagwanpura 01063000 Ram Tirath Jaga 3,673 1,838 1,835 3,225 1,822 1,403 2,207 1,758 449 01063100 Fatehgarh Nouabad 911 430 481 834 478 356 477 468 9 01063200 Gurusar Joga 699 306 393 569 383 186 391 348 43 01063300 Sangat Khurd 689 311 378 731 439 292 520 402 118 01063400 Teona Pltiarian 1,045 488 557 962 609 353 596 499 97 01063500 Behman Jassa Singh 1,035 478 557 644 478 166 493 477 16 01063600 Behman Koer Singh 1,176 561 615 873 551 322 550 541 9 01063700 Singo 1,940 904 1,036 1,570 988 582 1,345 962 383 01063800 Lehri 1,497 700 797 1,319- 770 549 927 745 182 01063900 Menuana 275 134 141 332 173 159 328 173 155 01064000 Mirziana 623 264 359 816 430 386 455 398 57 01064100 Gehlewala 628 272 356 639 345 294 535 320 215 01064200 Kaureana 1,140 536 604 1,054 614 440 691 559 132 01064300 Raya 552 234 318 647 353 294 254 239 15 01064400 Kalalwala 1,421 687 734 1,119 703 416 753 630 123
01064500 Fatah Balu 391 184 207 368 201 • 167 237 181 56 01064600 Golewala 508 253 255 255 237 18 233 230 3
01064700 Natheha 1,465 709 756 1,235 735 500 1,034 707 327
01064800 Nan~la 1,446 687 759 1,312 710 602 1,222 697 525
262

PRIMARY CENSUS ABSTRACT
CENSUS ABSTRACT Talwandi Sabo
Industrial category of main workers Household industry
Cultivators Agricultural labourers workers Other workers Persons Males Females Persons Males Females Persons Males Females Persons Males Females Name of Village
29 30 31 32 33 34 35 36 37 38 39 40 2
20,779 20,779
665 839 637 129 24
719 421 479 320 185 305 624 220 231 94
783 543 256 .360 735 470 468 499
1,102 1,077
921 733
74
1,183 232 197 210 348 262 258 584 425 230 325 293 460 222 431 144 157 493 412
18,323 18,323
635 670 331 123 23
478 385 410 315 174 289 576 212 191 90
748 520 254 348 677 457 440 445
1,043 977 707 719
70
945 232 186 205 305 258 257 577 416 123 319 180 351 213 385 107 157 405 395
2,456 2,456
30 169 306
6 1
241 36 69
5 II 16 48 8
40 4
35 23
2 12 58 13 28 54 59
100 214
14 4
238
11 5
43 4
7 9
107 6
113 109
9 46 37
88 17
12,186 12,186
377 502
88 149 44
214 421 202 203 224 155 280 131 94 43
411
329 139 607 432 512 328 428 548
1,027 458 413 III
658 173 86
183 62
162 225 199 226
82 88
216 122
10 155 62 63
259 279
9,821 9,821
343 379 69
130 43
134 399 173 176 168 92
255 130 86 38
330 269 102 503 276 377 196 348 491 837 329 383
93
489 169 73
141 60
158 219 191 221 47 40
119 117
10 141 44 61
198 174
2,365 2,365
34 123 19 19
I 80 28 29 27 56 63 25
I 8 S
81 60 37
104 156 135 132 80 57
190 129 30 18
169 4
13 42
2 4 6 8 5
35 48 97 5
14 18 2
61 105
1,190 1,190
24 51 24
1
18 4
17 6
40 II 46
7 4 8
30 25 53 10 29 43
118 36 32
176 33 32 2
68 7 9 9
24 2 5
70 16
6 2
15
20
28 28
651 651
tl 25 12
12 2
4 40
9 7 3 2 5 6
II 30
5 10 32 8
10 26
133 20 21
2
52 6 5 3
13 2 5
47 13
263
4 I
12
18 1
7 15
539 539
13 26 12
6 2
16 2
2 39
4 2 .}
24 14 23
5 19 11
110
26 6
43 13 11
16 I 4 6
II
23 3
2 I 3
2
,:"" 21 13
12,496 12,496
356 274
85 62 57 77
154 4S
178 82
190 417 106 36 27
852 206 261 716 739 212 424 168 512
2,756 380 308
54
298 65 99
118 162 67 62
492 260
16 36 24 94 22
147 30 13
254 503
6,890 6,890
219 170 66 58 50 40
121 12
166 77
153 151 95 31 22
208 95
122 127 162 114 92
132 337
2,229 157 203
39
272 61 84 53
121 59 60
147 95
3 35 20 79 16 86 29 12 97
113
5,606 Talwandi Sal;lo (Total) 5,606 Talwandi Sabo (Rural)
Talwandi Sabo (Urban) Talwandi Sabo (Rural)
137 Kaile bandar 104 Kot Bakhtu
19 Manwala UrfKishangarh 4 Bangi Dipa Singh 7 Bangi Rughu
37 Sukhladhi 33 Bagha 33 Tarkhanwala 12 Ramsara 5 Kanakwal Urf Rattang¥h
37 Phulo Khari 266 Giana II Gatwali 5 Jogewala 5 Tungwali
644 Malkana III Jajjal 139 Kamalu 589 Bangi Nihal Singh 577 Bangi Ruldu
98 Leleana 332 Mahi Nangal 36 Jeon Singhwala
175 Bhagibandar 527 Talwandi Sabo 223 Lelewala 105 Shekhpura
15 Gadhianwala Urf Bhagwanpura
26 Ram Tirath Jaga 4 Falehgarh Nouabad
15 Gurusar Joga 65 San gal Khurd 41 Teona Pujarian
8 Behman Jassa Singh 2 Behman Koer Singh
345 Singo 165 Lehri
13 Menuana I Mirziana 4 Gehlewala
15 Kaureana 6 Raya
61 Kalalwala t Fatah Balu
Golewala 157 Natheha 390 Nangla

DISTRICT CENSUS HANDBOOK: BATHINDA
VILLAGE PRIMARY CD Block-
Industrial category Location
code Mar~inal workers Cultivators ABriculturallabourers number Name of Villase Persons Males Females Persons Males Females Persons Males Females
1 2 41 42 43 44 45 46 47 48 49
0006 Talwandi Saba (Total) 16,175 3,331 12,844 4,621 826 3,795 6,616 1,812 4,804 0006 Talwandi Sabo (Rural) 16,175 3,331 12,844 4,621. 826 3,795 6,616 1,812 4,804 0006 Talwandi Sabo (Urban)
Talwandi Sabo (Rural) 01056900 Kaile bandar 543 80 463 133 4 129 344 68 276 01057000 KotBakhtu 577 62 SIS 320 30 290 180 24 156 01057100 Manwala UrfKishangarh 315 128 187 98 29 69 204 93 111 01057300 Bangi Dipa Singh 267 224 43 131 125 6 131 96 35 01057400 Bangi Rughu 443 320 123 213 206 7 199 107 92 01057500 Sukhladhi 301 95 206 28 6 22 197 85 112 01057600 Bagha 423 7 416 !O3 4 99 307 1 306 01057700 Tarkhanwala 15 1 14 2 2 8 7 01057800 Ramsara 30 I3 17 7 5 2 19 4 15 01057900 Kanakwal UrfRattangarh 112 32 80 4 3 86 16 70 01058000 Phulo Khari 365 35 330 295 23 272 50 9 41 01058100 Giana 713 254 459 35 23 12 278 124 154 01058200 Gatwali 270 91 179 5 5 71 49 22 01058300 Jogewala 7 3 4 6 3 3 I 01058400 Tungwali 87 11 76 2 2 01058500 Malkana 228 58 170 7 5 2 85 24 61 01058600 Jajjal 223 7 216 10 5 5 4 2 2 01058700 Karnalu 17 11 6 I 4 4
-01058800 Bangi Nihal Singh 9 4 5 3 .or- 2 5 2 3 01058900 BangiRuldu 270 66 204 5 3 2 234 61 173 01059000 Leleana 653 59 594 93 26 67 140 15 125 01059100 MahiNangal 33 11 22 3 1 2 11 5 6 01059200 Jean Singhwala 159 54 105 50 7 43 58 41 17 01062500 Bhagibandar 1,402 199 1,203 698 71 627 540 93 447 01062600 Talwandi Sabo 2,145 645 1,500 246 84 162 995 ]54 641 01062700 Lelewala 533 106 427 63 23 40 165 38 127 01062800 Shekhpura 706 67 639 223 18 205 249 40 209 01062900 Gadhianwala Urf 73 3 70 17 17 44 3 41
Bhagwanpura 01063000 Ram Tirath Jaga 1,018 64 954 614 20 594 339 40 299 01063100 Fatehgarh Nouabad 357 10 347 187 9 178 163 I 162 01063200 Gurusar Joga 178 35 143 12 I 11 89 33 56 01063300 Sangat Khurd 211 37 174 2 I I 77 23 54 01063400 Teona Pujarian 366 110 256 113 21 92 198 79 119 01063500 Behman Jassa Singh 151 1 150 6 6 63 62 01063600 Behman Koer Singh 323 10 313 5 5 162 8 154
01063700 Singo 225 26 199 2 1 19 14 5 01063800 Lehri 392 25 367 137 7 130 220 17 203 01063900 Menuana 4 4 2 2 01064000 Mirziana 361 32 329 248 21 227 103 6 97 01064100 Gehlewala 104 25 79 57 6 51 24 6 18
01064200 Kaureana 363 55 303 136 8 128 143 40 103 01064300 Raya 393 114 279 123 5 118 188 103 85 01064400 Kalalwala 366 73 293 80 4 76 145 59 36 01064500 Fatah Balu 131 20 III 80 8· 72 45 6 39
, 01064600 Golewala 22 7 15 I 1 1
01064700 Natheha 201 28 173 2 2 15 8 7
01064800 Nan~la 90 13 77 15 2 13 11 8 3
264

PRIMARY CENSUS ABSTRACT
CENSUS ABSTRACT Talwandi Sabo
ofmar~inal workers Location
Household indus!!! workers Other workers Non-workers code
Persons Males Females Persons Males Females Persons Males Females Name ofVilla~e number
50 51 52 53 54 55 56 57 58 2 ]
817 61 756 4,121 632 3,489 66,538 29,648 36,890 Talwandi Sabo (Total) 0006 817 61 756 4,121 632 3,489 66,538 29,648 36,890 Talwandi Sabo (Rural) 0006
Talwandi Sabo (Urban) 0006 Talwandi Sabo (Rural)
40 2 38 26 6 20 -1,952 794 1,158 Kaile bandar 01056900 12 I II 65 7 58 2,102 1,004 1,098 KotBakhtu 01057000
1 12 6 6 684 323 361 Manwala UrfKishangarh 01057100
3 '2 2 2 1,258 455 803 Bangi Dipa Singh 01057300 2 I 29 6 23 .934 363 571 Bangi Rughu 01057400 9 9 67 4 63 1,076 534 542 Sukhladhi 01057500
I3 2 II 1,502 628 874 Bagha 01057600 5 5 1,000 321 679 Tarkhanwala 01057700 4 4 1,675 565 1,110 Ramsam 01057800
22 13 9 1,044 396 648 Kanakwal Vrf Rattangarh 01057900 6 6 14 3 II 886 437 449 PhuloKhari 01058000
51 51 349 107 242 1,904 915 989 Giana 01058100 163 12 151 31 25 6 1,100 466 634 Gatwali 01058200
685 254 431 Jogewala 01058300 2 2 83 II 72 358 167 191 Tungwali 01058400 3 2 133 28 105 1,946 922 1,024 Malkana 01058500
17 17 192 192 1,618 644 974 Jajjal 01058600 ,4 4 8 7 I 1,082 429 653 Kamalu 01058700
1 I 1,604 728 876 Bangi Nihal Singh 01058800 12 12 19 2 17 1,706 873 833 Bangi Ruldu 01058900 63 3 60 357 15 342 1,528 762 766 Leleana 01059000 6 6 13 5 8 1,123 579 544 Mahi Nangal 01059100
43 3 40 8 3 5 1,917 719 1,198 Jeon Singhwala 01059200 39 6 33 125 29 96 2,982 1,409 1,573 Bhagibandar 01062500
117 18 99 787 189 598 9,573 4,089 5,484 Talwandi Sabo 01062600 38 3 35 267 42 225 1,679 ';- 769 910 Lelewala 01062700 23 23 211 9 202 2,610' 1,162 1,448 Shekhpura 01062800
12 12 390 169 221 Gadhianwala Ur[ 01062900 Bhagwanpura
12 11 53 3 50 2,987 1,489 1,498 Ram Tirath Jaga 01063000 2 2 5 5 833 378 455 Fatehgarh Nouabad 01063100
14 13 63 63 775 305 470 Gurusar Joga 01063200 7 7 125 13 112 785 365 420 Sangat Khurd 01063300
17 2 15 38 8 30 1,300 637 663 Teona Pujarian 01063400 37 37 45 45 1,171 491 680 Behman Jassa Singh 01063500
1 155 2 153 1,193 573 620 Behman Koer Singh 01063600 4 4 200 7 193 1,734 761 973 Singo 01063700 4 4 31 30 1,208 568 640 Lehri 01063800
2 2 177 95 82 Menuana 01063900 9 5 .. 495 259 236 Mirziana 01064000
23 13 10 502 246 256 Gehlewala 01064100 5 5 79 7 72 928 439 489 Kaureana 01064200
82 6 76 365 197 168 Raya 01064300 , 10 19 121 9 112 1,138 506 632 Kalalwala 01064400
6 6 293 156 137 Fatah Balu 01064500 20 5 15 500 178 322 Golewala 01064600
11 10 173 19 154 1,209 583 626 Natheha 01064700 28 28 36 3 33 1,027 546 481 Nan~la 01064800
265

DISTRICT CENSUS HANDBOOK: BATHINDA
VILLAGE PRIMARY CD Block-
Total population (including Location Area of institutional and houseless Population in the
code Village in Number of EOEulation~ age-!2:0uE 0-6 number Name ofVillage~ hectares households Persons Males Females Persons Males Females
1 2 3 4 5 6 7 8 9 10
0007 Maur (Tlltal) 28,278.0 11,684 69,326 36,935 32,391 8,963 5,076 3,887 0007 Maur (Rural) 28,278.0 1l,684 69,326 36,935'i- 32,391 8,963 5,076 3,887 0007 Maur (Urban)
. Maur (Rural)
01053000 Dhan Singh Khana 1,142.0 372 2,025 1,064 961 268 146 122 01059300 Chathewala 1,123.0 430 2,590 1,333 1,257 336 194 142 01059400 KotBhara 989.0 444 2,455 1,290 1,165 274 159 115 01059500 Ramgarh Bhundar 606.0 276 1,721 915 806 235 136 99 01059600 Bhai Bakhtour 811.0 407 2,396 1,280 1,1l6 321 182 139 01059700 GhasoKhana 313.0 148 834 433 401 140 81 59 01059800 Manak Khana 263.0 76 487 257 230 72 37 35 01059900 Arai Khana 1,178.0 307 1,851 1,007 844 205 116 89 01060000 Kishangarh UrfChinarthal 872.0 352 2,181 1,155 1,026 234 127 107 01060100 Gehri Bara Singh 691.0 249 1,413 735 678 197 112 85 01060200 Maisar Khana 2,002.0 714 4,241 2,283 1,958 S62 322 240 01060300 Jatri 385.0 196 1,081 586 495 119 69 50 01060400 Maur Charat Singh 907.0 406 2,398 1,256 1,142 270 159 III 01060500 Ramnagar UrfKasaiwara 1,767.0 718 4,027 2,140 1,887 551 319 232 01060600 Kutiwal Kalan 769.0 326 1,897 995 902 252 143 109 01060700 Tharnangarh 527.0 150 953 523 430 137 83 54 01060800 Kutiwal Khurd 567.0 261 1,617 876 741 200 116 84 01060900 Ghurnan Khurd 614.0 126 812 440 372 106 61 45 01061000 Ghurnan Kalan 1,520.0 763 4,644 2,496 2,148 561 313 248 01061100 Sukha Singhwala 185.0 109 637 340 297 80 50 30 01061200 KotliKhurd 1,195.0 465 2,867 1,539 1,328 383 212 171 01061300 Kamalu 537.0 349 1,898 989 909 268 142 126 01061400 Swaich 598.0 222 1,342 704 638 170 92 78 01061500 Rajgarh Kuba 1,388.0 716 4,108 2,179 1,929 543 303 240 01061600 Sandoha 1,641.0 592 3,665 2,003 1,662 438 271 167 01061700 Burj 731.0 379 2,248 1,188 1,060 360 205 155 01061800 MansaKalan 909.0 486 2,914 1,597 1,317 351 199 152 01061900 Mari 249.0 159 956 511 445 99 56 43 01062000 Jodhpur Pakhar 1,966.0 684 4,232 2,260 1,972 590 317 273 01062100 Burj Serna 561.0 275 1,607 851 756 214 119 95 01062200 Bangher Mohabat Singh 337.0 136 823 425 398 95 46 49 01062300 Bangher Charat Singh 442.0 201 1,199 623 576 162 91 71 01062400 Nat! 493.0 190 1,207 662 545 170 98 72
266

PRIMARY CENSUS ABSTRACT
CENSUS ABSTRACT Maur
Scheduled Castes EOEuation Scheduled Tribes EOEulation Literates Persons Males Females Persons Males Females Persons Males Females Name of Village
II 12 13 14 . 15 16 17 18 19 2
21,167 11,203 9,964 30,605 U,385 12,220 Maur (Total) 21,167 H,203 9,964 30,605 18,385 12,220 Maur (Rural)
Maur (Urban) -Maur (Rural)
670 348 322 966 565 401 Dhan Singh Khana 413 224 189 1,172 682 490 Chathewala 839 438 401 1,226 692 534 KotBhara 595 323 272 815 491 324 Ramgarb Bbundar 804 424 380 1,165 708 457 Bhai Bakhtour 354 186 168 377 233 144 GbasoKhana
36 18 18 230 147 83 ManakKhana 312 179 133 896 549 347 AraiKhana 655 331 324 927 555 372 Kisbangarb Urf Cbinartbal 650 336 314 715 437 278 Gehri Bara Singh 993 546 447 2,054 1,240 814 Maisar Khana 356 199 157 536 355 181 Jatri 976 513 463 1,029 601 428 Maur Charat Singh
1,822 958 864 1,691 976 715 Ramnagar Urf Kasaiwara 506 261 245 855 503 352 Kutiwal Kalan 316 176 140 287 172 115 Tharnangarh 279 154 125 660 406 254 Kutiwal Khurd 163 89 74 345 193 152 Ghurnan Khurd
1,267 659 608 1,997 1,261 736 Ghuman Kalan 257 137 120 184 124 60 Sukha Singhwala 892 464 428 954 601 353 Kotli Khurd 786 400 386 739 449 290 Karnalu 128 62 66 608 362 246 Swaich
1,310 685 625 2,010 1,212 798 Rajgarh Kuba 829 454 375 1,603 991 612 Sandoha
1,145 604 541 'I'" 900 542 358 Burj 836 452 384 • 1,160 709 451 MansaKalan 310 157 153 430 261 169 Mari
1,452 774 678 1,955 1,151 804 Jodhpur Pakhar 473 242 231 677 391 286 Burj Serna 298 153 145 404 228 176 Bangher Mohabat Singh 178 106 72 556 307 249 Bangher Charat Singh 267 151 116 482 291 191 Natt
267

DISTRICT CENSUS HANDBOOK: BATHINDA
VILLAGE PRIMARY CD Block·
Location
code llliterates Total workers Main workers number Name ofVilla~e Persons Males Females Persons Males Females Persons Males Females
2 20 21 22 23 24 25 26 27 28
0007 Maur (Total) 38,721 18,550 20,171 35,741 20,834 14,907 25,535 19,297 6,238 0007 Maur (Rural) 38,721 18,550 20,171 35,741 20,834 14,907 25,535 19,297 6,238 0007 Maur(Urban)
Maur(Rural) 01053000 Ohan Singh Khana 1,059 499 560 1,066 582 484 397 385 12 01059300 Chalhewala 1,418 651 767 1,442 739 703 1,155 689 466 01059400 Kot Bhara 1,229 598 631 1,048 764 284 720 682 38 01059500 Ramgarh Bhundar 906 424 482 716 535 181 694 516 178 01059600 Bhai Bakhlour 1,231 572 659 1,167 716 451 919 613 306 01059700 GhasoKhaoa 457 200 257 439 245 194 217 210 7 01059800 MaoakKhaoa 257 110 147 312 171 141 274 157 117 01059900 Arai Khana 955 458 497 621 549 72 619 547 72 01060000 Kishaogarh UrfChinarthal 1,254 600 654 1,289 680 609 915 645 270 01060100 Gehri Bara Singh 698 298 400 789 418 371 434 417 17 01060200 Maisar Khana 2,187 1,043 1,144 1,899 1,190 709 1,137 1,085 52 01060300 Jalri 545 231 314 672 357 315 634 348 286 01060400 Maur Charal Singh 1,369 655 714 1,393 726 667 724 697 27 01060500 Rarnnagar UrfKasaiwara 2,336 1,164 1,172 2,049 1,201 848 1,630 1,157 473 01060600 Kutiwal Kalao 1,042 492 550 942 490 452 816 486 330 01060700 Thamaogarh 666 351 315 507 271 236 507 271 236 01060800 Kutiwal Khurd 957 4'70 487 768 449 319 562 393 169 01060900 Ghumao Khurd 467 247 220 440 242 198 293 237 56 01061000 Ghumao Kalan 2,647 1,235 1,412 2,399 1,383 1,016 1,579 1,351 228 01061100 Sukha Singhwala 453 216 237 368 ·;.198 170 254 190 64 01061200 Kotli Khurd 1,913 938 975 1,617 , 867 750 1,126 849 277 01061300 Kamalu 1,159 540 619 1,024 541 483 560 518 42 01061400 Swaich 734 342 392 765 418 347 465 393 72
01061500 Rajgarh Kuba 2,098 967 1,131 1.979 1.239 740 1.549 1,154 395 01061600 Sandoha 2,062 1,012 1,050 2,033 1,159 874 2,013 1,154 859 01061700 Burj 1,348 646 702 1,110 674 436 576 535 41 01061800 MaosaKaian 1,754 888 866 1,416 934 482 827 754 73 01061900 Marl 526 250 276 503 277 226 332 268 64 01062000 Jodhpur Pakhar 2,277 1,109 1,168 2,332 1,323 1,009 1,616 1.214 402 01062100 Burj Serna 930 460 470 994 531 463 712 494 218 01062200 Bangher Mohabat Singh 419 197 222 421 217 204 384 205 179 01062300 Bangher Charat Singh 643 316 327 487 346 141 399 325 74 01062400 Natt 725 371 354 734 402 332 496 358 13&
268

PRIMARY CENSUS ABSTRACT
CENSUS ABSTRACT Maur
Industrial category of main workers "" Household industry
Cultivators Agricultural labourers workers Other workers Persons Males Females Persons Males Females Persons Males Females Persons Males Females Name of Village
29 30 31 32 33 34 35 36 37 3& 39 40 2
12,746 12,746
260 445 406 392 389 97
202 384 405 244 684 280 315 561 284 164 319 181 779 105 564 274 372 586
1,431 244 538 164 843 298 122 146 268
11,180 11,180
256 415 400 273 320 96
116 370 341 239 673 198 314 528 265 163 313 175 759 100 542 259 324 574 840 241 529 159 641 289 108 142 218
1,566 1,566
4 30
6 1i9 69
1 86 14 64
5 11 82
33 19
I 6 6
20 5
22 15 48 12
591 3 9 5
202 9
14 . 4
SO
6,085 6,085
48 235 177 208 138 55
7 105 352 147 182 138 224 410 141 95 33 65
408 140 311 232
29 402 398 235 125 91
470 163 98
104 119
4,974 1,111 4,974 1,111
43 5 160 75 167, 10 184 24 100 38
51 4 I 6
102 3 223 129 143 4 174 8 115 23 218 6 363 47 139 2 94 I 30 3 44 21
366 42 87 53
198 113 218 14
29 363 39 229 169 208 27 114 11 71 20
363 107 127 36 58 40 89 15
103 16
786 786
8 10 18 44 12 1
13 16 69
5 39
1 29
132 22
I 20
16
18 2 9
31 12 2
17 7
27 43
107 50
5
312 312
8 8
13 14 10
1 6
12 5 5
31
20 37 13
3
5
3 I 8 8 3 2
15 • 5
269
19 6 8
40 3
474 474
2 5
30 2
7 4
64
8
9 95
9 1
17
11
15 1 1
23 9
2 2 8
37 99 10 2
5,918 5,918
81 465 119 50
380 64 52
114 89 38
232 215 156 527 369 247 190 47
376 9
233 52 55
530 172 95
147 70
276 208 57 99
104
2,831 2,831
78 106 102 45
183 62 34 63 76 30
207 35
145 229
69 14 47 18
221 3
106 40 32
209 82 84 96 33
191 72 31 54 34
3,087 Mllur (Total) 3,087 Maur (Rural)
Maur (Urban) Maur (Rural)
3 Dhan Singh Khana 359 Chathewala
17 KotBhara 5 Ramgarh Bhundar
197 Bhai Bakhtour 2 Ghaso Khana
18 Manak Khana 51 Arai Khana 13 Kishangarh UrfChinarthal 8 Gehri Bara Singh
25 Maisar Khana 180 Jatri
11 Maur Charat Singh 298 Ramnagar UrfKasaiwara 300 Kutiwa1 Kalan 233 Thamangarh 143 Kuti~Khurd 29 Ghuman Khurd
155 Ghuman Kalan 6 Sukha Singhwala
127 Kotli Khurd 12 Kamalu 23 Swaich
321 Rajgarb Kuba 90 Sandoha 11 Burj 51 Mansa Kalan 37 Mari 85 Jodhpur Pakhar
136 Burj Serna 26 Bangher Mohabat Singh 45 Bangher Charat Singh 70 Natt

DISTRICT CENSUS HANDBOOK: BATHINDA
VILLAGE PRIMARY CD Blotk-
Industrial category Location
code Marginal workers Cultivators A~iculturallabourers number Name of Village Persons Males Females Persons Males Females Persons Males Females
2 41 42 43 44 45 46 47 48 49 0007 Maur (Total) 10,206 1,537 8,669 2,971 276 2,695 3,227 947 2,280 0007 Maur (Rural) 10,206 1,537 8,669 2,971 276 2,695 3,227 947 2,280 0007 Maur (Urban)
Maur (Rural) 01053000 Dhan Singh Khana 669 197 472 22 9 13 614 176 438 01059300 Chathewala 287 SO 237 12 6 6 51 10 41 01059400 Kot Bhara 328 82 246 23 7 16 48 29 19 01059500 Ramgarh Bhundar 22 19 3 12 10 2 9 8 1 01059600 Bhai Bakhtonr 248 103 145 14 1 13 190 95 95 01059700 GhasoKhana 222 35 187 77 8 69 116 17 99 01059800 Manak Khana 38 14 24 5 I 4 28 12 16 01059900 Arai Khana 2 2 2 2 01060000 Kishangarh Urf Chinarthal 374 35 339 165 9 156 48 15 33 01060100 Gehri Bara Singh 355 1 354 217 I 216 133 133 01060200 Maisar Khana 762 105 657 297 7 290 223 88 135 01060300 Jatri 38 9 29 6 4 2 01060400 Manr Charat Singh 669 29 640 12 5 7 39 5 34 01060500 Ramnagar Urf Kasaiwara 419 44 375 61 II 50 27 14 13 01060600 Kutiwal Kalan 126 4 122 119 119 2 01060700 Thamangarh 01060800 Kutiwal Khurd 206 56 150 6 3 3 68 43 25 01060900 Ghuman Khurd 147 5 142 9 4 5 5 5 01061000 Glluman Kalan &20 32 788 102 12 90 70 8 62 01061100 Sukha Singhwala 114 8 106 21 20 ,.. 16 7 9 01061200 Kotli Khurd 491 18 473 430 9 421 52 8 44 01061300 Kamalu 464 23 441 217 12 205 214 9 205 01061400 Swaicll 300 25 275 213 9 204 42 10 32 01061500 Rajgarh Kuba 430 85 345 41 4 37 214 77 137 01061600 Sandoha 20 5 15 10 3 7 5 I 4 01061700 Bmj 534 139 395 112 29 83 275 88 187 01061800 MansaKalan 589 180 409 149 14 135 322 137 185 01061900 Mari 171 9 162 107 6 101 27 1 26 01062000 Jodhpur Pakhar 716 109 607 341 48 293 232 34 198 01062100 Burj Serna 282 37 245 57 26 31 16 3 13 01062200 Bangher~ohabatSingh 37 12 25 6 5 12 4 8 01062300 Bangller Charat Singh 88 21 67 15 I 14 22 17 5 01062400 Natl 238 44 194 97 IJ 84 101 26 75
270

PRIMARY CENSUS ABSTRACT
CENSUS ABSTRACT Maur
of mars ina I workers
Location
Household indus!!}: workers Other workers Non-workers code Persons Males Females Persons Males Females Persons Males Females Name ofVillase number
50 51 52 53 54 55 56 57 58 2 ]
1,103 34 1,069 2,905 280 2,625 33,585 16,101 17,484 Maur (Total) 0007 1,103 34 1,069 2,905 280 2,625 33,585 16,101 , 17,484 Maur (Rural) .0007
Maur (Urban) 0007 Maur (Rural)
2 31 11 20 959 482 477 Dhan Singh Khana 01053000 224 34 190 '1,148 594 554 Chathewala 01059300
109 3 106 148 43 105 1,407 526 881 KotBhara 01059400 1 1 1,005 380 625 Ramgarh Bhundar 01059500
44 7 37 1,229 564 665 Bflai Bakhtour 01059600 2 2 27 10 17 395 188 207 GhasoKhana 01059700 2 2 3 I 2 175 86 89 Manak Khana 01059800
1,230 458 772 Arai Khana 01059900 23 22 138 10 128 892 475 417 Kishangarh Urf Chinarthal 01060000 4 4 1 I 624 317 307 Gehri Bara Singh 01060100
85 3 82 157 7 150 2,342 1,093 1,249 Maisar Khana 01060200 32 5 27 409 229 180 Jatri 01060300
497 5 492 121 14 107 1,005 530 475 Maur Ch~rat Singh 01060400 129 6 123 202 13 189 1,978 939 1,039 Ramnagar Urf Kasaiwara 01060500
2 1 I 3 2 I 955 505 450 Kutiwal Kalan 01060600 446 252 194 Thamangarh 01060700
7 6 125 9 116 849 427 422 Kutiwal Khurd 01060800 20 20 113 I 112 372 198 174 Ghuman Khurd 01060900 33 33 615 12 603 2,245 1,113 1,132 Ghuman Kalan 01061000 15 15 62 62 269 142 127 Sukha Singhwala 01061100 2 2 7 I 6 1,250 672 578 Kotli Khurd 01061200
33 2 31 874 448 426 Kamalu 01061300 12 12 33 6 27 577 286 291 Swaich 01061400 6 5 169 3 166 2,129 940 1,189 Rajgarh Kuba 01061500 2 2 3 2 1,632 844 788 Sandoha 01061600 4 4 143 22 121 1,138 514 624 Burj 01061700
35 6 29 83 23 60 1,498 663 835 MansaKalan 01061800 2 2 35 2 33 453 234 219 Mari 01061900 8 7 135 26 109 1,900 937 963 Jodhpur Pakhar 01062000
39 39 170 8 162 613 320 293 Burj Serna 01062100 16 3 13 3 3 402 208 194 Bangher Mohabat Singh 01062200 45 44 6 2 4 712 277 435 Bangher Charat Singh 01062300
I I 39 5 34 473 260 213 Natt 01062400
271

DISTRICT CENSUS HANDBOOK: BATHINDA
URBAN PRIMARY
Area of Location NameofTowni Ward Town! Ward Number of Total population (including Population in the
code in square households institutional and houseless age-group 0-6 number Kilometre population)
Persons Males Females Persons Males Females
2 3 4 5 6 7 8 9 10
41403000 RampurlI Phul (M CJ+OG) 8,234 44,665 .23,692 20,913 5,582 3,133 2,449
41403000 Rampura Phul (M CI) 7,902 42,823 22,706 20,111 5,321 2,999 2,322 0001 Ward No. 1 437 2,333 1,253 1,080 373 206 167 0002 Ward No.2 431 2,293 1,212 1,081 245 135 110 0003 Ward No. 3 349 2,024 1,045 979 209 109 100 0004 Ward No. 4 657 3,522 1,911 1,611 539 285 254 0005 Ward No. S 474 2,546 1,377 1,169 307 187 120 0006 Ward No. 6 580 3,213 1,722 1,491 538 302 236 0007 Ward No. 7 397 2,241 1,173 1,068 266 160 106 0008 Ward No. 8 459 2,473 1,330 1,143 314 183 131 0009 Ward No. 9 394 2,175 1,134 1,041 292 178 114 0010 Ward No. 10 690 3,545 1,885 1,660 375 220 155 0011 Ward No. II 376 2,143 1,139 1,004 231 140 91 0012 Ward No. 12 368 1,923 1,008 915 179 99 80 0013 Ward No. 13 540 2,958 1,559 1,399 387 209 178 0014 Ward No. 14 541 3,020 1,569 1,451 327 180 147 0015 Ward No. 15 340 1,691 912 779 171 101 70 0016 Ward No. 16 324 1,732 919 813 189 III 78
0017 Ward No. 17 545 2,991 1,558 1,433 379 194 185 Outgrowth(s)
0018 Jawahar Nagar on Rampura - 131 760 393 367 101 63 38
Bathinda Road (OG) - Ward "r
No.18
0019 Dashmesh Nagar on Rampura- 132 722 395 327 110 48 62
Mehraj Road COG) - Ward No.19
0020 Outgrowth of Gandhi Nagar on 63 360 198 162 50 23 27
Pitho Road (OG) - Ward No.20
41401000 Goniana (M CI) 2,312 12,813 6,866 5,947 1,544 911 633 0001 Ward No. I 21t' 1,202 652 550 183 103 80 0002 Ward No. 2 163 985 519 466 137 68 69
0003 Ward NO.3 130 802 420 382 104 62 42 0004 Ward NO.4 159 924 488 436 1-15 62 53
0005 Ward No.5 117 645 356 289 62 42 20
0006 Ward No. 6 191 1,067 558 509 120 70 50
0007 Ward No.7 170 960 501 459 97 54 43
0008 Ward No. 8 264 1,337 722 615 149 92 57
0009 Ward No.9 241 1,243 671 572 154 103 51
0010 Ward No. 10 211 1,1J6 607 529 135 88 47
001l Ward No. 11 163 900 491 409 133 77 56
0012 Ward No. 12 147 812 441 371 79 47 32
0013 Ward No. 13 145 800 440 360 76 43 33
41402000 Bhisiana (CT) 1,164 4,775 2,837 1,938 731 416 315
0001 Ward No.1 1,164 4,775 2,837 • 1,938 731 416 315
41404000 Bhucho Mandi (M CI) 2,284 13,246 7,017 6,229 1,726 979 747
0001 WardNu. I 184 1,021 544 477 137 77 60
0002 Ward No. 2 185 1,030 562 468 111 64 47
0003 Ward No. 3 168 933 488 445 101 60 41
0004 Ward No. 4 135 831 443 388 81 46 35
0005 Ward No.5 170 1,052 577 475 162 94 68
0006 Ward No. 6 201 1,091 580 511 155 89 66
0007 Ward No.7 188 1053 565 488 132 78 54
272

PRIMARY CENSUS ABSTRACT
CENSUS ABSTRACT
Name ofTownl Ward
Scheduled Castes population Scheduled Tribes population Literates
Persons Males Females Persons Males Females Persons Males Females
11 12 13 14 15 16 17 18 19 2
10,020 5,310 4,710 28,676 16,294 12,382 Rampura Phul (M d+OG)
9,482 5,029 4,453 27,823 15,765 12,058 Rampura Phut (M GI) 1,644 892 752 886 544 342 Ward No.1
57 32 25 1,437 812 625 Ward No. 2 37 18 19 1,217 687 530 Ward No. 3
750 396 354 1,888 1,136 752 Ward No. 4 267 135 132 1,791 1,025 766 Ward No. 5
2,270 1,207 1,063 1,342 819 523 Ward No. 6 396 205 191 1,650 903 747 Ward No. 7
1,118 595 523 1,299 744 555 Ward No. 8 1,223 630 593 1,188 670 518 Ward No. 9
199 109 90 2,688 1,514 1,174 Ward No. 10 36 19 17 1,701 945 756 Ward No. II
195 102 93 1,608 881 727 Ward No. 12 138 77 61 2,149 1,198 951 Ward No. 13
17 8 9 2,482 1,346 1,136 Ward No. 14 132 74 58 1,290 740 550 Ward No. 15 30 18 12 1,354 749 605 Ward No. 16
973 512 461 1,853 1,052 801 Ward No. 17 Outgrowth{s)
379 199 180 304 185 119 Jawahar Nagar on Rampura -Bathinda Road (OG) - Ward No.IS
85 42 43 363 229 134 Dashmesh Nagar on Rampura-Mehraj Road (00) - Ward No.19
74 40 34 186 115 71 Outgrowth of Gandhi Nagar on Pitho Road (00)· Ward No.20
2,886 1,526 1,360 9,053 5,139 3,914 Goniana (M CI) 698 365 333 557 340 217 Ward No. 1 716 369 347 546 342 204 Ward No. 2
93 50 43 6Jl 332 279 Ward No. 3 185 105 80 632 359 273 Ward No. 4
4 2 2 550 308 242 Ward No. 5 48 26 22 839 445 394 Ward No. 6 19 9 10 792 431 361 Ward No. 7
202 112 90 986 576 410 Ward NO .. 8 46 27 19 915 511 404 Ward No. 9 81 39 42 866 471 395 Ward No. 10
617 328 289 477 286 191 Ward No. II 4 3 1 678 384 294 Ward No. 12
173 91 82 604 354 250 Ward No. \3
683 362 321 3,541 2,214 1,327 Bhisiana (CT) 683 362 321 3,541 . 2,214 1,327 Ward No. 1
4,163 2,2.04 1,959 8,369 4,838 3,531 Bhucho Mandi (M el) 124 65 59 '640 376 264 Ward No. 1 80 46 34 • 819 471 348 Ward No. 2
14 6 8 763 418 345 ~ardNo. 3 706 392 314 Ward No. 4
723 403 320 392 229 163 Ward No. 5
536 274 262 596 357 239 Ward No. 6
464 251 213 702 412 290 Ward No. 7
273

Location code
number
NameofTownlWard
2
41403000 Rampura Phul (M el+OG)
41403000 0001 0002 0003 0004 0005 0006 0007 0008 0009 0010 0011 0012 0013 0014 0015 0016 0017
0018
0019
0020
41401000 0001 0002 0003 0004 0005 0006 0007 0008 0009 0010 0011 0012 0013
Rampura Phul (M el) Ward No. I Ward No. 2 Ward No. 3 Ward No. 4 Ward No. 5 Ward No. 6 War'~No. 7 Ward No. 8 Ward NO.9 Ward No. 10 Ward No. 11 Ward No. 12 Ward No. 13 Ward No. 14 Ward No. 15 Ward No. 16 Ward No. 17 Outgrowth(s)
Jawahar Nagar on Rampura -Bathinda Road (OG) - Ward No.1S
Dashmesh Nagar on Rampura -Mehraj Road (OG) - Ward No.19
Outgrowth of Gandhi Nagar on Pitho Road (OG) - Ward No.20
Goniana (M el) Ward No. 1 Ward No.2 Ward No. 3 Ward No. 4 Ward NO.5 Ward No. 6 Ward No. 7 Ward No.8 Ward No.9 Ward No. 10 Ward No. 11 Ward No. 12 Ward No. 13
41402000 Bhisiana (eT) 0001 Ward No.1
41404000 0001 0002 0003 0004 0005 0006 0007
Bhucho Mandi (M el) Ward No. 1 Ward No. 2 Ward No. 3 Ward No. 4 Ward NO.5 Ward No. 6 Ward No. 7
DISTRICT CENSUS HANDBOOK: BATHINDA
Illiterates Total workers
Persons Males Females Persons Males Females
20 21 22 23 24 25
- 15,989 7,398 8,591 15,200 12,310 2,890
15,000 1,447
856 807
1,634 755
1,871 591
1,174 987 857 442 315 809 538 401 378
1,138
456
359
174
3,760 645 439 191 292
95 228 168 351 328 270 423 134 196
1,234 1,234
4,877 381 211 170 125 660 495 351
6,941 709 400 358 775 352 903 270 586 464 371 194 127 361 223 172 170 506
208
166
83
1,727 312 177 88
129 48
113 70
146 160 136 205
57 86
623 623
2,179 168
91 70 51
348 223 153
8,059 738 456 449 859 403 968 321 588 523 486 248 188 448 315 229 208 632
248
193
91
2,033 333 262 103 163 47
115 98
205 168 134 218
77 110
611 611
2,698 213 120 100 74
312 272 198
274
14,324 891 850 789
1,342 820 932 703 894 689
1,232 613 652
1,009 956 543 533 876
421
283
172
4,071 406. 323 221 289 225 343 321 442 355 353 252 272 269
1,899 1,899
4,361 348 370 309 261 498 311 284
11,738 659 618 556
1,069 738 850 628 647 541 934 553 543 823 855 478 483 763
215
238
119
3,528 334 263 208 257 198 298 279 354 312 324 237 232 232
1,784 1,784 •
3,669 286 327 264 252
, 325 271 257
2,586 232 232 233 273
82 82 75
247 148 298
60 109 186 101 65 50
113
206
45
53
543 72 60 13 32 27 45 42 88 43 29 IS 40 37
115 115
692 62 43 45
9 173 40 27
URBAN PRIMARY
Main workers
Persons Males Females
26 27 28
13,083 11,269 1,814
12,402 522 575 595
1,005 801 674 684 788 664
1,178 586 598 975 915 520 531 791
262
247
172
3,908 395 254 221 287 214 338 317 413 351 348 241 268 261
1,888 1,888
4,111 328 330 292 260 432 310 281
10,771 495 516 509 916 731 622 616 589 525 894 535 539 806 825 461 483 709
164
215
119
3,433 328 205 208 256 192 296 277 351 311 320 230 230 229
1,776 1,776
3,534 281 294 257 251 281 270 257
1,631 27 59 86 89 70 52 68
199 139 284
51 59
169 90 59 48 82
98
32
53
475 67 49 J3 31 22 42 40 62 40 28 II 38 32
112 112
577 47 36 35 9
151 40 24

PRIMARY CENSUS ABSTRACT
CENSUS ABSTRACT
Industrial category of main workers
Cultivators Agricultural labourers Household industry
workers
Name ofTownl Wru:d Other workers
Persons Males, Females Persons Males Females Persons Males Females Persons Males Females
29 30 31 32 33 34 35 36 37 38, 39 40 2
795
724 93
206 ISS 179 22 2 2 5 5
14 4
6 6 5 4
15
5
31
35
20
4
3 2 3 7
26 26
84 19
6
3 5 3
766
709 92
203 153 176 22 2
5 5
13 3 I 4 6 5 3
15
2
23
32
19 I
3
3 2 3 7
24 24 ~,~I '8t 18
6
3 5 3
29
15 I 3 2 3
2
3
8
3
2 2
3
733
452 121 34 28 71 6
94
9
33 4
2 33 2 3 1
II
196
51
34
155 125
6
12
10
60 60
124 3 I
3 18 42
592
394 118 27 27 49
6 81
6
33 4 2
25 2 3
11
134
39
25
137 III
5
12
1
54 54
118 2 I
3 18 39
141
58 3 7 I
22
13
3
8
62
12
9
18 14
1
3
6 6
6 1
3
293
288 Hi 14 27 23 2
18 13 19
31 29
7 26 18 I
11 33
2
3
92 8
29
17
5 8 4 8 8 1 4
S 5
58 20
9
I 2 6 7
251
247 15 14 24 21
2 16 6
18
30 25
7 11 16 1
10 31
3
68 6
16
16
3 7 3 8 1
2
4 4
39 8 4
1 6 7
275
42 41
I
3 2
2 7 I
4
IS 2
I 2
24 2
13
2 I
I 2
1 1
19 12
5
11,262 9,660
10,938 9,421 292 270 321 272 385 305 732 670 771 701 560 523 669 609 755 560 659 520
1,100 818 549 503 588 529 910 766 889 801 511 452 515 470 732 652
61 28
163 152
100 59
3,641 3,209 261 210 219 184 221 208 258 228 214 192 333 292 312 274 402 341 345 306 336 308 226 216 267 230 247 220
1,797 .1,797
3,845 286 320 286 259 424 281 229
1,694 1,694
3,296 253 289 251 250 274 241 208
1,602 Rampura Phul-(M el+OG)
1,517 Rampura Phul (M CI) 22 Ward No. I 49 Ward No.2 80 Ward No.3 62 Ward NO.4 70 Ward NO.5 37 Ward NO.6 60 Ward No.7
195 Ward No.8 139 Ward NO.9 282 Ward No. 10
46 Ward No. II 59 Ward No. 12
144 Ward No. 13 88 Ward No. 14 59 Ward No. 15 45 Ward No. 16 80 Ward No. 17
Outgrowth(s) 33 lawahar Nagar on Rampura -
Bathinda Road (OG) - Ward No.1 8
II Dashmesh Nagar on RampuraMehraj Road (OG) - Ward No.19
41 Outgrowth of Gandhi Nagar on Pi tho Road (OG) - Ward No.20
432 Goniana (M el) 51 Ward No.1 35 Ward No.2 13 Ward No. 3 30 Ward No.4 22 Ward No. 5 41 Ward No. 6 3& Ward No.1 61 Ward No. 8 39 Ward No.9 28 Ward No. 10 10 Ward No. II 37 Ward No. 12 27 Ward No. 13
103 Bhisiana (CT) 103 Ward No. I
549 Bhucho Mandi (M el) 33 Ward No.1 31 Ward No.2 35 Ward No.3 9 Ward No.4
150 Ward No.5 40 Ward No.6 21 Ward NO.7

DISTRICT CENSUS HANDBOOK: BATHINDA
URBAN PRIMARY
Industrial cateS0!I Location Name of Town! Ward
code Marginal workers eulti yiltors Agricultural labourers number
Persons Males Females Persons Males Females Persons Males Females
2 41 42 43 44 45 46 47 48 49
41403000 Rampura Phul (M el+OG) 2,117 1,041 1,076 51 16 35 335 155 180
41403000 Rampura Phul (M el) 1,922 967 955 49 16 33 249 126 123 0001 Ward No.1 369 164 205 1 1 54 33 21 0002 Ward No. 2 275 102 173 10 7 3 18 9 9 0003 Ward No. 3 194 47 147 I 10 4 6 0004 Ward No. 4 337 153 184 36 7 29 45 17 28 0005 Ward No. 5 19 7 12 1 I 1 I 0006 Ward NO.6 258 228 30 4 3 0007 Ware! No. 7 19 12 7 0008 Ward No. 8 106 58 48 38 32 6 0009 Ward No.9 25 16 9 0010 Ward No. 10 54 40 14 0011 Ward No. 11 27 18 9 6 5 0012 Ward No. 12 54 4 50 50 3 47 0013 Ward No. 13 34 17 17 3 3 0014 Ward No. 14 41 30 11 7 7 0015 Ward No. 15 23 17 6 7 6 0016 Ward No. 16 2 2 0017 Ward No. 17 85 54 31 6 4 2
Outgrowth(s)
0018 Jawahar Nagar on Rarnpura - 159 51 108 2 2 77 25 52 Bathinda Road (OG) - Ward
No.18
0019 Dashmesh Nagar on Rarnpura- 36 23 13 9 4 5
Mehraj Road (OG) - Ward No.t9
0020 Outgrowth of Gandhi Nagar on Pitho Road (OG) - Ward No.20
41401000 Goniana (M CI) 163 95 68 4 2 2 0001 Ward No. I II 6 5 2 2 0002 Ward No.2 69 58 II 0003 Ward No.3 0004 Ward No. 4 2 0005 Ward No. 5 II 6 5 0006 Ward NO.6 5 2 3 0007 Ward No. 7 4 2 2 0008 Ward No.8 29 3 26 0009 Ward NO.9 4 3 0010 Ward No. 10 5 4 1
0011 Ward No. II II 7 4 0012 Ward No. 12 4 2 2 0013 Ward No. 13 8 3 5
41402000 Bhisiana (CT) 11 8 3 0001 Ward No. I II 8 3
41404000 Bhucho Mandi (M CI) 250 135 115 3 2
0001 Ward No. I 20 5 15 I 0002 Ward No. 2 40 33 7
0003 Ward No. 3 17 7 10 "".
0004 Ward No. 4 I I 0005 Ward NO.5 66 44 22
0006 Ward NO.6 I 0007 Ward No. 7 3 3
276

PRIMARY CENSUS ABSTRACT
CENSUS ABSTRACT
of marsinal workers N{IIlle of Town! Ward Location
Household industry Other workers Non-workers code
workers number
Persons Males Females Persons Males Females Persons Males Females
50 51 52 53 54 55 56 57 58 2
103 28 75 1,628 842 786 29,465 11,382 18,083 Rampura Phul (M el+OG) 41403000
99 27 72 1,525 798 727 28,499 10,968 17,531 Rampura Phol (M el) 41403000 7 5 2 307 125 182 1,442 594 848 Ward No. I 0001
10 3 7 237 83 154 1,443 594 849 Ward No.2 0002 47 7 40 136 , 35 101 1,235 489 746 Ward No.3 0003
8 8 248 129 119 2,180 842 1,338 Ward No. 4 0004 17 7 10 1,726 639 1,087 Ward NO.5 0005
254 225 29 2,281 872 1,409 Ward No.6 0006 18 II 7 1,538 545 993 Ward No.7 0007
5 2 3 63 24 39 1,579 683 896 Ward No.8 0008 25 16 9 1,486 593 893 Ward NO.9 0009
6 5 I 48 3S 13 2,313 951 1,362 Ward No. 10 0010
3 3 18 13 5 1,530 586 944 Ward No. II 0011
1 3 3 1,271 465 806 Ward No. 12 0012
3 3 28 14 14 1,949 736 1,213 Ward No. 13 0013 2 32 22 10 2,064 714 1,350 Ward No. 14 0014
16 II 5 1,14,8 434 714 Ward No. 15 0015 2 2 1,199 436 763 Ward No. 16 0016
6 2 4 73 48 25 2,115 795 1,320 Ward No. 17 0017 Outgrowth(s)
2 78 25 53 339 178 161 Jawahar Nagar on Rampura - 0018 Bathinda Road (OG) - Ward No.18
2 2 25 19 6 439 157 282 Dashmesh Nagar on Rampura- 0019 Mehraj Road (OG) - Ward No.19
188 79 109 Outgrowth of Gandhi Nagar on 0020 Pitho Road (OG) - Ward No.20
7 7 151 92 59 8,742 3,338 5,404 Goniana (M el) 41401000 8 5 3 796 318 478 Ward No. I 0001
68 57 11 662 256 406 Ward No. 2 0002 581 212 369 Ward No. 3 0003
2 635 231 404 Ward No. 4 0004 10 5 5 420 158 262 Ward No. 5 0005
3 3 2 2 724 260 464 Ward No. 6 0006 4 2 2 639 , ,1- 222 417 Ward No. 7 0007
29 3 26 895 368 527 Ward No. 8 0008 4 1 3 888 359 529 Ward No. 9 0009 5 4 1 783 283 500 Ward No. 10 0010
11 7 4 648 254 394 Ward No. 11 0011 2 2 2 2 540 209 331 Ward No. 12 0012
2 2 6 3 3 531 208 323 Ward No. 13 0013
, 6 3 2,876 1,053 1,823 Bhisiana (CT) 41402000 9 .6 3 2,876 1,053. 1,823 Ward No. 1 0001
-t!. 1 1 245 133 112 8,885 3.348 5,537 Bhucho Mandi (M el) 41404000
19 4 15 673 258 415 Ward No. I 0001 40 33 7 660 235 425 Ward No. 2 0002 17 7 10 624 224 400 Ward NO.3 0003
1 1 570 191 379 Ward NO.4 0004 66 44 22 554 252 302 Ward No. 5 0005
1 1 780 309 471 Ward NO.6 0006 3 3 769 308 461 Ward No.7 0007
277

DISTRICT CENSUS HANDBOOK: BATHINDA
URBAN PRIMARY
Area of Location Name ofTownl Ward TownlWard Number of Total population (including Population in the
code in square households institutional and houseless age-group 0-6 number Kilometre population)
Persons Males Females Persons Males Females
2 3 4 5 6 7 8 9 10
41403000 Rampura Phul (M el+OG) 8,234 44,665 23,692 20,973 5,582 3,133 2,449 0008 Ward No. 8 140 803 417 386 90 44 46 0009 Ward No.9 140 808 411 397 81 49 32 0010 Ward No. 10 173 1,059 555 504 138 75 63 0011 Ward No. 11 186 1,081 562 519 169 88 81 0012 Ward No. 12 219 1,360 728 632 221 121 100 0013 Ward No. 13 195 1,124 585 539 148 94 54
41405000 Bathi,lda (M el) 42,130 217,256 116,?,Q; 100,310 24,496 13,980 10,516 0001 Ward No. I 1,415 6,242 3,334 2,908 559 340 219 0002 Ward No.2 553 2,944 1,592 1,352 439 230 209 0003 Ward No. 3 1,589 6,870 3,745 3,125 460 253 207 0004 Ward No. 4 1,776 8,868 4,704 4,164 1,013 584 429 0005 Ward No. 5 1,286 6,948 3,618 3,330 787 424 363 0006 Ward No. 6 1,066 5,667 2,981 2,686 521 278 243 0007 Ward No.7 1,121 6,106 3,306 2,800 776 422 354 0008 Ward No. 8 1,924 9,150 4,758 4,392 926 537 389 0009 Ward No. 9 1,355 6,721 3,537 3,184 594 348 246 0010 Ward No. 10 1,458 7,121 3,831 3,290 651 383 268 0011 Ward No. 11 1,062 5,030 2,708 2,322 759 392 367 0012 Ward No. 12 1,655 8,113 4,752 3,361 741 430 311 0013 Ward No. 13 635 3,139 1,659 1,480 3~6 188 138 0014 Ward No. 14 1,082 5,621 3,015 2,606 535 310 225 0015 Ward No. 15 1,170 6,828 3,607 3,221 872 506 366 0016 Ward No. 16 939 4,269 2,234 2,035 418 232 186 0017 Ward No. 17 659 3,735 1,986 1,749 407 241 166 0018 Ward No. 18 982 5,437 2,876 2,561 575 333 242 0019 Ward No. 19 984 5,684 3,040 2,644 560 317 243 0020 Ward No. 20 935 5,324 2,841 2,483 532 342 190 0021 Ward No. 21 1,050 5,544 2,924 2,620 518 303 215 0022 Ward No. 22 1,188 6,079 3,330 2,749 644 385 259 0023 Ward No. 23 782 4,391 2,275 2,116 441 264 177 0024 Ward No. 24 835 4,755 2,470 2,285 450 247 203 0025 Ward No. 25 887 5,165 2,790 2,375 653 368 285 0026 Ward No. 26 1,396 7,127 3,957 3,170 1,076 605 471 0027 Ward No. 27 1,433 7,563 4,064 3,499 1,170 660 510 0028 Ward No. 28 1,355 6,962 3,743 3,219 764 441 323 0029 Ward No. 29 1,844 8,798 5,190 3,608 1,238 681 557 0030 Ward No. 30 1,378 6,880 3,632 3,248 831 491 340 0031 Ward No. 31 1,428 7,571 4,029 3,542 870 487 383 0032 Ward No. 32 1,236 6,738 3,602 3,136 729 446 283 0033 Ward No. 33 1,342 7,409 4,077 3,332 1,119 647 472 0034 Ward No. 34 1,032 5,730 3,106 2,624 893 496 397 0035 Ward No. 35 1,298 6,727 3,633 3,094 649 369 280
41406000 Sangat (M e1) 939 5,401 2,862 2,539 746 429 317 0001 Ward No. 1 76 452 242 210 79 42 37 0002 Ward No.2 85 430 230 200 38 21 17 0003 Ward No. 3 78 459 243 216 55 31 24 0004 Ward No. 4 86 483 251 232 55 31 24 0005 Ward No. 5 94 495 260 235 75 42 33 0006 Ward No. 6 97 526 285 241 90 51 39 0007 Ward No.7 82 503 275 228 67 45 22 0008 Ward No. 8 77 475 246 229 52 32 20 0009 Ward No. 9 95 591 301 290 93 49 44 0010 Ward No. 10 J06 627 341 286 78 45 JJ 0011 Ward No. 11 63 360 188 172 64 40 24
278

PRIMARY CENSUS ABSTRACT
CENSUS ABSTRACT
Name of Town! Ward Scheduled Castes population Scheduled Tribes population Literates
Persons Males Females Persons Males Females Persons Males Females
11 12 13 14 15 16 17 18 19 2
10,020 5,310 4,710 28,676 16,294 12,382 RampuTll Phul (MCI+OG) 541 278 263 429 257 172 Ward No. 8
677 358 319 Ward No. 9 652 344 308 540 326 214 Ward No. 10 626 325 301 555 326 229 Ward No. 11 267 142 1'25 777 486 291 Ward No. 12 136 70 66 773 430 343 Ward No. 13
46,295 24,463 21,832 150,479 85,979 64,500 Bathioda (M CI) 1,489 796 693 4,900 2,731 2,169 Ward No. I
542 277 265 1,514 921 593 Ward No.2 1,074 580 494 5,555 3,290 2,265 Ward No. 3 1,382 733 649 6,418 3,619 2,799 Ward No. 4 1,424 704 720 4,589 2,517 2,072 Ward No. 5
550 282 268 4,537 2,486 2,051 Ward No. 6 2,522 1,343 1,179 3,372 1,991 1,381 Ward No.7
733 383 350 6,786 3,670 3,116 Ward No. 8 78 38 40 5,557 3,027 2,530 Ward NO.9
330 185 145 5,742 3,225 2,517 Ward No. 10 1,087 559 528 ,1)32 1,369 963 Ward No. I I
800 518 282 5,985 3,467 2,518 Ward No. 12 292 148 144 2,355 1,325 1,030 Ward No. 13 919 469 450 3,862 2,226 1,636 Ward No. 14
3,817 1,999 1,818 4,213 2,395 1,818 Ward No. 15 572 284 288 3,422 1,861 1,561 Ward No. 16 854 459 395 2,731 1,519 1,212 Ward No. 17 558 300 258 4,169 2,302 1,867 Ward No. 18 495 258 237 4,438 2,487 1,951 Ward No. 19
19 11 8 4,359 2,380 1,979 Ward No. 20 1,113 585 528 4,321 2,401 1,920 Ward No. 21 1,261 671 590 4,218 2,468 1,750 Ward No. 22
30 IS 15 3,591 1,905 1,686 Ward No. 23 234 117 117 3,809 2,069 !,740 Ward No. 24
3,245 1,709 1,536 2,710 1,636 1,074 Ward No. 25 2,252 1,222 1,030 3,676 2,322 1,354 Ward No. 26 4,082 2,174 1,908 3,826 2,339 1,487 Ward No. 27 2,487 1,312 1,175 4,849 2,826 2,023 Ward No. 28 4,075 2,163 1,912 5,067 3,407 1,660 Ward No. 29 1.597 800 797 4,707 2,660 2,047 Ward No. 30 1,603 852 751 5,461 3,130 2,331 Ward No: 31
950 500 450 5,168 2,881 2,287 Ward No. 32 1,527 807 720 4,138 2,503 1,635 Ward No. 33 1,955 1,042 913 3,113 1,899 1,214 Ward No. 34
347 168 179 4.989 2.725 2,264 Ward No. 35
1,674 869 80s 2,701 1,541 1,161 Saolat (M el) 207 110 97 212 126 86 WatdNo. I 38 22 16 331 • 187 144 Ward No. 2
8 3 S 344 197 147 Ward No. 3 214 III 103 244 136 108 Ward No. 4 247 130 117 206 108 98 Ward No. 5 197 102 9S 181 113 68 Ward No. 6 55 27 28 234 139 95 Ward No. 7 26 15 11 273 149 124 Ward No. 8
519 260 259 149 85 64 WatdNo.9 105 56 49 381 222 159 Ward No. 10 58 33 25 147 79 68 WatdNo.11
279

DISTRICT CENSUS HANDBOOK: BATHINDA
URBAN PRIMARY
Location Name ofTownf Ward
code Illiterates Total workers Main workers number
Persons Males Females Persons Males Females Persons Males Females
2 20 21 22 23 24 25 26 27 28
41403000 Rampura Phul (M el+OG) 15,989 7,398 8,591 15,200 12,310 2,890 13,083 11,269 1,814
0008 Ward No.8 374 160 214 216 204 12 212 200 12 0009 Ward No. 9 131 53 78 258 237 21 257 236 21 0010 Ward No. 10 519 229 290 380 283 97 ·347 278 69 0011 Ward No. II 526 236 290 386 300 86 359 294 65 0012 Ward No. 12 583 242 341 412 366 46 381 344 37 0013 Ward No. 13 351 155 196 328 297 31 322 291 31
41405000 Bath;nda (M el) 66,777 30,967 35,810 69,411 58,334 11,077 65,892 55,977 9,915 0001 Ward No. I 1,342 603 739 2,042 1~655 387 2,022 1,643 379 0002 Ward No. 2 1,430 671 759 791 748 43 783 743 40 0003 Ward No. 3 1,315 455 860 2,024 1,752 272 1,991 1,726 265 0004 Ward No. 4 2,450 1,085 1,365 2,571 2,188 383 2,472 2,125 347 0005 Ward NO.5 2,359 1,101 1,258 2,176 1,787 389 2,136 1,759 377 0006 Ward No. 6 1,130 495 635 1,793 1,503 290 1,741 1,474 267 0007 Ward NO.7 2,734 1,315 1,419 1,878 1,602 276 1,769 1,514 255 0008 Ward No.8 2,364 1,088 1,276 3,126 2,314 812 3,040 2,260 780 0009 Ward No. 9 1,164 510 654 2,168 1,740 428 2,124 1,711 413 0010 Ward No. 10 1,379 606 773 2,257 1,850 407 2,213 1,818 395 0011 Ward No. 11 2,698 1,339 1,359 1,725 1,406 319 1,667 1,369 298 0012 Ward No. 12 2,128 1,285 843 2,968 2,429 539 2,748 2,293 455 0013 Ward No. 13 784 334 450 1,218 792 426 1,193 777 416 0014 Ward No. 14 1,759 789 970 1,657 1,408 249 1,573 1,353 220 0015 Ward No. 15 2,615 1,212 1,403 2,135 1,771 364 1,917 1,642 275 0016 Ward No. 16 847 373 474 1,413 1,118 295 1,376 1,102 274 0017 Ward No. 17 1,004 467 537 1,151 997 154 1,133 984 149 0018 Ward No. 18 1,268 574 694 1,691. 1,489 202 1,638 1,458 180 0019 Ward No. 19 1,246 553 693 1,806 1,559 247 1,742 1,513 229 0020 Ward No. 20 965 461 504 1,690 1,491 199 1,617 1,434 183 0021 Ward No. 21 1,223 523 700 1,845 1,574 271 1,689 1,522 167 0022 Ward No. 22 1,861 862 999 1,842 1,647 195 1,800 1,627 173 0023 Ward No. 23 800 370 430 1,379 1,205 174 1,328 1,182 146 0024 Ward No. 24 946 401 545 1,488 1,350 138 1,460 1,327 133 0025 Ward No. 25 2,455 1,154 1,301 1,768 1,349 419 1,522 1,198 324 0026 Ward No. 26 3,451 1,635 1,816 2,498 2,054 444 2,041 1,696 345 0027 Ward No. 27 3,737 1,725 2,012 2,257 2,015 242 2,133 1,948 185 0028 Ward No. 28 2,113 917 1,196 2,263 1,829 434 2,167 1,754 413 0029 Ward No. 29 3,731 1,783 1,948 2,800 2,526 274 2,570 2,338 232 0030 Ward No. 30 2,173 972 1,201 2,233 1,812 421 2,086 1,695 391 0031 Ward No. 31 2,110 899 1,211 2,283 1,985 298 2,152 1,907 245 0032 Ward No. 32 1,570 721 849 1,982 1,795 187 1,837 1,686 151 0033 Ward No. 33 3,271 1,574 1,697 2,478 2,085 393 2,304 1,972 332 0034 Ward No. 34 2,617 1,207 1,410 1,734 1,544 190 1,652 1,476 176
0035 Ward No. 35 1,738 908 830 2,281 1,965 316 2,256 1,951 305
41406000 Sangat (M el) 2,699 1,321 1,378 1,690 1,562 128 1,616 1,514 102 0001 Ward No. I 240 116 124 136 129 7 94 90 4 0002 Ward No.2 99 43 56 140 .. 124 • 16 138 122 16 0003 1[5
r 159 131 28 Ward No. 3 46 69 [59 • [31 28
0004 Ward No. 4 239 115 124 137 130 7 136 130 6
0005 Ward No. 5 289 152 137 164 159 5 163 158 5 0006 Ward No. 6 345 172 173 177 173 4 176 173 3 0007 Ward No. 7 269 136 133 165 163 2 165 163 2 0008 Ward No.8 202 97 105 136 133 3 134 133 1 0009 Ward No. 9 442 216 226 168 165 3 167 164 3
0010 Ward No. 10 246 119 127 160 155 5 157 153 4
0011 Ward No. 11 213 109 104 148 100 48 127 97 30
280

PRIMARY CENSUS ABSTRACT
CENSUS ABSTRACT
Industrial category of main workers
Cultivators Agricultural labourers Household industry
workers Other workers
Name ofTownl Ward
Persons Males Females Persons Males Females Persons Males Females Persons Males Females
29 30' 31 32 33 34 35 36 37 38 39 40 2
795 2
18 14 12 2
794 113 22
8 5 1 2
50 15 10
5 48 48 34
9 14 38
6 36
3 3
14 2
10 21 19 4 7
23 165 29
8 10 12
413 18 4 8
19 49 81
128 72 11
23
766 1
18 14 11 2
700 108 21
7 3
2 49 14 10
5 43 43 23
9 13 30
3 27
2 3
13 2 9
18 12 4 6
21 160 19
8 S 7
409 18 4 7
18 49 81
128 72 11
21
29
94 5 1
2
5 5
11
8 3 9 1
I 3 7
2 5
10
5 5
4
2
733
I 56
1,106 133 132
3 50 13 4
10 18 13 1
37 20 17 70 2 5
4 56 13 16 60
3 8
22 40
I 23
7 190 17 10
5 96
6
370
6 1
49 64 71 20 12
145
2
592
55 '
972 91
124 3
50 7 3 8
13 12 1
37 IS 14 70
2 4
4 45 12 14 54
2 7
19 31
1 19 6
182 14 9 3
92 4
362
5
48 63 70 20 12
142
2
141
134 42
8
6 1 2 5 1
5 3
11 1 2 6 1 1 3 9
4 1 8 3 I 2 4 2
8
3
293
6
7
1,939 37 18 13 40 92 19 33
167 59 29 21 27
294 144 36
6 6
22 128 S3
147 56 26 32 43 82 28 36 9
S3 63 27 27 27 39
23
12 3
2 2 2
251
6
6
1,247 18 17 9
36 60 15 24
lIO 55 24 12 25 29
101 31
4 4
15 95 40
117 43 24 26 35 40 18 2S
4 45 53 21 19 22 31
19
10 2
2 1 •
2
281
42
692 19
1 4 4
32 4 9
57 4
',..5 , 9
2 265 43
5 2 2 1
33 13 30 13 2 6 8
42 10 II 5 8
10 6 8 5 8
4
2
11,262 210 257 323 344 306 320
62,053 1,139
611 1,915 2,374 2,026 1,111 1,124 2,805 2,037 2,173 1,604 2,653
834 1,325 1,870 1,351 1,088 1,606 1,522 1,548 1,523 1,670 1,291 1,410 1,436 1,900 2,100 2,101 2,531 1,678 2,043 1,800 2,264 1,519 2,199
810 76
116 147 68 49 24 17 49
9 155 100
9,660
199 236 254 280 272 289
###1##
1,426 581
1,714 2,032 1,689 1,455 1,480 2,088 1,630
. 1,783 1,315 2,210
691 1,159 1,600 1,081
950 1,436 1,346 1,380 1,388 1,517 1,154 1,285 1,126 1,613 1,925 1,704 2,307 1,308 1,821 1,656 1,942 1,357 1,909
724 72
103 122 64 45 22 15 48
9 152 72
1,602 Rampura Phul (M el+0G) II Ward NO.8 21 Ward No. 9 69 Ward No. 10 64 Ward No. II 34 Ward No. 12 31 Ward No. 13
8,995 Bathinda (M el) 313 Ward No. I
30 Ward No. 2 261 Ward NO.3 342 Ward No.4 337 Ward NO.5 262 Ward NO.6 244 Ward No.7 717 Ward NO.8 407 Ward No.9 390 Ward No. 10 289 Ward No. 11 443 Ward No. 12 143 Ward No. 13 166 Ward No. 14 270 Ward No. IS 270 Ward No. 16 138 Ward No. 17 170 Ward No. 18 J 76 Ward No. 19 168 Ward No. 20 135 Ward No. 21 153 Ward No. 22 143 Ward No. 23 125 Ward No. 24 310 Ward No. 25 287 Ward No. 26 175 Ward No. 27 397 Ward No. 28 224 Ward No. 29 370 Ward No. 30 222 Ward No. 31 144 Ward No. 32 322 Ward No. 33 162 Ward No. 34 290 Ward No. 35
86 8aogat (M el) 4 Ward No. 1
13 Ward No. 2 25 Ward No. 3
4 Ward No. 4 4 Ward No. 5 2 Ward No. 6 2· Ward No. 7 1 Ward No. 8
Ward No. 9 3 Ward No. 10
28 Ward No. II

DISTRICT CENSUS HANDBOOK: BATHINDA
URBAN PRIMARY
Industrial cate~0!1 Location Name of Town/ Ward
code Marginal workers Culti vators Agricultural labourers number
Persons Males Females Persons Males Females Persons Males Females
2 41 42 43 44 45 46 47 48 49
41403000 Rampura Phul (M CI+OG) 1,117 1,041 1,076 51 16 35 335 155 180 0008 Ward No. 8 4 4 0009 Ward No. 9 1 0010 Ward No. 10 33 5 28 0011 Ward No. 11 27 6 21 0012 Ward No. 12 31 22 9 0013 Ward No. 13 6 6
41405000 Bat~linda (M CI) 3,519 1,357 1,162 29 13 16 308 272 36 0001 Ward No. 1 20 12 8 1 0002 Ward No, 2 8 5 3 0003 Ward No. 3 33 26 7 0004 Ward No. 4 99 63 36 2 2 2 2 0005 Ward No. 5 40 28 12 2 0006 Ward No. 6 52 29 23 0007 Ward No. 7 109 88 21 0008 Ward No. 8 86 54 32 0009 Ward No. 9 44 29 15 0010 Ward No, 10 44 32 12 4 4 0011 Ward No, 11 S8 37 21 0012 Ward No, 12 220 136 84 18 16 2 0013 Ward No. 13 25 15 10 0014 Ward No. 14 84 55 29 4 2 2 31 27 4 0015 Ward No, 15 218 129 89 0016 Ward No, 16 37 16 21 0017 Ward No, 11 18 13 5 I 0018 Ward No. 18 53 31 22 2. 2 0019 Ward No, 19 64 46 18 6 4 2 12 II 0020 Ward No. 20 73 57 16 0021 Ward No. 21 156 52 104 0022 Ward No, 22 42 20 22 16 4 12 0023 Ward No. 23 51 23 28 0024 Ward No. 24 28 23 5 0025 Ward No, 25 246 151 95 0026 Ward No, 26 457 358 99 2 2 112 104 8 0027 Ward No. 27 124 67 57 2 2 0028 Ward No. 28 96 75 21 9 7 2 0029 Ward No, 29 230 188 42 0030 Ward No. 30 147 117 30 2 46 45 I 0031 Ward No. 31 131 78 53 5 4 3 I 2 0032 Ward No. 32 145 109 36 27 26 I 0033 Ward No. 33 174 113 61 21 19 2 0034 Ward No. 34 82 68 14 I 0035 Ward No. 35 2S 14 II
41406000 Slingat (M CI) 74 48 26 30 28 2 0001 Ward No. I 42 39 3 26 25 1 0002 Ward No. 2 2 2 ~ I I 0003 Ward No. 3 0004 Ward No. 4 0005 Ward No.5 0006 Ward No. 6 0007 Ward No. 7 0008 Ward No. 8 2 2 0009 Ward No, 9 1 1
0010 Ward No. 10 3 2 2 0011 Ward No, II 21 3 18
282

PRIMARY CENSUS ABSTRACT
CENSUS ABSTRACT
of mar~iniii workers
Household industry Name of Town! Ward Location
workers Other workers Non-workers code
number
Persons Males Females Persons Males Females Persons Males Females
50 51 52 53 54 55 56 57 58 - 2
103 28 75 1,628 842 786 29,465 11,382 18,083 Rampura Phul (M CJ+OG) 41403000
4 4 587 213 374 Ward No. 8 0008 I I 550 174 376 Ward No. 9 0009
31 5 26 679 272 407 Ward No. 10 0010 26 ,6 20 695 262 433 Ward No. II 001l 31 22 9 948 362 586 Ward No. 12 0012
5 5 796 288 508 Ward No. 13 0013
138 48 90 3,044 2,024 1,020 147,845 58,612 89,233 Bathinda (M CI) 41405000 I 1 18 11 7 4,200 1,{»79 2,521 Ward No. I 0001
7 4 3 2,153 • 844 1,309 Ward No. 2 0002 I 32 26 6 4,846 1,993 2,853 Ward No. 3 0003
2 2 93 57 36 6,297 2,516 3,781 Ward NO.4 0004 38 27 11 4,772 1,831 2,941 Ward No.5 0005 52 29 23 3,874 1,478 2,396 Ward No. 6 0006
3 2 106 87 19 4,228 1,704 2,524 Ward No. 7 0007
9 5 4 76 48 28 6,024 2,444 3,580 Ward No. 8 0008
4 4 40 25 15 4,553 1,797 2,756 Ward NO.9 0009
1 1 39 27 12 4,864 1,981 2,883 Ward No. 10 0010
1 57 37 20 3,305 1,302 2,003 Ward No. II 0011 202 120 82 5,145 2,323 2,822 Ward No. 12 0012
2 23 14 9 1,921 867 1,054 Ward No. 13 0013
10 2 8 39 24 15 3,964 1,607 2,357 Ward No. 14 0014
5 5 212 128 84 4,693 1,836 2,857 Ward No. 15 0015
36 15 21 2,856 1,116 1,740 Ward No. 16 0016 17 13 4 2,584 989 1,595 Ward No. 17 0017
2 2 49 31 18 3,746 1,387 2,359 Ward No. 18 0018
6 3 3 40 28 12 3,878 1,481 2,397 Ward No. 19 0019
8 3 5 64 53 II 3,634 1,350 2,284 Ward No. 20 0020
10 2 8 146 50 96 3,699 1,350 2,349 Ward No. 21 0021
25 16 9 4,237 1,683 2,554 Ward No. 22 0022
51 23 28 3,012 1,070 1,942 Ward No. 23 0023
28 23 S 3,267 1,120 2,147 Ward No. 24 0024
16 4 12 229 147 82 3,397 1,441 1,956 Ward No. 2S 0025
II 8 3 332 244 88 4,629 1,903 2,726 Ward No. 26 0026
122 67 S5 5,306 2,049 3,257 Ward No. 27 0027
9 3 6 78 65 13 4,699 1,914 2,785 Ward No. 28 0028
230 188 42 5,998 2,664 3,334 Ward No. 29 0029
2 2 97 71 26 4,647 1,820 2,827 Ward No. 30 0030
12 2 10 111 74 37 5,288 2,044 3,244 Ward No. 31 0031
15 4 11 103 79 24 4,756 1,807 2,949 Ward No. 32 0032
4 3 149 93 56 4,931 1,992 2,939 Ward No. 33 0033
I I 80 67 13 3,996 1,562 2,434 Ward No. 34 0034
2 I 23 13 10 4,446 1,668 2,778 Ward No. 35 0035
44 20 24 3,711 1,300 2,411 Sangat (M CI) 41406000 16 14 2 316 ' 1t3 203 Ward No. I 0001
1 I 290 106 . 184 Ward No. 2 0002 300 112 188 Ward No. 3 0003 346 121 225 Ward No. 4 0004 331 101 230 Ward No. 5 0005 349 112 237 Ward No. 6 0006 338 Il2 226 Ward No. 7 0007
2 2 339 113 226 Ward No. 8 0008 423 136 287 Ward No. 9 0009
I I 467 186 281 Ward No. 10 0010 21 3 18 212 88 124 Ward No. 11 0011
283

DISTRICT CENSUS HANDBOOK: BATHINDA
URBAN PRIMARY
Area of Location Name ofTowni Ward TownlWard Number of Total population (including Population in the
code in square households institutional and houseless age-group 0-6
number Kilometre population)
Persons Males Females Persons Males Females
2 3 4 5 6 7 8 9 lO
41403000 Rampura Phul (M CI+OG) 8,234 44,665 23,692 20,973 ' 5,582 3,133 2,449
41408000 Kot FatUi (M CI) 1,150 6,504 3,435 3,069 876 476 400 0001 Ward No, 1 129 644 335 309 90 46 44 0002 WardNo,2 107 547 300 241 82 52 30 0003 Ward No, 3 82 451 249 202 56 32 24 0004 Ward No, 4 77 484 261 223 S4 36 18 0005 Ward No. 5 95 491 261 224 79 42 37 0006 WarGNo.6 }62 889 468 421 138 74 64 0007 Ward No, 7 82 451 234 217 48 22 26 0008 Ward No. 8 90 501 266 235 70 43 27 0009 Ward No. 9 65 394 206 188 53 24 29 0010 Ward No. 10 124 823 411 412 101 55 46 0011 Ward No. 11 137 829 438 391 105 50 55
41407000 Raman(M CI) 3,398 19,551 10,361 9,190 2,546 1,407 1,139 0001 Ward No, I 265 1,560 813 747 236 131 105 0002 Ward No. 2 262 1,461 782 679 188 108 80 0003 Ward No, 3 246 1,534 813 721 252 125 127 0004 Ward No. 4 242 1,460 757 703 195 101 94 0005 Ward No, 5 224 1,299 684 615 108 67 41
0006 Ward No. 6 209 1,278 671 607 127 73 54 0007 Ward No, 7 283 1,682 914 768 241 129 112 0008 Ward No, 8 325 1,659 889 770 211 132 79 0009 Ward No. 9 303 1,600 838 762 248 137 111 0010 Ward No. 10 281 1,688 910 778 195 104 91
0011 Ward No. II 260 1,545 825 720 213 113 100 0012 Ward No, 12 280 1,488 781 707 172 104 68 0013 Ward No, 13 218 1,297 684 613 160 83 77
41409000 Maur(M CI) 4,766 27,543 14,675 12,868 3,640 2,041 1,599 0001 Ward No. 1 318 1,842 992 850 285 155 130 0002 Ward No, 2 336 1,938 996 942 232 119 113
0003 Ward No. 3 271 1,565 853 712 218 124 94
0004 Ward No. 4 348 1,998 1,057 941 257 154 103 0005 Ward No. 5 349 1.921 1,029 892 276 159 117 0006 WardNo,6 279 1,595 849 746 161 94 67 0007 Ward No. 7 318 1,787 949 838 213 116 97 0008 Ward No. 8 261 1,551 841 710 170 102 68
I"
0009 Ward No. 9 330 1,811 ,974 837 256 143 113
0010 Ward No, 10 298 1,667 895 772 199 III 88
0011 Ward No. 11 370 2,160 1,153 1,007 276 152 124
0012 Ward No. 12 314 1,795 922 873 297 170 127
0013 Ward No. 13 294 1.696 903 793 223 118 105
0014 Ward No, 14 253 1,773 961 812 285 153 132
0015 Ward No, \5 427 2444 1,301 1 143 292 171 121
284

PRIMARY CENSUS ABSTRACT
CENSUS ABSTRACT
Name ofTowni Ward
Scheduled Castes population Scheduled Tribes population Literates
Persons Males Females Persons Males Females Persons Males Females
II 12 13 14 15 16 17 18 . 19 2
10,020 5,310 4,710 28,676 16,294 12,382 Rampura Phul (M CI+OG)
2,691 1,447 1,244 3,305 1,945 1,360 Kot Fatta (M el) 188 92 96 4\7 241 176 Ward No.1 117 69 48 317 194 123 Ward No. 2 285 ISS 130 154 96 58 Ward No. 3 218 121 97 265 154 III Ward No. 4 480 260 220 193 131 62 Ward NO.5 800 423 377 393 234 159 Ward No. 6 206 109 97 ';"254 146 108 Ward No. 7 113 61 52 266 149 117 Ward No. 8 23 12 II 226 137 89 Ward No. 9 11 5 6 416 223 193 Ward No. 10
250 140 110 404 240 164 Ward No. II
5,938 3,135 2,803 11,571 6,723 4,848 Raman (M CI) 1,124 583 541 825 SOl 324 Ward No. 1
79 42 37 1,076 606 470 Ward No. 2 1,154 602 552 701 433 268 Ward No. 3
94 46 48 1,001 556 445 Ward No. 4 1,105 602 503 Ward No. 5 1,058 581 477 Ward No. 6
875 468 407 886 553 333 Ward No. 7 lOS 52 53 1,110 620 490 Ward No. 8 695 378 317 546 313 233 Ward No. 9 224 124 100 757 478 279 Ward No. 10 884 477 407 585 377 208 Ward No. 11 154 82 72 1,043 583 460 Ward No. 12 550 281 269 878 520 358 Ward No. 13
8,411 4,467 3,944 15,810 9,276 6,534 Maur(MCI) 1,262 678 584 754 470 284 Ward No.1
347 164 183 981 567 414 Ward No. 2 426 239 187 680 408 272 Ward No. 3
113 58 55 1,410 793 617 Ward No. 4 421 224 197 1,110 653 457 Ward No. 5
13 8 5 1,313 733 580 Ward No. 6 18 10 8 1,434 799 635 Ward No. 7
5 4 1,206 679 527 Ward No. 8 . 1,007 528 479 862 535 327 Ward No. 9
815 444 371 760 469 291 Ward No. 10
989 531 458 1,007 621 386 Ward No. 11
994 510 484 894 509 385 Ward No. 12
558 285 273 1,021 601 420 Ward No. 13
1,200 659 541 756 482 274 Ward No. 14
243 125 118 1,622 957 665 Ward No. 15
285

DISTRICT CENSUS HANDBOOK: BATHINDA
URBAN PRIMARY
Location Name ofTowni Ward code Illiterates Total workers Main workers
number
Persons Males Females Persons Males Females Persons Males Females
2 20 21 22 23 24 25 26 27 28
41403000 Rampura Phul (M el+OG) 15,989 7,398 8,591 15,200 12,310 2,890 13,083 11,269 1,814
41408000 Kot Fatta (M el) 3,199 1,490 1,709 2,139 1,888 251 1,743 1,684 59 0001 Ward No. 1 227 94 133 227 178 49 176 165 11 0002 Ward No. 2 230 106 124 176 166 10 176 166 10 0003 Ward No. 3 297 153 144 144 132 12 134 125 9 0004 Ward No. 4 219 107 112 154 135 19 134 128 6 0005 Ward No. 5 298 136 162 162 146 16 142 138 4 0006 War~No. 6 496 234 262 '328 244 84 195 189 6 0007 Ward No. 7 197 88 109 136 129 7 126 124 2 0008 Ward No. 8 235 117 118 161 156 5 153 153 0009 Ward No. 9 168 69 99 137 115 22 96 92 4 0010 Ward No. 10 407 188 219 249 244 5 242 237 5 0011 Ward No. 11 425 198 227 265 243 22 169 167 2
41407000 Raman (Mel) 7,980 3,638 4,342 6,238 5,498 740 5,906 5,351 555 0001 Ward No. 1 735 312 423 476 403 73 453 395 58 0002 Ward No.2 385 176 209 495' 418 77 449 409 40 0003 Ward No. 3 833 380 453 477 415 62 344 304 40 0004 Ward NO.4 459 201 258 440 412 28 42} 406 17 0005 Ward No.5 194 82 112 404 382 22 402 380 22 0006 Ward No. 6 220 90 130 391 375 16 390 374 16 0007 Ward No. 7 796 361 435 585 499 86 584 499 85 0008 Ward No. 8 549 269 280 494 465 29 494 465 29 0009 Ward NO.9 1,054 525 529 691 479 212 590 473 117 0010 Ward No. 10 931 432 499 527 480 47 525 478 47 0011 Ward No, 11 960 448 512 446 423 23 444 422 22 0012 Ward No. 12 445 198 247 431 400 31 428 399 29 0013 Ward No. 13 419 164 255 381 347 34 380 347 33
41409000 Maur(MCI) 11,733 5,399 6,334 9,118 7,609 1,509 8,244 7,311 933 0001 Ward No. 1 1,088 522 566 647 481 166 541 465 76 0002 Ward No. 2 957 429 528 627 558 69 568 527 41 0003 Ward No. 3 885 445 440 513 444 69 391 380 11 0004 Ward No. 4 588 264 324 632 561 71 604 542 62 0005 Ward No.5 811 376 435 613 528 85 599 526 73 0006 Ward No. 6 282 116 166 490 437 53 480 430 50 0007 Ward No. 7 353 150 203 583 540 43 581 538 43 0008 Ward No. 8 345 162 183 446 '1'427 19 442 426 16 0009 Ward No. 9 949 439 510 574 476 98 536 453 83 0010 Ward No. 10 907 426 481 578 489 89 504 469 35 0011 Ward No. II 1,153 532 621 887 617 270 715 580 135 0012 Ward No. 12 901 413 488 739 486 253 609 472 137 0013 Ward No. 13 675 302 373 540 453 87 491 439 52 0014 Ward No. 14 1,017 479 538 547 480 67 544 478 66 0015 Ward No. 15 822 344 478 702 632 70 639 586 53
286

PRIMARY CENSUS ABSTRACT
CENSUS ABSTRACT
Industrial category of main workers
Cultivators Agricultural labourers Household industry workers
Name ofTownJ Ward Other workers
Persons Males Females Persons Males Females Persons Males Females Persons Males Females 29 30 31 32 33 34 35 36 37 38. 39 40 2
79S 766
696 688 12 12 69 68 19 18 65 65 18 18 5, 49 61 59 68 68 45 45
185 183 103 103
S21 504 12 12 11 11 8 8
31 31 7 7 7 7
II 11 14 .12 93 88
269 266 37 35 20 16
1,246 1,149 87 86
307 287 170 170 48 41 18 18 4 4
2 2 45 34
179 171 307 259 23 22 20 19
5 5 31 31
29
8
2 2
2
17
2 5 3 2 4
97 1
20
7
II 8
48
733
373 15 25 68 24 72 68 37 43
4 4
13
680
I 5 4
13 12
264 165 184
10 22
S55 75 56 44 16 42
41 133 80
33 27
8
S92
367 14 22 67 24 72 68 37 43
4 4
12
586
5 4
13 10
212 136 177
9 19
508 70 46 44 14 39
38 125 67
31 27
7
141
6 1 3
94
2 52 29
7 I 3
47 5
10
2 3
3 8
13
2
293
19 2
3 3 3 2 3
I 2
108 36 12 3 5 5
10 30
7
112 14 7
2 9 3 2
9 7
19 8 5
13 14
2S1
18 2
3 2 3 2 3
I 2
61 25 6 3 4 5
10 1
7
SO 3 3
7 3
6
5 3 4 9 4
287
42 11,262 9,660 .0r-
47 11 6
29
62 II 4
I 2
3 6
14 5 I 4
10
655 147 82 47 42 49 73 26 39 47 52 51
611 137 76 40 36 46 69 26 39 43 49 50
4,597 4,200 405 358 425 391 328 288 383 367 390 368 383 367 560 475 458 433 203 172
91 76 223 210 391 367 357 328
6,331 365 198 177 538 530 473 579 440 441 185 309 578 433 499 586
5,604 306 191 166 486 462 423 537 424 375 172 249 447 385 437 544
1,602 Rampura Phul (M CI+OG)
44 Kot Falta (M CI) 10 Ward No. 1 6 Ward No. 2 7 Ward No. 3 6 Ward No. 4 3 Ward No. 5 4 Ward No. 6
Ward No. 7 Ward No. 8
4 Ward No. 9 3 Ward No. 10
Ward No. II
397 Raman (M CI) 47 Ward No. 1 34 Ward No. 2 40 Ward No. 3 16 Ward No.4 22 Ward No. 5 16 Ward No.6 85 Ward NO.7 25 Ward NO.8 31 Ward No. 9 15 Ward No. 10 13 Ward No. II 24 Ward No. 12 29 Ward No. 13
727 Maur(M CI) 59 Ward No. 1
7 Ward No.2 11 Ward No.3 52 Ward No. 4 68 WardNo.5 50 Ward No. 6 42 Ward No. 7 16 Ward No.8 66 Ward No. 9 13 Ward No. 10 60 Ward No. 11
131 Ward No. 12 48 Ward No. 13 62 Ward No. 14 42 Ward No. 15

DISTRICT CENSUS HANDBOOK: BATHINDA
URBAN PRIMARY
Industrial cateBo!}:
Location Name ofTownl Ward
code Marginal workers Cultivators Agricultural labourers number
Persons Males Females Persons Males Females Persons Males Females
2 41 42 43 44 45 46 47 48 49
41403000 Rampura Fhul (M CI+OG) 2,117 1,041 1,076 51 16 35 335 155 180
41408000 Kot Fatta (M CI) 396 204 192 3 1 273 147 126 0001 Ward No. I 51 13 38 21 9 12 0002 Ward No. 2 0003 Ward No. 3 10 7 3 . 8 7 0004 Ward No. 4 20 7 13 8 4 4 0005 Ward No. 5 20 8 12 19 8 11 0006 WarJNo.6 133 55 78 131 54 77 0007 Ward No. 7 10 5 5 8 4 4 0008 Ward No. 8 8 3 5 7 3 4 0009 Ward No.9 41 23 18 21 17 4 0010 Ward No. 10 7 7 3 3 0011 Ward No. II 96 76 20 47 38 9
41407000 Raman (MCI) 332 147 185 4 4 100 7 93 0001 Ward No.1 23 8 15 0002 Ward No. 2 46 9 37 0003 Ward No.3 133 111 22 6 2 4
0004 Ward No. 4 17 6 11 0005 Ward No. 5 2 2 0006 Ward No.6 I I 0007 Ward No. 7 1 0008 Ward No. 8 0009 Ward No. 9 101 6 95 4 4 93 4 89
0010 Ward No. 10 2 2 OOll Ward No. II 2 I 0012 Ward No. 12 3 2 0013 Ward No. 13 1
41409000 Maur(M CI) 874 298 576 38 'r-
9 29 lSI 85 166 0001 Ward No. 1 106 16 90 I I 70 7 63
0002 Ward No. 2 59 31 28 4 I 3 32 13 19
0003 Ward No. 3 122 64 58 22 6 16 67 30 37 0004 Ward No. 4 28 19 9 5 4
0005 Ward No. 5 14 2 12 1 0006 Ward No. 6 10 7 3 0007 Ward No. 7 2 2 0008 Ward No. 8 4 1 3 0009 Ward No. 9 38 23 15 7 5 2
0010 Ward No. 10 74 20 54 8 8 35 16 19
0011 Ward No. 11 172 37 13S 27 4 23
0012 Ward No. 12 130 14 116 0013 Ward No. 13 49 14 35 ·7 6
0014 Ward No. 14 3 2 1
0015 Ward No. 15 63 46 17
288

PRIMARY CENSUS ABSTRACT
CENSUS ABSTRACT
of mar~inal workers
Household industry Name of Town! Ward Location
Other workers Non-workers code workers number
Persons Males Females Persons Males Females Persons Males Females
50 51 52 53 54 55 56 57 58 2
103 28 7S 1,628 842 786 29,465 11,382 18,083 Rampura Phul (M el+OG) 41403000 'r-
2 2 118 55 63 4,365 1;547 2,818 Kot Fatta (M el) 41408000 29 4 25 417 157 260 Ward No, 1 0001
371 134 237 Ward No. 2 0002 1 I 307 117 190 Ward No, 3 0003
11 ,
2 9 330 126 204 Ward No, 4 0004 329 121 208 Ward No. 5 0005
2 561 224 337 Ward No, 6 0006 2 315 105 210 Ward No. 7 0007
I 340 110 230 Ward No, 8 0008 20 6 14 257 91 166 Ward No. 9 0009
3 3 574 167 407 Ward No. 10 0010 49 3& 11 564 195 369 Ward No. 11 0011
27 2 25 201 138 63 13,313 4,863 8,450 Raman(M el) 41407000 1 I 22 & 14 1,084 410 674 Ward No. I 0001
23 23 23 9 14 966 364 602 Ward No. 2 0002 126 10& 18 1,057 398 659 Ward No. 3 0003
17 6 II 1,020 345 675 Ward No. 4 0004 2 2 895 302 593 Ward No.5 0005 I I 887 296 591 Ward No.6 0006 I 1,097 415 682 Ward No, 7 0007
1,165 424 741 Ward No.8 0008 4 2 2 909 359 550 Ward No. 9 0009 2 2 1,161 430 731 Ward No. 10 0010
1,099 402 697 Ward No. II 0011 2 1,057 381 676 Ward No. 12 0012
916 337 579 Ward No. 13 0013
8 8 577 204 373 18,425 7,066 1l,359 Maur(M el) 41409000 35 9 26 1,195 511 684 Ward No. I 0001
2 2 21 17 4 1,311 438 873 Ward No. 2 0002 33 28 5 \,052 409 643 Ward No. 3 0003 22 15 7 1,366 496 870 Ward No. 4 0004 13 2 II 1,308 501 807 Ward NO.5 0005 10 7 3 1,105 412 693 Ward No. 6 0006 1 1,204. 409 795 Ward No. 7 0007 4 3 1,105 414 691 Ward No. 8 0008
30 18 12 1,237 498 739 Ward No. 9 0009 31 4 27 1,089 406 683 Ward No. 10 0010
2 2 143 33 110 1,273 536 737 Ward No. II 0011 I 129 14 115 1,056 436 620 Ward No. 12 0012
40 7 33 1,156 450 706 Ward No, 13 0013 3 2 I 1,226 481 745 Ward No. 14 0014
62 46 16 1742 669 1073 Ward No. 15 0015
289

Annexure I Number of villages under Gram Panchayat :
With the Constitution (73 rd amendment) Act, 1992, the Census Organisation felt it necessary to provide population data for the territorial area of Panchayat. This required precise details of the territorial area of each Panchayat so that delineation of enumeration blocks (EBs) to be allotted to the enumerators could be done to meet this requirement.
It required careful delineation of enumeration blocks by the Charge Officers to ensure that EBs do not cut across the territorial area falling in the Panchayat. Different situations were well perceived. A Panchayat could consist of only one village or a number of complete Villages. There could be another situation where the Panchayat may consist of some complete villages and parts. of villages. Still there could be another situation where Panchayat could consist of a number of villages etc.
An exhaustive exercise was done to prepare Panchayat level data. However, we came across following types of situations which made it difficult to compile the Panchayat level data:
i) Some of the Panchayats have one or more than one village.
ii) Some of the Panchayats have only a part of the village.
iii) Some Panchayats include full village (s) as well as part of village (s).
All this has not made it feasible for us to present Panchayat level PCA ..
Annexure-II Fertility and Child Mortality :
The following table shows age specific fertility rates in Punjab and Bathinda district for the years 2001 and 1991. The trends observed are almost identical both for the State and the district. Among different age- groups the fertility rate is the highest in age-groups 20-24, 25-29 and 30-34. The trend is the same for rural and urban areas also.
The trends also show some fall in the fertility levels during 1991 and 2001 and this decline is noticeable in all age-groups except 45-49.
AGE SPECIFIC FERTILITY RATES 2001 AND 1991
Age Bathinda Punjab
Group Total Rural Urban Total Rural Urban
2001 1991 2001 1991 2001 1991 2001 1991 2001 1991 2001 1991
1 2 3 4 5 6 7 8 9 10 II 12 13
15-19 0.012 0.020 0.013 0.023 0.010 0.011 0.009 0.012 0.009 0.013 0.007 0.0lIl 20-24 0.116 0.155 0.126 0.168 0.094 0.112 0.110 0.120 0.123 0.132 0.086 0.092
25-29 0.108 0.145 0.110 0.155 0.103 0.112 0.124 0.124 0.133 0.138 0.107 0.092
30-34 0.049 0.077 0.049 0.081 0.048 0.063 0.062 0.067 0.066 0.077 0.054 0.047
35-39 0.021 0.045 0.022 0.052 0.020 0.026 0.026 0.032 0.028 0.Q38 0.023 0.020
40-44 0.017 0.014 0.018 0.016 0.014 0.006 0.016 0.016 0.018 0.018 0.014 0.011
45-49 0.026 0.009 0.028 0.009 0.023 0.009 0.025 0.008 0.026 0.011 0.023 0.006
290

The following table shows age specific marital fertility rates in Punjab and Bathinda district for the years 2001 and 1991. The trends observed are similar to those of total fertility levels, although the decline in marital fertility levels is at a relatively lower pace.
AGE SPECIFIC MARITAL FERTILITY RATES 2001 AND 1991
Age Bathinda Pun·ab
Group Total Ruml Urban Total Rural Urban 2001 1991 2001 1991 2001 1991 2001 1991 2001 1991 2001 1991
2 3 4 5 6 7 8 9 10 II 12 13
15-19 0.088 0.120 0.092 0.130 0.Q78 0.077 0.080 0.096 0.086 0.104 0.068 0.Q75
20-24 0.169 0.200 0.17S 0.214 0.IS2 0.148 0.179 0.170 0.191 0.186 0.152 0.133
2S-29 0.113 0.IS0 O.IIS 0.161 0.110 O.BS 0.134 0.129 0.142 0.145 0.118 0.097
30-34 O.OSO 0.080 O.OSO 0.084 0.050 0.064 0.064 0.069 0.068 0.079 0.056 0.048
3S-39 0.022 0.050 0.023 0.054 0.021 0.026 0.027 0.033 0.029 0.039 0.024 0.021
40-44 0.Ql8 0.020 0.019 0.017 0.015 0.006 0.017 0.017 0.019 0.019 O.OIS 0.011
45-49 0.029 0.010 0.031 0.009 0.02S 0.01 0.028 0.009 0.029 0.010 0.026 0.007
Annexure-III
Measures of Fertility and Mean Age At Marriage Fertility Levels:
In demography, the word fertility is used in relation to the actual production of children or 'occurrence of births specially live births'. Fertility is a measure of rate at which population adds to itself by births and normally assessed by relating number of births to size of some section of the popUlation, such as number of married couples and number of women of child bearing age. In other words, it is a major component of population growth. In the 1991 census, questions on fertility related to age at marriage, number of children surviving at present, number of children ever born alive and any child born alive during last one year were asked. The first three questions were asked to all ever married women and the last question related to currently married women only. The measures of fertility worked out are based on the F-Series Tables of 1991 & 2001 Census pertaining to Punjab State.
The following table presents important indices of fertility in Punjab and Bathinda district for the years 2001 and 1991 separately for total, rural and urban areas. There has been significant decline in the number of children ever born per ever married woman in the age group (45-49); the decline is relatively more in rural areas than urban in Bathi,nda district and the position is by and large the same for the state. Likewise there has been a significant decline in the child-women ratio also. However, the number of married couples per 1,000 of population has gone up both in the state and the district with exception of urban areas.
IMPORT ANT INDICES OF FERTILITY
Fertility Bathinda Pun'ab
indices Total Rural Urban Total RUrdl
2001 1991 2001 1991 2001 1991 2001 1991 2001 1991
2 3 4 5 6 7 8 9 10 11 No. of Children ever born per ever married woman in the age group (45-49) 3.42 4.37 3.52 4.47 3.21 4.01 3.50 4.27 3.69 4.45
Couples per 1000 Population 169 167 167 164 172 176 161 160 160 156.
Child-Woman ratio (0-4 Years) 334 493 351 496 296 483 349 480 369 493
291
Urban
2001 1991
12 13
3.16 3.81
164 168
311 448

Annexure IV MOVEMENT OF POPULATION
What is migration?
Migration is the third component of population change. the other two being mortality and fertility. A person is considered as a migrant by place of birth if the place in which he is enumerated during the census is other than the place of his birth. Similarly a person is considered as a migrant by place of last residence, if the place in which he is enumerated during the census is other than his place of immediate last residence.
Internal and International Migration:
The migrational movements are of three types- (i) Migration within the State itself with its components-(a) Migration within the district of enumeration (intra-district migration), (b) Migration from one district of the state to another di~trict of the StatelUT (inter-district migrati8n), (ii) Migration from one State to anothet state of the country (inter-state migration) and (iii) Migration from one country to another country. The first two streams together constitute internal migration, while the last type of movement is called international migration.
Why the people migrate?
For the first time in the census, reasons for migration were elicited in 1981. Keeping operational constraints in view, the reasons for migration were broadly categorized as (1) employment, (2) education, (3) marriage, (4) family movement and (5) other reasons. Other Reasons for migration have been elicited only with reference to movement from place of last residence.
Impact of migration:
The growth of population of a particular place depends upon the biological variates such as mortality and fertility and migration. The knowledge of trends in migration helps in future planning of a place.
PERCENTAGE DISTRIBUTION OF INMIGRANTS BY PLACE OF BIRTH
Place of Birth 1991 Census 2001 Census
Persons Males females Persons Males Females
2 3 4 5 6 7 (I) Migrants born within the state of enumeration 1,450,609 794,429 656,180 357,445 91,400 266,045
(93.0) (95.7) (89.9) (79.9) (73.6) (82.3) (i) Migrants born else where in the district of 267,742 51,500 216,242 189,353 56,764 132,589 enumeration (17.2) (6.2) (29.6) (42.3) (45.7) (41.0) (ii) Migrants born in other districts of the State 151,236 31,503 119,733 168,092 34,636 133,456
(9.7) (3.8) ( 16.4) (37.6) (27.9) (41.3) (II) Migrants born in other states of india 97,344 i!9,330 68,014 85,690 30,515 55,175
(6.2) (3.5) (9.3) (19.2) (24.5) (17.1) (III) Migrants born in other countries 10,880 5,800 5,080 4,251 2,331 1,920
(0.7) (0.7) (0.7) (0.9) (1.9) (0.6)
(IV) Unclassifiable 1,130 290 840 0 0 0 (0.7) (0.1) (0.1) (0.0) (0.0) (0.0)
Total Migrants 1,559.%3 829,849 730,114 447~6 124,246 323,140 (100.0) (100.0) (100.0) (100.0) ~lOO.O~ (100.0)
The above table gives distribution of in-migrants by place of birth in Bathinda district as per 1991 and 2001 Censuses. Out of the total in-migrants, 79.9 per cent are born within the state of enumeration and 19.2 per cent are born in other states/Union Territories ofIndia in Census 2001. Whereas the figures for persons, males and females are constant for migrants born elsewhere in the district ~f enumeration the disparity among the same in Census 1991 is quite noticeable.
292

The following table gives distribution of inmigrants by place of last residence in Bathinda , district. As per 1991 Census. 79.8 per cent of the inmigrants had the place of last residence within. the state but out of the place of enumeration. Another 18.3 per cent had place of last residence in other states/UTs within the country, while 1.7 per cent had their last residence out side India. The corresponding figures for 2001 Census are 80.7 per cent, 18.6 per cent and 0.7 per cent respectively.
PERCENTAGE DISTRIBUTION OF INMIGRANTS BY PLACE OF LAST RESIDENCE
Last residence 1991 Census 2001 Census
Persons Males Females Persons Males Females
2 3 4 5 6
(I) Last residence within the state of enumeration 422,803 84,843 v' 337,960 365,934 94,160
(79.8) (71.1 ) (82.3) (80.7) (74.8)
(i) Elsewhere in the district of enumeration 271,872 53,120 218,752 197,220 59,244
(51.3) (44.5) (53.3) (43.5) (47.1)
(ii) In other districts of the state of enumeration 150,931 31,723 119,208 168,714 34,916
(28.5) (26.6) (29.0) (37.2) (27.7)
(II) States in India beyond the state of enumeration 96,879 29,260 67,619 84,255 29,825
(18.3) (24 . .5) (16.4) (18.6) (23.7)
(111) Last residence outside India 9,230 4,890 4,340 3,449 1,895
(1.7) (4.1) 0.1) (0.7)/ (1.5)
(IV) Unclassifiable 1,160 280 880 0 ° !0.2) !0.3} ,,- ~0.22 !o.o~ !O.O)
Total 530,07,2;- 119,273 410,799 453,638 125.1180
(lOo.o~ (100.0) (100.0) {100.0~ (100.0)
Annexure V Main Religion,s:
The instructions for recording this information are same as in 1991. A brief analysis based on 1991 and 2001 Census data is presented below.
Question 7 of the Household Scheduled canvassed at the 2001 census pertained to religion of . a person. The religion of the person was recorded as returned by the respondent. The six main religions in the country were recorded by using following codes:
Hindu 1
Muslim 2
Christian 3 Sikh 4 Buddhist 5.
Jain 6 .
For all others, actual religion as stated was recorded fully. Further more, if any individual stated that he had no religion, the answer was recorded accordingly.
Religious Composition of Punjab's Population:
The numerical strength of the six main religious communities in the State and Bathinda district as per 1991 and 2001 Census is as follows:
293
7
27l,774
(82.9)
137,976
(42.1 )
133,798
(40.8)
54,430
(16.6)
1,554
(0.5)
0
{O.O}
327,758 /
(100.0) /

RELIGIOUS COMPOSITION OF POPULATION, PUNJAB ANn BA'rHINDA 1991 AND 2001
Religious Communities
Hindus
Muslims
Christians
Sikhs
Buddhists
Jains Others Religions and persuations Religion not statedi
Unspecified
All Religions
Punjab Total Population
1991 2001
2 3
6,989,226 8,997,942
239,401 382,045
225,163 292,800
12,767,697 14,592,387
24,930 41,487
20,763 39,276
883 &,594
13,906 4,468
20,281,969 24,358,999
Percentage in total EOEulation
1991 2001
4 5
34.4 36.9
1.2 1.6
1.1 1.2
63.0 59.9
0.1 0.2
0.1 0.2
0.0 0.0
0.1 0.0
100.0 100.0
or- Bathinda district Total Population Percentage in
total EOEulation 1991 2001 1991 2001
6 7 8 9
217,932 292,984 22.1 24.8
5,552 9,847 0.6 0.8
904 1,659 0.1 0.1
759,303 876,426 77.1 74.1
37 268 0.0 0.0
472 '1,186 0.0 0.1
30 87& 0.0 0.1
1,071 47 0.1 0.0
985,301 1,183,295 100.0 100.0
As can be seen from the above statement, Sikhs form the predominant religious community in Punjab and they account for 59.9 per cent of the State's population according to the 2001 Census. The corresponding percentage for 1991 Census was 63.0 per cent. Hindus is the second largest religious community in the State and their share in the total popUlation is 36.9 per cent which was 34.4 per cent as per 1991 Census. This signifies that Sikhs and Hindus, the two most dominant religious communities in the state, together constitute 96.8 per cent of the state's total population. The share of Muslims, Christians, Buddhists and lains in the total population is 1.6, 1.2, 0.2 and 0.2 per cent respectively.
In Bathinda district, Sikhs constitute 74.1 per cent of the total population and this is significantly higher than that of the state as a whole. Hindus, the second dominant religious community in the district, account for 24.8 per cent of the district's total popUlation. Together, the Sikhs and the Hindus account for 98.9 per cent ofthe district's popUlation. Muslims constitute 0.8 per cent while the share of Christians is only 0.1 per cent, the percentages of Sikhs and Hindus as per 1991 Census in the district were 77.1 and 22.1 per cent respectively The proportion of Muslims has slightly increased from 0.6 per cent in 1991 to 0.8 in 2001 Census.
Annexure VI Marital Status:
Current marital status of each individual, irrespective of age, was obtained through Question 5 of the household schedule canvassed at the 2001 census into following four categories:
1. Never married 2. Currently married 3. Widowed 4. Divorced or separated.
The instructions to enumerators for eliciting marital status were same as adopted in 1991 census. A brief analysis based on 1991 and 2001 census is presented here.
Punjab State has a population of 24,358,999 as per 2001 Census comprising 11,871,211 (48.7%), never married, 11,499,566 (47.2%) married, 938,678 (3.9%) widowed and 49,544 (0.2%) divorced or separated. As per 1991 Census Punjab State had a population of 20,281,969 comprising 10,452,444 (51.5%) never married, 9,146,158 (45:1%) married, 673,569 (3.3%) widowed, 8,768 (0.1%) divorced or separated and 1,030 (0.0%) un-specified.
294

MARITAL, STATUS OF POPULATION AS PER, 1991 AND 2001 CENSUS
Marital Status Punjab Bathinda
1991 2001 1991 2001
p M F p M F p M F P M F
2 3 4 S 6 7 8 9 10 II 12 13
Total Population 100.0
Never Married 51.5
Married 45.1
Widowed 3.3
Divorced or Separated 0.0
100.0
55.4
42.3
2.2
0.0
0.0
100.0
47.1
48.2
4.6
0.0
0.0
100.0
48.7
47.2
3.9
0.2.
0.0
100.0
53.1
44.6
2.1
0.2
0.0
100.0
43.8
SO.2
5.8
0.2
0.0
100.0
51.1
45.5
3.4
0.0
0.0
100.0
55.S
42.4
2.1
0.0
0.0
100.0
46.1
49.0
4.9
0.0
0.0
100.0
47.3
48.9
3.6
0.2
0.0
100.0
5t.7
46.1
1.9
0.2
0.0
lOO.Q
42.3
52.0
5.6
0.2'
Un-Specified 0.0
In Bathinda district, out of the total population of 1,183,295 as per 2001 census; 559,974 (47.3%) are never married, 578,274 (48.9%) are married, 42,892 (3.6%) are widowed, 2,155 (0.2%) are divorced or separated. Thus, the patterns observed for the State and the district are almost Identical.
Similarly, out of the total population of 1,559,963 as per 1991 Census, 797,029 (51.1%) were never married, 709,379 (45.5%) were married, 53,0671 (3.4%) were widowed, 438 (0.0%) were divorced or separated and the marital status of a small population (50 in number) could not be specified. Thus the patterns observed for the State and the district were almost identical. Total population of 1991 of Bathinda has not been recasted.
Annexure VII Sex and Educational level :
It has become customary for the Indian Census to obtain details of educational levels of the literates in the society. Question 13 of the Household Schedule canvassed at the 2001 census aimed to elicit information on the highest educational level attained. The data so collected is put to public domain by classifying the population by sex and educational levels.
The following table shows percentage distribution of literates by educational level for Punjab State and Bathinda district as per 1991 as well 2001 Census. .
0.0
PERCENTAGE DISTRIBUTION OF LITERATES BY EDUCATIONAL LEVEL AS PER 1991 AND 2001 CENSUS
Educational Total Levels Rural
Urban P
Below Primary
Primary but below middle
Middle but below roatric
Matric but below graduate
Graduate and above
2 3
Total
Rural
Urban
Total
Rural
Urban
Total
Rural
Urban
Total
Rural
Urban
Total
Rural
Urban
21.8
24.2
17.6
27.9
31.8
21.2
18.1 18.5
17.3
263
23.0
32.0
5.9
2.5
11.8
Punjab Bathinda 1991 2001 1991 2001 M F P M F P M F P M F
4 5 6 7 8 9 10 11 12 13 14
20.9 22.9
17.2
25.3 28.4
19.7
19.0
19.8
17.7
28.6
26.0
33.5
6.1
3.0
11.9
23.1 26.2
18.2
31.7 37.0
23.3 16.7
16.7
16.8 22.8
18.3
30.0
5.7
1.8
11.8
20.0 22.9
15.5
25.6 29.3
19.9 16.9
17.7
15.7 30.&
27.5
36.0 6.6
2.5
12.9
19.7 20.4 26.6 24.9 29.6
22.3 23.7 30.0 27.5 34.5
lS.6 15.4 20.1 19.3 21.3
23.7 28.3. 28.0 26.3 30.8
26.6 33.0 31.5 29.4 35.2
19.0 21.1 21.2 19.7 23.4
17.5 16.1 IS.9 17.0 14.1
IS.5 16.8 IS.S 17.3' 13.1
16.1 lS.i 16.1 16.3 15.8 32.7 2&.4 242 26.5 20.4
29.9 24.3 20.4 23.3 15.4 37.1 34.6 31.3 33.2 28.7
6.4 6.7 5.3 5.4 5.2
2.8 2.2 2.2 2.5 I.S
12.2 --..::13:.: . .;...7 ____ 1~1~.2:..._---!1.!:1.:::.S __ _:.:.1 O~. 9::._
295
23.0 22.2 24.0
26.9 25.6 2S.7
16.2 16.2 16.3
26.4 24.5 29.2 29.9 27.3 33.8
20.4 19.5 21.7 16.0 16.7 15.0
16.4 17.2 15.2
15.3 15.8 14.7 28.3 30.5 is.) 24.3 27.2 20.0
35.1 36.4 33.4 6.4 6.1 6.7
2.5 2.7 2.2
12.9 __gJ__!!2__

As per 1991 census 21.8 per cent of the literates in Punjab were below primary level of education, 27.9 per cent were primary but below middle and 18.1 per cent were middle but below matric. A little over one-fourth (26.3%) of the literates in the State were matric but below graduation. It was only 5.9 per cent of the literates who had attained graduation or above level of education. .
According to 2001 census 20.0 per cent of the literates in Punjab are below primary level of education, 25.6 per cent are primary but below middle and 16.9 per cent are middle but below matric; 30.8 per cent are matric but below graduation. Only 6.6 per cent of the literates in Punjab are graduate and above.
In Bathinda district, the incidence of lower educational level is greater than that of the State. In the district 23.0 per cent of the literates are below primary and another 26.4 'per cent are ~ primary but below middle; the corresponding percentage for the State are 20.0 and 25.6 per cent respectively. By contrast, the percentage of literates with middle or above level of education is lesser in Bathinda district as compared to the State as such. In the district 16.0 per cent of the literates are middle passed as compared to state with 16.9 per cent. Likewise the percentage of matriculation, graduation and above with 28.3 and 6.4 in Bathinda district is lower than that 0(. ..... the State.
Annexure VIII Distribution of Different Mother Tongues:
Question 10 of the Household Schedule canvassed at the 2001 Census pertained to 'Mother Tongue'. It is the language spoken in the childhood by the person's mother to the person. If the mother. died in infancy, the language mainly spoken in the person's home in childhood is recorded as the mother-tongue. In case of infants and deaf mutes the language usually spoken by the mother should be recorded. In case of doubt, the language mainly spoken in the household may be recorded. Since th,e household may consist of persons related by blood or of unrelated persons or a mix of both, every person in the househol,cr is asked about herlhis mother tongue because the mother tongue of each member of a household need not necessarily be the same. These may be different for different meinbers in the household. The definition of 'Mother Tongue' is the same as in 1991. .
Mother Tongue and Language data based on 1991 & 2001 Censuses is given here. The distribution of languages/mother tongues which returned 10,000 or more speakers each at allIndia level (including of mother tongues grouped under each) for the district by sex separately for rural and urban areas. The unclassified mother tongues and the mother tongues having less than 10,000 speakers have been relegated to 'other' mother tongue category. The table is divided into two parts; Part A- Scheduled languages with the mother tongues grouped tJnder each, and Part BNon-Scheduled languages with the mother tongues grouped under each. This naturally leads to the recording of a very large number of mother tongue names. It is to be mentioned that mother tongues as returned in the census, are basically the designations provided by the respondents. These designations or mother tongue label need not be identical with the actual linguistic mediums. For assessing the correlation between the mother tongue designations and actual languages and dialects, the raw returns of census were subjected to thorough scrutiny and rationalization. This resulted in 1576 rationalized mother tongues in 1991 for the entire Country, which were further classified following the usual linguistic methods. The total number of languages so arrived at is 114 returned by 10,000 or more speakers at the all-India level and grouped under appropriate languages. .
Table below shows languages arranged in descending order of number of speakers in Bathinda district as per 1991 and 2001 censuses. Punjabi is the most dominant language spoken in the State and the district. It is spoken by 1,084,933 persons in Bathinda district and this forms 91.69 per cent of the district's total population. Hindi, the second most dominant language is spoken by 82,995 (7.01 %) persons in the district.
296

NUMERICALLY BIGGEST LANGUAGE ARRANGED IN DESCENDING ORDER OF THE NUMBER OF SPEAKERS, 2001-1991
Serial Language Number of Persons who returned the Lan~~es as their Mother Tongue number Total Percentage to Rural Urban ProQortion
Total Population Rural Urban
1991 2001 1991 2001 1991 2001 1991 2001 1991 2001 1991 2001 2 3 4 5 6 7 8 9 10 11 12 13 14
Bathinda District
Punjabi 928,497 1,084,933 94.23 91.69 702,531 798,041 225,966 286,892 75.66 73.56 24.34 26.44
2 Hindi 51,530 82,995 5.23 7.01 12,852 22,661 38,678 60,334 24.94 27.30 75.06 72.70
3 Bengali 768 1,567 0.08 0.13 620 1,040 148 527 80.73 66.37 19.27 33.63
4 Marathi 711 1,702 0.07 0.14 652 1,494 59 208 91.70 87.78 8.30 12.22
5 Tamil 627 1,303 0.06 0.11 552 1,150 75 153 88.04 88.26 11.96 11.74
6 Malayalam 576 1,203 0.06 0.10 506 980 70 223 87.85 81.46 12.15 18.54
7 Telugu 541 1,022 0.05 0.09 487 843 54 179 90.02 82.49 9.98 17.51
8 Oriya 460 892 0.05 0.08 233 605 227 287 50.65 67.83 49.35 32.17
9 Nepali 408 712 0.04 0.06 216 244 192 468 52.94 34.27 47.06 65.73
10 Dogri 370 503 0.04 0.04 358 418 12 85 96.76 83.10 3.24 16.90
II Gujarati 248 773 0.03 0.07 III 286 137 487 44~76 37.00 55.24 63.00
12 Kannada 216 592 0.02 0.05 171 544 45 48 79.17 91.89 20.83 8.11
13 Urdu 149 456 0.02 0.04 82 182 67 274 55.03 39.91 44.97 60.09
14 Assamese 116 363 0.01 0.03 96 336 20 27 82.76 92.56 17.24 7.44
15 Bhili/Bhilodi 31 0 0.00 0.00 16 0 15 0 51.61 0.00 48.39 0.00
16 Kashmiri 21 84 0.00 0.01 14 66 7 18 66.67 78.57 33.33 21.43
17 Other Langu~es 32 4195 0.00 0.35 14 2651 18 1544 43.75 63.19 56.25 36.81
All Languages 985,301 1,183,295 100.00 100.00 719,511 831,541 265,790 351,754 73.02 70.27 26.98 29.73
Comparative Strength of the Scheduled Languages in the State for 1971, 1981, 1991 and 2001 is shown in the following table. It reveals that the number of speakers of all the languages has consistently improved in the State during the decadal year 1991-2001. Screening the major two languages, the speakers of Hindi Continued to plunge till 1991 whereas that of Punjabi ceaselessly shot up
COMPARATIVE STRENGTHS OF SCHEDULED LANGUAGES 1971,1981,1991 AND 2001lN THE STATE
Serial Language Persons who returned the language Percentage to total population number as their mother tonl!,ue
1971 1981 1991 2001 1971 1981 1991 2001 2 3 4 5 6 7 8 9 10
Punjab State 1 Assamese 146 359 1,809 2,964 N N 0.01 0.01 2 Bengali 2,294 3,761 9,667 20,618 0.02 0.02 0.05 0.08 3 Gujarati 1,384 1,886 4,352 6,986 0.01 0.01 0.02 O.oJ 4 Hindi 2,711,490 2,441,112 1,478,993 1,770,058 20.01 14.59 7.29 7.27 5 Kannada 236 367 1,742 3,937 N N 0.01 0.02 6 Kashmiri 963 797 1,083 2,404 0.01 0.01 N 0.01 7 Konkani @ @ 53 65 @ @ N N 8 Malayalam 2,019 3,591 7,139 10,624 0.01 0.02 0.04 0.04 9 Manipuri @ @ 1 503 @ @ N N 10 Marathi 1,710 2,972 5,704 12,077 0.01 0.02 0.03 0.05 11 Nepali @ @ 7,734 19,767 @ @ 0.04 0.08 12 Oriya 323 950 3,987 10,277 N 0.01· 0.02 0.04 13 Punjabi 10,771,246 14,195,069 18,704,461 22,187,364 79.49 84.88 92.22 91.08 14 Sanskrit 77 61 26 l(){r N N N N 15 Sindhi 774 529 326 4'50 0.01 0.01 N N 16 Tamil 2,322 3,280 6,271 12,331 0.02 0.02 0.03 0.05 17 Telugu 995 2,185 3,829 7,215 0.01 0.01 0.02 0.03 18 Urdu 29,003 32,575 13,416 27,660 0.21 0.2 0.07 0.11
@ Kokani, Mailipuri & Nepali were not scheduled language in 1971 & 1981.
297