· web viewwater quality standards of particular interest to the issues of cultural eutrophication...
TRANSCRIPT

FINALLewis Bay System and Halls Creek
Total Maximum Daily LoadsFor Total Nitrogen
(Report # 96-TMDL-18 Control #314)
COMMONWEALTH OF MASSACHUSETTSEXECUTIVE OFFICE OF ENERGY AND ENVIRONMENTAL AFFAIRS
MATTHEW A. BEATON, SECRETARYMASSACHUSETTS DEPARTMENT OF ENVIRONMENTAL PROTECTION
MARTIN SUUBERG, COMMISSIONERBUREAU OF WATER RESOURCES
BETHANY CARD, ASSISTANT COMMISSIONER
March 3, 2015

Lewis Bay SystemTotal Maximum Daily Loads
For Total Nitrogen
Key Feature: Total Nitrogen TMDL for Barnstable and YarmouthLocation: EPA Region 1 Land Type: New England Coastal303d Listing: The waterbody segments impaired and on the Category 5 list
include Lewis Bay (MA96-36), Hyannis Inner Harbor (MA96-82), Mill Creek (MA96-80)
Data Sources: University of Massachusetts – Dartmouth/School for Marine Science and Technology; US Geological Survey; Applied Coastal Research and Engineering, Inc.; Cape Cod Commission, Towns of Barnstable and Yarmouth
Data Mechanism: Massachusetts Surface Water Quality Standards, Ambient Data, and Linked Watershed Model
Monitoring Plan: Barnstable Town wide Monitoring Program and Yarmouth Town wide Monitoring Program, both with technical assistance by SMAST
Control Measures: Sewering, Storm Water Management, Attenuation by Impoundments and Wetlands, Fertilizer Use By-laws
i

Executive Summary
Problem Statement
Excessive nitrogen (N) originating from a variety of sources, has impaired the environmental quality of the Lewis Bay System. In general, excessive N in theses waters are indicated by:
Loss of eelgrass beds, which are critical habitats for macroinvertebrates and fish Undesirable increases in macro algae, which are much less beneficial than eelgrass Periodic extreme decreases in dissolved oxygen concentrations that threaten aquatic
life Reductions in the diversity of benthic animal populations Periodic algae blooms
With proper management of N inputs these trends can be reversed.
Studies within the Halls Creek system, included in this document, indicate a “healthy” environment relative to dissolved oxygen, algae, and benthic animal populations; indicating that the Halls Creek estuary can assimilate the existing N loads. Without proper management of N loads to Lewis Bay, on the other hand, more severe problems might develop, including:
Periodic fish kills Unpleasant odors and scum Benthic communities reduced to the most stress-tolerant species, or in the worst cases,
near loss of the benthic animal communities
Coastal communities, including Barnstable and Yarmouth rely on clean, productive, and aesthetically pleasing marine and estuarine waters for tourism, recreational swimming, fishing, and boating, as well as for commercial fin fishing and shellfishing. Failure to reduce and control N loadings could result in complete replacement of eelgrass by macro-algae, a higher frequency of extreme decreases in dissolved oxygen concentrations and fish kills, widespread occurrence of unpleasant odors and visible scum, and a complete loss of benthic macroinvertebrates throughout most of the system. As a result of these environmental impacts, commercial and recreational uses of Lewis Bay waters will be greatly reduced, and could cease altogether.
Sources of Nitrogen
Nitrogen enters the waters of coastal embayments/ponds from the following sources:
The watershed On-site subsurface wastewater disposal systems Wastewater treatment facilities Natural background Runoff Fertilizers
Atmospheric deposition
ii

Nutrient-rich bottom sediments in the embayments/ponds
Most of the present controllable N load originates from individual subsurface wastewater disposal (septic) systems, primarily serving individual residences, as seen in the following figure.
Target Threshold N Concentrations and Loadings The groundwater N loadings to the Lewis Bay system (the quantity of N) range from 14.07 kg/day in Uncle Roberts Cove, to 70.37 kg/day in Lewis Bay. The resultant concentrations of N in the system range from 0.42 mg/L (milligrams per liter of N) in Lewis Bay and 0.47 mg/L in Uncle Roberts Cove, to 1.92 mg/L in Snows Creek. The N loading to Halls Creek is 29 kg/day, with N concentrations up to 1.21 mg/L. These concentrations are taken from Tables ES-1, ES-2, and VI-1 of the Massachusetts Estuaries Project (MEP) Technical Report (Linked Watershed Embayment Model to Determine Critical Nitrogen Loading Thresholds for the Lewis Bay Embayment System. Dec. 2008. UMass Dartmouth, School of Marine Science and Technology).
In order to restore and protect the Lewis Bay system, N loadings, and subsequently the concentrations of N in the water, must be reduced to levels below the thresholds that cause the observed environ-mental impacts. This concentration will be referred to as the target threshold N concentration. The goal of the implementation of this TMDL is to reach this target threshold N concentration, as it has been determined for each impaired waterbody segment. The MEP has determined that, for the Lewis Bay system, a N concentration of 0.38 mg/L, in the area of the Eastern end of Lewis Bay (Sentinel Station, Figures 4a and 4b), will protect water quality and habitat throughout the embayment system. The mechanism for achieving this target threshold N concentration is to reduce the N loadings to various portions of the system. Based on the MEP modeling efforts, presented in their Technical Report, the MassDEP has adopted a range of Total Maximum Daily Loads (TMDL) of N throughout the system. Values of TMDLs range from 5 - 47 kg/day in the Lewis Bay System, and 44 kg/day for Halls Creek.
As a function of various aspects of the sub-embayment systems (size, current N loading rates, hydrodynamics, and land uses in the watersheds) N loading reductions will not be necessary in the watersheds of Snows Creek, Stewarts Creek, Uncle Roberts Cove, Chase Brook, or Halls Creek. The TMDLs for these subembayments are set at existing N loads. Snows Creek and Stewarts Creek have
Lewis Bay Nutrient Loading
Sediment28%
Land Use11%
Septic39%
WWTF14%
Atmosheric deposition directly
to estuary8%
iii

among the highest N concentrations in the Lewis Bay system. They are also projected to be heavily impacted by future growth as seen in the build-out scenario described in Table IV-6 of the MEP Technical Report. Reductions in N loadings in the watersheds of adjacent embayments will result in reductions in the N concentrations in all of the embayments as needed to meet the target threshold N concentrations.
Implementation The primary goal of implementation will be lowering the concentrations of N by reducing the loadings from on-site subsurface wastewater disposal systems through a variety of centralized or decentralized methods such as sewering and treatment with N removal technology, advanced treatment of septage, and/or installation of N-reducing on-site systems.
These strategies, plus methods of reducing N loadings from stormwater runoff and fertilizers, are explained in detail in the “MEP Embayment Restoration Guidance for Implementation Strategies”, that is available on the MassDEP website http://www.mass.gov/eea/agencies/massdep/water/watersheds/coastal-resources-and-estuaries.html.The appropriateness of any of the alternatives will depend on local conditions, and will have to be determined on a case-by-case basis, using an adaptive management approach. This adaptive management approach will incorporate the priorities and concepts included in the updated area wide management plan established under the Clean Water Act Section 208.
Finally, growth within the communities of Barnstable and Yarmouth that would exacerbate the problems associated with N loadings should be guided by considerations of water quality-associated impacts.
iv

Table of Contents
Executive Summary................................................................................................................................iiList of Tables.........................................................................................................................................viList of Figures........................................................................................................................................viIntroduction.............................................................................................................................................1Description of Water Bodies and Priority Ranking................................................................................2Problem Assessment...............................................................................................................................4Pollutant of Concern, Sources and Controllability.................................................................................6Description of the Applicable Water Quality Standards.........................................................................8Methodology - Linking Water Quality and Pollutant Sources...............................................................8Total Maximum Daily Loads................................................................................................................16Implementation Plans............................................................................................................................22Monitoring Plan....................................................................................................................................23Reasonable Assurances.........................................................................................................................24Appendix A...........................................................................................................................................25Appendix B...........................................................................................................................................26Appendix C...........................................................................................................................................27Appendix D...........................................................................................................................................28Appendix E...........................................................................................................................................24
v
List of Tables
Table Number Title Page:
1A The Lewis Bay System Waterbody Segments in Category 5 of the Massachusetts 2012 Integrated List 2
1B Comparison of Impaired Parameters for the Lewis Bay System 3
1C General Summary of Conditions Related to the Major Indicators of Habitat Impairment Observed in the Lewis Bay System 4
2Observed Present Nitrogen Concentrations and Target Threshold Nitrogen Concentrations for the Major Sub-Embayments of the Lewis Bay System and Halls Creek
12
3 Nitrogen Loadings to the Lewis Bay System and Halls Creek 15
4
Present Watershed Nitrogen Loading Rates, Calculated Loading Rates that are Necessary to Achieve Target Nitrogen Concentrations, and the Percent Reduction of the Existing Loads Necessary to Achieve the Target Threshold Loadings
16
5 The Total Maximum Daily Loads (TMDLs) for the Lewis Bay System and Halls Creek 21
List of Figures
Figure Number Title Page:1 Overview of Lewis Bay 32 Resident Population for Barnstable & Yarmouth 53 Lewis Bay Nutrient Loading 74a Water quality sampling stations within the Lewis Bay System 134b Water quality sampling stations within the Halls Creek System 145 Controllable Nitrogen Loads (kg/day) to the Lewis Bay System 19
vi
Introduction
Section 303(d) of the Federal Clean Water Act requires each state (1) to identify waters for which effluent limitations normally required are not stringent enough to attain water quality standards and (2) to establish Total Maximum Daily Loads (TMDLs) for such waters for the pollutants of concern. The TMDL allocation establishes the maximum loadings (of pollutants of concern), from all contributing sources, that a water body may receive and still meet and maintain its water quality standards and designated uses, including compliance with numeric and narrative standards. The TMDL development process may be described in four steps, as follows:
1. Determination and documentation of whether or not a water body is presently meeting its water quality standards and designated uses.
2. Assessment of present water quality conditions in the water body, including estimation of present loadings of pollutants of concern from both point sources (discernable, confined, and concrete sources such as pipes) and non-point sources (diffuse sources that carry pollutants to surface waters through runoff or groundwater).
3. Determination of the loading capacity of the water body. EPA regulations define the loading capacity as the greatest amount of loading that a water body can receive without violating water quality standards. If the water body is not presently meeting its designated uses, then the loading capacity will represent a reduction relative to present loadings.
4. Specification of load allocations, based on the loading capacity determination, for non-point sources and point sources, that will ensure that the water body will not violate water quality standards.
After public comment and final approval by the EPA, the TMDL will serve as a guide for future implementation activities. The MassDEP will work with the Towns to develop specific implementation strategies to reduce N loadings, and will assist in developing a monitoring plan for assessing the success of the nutrient reduction strategies.
In the Lewis Bay System and Halls Creek, as with other coastal systems, the pollutant of concern is the nutrient N. Nitrogen is the limiting nutrient in coastal and marine waters, which means that as its concentration is increased, so is the amount of plant matter. This leads to nuisance populations of macro-algae and increased concentrations of phytoplankton and epiphyton that imperil the healthy ecology of the affected water bodies.
The TMDLs for N for the Lewis Bay System and Halls Creek are based primarily on data collected, compiled, and analyzed by University of Massachusetts Dartmouth’s School of Marine Science and Technology (SMAST), the Barnstable/Yarmouth Lewis Bay Water Quality Monitoring Program, and others, as part of the Massachusetts Estuaries Project (MEP). The data were collected over a study period from 2001 to 2006 (see Appendix A). This study period will be referred to as the “Present Conditions” in the TMDL since it contains the most recent data available. The MEP Technical Report can be found at http://www.oceanscience.net/estuaries/reports.htm. The Technical Report presents the results of the analyses of this embayment system using the MEP Linked Watershed-Embayment Nitrogen Management Model (Linked Model). The analyses were performed to assist Barnstable and Yarmouth with decisions on current and future wastewater planning, wetland restoration, anadromous fish runs, shellfisheries, open-space, and harbor maintenance programs. A critical element of this approach is the assessment of water quality monitoring data, historical
1

changes in eelgrass distribution, time-series water column oxygen measurements, and benthic community structure that was conducted on this embayment. These assessments served as the basis for generating an N loading threshold for use as a goal for watershed N management. The TMDL is based on the site- specific target threshold N concentration generated for this embayment. Thus, the MEP offers a science-based management approach to support the wastewater management planning and decision making process in the Towns of Barnstable and Yarmouth.
Description of Water Bodies and Priority Ranking
The Lewis Bay System is a complex estuary located within the Towns of Barnstable and Yarmouth on Cape Cod Massachusetts and its southern shore is bordered by Nantucket Sound (See Figure 1). It is comprised of the primarily lagoonal Lewis Bay and three tributary sub-embayments: Hyannis Inner Harbor, Mill Creek and Uncle Roberts Cove. Other groundwater sources included in the analyses included Snow’s Creek, Stewarts Creek, and Halls Creek estuaries. Surface water sources from Chase Brook, Mill Pond Creek, and Inner Harbor Creek, were also analyzed. The Lewis Bay watershed lies completely within the Towns of Barnstable and Yarmouth. This embayment system constitutes an important component of both Towns’ natural and cultural resources.
The nature of enclosed embayments in populous regions brings two opposing elements to bear: 1) as protected marine shoreline they are popular regions for boating, recreation, and land development and 2) as enclosed bodies of water, they may not be readily flushed of the pollutants that they receive due to the proximity and density of development near and along their shores. In particular, the Lewis Bay System is at risk of further eutrophication from high nutrient loads in the groundwater and runoff from their watersheds. The segments listed below are already listed as waters requiring a TMDL (Category 5) for pathogens and estuarine bioassessments in the MA 2012 Integrated List of Waters, as summarized in Table 1A.
A complete description of this embayment system is presented in Chapters I and IV of the MEP Technical Report. A majority of the information on this embayment system is drawn from this report. Chapter VI and VII of the MEP Technical Report provide assessment data that show that various portions of the Lewis Bay System are impaired because of nutrients, low dissolved oxygen levels, elevated chlorophyll a levels, eelgrass loss, and/or decreased quality of benthic fauna habitat. Please note that pathogens are listed in Tables 1A and 1B for completeness. Further discussion of pathogens is beyond the scope of this TMDL.
Table 1A: The Lewis Bay System Water Body Segments in Category 5 of the Massachusetts 2012 Integrated List
Name Waterbody Segment
Description Size PollutantListed
Lewis Bay MA96-36_2008 Includes portion of Pine Island Creek and Uncle Roberts Cove to confluence with Nantucket Sound, Barnstable/Yarmouth (excluding Hyannis Inner Harbor, Barnstable/Yarmouth and Mill Creek, Yarmouth
1.8 sq mi
-Pathogens-estuarine bioassessments
Hyannis Inner Harbor
MA96-82_2010 Waters inland of an imaginary line drawn from Harbor Bluff, Barnstable to Hyannis Park, Yarmouth
0.3 sq mi
-Fecal coliform-Nitrogen (total)
Mill Creek MA96-80_2010 Headwaters, outlet Mill Pond, Yarmouth to confluence with Lewis Bay, Yarmouth
0.07 sq mi
-Fecal coliform-Nitrogen (total)
2

FIGURE 1: Overview of Lewis Bay
The embayments addressed by this document is determined to be a high priority based on three significant factors: (1) the initiative that the Towns have taken to assess the conditions of the entire embayment system, (2) the commitment made by the Towns to restore and preserve the embayment, and (3) the need to halt further degradation to prevent the existing “moderate” impairments from becoming “significant”. In particular, portions of the Lewis Bay system are at risk of further degradation from increased N loads entering through groundwater and surface water from their increasingly developed watersheds. In both marine and freshwater systems, an excess of nutrients results in degraded water quality, adverse impacts to ecosystems, and limits on the use of water resources. Observations are summarized in the Problem Assessment section below and detailed in Chapter VII, Assessment of Embayment Nutrient Related Ecological Health, of the MEP Technical Report.
Table 1B. Comparison of Impaired Parameters for the Lewis Bay SystemName DEP Listed Impaired Parameter SMAST Impaired Parameter
Lewis Bay(includes Uncle Roberts Cove)
Pathogens, estuarine bioassessments Nutrients, DO, Chlorophyll,Eelgrass loss, Benthic fauna
Hyannis Inner Harbor Fecal coliform, Total Nitrogen Nutrients, DO, Chlorophyll,
Benthic fauna
Mill Creek Fecal coliform, Total Nitrogen Nutrients, DO, Chlorophyll, Benthic fauna
Mill Pond Creek -- Nutrients
Inner Harbor Creek -- Nutrients
3

Problem Assessment
The primary ecological threat to the Lewis Bay embayment system as a coastal resource is degradation resulting from nutrient enrichment. The N loading to this system, like almost all embayments in southeastern Massachusetts including the Islands, results primarily from on-site disposal of wastewater and WWTF discharges. Wastewater effluents (from septic systems and from wastewater treatment facilities) discharge to the ground, enter the groundwater system and eventually enter the surface water bodies. In the sandy soils of Cape Cod, effluent that has entered the groundwater travel towards the coastal waters at an average rate of one foot per day.
The nutrient load to the groundwater system is primarily a function of the human population. The towns of Barnstable and Yarmouth have been among the fastest growing towns in the Commonwealth over the past two decades. In the period from 1940 to 2000 the number of year round residents in Barnstable and Yarmouth has almost quadrupled (Figure 2). The watershed of Lewis Bay embayment has had rapid and extensive development of single-family homes and the conversion of seasonal into full time residences. This is reflected in a substantial transformation of land from forest
Table 1C: General Summary of Conditions Related to the Major Indicators of Habitat Impairment Observed in the Lewis Bay System
Embayment System
Dissolved OxygenDepletion Chlorophyll a1 Eelgrass Loss Benthic Fauna2
Hyannis Inner Harbor
Oxygen levels <6 mg/L 20-30% of time, but <5
mg/L only 1%H-MI
Moderate levels (5–10 µg/L)
MINo historical beds
Moderate reduced numbers of species and
individualsMI
Lewis Bay (outer)
Oxygen levels <6 mg/L 18%, with no depletions
of <5 mg/LH
Low levels (approx. 5 µg/L)
H
Eelgrass present in 1951 in lower main basin only,
now very sparseSI
High number of species and individuals
H
Lewis Bay (inner)
Oxygen levels <6 mg/L 22%, with depletions
rarely 5-3 mg/LMI-SI
Moderate levels (5 – 10 µg/L)
MI
Eelgrass beds lost between 1951 and 1995
SI
Moderate to high number of species and
individualsH-MI
Uncle Robert’s Cove
Oxygen levels <6 mg/L 54%, with depletions <5
mg/L 8 %MI - SI
High levels (>10 µg/L) 43% occasional bloom
conditionsSI
Eelgrass beds lost between 1951 and 1995
SI
Moderate number of species but very low
numbers of individualsSI
Mill Creek
Oxygen levels <6 mg/L 36%, depletions < 5
mg/L 11 %H-MI
High levels>25 µg/L
22% of the timeMI
No historical beds
Typical of salt marsh, but with signs of
possible moderate impairment
H-MI
Hall’s CreekOxygen levels >6 mg/L
90%H
Levels Consistently < 10 µg/L
HNo historical beds Typical of salt marsh
H
1 Algal blooms are consistent with chlorophyll a levels above 20 µg/L2 Based on observations of the types of species, number of species, and number of individuals
H - Healthy habitat conditionsMI – Moderately ImpairedSI – Significantly Impaired - considerably and appreciably changed from normal conditions*
* - These terms are more fully described in MEP report “Site-Specific Nitrogen Thresholds for Southeastern Massachusetts Embayments: Critical Indicators” December 22, 2003. http://www.mass.gov/eea/agencies/massdep/water/watersheds/coastal-resources-and-estuaries.html
4

to suburban use between the years 1940 to 2000. Water quality problems associated with this development result primarily from wastewater, and to a lesser extent, from runoff - including fertilizers - from these developed areas.
Prior to the 1940’s there were few homes and many of those were seasonal. During these times water quality was not a problem and eelgrass beds were plentiful. Dramatic declines in water quality and the quality of the estuarine habitats throughout Cape Cod and the Islands have paralleled its population growth since these times. The problems in this particular embayment generally include periodic decreases of dissolved oxygen, decreased diversity and quantity of benthic animals, loss of eelgrass habitat, and periodic algal blooms. In the most severe cases habitat degradation could lead to periodic fish kills, unpleasant odors and scums, and near loss of the benthic community and/or presence of only the most stress-tolerant species of benthic animals.
Coastal communities, including Barnstable and Yarmouth, rely on clean, productive, and aesthetically pleasing marine and estuarine waters for tourism, recreational swimming, fishing, and boating, as well as commercial fin fishing and shellfishing. The continued degradation of this coastal embayment, as described above, will significantly reduce the recreational and commercial value and use of these important environmental resources.
Habitat and water quality assessments were conducted on each of the these embayment systems based upon six years of water quality monitoring data, historical changes in eelgrass distribution, time-series water column oxygen measurements, and benthic community structure. At present, the Lewis Bay Embayment System is showing variations in N enrichment and habitat quality among its various component basins. In general the system is showing healthy to moderately impaired benthic habitat. However, the smaller tributary embayments and limited inner areas of Lewis Bay (e.g. Uncle Roberts Cove, Hyannis Inner Harbor) are presently moderately impaired based upon infaunal habitat criteria. However, the dominant habitat issue for this system is the significant impairment of the Lewis Bay basin and Uncle Roberts Cove, based on eelgrass criteria. Historical eelgrass beds have been lost in these areas and eelgrass is virtually non-existent within this system.
Halls Creek continues to function as a healthy salt marsh-dominated system that is assimilating its current N loadings.
Pollutant of Concern, Sources and Controllability
5

Target Threshold N Concentrations and Loadings The total N loadings to the Lewis Bay system (the quantity of N) range from 14.07 kg/day in Uncle Roberts Cove, to 70.37 kg/day in Lewis Bay. The resultant concentrations of N in the system range from 0.42 mg/L (milligrams per liter of N) in Lewis Bay and 0.47 mg/L in Uncle Roberts Cove to 1.92 mg/L in Snows Creek. The N loading to Halls Creek is 29 kg/day, with N concentrations up to 1.21 mg/L. These concentrations are taken from Tables ES-1, ES-2, and VI-1 of the MEP Technical Report.
In order to restore and protect the Lewis Bay system, N loadings, and subsequently the concentrations of N in the water, must be reduced to levels below the thresholds that cause the observed environ-mental impacts. This concentration will be referred to as the target threshold N concentration. The goal of the implementation of this TMDL is to reach this target threshold N concentration, as it has been determined for each impaired waterbody segment. The MEP has determined that, for the Lewis Bay system, a N concentration of 0.38 mg/L, in the area of the eastern end of Lewis Bay (sentinel Station, Figures 4a), will protect water quality and habitat throughout the embayment system. The mechanism for achieving this target threshold N concentration is to reduce the N loadings to various portions of the system. Based on the MEP modeling efforts, presented in their Technical Report, the MassDEP has adopted a range of Total Maximum Daily Loads (TMDL) of N throughout the system. Values of TMDLs range from <1 - 47 kg/day in the Lewis Bay System, and 30 kg/day in Halls Creek.
As a function of various aspects of the sub-embayment systems (size, current N loading rates, hydrodynamics, and land uses in the watersheds) N loading reductions will not be necessary in the watersheds of Snows Creek, Stewarts Creek, Uncle Roberts Cove, and Chase Brook. Reductions in N loadings in the watersheds of adjacent embayments will result in reductions in the N concentrations in all of the embayments as needed to meet the target threshold N concentrations.
Implementation The primary goal of implementation will be lowering the concentrations of N by reducing the loadings from on-site subsurface wastewater disposal systems through a variety of centralized or decentralized methods such as sewering and treatment with N removal technology, advanced treatment of septage, and/or installation of N-reducing on-site systems.
In the coastal embayments of the Towns of Barnstable and Yarmouth, as in most marine and coastal waters, the limiting nutrient is N. Nitrogen concentrations beyond those expected naturally contribute to undesirable conditions, including the impacts described above, through the promotion of excessive growth of plants and algae, including nuisance vegetation.
The embayment system covered in this TMDL has had extensive data collected and analyzed through the MEP and with the cooperation and assistance from the Towns of Barnstable and Yarmouth. Data collection included both water quality and hydrodynamics as described in Chapters I, IV, V, and VII of the MEP Technical Report.
These investigations revealed that loadings of nutrients, especially N, are much larger than they would be under natural conditions, and as a result the water quality has deteriorated.
6

The sources of N and their percent contributions are illustrated in Figure 3.
Figure 3: Lewis Bay Nutrient Loading
The level of “controllability” of each source, however, varies widely:
Atmospheric N – local control efforts are helpful, but are not adequate to significantly reduce N - it is only through region- and nation-wide air pollution control initiatives that significant reductions are feasible;
Sediment N- control by such measures as dredging is not feasible on a large scale. However, the concentrations of N in sediments, and thus the loadings from the sediments, will decline over time if sources in the watershed are removed, or reduced to the target levels discussed later in this document. Increased dissolved oxygen will help keep N from fluxing;
Stormwater Runoff – related N loadings can be reduced through best management practices (BMPs), bylaws, stormwater infrastructure improvements and public education;
Fertilizer – related N loadings can be reduced through bylaws and public education;
WWTF – related N loadings can be reduced by upgrading the treatment process to include N removal.
Septic system - sources of N are the largest controllable sources. These can be controlled by a variety of case-specific methods including: sewering and treatment at centralized or decentralized locations, transporting and treating septage at treatment facilities with N removal technology either in or out of the watershed, or installing N-reducing on-site wastewater treatment systems.
Atmospheric deposition to natural surfaces (forests, fields, etc.) and lakes in the watershed – atmospheric deposition (loadings) to these areas cannot adequately be controlled locally; however the N from these sources might be subjected to enhanced natural attenuation as it moves towards the estuary.
Lewis Bay Nutrient Loading
Sediment28%
Land Use11%
Septic39%
WWTF14%
Atmosheric deposition directly
to estuary8%
7

Cost/benefit analyses will have to be conducted on all of the possible N loading reduction methodologies in order to select the optimal control strategies, priorities, and schedules.
Description of the Applicable Water Quality Standards
The water bodies addressed in this report are classified as SA. Water quality standards of particular interest to the issues of cultural eutrophication are dissolved oxygen, nutrients, aesthetics, excess plant biomass, and nuisance vegetation. The Massachusetts water quality standards (314 CMR 4.0) contain numeric criteria for dissolved oxygen, but have only narrative standards that relate to the other variables, as described below:
314 CMR 4.05(5)(a) states “Aesthetics – All surface waters shall be free from pollutants in concentrations or combinations that settle to form objectionable deposits; float as debris, scum, or other matter to form nuisances; produce objectionable odor, color, taste, or turbidity; or produce undesirable or nuisance species of aquatic life.”
314 CMR 4.05(5)(c) states, “Nutrients. Unless naturally occurring, all surface waters shall be free from nutrients in concentrations that would cause or contribute to impairment of existing or designated uses and shall not exceed the site specific criteria developed in a TMDL or as otherwise established…”
314 CMR 4.05(b) 1:
(a) Class SA
1. Dissolved Oxygen -a. Shall not be less than 6.0 mg/L unless background conditions are lower;b. natural seasonal and daily variations above this level shall be maintained.
Thus, the assessment of eutrophication is based on site-specific information within a general framework that emphasizes impairment of uses and preservation of a balanced indigenous flora and fauna. This approach is recommended by the US Environmental Protection Agency in their draft Nutrient Criteria Technical Guidance Manual for Estuarine and Coastal Marine Waters (EPA-822-B-01-003, Oct 2001). The guidance Manual notes that lakes, reservoirs, streams, and rivers may be subdivided by classes, allowing reference conditions for each class and facilitating cost-effective criteria development for nutrient management. However, individual estuarine and coastal marine waters tend to have unique characteristics, and development of individual water body criteria is typically required.
It is this framework, coupled with an extensive outreach effort that the Department, with the technical support of SMAST, is employing to develop nutrient TMDLs for coastal waters. Methodology - Linking Water Quality and Pollutant Sources
Extensive data collection and analyses have been described in detail in the MEP Technical Report. Those data were used by SMAST to assess the loading capacity of each sub-embayment. Physical (Chapter V), chemical, and biological (Chapters IV, VII, and VIII) data were collected and evaluated. The primary water quality objective was represented by conditions that:
8

1) Restore the natural distribution of eelgrass because it provides valuable habitat for shellfish and finfish
2) Prevent algal blooms3) Protect benthic communities from impairment or loss4) Maintain dissolved oxygen concentrations that are protective of the estuarine communities.
The details of the data collection, modeling and evaluation are presented and discussed in Chapters IV, V, VI, VII and VIII of the MEP Technical Report. The main aspects of the data evaluation and modeling approach are summarized below, taken from pages 6 through 8 of that report.
The core of the Massachusetts Estuaries Project analytical method is the Linked Watershed-Embayment Management Modeling Approach. It fully links watershed inputs with embayment circulation and N characteristics, and is characterized as follows:
• Requires site specific measurements within the watershed and each sub-embayment;
• Uses realistic “best-estimates” of N loads from each land-use (as opposed to loads with built-in “safety factors” like Title 5 design loads);
• Spatially distributes the watershed N loading to the embayment;
• Accounts for N attenuation during transport to the embayment;
• Includes a 2D or 3D embayment circulation model depending on embayment structure;
• Accounts for basin structure, tidal variations, and dispersion within the embayment;
• Includes N regenerated within the embayment;
• Is validated by both independent hydrodynamic, N concentration, and ecological data;
• Is calibrated and validated with field data prior to generation of “what if” scenarios.
The Linked Model has been applied previously to watershed N management in over 15 embayments throughout Southeastern Massachusetts. In these applications it became clear that the model can be calibrated and validated, and has use as a management tool for evaluating watershed N management options.
The Linked Model, when properly calibrated and validated for a given embayment, becomes a N management planning tool as described in the model overview below. The model can assess solutions for the protection or restoration of nutrient-related water quality and allows testing of management scenarios to support cost/benefit evaluations. In addition, once a model is fully functional it can be refined for changes in land-use or embayment characteristics at minimal cost. In addition, since the Linked Model uses a holistic approach that incorporates the entire watershed, embayment, and tidal source waters, it can be used to evaluate all projects as they relate directly or indirectly to water quality conditions within its geographic boundaries. It should be noted that this approach includes high-order, watershed and sub-watershed scale modeling necessary to develop critical nitrogen targets for each major sub-embayment. The models, data and assumptions used in this process are specifically intended for the purposes stated in the MEP Technical Report, upon
9

which this TMDL is based. As such, the Linked Model process does not contain the type of data or level and scale of analysis necessary to predict the fate and transport of nitrogen through groundwater from specific sources. In addition, any determinations related to direct and immediate hydrologic connection to surface waters are beyond the scope of the MEP’s Linked Model process.
The Linked Model provides a quantitative approach for determining an embayment's: (1) N sensitivity, (2) N threshold loading levels (TMDL) and (3) response to changes in loading rate. The approach is fully field validated and unlike many approaches, accounts for nutrient sources, attenuation, and recycling and variations in tidal hydrodynamics (Figure I-3 of the MEP Technical Report). This methodology integrates a variety of field data and models, specifically:
• Monitoring - multi-year embayment nutrient sampling
• Hydrodynamics -
- Embayment bathymetry (depth contours throughout the embayment)- Site specific tidal record (timing and height of tides)- Water velocity records (in complex systems only)- Hydrodynamic model
• Watershed N Loading
- Watershed delineation- Stream flow (Q) and N load- Land-use analysis (GIS)- Watershed N model
• Embayment TMDL - Synthesis
- Linked Watershed-Embayment Nitrogen Model- Salinity surveys (for linked model validation)- Rate of N recycling within embayment- Dissolved oxygen record- Macrophyte survey- Infaunal survey (in complex systems)
Application of the Linked Watershed-Embayment Model The approach developed by the MEP for applying the linked model to specific embayments, for the purpose of developing target N loading rates, includes:
1) Selecting one or two sub-embayments within the embayment system, located close to the inland-most reach or reaches, which typically has the poorest water quality within the system. These are called “sentinel” stations;
2) Using site-specific information and a minimum of three years of sub-embayment-specific data to select target threshold N concentrations for each sub-embayment. This is done by refining the draft target threshold N concentrations that were developed as the initial step of the MEP process. The target threshold N concentrations that were selected generally occur in higher quality waters near the mouth of the embayment system;
10

3) Running the calibrated water quality model using different watershed N loading rates, to determine the loading rate which will achieve the target threshold N concentration at the sentinel station. Differences between the modeled N load required to achieve the target threshold N concentration, and the present watershed N load, represent N management goals for restoration and protection of the embayment system as a whole.
Previous sampling and data analyses, and the modeling activities described above, resulted in four major outputs that were critical to the development of the TMDL. Two outputs are related to N concentration:
the present N concentrations in the sub-embayments site-specific target threshold N concentrations
And, two outputs are related to N loadings: the present N loads to the sub-embayments load reductions necessary to meet the site specific target threshold N concentrations
In summary: meeting the water quality standards by reducing the N concentration (and thus the N load) at the sentinel station(s), the water quality goals will be met throughout the entire system.A brief overview of each of the outputs follows:
Nitrogen concentrations in the embayment a) Observed “present” conditions:Table 2 presents the average concentrations of N measured in this system from six years of data collection (during the period 2001 through 2006). The concentrations of N in this embayment system range from 0.41 mg/L (milligrams per liter of N) in Lewis Bay to 1.57 mg/L in Snows Creek. The overall means and standard deviations of the averages are presented in Appendix A (reprinted from Table VI-1 of the MEP Technical Report). The water quality sampling stations are shown in Figures 4a and 4b.
b) Modeled site-specific target threshold N concentrations:A major component of TMDL development is the determination of the maximum concentrations of N (based on field data) that can occur without causing unacceptable impacts to the aquatic environment. Prior to conducting the analytical and modeling activities described above, SMAST selected appropriate nutrient-related environmental indicators and tested the qualitative and quantitative relationship between those indicators and N concentrations. The Linked Model was then used to determine site-specific target threshold N concentrations by using the specific physical, chemical, and biological characteristics of each sub-embayment.
As listed in Table 2, the site-specific target threshold N concentration for Lewis Bay is 0.38 mg/L (at the sentinel station BHY-3 at 41°38'5.5"N, 70°14'43.5"W), and is 1.0 mg/L in the Halls Creek system (at station BC-14 at 41°37'56"N, 70°9'3"W ). See Figures 4a and 4b.
11

The findings of the analytical and modeling investigations for these embayment systems are discussed and explained below:
The target threshold N concentration for an embayment represents the average water column concentration of N that will support the habitat quality or dissolved oxygen conditions being sought. The water column N concentration is ultimately controlled by the integration of the watershed N load, the N concentration in the inflowing tidal waters (boundary condition) and dilution due to ground or surface water flows. The water column N concentration is also modified by the extent of sediment regeneration and by direct atmospheric deposition.
Target threshold N concentrations in this study were developed to restore or maintain SA waters or high habitat quality. In this system, high habitat quality was defined as diverse benthic animal communities and dissolved oxygen levels that would support Class SA waters.
Nitrogen loadings to the embayment
a) Present loading rates:
In the Lewis Bay System overall, the highest N loading from controllable sources is from on-site wastewater treatment systems, which is almost always the highest N loading source in other coastal embayments as well. Nitrogen loading from the nutrient-rich sediments (referred to as benthic flux) is significant in portions of these embayments. As discussed previously, however, the direct control of N from sediments is not considered feasible. However, the magnitude of the benthic contribution is related to the watershed load. Therefore, reducing the incoming load should reduce the benthic flux over time. A breakdown of N loading, by source, is presented in Table 3. This table is based on data from Tables ES-1and ES-2 of the MEP Technical Report.
As previously indicated, the present N loadings to Lewis Bay System must be reduced in order to restore conditions and to avoid further nutrient-related adverse environmental impacts. The critical final step in the development of the TMDL is modeling and analysis to determine the loadings required to achieve the target threshold N concentrations.
TABLE 2: Observed Present Nitrogen Concentrations and Target Threshold Nitrogen Concentrations for the Major Sub-Embayments of the Lewis Bay System and Halls
Creek
Lewis Bay SystemObserved N
Concentration(mg/L) 1
Target Threshold N Concentration
(mg/L)Hyannis Inner Harbor 0.43 – 0.602
Snows Creek 1.57Lewis Bay (BHY-3) 0.41 0.38
Stewarts Creek 1.25Uncle Roberts Cove 0.41
Mill Creek 0.52-0.562
Halls Creek System (BC-14) 0.45 1.0 1 Ranges represent the upper to lower regions (highest – lowest) of a sub-embayment, calculated
as the average of the separate yearly means of 2001-2006 data. Individual yearly means and standard deviations of the average are presented in Appendix A2 Listed as a range since it was sampled at more than one station (Appendix A)
12

Figure 4a. Water Quality Sampling Stations within the Lewis Bay System. Station BHY-3 is the sentinel station.
l
13

Figure 4b. Water Quality Sampling Stations Within the Halls Creek System. Station BC-14 is the sentinel station.
14

b) Nitrogen loads necessary for meeting the site-specific target N concentrations:
Table 4 (based on data from Tables ES-1 and ES-2 of the MEP Technical Report) lists the present watershed N loadings from the Lewis Bay System, and one scenario of the reduced loads and percentage reductions that could achieve the target threshold N concentration at the sentinel station (see following section). It is important to note that load reductions can be produced through reduction of any or all sources of N. The load reductions presented below represent only one of a suite of potential reduction approaches that need to be evaluated the Towns of Barnstable and Yarmouth. The presentation is to establish the general degree and spatial pattern of reduction that will be required for restoration of this N impaired embayment. Other alternatives may also achieve the desired target threshold N concentration as well and can be explored using the MEP modeling approach. Table VIII-2 of the MEP Technical Report (and rewritten as Appendix B of this document) summarizes the present loadings from on-site subsurface wastewater disposal systems and the reduced loads that would be necessary to achieve the target threshold N concentration in the Lewis Bay System. In the scenario presented in Table 4 the percentage reductions in N loadings to meet target threshold N concentration ranged from 2% in Mill Pond Creek up to 83 % in Inner Harbor Creek. However, Snow’s Creek, Stewart’s Creek, Uncle Roberts Cove, Chase Brook, and Halls Creek will not need N loading reductions (under this scenario) in order for the remainder of the system to be restored. There
TABLE 3: Nitrogen Loadings to the Lewis Bay System and Halls Creek
Embayment
Present Non-Wastewater Watershed
Load1
(kg/day)
Present SepticSystemLoad
(kg/day)
Present WWTFLoad
(kg/day)
Present Sediment Load
(kg/day)
Present Atmospheric Deposition2
(kg/day)
Total Load (kg/day)
Hyannis Inner Harbor 3.60 6.84 1.72 18.66 0.63 31.45
Snow’s Creek 2.12 4.91 8.09 03 Not Measured 15.12
Lewis Bay 4.36 26.49 0 26.00 13.51 70.37
Stewart’s Creek 4.31 15.76 18.92 03 0.24 39.23
Uncle Robert’s Cove 0.15 0.39 0 12.77 0.76 14.07
Mill Creek 1.75 13.57 0.65 03 0.63 16.60
Chase Brook 1.08 2.27 0 Not Measured Not Measured 3.35
Mill Pond Creek 4.23 10.39 0.43 Not Measured Not Measured 15.05
Inner Harbor Creek 0.33 1.58 0 Not Measured Not Measured 1.91
Halls Creek 6.38 15.62 1.14 5.25 0.63 29.02
1Composed of fertilizer, runoff, and atmospheric deposition to freshwater and natural surfaces2Atmospheric deposition directly to the estuary surface only, any atmospheric deposition to other water bodies that run into the estuary are considered in the present watershed load.3Represented as 0, not a nitrogen load.
15

can be variations depending on the chosen sub-watershed and which controllable source is selected for reduction. Alternate scenarios will result in different amounts of N being reduced in different sub-watersheds. For example, taking out additional N “upstream” will impact how much N has to be taken out “downstream”. The municipalities should take any reasonable actions to reduce the controllable N sources.
Total
Maximum Daily Loads
As described in EPA guidance, a total maximum daily load (TMDL) identifies the loading capacity of a water body for a particular pollutant. EPA regulations define loading capacity as the greatest amount of loading that a water body can receive without violating water quality standards. The TMDLs are established to protect and/or restore the estuarine ecosystem, including eelgrass, the leading indicator of ecological health, thus meeting water quality goals for aquatic life support. Because there are no “numerical” water quality standards for N, the TMDL for the Lewis Bay System is aimed at determining the loads that would correspond to specific N concentrations determined to be protective of the water quality and ecosystems.
TABLE 4: Present Watershed Nitrogen Loading Rates, Calculated Loading Rates that are Necessary to Achieve Target Threshold Nitrogen Concentrations, and the
Percent Reductions of the Existing Loads Necessary to Achieve the Target Threshold Loadings
Embayment
Present Total Watershed
Load 1
(kg/day)
TargetThresholdWatershed
Load2
(kg/day)
Percent Watershed Load
Reductions Needed to Achieve
Threshold Loads
Hyannis Inner Harbor 12.15 7.12 42%
Snow’s Creek 15.12 15.12 0
Lewis Bay 30.86 9.66 69%
Stewart’s Creek 38.99 38.99 0
Uncle Robert’s Cove 0.54 0.54 0
Mill Creek 15.96 4.32 73%
Chase Brook 3.35 3.35 0
Mill Pond Creek 15.04 14.68 2%
Inner Harbor Creek 1.91 0.33 83%
Halls Creek System 23.14 23.14 01 Composed of fertilizer, runoff from impervious surfaces, septic systems and atmospheric deposition to natural surfaces.2 Target threshold watershed load is the load from the watershed needed to meet the embayment target threshold N concentration identified in Table 2 above. Includes natural background.
16

The effort includes detailed analyses and mathematical modeling of land use, nutrient loads, water quality indicators, and hydrodynamic variables (including residence time), for each sub-embayment. The results of the mathematical model are correlated with estimates of impacts on water quality, including negative impacts on eelgrass (the primary indicator), as well as dissolved oxygen, chlorophyll, and benthic infauna.
The TMDL can be defined by the equation:
TMDL = BG + WLAs + LAs + MOS
Where
TMDL = loading capacity of receiving waterBG = natural backgroundWLAs = portion allotted to point sourcesLAs = portion allotted to (cultural) non-point sourcesMOS = margin of safety
Background Loading
Natural background N loading is included in the loading estimates, but is neither quantified nor presented separately.
Wasteload Allocations
Wasteload allocations identify the portion of the loading capacity allocated to existing and future point sources of wastewater. EPA interprets 40 CFR 130.2(h) to require that allocations for NPDES regulated discharges of storm water be included in the waste load component of the TMDL. For purposes of the Lewis Bay/Halls Creek TMDL, MassDEP also considered the nitrogen load reductions from regulated MS4 sources necessary to meet the target nitrogen concentrations.
In estimating the nitrogen loadings from regulated stormwater sources, MassDEP considered that most stormwater runoff in the MS4 communities is not discharged directly into surface waters, but, rather, percolates into the ground. The geology on Cape Cod and the Islands consists primarily of glacial outwash sands and gravels, and water moves rapidly through this type of soil profile. A systematic survey of stormwater conveyances on Cape Cod and the Islands has never been undertaken. Nevertheless, most catch basins on Cape Cod and the Islands are known to MassDEP to have been designed as leaching catch basins in light of the permeable overburden. MassDEP, therefore, recognized that most stormwater that enters a catch basin in the regulated area will percolate into the local groundwater table rather than directly discharge to a surface waterbody.
As described in the Metholody Section (above), the Linked Model accounts for storm water loadings and groundwater loading in one aggregate allocation as a non-point source. However, MassDEP also considered that some stormwater collected in regulated area is discharged directly to surface waters through outfalls. In the absence of specific data or other information to accurately quantify stormwater discharged directly to surface waters, MassDEP assumed that all impervious surfaces within 200 ft of the shoreline, as calculated from MassGIS data layers, would discharge directly to surface waters, whether or not it in fact did so. MassDEP selected this approach because it considered it unlikely that any stormwater collected farther than 200 ft. from the shoreline would be directly discharged into surface waters. Although the 200 ft. approach provided a gross estimate, MassDEP considered it a reasonable and conservative approach given the lack of pertinent data and information
17

about MS4 systems on Cape Cod. For Lewis Bay/Halls Creek this calculated stormwater WLA based on the 200” buffer is 1.11% of the total N load or 704.1 kg/yr as compared to the overall N load of 63,482 kg/yr to the embayment (see Appendix C for details). This conservative load is a negligible amount of the total nitrogen load to the embayment when compared to other sources.
Load Allocations
Load allocations identify the portion of loading capacity allocated to existing and future nonpoint sources. In the case of the Lewis Bay System, the nonpoint source loadings are primarily from on-site subsurface wastewater disposal systems. Additional N sources include: WWTF’s, fertilizer, stormwater runoff (including N from fertilizers), atmospheric deposition, and nutrient-rich sediments. Generally, stormwater that is subject to the EPA Phase II Program would be considered a part of the wasteload allocation, rather than the load allocation. As presented in Chapter IV, V, and VI, of the MEP Technical Report, on Cape Cod and the Islands the vast majority of stormwater percolates into the aquifer and enters the embayment system through groundwater. Given this, the TMDL accounts for stormwater loadings and groundwater loadings in one aggregate allocation as a non-point source. As the Phase II Program is implemented in Barnstable and Yarmouth, new studies, and possibly further modeling, will identify what portion of the stormwater load may be controllable through the application of Best Management Practices (BMPs).
The sediment loading rates for Lewis Bay which are incorporated into the TMDL are lower than the existing sediment flux rates listed in Table 3 above because projected reductions of N loadings from the watershed will result in reductions of nutrient concentrations in the sediments, and therefore, over time, reductions in loadings from the sediments will occur. Benthic N flux is a function of N loading and particulate organic N (PON). Projected benthic fluxes are based upon projected PON concentrations and watershed N loads, and are calculated by multiplying the present N flux by the ratio of projected PON to present PON, using the following formulae:
Projected N flux = (present N flux) (PON projected / PON present)
When: PON projected = (Rload ) (DPON) + PON present offshore
When Rload = (projected N load) / (Present N load)
And D PON is the PON concentration above background determined by:
D PON = (PON present embayment – PON present offshore)
Benthic loading is affected by the change in watershed load. The benthic flux modeled for the Lewis Bay system is reduced from existing conditions based on the load reduction from controllable sources.
The loadings from atmospheric sources incorporated into the TMDL, however, are the same rates presently occurring, because, as discussed above, local control of atmospheric loadings is not considered feasible.
Locally controllable sources of N within the watersheds are categorized as on-site subsurface wastewater disposal system wastes, the effluent plume from the WWTF’s, and land use (which includes agriculture, stormwater runoff and fertilizers). The following figure emphasizes the fact
18

that the overwhelming majority of locally controllable N comes from on-site subsurface wastewater disposal systems.
Margin of Safety
Statutes and regulations require that a TMDL include a margin of safety (MOS) to account for any lack of knowledge concerning the relationship between load and wasteload allocations and water quality [CWA para 303 (d)(20C, 40C.G.R. para 130.7C(1)]. The EPA’s 1991 TMDL Guidance explains that the MOS may be implicit, i.e., incorporated into the TMDL through conservative assumptions in the analysis, or explicit, i.e., expressed in the TMDL as loadings set aside for the MOS. The MOS for the Lewis Bay System TMDL is implicit, and the conservative assumptions in the analyses that account for the MOS are described below.
1. Use of conservative data in the linked model The watershed N model provides conservative estimates of N loads to the embayment. Nitrogen transfer through direct groundwater discharge to estuarine waters is based upon studies indicating negligible aquifer attenuation and dilution, i.e. 100% of load enters embayment. This is a conservative estimate of loading because studies have also shown that in some areas less than 100% of the load enters the estuary. In this context, “direct groundwater discharge” refers to the portion of fresh water that enters an estuary as groundwater seepage into the estuary itself, as opposed to the portion of fresh water that enters as surface water inflow from streams, which receive much of their water from groundwater flow. Nitrogen from the upper watershed regions, which travel through ponds or wetlands, almost always enter the embayment via streamflow, are directly measured (over 12-16 months) to determine attenuation. In these cases the land-use model has shown a slightly higher predicted N load than the measured discharges in the streams/rivers that have been assessed to date. Therefore, the watershed model as applied to the surface water watershed areas again presents a conservative estimate of N loads because the actual measured N in streams was lower than the modeled concentrations.
The hydrodynamic and water quality models have been assessed directly. In the many instances where the hydrodynamic model predictions of volumetric exchange (flushing) have also been directly
FIGURE 5: Controllable Nitrogen Loads (kg/day) to the Lewis Bay System
96
9 14
34
0
20
40
60
80
100
120
Septic Systems Fertilizer Runoff fromImperviousSurfaces
WWTF
19

measured by field measurements of instantaneous discharge, the agreement between modeled and observed values has been >95%. Field measurement of instantaneous discharge was performed using acoustic doppler current profilers (ADCP) at key locations within the embayment (with regards to the water quality model, it was possible to conduct a quantitative assessment of the model results as fitted to a baseline dataset - a least squares fit of the modeled versus observed data showed an R2>0.95, indicating that the model accounted for 95% of the variation in the field data). Since the water quality model incorporates all of the outputs from the other models, this excellent fit indicates a high degree of certainty in the final result. The high level of accuracy of the model provides a high degree of confidence in the output, therefore less of a margin of safety is required.
Similarly, the water column N validation dataset was also conservative. The model is validated to measured water column N. However, the model predicts average summer N concentrations. The very high or low measurements are marked as outliers. The effect is to make the N threshold more accurate and scientifically defensible. If a single measurement two times higher than the next highest data point in the series raises the average 0.05 mg N/L, this would allow for a higher “acceptable” load to the embayment. Marking the very high outlier is a way of preventing a single and rare bloom event from changing the N threshold for a system. This effectively strengthens the data set so that a higher margin of safety is not required.
Finally, the reductions in benthic regeneration of N are most likely underestimates, i.e. conservative. The reduction is based solely on a reduced deposition of PON, due to lower primary production rates under the reduced N loading in these systems. As the N loading decreases and organic inputs are reduced, it is likely that rates of coupled remineralization-nitrification, denitrification and sediment oxidation will increase.
Benthic regeneration of N is dependant upon the amount of PON deposited to the sediments and the percentage that is regenerated to the water column versus being denitrified or buried. The regeneration rate projected under reduced N loading conditions was based upon two assumptions:(1) PON in the embayment in excess of that of inflowing tidal water (boundary condition) results from production supported by watershed N inputs and (2) Presently enhanced production will decrease in proportion to the reduction in the sum of watershed N inputs and direct atmospheric N input. The latter condition would result in equal embayment versus boundary condition production and PON levels if watershed N loading and direct atmospheric deposition could be reduced to zero (an impossibility of course). This proportional reduction assumes that the proportion of remineralized N will be the same as under present conditions, which is almost certainly an underestimate. As a result, future N regeneration rates are overestimated which adds to the margin of safety.
2. Conservative sentinel station/target threshold N concentrationConservatism was used in the selection of the sentinel station and target threshold N concentration. The site was chosen that had stable eelgrass or benthic animal (infaunal) communities, and not those just starting to show impairment, which would have slightly higher N concentration. Meeting the target threshold N concentration at the sentinel station will result in reductions of N concentrations in the rest of the system.
3 Conservative approachThe linked model accounted for all stormwater loadings and groundwater loadings in one aggregate allocation as a non point source and this aggregate load is accounted for in the load allocation. The method of calculating the WLA in the TMDL for regulated stormwater was conservative as it did not disaggregate this negligible load from the modeled stormwater LA, hence this approach further enhances the MOS.
20

The target loads were based on tidally averaged N concentrations on the outgoing tide, which is the worst case condition because that is when the N concentrations are the highest. The N concentrations will be lower on the flood tides, therefore this approach is conservative.
In addition to the margin of safety within the context of setting the N threshold levels, described above, a programmatic margin of safety also derives from continued monitoring of this embayment to support adaptive management. This continuous monitoring effort provides the ongoing data to evaluate the improvements that occur over the multi-year implementation of the N management plan. This will allow refinements to the plan to ensure that the desired level of restoration is achieved.
Seasonal Variation
Since the TMDLs for the waterbody segments are based on the most critical time period, i.e. the summer growing season, the TMDLs are protective for all seasons. The daily loads can be converted to annual loads by multiplying by 365 (the number of days in a year). Nutrient loads to the embayment are based on annual loads for two reasons. The first is that primary production in coastal waters can peak in both the late winter-early spring and in the late summer-early fall periods. Second, as a practical matter, the types of controls necessary to control the N load, the nutrient of primary concern, by their very nature do not lend themselves to intra-annual manipulation since a considerable portion of the N is from non-point sources. Thus, the annual loads make sense, since it is difficult to control non-point sources of N on a seasonal basis and N sources can take considerable time to migrate to impacted waters.
TABLE 5: The Total Maximum Daily Loads (TMDLs) for the Lewis Bay System and Halls Creek
Sub-embaymentTarget ThresholdWatershed Load 1
(kg/day)
Atmospheric Deposition (kg/day)
Sediment Load(kg/day)
TMDL 2
(kg/day)
Hyannis Inner Harbor 7.12 0.63 9.78 17.53
Snow’s Creek 15.12 Not Measured 0 15.12
Lewis Bay 9.66 13.51 23.92 47.09
Stewart’s Creek 38.99 0.24 0 39.23
Uncle Robert’s Cove 0.54 0.76 10.99 12.29
Mill Creek 4.32 0.63 0 4.95
Chase Brook 3.35 Not Measured Not Measured 3.35
Mill Pond Creek 14.68 Not Measured Not Measured 14.68
Inner Harbor Creek 0.33 Not Measured Not Measured 0.33
Halls Creek System 23.14 0.63 6.65 30.421 Target threshold watershed load is the load from the watershed needed to meet the embayment target threshold nitrogen concentration identified in Table 2. 2 Sum of target threshold watershed load, atmospheric deposition, and sediment load.
21

TMDL Values for the Lewis Bay System and Halls Creek
As outlined above, the total maximum daily loadings of N that would provide for the restoration and protection of the embayment were calculated by considering all sources of N grouped by natural background, point sources, and non-point sources. A more meaningful way of presenting the loadings data, from an implementation perspective, is presented in Table 5. This table is based on data from Tables ES-3 and ES-4 of the MEP Technical Report.
In this table the N loadings from the atmosphere is listed separately from the target watershed threshold loads, which are composed of natural background N along with locally controllable N from the on-site subsurface wastewater disposal systems, stormwater runoff, and fertilizer sources. In the case of the Lewis Bay System the TMDL was calculated by projecting reductions in locally controllable on-site subsurface wastewater disposal system, stormwater runoff, and fertilizer sources. Once again the goal of this TMDL is to achieve the identified target threshold N concentration at the identified sentinel station. The target load identified in this table represents one alternative loading scenario to achieve that goal but other scenarios may be possible and approvable as well.
Implementation Plans
The critical element of this TMDL process is achieving the sentinel station specific target threshold N concentration presented in Table 2 above, that are necessary for the restoration and protection of water quality and eelgrass habitat within the Lewis Bay System. In order to achieve this target threshold N concentration, N loading rates must be reduced throughout this embayment. Table 5, above, lists the target watershed threshold loads for this embayment. If this threshold load is achieved, this embayment will be protected.
As previously noted, this loading reduction scenario is not the only way to achieve the target threshold N concentrations. Barnstable and Yarmouth are free to explore other loading reduction scenarios through additional modeling as part of the Comprehensive Wastewater Management Plan (CWMP). It must be demonstrated, however, that any alternative implementation strategies will be protective of Lewis Bay, and that none of the embayment will be negatively impacted. To this end, additional linked model runs can be performed by the MEP at a nominal cost to assist the planning efforts of the Towns in achieving target N loads that will result in the desired target threshold N concentration.
The CWMP should include a schedule of the selected strategies and estimated timelines for achieving those targets. However, the MassDEP realizes that an adaptive management approach may be used to observe implementation results over time and allow for adjustments based on those results. This adaptive management approach will incorporate the priorities and concepts included in the updated area wide management plan established under the Clean Water Act Section 208.
Because the vast majority of controllable N load is from individual on-site subsurface wastewater disposal systems for private residences, the CWMP should assess the most cost-effective options for achieving the target N watershed loads, including but not limited to, sewering and treatment for N control of sewage and septage at either centralized or de-centralized locations, and denitrifying systems for all private residences.
Barnstable and Yarmouth are urged to meet the target threshold N concentrations by reducing N loadings from any and all sources, through whatever means are available and practical, including reductions in stormwater runoff and/or fertilizer use within the watershed through the establishment
22

of local by-laws and/or the implementation of stormwater BMPs, in addition to reductions in on-site subsurface wastewater disposal system loadings.
MassDEP’s MEP Implementation Guidance report http://www.mass.gov/eea/agencies/massdep/water/watersheds/coastal-resources-and-estuaries.html provides N loading reduction strategies that are available to Barnstable and Yarmouth and that could be incorporated into the implementation plans. The following topics related to N reduction are discussed in the Guidance:
Wastewater Treatment On-Site Treatment and Disposal Systems Cluster Systems with Enhanced Treatment Community Treatment Plants Municipal Treatment Plants and Sewers
Tidal Flushing Channel Dredging Inlet Alteration Culvert Design and Improvements
Stormwater Control and Treatment * Source Control and Pollution Prevention Stormwater Treatment
Attenuation via Wetlands and Ponds Water Conservation and Water Reuse Management Districts Land Use Planning and Controls
Smart Growth Open Space Acquisition Zoning and Related Tools
Nutrient Trading
* The Towns of Barnstable and Yarmouth are two of the 237 communities in Massachusetts covered by the Phase II stormwater program requirements.
Monitoring Plan
MassDEP is of the opinion that there are two forms of monitoring that are useful to determine progress towards achieving compliance with the TMDL keeping in mind that MassDEP’s position is that implementation will be conducted through an iterative process where adjustments may be needed along the way. The two forms of monitoring include 1) tracking implementation progress as approved in the Town CWMP plan and 2) monitoring ambient water quality conditions at the sentinel stations identified in the MEP Technical Report, and listed in Table 2 and the related discussion in this report.
The CWMP will evaluate various options to achieve the goals set out in the TMDL and Technical Report. It will also make a final recommendation based on existing or additional modeling runs, set out required activities, and identify a schedule to achieve the most cost effective solution that will result in compliance with the TMDL. Once approved by the Department tracking progress on the agreed upon plan will, in effect, also be tracking progress towards water quality improvements in conformance with the TMDL.
Relative to water quality, MassDEP believes that an ambient monitoring program, much reduced from the data collection activities needed to properly assess conditions and to populate the model,
23

will be important to determine actual compliance with water quality standards. Although the TMDL load values are not fixed, the target threshold N concentrations at the sentinel stations are fixed. In addition, there are target threshold N concentrations that are provided for many other non-sentinel locations in subembayments to protect nearshore benthic habitat. These are the water quality targets, and a monitoring program should encompass these stations at a minimum. Through discussions amongst the MEP it is generally agreed that existing monitoring programs, which were designed to thoroughly assess conditions and populate water quality models, can be substantially reduced for compliance monitoring purposes. Although more specific details need to be developed on a case by case basis MassDEP's current thinking is that about half the current effort (using the same data collection procedures) would be sufficient to monitor compliance over time and to observe trends in water quality changes. In addition, the benthic habitat and communities would require periodic monitoring on a frequency of about every 3-5 years. Finally, in addition to the above, existing monitoring conducted by MassDEP for eelgrass should continue into the future to observe any changes that may occur to eelgrass populations as a result of restoration efforts.
The MEP will continue working with the Towns to develop and refine monitoring plans that remain consistent with the goals of the TMDL. It must be recognized however that development and implementation of a monitoring plan will take some time, but it is more important at this point to focus efforts on reducing existing watershed loads to achieve water quality goals.
Reasonable Assurances
MassDEP possesses the statutory and regulatory authority, under the water quality standards and/or the State Clean Water Act (CWA), to implement and enforce the provisions of the TMDL through its many permitting programs, including requirements for N loading reductions from on-site subsurface wastewater disposal systems. However, because most non-point source controls are voluntary, reasonable assurance is based on the commitment of the locality involved. Barnstable and Yarmouth have demonstrated this commitment through the comprehensive wastewater planning that they initiated well before the generation of the TMDL. The Towns expect to use the information in this TMDL to generate support from their citizens to take the necessary steps to remedy existing problems related to N loading from on-site subsurface wastewater disposal systems, stormwater, and runoff (including fertilizers), and to prevent any future degradation of these valuable resources. Moreover, reasonable assurances that the TMDL will be implemented include enforcement of regulations, availability of financial incentives and local, state and federal programs for pollution control. Storm water NPDES permit coverage will address discharges from municipally owned storm water drainage systems. Enforcement of regulations controlling non-point discharges include local implementation of the Commonwealth’s Wetlands Protection Act and Rivers Protection Act; Title 5 regulations for on-site subsurface wastewater disposal systems, and other local regulations such as the Town of Rehoboth’s stable regulations. Financial incentives include federal funds available under Sections 319, 604 and 104(b) programs of the CWA, which are provided as part of the Performance Partnership Agreement between MassDEP and EPA. Other potential funds and assistance are available through Massachusetts’ Department of Agriculture’s Enhancement Program and the United States Department of Agriculture’s Natural Resources Conservation Services. Additional financial incentives include income tax credits for Title 5 upgrades and low interest loans for Title 5 on-site subsurface wastewater disposal system upgrades available through municipalities participating in this portion of the state revolving fund program.
As the towns implement this TMDL the loading values (kg/day of N) will be used by MassDEP as guidelines for permitting activities, and may be used by local communities as a management tool.
24

Public Participation
Public meetings to present the results of and answer questions on this TMDL were held on September 15, 2010 in the Barnstable Selectman’s meeting room and September 23, 2010 at the Yarmouth Town Hall. Mike Ackerman (MassDEP) summarized the Mass Estuaries Project and described the Draft Nitrogen TMDL Report findings. Public comments received at the public meetings and comments received in writing within a 30-day comment period following the public meeting were considered by the Department. This final version of the TMDL report includes both a summary of the public comments together with the Department's response to the comments and scanned images of the attendance sheets from the meetings (Appendix E). MEP representatives at the public meetings included MassDEP (Michael Ackerman, Rick Dunn, Chris Duerring, Brian Dudley, Dave Delorenzo, Cathy Vakalopoulos) and SMAST (Brian Howes).
25

Appendix ASummarizes the Nitrogen Concentrations for Lewis Bay System (from Chapter VI of the
MEP Technical Report)
24

Appendix B
Summarizes the Present On-Site Subsurface Wastewater Disposal System Loads, and the Loading Reductions that would be Necessary to Achieve the TMDL by Reducing
On-Site Subsurface Wastewater Disposal System Loads, Ignoring All Other Sources
Table VIII-2. Comparison of sub-embayment watershed septic loads (attenuated) used for modeling of present and threshold loading scenarios of
the Lewis Bay system. These loads do not include direct atmospheric deposition (onto the subembayment surface), benthic flux, runoff, or fertilizer
loading terms.
sub-embaymentpresent
septic load (kg/day)
threshold septic load
(kg/day)
threshold septic load %
changeLewis Bay 26.490 5.299 -80.0%
Uncle Roberts Cove 0.214 0.214 0.0%Mill Creek 13.570 1.926 -85.8%
Hyannis Inner Harbor 6.847 1.808 -73.6%1
Snows Creek 7.970 9.088 +14.0%Stewarts Creek 21.564 24.178 +12.1%
Surface Water SourcesChase Brook 2.488 2.479 -0.3%
Mill Pond 10.425 10.068 -3.4%Hospital Creek/Hyannis Inner 1.907 0.326 -82.9%1 Hyannis Inner Harbor is a combination of Hyannis Inner Harbor watershed (13),
and Wells Mary Dunn watershed (6) thus the 80% reduction in septic loading for the threshold does not result in a direct 80% reduction in septic loading.
25

Appendix C
The Lewis Bay Embayment System estimated wasteload allocation (WLA) from runoff of all impervious areas within 200 feet of waterbodies.
Watershed Name
Impervioussubwatershed buffer areas1
Total subwatershed
Impervious areas
Total Impervious
subwatershed load
Totalsubwatershed
load
Impervious watershed buffer
areaWLA
Acres % Acres % Kg/year Kg/year Kg/year2 %3
Lewis Bay 43.1 12.2 321.1 7.6 3895 40490 522.8 1.29
Stewarts Creek 5.4 10.5 85.6 9.2 749 14318 47.2 0.32
Halls Creek 14.8 5.7 76.5 9.0 731 8674 9.6 0.11
Total 63.3 10.7 483.2 9.1 5375 63482 704.1 1.11
1The entire impervious area within a 200 foot buffer zone around all waterbodies as calculated from GIS. Due to the soils and geology of Cape Cod it is unlikely that runoff would be channeled as a point source directly to a waterbody from areas more than 200 feet away. Some impervious areas within approximately 200 feet of the shoreline may discharge stormwater via pipes directly to the waterbody. For the purposes of the wasteload allocation (WLA) it was assumed that all impervious surfaces within 200feet of the shoreline discharge directly to the waterbody.
2The impervious subwatershed buffer area (acres) divided by total subwatershed impervious area (acres) then multiplied by total impervious subwatershed load (kg/year).
3The impervious subwatershed buffer area WLA (kg/year) divided by the total subwatershed load (kg/year) then multiplied by 100.
26

Appendix D
6 Total Nitrogen TMDLs, 4 Pollution Prevention TMDLs
Embayment System and Sub-embayment
Segment ID Impairment/TMDL Status TMDL (kg/day)
Lewis Bay SystemHyannis Inner Harbor MA96-82_2010 Determined to be impaired for nutrients during the development of
this TMDL.17.53
Snow’s Creek MA96-81_2008 Not impaired for total nitrogen, but TMDL needed since embayments are linked. (Pollution Prevention TMDL)
15.12
Lewis Bay MA96-36_2008 Determined to be impaired for nutrients during the development of this TMDL.
47.09
Stewart’s Creek MA96-94_2012 Not impaired for total nitrogen, but TMDL needed since embayments are linked. (Pollution Prevention TMDL)
39.23
Uncle Robert’s Cove Part of MA96-36_2008 Determined to be impaired for nutrients during the development of this TMDL.
12.29
Mill Creek MA96-80_2010 Determined to be impaired for nutrients during the development of this TMDL.
4.95
Chase Brook Not impaired for total nitrogen, but TMDL needed since embayments are linked. (Pollution Prevention TMDL)
3.35
Mill Pond Creek Determined to be impaired for nutrients during the development of this TMDL.
14.68
Inner Harbor Creek Determined to be impaired for nutrients during the development of this TMDL.
0.33
Lewis Bay System Total 154.57Halls Creek System MA96-93_2012 Not impaired for total nitrogen, but TMDL needed since
embayments are linked. (Pollution Prevention TMDL)30.42
27

Appendix E
MEPResponse to Comments
DRAFT TMDL REPORT FOR THE LEWIS BAY SYSTEM AND HALLS CREEK(Report Dated August 12, 2010)
Verbal Questions and Responses from Public Hearings for Draft Nitrogen TMDLsSeptember 23, 2010, 4:00-6:00 PM, Yarmouth Town Hall and September 15, 2010, 4:00–6:00 PM,
Barnstable Selectman’s Meeting Room
Mike Ackerman (MassDEP) summarized the Mass Estuaries Project and described the Draft Nitrogen TMDL Report findings. The public was able to ask questions and provide comments during and after the presentation. The following is a summary of the public comments prepared by Cathy Vakalopoulos (MassDEP). Also commenting are Brian Dudley (MassDEP), Christine Duerring (MassDEP), and Brian Howes (SMAST). Scanned images of the attendance sheets from these public meetings and the public meeting held in Barnstable (September 15, 2010 4:00-6:00 PM) / Barnstable Selectman’s Meeting Room.
Audience: What percent [nitrogen] is from cesspools and hotels near the water, jet fuel deposition, and road runoff?M. Ackerman: Various sources have been differentiated but I do not have the details available here today. Information on nitrogen sources presented here was separated into two groups: controllable sources and non-controllable sources (e.g. atmospheric deposition and nitrogen from the sediments). Dredging the sediments would not reduce the nitrogen coming from the sediments because that nitrogen is originally from decaying algae. To control this, nitrogen must be controlled from the original source and sources of nitrogen will be discussed later in the presentation. Jet fuel was not considered in this analysis.
Audience: Why wasn’t fertilizer addressed?M. Ackerman: Fertilizer use is considered in the analysis (lawn care, golf courses, and cranberry bogs).
Audience: Though the stench of jet fuel is a problem, people need to understand that we need sewers.
Audience: The Maritime Provinces of Canada, as well as Quebec have banned inorganic fertilizers and weed killers so Canada is way ahead of us. It’s better to have homeowners reduce nitrogen use by using organic fertilizers instead of digging up the streets [for sewers].
Audience: Flushing improvements would be good because Nantucket Sound is a much larger area that can handle algae. Shoaling has been a problem and is making areas shallower so dredging would have a significant effect. We are looking at opening the old Hyannis Channel down the road. These ideas are much cheaper than sewering although dredging is not the complete solution.Audience: Please discuss the other “non-traditional” approaches some more.[M. Ackerman did]
Audience: Can we get a better geographic idea of septic use, i.e. is it mostly near the shore?M. Ackerman: Septic information is based on water use data.B. Dudley: We could look at septic information more carefully to some degree by looking at the subwatersheds. Nitrogen loads in the upper reaches have more potential to be attenuated.
24
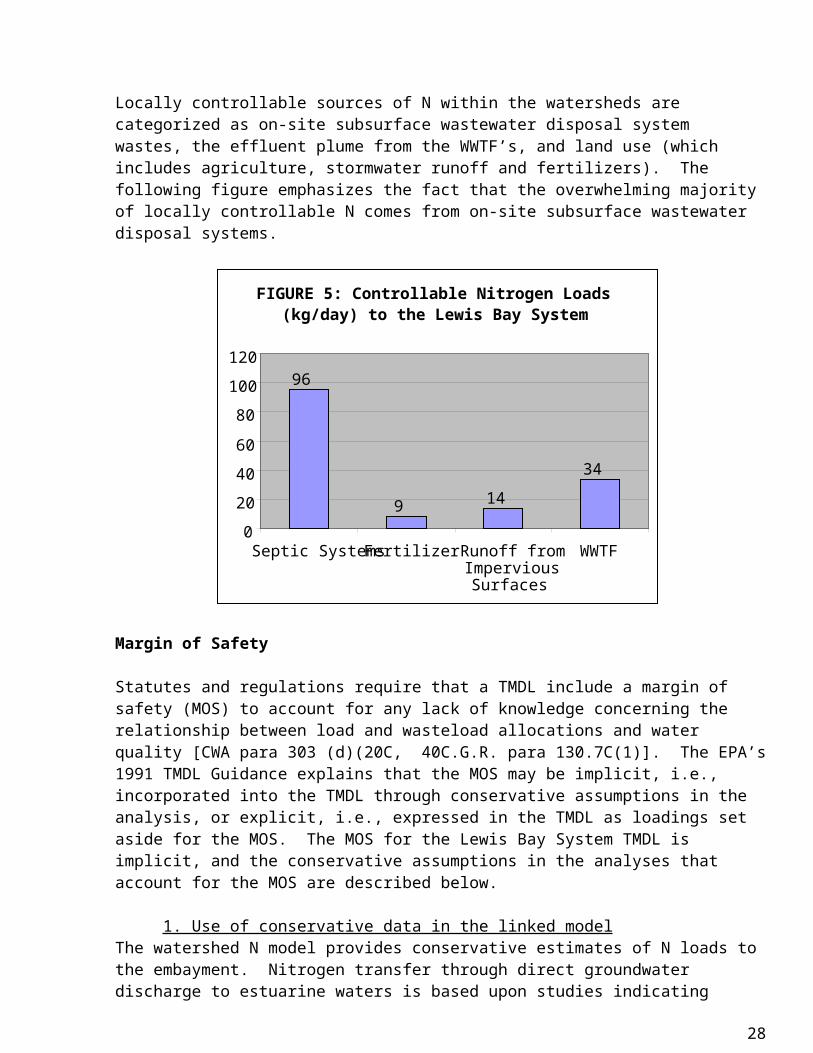
Audience: These data are great but they are not specific to our town. Residents are concerned about money. Yarmouth had a meeting this past Tuesday evening that discussed cost.Audience: How do you account for seasonal vs. year round septic use?B. Howes: It is impossible to count people. We use water use meter data. Audience: How come some areas are allowed to have a higher threshold?M. Ackerman: There are a lot of factors such as groundwater load, hydrodynamics, flushing, septic load, and sediment flux. What was presented here was just one example that only looked at septic load.
Audience: Early on, what standards were held when deciding where you wanted to end up?M. Ackerman: There were both subjective and objective standards [CV missed something here in her notes].
Audience: Please explain the acronyms we have never heard of before.
Audience: If we are now close to 0.38 mg/L N, why do we need a 69% reduction?M. Ackerman: Though the concentration is low, after converting it to load (from mg/L to kg/day), it is a lot of nitrogen.
Audience: Over what period of time and what part of year is this?M. Ackerman: A town needs three years of data to enter the Mass Estuaries Program, then three years of intensive data collection occurs during the summer months. The summer months are the most crucial when it comes to things like dissolved oxygen. B. Howes: One important piece of information is that at 0.37 mg/L nitrogen, there is eelgrass. Though there is a 69% reduction needed in one subembayment, if you look at all of the subembayments, then it is not as much. We are not trying to go back to pristine conditions but we want the water to be clear and the bottom to be sandy. This is good for the environment, the economy, and the people that live here.
Audience: Why are fertilizers, runoff from impervious surfaces, and WWTFs not included on the TMDL chart on page 9?M. Ackerman: We are only presenting one scenario as an example.
Audience: Please add those columns so we can discuss them further.M. Ackerman: We can certainly discuss this. I’m not telling you how to solve this. For example, perhaps the airport should be looked at. What I showed was just one example. C. Duerring: The total load is from all sources, not just septic.M. Ackerman: Load reductions in this case only look at septic.
Audience: There is a high percent contribution from the sediments in Lewis Bay. Explain why this is the case here and not in the other embayments.B. Howes: Perhaps it is because Lewis Bay is deep and there is a lot of Codium (invasive attached macroalgae). This may cause particles in the water column to fall out because they found fine materials over a sandy base. But the fix to Lewis Bay does not require the town to do anything to the sediments. As nitrogen is reduced in the watershed, the sediments will improve. We look at the sediments because they interact with the overall nitrogen balance. Just dredging will not solve the problem, fine sediments will be deposited again. Audience: So phytoplankton settling is causing this?B. Howes: 2 mm of sediments settles per year (both organic and inorganic).
25

Audience: In some areas, the fine sediments get flushed out but in some areas there are deep pockets. I’m concerned about using eelgrass as an indicator for improvement because it won’t grow in these areas with fine sediments. If eelgrass is what we hang our hat on, I’m not sure that we will see a recovery.B. Howes: We have tracked sediment type and eelgrass and in these waters, fine sediments will support eelgrass. If we are limited by a lack of seed source or propagation then we would have to help things along with some plantings.
Audience: There are issues of decomposing Codium which will smother the eelgrass. Codium is growing because of the nitrogen.
Audience: You will get the best cooperation if the government mandates it and pays for it. [Sewering] is a tax, and we don’t like it. If our town can’t pay for it, how can residents pay $10-80K per household? It’s going to kill the homeowners.B. Dudley: There are programs (e.g. state revolving loan fund) that can help towns. The O’Leary Bill provides 0% loans and there are USDA and rural development grants (Provincetown and Chatham has benefited from these). There are avenues to pursue that would help funding.
Audience: Yarmouth is applying for SRF. The O’Leary Bill provides 0% loans but only for 10 years and two years have already passed. [Sewering] is an unfunded mandate from the state. But we will pursue all grants available to us. Now that there is no money available from the federal government, we are on our own. [Yarmouth’s] elected officials will try to make this as manageable as possible. We are required to remove nitrogen but our eye is on the homeowners.
Audience: What is the timeline for all of this?M. Ackerman: This TMDL is guidance and not an enforcement document.B. Dudley: We do have “ways”, but we would prefer to work together though the CWMP process so that we can compromise on a workable plan. If we are forced to take an enforcement action, we would prefer a mutually agreed upon consent order but this would take away all flexibility. So far we are satisfied with Yarmouth’s progress and we feel that it’s better to work together to solve this problem.
Audience: Has the lawsuit been filed [by the Conservation Law Foundation]?B. Dudley: The notice of intent has been filed. If [the regulatory agencies] show progress, it may prevent the lawsuit.
Audience: This lawsuit echoes of the Boston Harbor case.G. Allaire: They are going after the regulatory agencies because they want them to work more quickly.
Audience: Who is going to force us to start digging? If we don’t do it, then will the feds come in and do it? This feels like extortion. We should force the feds to fund these mandates.
Audience: No, it’s in our local interest to fix our problems. When our water quality is exceeded, then our tax base and our revenues will suffer. That’s the driving force. Audience: But we cannot afford this!
Audience: What does this cost?G. Allaire: There are five phases at $55 million each south of Route 6.
26

Audience: Schools are run in the same way – unfunded mandates.Audience: In a sense we are paying now for poor decisions in the 1970’s. Anecdotally, Lewis Bay has slime and oil, and in my opinion, is not swimmable. It is sad to see tourists coming to Englewood Beach and not being able to swim. We are already “over the edge”. Let’s not stonewall and dig in our heels.
Audience: Let’s say we go ahead with this and it takes 25 years to do the work. Once the project is completed, and Lewis Bay is cleaner, when can it be considered “cleaned”?B. Howes: Lewis Bay already has significant sewering and is not as impaired as Seine Pond in the Parkers River watershed. Things would improve with each year with a ~95% improvement within 3-5 years. We come up with plans that limit sewering. Here we recommended 30% sewering. Delaying and having to go through a court case could make us have to sewer 100%.
Audience: Would it be prudent to ban the use of inorganic fertilizers?M. Ackerman: That makes sense but we are not telling what the towns to do.
Audience: Will the technology improve if we delay?Yarmouth official: No, the cost to dig sewers or build treatment plants does not go down.
Written comments
Comment (1):FROM: Zabelle D'Amico53 Lewis Bay Boulevard, West Yarmouth, MA 026731355 Main St., Holden, MA 01520 TO: Mass DEP, Division of Watershed Management627 Main St., Worcester, MA 01608Attn: Mr. Michael Ackerman: I read with concern the article on Lewis Bay contamination that appeared in the Cape Cod Times last week. When I looked up the website you noted to find more details on the estuaries report on Lewis Bay, I could find no specific mention of the work done on Lewis Bay. Can you help me? [Comment 1] My husband and I have owned a home on Lewis Bay (specifically in the Englewood Beach corner) for over 30 years. Last year, my husband and I donated to a report funded by the Springer Beach Association, also carried out by UMA-Dartmouth researchers, that was specifically targeted from the tip of the Englewood dock to Sweetheart Creek. I would be interested in reviewing the two reports again. I'm also wondering if the two research projects are one and the same. [Comment 2] Meanwhile, my level of concern for Lewis Bay went on high alert in August when my granddaughter took part in a Knockabout Sailboat race sponsored by the Yarmouth Recreation Department. All of the participants were given a bright yellow t-shirt with a detailed mariner's map of the entire bay showing in detail the various depths of the water. I was astounded to see a graphic presentation showing just how shallow much of the bay now is. We who live along the water, have expressed concern about the depth to one another, but his was the first time I'd seen a reliable visual that made the reality so shocking. Have you looked at this issue? Certainly that too must be a contributing factor to the negative quality of the water. [Comment 3] I believe the issue is especially urgent as Cape Wind is nearing final approval of 130 windmills on Nantucket Sound that will be connected by huge underground cables that will run from the wind farm site along the floor of Lewis Bay to the Englewood area, then proceed by land to connect to the power plant on Higgins Crowell Road. The bay is already shallow and I fear that the upshot of all of the work will be to further compromise both the depth and the water quality. I am not concerned about the appearance of the wind farm; rather, I am concerned about the further negative impact it will have on this very fragile resource. The loss of Lewis Bay would have a huge impact not just on tourism, but on the entire economy of Hyannis and Yarmouth.
27
Also, have you thought of actively enlisting the participation of homeowners who live on Lewis Bay, perhaps on the entire south side of 28, to use organic fertilizers that will at minimum stabilize the amount of nitrogen levels? It isn't sewers, but every effort counts. [Comment 4] I appreciate your time in this matter. I look forward to hearing back from you. Sincerely, Zabelle D'Amico
Response:Comment (1) The MassDEP TMDLs are available at http://www.mass.gov/dep/water/resources/tmdls.htm
Comment (2) It appears that the two research projects are not the same.
Comment (3) The issue of waterbody depth, the rate of sedimentation, and the shape of the waterbody (bathymetry) are all issues that have been reviewed as part of the TMDL process.
Comment (4) MassDEP does not get involved directly in modifying individual homeowner behavior over this type of issue (fertilizer use). MassDEP does however encourage local communities (and individuals) to look at every source of nutrients which it is able to control. In this particular system fertilizer use accounts for approximately 6% of the total controllable nitrogen load and is the smallest of the four controllable sources.
28

From: Tom Cambareri [[email protected]]Sent: Friday, October 01, 2010 11:24 AMTo: [email protected]; Ackerman, Michael (DEP)Cc: Ed Eichner; Saad, DaleSubject: LEWIS BAY PERCENT REMOVAL FOR STEWARDS CREEKAttachments: DraftTMDLlewisbay.pdf Hi, I noted an alarming difference in the percent removal required for Stewarts Creek between the Tech Report and the Draft TMDL. The Tech report indicates Stewards Creek has assimilative capacity to increase nitrogen loading by 12%, but the Draft TMDL show that there is a requirement for 36.1% removal. Given the ultimate discharge of the Hyannis WPCF into Stewarts Creek, this is a BIG difference. [Comment 5] Please review and advise. The comparison can be seen on the attached -Tom Tom Cambareri, CGWP, LSPWater Resources Program Manager Cape Cod Commission3225 Main StreetBarnstable, MA 02630www.capecodcommission.org Main: (508) 362-3828Fax: (508) 362-3136
29

Attachment:
DRAFTLewis Bay System and Halls Creek
Total Maximum Daily LoadsFor Total Nitrogen
(Report # 96-TMDL-18 Control #314)
COMMONWEALTH OF MASSACHUSETTSEXECUTIVE OFFICE OF ENERGY AND ENVIRONMENTAL AFFAIRS
IAN A. BOWLES, SECRETARY MASSACHUSETTS DEPARTMENT OF ENVIRONMENTAL PROTECTION
LAURIE BURT, COMMISSIONER BUREAU OF RESOURCE PROTECTION
GLENN HAAS, ACTING ASSISTANT COMMISSIONER
August 12, 2010 Appendix B
Summarizes the Present On-Site Subsurface Wastewater Disposal System Loads, and the Loading Reductions that would be Necessary to Achieve the TMDL by Reducing On-Site Subsurface Wastewater Disposal System Loads, Ignoring All Other Source
30

reduction in loading from this source to the main basin of Lewis Bay (Watershed 16) and an 80% reduction from this source to Hyannis Inner Harbor (Watershed 13). The distribution of tidally-averaged nitrogen concentrations associated with the above thresholds analysis is shown in Figure VIII-1.
Lewis Bay Estuary: Watershed nitrogen loads to Lewis Bay were sequentially lowered, using reductions in septic effluent discharges only, until the nitrogen levels reached the threshold level at the sentinel station chosen for the Lewis Bay Embayment System (BHY-3 located in the eastern basin of Lewis Bay), and at the secondary stations in Uncle Roberts Cove, Hyannis Inner Harbor and Mill Creek. It is important to note that load reductions can be produced by reduction of any or all sources or by increasing the natural attenuation of nitrogen within the freshwater systems to the embayment. The load reductions presented below represent only one of a suite of potential reduction approaches that need to be evaluated by the community. The presentation is to establish the general degree and spatial pattern of reduction that will be required for restoration of this nitrogen impaired embayment.
As shown in Table VIII-2, the nitrogen load reductions within the system necessary to achieve the threshold nitrogen concentrations required using: 1) Existing Removal Scenario B (as requested by the Towns of Yarmouth and Barnstable) with 2) additional removal of septic N loading to produce an 80% total reduction in loading from this source to the main basin of Lewis Bay (Watershed 16) and 3) an 80% reduction from septic N Loading to Hyannis Inner Harbor (Watershed 13). The distribution of tidally-averaged nitrogen concentrations associated with the above thresholds analysis is shown in Figure VIII-1.
31

Tables VIII-3 and VIII-4 provide additional loading information associated with the thresholds analysis. Table VIII-3 shows the change to the total watershed loads, based upon the removal of septic loads depicted in Table VIII-2. Removal of septic loads from Existing
Table VIII-2. Comparison of sub-embayment watershed septic loads (attenuated) used for modeling of present and threshold loading scenarios of
the Lewis Bay system. These loads do not include direct atmospheric deposition (onto the subembayment surface), benthic flux, runoff, or fertilizer
loading terms.
sub-embaymentpresent
septic load (kg/day)
threshold septic load
(kg/day)
threshold septic load %
changeLewis Bay 26.490 5.299 -80.0%
Uncle Roberts Cove 0.214 0.214 0.0%Mill Creek 13.570 1.926 -85.8%
Hyannis Inner Harbor 6.847 1.808 -73.6%1
Snows Creek 7.970 9.088 +14.0%Stewarts Creek 21.564 24.178 +12.1%
Surface Water SourcesChase Brook 2.488 2.479 -0.3%
Mill Pond 10.425 10.068 -3.4%Hospital Creek/Hyannis Inner 1.907 0.326 -82.9%1 Hyannis Inner Harbor is a combination of Hyannis Inner Harbor watershed (13),
and Wells Mary Dunn watershed (6) thus the 80% reduction in septic loading for the threshold does not result in a direct 80% reduction in septic loading.
Response:Comment (5) MassDEP was unaware of the revision which you supplied as part of your comment (see attachment) at the time the public meetings for this project were advertised and conducted. Revisions have been made to the TMDL document (Appendix B) based on the information in the attachment.
32

From: Charles Spooner [[email protected]]Sent: Friday, October 22, 2010 3:39 PMTo: Ackerman, Michael (DEP); Charles SpoonerSubject: Lewis Bay TMDL Comments
Michael T. AckermanMassachusetts Department of Environmental ProtectionBasin Planning Section627 Main StreetWorcester MA 01608
Dear Mr. Ackerman:
Thank you for the opportunity to review the DRAFT Lewis Bay System and Halls Creek Total Maximum Daily Loads For Total Nitrogen (Report #96-TMDL-18 Control #314) dated August 12, 2010.My comments follow. I hope that they may help establish the TMDL as the basis for future planning and state oversight, and local response.
First, the draft report is clear, representing what appears in the December, 2008 final report “Linked Watershed-Embayment Model to Determine Critical Nitrogen Loading Thresholds for the Lewis Bay Embayment System, Barnstable/Yarmouth, MA”. The one exception: I found no tables in the MEP Technical Report labeled either ES-1 or ES-2. These are cited in the draft document. [Comment 6]
One regulatory linkage might be clarified in the TMDL. How and when the pathogen TMDL that is noted as being outside the scope of this report will be addressed is part of the overall water quality picture and, I believe, should be noted. [Comment 7]
The third paragraph on page iii states that “… N loading reductions will not be necessary in the watersheds of Snows Creek, Stewarts Creek, Uncle Roberts Cove, and Chase Brook.“ I suggest also noting that the TMDLs for these embayments are set at existing N load levels. This might also be the place to underscore that both Snows Creek and Stewarts Creek have among the highest N concentrations in the Lewis Bay system. They are also projected to be heavily impacted by future growth as seen in the build-out scenario described in Table IV-6. [Comment 8]
In contrast to TMDLs for Snows Creek, Stewarts Creek, Uncle Roberts Cove, and Chase Brook, Halls Creek has an allowable N load that is set higher than the current loading. This feature of the TMDL seems unwise. The Technical Report (section VII .3 on page 186) notes that allowing load increases is the exception in the estuaries the MEP has addressed and specifically notes that the load increases presented “… represent only one of a suite of potential approaches that need to be evaluated by the community.” I recommend that Halls Creek be capped at the existing N load level. If it is not, then it might be interpreted as a special backsliding privilege for Hyannisport, so the logic for an increased N load should at least be explained. [Comment 9]
The TMDL allocates substantial reduced loads to the benthic nitrogen flux in three specific areas, Hyannis Inner Harbor, Lewis Bay, and Uncle Roberts Cove. The discussion of this in the Technical Report is skimpy and curiously embedded in the discussion of the build-out scenario. The draft document replicates this text. Neither document presents a very compelling understanding of how well or how quickly these reductions will become apparent. The draft TMDL report might emphasize that the TMDL for this N load represents a 20% reduction in sediment loads and that the TMDL target accounts for 25% of the allowed N load in the Lewis Bay system. This means that it is an important source to reduce. I recommend that special monitoring and even research should be put in place to better understand how appropriate the assumptions on its dissipation are. It should be
33
stressed that if this load does not reduce, then additional pollution controls in other areas will be needed. [Comment 10]
I am pleased to see that you have noted the need for an implementation-monitoring program in the TMDL. I find the absence of monitoring data to be the single biggest defect in the Technical Report, and a TMDL monitoring program can be a good place to make both older data and the planned new data available. The proposed language in the draft could be strengthened by tightly referencing the measures that will be used to gauge the success of implementation. This section of the draft could also be strengthened by noting that the monitoring may be needed to update the current conditions should implementation be delayed and growth in the loads in the watershed begin to increase the load reductions that are needed. Rather than suggest that this monitoring will take time to implement, I would suggest phrasing it in such a way that it adds urgency to the undertaking and reminds everyone that DEP is serious about the TMDL’s implementation.
There are several aspects of the TMDL that are the opportunities and responsibilities of the town governments. Perhaps they should be emphasized under a special heading
• Page 22 notes that the TMDL “loading reduction scenario is not the only way to achieve the target threshold N concentrations. Barnstable and Yarmouth are free to explore other loading reduction scenarios through additional modeling as part of the Comprehensive Wastewater Management Plan (CWMP). It must be demonstrated, however, that any alternative implementation strategies will be protective of Lewis Bay…”
• The draft notes that both Barnstable and Yarmouth have been among the fastest growing towns in the Commonwealth. This is particularly important because, as the Technical Report makes clear, the land use plans of the two towns will increase N loads from watershed sources on average, by 30% above current levels used to plan the TMDL. Given the load increases that are likely with planned growth and the role that sewers often play in sparking growth, a further description of the interplay between the TMDL, the expected CWMP, and state permits would be in order in this document.
• The list of other programs noted under the reasonable assurance section of the draft does not describe that the towns are responsible for coordinated efforts to harness them to meet the load reduction challenge. At least, I am not aware of any other planning vehicle.
• The application of many of these programs may be unknowable, and the list of them as opportunities on pages 22 and 23 of the draft may have to suffice. There is a note on page 23 of the draft, however that confirms that the two towns are covered by Phase II stormwater (MS4) control program requirements, but it does not describe the potential role of that program in quantifying and in controlling N loads in the Lewis Bay System. There appears to be no expectation in the draft document that the CWMP or any other planning program in response to the MEP Implementation Guidance will (or should) consider stormwater quality beyond the impervious surfaces at the facilities they require. Given the inevitable problems towns will face in funding the WWTF systems implied by this TMDL and the 25-YEAR implementation suggested (on page 10-1) in the draft CWMP, it would appear to be an opportunity for DEP to outline opportunities and obligations stemming from the MS4 program.
Sincerely,Charles S. Spooner, P.E.176 Thacher Shore RdYarmouth Port MA 02675
34

Response:Comment (6) The draft MEP Technical Report does not contain an Executive Summary (no tables ES-1 or ES-2). The final MEP Technical Report does contain them and can be found at http://www.oceanscience.net/estuaries/reports.htm. Please note that in the case of this MEP Technical Report the above referenced ES-1 would apply to ES-1 and 2 and ES-2 would apply to ES-3 and 4.
Comment (7) MassDEP (for a variety of reasons) has no current plans to write a bacteria TMDL for Lewis Bay specifically. There is an EPA approved basin wide Pathogen TMDL for the Cape Cod Basin (96).
Comment (8) The suggested language has been added to the TMDL.
Comment (9) The Target Threshold Watershed Load (Tables 4 and 5) and the TMDL (Table 5) for Halls Creek have been adjusted to Present Total Watershed Load levels.
Comment (10) In most cases (but certainly not all) when comparing existing benthic flux loads (ES-1 and 2) to post TMDL benthic flux loads (ES-3 and 4), the flux approaches zero. Also, please note in the Implementation Plans section “The CWMP should include a schedule of the selected strategies and estimated timelines for achieving those targets. However, the MassDEP realizes that an adaptive management approach may be used to observe implementation results over time and allow for adjustments based on those results.”
35

October 29, 2010
Michael AckermanDepartment of Environmental ProtectionDivision of Watershed Management627 Main Street 2 FloorWorcester, MA 01608
Subject: Lewis Bay Draft TMDL – Comments from the Town of Yarmouth
Dear Mr. Ackerman:
The Town of Yarmouth recently submitted their Expanded Environmental Notification Form (ENF) and Draft Comprehensive Wastewater Management Plan (CWMP) in accordance with the Massachusetts Environmental Policy Act (MEPA) regulations. The expanded ENF and Draft CWMP were also filed with the Cape Cod Commission (CCC) for joint review with their Determination of Regional Impact (DRI) process.
The town is pursuing a long-term, multi-phased wastewater management program with centralized treatment to reduce nutrient loading to coastal estuariess, to meet the anticipated total maximum daily loads (TMDL’s) for those estuaries, to protect the towns drinking water sources, and to support viable business centers along Route 28. The Lewis Bay Watershed is one of three estuary systems located within the town boundaries and has been studied by the Massachusetts Estuaries Project(MEP). At this time, the Town of Yarmouth has reviewed the Final Lewis Bay Draft TMDL Report and has concluded that Yarmouth’s CWMPwill meet the threshold nitrogen loadin Lewis Bayand therefore meet the proposed TMDL.
In section eight of the Expanded ENF/Draft CWMP, the town summarizes the nitrogen threshold loads for Lewis Bay which it shares with the Town of Barnstable and Yarmouth’s proposed sewer service area in that watershed. It discusses the results of the threshold nitrogen loads found in the MEP report and runs a scenario to determine if the proposed sewer service area will remove sufficient nitrogen to meet those threshold loads. In the preferred scenario, the threshold loads are exceeded by 0.01mg/l to 0.02mg/l total nitrogen in the sentinel and check stations for the bay. The table below shows the results of the total nitrogen threshold concentrations and the result of the preferred scenario.
Sentinel and Check Stations – Lewis Bay, Build-out Flow – Total Nitrogen Concentrations
Sub-Embayment Monitoring Station
Threshold Concentration
(mg/l)
-Preferred Scenario-
Scenario D Concentration
(mg/l)
Result
Lewis Bay – Sentinel Station BHY – 3 0.38 0.39 0.01 mg/l OverHyannis Inner Harbor – Check Station BH-1
0.50 (average) 0.51 0.01 mg/l OverHyannis Inner Harbor– Check Station BH-2
Uncle Roberts Cove– Check Station BHY – 4 0.40 0.41 0.01 mg/l OverMill Creek– Check Station MC-1 0.50 0.52 0.02 mg/l Over
Source: Lewis Bay MEP Report, Table IX-40
36

As shown in the above table, Scenario D for the Lewis Bay watershed misses by a slight margin. Based on discussions with the MEP team and MassDEP, it is believed that the Yarmouth sewershed described in Scenario D will meet the nitrogen removal targets once the proposed sewer services areas in theBarnstable portion of Lewis Bay are included in this model scenario. To date, only the existing sewers in Barnstable are part of Scenario D MEP model. Barnstable is proposing to update these model runs with their proposed sewer areas.
Since the town has created a sewer scenario that removes almost all of the wastewater load in the Yarmouth portion of Lewis Bay and elected to recharge the treated effluent in another watershed outside of the Lewis Bay, the town feels that it has accounted for more than its share of the wastewater load. As a result, the town would like to request that the MEP model be re-run to include all of Barnstable’s proposed Lewis Bay sewer areas.
The town of Yarmouth would like to request that this updated model scenario be conducted prior to the “final” TMDL being set so that both communities can demonstrate that they have recommended programs to meet these loadings. It is important for Yarmouth and the success of their wastewater management program that this final scenario be run so the town can present a model scenario that meets the TMDL. [Comment 13]
Very truly yours,
George Allaire, P.E. Director of Public Works
cc: Robert C. Lawton, Jr., Town Administrator
Response:Comment (13) MassDEP realizes that the towns of Barnstable and Yarmouth need to work this out. However, MassDEP needs to keep this project moving forward.
37

38

39

40

41
