elibrary.gbrmpa.gov.auelibrary.gbrmpa.gov.au/jspui/bitstream/11017/3159/1/cyp... · web viewthe...
TRANSCRIPT

Howley, C.1, Devlin, M.2, Petus, C. 2, da Silva, E.D2
1. Griffith University Australian Rivers Institute 2. James Cook University TropWaterOctober 2015
1
WATER QUALITY IN PRINCESS CHARLOTTE BAY FLOOD PLUMES and EASTERN CAPE YORK PENINSULA
FLOOD PLUME EXPOSURE:
2012 – 2014 A Report to the Great Barrier Reef Marine Park Authority Marine Monitoring Programme

© Howley Environmental Consulting 2017Published by the Great Barrier Reef Marine Park AuthorityISBN 978 09953731 29
Water Quality in Princess Charlotte Bay Flood Plumes and Eastern Cape York Peninsula Flood Plume Exposure: 2012-2014 is licensed for use under a Creative Commons By Attribution 4.0 International licence with the exception of the Coat of Arms of the Commonwealth of Australia, the logos of the Great Barrier Reef Marine Park Authority, Griffith University and TropWATER, any other material protected by a trademark, content supplied by third parties and any photographs. For licence conditions see: http://creativecommons.org/licences/by/4.0
This report should be cited as:
Howley C., Devlin M., Petus C., and da Silva E.D. 2017, Water Quality in Princess Charlotte Bay Flood Plumes and Eastern Cape York Peninsula Flood Plume Exposure: 2012-2014. A report for the Great Barrier Reef Marine Park Authority. Great Barrier Reef Marine Park Authority. 37pp.
A catalogue record for this publication is available from the National Library of Australia
Front cover image: Normanby River mouth in flood 2012 © C. Howley; Wharton Reef, Princess Charlotte Bay during flood event 2009 © A. Hogbin for CYMAG Environmental.
DISCLAIMER
While reasonable efforts have been made to ensure that the contents of this document are factually correct, Howley Environmental Consulting do not make any representation or give any warranty regarding the accuracy, completeness, currency or suitability for any particular purpose of the information or statements contained in this document. To the extent permitted by law Howley Environmental Consulting shall not be liable for any loss, damage, cost or expense that may be occasioned directly or indirectly through the use of or reliance on the contents of this document.
Comments and inquiries on this document should be addressed to: Christina HowleyPhone: +61 7 40695229 Email: [email protected]
This project is supported by the Great Barrier Reef Marine Park Authority through funding from the Australian Government Reef Program, the Reef 2050 Integrated Monitoring, and Reporting Program and James Cook University.

AcknowledgementsThe monitoring of flood plumes at Princess Charlotte Bay over three years was the result of the collaboration and support of many organisations and individuals. Principal funding for the 2012-2014 helicopter sampling costs, the combined CSIRO – JCU 2013 field trip and laboratory analysis was provided by the Marine Monitoring Program and we thank Hugh Yorkston and Katherine Martin (GBRMPA) for their support. Funding for the 2014 plume monitoring was also provided by the Australian Government Reef Trust (via Balkanu Cape York Development Corp), the South Endeavour Trust, and South Cape York Catchments (SCYC). We also thank Jeff Shellberg and Sue Marsh for their volunteer assistance with field sampling and preparations. Bungie Scott Helicopters and Dr. Shellberg helped pioneer the methods of flood plume sampling by helicopter, which allowed us to respond quickly to remote flood events. In addition to helicopter sampling, sampling of the 2013 flood plume by boat was conducted by Jenn Debose (JCU), Kadija Oebelkheir (CSIRO), Phillip Ford (CSIRO), Caroline Petus (JCU) and Nagur Cherukuru (CSIRO) and the nutrient and TSS analytical results are included in this report. Logistical assistance and accommodation during flood plume sampling was provided by the Bassini family (Lama Lama traditional owners) of Silver Plains Station. The PCB water quality monitoring and flood plume assessment work has been undertaken as part of a Griffith University PhD project assessing the drivers of water quality in the Normanby Basin and Princess Charlotte Bay.

Executive Summary
Coral reefs in the far Northern Cape York Peninsula (CYP) region of the Great Barrier Reef (Reef) have maintained moderate to high live coral cover despite losses of up to 50% in other regions of the Reef. However, development impacts pose a significant and growing threat to water quality. Documenting the flux of sediment and nutrients from Cape York rivers, and mapping the areas regularly inundated by the river flood plumes, is crucial to improve our understanding of their influence on Reef coral reef and seagrass health, Crown-of Thorns starfish outbreaks, and the potential impacts of changing land use.
This study conducted as part of the Marine Monitoring Program and a Griffith University PhD project mapped and monitored water quality in flood plumes from the Normanby Basin at Princess Charlotte Bay (PCB) over three wet seasons. The Normanby Basin in south eastern CYP is the fourth largest catchment (24,550 km2) discharging to the Reef lagoon and the largest catchment in Eastern Cape York. During flood events in March 2012, January 2013 and April 2014, suspended sediment, nutrients, chlorophyll-a, phytoplankton and coloured dissolved organic matter (CDOM) samples were collected along transects from the Normanby, Bizant and Kennedy estuaries to the edge of the flood plume. Sampling began as the peak of the flood waters reached PCB and continued for one (2012 and 2014) to 4 (2013) days. PCB flood plume extents, and the areas exposed to primary, secondary and tertiary plumes, were assessed using Moderate Resolution Imaging Spectroradiometer (MODIS) satellite imagery and aerial surveys. The plume classification method developed by Álvarez-Romero et al. (2013) was also used to produce plume frequency maps for all of eastern Cape York for the 2012 to 2014 wet seasons.
Total event discharge for the 2012, 2013 and 2014 flood events was below average compared to annual Normanby River flood events recorded over the 10-year period of record at the Kalpowar gauge on the Normanby distributary. The March 2012 PCB event was a minor flood (total event discharge 543,800 ML at Kalpowar) with a freshwater flood plume flowing north from the Normanby, Bizant and Kennedy River mouths, extending approximately 22 kms into PCB and inundating an area of approximately 350 km2. The January 2013 flood, associated with ex-tropical cyclone Oswald (total event discharge 859,659 ML), flowed north and then east past the Flinders Isles and Clack Reef driven by north-westerly winds. The freshwater plume was 1.5 m thick 4 km from the mouth of the Normanby with an approximate area of 1400 km2 on the 30th January. In April 2014, the passage of Cyclone Ita resulted in a total event discharge of 1,082,427 ML at Kalpowar Crossing. The flood plume flowed to the northeast along the coast converging an estimated area of at least 1100 km2. During each of the flood events, the Kennedy and Bizant rivers had a distinct plume that merged with the Normanby plume.
There are no gauges on the lower Kennedy or Bizant rivers to measure discharge. Event discharge volumes for the Normanby Basin are calculated based on the gauge

at Kalpowar Crossing, 75 km upstream from the mouth of the Normanby river, which represents less than 50% of the floodwater discharged to PCB. Due to this lack of end-of-system discharge data, loads of nutrients and sediments discharged to the Bay cannot be accurately calculated.
Total suspended sediments (TSS) during the three flood events ranged from 26 mg/L to 150 mg/L at the Normanby, Kennedy and Bizant River mouths. TSS at the river mouths was strongly correlated with total event discharge (rs = 0.879, p<0.001) and maximum concentrations were detected during the larger 2013 and 2014 events. Salinity mixing diagrams show a rapid decrease in TSS within the 0 - 5 salinity zone for all events (Figure 7). Beyond 6 km offshore all TSS concentrations were <10 mg/L and fine sediments (<63 µm) comprised 99% of the sediment fraction. Although the particle size composition of the <63 µm fraction was not assessed, other Reef flood plumes are composed primarily of fine clays (<10 µm) beyond the initial low salinity zone (Bainbridge et al 2012).
A maximum TN of 51.26 µM/L was measured at the Normanby estuary in 2013. TN concentrations within the flood plumes ranged from 8.64 µM/L to 39.05 µM/L. Dissolved organic nitrogen (DON) accounted for between 51% (2013) to 73% (2014) of flood plume TN. Flood plume total phosphorous (TP) concentrations ranged from 0.161 µM/L to 3.552 µM/L. Particulate phosphorous (PP) accounted for an average of 58% of TP in 2014 compared to 20% in 2012 and 19% in 2013. Dissolved organic phosphorous (DOP) accounted for an average of between 22% (2014) to 44% (2012). The particulate nutrient fractions generally settled out of the flood plume (or were subjected to biotransformation) less than 20 km from the mouth of the rivers. The outer reaches of the flood plumes, which inundate coral reefs such as Corbett and Clack to the northeast and the Cliff Isles to the west, were primarily composed of dissolved organic and inorganic nutrient fractions.
Chlorophyll-a concentrations within the three PCB flood plumes ranged from 0.25 µg/L to 8.82 µg/L 1 (mean 1.70 ± 1.86 µg/L) compared to maximum concentrations outside of the flood plume of 0.87 µg/L. Maximum chlorophyll concentrations were detected in 2013. Chlorophyll-a concentrations were low across the 2014 flood plume (<1.10 µg/L). Chlorophyll trends across the plumes varied, however a mid-salinity increase in chlorophyll and phytoplankton densities was observed in all three flood plumes. This mid-salinity increase is attributed to increased light availability as suspended sediments decline (Dagg et al 2004, Devlin et al., 2013). Turner et al (1990) identified a suspended sediment threshold of 10 mg/L, above which there is insufficient light for phytoplankton growth. This threshold generally applied at PCB, however in 2013 chlorophyll concentrations as high as 5.34 µg/L were detected at TSS of 15 to 20 mg/L.
Phytoplankton densities and species diversity varied for each plume. Maximum phytoplankton densities were measured in 2013, ranging from 32,429 cells/L to 4,140,848 cells/L, while densities outside of the freshwater plume ranged from 18,299 cells/L to 35,862 cells/L. Diatomacea was the dominant species group all

years, comprising up to 97% of phytoplankton. Skeletonema sp. were the most prevalent species in 2013, comprising over 50% of most samples. Skeletonema sp. were not detected in PCB outside of the freshwater plume and were not recorded in 2012 or 2014 samples. Dominant species in the 2014 flood plume included the cyanobacteria Trichodesmium erythraeum, which was recorded at a maximum density of 70,752 cells/L but was not recorded in 2012 or 2013.
Although comparisons of river plume concentrations are subject to multiple limitations, when the results from the three Normanby flood plumes are compared against Reef-wide flood plume concentrations (Devlin et al 2012), the mean TSS, TN, DIN, PN, DON, DOP and chlorophyll-a concentrations exceed mean Reef concentrations. Mean TSS concentrations within Reef plumes were highest at the Burdekin (29 mg/L), followed by the Fitzroy (25 mg/L) and Normanby Rivers (21 mg/L). High mean TSS relative to other Reef plumes may be related to increased discharge volumes (which are not measured at the Normanby, Kennedy or Bizant river mouths), but is also likely to be influenced by the high levels of gully erosion present across all three of these catchments. Surprisingly, concentrations detected during a minor flood event from the Annan River in southeastern Cape York were amongst the highest suspended sediment concentrations of all the available plume data, ranging from 20 to 110 mg/L within the plume (Davies & Eyre 2005; mean concentrations not available). The Annan catchment has been subject to a high level of historic mining disturbance (Shellberg et al 2015).
When compared against other Reef flood plumes, the Normanby Basin plumes had the second highest mean DON and PN concentrations, and the third highest mean plume NOx concentration, despite low levels of horticulture and cropping (<1% of total catchment area). Mean PN concentrations in the Normanby plume were second only to the Burnett River, and similar to mean PN from the Fitzroy. As with TSS, PN concentrations in the Normanby catchment are likely to be influenced by accelerated rates of erosion. DIN concentrations in Normanby plumes are within a similar range to those discharged from the Tully River, where 15% of the catchment is under horticulture or sugarcane production. Mean DIP concentrations in the Normanby are amongst the lowest of all the river plumes.
Field observations and satellite images show that seagrass meadows at the mouth of the Normanby and Kennedy rivers and coral reef and seagrass ecosystems at the Flinders Isles are regularly inundated by Normanby Basin flood plumes and are therefore most vulnerable to future changes in flood plume water quality. Fine clays and dissolved nutrients transported by average magnitude Normanby Basin flood events can also inundate Wharton, Corbett and Clack Reefs and some outer barrier reefs. While these reefs appear to be in moderate to good condition, nutrients delivered by flood plumes are likely to be driving the current outbreaks of Crown-of-thorns starfish on both Corbett and Clack Reef (Brodie et al 2005).
Expanding horticultural land-use, road development and large scale clearing within the Normanby Basin pose a growing threat to water quality in the Normanby River

and the ecosystems of PCB. Strict application of “Best Practice” management actions to developments within the catchment and regular monitoring of downstream water quality and ecosystem condition is critical for the protection of this valuable region of the Reef. Further research on the sources and fate of nutrients and sediments in CYP Rivers and the resulting flood plumes is also necessary to improve our understanding of the drivers of COTS outbreaks in this region and the condition and long-term management of CYP marine ecosystems.

Table of ContentsExecutive Summary.......................................................................1Table of Contents..........................................................................51.0 Introduction...........................................................................1
1.1 Study Area..................................................................................................12. Methods...............................................................................3
2.1. Mapping of the eastern CYP plume waters over three wet seasons.........................32.2 PCB Water Quality Monitoring and Plume Mapping over 3 Wet Seasons..............4
2.2.1 Quality Control Samples..........................................................................63 RESULTS.............................................................................7
3.1. Mapping of eastern CYP plume waters over three wet seasons..............................73.2 PCB Flood Plume Mapping and Water Quality Monitoring over 3 wet seasons....10
3.2.1 Flood Event Discharge and Plume Characteristics....................................103.2.2 Turbidity and suspended sediments...........................................................143.2.3 Nutrients.............................................................................................163.2.4 Chlorophyll-a and Phytoplankton................................................................17
4.0 Comparison with other Reef Plumes.......................................195.0 Discussion & Conclusion.......................................................236.0 Bibliography........................................................................26

List of Tables
Table 1: Number of water samples collected within each flood event................................6Table 2: Areas (km2) and percentage (%) of the Cape York NRM exposed to different categories of river plume frequency...........................................................................10Table 3: Annual and Flood Event Discharge1, Wind Speed, Wind Direction and Temperature for 2012, 2013 and 2014 Flood Events.......................................................................13Table 4: Minimum, maximum and mean TSS, nutrient and chlorophyll-a concentrations for 2012, 2013 and 2014 PCB flood plumes and PCB outside flood plumes.........................14Table 5: Mean Concentrations (±stdev) of Water Quality Parameters from PCB flood plumes (Normanby Basin) compared with Herbert, Tully, Burdekin, Fitzroy And Burnett River Flood Plumes.................................................................................................................. 22
List of Figures
Figure 1 : Lower Normanby Basin and Princess Charlotte Bay showing estuary and Kalpowar Crossing sampling locations.........................................................................2Figure 2 : Princess Charlotte Bay Flood Plume, February 2007.......................................3Figure 3 : Princess Charlotte Bay flood plume sampling locations with MODIS images of the 2012 plume (3a) 2013 (3b) and 2014 (3c) flood plumes. No clear MODIS images of the 2012 plume were available due to heavy cloud cover. See Figure 4 for estimated primary, secondary and tertiary plume areas for each year..........................................................5Figure 4: PCB flood plume exposure maps for the 2012, 2013 and 2014 events with sample locations. Remote sensing imagery extracted from the regional algorithms in Cape York has not been fully validated and as such, errors in the multi-annual images can be problematic, particularly for the secondary and tertiary plumes. The maps above have been developed from the seven days around each main plume event with the Colour class representing the weekly MIN for the seven day period shown in the top right of each image. Boxes correlate to the areas shown in Figures 3a, b and c. (produced by Dieter Tracey, JCU)....................6Figure 5a: Extent and frequency of all water types (CC1 - CC6) reported as normalised seasonal value for the wet seasons 2011-12, 2012-13 and 2014-15. The frequency number represent the normalised number of weeks per wet season an area or pixel has been exposed to the primary plume water type (max: 1 = 22 weeks)........................................8Figure 6: Hydrograph showing daily discharge at the Kalpowar Crossing gauge (105107) for the period of record (2005- 2015) showing the 2012, 2013 and 2014 flood events (Source: DNRM, http://watermonitoring.dnrm.qld.gov.au/host.htm)..............................................12Figure 7: TSS, chlorophyll-a, TN, PN, DON, DIN, PP, DOP and DIP plotted as a function of salinity for the 2012, 2013 and 2014 PCB flood plumes................................................15Figure 8: Nitrogen and Phosphorus Species Composition.............................................16
1.0 Introduction
Increased loads of riverine suspended sediments, nitrogen and phosphorous have contributed to the widespread degradation of the Great Barrier Reef (Reef) lagoon (Furnas 2003; Fabricius et al. 2005; Woolridge et al. 2006; Kroon et al 2011) where total coral cover has declined by 50% since 1985 (De’ath et al. 2012). In contrast, the coral reefs in the far northern Cape York Peninsula (CYP) region of the Reef have maintained moderate to high (20 – 50%) live coral cover (http://www.aims.gov.au/web/guest/reef-monitoring/cape-york-sector-2013) and higher species diversity than adjacent regions (Fabricius et al 2005). Rivers in this region may provide the best example of pre-anthropogenic sediment and nutrient loads discharged to the Reef (Brodie et al. 2008, Brodie et al. 2011, Brodie et al. 2012); however, impacts from over-grazing, road-erosion, mining, altered fire regimes and the rapid expansion of horticulture pose a significant and growing threat to water quality. Documenting the flux of sediment and nutrients from Cape York rivers is crucial to improve our understanding of their influence on coral reef and seagrass health, Crown-of Thorns outbreaks, and the potential impacts of changing land use.
Prior to 2012, no CYP flood plumes had been monitored, with the exception of a small (2km radius) plume from the Annan River associated with a minor flood event (Davies and Eyre 2005) and sampling of flood water at Boulder Reef in 1998 associated with a flood event in the Endeavour River (Davies and Hughes 1983). These current studies provided the first records of the sediment and nutrient concentrations discharged from the Normanby Basin and the potential influence of these plumes on Reef ecosystems.
1.1 Study Area
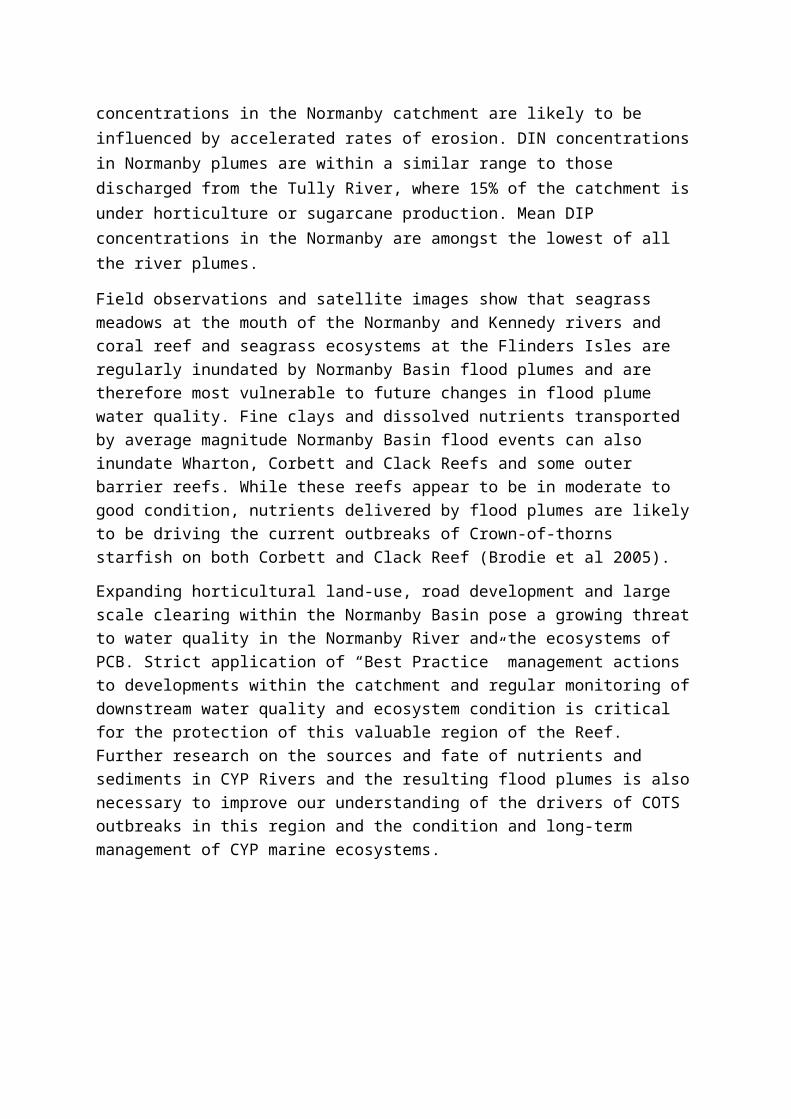
The Normanby Basin in south eastern CYP (-15.148°E 144.359°S) is the fourth largest catchment (24,550 km2) discharging to the Reef lagoon. The Basin includes the Normanby, Laura, Kennedy, Hann, Mossman, and Morehead Rivers, plus three distributaries - the Kennedy, Normanby and Bizant (Figure 1). The average annual discharge rate from the Normanby distributary is estimated at 2,969 GL, based on discharge data calculated from the Queensland Department of Natural Resources and Mines (DNRM) gauging station at Kalpowar Crossing (105107A), which is situated approximately 70 km upstream from the mouth of the Normanby River. The Kalpowar gauge captures less than 50% of Normanby Basin discharge and does not include discharge from the extensive coastal floodplains or from the Kennedy distributary (Wallace et al 2012, Brooks et al 2013).
The Normanby River discharges into the Reef Lagoon at Princess Charlotte Bay (PCB). PCB supports over 11,446 ha of coastal and reef-top seagrass meadows providing important dugong (Dugong dugon) and marine turtle feeding grounds
1

(CRC Reef Research Centre 2002, Dobbs et al. 2008, Carter et al. 2012). Reefs in northern PCB have significantly higher levels of coral cover, coral species diversity and fish abundance than near shore reefs in the adjacent Wet Tropics region of the Reef (Fabricius et al 2005). COTs outbreaks, which may be linked to nutrient enrichment from terrestrial run-off (Brodie et al. 2005) are currently recorded at Clack and Corbett Reefs, the two reefs most frequently inundated by Normanby River floodwater and at Reef 13-124 adjacent to Corbett Reef (http://www.aims.gov.au/web/guest/reef-monitoring/cape-york-sector-2013). Following major flood events, plumes of fine sediment, nutrients and organic matter can extend from the Normanby, Kennedy and Bizant estuaries to the outer Reef (Figure 2).
Figure 1 : Lower Normanby Basin and Princess Charlotte Bay showing estuary and Kalpowar Crossing sampling locations.
2

Figure 2 : Princess Charlotte Bay Flood Plume, February 2007
2. Methods
2.1. Mapping of the eastern CYP plume waters over three wet seasons
The method of Álvarez-Romero et al. (2013) was used to classify three years of Moderate Resolution Imaging Spectroradiometer (MODIS) images and to produce plume frequency maps for the wet season 2012 (i.e., December 2011 to April 2012) to the wet season 2014 (i.e., December 2013 to April 2014). In this method, daily MODIS Level-0 data focused on the summer wet season (December to April inclusive) are converted into true colour images with a spatial resolution of about 500m × 500m using SeaDAS. True colour images are then spectrally enhanced (from Red-Green-Blue to Hue-Saturation-Intensity colour system) and classified into six colour classes corresponding to a gradient of six distinct plume water types across river plume waters through a supervised classification using typical colour signature of river plume waters in the Reef.
Each of the defined six colour classes (CC1–CC6) is characterised by different concentrations of optically active components (TSS, CDOM, and chlorophyll-a) which influence the light attenuation and can vary the impact on the underlying ecological systems. CC1 to CC4 (so called Primary water type) correspond to the brownish turbid water masses with high sediment and CDOM concentrations, CC5 (Secondary water type) to the greener water masses with lower sediment concentrations favouring increased coastal productivity, and CC6 (Tertiary water type) is the transitional water mass between plume waters and marine waters (Devlin et al., 2015). The six plume water types are then combined into one river plume water type to map the full extent of the river plume. Coral reefs and land areas were masked out and weekly water type composite maps (22 composites per wet season) were created to minimize the amount of area without data per image due to masking of dense cloud cover, common during the wet season, and intense sun glint. Weekly composites were thus overlaid (i.e., presence/absence of plume waters) and
3

normalised, to compute seasonal normalised maps of frequency of river plume and primary plume water type occurrence.
It should be, however, noted that the method of Alvarez-Romero et al. (2013) didn't include colour signatures of Cape York waters and, that this method hasn’t been validated yet in the Cape York NRM region. In addition, the frequently turbid waters in the PCB region due to wind-driven sediment re-suspension and tide-driven sediment plumes may falsely influence the river plume extent and frequency maps. All mapping outputs from this method should be taken with care, even though the method has been shown to work well in other NRM regions of the Reef.
2.2 PCB Water Quality Monitoring and Plume Mapping over 3 Wet Seasons
Flood events (flow exceeding the 75th percentile of flow) in the Normanby Basin (total discharge ranging from 544 GL to 1084 GL) in March 2012, January 2013 and April 2014 created visible plumes of turbid water that extended out into PCB with the potential to inundate coral reefs and seagrass meadows (Figure 3; Figure 4). During each of these events, water quality samples were collected along a transect from the estuary to the outer plume reaches and flood plume extents were assessed using MODIS satellite imagery and aerial surveys.
During the March 2012, January 2013 and April 2014 flood events, water levels at Normanby Basin gauging stations and MODIS satellite images were monitored through the different stages of flooding across the catchment and in PCB. Flood plume sampling commenced after the peak floodwaters passed Kalpowar Crossing and satellite images showed a visible plume of turbid water extending into PCB. Samples were collected along the transect initiating in the mouth of the Normanby River out to the edge of the flood plume (Normanby plume transect). Samples were also collected from the Kennedy and Bizant estuaries and across the flood plume discharged from these rivers (Kennedy plume transect). Timing and locations of samples collected from the flood plume depended on the direction and extent of the flood plume and logistical limitations of getting across the plume. The location of the flood plume was determined by monitoring the previous day’s satellite images, visually assessing the plume by helicopter, and measuring surface water salinity levels across the Bay.
PCB plume sample sets were collected by helicopter on the 26th and 28th March 2012 along a 22 km Normanby plume transect and from the Bizant River and Kennedy River flood plume (Figure 3a). Weather conditions restricted sampling on the 27th. The 2013 plume samples were collected by helicopter and boat from the 29 th January to 1st February along a 33 km Normanby plume transect, from the Bizant and Kennedy River mouths and adjacent plumes, and to the east near Flinders Isles (Figure 3b). On the 16th and 18th of April 2014, samples were collected by helicopter along a 10.5 km Normanby plume transect and 19 km Kennedy plume transect
4

(Figure 3c). The majority of samples were collected from inside the visible plume, however additional samples were also taken outside the edge of the plume.
Samples taken by helicopter were collected by lowering a 2.5m pole and wide-mouthed sampling cup from the helicopter into the seawater, rinsing the sampling cup three times and then rinsing and filling the appropriate sterile sample bottles. Suspended sediment samples were collected with a DH48 isokinetic sediment sampler lowered into the seawater. To minimize the potential effect of the helicopter downdraft on water composition, the helicopter slowly moved forward over the surface of the water while samples were being collected, and rose to 15m while sample bottles were filled and measurements were taken from an additional sample cup. Salinity and temperature were measured with a Thermo-Orion 5-Star Multi-meter. Turbidity was measured on a Hach 2500P nephelometric turbidity meter (2012 and 2013 only). Samples collected at each sampling location included total and dissolved kjeldahl nitrogen and phosphorus (TKN, TKP, DKN and DKP), ammonium (NH4), nitrates and nitrites (NOx) and filterable reactive phosphorous (FRP), chlorophyll-a, total suspended sediments (TSS), coloured dissolved organic matter (CDOM) and phytoplankton. Additional samples were collected for herbicides (2012 only) and silicate (Si) analysis (2013 only). The number of samples collected for each event is listed in Table 1.
Figure 3: Princess Charlotte Bay flood plume sampling locations with MODIS images of the 2012 plume (3a) 2013 (3b) and 2014 (3c) flood plumes. No clear MODIS images of the 2012 plume were available due to heavy cloud cover. See Figure 4 for estimated primary, secondary and tertiary plume areas for each year.
5
3a
3b 3c
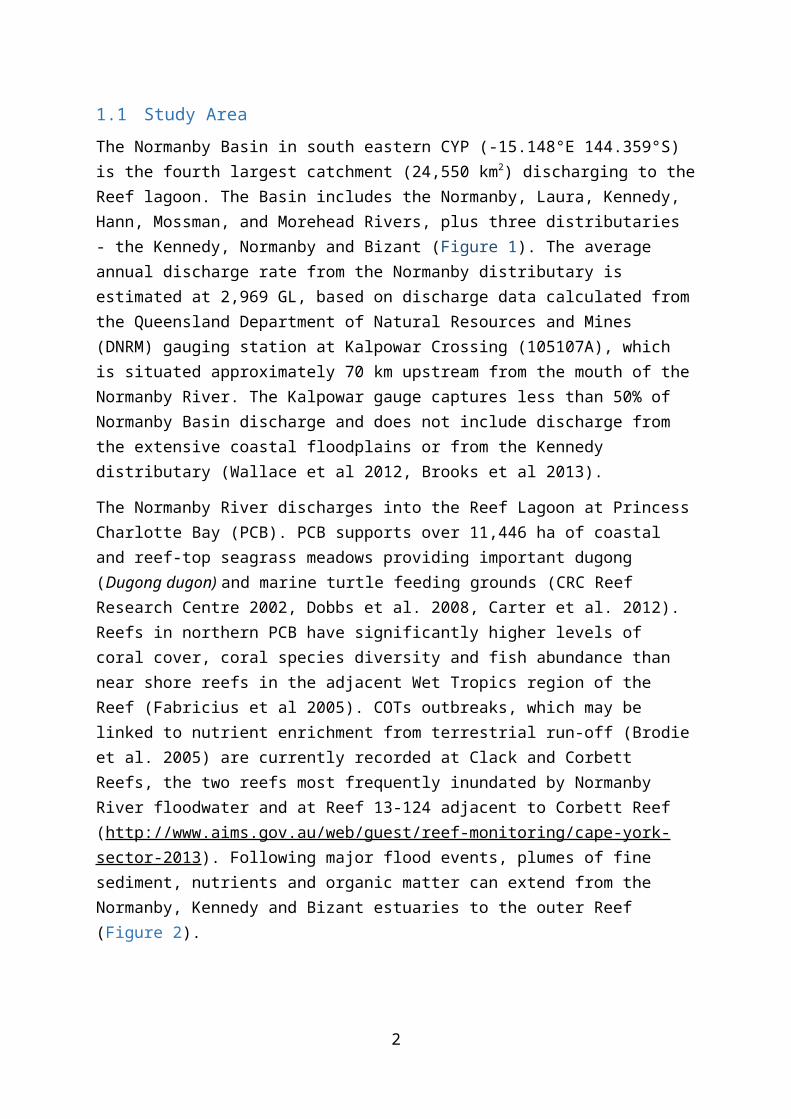
Figure 4: PCB flood plume exposure maps for the 2012, 2013 and 2014 events with sample locations. Remote sensing imagery extracted from the regional algorithms in Cape York has not been fully validated and as such, errors in the multi-annual images can be problematic, particularly for the secondary and tertiary plumes. The maps above have been developed from the seven days around each main plume event with the Colour class representing the weekly MIN for the seven day period shown in the top right of each image. Boxes correlate to the areas shown in Figures 3a, b and c. (produced by Dieter Tracey, JCU)
Table 1: Number of water samples collected within each flood eventFlood Event (year)
PCB Plume samplesTSS Nutrients1 Chlor-a Phytoplankton Silica
2012 13 13 13 52013 31 31 29 16 312014 10 10 10 8
1 TKN, TKP, TDN, TDP, NOx, NH3, FRP, DON, DOP, PN and PP
Samples were collected and analysed as per the flood plume sampling methods described in Devlin et al., 2012. All samples were kept on ice for the duration of the sampling trip and refrigerated (TSS, silica, phytoplankton) or frozen (nutrients and chlorophyll-a filters) until delivery at the lab. Plume water samples were shipped by refrigerated transport to the TropWater laboratory at James Cook University.
2.2.1 Quality Control SamplesA total of nine duplicate suspended sediment and nutrient samples and two duplicate chlorophyll-a samples were collected over the three events to assess field sampling variability and laboratory precision. The results showed relative percent differences (RPD) less than 12% for TN, NOx and FRP, providing a high level of confidence in the precision of these analyses. TSS, TP, PN and PP had RPD’s ranging from 23% to 41%, providing a lower level of confidence in the precision of these analyses. To
6

test for potential helicopter downdraft effects on concentrations, four paired suspended sediment samples were collected at Normanby estuary sites. The paired samples were collected from the mid-river channel by helicopter and from the adjacent bank with a 2.5m extended sampling pole. The mean RPD between the paired samples was 9.0%, which is comparable to the 11% mean RPD calculated for 11 sample pairs collected from the upper catchment from the mid-channel by bridge and the adjacent river banks (Howley, unpublished data). These results indicate that the helicopter downdraft did not significantly alter suspended sediment concentrations beyond natural cross-channel variations which produce higher suspended sediment concentrations mid-channel than adjacent to the banks.
3 RESULTS
3.1. Mapping of eastern CYP plume waters over three wet seasons
The spatial distribution and frequency of the occurrence of river plumes in the Cape York NRM during the wet seasons 2011-12, 2012-13 and 2014-15 is shown in Figure5 and Figure . It illustrates a well-documented inshore to offshore spatial pattern, with coastal areas experiencing the highest frequency of exposure to river plume waters (e.g., Devlin et al., 2015). The total area of the Cape York NRM exposed to river plume waters was 35,035 km2 (i.e., 36% of the Cape York NRM) in 2011-12, 43,747 km2 (45%) in 2012-13 and 44,556 km2 (46%) in 2013-14 (Figure 5 and Table 2), and the full plume extent was correlated with the total Normanby river discharge recorded between December and March of each wet season (r2 = 0.76). However, the actual area very frequently to frequently exposed (> 60% of the wet season) to river plume was much lower: 14810 km2, 18882 km2 and 24584 km2 i.e., about 15 %, 20 %, and 26 % of the Cape York NRM in 2011-12, 2012-13 and 2013-14; respectively. The total area of the Cape York NRM exposed to turbid (Primary) river plume waters ranged from 4611 km2 (i.e., 5% of the Cape York NRM) in 2012-13 to 14516 km2 (15%) in 2012-13 (Figure 5 and Table 2).
7

Figure 5a: Extent and frequency of all water types (CC1 - CC6) reported as normalised seasonal value for the wet seasons 2011-12, 2012-13 and 2014-15. The frequency number represent the normalised number of weeks per wet season an area or pixel has been exposed to the primary plume water type (max: 1 = 22 weeks).
8

Figure 5b: Extent and frequency of only Primary water types (CC1, CC2, CC3 and CC4) reported as normalised seasonal value for the wet seasons 2011-12, 2012-13 and 2014-15. The frequency number represent the normalised number of weeks per wet season an area or pixel has been exposed to the primary plume water type (max: 1 = 22 weeks).
9

It should be, however, again noted that the method of Alvarez-Romero et al. (2013) didn't include colour signatures of Cape York waters and, that this method hasn’t been validated yet in the Cape York NRM region. It should also be noted that the water types presented in Figure 5 and 6 represent the water types observed across the entire annual wet season, not specific to periods when flood plumes were present. This means that periods of wind-driven sediment re-suspension and sediment plumes from outgoing tides may by falsely represented as plume water on the maps. All mapping outputs and results from this method should be taken with care.
Table 2: Areas (km2) and percentage (%) of the Cape York NRM exposed to different categories of river plume frequency.
Normalised Frequency of occurrence
>0 - 0.2 0.2 - 0.4 0.4 - 0.6 0.6 - 0.8 0.8 -1.0 TOT exp. TOT non exp.
Fplu
me
20128439 7042 8303 7718 3534 35035 612819% 7% 9% 8% 4% 36% 64%
963162013
12756 5951 10632 11386 3022 43747 52569100% 13% 6% 11% 12% 3% 45% 55%
201410553 5907 5780 7653 14663 44556 5176011% 6% 6% 8% 15% 46% 54%
Fprim
ary
20127472 601 336 143 7 8559 877578% 0.6% 0.3% 0.1% 0.0% 9% 91%
963162013
3734 420 262 175 20 4611 91705100% 4% 0.4% 0.3% 0.2% 0.0% 5% 95%
201413197 597 365 221 137 14516 8180014% 0.6% 0.4% 0.2% 0.1% 15% 85%
3.2 PCB Flood Plume Mapping and Water Quality Monitoring over 3 wet seasons
3.2.1 Flood Event Discharge and Plume CharacteristicsThe March 2012 PCB flood event was a moderate flood (total event discharge 543,800 ML) preceded by several smaller events (Error: Reference source not found; Table 3). The freshwater flood plume flowed north from the Normanby, Bizant and Kennedy River mouths, extending approximately 22 kms into PCB on the 26th, three days after the peak discharge at Kalpowar Crossing (Figure 3a; Appendix 1). The area of the visible plume was visually assessed to reach a maximum of 350 km2, although the freshwater influence may have extended beyond this area. Surface water temperatures within the plume ranged from 31.6˚C to 32.8˚C and salinity ranged from 1.0 to 32.1.
The larger January 2013 flood (total event discharge 859,659 ML), associated with ex-tropical cyclone Oswald, was the first flood event in the catchment for the 2013 water year (Figure 6 Table 3). The flood plume flowed north from the Normanby,
10

Bizant and Kennedy Rivers, inundating Wharton Reef and the southern edge of Corbett Reef on the 29th January. On the 30th, 11 to 20 knot north-westerly winds drove the visible plume away from Corbett Reef to flow east past Clack Reef (Figure 3b). Satellite images indicate that the plume travelled over 60 km to the outer Reef. The plume area was approximately 1400 km2 on the 30th January. Vertical sampling showed that the freshwater plume was 1.5 m thick 4 km from the mouth of the Normanby, with salinity increasing gradually below the surface. The Kennedy and Bizant rivers had a distinct 10 to 12 km radius plume that flowed east to merge with the Normanby plume. A distinct coastal plume was also evident from the Normanby mouth to the Flinders Isles. Surface water salinity measured on 29th January ranged from 1.7 at the mouth of the Normanby to 17.0 near the Flinders Isles (16 km northeast) and 28.3 at Wharton Reef (33 km northwest on the Normanby transect). Salinity outside of the flood plume ranged from 35.1 to 35.3.
In April 2014, the passage of Cyclone Ita across the southeastern catchment created a 1-in-20 year flood event in the upper catchment, resulting in a total event discharge of 1,082,427 ML at Kalpowar Crossing (Table 3). Numerous smaller events preceded this flood, with total antecedent discharge for the water year totalling 1,388,475 ML (Error: Reference source not found). On the 18th April, the flood plume extended 18 km north from the Kennedy River and 10.5 km northwest from the Normanby River. Salinity within the Normanby River transect ranged from 0.2 to 29.8 seven km offshore. Salinity in the Kennedy River transect ranged from 3.5 at the river mouth to 26.7 eighteen km offshore. Outside the visible plume, salinity ranged from 32.9 to 33.5. Surface water temperatures ranged from 27.3˚C to 29.7˚C. Strong south-easterly winds (26- 31 knots) pushed the plume to the west, flowing north along the coast for over 50 km according to MODIS imagery from the 18th to the 20th April (Figure 3c). The 2014 plume covered an estimated area of at least 1100 km2.
11

12/9/2
005
4/14/2
006
8/18/2
006
12/22/2
006
4/27/2
007
8/31/2
007
1/4/2
008
5/9/2
008
9/12/2
008
1/16/2
009
5/22/2
009
9/25/2
009
1/29/2
010
6/4/2
010
10/8/2
010
2/11/2
011
6/17/2
011
10/21/2
011
2/24/2
012
6/29/2
012
11/2/2
012
3/8/2
013
7/12/2
013
11/15/2
013
3/21/2
014
7/25/2
014
11/28/2
014
4/3/2
0150
20000400006000080000
100000120000140000160000180000200000
Kalpowar Crossing Gauge (105107) Daily Discharge Records M
L
2012 Event
2013 Event
2014 Event
Figure 6: Hydrograph showing daily discharge at the Kalpowar Crossing gauge (105107) for the period of record (2005- 2015) showing the 2012, 2013 and 2014 flood events (Source: DNRM, http://watermonitoring.dnrm.qld.gov.au/host.htm)
Total event discharge for the 2012, 2013 and 2014 flood plumes was below average compared to annual Normanby River flood events recorded over a 10 year period. The DNRM Kalpowar Crossing gauge (105107A) was installed in the Normanby River in 2005. During the period of 2005-2014, the January 2012 event had the lowest daily discharge and total event discharge of any annual flood event (Figure 6). The 2013 flood plume represented the second lowest total event discharge for the period.
12

Table 3: Annual and Flood Event Discharge1, Wind Speed, Wind Direction and Temperature for 2012, 2013 and 2014 Flood EventsWater Year2
(WY)Annual Discharge (ML)
Peak event discharge (cumecs)
Total event discharge (ML)
Antecedent discharge4 WY (ML)
Principal Sampling date(s)
Average Wind Speed (knots)
Average Wind Direction
PCB surface temp (°C)
2011-2012 1,148,497
516.78 (23/3/12) 555,373 380,252 26/3/12 13.6 134 (SE) 32.0
2012-2013 1,822,230
1860.49 (27/1/13) 859,659 <1 29/1/13 18.0 304 (NW) 34.730/1/13 17.4 315 (NW) 32.831/1/13 13.6 206 (NW to
SE / NE)30.0
2013-2014 2,659,741
2055.89 (16/4/14) 1,082,427 1,388,475 18/4/14 27.2 130 (SE) 28.9
1 Measured at Kalpowar Crossing. Estimated flood travel time between Kalpowar Crossing and Normanby River mouth = 2 days2 1st October to 30th September 3 Total discharge from start of event to time of sampling4 Total discharge for the Water Year prior to the start of the current flood event
13

3.2.2 Turbidity and suspended sedimentsTSS during the three flood events ranged from 26 mg/L to 125 mg/L at the Normanby, Kennedy and Bizant River mouths (Table 4). TSS at the river mouths was strongly correlated with total event discharge (rs = 0.879, p<0.001) and maximum concentrations were detected during the larger 2013 (84 mg/L) and 2014 (150 mg/L) events. TSS concentrations within the plumes were negatively correlated with salinity (Spearman’s rs = -0. 426, p<0.01). Salinity mixing diagrams show a rapid decrease in TSS within the 0 - 5 salinity zone for all events (Figure 7). This is the area of the primary zone, characterised by low salinity, high rates of sedimentation, high nutrients but with light limiting conditions (Devlin et al., 2012b). Concentrations remained <20 mg/L at salinity > 5 (1 to 3 km from the river mouths) with one exception in 2014 where 150 mg/L was measured 2 km from the mouth of the Normanby at a salinity of 20. Wind-driven sediment re-suspension may have increased the concentrations in these shallow (<4m) waters, however similar high (125 mg/L) concentrations were also recorded at mouth of the Normanby river. Beyond six km offshore all TSS concentrations were <10 mg/L and fine sediments (<63 µm) comprised 99% of the sediment fraction. Although the particle size composition of the <63 µm fraction was not assessed, other Reef flood plumes are composed primarily of fine clays (<10 µm) beyond the initial low salinity zone (Bainbridge et al 2012).
Table 4: Minimum, maximum and mean TSS, nutrient and chlorophyll-a concentrations for 2012, 2013 and 2014 PCB flood plumes and PCB outside flood plumes
AnalyteUnits
2012 PlumeMin- Max (mean)
2013 PlumeMin- Max (mean)
2014 PlumeMin- Max (mean)
PCB Outside plumeMean ± st.dev.
TSS mg/L 2.8 – 29.0 (9.9) 0.8 – 84.0 (18.5) 3.7 – 150.0 (45.8) 4.7 ± 3.9
TN µM/L 14.06 - 37.62 (23.50)
8.64 – 51.26 (24.16)
13.28 – 33.55 (20.60)
7.972 ± 4.60
NOX µM/L 2.36 - 6.64 (4.01)
0.21 – 4.85 (1.71) 0.57- 1.71 (0.98) 0.428 ± 4.599
NH4 µM/L 0.50 – 1.71 (1.05)
0.14 – 4.14 (1.32) 0.21 – 7.57 (1.37) 0.642 ± 0.539
DON µM/L 7.07 - 24.7 (13.57)
1.07 – 34.55 (14.06)
5.0 – 18.42 (12.46) 5.40 ± 4.45
PN µM/L 0.29 - 18.06 (4.87)
0.14 – 27.84 (7.45) 0.29 – 27.13 (5.79) 1.50 ± 1.19
TP µM/L 0.65 - 0.90 (0.79)
0.16 – 2.58 (0.75) 0.23 – 3.55 (1.21) 0.16 ± 0.06
DIP µM/L 0.10 - 0.36 (0.23)
0.06 – 0.45 (0.19) 0.06 – 0.23 (0.12) 0.108 ± 0.049
DOP µM/L 0.13 - 0.55 (0.33)
0.03 – 0.39 (0.16) 0 – 0.42 (0.17) 0.02 ± 0.02
PP µM/L 0.06 - 0.45 (0.23)
0 – 2.26 (0.38) 0.06 – 2.70 (0.87) 0.03 ± 0.03
Chlor-a µg L-1 0.2 - 2.0 (1.1) 0.2 – 8.8 (2.1) 0.2 – 1.1 (0.50) 0.28 ± 0.12
14

Phyto cells L-1
(X1000)
10 – 38 (20) 18 – 4,141 (616) 14– 189 (99) 80 ± 80
Salinity ppt 0 - 30.6 (15.3) 0.2 – 33.7 (20.3) 0.5 – 33.0 (15.0) 33.5 ± 1.3
Figure 7: TSS, chlorophyll-a, TN, PN, DON, DIN, PP, DOP and DIP plotted as a function of salinity for the 2012, 2013 and 2014 PCB flood plumes.
15

3.2.3 Nutrients Mean event concentrations of total nitrogen (TN) at Kalpowar Crossing ranged from of 30.30 µM/L (2012) to 43.31 µM/L (2013). Similar concentrations were measured in the estuaries, with a maximum TN of 51.26 µM/L measured in 2013 (Table 4). TN concentrations within the flood plumes ranged from 8.64 µM/L to 39.05 µM/L. Dissolved organic nitrogen (DON) accounted for between 51% (2013) to 73% (2014) of TN while particulate nitrogen (PN) comprised an average of 24% of all flood plume TN. Dissolved inorganic nitrogen (DIN) accounted for an average of 16% of TN across all plumes. Flood plume total phosphorous (TP) concentrations ranged from 0.161 µM/L to 3.552 µM/L. Particulate phosphorous (PP) accounted for an average of 58% of TP in 2014 compared to 20% in 2012 and 19% in 2013. Dissolved organic phosphorous (DOP) accounted for an average of 44%, 36%, and 22% of TP in 2012, 2013 and 2014 respectively.
2012 2013 20140%
20%
40%
60%
80%
100%
Nitrogen Species Composition
PNDONNOxNH3
Annual Flood Event
2012 2013 20140%
20%
40%
60%
80%
100%
Phosphorus Species Composition
PPDOPDIP
Annual Flood Event
Figure 8: Nitrogen and Phosphorus Species Composition
Salinity mixing plots for nutrient species varied across the three years reflecting different discharge concentrations and conditions within the plumes (Figure 7). TN, DON and Si exhibited primarily conservative behaviour. PN concentrations generally declined at low salinities, however there were some increases at salinity > 15. Increases in PN could have been caused by re-suspension or entrainment from below the plume; however, most increases in PN were observed in areas of maximum biological activity, where the formation of particulate nutrients by phytoplankton has been observed in other flood plumes (Dagg et al 2004, Devlin and Brodie 2005). DIN concentrations generally declined at salinity < 20 (particularly in 2013) corresponding to increasing chlorophyll-a concentrations, indicating the uptake of DIN by phytoplankton. These patterns were less obvious in 2014 when concentrations of both NOx and NH4 remained low (<2 µM/L) across the plume.
DON generally showed a conservative decline, however in 2014 a rapid increase in both DON and DOP was observed at salinity <5 ppt. Although dissolved organic matter production in plumes can be attributed to phytoplankton, the 2014 increase in DON and DOP was not correlated to an increase in chlorophyll-a.
16

Similar to PN, PP declined rapidly at low salinity (<5 ppt), with the majority settling out of the plume within 3 km from the river mouths (Error: Reference source not found). DIP concentrations generally decreased at lower salinities, and increased or levelled off at salinity > 20. In the 2013 plume, DIP decreased gradually (up to 20 ppt) potentially associated with uptake by phytoplankton (observed as an increase in DOP and chlorophyll). In the 2014 plume, DIP decreased rapidly at low salinities (<5) and increased at salinity >20 despite an increase in phytoplankton densities. DIP has been shown to sorb to particles in the early plume mixing stage and to desorb at higher salinities (Dagg et al 2004). There were no clear trends in DOP concentrations across the flood plumes. DOP generally increased with increasing salinity in 2012, while DIP decreased and chlorophyll increased at mid salinities. This indicates the uptake and transformation of DIP by phytoplankton. However, DOP and DIP showed both increases and decreases in mid-salinity zones, indicating that other processes, such as the microbial or photochemical degradation of DOP, were dominant in some parts of the plume. In the 2014 plume, DOP concentrations increased at low salinities (<10) and decreased at higher salinities.
TN, TP and PP concentrations exhibited strong positive correlations (rs>0.6, (p<0.001) with TSS. All nutrient species with the exception of NOx and FRP were negatively correlated (p<0.01) with salinity. NOx was strongly negatively correlated with total event discharge (maximum concentrations were detected in 2012).
Mean NOx, DON, PN, FRP and PP concentrations were all significantly elevated (p<0.01) within the flood plumes compared to PCB concentrations outside of the plumes (Table 4). The particulate nutrient fractions generally settled out of the flood plume (or were subjected to biotransformation) less than 20 km from the mouth of the rivers. The outer reaches of the flood plumes, which inundate coral reefs such as Corbett and Clack to the northeast and the Cliff Isles to the west, were primarily composed of dissolved organic and inorganic nutrient fractions.
Silica samples were collected during the 2013 flood plume only. Concentrations ranged from 199.5 µM/L in the estuary to 1.7 µM/L outside of the flood plume at PCB, with a mean flood plume concentration of 74.9 µM/L (Table 4). Si exhibited conservative behaviour (r2= 0.89) as has been observed in other flood plumes (Boyle 1974), however Si was only moderately correlated with salinity.
3.2.4 Chlorophyll-a and PhytoplanktonChlorophyll-a concentrations within the three PCB flood plumes ranged from 0.25 µg/L to 8.82 µg/L 1 (mean 1.70 ± 1.86 µg/L). Concentrations outside of the flood plume ranged from 0.20 µg/L to 0.87 µg/L (Table 4). Maximum chlorophyll concentrations were detected in 2013 (Table 4). Chlorophyll trends across the plumes varied, however a mid-salinity increase in chlorophyll and/ or phytoplankton densities was observed in all three flood plumes. This mid-salinity increase has been observed in other flood plumes and is attributed to increased light availability as
17

suspended sediments decline (Dagg et al 2004, Devlin et al., 2013). In 2013 the increase occurred between 5-20 salinity. Chlorophyll-a concentrations were low across the 2014 flood plume (<1.10 µg/L), however a slight increase in both chlorophyll-a and phytoplankton density was observed between salinities of 20 to 30. Both Dagg et al (2004) and Turner et al (1990) have identified a suspended sediment threshold of 10 mg/L, above which there is insufficient light for phytoplankton growth. In our study, this threshold generally applied, however in 2013 chlorophyll concentrations as high as 5.34 µg/L were detected at TSS of 15 mg/L (duplicate SSC 20 mg/L). Following the mid-salinity increases, chlorophyll-a concentrations declined at salinities >25 within the 2012 and 2013 plumes, indicating a depletion of dissolved nutrients.
Maximum phytoplankton densities and species diversity were measured in 2013 (Table 4). Phytoplankton densities within the 2013 plume ranged from 32,429 cells/L
to 4,140,848 cells/L, while densities outside of the freshwater plume ranged from 18,299 cells/L to 35,862 cells/L. Maximum densities occurred on the 30th January 2013 approximately 5 km from the Normanby River mouth (salinity 29, TSS 10.6 mg/L). Diatomacea was the dominant species group all years, comprising up to 97% of phytoplankton. Skeletonema sp. were the most prevalent species in 2013, comprising over 50% of most samples. Skeletonema sp. are not detected in PCB samples outside of the freshwater plume and were not recorded in 2012 or 2014 samples. Dominant species in the 2014 flood plume included the cyanobacteria Trichodesmium erythraeum, which was recorded at a maximum density of 70,752 cells/L but was not recorded in 2012 or 2013. Dinoflagellates and coccolithophorids also occurred in smaller numbers in most samples, as well as several freshwater taxa including Mallomonas sp.
Elevated densities (cells/L) of phytoplankton recorded in the 2013 plume did not appear to be driven by increased nutrient concentrations, as there were no significant differences in nutrient concentrations within the flood plumes between the three flood events (other than elevated NOx and DON in 2012; Table 4).
Diatom dominating the microalgae during nutrient pulses indicates that microplankton are able to compete efficiently with nanoplankton and Trichodesmium during periods of high nutrient input, which is clearly seen in the majority of the samples where diatom species dominate over all functional groups.
Alterations in nutrient stoichiometry, through disproportionate N and P loads can have profound consequences on algal assemblages; nutrients introduced or released during the high flow events are rapidly taken up by pelagic and benthic algae and microbial communities, sometimes nurturing short-lived phytoplankton blooms and high levels of organic production as measured in flood plumes. High values of phytoplankton biomass, dominated by Skeletonema sp., were measured (as chl-a) in both the Mary and Normanby river plumes compared to other Reef catchments (Devlin et al., 2013). Skeletonema is a small diatom characterized by the ability to thrive well in mid salinity, eutrophic conditions. It is interesting to note the
18

high values of biomass associated with Skeletonema sp. occurred in the 2013 Normanby flood plumes, indicating that these short lived phytoplankton blooms can occur in all catchments, including those not expected to suffer high N and P loads such as the Normanby River. The highest phytoplankton counts are also associated with the highest concentrations of chl-a indicating that the nanoplankton are a significant contributor to the overall biomass of the system, particularly in conditions of medium salinity.
4.0 Comparison with other Reef PlumesA number of factors can complicate comparisons of flood plume concentrations from different rivers, including annual variations associated with flood magnitude, antecedent rainfall, timing of sampling, and the location of sampling within the estuary or across the plume. Plume concentrations will also be influenced by winds and currents. Event loads and specific yields may be more appropriate metrics for comparison between rivers and flood events, although these metrics are also subject to significant variation between events and the different methods used to calculate loads. End of catchment loads for the three Normanby Basin flood events have not been estimated here due to the lack of end of system discharge measurements for any of the three major Normanby Basin distributaries. Despite the limitations, suspended sediment and nutrient concentrations and stoichiometry within a flood plume may provide some indication of the level of disturbance within the catchments and potential impacts on Reef ecosystems. The Normanby flood plume concentrations are compared here against flood plumes from the three largest Reef catchments; the Burdekin, Fitzroy and Burnett Rivers, which, like the Normanby are dominated by grazing, as well as the Herbert and Tully Rivers, which have similar mean annual discharge to the Normanby but are dominated by sugarcane in the lower catchments. Results from flood events in the Annan River (southern CYP) are also discussed.
In a comparison of published concentrations of suspended sediments and nutrients discharged to the Reef lagoon or adjacent Torres Straits during flood events, the Jardine River, which flows west from eastern CYP in the far northern region, had the lowest recorded end of system TSS values, with concentrations remaining below 20 mg/L during a major flood event (Eyre & Balls 1999). In contrast, suspended sediment (SS) concentrations near the mouth of the Annan River ranged from 15 mg/L – 105 mg/L during a minor flood event (Davies and Eyre 2005) and from 10 mg/L to 219 mg/L (mean 86 mg/L) during a larger 2015 flood event (Shellberg et al, unpublished data). Concentrations at the mouth of the Normanby ranged from 26 mg/L to 125 mg/L (mean 52.5 mg/L) during the 2012, 2013 and 2014 flood events. The Herbert River, with a similar mean annual discharge to the Normanby but smaller catchment size, recorded maximum SS in the estuary close to 400mg/L and a mean flood event SS concentration of 156 mg/L during one event (Mitchell et al 1997). The Burdekin River, with a catchment 5 times larger than the Normanby Basin and more than three times greater mean annual discharge, recorded
19

maximum event SS in the estuary of 1600 mg/L, and a mean SS of 290 mg/L during one event (Brodie et al. 2010, Bainbridge et al. 2012).
Concentrations of NOx discharged to the Reef from the Normanby River during the three flood events reached a maximum 6.6 µM/L (mean of 3.2 µM/L) at the Normanby river mouth. A maximum NOx flood concentration of 5 µM/L (Davies and Eyre 2005) and a mean of 0.8 µM/L (Shellberg et al. unpublished data) have been recorded in the Annan River estuary during flood events. The Herbert River estuary had a mean NOx concentration of 15 µM/L during one flood event (Mitchell et al 1997) and the Burdekin recorded concentrations between 9 µM/L to 32 µM/L near the mouth during flood events (Brodie et al. 2010).
Within the flood plumes, suspended sediments and particulate nutrients rapidly settle out, while increased light availability combined with elevated nutrient concentrations result in phytoplankton blooms. Mean plume transect concentrations represent this variability, and are biased towards higher particulate concentrations at low salinities or higher chlorophyll and dissolved organic nutrients at higher salinities. The timing of sampling in relation to the flood peak also can have a significant influence on the measured concentrations. The mean salinity values in Table 5 provide a rough estimate of the distribution of samples collected across each of the flood plumes.
Mean SS concentrations within the plumes were highest at the Burdekin (28.9 mg/L), followed by the Fitzroy (24.7 mg/L) and Normanby Rivers (21.3 mg/L) (Table 5). High mean SS relative to other Reef plumes may be related to increased discharge volumes, but is also likely to be influenced by the high levels of gully erosion documented across all three of these catchments.
Surprisingly, concentrations detected during the 1995 Annan River flood event were amongst the highest suspended sediment concentrations of all the plumes, ranging from 20-110 mg/L within the plume (Davies & Eyre 2005). Davies & Eyre (2005) attributed the high SS to the highly erodible nature of the catchment and the fact that this was the “first flush” of the year. The Annan catchment has also been subject to a high level of historic mining disturbance (Shellberg et al 2015).
Mean total nitrogen concentrations are higher in the Normanby flood plumes than other Reef catchments (Table 5), despite the low levels of horticulture and cropping in the upper Normanby (<1%). Of the TN in the Normanby, mean DON was higher than the other plumes, with the exception of the Fitzroy river plume. High DON:TN ratios can be indicative of a less anthropogenically disturbed catchment (Harris, 2001) and may partially explain why the Normanby has the highest mean TN concentrations of the dataset. Mean PN concentrations in the Normanby plume were second only to the Burnett River, and similar to mean PN from the Fitzroy. As with TSS, PN concentrations in the Normanby catchment are likely to be influenced by accelerated rates of erosion, however the extent of anthropogenic influence on particulate nutrients in the Normanby River is unknown. Mean plume NOx concentrations were the third highest in the Normanby plume, exceeded by the
20

Burdekin and similar to concentrations detected in the Fitzroy. However a separate study presenting mean concentrations from MMP flood plume monitoring (Devlin et al 2012) showed the mean 2007 – 2011 Tully flood plume DIN concentration (3.69 ± 4.18 uM/L) exceeding the mean Normanby DIN (3.4 ± 2.2 µM/L) for the three years sampled (Table 5). Either way, DIN concentrations in Normanby plumes are within a similar range to those discharged from the Tully River, where 15% of the catchment is under horticulture or sugarcane production. Mean DIP concentrations in the Normanby are amongst the lowest of all the river plumes. When the results from the three Normanby flood plumes are compared against Reef -wide flood plume concentrations (Devlin et al 2012), the mean TSS, TN, DIN, PN, DON, DOP and chlorophyll-a concentrations exceed the mean Reef concentrations (Table 5).
21

Table 5: Mean Concentrations (±stdev) of Water Quality Parameters from PCB flood plumes (Normanby Basin) compared with Herbert, Tully, Burdekin, Fitzroy And Burnett River Flood Plumes
River salinity TSS_mg_l TN_uM/LNH4_ uM/L
NOX_ uM/L PN_ uM/L
DON_ uM/L TP_ uM/L
DIP_ uM/L
DOP_ uM/L PP_ uM/L chl_ug/l
Normanby 18.0 ± 11.4 21.3 ± 30.3 23.33 ±
10.19 1.26 ± 1.30 2.16 ±1.50 6.45 ± 7.01 13.64 ±6.28 0.85 ± 0.70 0.19 ± 0.11 0.43 ± 0.60 0.21 ± 0.14 1.5 ± 1.8
Burdekin1 5.9 ±12.2 28.9 ± 70.8 14.69 ± 14.11 1.47 ± 1.96 2.44 ± 3.52 2.87 ± 5.01 7.19 ± 6.83 0.63 ± 1.20 0.31 ± 0.35 0.17 ± 0.17 0.40 ± 1.01 0.7 ± 1.2
Burnett1 35.8 ± 2.4 5.1 ± 4.2 20.92 ± 12.76 1.89 ± 0.55 0.74 ± 0.40 6.85 ± 10.23 11.44 ± 7.60 0.93 ± 0.24 0.43 ± 0.08 0.33 ± 0.17 0.18 ± 0.20 1.6 ± 1.7
Fitzroy1 9.8 ± 15.1 19.9 ± 37.5 22.80 ± 16.34 1.12 ± 0.93 2.21 ± 2.22 5.35 ± 6.77 14.10 ±
10.58 1.22 ± 0.99 0.79 ± 0.69 0.29 ± 0.30 0.40 ± 0.56 2.0 ± 3.7
Fitzroy2 24.7±38.8 3.2±2.23 5.1±5.6 0.8±0.7 0.3±0.3 0.4±0.5 15.2±10.5 2.1±3.6
Herbert1 21.4 ± 13.7 10.1 ± 14.5 10.40 ± 10.53 0.56 ± 0.77 1.60 ± 2.62 1.08 ± 2.83 5.97 ± 6.09 0.26 ± 0.26 0.16 ± 0.18 0.14 ± 0.25 0.07 ± 0.16 1.3 ± 1.4
Herbert2 10.7±25.1 3.0±6.3 3.1±3.3 0.2±0.2 0.2±0.2 0.2±0.2 7.4±4.2 1.2±1.0
Tully1 15.4 ± 15.2 6.9 ± 11.3 9.51 ± 9.31 0.64 ± 0.66 1.44 ± 2.57 1.63 ± 2.58 4.51 ± 4.30 0.48 ± 0.42 0.23 ± 0.22 0.16 ± 0.19 0.12 ± 0.18 0.9 ± 0.9
Tully2 10.89±11.59 3.69±4.18 3.94±5.14 9.25±7.85 0.41±0.41 1.77±2.57
Reef Mean2 13.6±29.3 2.8±3.1 3.4±4.7 8.8±7.1 0.4±0.4 0.2±0.2 0.3±0.6 1.3±1.8
1 M.Devlin, 2012, James Cook University, Flood plume monitoring in the Great Barrier Reef, 1994 - 2012. 2 Devlin et al 2012b: MMP 2011/2012 Report, Mean Concentrations 2007 – 2011 Flood Plume Monitoring3 Mean DIN (NH4 + NOx) concentrations
22

5.0 Discussion & Conclusion
The method of Álvarez-Romero et al. (2013) was used to classify three years of MODIS imagery and to produce normalised maps of frequency of river plume and primary plume water type occurrence for the wet season 2011-12 to 2013-14. Coastal areas of the Cape York Peninsula were the most exposed to river plume waters, and the full plume extent of the river plumes were correlated with the total Normanby river discharge. The method of Alvarez-Romero et al. (2013) has, however, not been calibrated and validated in the Cape York NRM region. Further work is required to evaluate the validity of these mapping outputs, especially because the Cape York coastal waters are optically shallow waters where bottom contamination of the satellite signals could be problematic. Wind-driven sediment resuspension could also influence the plume exposure maps.
However, the on-ground PCB plume monitoring and mapping provided detailed information on plume processes and water quality discharged from the Normanby Basin and the area of influence. The aerial extent and direction of flood plumes in PCB varied significantly during the 2012, 2013 and 2014 flood events. Although the magnitude of the flood event was partially responsible for variations in the aerial extent of flood plumes, the direction of flow of the flood plumes, and therefore which ecosystems were influenced by flood waters, were largely controlled by wind speed and direction, as has been observed elsewhere on the Reef (Devlin and Schaffelke, 2009). Seagrass meadows at the mouth of the Normanby and Kennedy rivers and coral reef and seagrass ecosystems at the Flinders Isles are regularly inundated by Normanby Basin flood plumes and are therefore most vulnerable to future changes in flood plume water quality. Wharton, Corbett and Clack Reefs and some outer barrier reefs were inundated by the 2013 flood plume, which represented a below average magnitude flood event for the Normanby River. The inundation of some or all of these reefs was also observed during the February 2007 flood plume (Figure 2) and during an aerial flight over PCB in February 2009. These observations indicate that under the right conditions, PCB mid- and outer shelf reef ecosystems are inundated by fine clays and dissolved nutrients transported by average magnitude Normanby Basin flood events. Nutrients delivered by flood plumes are likely to be driving the current outbreaks of Crown-of-thorns starfish on both Corbett and Clack Reef (Brodie et al 2005).
Significant variations between the three flood plumes, including the aerial extent of the plume and the density of the phytoplankton bloom produced in response to flood plume waters, highlight the importance of monitoring flood plumes under different magnitude and timing of flood events in order to get an accurate picture of the potential influence of a given river on Reef ecosystems (Devlin and Schaffelke, 2009; Devlin et al., 2011; Devlin et al., 2012a; Devlin et al., 2001). Increased phytoplankton densities and species diversity in the 2013 plume did not appear to be directly
23

related to increased discharge or nutrient concentrations. Other factors, such as variations in antecedent rainfall or nutrient stoichiometry may have contributed to the variations in phytoplankton densities and species diversity. As the production of “marine snow” from phytoplankton may be linked to coral condition (Brodie et al. 2007, Wolanski et al. 2003), further research into the drivers of phytoplankton growth in PCB could help to explain regional variations in coral condition.
When compared against other Reef flood plumes, the Normanby Basin plumes had the third highest mean TSS concentration, the second highest mean DON and PN concentrations, and the third highest mean plume NOx concentration. Comparisons of flood plume concentrations from different rivers are complicated by a number of factors, including annual variations in flood magnitude, antecedent rainfall, timing of sampling in relation to flood peaks, and the location of sampling across the plume. Beyond the river mouths, plume concentrations will also be influenced by winds and currents. Event loads and specific yields may be more appropriate metrics for comparison between rivers and flood events, although these metrics are also subject to significant variation between events and the different methods used to calculate loads. End of catchment loads for the three Normanby Basin flood events have not been estimated here due to the lack of end of system discharge measurements for any of the three major Normanby Basin distributaries. Although the concentrations of plume constituents will be influenced by discharge volumes and PCB conditions, land-use impacts such as accelerated gully erosion are also likely to influence the concentrations and loads of suspended sediments and nutrients within PCB flood plumes. Elevated suspended sediment concentrations have been documented in the upper Normanby Basin as a result of accelerated gully erosion (Brooks et al. 2013; Howley et al. 2013), however, the majority of the sediments settle out within the river channels, flood plains or within several kilometres of the river mouths, leaving only the fine sediment fraction in suspension within the outer flood plumes. The contribution of gully and other anthropogenic erosion sources to this suspended clay fraction has not been quantified. Accelerated erosion may also be a significant source of both particulate and dissolved nutrients (which can desorb from suspended sediments) in Normanby Basin flood waters. Further work is required to quantify the sources of nutrients and sediments in PCB flood plumes.
End of system loads have not been calculated for the Normanby Basin due to the lack of end of system discharge data for the interconnected Kennedy, Bizant and Normanby rivers. Only the Normanby River distributary is gauged, and the Normanby gauge at Kalpowar does not take into account overland flow or coastal discharge, which can be significant. Distinct plumes from the Kennedy River also contribute significantly to the PCB plumes. Without end of system discharge measurements and water quality monitoring data, loads of nutrients and sediments discharged to the Reef lagoon cannot be accurately calculated and are likely being significantly under-estimated when calculated from data collected only from the Kalpowar gauge.
24

The current condition of coral reefs and seagrass meadows in PCB indicates that river discharge has had a less detrimental effect on these ecosystems than in other Reef regions. Expanding horticultural land-use, road development and large scale clearing currently occurring within the Normanby Basin pose a growing threat to water quality in the Normanby River and the ecosystems of PCB. Strict application of “Best Practice” management actions to developments within the catchment and regular monitoring of downstream water quality and ecosystem condition is critical for the protection of this valuable region of the Reef (Brodie et al., 2008; Brodie et al., 2014). Further research on the sources and fate of nutrients and sediments in CYP Rivers and the resulting flood plumes is also necessary to improve our understanding of the drivers of COTS outbreaks in this region and the condition and long-term management requirements of CYP marine ecosystems.
25

6.0 Bibliography
Álvarez-Romero, J. G., Devlin, M., Teixeira da Silva, E., Petus, C., Ban, N. C., Pressey, R. L., Kool, J., Roberts, J., Cerdeira,S., Wenger, A., and Brodie, J. (2013). Following the flow: a combined remote sensing-GIS approach to model exposure of marine ecosystems to riverine flood plume. Journal of Environmental management, 119: 194-207.
Bainbridge, ZT., Wolanski, E., Alvarez-Romero, J.G., Lewis, S.E., Brodie, J.E. 2012. Fine sediment and nutrient dynamics related to particle size and floc formation in a Burdekin River flood plume, Australia. Marine Pollution Bulletin, 65: 236-248. 10.1016/j.marpolbul.2012.01.043.
Brodie, J., Binney, J., Fabricius, K., Gordon, I., Hoegh-Guldberg, O., Hunter, H., O’Reagain, P., Pearson, R., Quirk, M., Thorburn, P., 2008. Synthesis of evidence to support the scientific consensus statement on water quality in the Great Barrier Reef. The State of Queensland (Department of Premier and Cabinet), Brisbane.
Brodie, J., Devlin, M., Haynes, D., Waterhouse, J., 2011. Assessment of the eutrophication status of the Great Barrier Reef lagoon (Australia). Biogeochemistry 106, 281-302.
Brodie, J., Kroon, F., Schaffelke, B., Wolanski, E., Lewis, S., Devlin, M., Bohnet, I., Bainbridge, Z., Waterhouse, J., Davis, A., 2012. Terrestrial pollutant runoff to the Great Barrier Reef: an update of issues, priorities and management responses. Marine pollution bulletin 65, 81-100.
Brodie, J., Lewis, S., Wooldridge, S., Bainbridge, Z., Kroon, F., 2014. Ecologically relevant targets for pollutant discharge from the drainage basins of the Wet Tropics Region, Great Barrier Reef, Centre for Tropical Water & Aquatic Ecosystem Research (TropWATER) Report 14/33, James Cook University, Townsville, Australia.
Boyle, E., Collier, R., Dengler, A.T., Edmond, J.M., Ng, A.C., and Stallard, R.F. (1974) On the chemical mass-balance in estuaries. Geochimica et Cosmochimica Acta 38(11), 1719-1728.
Brodie, J., De’ath, G., Devlin, M., Furnas, M., and Wright, M. (2007) Spatial and temporal patterns of near-surface chlorophyll a in the Great Barrier Reef lagoon. . Marine and Freshwater Research(58), 342-353.
Brodie, J., Fabricius, K., De'ath, G., and Okaji, K. (2005) Are increased nutrient inputs responsible for more outbreaks of crown-of-thorns starfish? An appraisal of the evidence. Marine Pollution Bulletin 51(1-4), 266-278.
Brodie, J., Kroon, F., Wolanski, E., Waterhouse, J., Lewis, S., Kuhnert, P., Wallace, J., Lynam, T., Wilkinson, S., Honchin, C., and Bainbridge, Z. (2010) Setting ecologically relevant targets for pollution reduction to sustain the ecosystems of the Great Barrier Reef. In JCU Challenges in Environmental Science and Engineering. pp. 78-79. (JCU: Cairns)
Brodie, J., Schroeder, T., Rohde, K., Faithful, J., Masters, B., Dekker, A., Brando, V., and Maughan, M. (2010) Dispersal of suspended sediments and nutrients in the Great
26

Barrier Reef lagoon during river-discharge events: conclusions from satellite remote sensing and concurrent flood-plume sampling. Marine and Freshwater Research 61(6), 651-664.
Brodie, J.E., and Mitchell, A.W. (2005) Nutrients in Australian tropical rivers: changes with agricultural development and implications for receiving environments. Marine and Freshwater Research 56(3), 279-302.
Brooks, A., Olley, J., Pietsch, T., Spencer, J., Shellberg, J., Borombovits, D., Curwen, G., Howley, C., Gleeson, A., Simon, A., Bankhead, N., Klimetz, D., Klimetz, L., Eslami-Endargoli, L., Bourgeault, A. (2013). Sediment sources, sinks and drivers in the Normanby catchment, Cape York. Griffith University, Australian Rivers Institute.
Carter, A.B., Chartrand, K.M. and Rasheed, M.A. (2012) Critical marine habitats in high risk areas, Princess Charlotte Bay region - 2011 Atlas. Northern Fisheries Centre, Cairns, 67pp.
CRC Reef Research Centre (2002) Dugongs in the Great Barrier Reef, Current State of Knowledge, April 2002
Dagg, M., Benner, R., Lohrenz, S., and Lawrence, D. (2004) Transformation of dissolved and particulate materials on continental shelves influenced by large rivers: plume processes. Continental Shelf Research 24(7–8), 833-858.
Davies, P.J., and Eyre, B.D. (2005) Estuarine modification of nutrient and sediment exports to the Great Barrier Reef marine park from the Daintree and Annan River catchments. Marine Pollution Bulletin 51(1-4), 174-185.
Davies, P.J. & Hughes, H. (1983) High-energy reef and terrigenous sedimentation, Boulder Reef, Great Barrier Reef. BMR Journal of Australian Geology and Geophysics 8:3:201-209. Bureau of Mineral Resources, Geology and Geophysics, Canberra.
De’ath, G., Fabricius, K.E., Sweatman, H., and Puotinen, M. (2012) The 27–year decline of coral cover on the Great Barrier Reef and its causes. Proceedings of the National Academy of Sciences 109(44), 17995-17999.
Devlin, M.J., and Brodie, J. (2005) Terrestrial discharge into the Great Barrier Reef Lagoon: nutrient behavior in coastal waters. Marine Pollution Bulletin 51(1-4), 9-22.
Devlin, M. (2012) James Cook University, Flood plume monitoring in the Great Barrier Reef, 1994 - 2012. (https://eresearch.jcu.edu.au/tdh/data/f31cbf35-2c03-4c6f-a312-2f621b1fc5b5)
Devlin, M.J., Wenger, A., Petus, C.,da Silva, E.T., DeBose, J., Alvarez-Romero, J (2012) Reef Rescue Marine Monitoring Program. Final Report of JCU Activities 2010/11– Flood Plumes and Extreme weather monitoring for the Great Barrier Reef Marine Park Authority. James Cook University. Townsville.
Devlin, M., Schaffelke, B., 2009. Spatial extent of riverine flood plumes and exposure of marine ecosystems in the Tully coastal region, Great Barrier Reef. Marine and Freshwater Research 60, 1109-1122.
Devlin, M., Schroeder, T., McKinna, L., Brodie, J., Brando, V., Dekker, A., 2011. Monitoring and mapping of flood plumes in the Great Barrier Reef based on in-situ and remote sensing observations. Advances in Environmental Remote Sensing to Monitor Global Changes, CRC Press, Boca Raton.
27

Devlin, M., Schroeder, T., McKinna, L., Brodie, J., Brando, V., Dekker, A., 2012a. Chapter 8: Monitoring and mapping of flood plumes in the Great Barrier Reef based on in situ and remote sensing observations. CRC Press, Boca Raton.
Devlin, M., Waterhouse, J., Taylor, J., Brodie, J., 2001. Flood plumes in the Great Barrier Reef: spatial and temporal patterns in composition and distribution. Great Barrier Reef Marine Park Authority.
Devlin, M.J., McKinna, L.W., Alvarez-Romero, J.G., Petus, C., Abott, B., Harkness, P., Brodie, J., 2012b. Mapping the pollutants in surface riverine flood plume waters in the Great Barrier Reef, Australia. Marine pollution bulletin 65, 224-235.
Devlin, M., Petus, C., Teixeira da Silva, E., Tracey. D., Wolff, N., Waterhouse, J., Brodie, J. (2015).Water Quality and River Plume monitoring in the Great Barrier Reef: An Overview of Methods Based on Ocean Colour Satellite Data. Remote Sens. 2015, 7, 12909-12941; doi:10.3390/rs71012909
Dobbs K. et al. (2008) Incorporating dugong habitats into the marine protected area design for the Great Barrier Reef Marine Park, Queensland, Australia. Ocean Coast Manage 51:368–375.
Eyre, B., and Balls, P. (1999) A comparative study of nutrient behavior along the salinity gradient of tropical and temperate estuaries. Estuaries 22(2A), 313-326.
Fabricius, K., De'ath, G., McCook, L., Turak, E., and Williams, D.M. (2005) Changes in algal, coral and fish assemblages along water quality gradients on the inshore Great Barrier Reef. Marine Pollution Bulletin 51(1-4), 384-398.
Fabricius, K.E. (2005) Effects of terrestrial runoff on the ecology of corals and coral reefs: review and synthesis. Marine Pollution Bulletin 50(2), 125-146.
Furnas, M. (2003) 'Catchments and corals : terrestrial runoff to the Great Barrier Reef.' (Australian Institute of Marine Science: Townsville, Qld)
Harris, G.P. (2001) Biogeochemistry of nitrogen and phosphorus in Australian catchments, rivers and estuaries: effects of land use and flow regulation and comparisons with global patterns. Marine and Freshwater Research 52(1), 139-149.
Kroon, F.J., Kuhnert, P.M., Henderson, B.L., Wilkinson, S.N., Kinsey-Henderson, A., Abbott, B., Brodie, J.E., and Turner, R.D.R. (2011) River loads of suspended solids, nitrogen, phosphorus and herbicides delivered to the Great Barrier Reef lagoon. Marine Pollution Bulletin (0).
Mitchell, A.W., Bramley, R.G.V., and Johnson, A.K.L. (1997) Export of nutrients and suspended sediment during a cyclone-mediated flood event in the Herbert River catchment, Australia. Marine and Freshwater Research 48(1), 79-88.
Turner, R.E., Rabalais, N.N., Nan, Z.Z., (1990) Phytoplankton biomass, production and growth limitations on the Huanghe (Yellow) River continental shelf. Continental Shelf Research 10, 545–571.
Wallace, J., Karim, F., and Wilkinson, S. (2012) Assessing the potential underestimation of sediment and nutrient loads to the Great Barrier Reef lagoon during floods. Marine Pollution Bulletin 65(4–9), 194-202.
Wolanski, E., Richmond, R., McCook, L., and Sweatman, H. (2003). Mud, marine snow and coral reefs. American Scientist 91, 44–51.
28

Wooldridge, S., Brodie, J., and Furnas, M. (2006) Exposure of inner-shelf reefs to nutrient enriched runoff entering the Great Barrier Reef Lagoon: Post-European changes and the design of water quality targets. Marine Pollution Bulletin 52(11), 1467-1479.
29