spiral.imperial.ac.uk · web viewspace and atmospheric physics department ... we note that for...
TRANSCRIPT
A study of the time evolution of GERB shortwave calibration by comparison with CERES Edition-3A
data
R.Parfitt1,*, J.E. Russell1, R.Bantges1,2, N. Clerbaux3, H.Brindley1,2
1Department of Physics, Imperial College London, UK
2NERC National Centre for Earth Observation, UK
3Royal Meteorological Institute of Belgium, Belgium
*Corresponding author. Space and Atmospheric Physics Department, Imperial College London, London, SW7 2AZ, UK. [email protected]
Keywords: Earth Radiation Budget, GERB, CERES, Instrument Calibration
Abstract
This study examines the evolution of the GERB-2 and GERB-1 Edition 1 shortwave radiance
calibration between 2004-2007 and 2007-2012 respectively, through comparison with CERES
instrument FM1 Edition 3A SSF instantaneous radiances. Two periods when simultaneous
observations from both GERB-2 and GERB-1 were available, January 13th to February 11th 2007 and
May 1st to May 10th 2007, are also compared. For these two overlap periods respectively, averaged
over all CERES ‘unfiltered-to-filtered radiance ratio’ subsets, the GERB-1/CERES unfiltered radiance
ratio is on average found to be 1.6% and 1.9% lower than the associated GERB-2/CERES unfiltered
radiance ratio. Over the two longer time series the GERB/CERES unfiltered radiance ratio shows a
general decrease with time for both GERB-2 and GERB-1. The rate of decrease varies through time
but no significant seasonal dependence is seen. Averaged over all subsets the GERB-2/CERES
unfiltered radiance ratio showed a decrease of 1.9% between June 2004 and June 2006. Between
June 2007 and June 2012, the corresponding decrease in the GERB-1/CERES unfiltered radiance ratio
was 6.5%. The evolution of the GERB/CERES unfiltered radiance ratio for both GERB-2 and GERB-1
shows a strong dependence on the CERES unfiltered-to-filtered radiance ratio, indicating that it is
1
1
2
3
4
5
6
78
9
10
11
12
13
14
15
16
17
18
19
20
21
22
23
24
25
26

spectrally dependent. Further time-series analysis and theoretical work using simulated spectral
radiance curves suggests that for GERB-1 the evolution is consistent with a darkening in the GERB
shortwave spectral response function which is most pronounced at the shortest wavelengths. For
GERB-2, no single spectral cause can be identified, suggesting that the evolution is likely due to a
combination of several different effects.
1 Introduction
The Geostationary Earth Radiation Budget (GERB, Harries et al., 2005) instruments are a series of
broadband radiometers operating from geostationary orbit aboard the Meteosat Second Generation
(Schmetz et al., 2002) satellites. The first GERB instrument (GERB-2) was operational aboard
Meteosat-8 from March 2004 to May 2007, after which time the second GERB instrument (GERB-1)
on Meteosat-9 provided measurements which extended to January 2013. One goal of the GERB
mission is to provide a stable climate quality long-term dataset, with high absolute radiometric
accuracy. As such, identifying and correcting for drifts in the instrument calibration that occur in
orbit is a fundamental requirement. For the GERB Edition 1 data which are used in this study, the
calibration of the individual GERB instruments are maintained independently using their on-board
calibration sources. Fixed pre-launch measurements of their respective spectral responses are used
in the processing.
Nevertheless, the wide field of view of the GERB instruments, as well as their mounting on the
spinning Meteosat platform means that they will inevitably be exposed to significant amounts of
ultraviolet (UV) radiation during normal operation. Despite the presence of on-board calibration
targets, the effect on calibration of long-term exposure of any optical system to UV radiation has
long been an outstanding problem for Earth Observation sensors (e.g. Clark and DiBattista, 1978). As
such, there is some expectation that a change in the detail of the GERB spectral response during
operation will occur. Additionally, preliminary studies of the GERB Edition 1 data have shown
apparent scene-dependent decreases in the derived shortwave (SW) fluxes over the course of the
2
27
28
29
30
31
32
33
34
35
36
37
38
39
40
41
42
43
44
45
46
47
48
49
50
51

instrument lifetimes (Russell, 2011, N. Clerbaux, personal comm., April 2015). For these reasons, the
present study has been undertaken as part of a larger effort to survey the GERB Edition 1 data
record for artefacts and spurious trends due to instrument and processing effects that can only be
discerned after some years of data are available.
In this study, unfiltered SW radiances from the GERB-2 and GERB-1 instruments are compared to
analogous observations from the Clouds and the Earth's Radiant Energy System (CERES, Wielicki et
al., 1996), on the polar orbiting Terra satellite. The CERES broadband instruments are particularly
suited as their optics and processing offer many similarities to the GERB instruments, such as Denton
enhanced silver-coated mirrors , the use of a quartz filter in the SW region and the use of a scene
dependent spectral correction to derive unfiltered radiances (Loeb et al., 2001). The calibration and
stability of the CERES instruments have also been extensively studied through inter-comparison
between the different flight models and with other instruments to ensure their long-term climate
accuracy (Loeb et al., 2006, Priestley et al., 2011, Shankar et al., 2014). Moreover, a previous analysis
of the CERES instruments (Matthews et al., 2005) identified a spectral darkening of their SW optics,
resulting from a process similar to that suspected in the GERB instruments.
Given the relatively similar start of life calibration uncertainties of the two datasets, 1% for CERES
(Wielicki et al., 1996) and 2.25% for GERB (Russell, 2011), this study concentrates on the evolution of
the calibration differences between GERB and CERES rather than the initial bias between the
datasets. Changes are interpreted here in terms of a calibration drift in the GERB radiances. This is
considered as a reasonable first approximation given the independent evidence of a possible trend
in the GERB SW fluxes, the work already carried out to ensure and validate the stability of the
Edition 3A CERES data, and the operational constraints placed on the CERES Flight Model 1 (FM1)
instrument throughout the period considered to minimise its UV exposure. Additionally, as a first
step to understanding the underlying mechanism behind the identified changes, we perform a short
theoretical study, using simulated spectral radiance curves for a variety of different scenes from the
3
52
53
54
55
56
57
58
59
60
61
62
63
64
65
66
67
68
69
70
71
72
73
74
75
76

NASA Advanced Spaceborne Thermal Emission and Reflection Radiometer (ASTER) spectral library
(Baldridge et al., 2009). This investigates the type of degradation in the GERB instrument spectral
response that could explain the observed changes.
Section 2 presents the data used in this study, whilst Section 3 details the methodology for the
GERB-CERES matching. Section 4 presents the comparison results, including the theoretical
investigation of instrument spectral response changes. A summary is provided in the final section.
2 Data
2.1 GERB data
The study uses GERB level-2 top-of-the-atmosphere (TOA) unfiltered SW radiances. It is noted that
for unfiltered radiances here and throughout the paper, SW is used to refer to all reflected solar
radiation. The native GERB observations are obtained at a spatial resolution of approximately 50km
at sub-satellite point and are affected by the non-uniform spatial weighting of the instrument Point
Spread Function (PSF) and filtered by the instrument spectral response. The processing of all the
GERB level 2 products uses finer spatial resolution narrow-band data available from the Spinning
Enhanced Visible and Infrared Radiometer Imager (SEVIRI, Schmetz et al., 2002) on the same satellite
to geolocate the data, provide spectral and spatial detail needed to correct for imperfections in the
GERB instrument spatial and spectral response, and provide information on the scene needed to
enable a radiance to flux conversion. Several different GERB Level 2 products are available to users,
all provided on a regular equal viewing angle grid at approximately 15 minute temporal resolution
but with slightly different spatial and temporal characteristics. The GERB product used here is the
High-Resolution (HR) dataset (Dewitte et al., 2008), which has a resolution of 3x3 SEVIRI pixels
(9x9km at nadir) and is provided every 15 minutes as a snapshot of the radiances and fluxes at the
time of SEVIRI data acquisition. Hence, within a given HR radiance field the observation time is
matched to the SEVIRI scan pattern and thus varies with location. The HR product has ‘enhanced’
4
77
78
79
80
81
82
83
84
85
86
87
88
89
90
91
92
93
94
95
96
97
98
99
100

resolution with respect to the original GERB observations; this improved spatial resolution relies on
normalised SEVIRI based broadband radiance estimates and overlap between the GERB pixel PSFs to
provide information on the spatial variation of the scene within the GERB footprint. The SEVIRI
narrowband to broadband relationships used for this are based on regressions performed on both a
combination of simulated spectra and an observational dataset of matched broadband and SEVIRI
measurements. It is noted that the GERB HR products are consistent with the native resolution GERB
data at the larger GERB footprint scale and are designed to be used for creating custom averages. In
fact, previous comparisons between GERB and CERES reported in Clerbaux et al (2009) show that the
HR product is actually best suited for comparisons with other instruments as it has the effect of the
GERB PSF corrected and is not subject to temporal averaging. In addition to the unfiltered radiance,
the angular information in the GERB HR product is also used for the observational matching
performed here.
2.2 CERES data
For CERES, instantaneous TOA radiances are taken from Edition-3A of the Single Scanner Footprint
(SSF) product (Wielicki et al., 1996). This study uses data from the FM1 instrument on the sun-
synchronous Terra satellite (equator crossing times around 10:30 and 22:30 local time). FM1 is
chosen as it is the instrument to which the other CERES instruments are calibrated for the Edition 3A
products (Personal Comm, S. Thomas, December 2015). During the time period considered the FM1
instrument always operates in a cross-track scanning mode.
In addition to the unfiltered radiance, scene, angular information and measurements of the filtered
radiance in the CERES SSF product are also used for matching and classifying data. The filtered
radiance is the radiance that is directly measured by the instrument before spectral correction and
includes the effect of the instrument spectral response. The unfiltered radiances, RadU, and filtered
radiances, RadF are given by:
5
101
102
103
104
105
106
107
108
109
110
111
112
113
114
115
116
117
118
119
120
121
122
123
124

RadU=∫ L ( λ )dλ (1)
RadF=∫ L ( λ )φ(λ)dλ (2)
where λ is the wavelength, L(λ) is the spectral radiance and φ(λ) is the instrument spectral response.
The unfiltered-to-filtered radiance ratio α is defined as:
α=RadU /RadF (3)
2.3 Simulated Spectral Radiance Data
In Section 4, a study of the effects of a theoretical change in instrument spectral response is
presented. For this purpose, a large database of simulated spectral radiance curves is used (Clerbaux
et al., 2008, Clerbaux, 2008). The spectral radiance curves were simulated using the Santa Barbara
DISORT Atmospheric Radiative Transfer (SBDART) model (Ricchiazzi et al., 1998), and are modelled
for a wide variety of surface types for both clear and cloudy conditions. The surface types are
formed as a combination of two fundamental geotypes such as ocean and vegetation (labelled
‘primary’ and ‘secondary’ with abundance), with the spectral reflectance curves of the geotypes
themselves taken from the ASTER spectral library (Baldridge et al., 2009). Each scene type is
simulated at a variety of different viewing geometries: solar zenith angles from 0o to 80o in 10o
increments, viewing zenith angles from 0o to 85o in 5o increments and relative azimuth angles from 0o
to 180o in 10o increments. 50% of the simulations include clouds, made up of high-, mid- and low-
level overlapping layers. The altitude of the cloud layers is set at random with a uniform distribution
of probability in the ranges 0.5-3.5km (low), 4-7km (mid) and 7.5-16km (high). The respective optical
thickness at 0.55μm is also selected at random between 0.3 and 300 with a uniform distribution of
probability. The low-level clouds are always composed of water droplets and the high-level clouds of
ice crystals, with the phase of the mid-layer clouds either water or ice with equal probability. The
drop size distribution follows a gamma distribution stretched using the effective radius, which for
water (ice) is uniformly selected at random from within the 2-25μm (15-128μm) range.
6
125
126
127
128
129
130
131
132
133
134
135
136
137
138
139
140
141
142
143
144
145
146
147
148

3 Methodology
The method of matching the observations for comparison largely follows that of previous work (e.g.
Haeffelin et al., 2001, Clerbaux et al., 2009). The key objective is to achieve a sufficiently close
spatial, temporal and angular match between the GERB and CERES radiance observations.
Spatial matching is achieved by modelling the CERES PSF as a disk with radius RPSF, as described in
Clerbaux et al. (2009), where the radius in km is given by:
RPSF=20 /cos (VZACERES) . (4)
Here VZACERES is the CERES viewing zenith angle. RPSF is calculated for each CERES observation and the
matched GERB radiance is calculated as a weighted average of all GERB HR pixels whose centres fall
inside the CERES PSF disk. The weighting assigned to each contributing GERB HR pixel depends on
the distance of its centre from the CERES PSF disk centre according to a Gaussian weighting function,
with the Full Width Half Maximum (FWHM) taken to be RPSF. Mathematically, the average GERB
radiance RG is given by:
RG=∑ie−(12 ( xσ )
2
)
RGHRi (5)
where x is the distance between the centre of GERB HR pixel i and the CERES PSF centre and
σ=RPSF /√2 ln 2 (6)
The assumed shape of the CERES PSF is considered a reasonable simplification of the instrument
response and has been shown by Clerbaux et al (2008) to be sufficient to achieve a good match
between GERB and CERES. The additional weighting used here brings the approximation closer to
the characteristics of the actual CERES PSF (Priestley et al., 2010).
As noted in section 2.1 the GERB HR product is provided at 15 minute intervals, however the actual
time associated with each observation will vary about this time depending on its location. Hence, for
7
149
150
151
152
153
154
155
156
157
158
159
160
161
162
163
164
165
166
167
168
169
170

the temporal matching, a maximum absolute difference of 7.5 minutes is allowed between the times
of the GERB and CERES observations.
For the angular matching a threshold value of 8o is chosen as the maximum allowed angle between
the directions of the GERB and CERES observations. Sensitivity calculations from previous studies
have shown that for angles smaller than this there is no significant improvement in comparison
results (Clerbaux et al, 2009) and so 8o is used to maximize the number of matches between the two
instruments.
To ensure the highest quality data are used several additional selection criteria are enforced in this
study. Firstly, all GERB observations considered for comparison must have a viewing zenith angle and
a solar zenith angle less than 60o. This is due to increased errors associated with higher viewing
geometries (Russell, 2011). In order that all ocean scenes are identified correctly, a restriction is also
made that the ocean sun-glint angle must be greater than 25o. Lastly, matches are only considered
when both the GERB and CERES matched radiances are valid and non-zero (i.e. > 0 W m -2 sr-1).
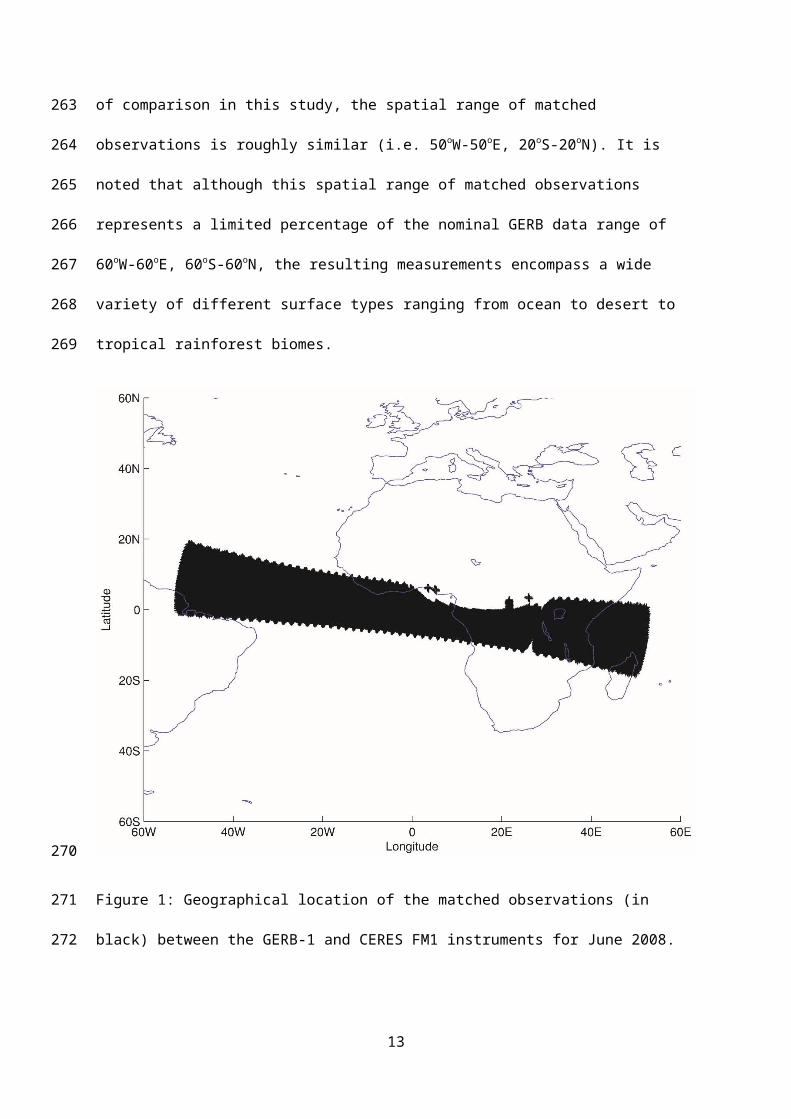
Figure 1 shows the matched observations between GERB-1 and CERES FM1 for June 2008 given the
restrictions detailed above. For all months of comparison in this study, the spatial range of matched
observations is roughly similar (i.e. 50oW-50oE, 20oS-20oN). It is noted that although this spatial range
of matched observations represents a limited percentage of the nominal GERB data range of 60oW-
60oE, 60oS-60oN, the resulting measurements encompass a wide variety of different surface types
ranging from ocean to desert to tropical rainforest biomes.
8
171
172
173
174
175
176
177
178
179
180
181
182
183
184
185
186
187
188
189

Figure 1: Geographical location of the matched observations (in black) between the GERB-1 and
CERES FM1 instruments for June 2008.
As previously discussed, we are attempting to diagnose and quantify the change in the GERB
calibration over time. A previous intercomparison of GERB and CERES SW unfiltered radiances
showed that the disparity between the measurements is best explained by multiplicative factors
(Clerbaux et al., 2009). Studies carried out by the present authors (not shown) show that linear
regressions between the GERB and CERES SW radiances produce intercepts that are extremely close
to zero and that this behaviour does not depend on the time period considered and does not
contribute to the evolution in the difference between GERB and CERES SW radiance.
The expected aging mechanism of the optical components suggests that calibration changes will be
dominated by a spectrally dependent loss of SW response. Such unaccounted for loss in instrument
9
190
191
192
193
194
195
196
197
198
199
200
201

throughput would manifest as an error in the spectral correction of the broadband GERB
measurements. This error will be a fraction of the observed radiance with the fractional value
dependent on the spectral properties of the scene observed, thus at each point in time a wide range
of fractional errors are expected in the dataset. To analyse the change we require a means to
classify the data according to the magnitude of the fractional error experienced. Comparing without
such a classification whether as a ratio or a regression will result in an apparently noisy picture with
an average effect dependent on the precise makeup of scenes and their spectral distribution of
energy. The classification must be sensitive enough to sufficiently limit the fractional change, but
also able to group all scenes with the same spectral properties so to minimise comparison noise.
Following the example of Loeb et al (2001), here we use the ratio of the unfiltered-to-filtered
radiance to classify the spectral properties of different scenes, subsetting the data into narrow
ranges of this ratio before comparison. Due to the effect of viewing and solar geometry for the
range of observations considered this provides a much better characterisation of the spectral
distribution of energy in the scene than could be obtained using the magnitude of the observed
radiance, the bi-directional reflectance or a simple scene type classification such as overcast or clear
ocean. Moreover, it can be shown to provide a much less noisy comparison for errors of this nature
than can be obtained from comparisons classified by these other means (see Loeb et al. 2001). It
also ensures that all scenes with the same spectral properties are included together, improving
comparison signal to noise. This classification isolates within each subset a given fractional change
which can be determined by considering the evolution in the ratio of GERB and CERES SW unfiltered
radiances within that subset. Although a linear regression could in theory also be used after
subsetting, some of the subsets have too narrow a range of radiances to make this approach robust,
and given the negligible contribution of any offset the ratio is more appropriate for our purposes.
In this study for reasons of utility we use the CERES unfiltered-to-filtered radiance ratio rather than
the equivalent quantity from GERB. Because of the similarity between the GERB and CERES optics
10
202
203
204
205
206
207
208
209
210
211
212
213
214
215
216
217
218
219
220
221
222
223
224
225
226

(i.e. mirror coatings and filter material) this provides the appropriate sensitivity and separation
although its absolute magnitude will differ from the corresponding GERB quantity due primarily to
the different number of mirrors employed by the two instruments.
4 Results
4.1 Yearly Comparisons
In the first instance, a comparison is made between CERES FM1 and GERB HR unfiltered radiances
for every June and December between 2004 and 2006 (GERB-2) and 2007 and 2012 (GERB-1). Two
“overlap” periods between GERB-2 and GERB-1 when both instruments were providing
measurements, running from January 13th to February 11th 2007 and May 1st to May 10th 2007,
are also considered. The numbers of CERES points matched (i.e. the number of matched
observations) for all of these periods are shown in Tables 1-3.
Table 1: Number of matches between GERB-2 and CERES FM1 for June and December 2004-2006.
Table 2: As for Table 1, but for GERB-1 and CERES FM1 for June and December 2007-2012.
Table 3: As for Table 1, but considering both GERB-1 and GERB-2 versus CERES FM1 for two overlap
periods, January 13th to February 11th 2007 and May 1st to May 10th 2007.
11
227
228
229
230
231
232
233
234
235
236
237
238
239
240
241
242
243
244

Matches are classified into subsets according to the CERES unfiltered-to-filtered radiance ratio αFM1.
In general, the highest unfiltered-to-filtered radiance ratios correspond to the “bluest” scenes (e.g.
clear dark ocean). For this analysis 46 subsets of the CERES FM1 unfiltered-to-filtered radiance
ratios are used covering the range from α FM1=1.285 to 1.400, with each interval having a width ∆α
FM1=0.0025. The percentage of matched points in each unfiltered-to-filtered radiance ratio subset is
shown in Figure 2 for June 2004 (blue) and December 2008 (red). The shapes of these distributions
are highly representative of what is seen across all the months and years considered in this study.
Figure 2: Percentage of matched observations in each CERES unfiltered-to-filtered radiance ratio
subset for GERB-2 and FM1 in June 2004 (red) and GERB-1 and FM1 in December 2008 (blue).
12
245
246
247
248
249
250
251
252
253
254
255
256
For each unfiltered to filtered radiance ratio subset a monthly comparison ratio M is calculated
from the average of the matched GERB and CERES radiances:
M α=¿ RadU ,GERB ,α> ¿¿RadU ,CERES , α>¿¿
¿ (7)
where ¿ RadU ,GERB. α>¿ is the average of the matched GERB unfiltered radiances for that month in
that subset of α with similar nomenclature applying for CERES. To obtain a measure of the variability
through the month a daily comparison ratio M,t is calculated from the daily average of the matched
unfiltered radiances in each αFM1 bin, viz:
M α ,t=¿RadU ,GERB, α ,t> ¿¿ RadU ,CERES ,α , t>¿¿
¿ (8)
for t=1:N , where N is the number of days in the month. The variability is then calculated as three
times the standard error in the sample
ε α=3 σ (M α ,t)
√(N−1)(9)
where σ is the standard deviation of the daily ratio. Following the example of Clerbaux et al. (2009)
we use ε α as a measure of the consistency within the month of the ratio calculated for each subset
and show its size as bars around the overall monthly ratio in the following plots (Figures 3, 4 and 5).
To ensure a sufficient distribution of matched observations in the calculation of this variability, a
daily Mα,t is only calculated if there are at least 50 matched observations in the relevant FM1 and t
bin.
4.1.1 GERB-2
Figure 3 illustrates the monthly GERB/CERES SW unfiltered radiance ratios Mα, as a function of αFM1,
for GERB-2 for (a) June and (b) December 2004-2006. The associated variability through the month
for each , εα, is shown by the vertical error bars. For both June and December there is a broad
13
257
258
259
260
261
262
263
264
265
266
267
268
269
270
271
272
273
274
275
276
277

decrease in M between 2004 and 2006 for all αFM1 bins. The average value of Mα calculated across
all subsets of αFM1, shows absolute decreases from 1.036 to 1.016 (June) and from 1.034 to 1.006
(December). These correspond to percentage decreases of 1.9% and 2.7% respectively. It is noted
that the average GERB-2 radiances calculated across all subsets of αFM1 are 44.528 W m-2 sr-1 and
50.197 W m-2 sr-1 in June and December 2004, respectively.
However, the year-to-year changes are by no means consistent across all αFM1 subsets. Considering
the June months, for values of FM1 less than 1.37 a regular decrease is generally seen from year-to-
year. However for αFM1 greater than 1.37, this is not the case, with Mα noticeably larger in June 2006
than in June 2005. For the December months, a decrease is seen from year-to-year across all αFM1,
except in the range 1.3 to 1.32 where Mα appears to show little change between December 2005 and
December 2006. Furthermore, for both the June and December months the largest percentage
changes from year-to-year are noticeably larger for matched observations where αFM1 is greater than
1.37. With reference to Fig. 2, this suggests that a minority of the overall matched observations are
dominating the average values of Mα calculated using an equal weighting across the bins. As
mentioned previously, these matched observations at the highest unfiltered-to-filtered radiance
ratios correspond to the “bluest” scenes, which would be most sensitive to changes in the
instrument SW spectral response at the shortest wavelengths in the visible and UV. We consider this
further in Section 4.2.
14
278
279
280
281
282
283
284
285
286
287
288
289
290
291
292
293
294
295

Figure 3: GERB/CERES radiance ratios, M, as a function of CERES unfiltered-to-filtered radiance ratio
subset, FM1, for (a) June 2004-2006 and (b) December 2004-2006. Each separate year is shown as a
different colour in each individual figure.
4.1.2 GERB-1
15
296
297
298
299
300

Figure 4. GERB/CERES radiance ratios, M, as a function of CERES unfiltered-to-filtered radiance ratio
subset, FM1, for (a) June 2007-2012 and (b) December 2007-2012. Each separate year is shown as a
different colour in each panel.
Figure 4 illustrates the GERB/CERES SW unfiltered radiance ratios Mα as a function of αFM1, for GERB-
1 for (a) June and (b) December for all years from 2007 to 2012. As for the previous comparisons, the
associated variability estimates, εα, are shown by the vertical error bars. For both the June and
December comparisons there is a marked decrease in Mα between 2007 and 2012. Between June
2007 and June 2012 (Fig 4(a)), the average Mα, calculated across all values of FM1 decreases from
0.9899 to 0.9256, equating to a 6.5% decrease. At values of FM1 less than 1.37, this decrease occurs
at a consistent rate in each FM1 bin but varies from bin to bin with the long-term decrease in Mα
between June 2007 and June 2012 becoming larger as αFM1 increases. For αFM1 greater than 1.37,
16
301
302
303
304
305
306
307
308
309
310
311
312

whilst there is a clear long-term decreasing trend, Mα does not decrease consistently from year-to-
year.
Between December 2007 and December 2012 (Fig 4(b)), the average Mα calculated across all αFM1
decreases from 0.9782 to 0.9176, a 6.2% decrease. As for the June months, up to an unfiltered-to-
filtered radiance ratio of 1.37, Mα is seen to decrease with time. However the rate of this decrease is
not as consistent from year to year. This non-constant rate of change is even more apparent for αFM1
greater than 1.37, although again there is a clear long-term decrease in Mα. In common with the
June results, the long-term decrease in Mα between December 2007 and December 2012 becomes
larger as αFM1 increases.
4.1.3 GERB-2/GERB-1 Overlap Periods
17
313
314
315
316
317
318
319
320
321
322
323
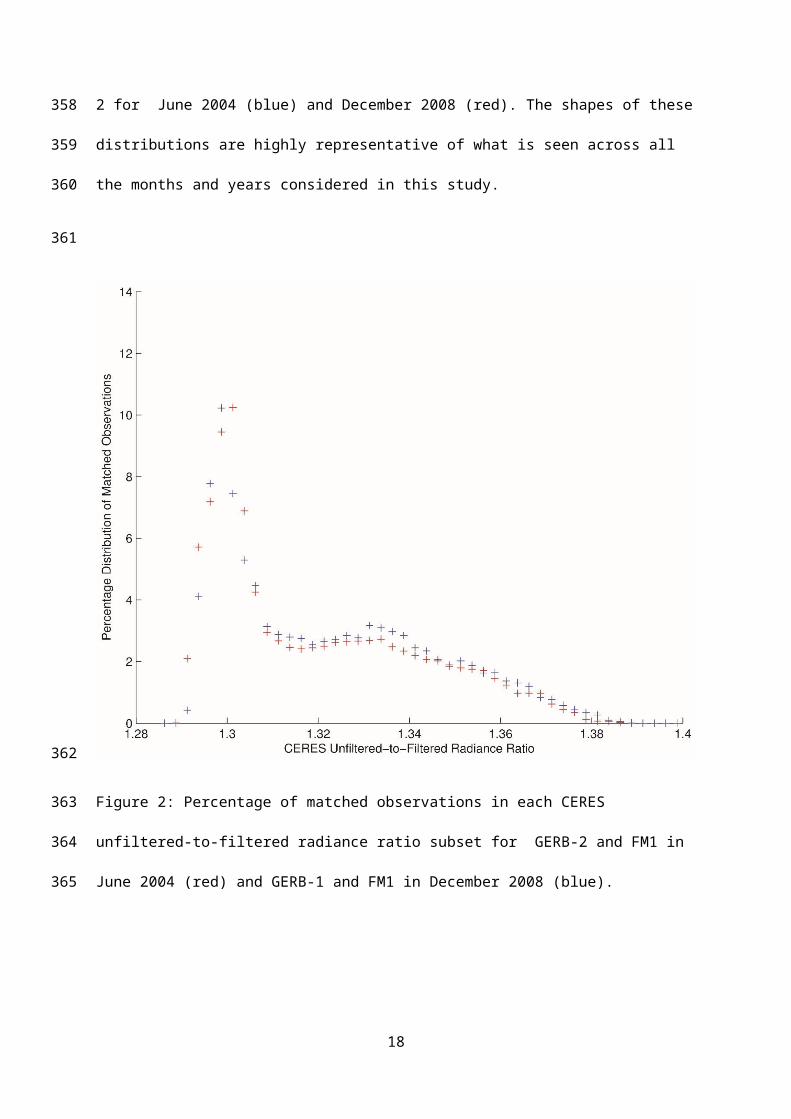
Figure 5: GERB/CERES radiance ratios, M, as a function of CERES unfiltered-to-filtered radiance ratio
subset, FM1, for (a) January 13th to February 11th 2007 and (b) May 1st to May 10th 2007.
Figure 5 shows Mα as a function of αFM1 for both GERB-2 and GERB-1 for (a) January 13th to February
11th 2007 and (b) May 1st to May 10th 2007. Again, the associated variability estimates, εα, are
shown by the vertical error bars. Both overlap periods show that Mα is generally lower for GERB-1
than for GERB-2. For the first overlap period (Fig 5(a)), averaging M across all αFM1 gives values of
1.0030 for GERB-2 and 0.9872 for GERB-1, corresponding to a 1.6% difference. This average offset is
dominated by the larger differences at lower values of αFM1; for αFM1 greater than 1.37 there is a
negligible difference. For the second overlap period (Fig 5(b)), an average across all αFM1 gives values
of 1.0131 for GERB-2 and 0.9934 for GERB-1, corresponding to a 1.9% difference. As for the first
overlap period, this difference is dominated by the large changes at lower values of αFM1, however
there is now a noticeable difference between GERB-2 and GERB-1 at all αFM1.
Between the first and second overlap periods, Mα shows an average increase of 1.0% for GERB-2 and
0.6% for GERB-1. This is mostly driven by changes in the higher unfiltered-to-filtered radiance ratios
(αFM1 greater than 1.37), which have been observed in all previous comparisons to be the unfiltered-
to-filtered radiance ratios at which Mα is the most variable. It is noted that between the two overlap
periods the two GERB instruments underwent orbital relocations in conjunction with the change of
operations from Meteosat-8 (GERB-2) to Meteosat-9 (GERB-1), which could have contributed to the
systematic offset between the two periods. Whilst such systematic effects will contribute an error to
the determined absolute calibration difference between GERB and CERES, only data from a stable
orbital position are used to study the evolution of the GERB 1 and 2 instrument calibrations. As such,
they should be stable through the study period and should not affect the changes observed.
4.2 Attribution
18
324
325
327
328
329
330
331
332
333
334
335
336
337
338
339
340
341
342
343
344
345
346
347

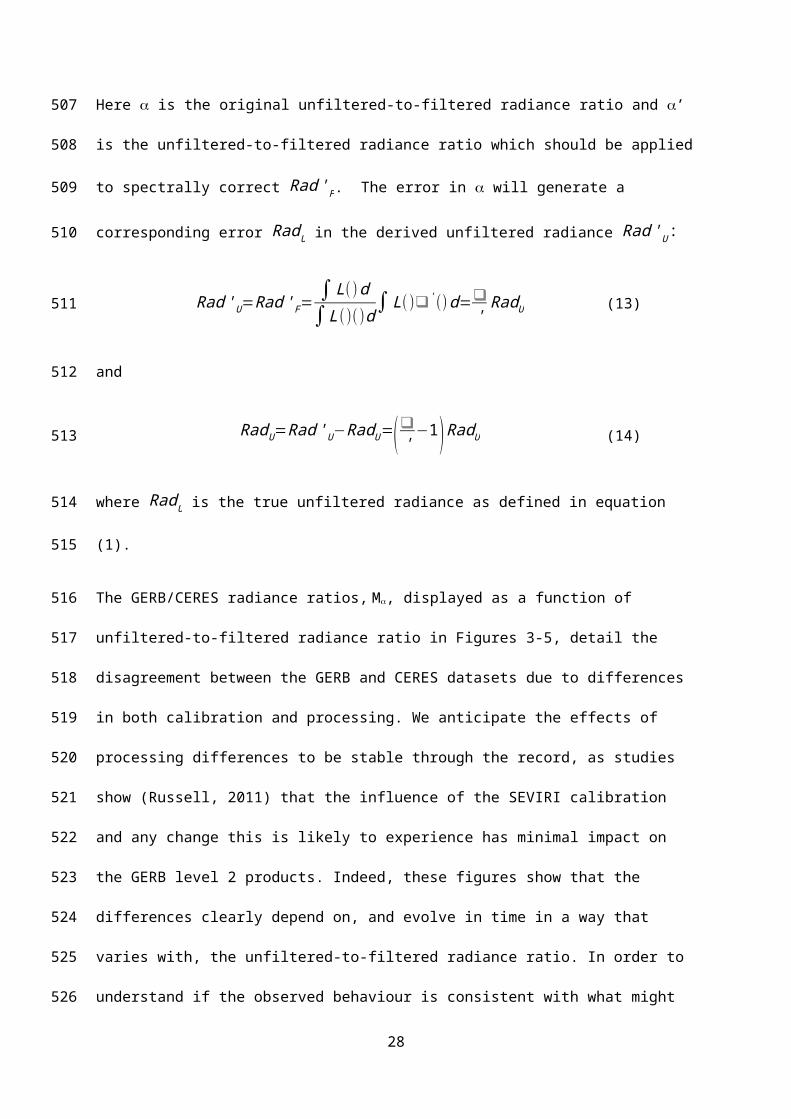
For broadband observations such as those made by GERB and CERES, we may consider calibration
errors due to changes in instrument response in terms of the discrepancy between the actual
spectral response of the instrument (’) and the spectral response assumed for the ‘spectral
correction’ process ().
( )=' ()−() (10)
Equations (1), (2) and (3) imply that the radiance actually measured by the instrument, Rad 'F, will
be:
Rad 'F=∫ L()❑' ()d (11)
Spectrally correcting this measurement with the assumed spectral response, , will result in an error
as the treatment will not correctly remove the effect of the true instrument spectral response ’.
This error will propagate to give an error in unfiltered-to-filtered radiance ratio, :
¿❑'−¿∫L()d
∫ L() ' ()d−
∫ L()d
∫L( )( )d(12)
Here is the original unfiltered-to-filtered radiance ratio and ’ is the unfiltered-to-filtered radiance
ratio which should be applied to spectrally correct Rad 'F. The error in will generate a
corresponding error RadU in the derived unfiltered radiance Rad 'U :
Rad 'U=Rad 'F=∫L()d∫L()()d∫
L()❑'( )d=❑'RadU (13)
and
RadU=Rad 'U−RadU=(❑' −1)RadU (14)
where RadU is the true unfiltered radiance as defined in equation (1).
19
348
349
350
351
352
353
354
355
356
357
358
359
360
361
362
363
364
365
366

The GERB/CERES radiance ratios, M, displayed as a function of unfiltered-to-filtered radiance ratio
in Figures 3-5, detail the disagreement between the GERB and CERES datasets due to differences in
both calibration and processing. We anticipate the effects of processing differences to be stable
through the record, as studies show (Russell, 2011) that the influence of the SEVIRI calibration and
any change this is likely to experience has minimal impact on the GERB level 2 products. Indeed,
these figures show that the differences clearly depend on, and evolve in time in a way that varies
with, the unfiltered-to-filtered radiance ratio. In order to understand if the observed behaviour is
consistent with what might be expected from theory, we first consider the effect of a SW darkening
of the GERB spectral response which is most severe at the shortest wavelengths, such as that
suggested by Matthews et. al. (2005) where:
❑'()={()ea (−0.5 )<0.5m()0.5m
, (15)
with a=−4 ln 0.4 . Applying this form of change to the GERB-2 spectral response results in the blue
curve shown in Figure 6, which has been superposed on the original GERB spectral response in red.
Both curves were applied to the SBDART radiance database described in section 2.3 to generate 750
values of G and G’ (the G subscript indicating that they are derived from the GERB spectral
response) encompassing a wide variety of scene types, solar illumination and observation angles.
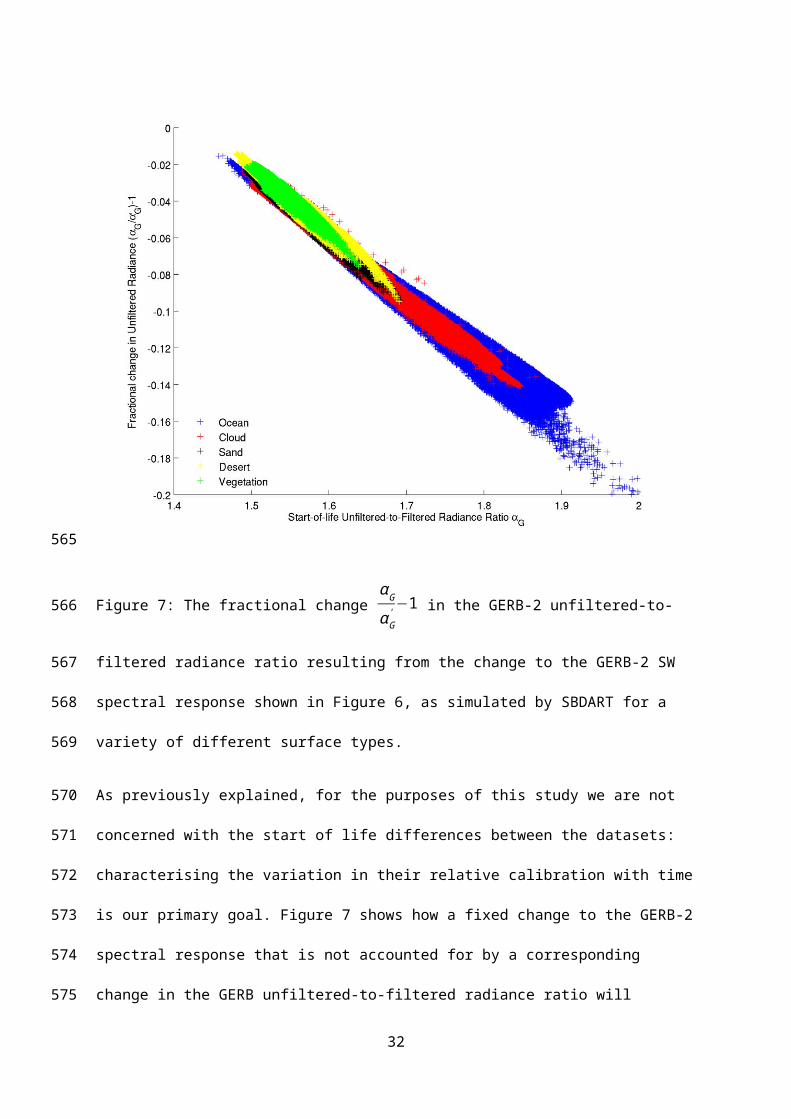
Figure 7 shows the relationship between the fractional change in the unfiltered radiance RadU/RadU
, given by (G /G’) -1 (equation 14), against the unfiltered-to-filtered radiance ratio G
corresponding to the unaltered spectral response. The results clearly demonstrate how for this case
the strong spectral signature of translates to an error in the unfiltered radiance which is linearly
related to the magnitude of G . It is noted that the relatively small spread around the linear relation
for all but the highest unfiltered-to-filtered radiance ratios (associated with the bluest ocean scenes)
indicates that except in these extreme cases the spectral correction error is much less sensitive to
the finer details of the scene, illumination and viewing geometry not captured in the unfiltered-to-
20
367
368
369
370
371
372
373
374
375
376
377
378
379
380
381
382
383
384
385
386
387
388
389
390

filtered radiance ratio. Indeed, this highlights how the unfiltered-to-filtered radiance ratio is a good
proxy for the spectral properties of the scene and can thus be useful for studying the effects of
instrument calibration differences. By contrast, a simple scene type classification such as ‘cloud’ or
‘desert’ does not isolate the change in the filtered radiance. Indeed, the results in Figure 7 show
that a wide range of fractional change is observed within these classifications.
Figure 6: GERB-2 start-of-life SW instrument spectral response (red). The simulated change in
spectral response considered in this study, as described by Eq. 15, is shown in blue.
21
391
392
393
394
395
396
397
398
399

Figure 7: The fractional change αGαG' −1 in the GERB-2 unfiltered-to-filtered radiance ratio resulting
from the change to the GERB-2 SW spectral response shown in Figure 6, as simulated by SBDART for
a variety of different surface types.
As previously explained, for the purposes of this study we are not concerned with the start of life
differences between the datasets: characterising the variation in their relative calibration with time
is our primary goal. Figure 7 shows how a fixed change to the GERB-2 spectral response that is not
accounted for by a corresponding change in the GERB unfiltered-to-filtered radiance ratio will
manifest as an error in the unfiltered radiance. This resulting error varies in a way that can be
characterised by the unfiltered-to-filtered radiance ratio. Figure 7 is an example of the error at a
fixed point in time, so is analogous to the difference between the curves for different years shown
for GERB 2 and GERB 1 in Figures 3 and 4. When such an error increases with time, the increasing
22
400
401
402
403
404
405
406
407
408
409
410
411

error in the unfiltered radiance will manifest in the radiance ratio M. Figure 7 also indicates that
any error in the unfiltered radiance, and hence M, shows little variation for a given unfiltered-to-
filtered radiance ratio, αG. As such, given a stable CERES unfiltered radiance in the denominator of
M, performing a time-series analysis of the evolution of M, stratified by unfiltered-to-filtered
radiance ratio, should provide good insight into how both the magnitude and spectral characteristics
of a change in instrument spectral response vary with time.
Table 4: A list of months in which comparisons are made between GERB-2 and the CERES instrument
FM1.
Table 5: As for Table 4, but for GERB-1.
23
412
413
414
415
416
417
418
419
420
421
422
423

Figure 8: Values of the GERB-2/CERES radiance ratios Mα calculated for each month in Table 4, for
the subsets of αFM1 between 1.2975 and 1.3000 (black) and 1.3750 and 1.3775 (magenta). A linear
regression is applied to each plot and the fitted line is plotted in their respective colour.
24
424
425
426
427

Figure 9: As Figure 8, but for GERB-1, for each month in Table 5.
Assuming that errors in the CERES FM1 unfiltered radiance are stable over time, a statistical time-
series analysis performed on Mα for both GERB-2 and GERB-1 can be used to study the calibration
evolution of the GERB instruments. We note that for practical reasons the comparison uses αFM1
rather than αG to stratify the radiance ratios. The similarity between the CERES and GERB
instrument optics makes this substitution appropriate for our needs. As both employ the same UV
enhanced silver coating on their mirrors and a quartz filter, for the SW channel the characteristic
drop in response below 0.5m dominates the shape of the instrument spectral response and drives
the scene variation of the unfiltered-to-filtered radiance ratio. As GERB uses five mirrors, compared
to the two of CERES, the drop and hence range of unfiltered-to-filtered radiance ratios is larger for
25
428
429
430
431
432
433
434
435
436
437
438
439

GERB, however studies (not shown) for the range of spectra covered by the SBDART radiance
database demonstrate a simple linear relation between the unfiltered-to-filtered radiance ratios is
expected for the two instruments. Thus, using the CERES unfiltered-to-filtered radiance ratios here
should have no substantive effect on the calibration change derived, although an additional step will
be needed to correctly map the change to the GERB scene. Tables 4 and 5 illustrate the comparison
months included in this analysis. Values of Mα are calculated for each of these months and a linear
regression fit on Mα with time is made separately for each αFM1 subset. The result of the linear
regression provides an estimate of the monthly decrease in Mα, M α, as well as a standard error on
the estimate for each fit, SEα. Figure 8 illustrates two examples of these linear regression fits for
GERB-2 for the subsets of αFM1 between 1.2975 and 1.3000 (black) and 1.3750 and 1.3775 (magenta).
In these cases the linear fits produce values of M α and SEα of 4.83x10⁻⁴ per month and 9.48x10⁻⁵ per
month (black) respectively and 1.64x10⁻³ per month and 2.78x10⁻⁴ per month (magenta)
respectively. Two further examples are shown in Figure 9, for the same subsets of αFM1 but for GERB-
1. In these cases, each linear fit produces values of M α and SEα of 6.50x10⁻⁴ per month and 2.08x10⁻⁵
per month (black) respectively and 1.52x10⁻³ per month and 7.94x10⁻⁵ per month (magenta)
respectively. Consistent with observations in Section 4, the change in Mα appears larger at the higher
unfiltered-to-filtered radiance ratios (indicated by the higher values of M α).
The differences between the GERB 1 and GERB 2 results are confirmed in Figure 10, which plots M α
and SEα for every unfiltered-to-filtered radiance ratio subset for GERB-2 (red) and GERB-1(blue). For
both GERB-2 and GERB-1, for all αFM1 M α is negative (i.e. Mα decreasing with time). In each case, the
values of SEα are substantially larger for unfiltered-to-filtered radiance ratios greater than 1.37,
indicating that at high αFM1, the decrease in Mα with time is less clearly linear. Nevertheless, for αFM1
less than 1.37, SEα for both instruments is reasonably small, suggesting that for all but the very
bluest scenes the decrease in Mα is well fitted by a linear trend. It is noted that for the vast majority
of points (αFM1 less than 1.37), the decrease in Mα is larger for GERB-1 then for GERB-2.
26
440
441
442
443
444
445
446
447
448
449
450
451
452
453
454
455
456
457
458
459
460
461
462
463
464

Figure 10: The value of the monthly decrease in the ratio between GERB and the CERES FM1
unfiltered radiance, M α, as fitted by linear regression for each subset in CERES unfiltered-to-filtered
radiance ratio αFM1, for GERB-2 (red) and GERB-1 (blue), for the months shown in Tables 4 and 5.
Each value of M α is shown with the associated standard error, SEα, of the fit.
For both GERB-2 and GERB-1, the absolute magnitude of M α is seen to increase with αFM1, indicating
that Mα decreases faster at higher αFM1. The variation of M α with αFM1 can be characterised by the
slope, d M α
dα, determined from an error weighted linear regression fit. Each point is weighted in the
regression with respect to the inverse of the square of its standard error (i.e. 1¿¿
, ) such that more
significance is given to the values of M α which are considered most accurate. For GERB-1, this
27
465
466
467
468
469
470
471
472
473
474
475
weighted fit gives d M α
dα as -0.0117±0.0002 per month per unfiltered-to-filtered radiance ratio,
where the error quoted is the standard error on the weighted fit. The ordinary R2 for this fit is 0.99.
Equation 14 showed that an error in the unfiltered radiance (❑' −1)RadU, where RadU is the true
unfiltered radiance, is introduced if filtered radiances are spectrally corrected with an assumed
factor of α when in fact the true unfiltered-to-filtered radiance ratio is α’. Considering how this
affects the GERB/CERES radiance ratio Mα over time, assuming that any error in the CERES FM1
unfiltered radiance is constant through time, from equation 14 we may write:
M α=( αGα 'G−1) RadU ,GERBRadU ,CERES(16)
where in this case RadU ,GERB and RadU ,CERES are the GERB and CERES unfiltered radiances at the
start of the comparison period, αG is the GERB unfiltered-to-filtered radiance ratio used to spectrally
correct the GERB data (a constant for each instrument through the comparison period), and α’G is
the value of the unfiltered-to-filtered radiance ratio required at each time step to maintain a stable
unfiltered GERB radiance equal to the start of comparison period value. It follows that:
M α∝( αGα 'G−1) (17)
Previously, it was shown that for the simulated SW darkening response given by equation 15, the
factor αGαG' −1 was linear with αG. Given a linear relation between the GERB and CERES unfiltered-to-
filtered radiance ratios, we may substitute kFM1 for G (k is a constant), and thus retain the
proportionality relation. As can be seen from Figure 10, as well as from the standard error and the
28
476
477
478
479
480
481
482
483
484
485
486
487
488
489
490
491
492
493
494
495

ordinary R2 value of the weighted fit of M α versus , for GERB-1 the variation of M α with αFM1 is
highly linear. Assuming stable accuracy in the unfiltered radiances from FM1 over the comparison
period, this result shows that the evolution of the GERB-1 unfiltered radiance calibration is
consistent with the general type of SW darkening described by Equation 15 and shown in Figure 6,
where the magnitude of SW darkening increases with decreasing wavelength.
For GERB-2 a weighted linear regression fit produces a value for d M α
dα of -0.0082±0.0009 per month
per unfiltered-to-filtered radiance ratio, with an ordinary R2 value of 0.71, suggesting the variation is
less clearly linear than for GERB-1. Further attempts at non-linear regression with higher order
polynomial and exponential fits produce poor fits. The results could be due to noise in the GERB-2
comparisons masking the linear decrease, a breakdown in the assumption of constancy for the
CERES unfiltered radiance for this time period, or due to true non-linear variations in the GERB-2
response evolution such as step changes driven by particular events. Such step changes would not
be wholly unexpected for GERB-2 as it experienced two instrument anomalies during its operation
which resulted in it directly viewing the sun and the loss of some GERB HR pixels. Although the
GERB HR pixels lost are outside the comparison area these events would result in large
instantaneous UV exposure to the primary optics which could potentially introduce step changes to
the calibration. Nonetheless, the values of SEα shown in Figure 10 are still relatively small for GERB-
2, indicating a reasonable degree of linearity in how Mα decreases with time at a particular
unfiltered-to-filtered radiance ratio, implying there is a significant linear component to the GERB-2
evolution. Given that the values of M α for GERB-2 are of similar magnitude to those calculated for
GERB-1 and are observed to decrease with αFM1, this suggests that the linear component of the
calibration evolution is a spectrally similar SW darkening loss of response.
5 Summary and Discussion
29
496
497
498
499
500
501
502
503
504
505
506
507
508
509
510
511
512
513
514
515
516
517
518
519
In this study, the evolution of the GERB-2 and GERB-1 HR calibration has been investigated, through
comparison with CERES Edition 3A SSF instantaneous radiances from FM1. These comparisons have
been made by analyzing the evolution of monthly averaged GERB/CERES unfiltered radiance ratios,
Mα, stratified as a function of CERES FM1 unfiltered-to-filtered radiance ratio, FM1. For GERB-2,
between June (December) 2004 and June (December) 2006, Mα showed an average decrease of 1.9%
(2.7%). For GERB-1, between June (December) 2007 and June (December) 2012, Mα showed an
average decrease of 6.5% (6.2%). Two overlap periods, January 13th to February 11th 2007 and May
1st to May 10th 2007 were considered for both GERB-2 and GERB-1. On average, the GERB-1/CERES
unfiltered radiance ratio was 1.6% (Jan-Feb) and 1.9% (May) smaller than the corresponding GERB-
2/CERES unfiltered radiance ratio.
Further analysis showed that the evolution of Mα varied with the unfiltered-to-filtered radiance ratio
of the scene. This implies that the magnitude of the decrease in Mα with time (M α ) is dependent on
the spectral properties of the scene being observed. For GERB-1, further time-series analysis showed
that M α was a linear function of the CERES unfiltered-to-filtered radiance ratio αFM1, with the
radiance ratios associated with the highest unfiltered-to-filtered radiance ratios (i.e. the bluest
scenes) displaying the greatest monthly decrease. For GERB-2, the greatest monthly decrease was
again found to occur at the highest unfiltered-to-filtered radiance ratios. However the regularity of
the monthly decrease and the presence of a linear trend in its magnitude across the entire range of
unfiltered-to-filtered radiance ratios were not as obvious as for GERB-1.
In order to better understand the nature of the calibration evolution, a theoretical study was
performed considering the effect of spectrally varying shortwave darkening. Here, the GERB-2 start-
of-life SW spectral response function was reduced according to the exponential function of
wavelength derived by Matthews et al. (2005) as a fit to an observed change to the CERES spectral
response. This altered GERB-2 spectral response function was then applied to simulated spectral
radiance curves for a variety of different scenes and geometries to calculate associated unfiltered
30
520
521
522
523
524
525
526
527
528
529
530
531
532
533
534
535
536
537
538
539
540
541
542
543
544

and filtered radiances. By comparison with the radiances calculated from the same curves, but with
the original (unaltered) GERB-2 spectral response, the error which results if an appropriate update is
not applied to the unfiltered-to-filtered radiance ratios was determined. The resulting error in the
unfiltered radiance is given by the fractional change that should be made to the unfiltered-to-filtered
radiance ratio and is a highly linear function of the original unfiltered-to-filtered radiance ratio.
Assuming the accuracy of the CERES FM1 unfiltered radiance is constant over the comparison
period, the evolution of the GERB unfiltered radiance error drives the observed decrease in the
GERB/CERES unfiltered radiance ratio Mα. Thus it was shown that the rate of decrease of the ratio,
M α, is proportional to the fractional change required to correct the original unfiltered-to-filtered
radiance ratio.
This study was concerned with the evolution of the GERB/CERES SW radiance ratio over time. The
GERB SW fluxes are derived from the SW unfiltered radiance by application of a radiance to flux
multiplier which depends on the scene and the solar and viewing geometry but not on the GERB
radiance itself. Thus the multiplier itself is insensitive to the GERB calibration evolution and a given
percentage change in the GERB SW radiance will manifest the same percentage change in the GERB
SW flux. Under the assumption that CERES FM1 has stable calibration and that the unfiltered-to-
filtered ratio isolates the magnitude of GERB calibration change, it can be shown that the fractional
change in the GERB/CERES radiance ratio for a given unfiltered-to-filtered radiance ratio subset αFM1
will equal the fractional change in both the GERB SW unfiltered radiance and the GERB SW flux. For
the most populated subset classification (αFM1 = 1.2975-1.3000) the derived change to the
GERB/CERES ratio Mα corresponds to an annual decrease of 0.8% in the ratio and hence in the GERB
SW radiances and associated fluxes in this subset. For GERB-1 the annual decrease in the ratio for
over 95% of the matched cases and hence expected in the GERB SW radiance and associated flux is
in the range 0.6% to 1.6%. For GERB-2 this corresponding range in annual decrease is 0.5% to 1.2%.
31
545
546
547
548
549
550
551
552
553
554
555
556
557
558
559
560
561
562
563
564
565
566
567
568
Is it reasonable to assume that CERES FM1 has a stable calibration? We consider that such an
assumption is justified for the Ed 3A FM1 SW dataset used here as it is the result of extensive cross-
validation checks that have been consistently performed on FM1 throughout time with the other
CERES instruments, other instruments and various calibration targets (Loeb et al., 2006, Priestley et
al., 2011, Shankar et al., 2014). These studies resulted in corrections being applied where needed in
the Edition 3 processing to account for the type of spectral response changes studied in Matthews et
al. (2005). Indeed, the remaining CERES flight models are inter-calibrated to FM1. With this
assumption, the results reported here show that the GERB-1 Edition 1 unfiltered SW radiances have
been systematically darkening over time due to a spectrally varying SW darkening of the GERB-1
spectral response function which is most pronounced at the shortest wavelengths.
Further work is required to refine the final correction that will need to be applied within the GERB
calibration to account for this change and it is expected that additional studies including vicarious
targets and extending the comparison to the full GERB field of the view will be made. However the
results shown here clearly show that a correction to the GERB-1 unfiltered SW radiances or update
to the GERB-1 unfiltered-to-filtered radiance ratios may potentially be applied as a linear trend in
time and as a linear function of unfiltered-to-filtered radiance ratio. For GERB-2, although there is
some similarity in the observed darkening, the variation in time is less well behaved and the
variation of M α with unfiltered-to-filtered radiance ratio is not so obviously linear. This hints that
changes to the GERB-2 SW spectral response may have occurred that are more variable in time and
include more complex spectral components than those considered here. Nevertheless, much of the
monthly decrease in Mα for each subset of αFM1 can be explained by a simple linear function, and a
correction of this form should go much of the way to compensating for the GERB-2 calibration
evolution.
Acknowledgments
32
569
570
571
572
573
574
575
576
577
578
579
580
581
582
583
584
585
586
587
588
589
590
591
592
593

This work was funded by EUMETSAT as part of the GERB 4 instrument programme. R.Bantges and
H.Brindley are supported by NCEO grant PR140015. The authors are grateful to the Atmospheric
Sciences Data Center at NASA Langley Research Center for providing the CERES data used in this
work. The helpful comments of two anonymous reviewers are greatly acknowledged.
References
Baldridge, A. M., S.J. Hook, C.I. Grove and G. Rivera, (2009) The ASTER Spectral Library Version 2.0.
Remote Sensing of Environment, vol 113, pp. 711-715.
Clark & Dibattista (1978) Space Qualification of Optical-Instruments using NASA Long Duration
Exposure Facility, Optical Engineering, 17(5), pp 547-552.
Clerbaux, N., (2008) Processing of Geostationary Satellite Observations for Earth Radiation Budget
Studies. Doctoral Thesis.
Clerbaux, N., et al. (2008) Unfiltering of the Geostationary Earth Radiation Budget (GERB) Data. Part
I: Shortwave Radiation, Journal of Atmospheric and Oceanic Technology, 25(7), 1087-1105.
Clerbaux, N., et al. (2009): "Comparison of GERB instantaneous radiance and flux products with
CERES Edition-2 data." Remote Sensing of Environment 113.1: 102-114.
33
594
595
596
597
598
599
600
601
602
603
604
605
606
607
608
609
610
611
612
613
614

Dewitte, S., Gonzalez, L., Clerbaux, N., Ipe, A., Bertrand, C., & De Paepe, B. (2008). The geostationary
earth radiation budget edition 1 data processing algorithms. Advances in Space Research, 41(11),
1906-1913.
Haeffelin, M., Wielicki, B., Duval, J. P., Priestley, K., & Viollier, M. (2001). Inter-calibration of CERES
and ScaRaB Earth radiation budget datasets using temporally and spatially collocated radiance
measurements. Geophys. Res. Lett., 28, 167−170.
Harries, J., Russell, J., Hanafin, J., Brindley, H., Futyan, J., Rufus, J., et al. (2005). The geostationary
earth radiation budget project. Bulletin of the American Meteorological Society, 86(7), 945−960.
Loeb N., et al. (2001) Determination of unfiltered radiances from the clouds and the Earth's Radiant
Energy System instrument, J. Appl Meteo.V 40 pp 822-835
Loeb, N. et al. (2006) Multi-Instrument Comparison of Top-of-Atmosphere Reflected Solar Radiation.
J of Climate V 20 p 575-591
Matthews, G., Priestley, K., Spence, P., Cooper, D., & Walikainen, D. (2005, August). Compensation
for spectral darkening of short wave optics occurring on the Cloud's and the Earth's Radiant Energy
System. In Optics & Photonics 2005 (pp. 588212-588212). International Society for Optics and
Photonics.
34
615
616
617
618
619
620
621
622
623
624
625
626
627
628
629
630
631
632
633
634
635
636

Priestley, K. J., Thomas, S., & Smith, G. L. (2010). Validation of point spread functions of CERES
radiometers by the use of lunar observations. Journal of Atmospheric and Oceanic Technology, 27(6),
1005-1011.
Priestley, K. et al. (2011). Radiometric Performance of the CERES Earth Radiation Budget Climate
Record Sensors on the EOS Aqua and TerraSpacecraft through April 2007 Preistley et al. 2011 JAOT
V28 pp3-21
Ricchiazzi, P., Yang, S., Gautier, C. & Sowle, D. (1998). SBDART: A Research and Teaching Software
Tool for Plane-Parallel Radiative Transfer in the Earth's Atmosphere. Bulletin of the American
Meteorological Society , 79, 21012114.
Russell. J.E. Quality Summary for GERB EDITION 1 (2011). Available online at:
http://ggsps.rl.ac.uk/GERBED1_ARG_QS_v2.pdf
Schmetz, J., Pili, P., Tjemkes, S., Just, D., Kerkmann, J., Rota, S., et al. (2002). An introduction to
Meteosat Second Generation (MSG). Bulletin of the American Meteorological Society, 83, 977−992.
Shankar, M., Priestley, K., Smith, N., Thomas, S., & Walikainen, D. (2014, September). On-orbit
stability and performance of the Clouds and Earth’s Radiant Energy System (CERES) Instrument
35
637
638
639
640
641
642
643
644
645
646
647
648
649
650
651
652
653
654
655
656
657

Sensors onboard the Aqua and Terra Spacecraft. In SPIE Optical Engineering+ Applications (pp.
92180Q-92180Q). International Society for Optics and Photonics.
Wielicki, B. A., Barkstrom, B. R., Harrison, E. F., Lee, R. B., III, Smith, G. L., & Cooper, J. E. (1996).
Clouds and the Earth's Radiant Energy System (CERES): An earth observing system experiment.
Bulletin of the American Meteorological Society, 77, 853−868.
List of Figure Captions
Figure 1: Geographical location of the matched observations (in black) between the GERB-1 and
CERES FM1 instruments for June 2008.
Figure 2: Percentage of matched observations in each CERES unfiltered-to-filtered radiance ratio
subset for GERB-2 and FM1 in June 2004 (red) and GERB-1 and FM1 in December 2008 (blue).
Figure 3: GERB/CERES radiance ratios, M, as a function of CERES unfiltered-to-filtered radiance ratio
subset, FM1, for (a) June 2004-2006 and (b) December 2004-2006. Each separate year is shown as a
different colour in each individual figure.
Figure 4. GERB/CERES radiance ratios, M, as a function of CERES unfiltered-to-filtered radiance ratio
subset, FM1, for (a) June 2007-2012 and (b) December 2007-2012. Each separate year is shown as a
different colour in each panel.
Figure 5: GERB/CERES radiance ratios, M, as a function of CERES unfiltered-to-filtered radiance ratio
subset, FM1, for (a) January 13th to February 11th 2007 and (b) May 1st to May 10th 2007.
Figure 6: GERB-2 start-of-life SW instrument spectral response (red). The simulated change in
spectral response considered in this study, as described by Eq. 15, is shown in blue.
36
658
659
660
661
662
663
664
665
666
667
668
669
670
671
672
673
674
675
676
677
678

Figure 7: The fractional change αGαG' −1 in the GERB-2 unfiltered-to-filtered radiance ratio resulting
from the change to the GERB-2 SW spectral response shown in Figure 6, as simulated by SBDART for
a variety of different surface types.
Figure 8: Values of the GERB-2/CERES radiance ratios Mα calculated for each month in Table 4, for
the subsets of αFM1 between 1.2975 and 1.3000 (black) and 1.3750 and 1.3775 (magenta). A linear
regression is applied to each plot and the fitted line is plotted in their respective colour.
Figure 9: As Figure 8, but for GERB-1, for each month in Table 5.
Figure 10: The value of the monthly decrease in the ratio between GERB and the CERES FM1
unfiltered radiance, M α, as fitted by linear regression for each subset in CERES unfiltered-to-filtered
radiance ratio αFM1, for GERB-2 (red) and GERB-1 (blue), for the months shown in Tables 4 and 5.
Each value of M α is shown with the associated standard error, SEα, of the fit.
37
679
680
681
682
683
684
685
686
687
688
689
690