web viewsearch strategy output for crd ... comparison of preventive care in medicaid managed care...
TRANSCRIPT

Supplementary files
Supplementary File S1 Search strategy output for CRD database
Database Centre for Reviews and Dissemination (CRD)
Host http://www.york.ac.uk/inst/crd/
Date of search January 2012-June 2014 last search date: 26/6/14
Years covered1990-June 2014 (no date restrictions)
Search Strategy Key word search: Financial incentives, Pay for performance, Performance based financing (Pay for performance) OR (financial incentives) OR (performance based financing) IN DARE, NHSEED, HTA
Language restrictionsNone
Number of citations70
Number of relevant reviews
8: Huang et al., 2013, Reda et al., 2012, Chaix-couturier et al., 2012, Hamilton et al., 2013, Witter et al., 2012, Scott et al., 2011, Petersen et al., 2006, Houle et al., 2012
1

Supplementary File S2 Search strategy output for Cochrane database
Database Cochrane
Host http://onlinelibrary.wiley.com/cochranelibrary/
Date of search January 2012-June 2014 last date searched: 26/6/14
Years covered 1990-2014 no date restrictions
Search Strategy Key word search: Financial incentives, Pay for performance, Performance based financing
There are 20 results from 8524 records for your search on 'financial incentive or pay for performance or performance based financing in Title, Abstract, Keywords in Cochrane Reviews'
There are 12 results from 30299 records for your search on 'financial incentive or pay for performance or performance based financing in Title, Abstract, Keywords in Other Reviews'
There are 3 results from 16096 records for your search on 'financial incentive or pay for performance or performance based financing in Title, Abstract, Keywords in Economic Evaluations'
Language restrictions
None
Number of citations
35
Relevant reviews 8: Huang et al., 2013, Gillam et al., 2012, Reda et al., 2012, Chaix-couturier et al., 2012, Hamilton et al., 2013, Witter et al 2012, Scott et al 2011, Petersen et al 2006,
2

Supplementary File S3 Search output for the updating the review by Van Herck et al. (2010)
Database Medline
Host http://www.ncbi.nlm.nih.gov/sites/entrez (Pubmed)
Date of search 25/04/2016
Years covered 01/07/2009 to 25/04/2016
Search Strategy ("Salaries and Fringe Benefits"[Majr] OR "Reimbursement, Incentive"[Majr] OR "Fees and Charges"[Majr] OR p4q OR p4p OR pay* OR incentive* OR bonus*) AND ("Treatment Outcome"[Majr] OR "Medical Errors"[Majr] OR "Quality Control"[Majr] OR "Cost-Benefit Analysis"[Majr] OR "Safety"[Majr] OR "Health Services Accessibility"[Majr] OR quality OR outcome* OR performance OR error* OR safety* OR access* OR equity OR effectiveness) AND ("Hospitals"[Majr] OR "Physicians"[Majr] OR hospital* OR physician* OR practitioner*) AND (hasabstract[text] AND ("2009/07/01"[EDat]:"2014/07/28"[EDat]) AND (Humans[Mesh]) AND (Clinical Trial[ptyp] OR Randomised Controlled Trial[ptyp] OR Case Reports[ptyp] OR Clinical Trial, Phase I[ptyp] OR Clinical Trial, Phase II[ptyp] OR Clinical Trial, Phase III[ptyp] OR Clinical Trial, Phase IV[ptyp] OR Comparative Study[ptyp] OR Controlled Clinical Trial[ptyp] OR Evaluation Studies[ptyp] OR Technical Report[ptyp] OR Validation Studies[ptyp]))
Language restrictions None
Number of citations 1437
3

Supplementary File S4 Search strategy output for PubMed databaseDatabase Medline
Host http://www.ncbi.nlm.nih.gov/sites/entrez (Pubmed)
Date of search January 2012-April 2016 last date searched: 25/04/16
Years covered 1990-June 2014 (no date restrictions)
Search Strategy
1. Search (((((((financial incentive*) OR performance based financing) OR pay for performance) OR paying for performance) OR incentive*) AND Review[ptyp] AND Humans[Mesh] AND English[lang])) AND health
Language restrictions
None
Number of citations
1453
Relevant reviews
12: Van Herck P et al 2010, de Bruin SR, et al 2011, Witter et al 2012, Scott et al 2011, Petersen et al 2006, Eijkenaar 2012, Christianson et al 2008, Reda et al., 2012, Hamilton et al., 2013, Houle et al., 2012, Gillam et al., 2012, Andrew D Oxman and Atle Fretheim, 2009
4

Supplementary File S5 Summary of identified reviewsReviews Objectives Search strategy and studies included Quality of included studies
and evaluation designResults and limitations Grade of evidence
(Amstar score)
Oxman and Fretheim, 2009
The authors undertook a critical appraisal of selected evaluations of incentive (PBF) schemes in the health sector in low and middle-income countries (LMIC)
Key informants were interviewed to identify literature relevant to the use of PBF in the health sector in LMIC, key examples, evaluations, and other key informants.
13 studies were identified but only 4 met their inclusion criteria (which was not explicitly stated in the paper) and were included in the review: two single country cases and two multi-country studies
Quality of studies included in this review was not assessed.
The authors found very limited evidence of PBF having a positive impact and it was impossible to disentangle the effects of financial incentives as one element of PBF.
They concluded that when PBF schemes are used, they should be designed carefully, including the level at which they are targeted, the choice of targets and indicators, the type, and magnitude of incentives.In addition, PBF schemes should be monitored for possible unintended effects and evaluated using rigorous study designs
4/11
Canavan et al., 2008
The authors explored incentive based approaches adopted in developing countries over the past decade
Search strategy was not described.
5 programs from 5 countries (Democratic Republic of Congo, Rwanda, Burundi, Haiti, Afghanistan), from 8 studies
Quality of included primary studies was not assessed.
The authors found that PBF results showed remarkable improvements in health indicators (utilization, coverage and emergency referral) with associated enhanced quality of health provider performance.
They also noted the ambiguity among researchers regarding the extent of attribution of success, which calls for more rigorous evaluations of these programs.
5/11
Chaix-couturier et al., 2002
The authors’ objectives were to identify all the types of financial incentives that have been provided to health care professionals and, when possible, to assess the effects of these incentives on the costs, process or outcomes of health care.
6 databases were searched from January 1993 to May 1999 for English and French publications: MEDLINE, EMBASE, the Health Planning and Administration database, Pascal, International Pharmaceutical Abstracts, and the Cochrane Library. Additional papers were retrieved from the bibliographies of selected articles.
It was stated that 89 papers were included in the review, whereas only 36 appeared to directly address the review question
The quality of each study was assessed according to the criteria described by the Cochrane Effective Practice and Organization of Care Group, but the results were not reported in the review.
The authors concluded that financial incentives could be used to reduce the use of health care resources, improve compliance with practice guidelines or achieve a general health target. It may be effective to use combinations of incentives, depending on the target set for a given health care programme. The authors however stated that few studies used the same methodology to assess the impact of the same incentive, thus limiting the external validity of their conclusions.
6/11
Christianson et al., 2008
This paper reviews evaluations of recent pay for- performance initiatives instituted by health plans or by provider organizations in cooperation with health plans.
The authors conducted electronic searches of MEDLINE, EMBASE, Cochrane Database of Systematic Reviews, Database of Reviews of Effects, Econlit, the Agency for Healthcare Research and Quality, the Organisation for Economic Co-operation and Development, and the World Health Organization.
Nine studies were included in this review
Quality of included primary studies was not assessed in a standardized way. The authors however stated that most of the studies included in this review were low quality studies (no adequate control groups).
The review found that there were improvements in some quality measures, but it was not clear the degree of contribution of pay for performance to these improvements; the incentives typically were implemented in conjunction with other quality improvement efforts, or there was not a convincing comparison group.
5/11
5

Reviews Objectives Search strategy and studies included Quality of included studies and evaluation design
Results and limitations Grade of evidence (Amstar score)
de Bruin SR, et al., 2011
This review assessed the effectiveness of P4P schemes used to stimulate delivery of chronic care through disease management with regards to quality and costs.
Only one database was searched (PubMed).In addition to the electronic database search, relevant papers were identified through reference tracking and through a manual literature search on the internet from relevant websites, such as those of health insurers and Ministries of Health.
Eight PBF schemes were identified 6 in the USA, 1 in Germany and 1 in Australia. Five of the P4P schemes were part of a larger scheme of interventions to improve quality of care, whereas the other three was implemented as ‘standalone’ schemes.
Primary studies were not assessed in a standardized way.
Most studies showed positive effects of P4P on healthcare quality. However, there was only one database was searched, and no attempt to identify unpublished literature, important studies that might have influenced the conclusion might have been missed.
They authors also found variation in incented entities and the basis for providing incentives. Information about motivation, certainty, size, frequency, and duration of the financial incentives was generally limited.
6/11
Eijkenaar, 2012 This review systematically compared pay for performance initiatives in the USA to other countries in terms of specific design choices that might contribute to success of PBF programs.
The author searched Medline through PubMed and searched the Internet via Google and Google Scholar. The authors also consulted country-specific experts and searched reference list for relevant studies.
The author identified 13 programs initiated in 9 countries. Seven programs were regional while six have been implemented nationally.
Since this was not an impact evaluation review per se, and included studies were used to identify program descriptions, the quality of the studies was not assessed.
The paper found variations in design and contextual factors between the identified programs. The author concluded that the designs of these schemes are likely to affect the effectiveness of the schemes. However, the designs of these schemes are lacking in several respects and might be as a result of the limited knowledge about “what works” in P4P.
This study has several limitations: some relevant programs were not identified as a result of English language restriction in the search strategy, the study suffers from publication bias as some studies were specifically not included because sufficient information was not found on the programs.
6/11
Gillam et al., 2012
The authors review the growing evidence for the impact of the framework on the quality of primary medical care (QOF) in the United Kingdom.
The authors searched 3 databases: MEDLINE, EMBASE, and PsycINFO. They also searched the reference lists of published reviews and articles.
Ninety-four studies were included in the review.
Quality of primary studies were assessed using a modified Downs and Black rating scale for observational studies and a Critical Appraisal Skills Programme rating scale for qualitative studies.The authors however did not report the quality assessment in this paper.
The authors found that:
Quality of care for incentivized conditions during the first year of the framework improved at a faster rate than the pre-intervention trend and subsequently returned to prior rates of improvement.
There were modest cost-effective reductions in mortality and hospital admissions in some domains.
Achievement for conditions outside the framework was lower initially and has worsened in relative terms since inception.
The person-centeredness of consultations and continuity were negatively affected.
Patients’ satisfaction with continuity declined, with
9/11
6

Reviews Objectives Search strategy and studies included Quality of included studies and evaluation design
Results and limitations Grade of evidence (Amstar score)
little change in other domains of patient experience.
The conclusions of this study was limited by lack of adequate control groups
Hamilton et al., 2013
The authors set out to evaluate the effectiveness of providing financial incentives to healthcare professionals for smoking cessation activities.
7 databases were searched till May 2011: MEDLINE, EMBASE, PsycINFO, Cochrane Database of Systematic Reviews, DARE, Cochrane Central Register of Controlled Trials (CENTRAL) and Web of Science. The authors also searched to GreyNet International and Open Grey for grey literature. Reference lists of retrieved articles and relevant reviews were also checkedEighteen studies were included in the review: three RCTs and 15 observational studies.
Primary study quality was assessed using the Downs and Black guidelines for randomised and non-randomised studies of healthcare interventions. Scores ranged from 1 (poor) to 4 (excellent).
Included primary studies were considered to be mid-range for quality
The Authors found that financial incentives improved some process indicators such as recording smoking status, advice and referrals but not for outcome measures such as smoking quit rates.
Studies of QOF program in the UK reported improvements in recording smoking status. One RCT also reported improvements in incentive clinics in the USA.
Smoking advice or referral: QOF studies reported an increase in smoking advice.
The QOF studies should however be interpreted with caution because of the lack of adequate control groups
Other studies reported mixed findings: two studies reported no differences for financial incentives and some studies reported improvements.
Quit rates: Two studies reported no improvements in quit rates as a result of incentives and one study reported mixed effects for outcomes.
The authors concluded that financial incentives appeared to improve recording of smoking status and increase provision of cessation advice and referrals to stop smoking services. There was however insufficient evidence to show that financial incentives led to reductions in smoking rates.
Limitation: although this review is one of the well-conducted reviews, most data were retrieved from observational studies, which are prone to multiple biases. The authors noted that most studies did not account for secular changes during study periods (such as new guidelines for smoking cessation or recent fiscal policy or legislation)
9/11
Houle et al., 2012 This review assessed the effect of Pay-for-Performance remuneration, for individual health care
PubMed, EMBASE, The Cochrane Library, OpenSIGLE, the Canadian Evaluation Society's; Unpublished Literature Bank, and
The primary studies included were assessed, according to the Cochrane
The authors, taking into consideration the limitations of the uncontrolled studies and the inability to draw reliable conclusions from them; concluded that Pay-
10/11
7

Reviews Objectives Search strategy and studies included Quality of included studies and evaluation design
Results and limitations Grade of evidence (Amstar score)
practitioners, on the patient care outcomes.
the Grey Literature Collection of the New York Academy of Medicine's Library were searched up to June 2012. Reference lists were also manually searched.
Thirty studies were included in the review. Four were RCTs, five were interrupted time series, three were controlled before-and-after studies, one was a non-randomized controlled study, 15 were uncontrolled before-and-after studies, and two were uncontrolled cohort studies.
risk of bias scale, which included criteria for allocation concealment, similar baseline characteristics, complete outcome reporting, and protection against contamination.
The quality of the studies was generally low to moderate; only RCTs had comparable baseline characteristics and only one study had adequate patient allocation concealment (full results were reported).
for-Performance modestly improved preventive activities, such as immunization rates, but there was little evidence that it was effective for other activities such as mammography referrals and cancer screening.
Huang et al., 2013
The authors’ objectives were to review and synthesize published evidence of pay-for-performance (P4P) effects on management of diabetes.
Four databases were searched: Ovid MEDLINE, EMbase, PubMed, The Cochrane Library (Issue 3, 2012
12 interrupted time series studies, 7 controlled before-after studies, and 2 cross-sectional studies were included. Additionally, 12 studies were further included for quantitative analysis.
The quality of included primary studies was assessed using Grading of Recommendations Assessment, Development, and Evaluation (GRADE) system.
The authors reported that most studies included in the review were low quality studies.
Results of meta-analysis showed that P4P produced generally positive effects in most indicators (e.g. patients with records of total cholesterol or blood pressure). However, these results were inconsistent. The percentage of patients with HbA1c ≤ 7% or 53 mmol/mol showed a pooled odds ratio of 0.98 in patients, but a pooled mean difference of 19.71% in the physician groups. The odds ratios of receiving tests/reaching an outcome level were also diverse in patients (odds ratios ranged from 0.98 to 3.32).The authors also found that process indicators had higher rates of improvement than outcome indicators.Limitations: the authors concluded that because of the low quality of included studies, the results of the review should be interpreted with caution.
8/11
Petersen et al., 2006,
This review assessed the effects of explicit financial incentives for improving performance on health care quality measures.
The search was limited to studies written in English.
Seventeen studies were included in the review: 9 randomized controlled trials, 4 controlled trials with before-and-after data and 4 cross-sectional surveys.
The studies were assessed according to a published methodological quality checklist (by Downs and Black) and graded on a scale of 1 (poor) to 4 (excellent).
Six studies were assigned a quality grade of 3, six were assigned a grade of 2, and five were assigned a grade of 1.
The authors found that of the 2 studies that evaluated financial incentives provided at the payment-system level, one found a positive effect on access to care while the other found a negative effect on access to care for the sickest patients.
Of the 9 studies that evaluated the use of financial incentives directed to provider groups, two reported improvements for all quality of care measures, five were classified as partial improvement studies, and two showed no effect of the intervention compared with the control group.
Of the 6 studies that evaluated the effects of financial incentives at the physician level, two reported a positive effect of the intervention and three reported
7/11
8

Reviews Objectives Search strategy and studies included Quality of included studies and evaluation design
Results and limitations Grade of evidence (Amstar score)
some positive effects (partial studies).
The authors concluded that incentives at the physician, provider group and payment-system levels have some positive effects, but further research is needed. This review was flawed because only one database was searched and the search was limited to English language papers, which suggests that relevant studies might have been missed. Although an attempt was made to obtain unpublished data, publication bias was not assessed. Measures were taken to reduce the risk of bias in study selection.
Reda et al., The primary objective of this review was to assess the impact of reducing the costs of providing or using smoking cessation treatment through healthcare financing interventions on abstinence from smoking.
The authors searched the Cochrane Tobacco Addiction Group Specialized Register in April 2012.Eleven studies were included.Of the eleven included studies, six randomly assigned the individual participants to the treatment group and one or two control groups (and three randomly assigned medical practices The two other studies were controlled natural experiments with two and four different benefit groups, respectively.
The quality of primary studies was assessed by The risk of bias of the included studies was assessed using criteria from the Cochrane Collaboration included in the Review Man- ager software.
The Authors reported that most of the included studies had moderate to high risk of bias.
The authors found there was no evidence of an effect on smoking cessation from the results of pooling two trials of financial incentives directed at healthcare providers (RR 1.16, CI 0.98 to 1.37, I² = 0%).
Limitations: Only one database was searched and potentially important studies could have been missed. In addition, the two primary studies pooled together have relatively different incentive designs (heterogeneity) that were not accounted for.
10/11
Scott et al., 2011 This review assessed the effect of financial incentives on the quality of health care provided by primary care physicians.
The authors searched the Cochrane Effective Practice and Organisation of Care (EPOC) Trials Register, Cochrane Central Register of Controlled Trials (CENTRAL) and Cochrane Database of Systematic Reviews (CDSR) (The Cochrane Library), MEDLINE, HealthSTAR, EMBASE, CINAHL, PsychLIT, and ECONLIT. Searches of Internet-based economics and health economics working paper collections were also conducted. Finally, studies were identified through the reference lists of retrieved articles, websites of key organisations, and from direct contact with key authors in the field.
Articles were included if they were published from 2000 to August 2009.Seven studies were included in this review.
Quality of included studies was assessed using the Epoc risk of bias guideline. The authors reported that there was high risk of bias (low quality) in most of the studies due to poor study designs
Six of the seven studies included in this review showed positive but modest effects on a minority of the measures of quality of care included in the study.The authors concluded that there is insufficient evidence to support or not support the use of financial incentives to improve the quality of primary health care.Implementation should proceed with caution and incentive schemes should be more carefully designed before implementation. In addition to basing incentive design more on theory, there is a large literature discussing experiences with these schemes that can be used to draw out a number of lessons that can be learned and that could be used to influence or modify the design of incentive schemes.
9/11
9

Reviews Objectives Search strategy and studies included Quality of included studies and evaluation design
Results and limitations Grade of evidence (Amstar score)
Van Herck P et al., 2010,
This review summarizes evidence, obtained from studies published between January 1990 and July 2009, concerning P4P effects, as well as evidence on the impact of design choices and contextual mediators on these effects.
The authors looked at papers from 1990- July 2009. They searched the following databases: Cochrane Library, EconLit, Embase, Medline, PsychINFO, and Web of Science. They also screened references, forward citation tracking, and expert consultation to identify studies.Studies that evaluated P4P effects in primary care or acute hospital care medicine were included.
They included One hundred twenty-eight evaluation studies
The vast majority of identified studies was not randomized (only nine were) and roughly 75 studies were either cross-sectional or employed a simple before-and- after design.
The authors concluded that P4P programs result in the full spectrum of possible effects for specific targets, from absent or negligible to strongly beneficial and that the effects of P4P interventions varied according to design choices and characteristics of the context in which it was introduced.
This study was however limited because they excluded studies based on quality and this may have produced an overly restrictive analysis.
11/11
Witter et al., 2012 This review assessed the current evidence on the effects of pay for performance on the provision of health care and health outcomes in low and middle-income countries. The studies assessed a mix of both patients’ targeted incentives and incentives targeted at health care professionals.
Over 15 databases were searched till June 2011. This includes: the Cochrane Effective Practice and Organisation of Care Group Specialised Register, CENTRAL, MEDLINE, Ovid, EMBASE, EconLit, the Social Sciences Citation Index, ISI Web of Science. They also searched the websites and online resources of numerous international agencies, organisations and universities to find relevant grey literature and contacted experts in the field.
Nine studies were included in the review. There was one randomized trial; six controlled before-after studies and two interrupted time series studies.
The quality of included studies was assessed using the GRADE Working Group grades of evidence.
The authors reported that almost all the studies identified had a high risk of bias. Sources of bias in the primary studies include non-random allocation of interventions, additional funds/structures (other than the PBF schemes) that might have been responsible for the improvements seen, other confounders (e.g. contextual differences between intervention and non-intervention groups), and lack of rigorous evaluations.
The authors concluded that the evidence base was too weak to draw general conclusions due to validity issues.Only one study out of the nine studies was considered to have low risk of bias, one had a moderate risk of bias and the remaining seven had a high risk of bias.The high and moderate quality study found mixed results: some indicators improved while there was no improvement in others. Two of the studies showed significant improvement for the intervention group, while two showed no significant difference.
11/11
10

Supplementary file S6 Extraction of data from all 96 relevant primary studies
Program Author/Evaluation design Objectives /clinical area ResultsEffect size
Advancing QualityUnited kingdom2008
Sutton et al, 2012
Pre/postCompared with national average (difference in difference analysis)
Outcomes/clinical/chronic care30 days in hospital mortality: combined (heart failure, pneumonia, acute myocardial infarction)
General combined results: Risk-adjusted, absolute mortality for the conditions included in the pay-for-performance program decreased significantly, with an absolute reduction of 1.3 percentage points (95% confidence interval [CI], 0.4 to 2.1; P = 0.006) significant impact
Outcome 30 days in hospital mortality for patients admitted for Pneumonia The largest reduction, for pneumonia, was significant (1.9 percentage points; 95% CI, 0.9 to 3.0; P<0.001) significant impact (positive)
Outcome 30 days in hospital mortality for patients admitted for myocardial infection
non-significant reductions for acute myocardial infarction (0.6 percentage points; 95% CI, −0.4 to 1.7; P = 0.23)
30 days in hospital mortality for patients admitted for Heart failure Non-significant reduction 0.6 percentage points; 95% CI, −0.6 to 1.8; P = 0.30). [positive impact but not significant)
ClalitIsrael, 1998
Gross et al. 2008 pre/post design from 1998 to 2005)
Cost containment (process) Clinics have managed to reduce 10 percent of budget expenses
Mammography rates (process) Mammography rates had risen from 40 percent to 65 percent
Patient satisfaction (outcome) Patient satisfaction had risen from about 76 percent to 85 percent of members reporting high satisfaction.
Diabetes control measures (process) Diabetes control measures have improved from 35 percent to 48 percent
11

Program Author/Evaluation design Objectives /clinical area ResultsEffect size
Clinical Practice Improvement Pay (CPIP)Australia, Queensland (started 2008)
Clinical PracticeImprovement Centre (2008,2010),
Queensland Health(2010)
Before and after (no control group)
Mental healthSixteen mental health services across Queensland participated and were provided with the opportunity to receive incentive payments during the period between January 2009 and June 2011. Data collection was conductedUsing information available on existing Queensland Health databases.
State-wide results showed steady and continual improvement in the indicator over the reporting period.
MACCABIIsrael2001
Friedman, 2006Before and after (pre-post) no control group
Mammography rates (process) Mammography rates had risen from 52 percent in 2002 to 64 percent in 2004
Balanced diabetes patients (Intermediate outcome) An increase in the percentage of balanced diabetes patients (Hba1c , 7) was also noted
Vaccination flu rates (process) Flu vaccination rates had risen from 35 percent to 47 percent
National Health Insurance P4P (NHI-P4P)Taiwan2004
Chang et al., 2008Logistic regression/pre/post (no control group)One year
Smoking cessation visits (process) Odds Ratio (95% CI) Financing policy2004* 2005 0.96 (0.87 to 1.06)
This policy increased the annual number of cessation visits per patient.
Tsai et al., 2010:Pre-post design compared with control (non-PBF) for 3 years
Tuberculosis treatment default rate (process) The treatment default rate after “P4P on TB” was 11.37% compared with the 15.56% before “P4P on TB” implementation. The treatment default rate in P4P hospitals was 10.67% compared to 12.7% in non-P4P hospitals.
Kuo et al., 2011Pre-post with controls (4 years follow up)
Breast cancer care (BC-P4P) in Taiwan on care quality (process) BC-P4P enrollees received higher-quality care than nonenrollees (P _ .001).
Breast cancer care (BC-P4P) in Taiwan on patient survival (outcome) BC-P4P enrollees had better 5-year overall survival (odds ratio, 0.167; P _ .001)
Breast cancer care (BC-P4P) in Taiwan on recurrence (outcome) Less recurrence (odds ratio, 0.370; P _ .002)
Li et a.l, 2010Pre-post compared with controls: 4 years
Tuberculosis cure rate (intermediate outcome) Cure rate: Number cured (cure rate) p4p:18 377 (68.1) non p4p: 2778 (42.4) <0.01 (%) p4p:N 26 977 (80.4) non p4p 6559 (19.6) P4P hospital 0.2911 1.338 (1.159–1.544) <0.0001 cure rate odds ratio 95% CI
Lee at al., 2010One year: Pre-post design with control groups
Diabetes care (diabetes specific tests and exams) (process) Patients in the P4P program (received significantly more diabetes-specific exams and tests after enrolment (3.8 vs 6.4, P <.001) than patients not enrolled in the program (3.5 vs 3.6, P
12

Program Author/Evaluation design Objectives /clinical area ResultsEffect size
<.001).Physician visits for diabetes (process) Patients in the intervention group had an average of 2 more
physician visits for diabetes than those in the comparison group (P <.001).
Diabetes related hospitalizations (intermediate outcome) Conversely, the intervention group had fewer diabetes-related hospitalizations (−0.027, P = .003).
Primary care P4P (PC-P4P)Netherlands
*Kirschner et al 2013Pre-post design evaluation after one year` with control group
Mean score diabetes (9 process indicators) 10.4* (*=significant, p less than 0.05)
Blood pressure controlled 5.9*
Total cholesterol controlled 8.8*
HbA1c controlled(≤7.0%) (Intermediate outcome)
7.7*
Asthma management (4 process indicators) 11.5*
Asthma outcome 4.4
Mean score COPD (5 process indicators) 8.1*
COPD outcome 2.5
Influenza vaccination (process) -1.2 (negative impact although not significant)
Cervical cancer screening (process) 0.6 (no significant impact)
CRVM process 14.7**
CRVM outcomes 8.4**
Primary Care Renewal Models (PCRM)Canada OntarioStarted 2007
Li et al., 2010Difference in difference estimatesCross sectional design /time series(with control group)data collected from 1998-2008
Pap smear 0.003*** pless than 0.005
Influenza vaccination 0.009
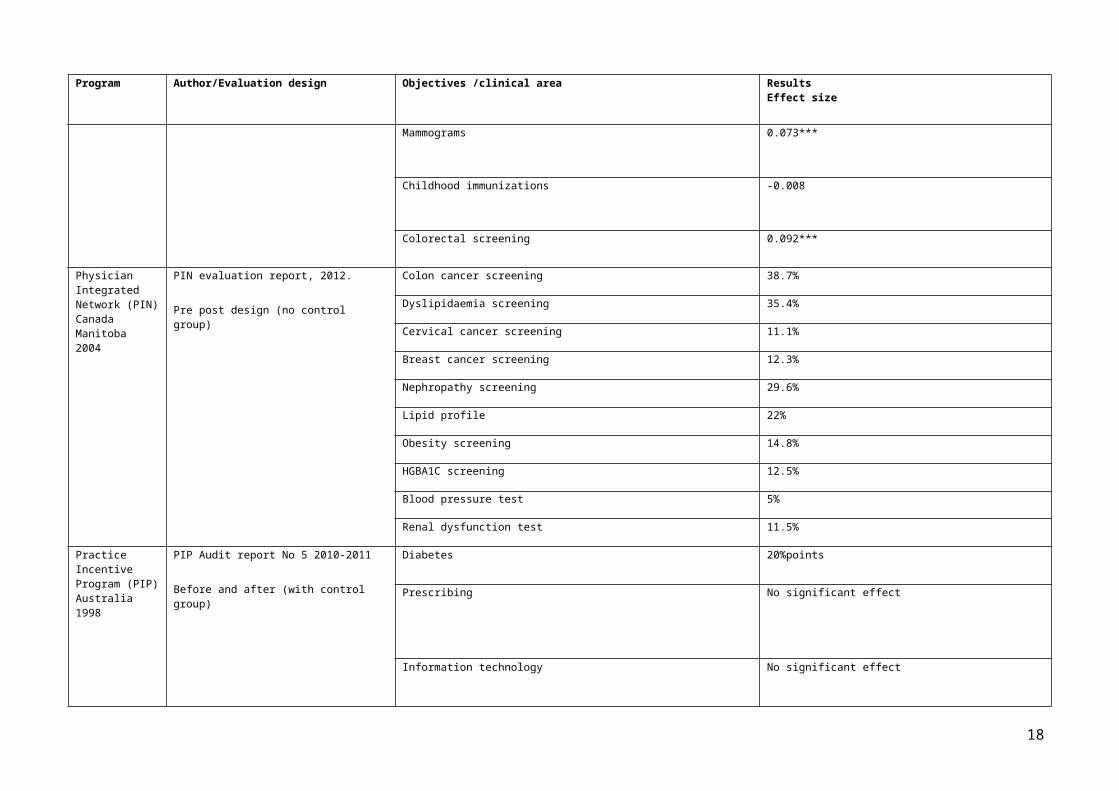
Mammograms 0.073***
Childhood immunizations -0.008
Colorectal screening 0.092***
Physician Integrated Network
PIN evaluation report, 2012. Colon cancer screening 38.7%
13

Program Author/Evaluation design Objectives /clinical area ResultsEffect size
(PIN)Canada Manitoba2004
Pre post design (no control group) Dyslipidaemia screening 35.4%
Cervical cancer screening 11.1%
Breast cancer screening 12.3%
Nephropathy screening 29.6%
Lipid profile 22%
Obesity screening 14.8%
HGBA1C screening 12.5%
Blood pressure test 5%
Renal dysfunction test 11.5%
Practice Incentive Program (PIP)Australia 1998
PIP Audit report No 5 2010-2011
Before and after (with control group)
Diabetes 20%points
Prescribing No significant effect
Information technology No significant effect
Quality and Outcomes Framework (QOF)
Calvert et al., 2009
Retrospective cohort design (no control group)
Diabetes managementChange in HbA1c levels >10%ReductionIntermediate outcome
The introduction of the quality and outcomes framework did not lead to improvement in the management of patients with type 1 diabetes, nor to a reduction in the number of patients with type 2 diabetes who had HbA1c levels greater than 10%.
HbA1c levels of ≤7.5%Intermediate outcome
Odds ratio 1.05 (95% confidence interval 1.01 to 1.09; P=0.02).
Campbell et al., 2007Adequate control
Coronary heart diseaseMean Difference(95% CI) P ValueIntermediate outcome
0.53 (−0.01 to 1.08) 0.054
AsthmaIntermediate outcome
0.03 (−0.45 to 0.51) 0.904
Type 2 diabetes managementIntermediate outcome
0.08 (−0.32 to 0.49) 0.682
14

Program Author/Evaluation design Objectives /clinical area ResultsEffect size
Taggart et al., 20122000-2008Before and after: no control group
Smoking cessation adviceprocess
Rapid increases in recording smoking status and advice occurred around the QOF’s introduction in April 2004. Subsequently, compliance to targets has been sustained, although rates of increase have slowed.
Millet et al., 2009Before and after with no control group
Achievement of diabetes treatment targets for blood pressure (< 140/80 mm Hg), HbA1c (# 7.0%) and cholesterol(# 5 mmol/L).Intermediate outcome
Patients with co-morbidity remained significantly more likely to meet treatment targets for cholesterol and HbA1c than those without after the introduction of pay for performance
MacBride-Stewart, et al,. 2008Before and after ITSAdequate control
Changes in prescription patternProcess
QOF significant reduction in prescribing pattern compared to a non-significant increase in prescribing pattern for the Non QOF control group.
Doran et al., 2011Time series, Longitudinal analysis
Measurement indicatorsPrescription indicatorsProcesses
Change in Mean for measurement indicators= 1.9 (1.4 to 2.5) p=0.001
Change in mean for Prescribing indicators= 2.6 (1.8 to 3.3) p=0.002
Strong et al., 2009Before and after with no control group
Accurate spirometry in the management of COPDprocess
There was no association between quality, as measured by adherence to BTS spirometry standards, and either QOF COPD9 achievement (Spearman's rho = -0.11), or QOF COPD10 achievement (rho = 0.01).
Vaghela et al,. 2008
Before and after: no control group
A1C <or=7.5%, The estimated annual increase in percent of diabetes subjects achieving targets was 3.03% (95% CI 2.95–3.10; P 0.001) for the A1C target
Blood pressure <or=145/85 mmHgProcess
The estimated annual increase in percent of diabetes subjects achieving targets was 3.26% (3.18–3.34; P 0.001) for the blood pressure target
Cholesterol <or=5 mmol/l was determined.Process
The estimated annual increase in percent of diabetes subjects achieving targets was 3.99 % (3.92– 4.07; P 0.001) for the cholesterol target.
Tahrani et al., 2007Before and after with no control groupPCTs
Process indicators 95% CI April 2004- March 2006 all p values less than < 0.001BMI Record -19.2 to -14.5Smoking record -54.7 to -47.3HBA 1c Record -22.5 to -15.0Retinal screening record -42.9 to -32.5Peripheral pulses record -63.6 to -52.7Neuropathy testing record -64.2 to -53.2BP record -10.8 to -8.2Micro albumin testing record -74.8 to -65.9Creatinine record -15.0 to -11.2Cholesterol record -17.3 to -13.6Outcome indicators 95% CI April 2004- March 2006 all p values less than < 0.001
15

Program Author/Evaluation design Objectives /clinical area ResultsEffect size
Smoking cessation advice -15.2 to -9.2HbA1c< 7.4 -24.1 to -16.2HbA1c< 10 -22.6 to -16.4BP< 145/85mmHg -20.3 to -15.9TC<5 -25.9 to -22.0Influenza vaccine -24.6 to -18.1
Serumaga et al., 2011
Design Interrupted time series.
Blood pressure monitoring (no change)process
After accounting for secular trends, no changes in blood pressure monitoring (level change 0.85, 95% confidence interval −3.04 to 4.74, P=0.669 and trend Change −0.01, −0.24 to 0.21, P=0.615), control (−1.19, −2.06 to 1.09, P=0.109 and −0.01, −0.06 to 0.03, P=0.569)
Treatment intensity (no change)process
Treatment intensity (0.67, −1.27 to 2.81,P=0.412 and 0.02, −0.23 to 0.19, P=0.706)Good quality of care for hypertension was stable or improving before pay for performance was introduced. Pay for performance had no discernible effects on processes of care or on hypertension related clinical outcomes.
Cupples et al., 20082004-2006Cross-sectionalStudyControl group
Blood pressure, More RoI than NI participants had systolic blood pressure >140 mm Hg (37% vs 28%, P =0.01)
Cholesterol More RoI than NI participants had cholesterol >5 mmol/L (24% vs 17%, P = 0.02)
Medications Fewer participants in the RoI (55% vs 70%) were prescribed β-blockers.ACE inhibitor prescribing was similar for both groups (41%; 48%); high proportions were prescribed statins (84%; 85%) and aspirin (83%; 77%)
Smoking status 1 -62.1 (-67.0 to -56.3)
Smoking status 2 -22.7 (-26.4 to -19.0)Smoking status 3 3.5 (-1.8 to 8.6)Smoking status 4 -3.1(-8.4 to 1.8)
Coleman, 20071990-2005Retrospectivelongitudinalsurvey
Smoking status recording Compared with the first quarter of 2003, recording of smoking status increased up to the first quarter of 2004 in (rate ratio = 1.88; 95% CI, 1.87–1.89)
Brief advice to smokers Compared with the first quarter of 2003, and in brief advice to smokers increased up to (RR = 3.03; 95% CI, 2.98–3.09),
Campbell, et al., 20091998-2007Before and after studyInterrupted time series
Coronary heart disease Mean change in rate of improvement -0.250, 95% CI, -0.401 to 0.100, pvalue=0.001
Asthma Mean change in rate of improvement -0.468, 95% CI, -0.748 to -0.187, pvalue=0.001
Diabetes Mean change in rate of improvement -0.220, 95% CI, -0.313 to -0.127, pvalue=0.001
Continuity of care Mean change in rate of improvement 0.091, 95% CI, 0.025 to 0.157, pvalue=0.001
Hippisiley-cox, et al., 2007 Coronary heart disease This is equivalent to a relative increase of 50% (95% CI 37%-63%) over the five year study period as shown in the graph
16

Program Author/Evaluation design Objectives /clinical area ResultsEffect size
2001-2006Interruptedtime seriesHowever, absolute mean changes were reported
belowStroke patients with cholesterol < 5 mmol 356% relative increase (95% CI 182-637%) in the percentage of
stroke patients with cholesterol < 5 mmol/l in the preceding 15 months
Stroke patients with a blood pressure reading < 150/90 mm hg There was a 68% relative increase (95% CI 55-83%) in the percentage of patients with a blood pressure reading < 150/90 mm hg in the preceding 15 months
Diabetes recorded prevalence Using the new 2006/7 definitions, there was a 117% (95% CI 115-120) relative increase in the recorded prevalence of diabetes (Diabetes1).
percentage of diabetes patients with cholesterol < 5 mmol/ there was a 132% relative increase (95% CI 95-176%) in the percentage of diabetes patients with cholesterol < 5 mmol/l in the preceding 15 months.
Diabetics with a blood pressure reading < 145/85 mm hg There was a 56% relative increase (95% CI 47-66%) in the percentage of patients with a blood pressure reading < 145/85 mm hg in the preceding 15 months.
Diabetic High blood pressure recorded There was a 35% (95% CI -41 - 209) relative increase in the recorded prevalence of hypertension (BP1).
Diabetic High blood pressure controlled There was a 65% (95% CI 51-79%) relative increase in the percentage of patients with controlled blood pressure levels
Chronic kidney disease chronic kidney disease and blood pressure recorded there was a 20% relative increase (95% CI 3-32%) in the percentage of patients with chronic kidney disease and blood pressure recorded in preceding 15 months.
Chronic Kidney disease percentage of patients with a blood pressure reading < 140/85
There was an 89% relative increase (95% CI 59-124%) in the percentage of patients with a blood pressure reading < 140/85 mm hg in the preceding 15 months.
Magee, 2010Interrupted time series
Nephropathy prevalence Nephropathy prevalence was 15.1% and 11.5%, respectively.The median ACR testing rate The median ACR testing rate was 82% compared with a historic
figure of 41% in 2001/2002
Milliet, et al.,20072003-2005Longitudinalcross-sectionalsurvey
Record of smoking status Significantly more patients with diabetes had their smoking status ever recorded in 2005 than in 2003 (98.8% vs 90.0%, P <.001).
Smoking cessation advise The proportion of patients with documented smoking cessation advice also increased significantly over this period, from 48.0% to 83.5% (P <.001).
Prevalence of smoking/quit rates The prevalence of smoking decreased significantly from 20.0% to 16.2% P <.001)
McGovern, 2008
200-2005: serial cross sectional study
Recording and prescribing increased by mean 17.1% after the introduction of the GMS contract
Oluwatowoju, et al., 20102006-2008Retrospective
Diabetes HbA1c <7.5%); In 2006, 39.7% of adults had glycemic control within the QOF threshold (HbA1c <7.5%); by 2008, this proportion had risen to 52.1% (P <.001).
17
Program Author/Evaluation design Objectives /clinical area ResultsEffect size
retrieval ofcomputer-heldbiochemicalmeasurements
Diabetes HbA1c >10.0% In 2006, 11.8% of subjects had poor glycemic control (HbA1c >10.0%); by 2008, this proportion had decreased to 10.1% (P <.001).
Diabetes (both HbA1c<7.5% and total cholesterol ≤5.0 mmol/L)
The proportion of subjects achieving HbA1c and cholesterol targets (both HbA1c <7.5% and total cholesterol ≤5.0 mmol/L) was 30.2% in 2006; in 2008 this proportion had increased to 43.7% (P <.001)
Srirangalingam et al.,(2006)Before and after cross sectional study
Diabetes Increase in referrals for poor glycaemic control, and the glycaemic threshold for referral with poor glycaemic control has reduced (9.7% vs 10.6%, P= .006, mean difference = 0.9%, 95% CI, 0.4-1.3%).
Simpson et al., 2010Before and after
Smoking status reporting The proportion of people with smoking status recorded increased by 32.9% (from 46.6% in2001/2 to 79.5% in 2006/7, OR 4.45, 95% CI 4.43 to 4.46)
Smoking cessation advise There was a large increase in provision of smoking cessation advice (43.6% in 2001/2, 84%in 2006/7, OR 6.75, 95% CI 6.66 to 6.85)
Smoking cessation referral The proportion of patients referred to stop smoking clinics increased (from 0.95% to 6.56%, OR 7.32, 95% CI 6.92 to 7.73)
Quit rates The proportion of people recorded as being a smoker reduced from 28.4% in 2001/2 to 22.4% in 2006/7 (OR 0.73, 95% 0.72 to 0.73)
Simpson et al., 2011No control group
Hypertension Increasing treatment for hypertension (absolute difference [AD] 9.2%; 95% confidence interval [CI] = 9.0 to 9.5) occurred throughout the study period.
Gulliford, et al., 2007 Diabetes HbA1c≤7.4% Among 26 practices in South London, the median practice-specific proportion of patients achieving HbA1c≤7.4% each year increased: 2000,22%; 2001, 32%; 2002, 37%; 2003, 38% and in 2005 from QOF, 57%.
Kontopantelis et al., 2012Interrupted time series analysisAdequate control
Diabetes Recorded quality of care improved for all subgroups in the pre-incentive period. In the first year of the incentives, composite quality improved over-and-above this pre-incentive trend by 14.2% (13.7–14.6%).By the third year the improvement above trend was smaller, but still statistically significant, at 7.3% (6.7–8.0%).
Western New York Physician Incentive Program (WNY-PIP)
Beaulieu ND and Horrigan DR (2005) 8months pre-post with a control group
Diabetes control:HbA1c test (process)
HbA1c test (1) no significant differenceSignificance: p<0.0001 (for all)
18

Program Author/Evaluation design Objectives /clinical area ResultsEffect size
USA
Even though they stated that there was a control group, the results presented are absolute so I will treat as no control group
Lipid test (process) Lipid test: significant increase
HbA1c < 9.5 (intermediate outcome) HbA1c < 9.5: significant increase
LDL <130 (Intermediate outcome) LDL <130: significant increase
Diabetes control:HbA1c test (process)
HbA1c test (1) no significant differenceSignificance: p<0.0001 (for all)
Kouides et al., 1998Rochester, New York, USA
PBF vs. non PBF
Before PBF vs. After PBFControl group
Influenza immunization rates Absolute increase in immunization rates (from 1990 [baseline] to 1991) was 6.8%; P _ 0.03 Change in immunization rates (1991-1990) intervention:10.3% , control: 3.5% p=0.3
Ashworth et al., 2004UK 2004
Before and after incentive (no control group) Change in use of prescription budget (overspent/underspent) of primary care organization (PCO)
PCO prescribing budgets were, on average, overspent by 4.5 per cent in the first year and marginally under spent by 0.6 per cent in the second year.Many PCOs had successfully turned a first year prescribing overspend into a second year under spend. PCOs that successfully reversed their overspend (49 out of 84; 58 per cent)
Cattaneo et al., 2001
Before and after study Change in breast feeding rates (intermediate outcome) Significant increase in breast feeding rates
19

Program Author/Evaluation design Objectives /clinical area ResultsEffect size
Italy 1998-1999
(no control)
Fairbrother et al., 1999New York12 months
Before and after study with control group
July 1995-July 1996
Childhood immunization coverage rates (process) Bonus group improved significantly in documented up-to-date immunization status, with an overall change of 25.3% (P _ 0.01),
Fairbrother et al., 2001USA16 months
Comparison of Preventive Care in Medicaid Managed Care and Medicaid Fee for Service in Institutions and Private Practices
Control group
Change in documentation of up-to-date immunization status. The bonus group improved significantly in documented up-to-date immunization status, with an overall change of 5.9% (P _ 0.05) compared with the control group.N=57 physicians (24 bonus; 12 FFS; 21 control)
Grady et al., 1997USA
Mammography referral rates (process) Mammography referral rates (process) No significant difference between the two groups
Hillman et al., 1998
RCT
Cancer screening: breast, cervical and colorectalMean compliance score
No significant difference between the intervention and control groups for pap test
20

Program Author/Evaluation design Objectives /clinical area ResultsEffect size
2 years
No significant difference between the intervention and control groups for colorectal screening
No significant difference between the intervention and control groups for mammography
No significant difference between the intervention and control groups for breast exam
Larsen et al., 2003
Four years pre-post: no control group
Diabetes care:LDL < 130
Significant difference p<0.001 from 1998-200239.9% To 69.8% pvalue less than 0.001
Average HbA1c Reduction of 8.1-7.3
HbA1c>9.5 Reduction of 34.6-21.4
HbA1c < 7(Intermediate outcome)
33.5%%To 52.8%
Annual HbA1c 78.5-90.5%
Bi annual LDL Increase of 65.9-91.7
Annual eye exam From 52-62%
LeBaron et al., 1999USA
Before and after (no control group)
Childhood immunization coverage rates Mean change +3 percentage points From 1994-199675 (74-76)- 78 (77-79) (95% CI))
Ritchie et al., 1991Scotland: UK
Before and after study
Study period: one year no control group
Percentage immunized by practice/ immunization rates Percentage of children aged 5 years given preschool boosters in Grampian region, 1987-91 rose from 78- 93% (p<0-0001). All 95 general practices in Grampian region (313 general practitioners). Those aged 5 years on the first day of the relevant quarter, with an average population of 6600
21

Program Author/Evaluation design Objectives /clinical area ResultsEffect size
Rooski et al., 2003USA
RCT 12 Months (unbalanced)
Adherence to smoking cessation clinical practice guidelines and patients’ smoking cessation behaviours.
Percentage of patients, tobacco use status identified in the last visit (Process) 14.1 vs 6.2(incentive vs control)
Percentage of smokers who received advice to quit in the last visit (Process)24.2 vs 18.3 (incentives vs control)
Percentage of smokers who were offered assistance to quit in the last visit (Outcome) 14.3 vs 8.8 (incentives vs control)
Quitting rates did not differ statistically significantly between the experimental conditions.
Harries et al., 2005Malawi National Tuberculosis Control Programme(four year program/0
before and after study with control groups
Tuberculosis control and other outcome measure. Percentage of patients documented as smear-positive in the laboratory register that are subsequently registered for treatment in the TB register. Target set at or above 90%
22

Program Author/Evaluation design Objectives /clinical area ResultsEffect size
Percentage of patients aged 15 years and above registered in the TB register as smear-negative PTB patients who have had Sputum smears examined (data from laboratory register).Target set at or above 85%.
Percentage of new smear-positive PTB patients who default from treatment/transfer out or who complete treatment with no smears examined. Target set at or below 10%.
Percentage of relapse smear-positive PTB patients for whom sputum specimens arrived at the mycobacterial central reference laboratory, Lilongwe, for culture and drug sensitivity testing. Target set at or above 60%.
Chien et al., 2012 Hudson Health Plan's P4P program in New York
Four years(2003–2007)Design: case-comparison difference-in-difference study using plan-level administrative data; (2) a patient-level claims data analysis; and (3) a cross-sectional survey(control group)
Lipid testing (process) +4%points
HbA1c <9 +8%points
23

Program Author/Evaluation design Objectives /clinical area ResultsEffect size
Hba1c testing (process) +2%points
Hillman et al., 1999
USA
RCT
18MONTHS
RCT (3 arms);1993 to 1995;49 PC sites (19 FB_I; 15 FBO; 15 controls)
Rate of paediatric immunization:randomly assigned primary care sites serving children in a Medicaid HMO to one of three groups: a feedback group (where physicians received written feedback about compliance scores), a feedback and incentive group (where physicians received feedback and a financial bonus when compliance criteria were met), and a control group. They evaluated compliance with paediatric preventive care guidelines through semi annual chart audits during the years
However, no significant differences were observed between either intervention group and the control group, for compliance scores
However, no significant differences were observed between either intervention group and the control group, for immunization rates
Christensen et al., 2000
USA
RCT (2 arms);February 1994 to September 1995200 pharmacies (110 interventions; 90 control)
Dosage with CS Student t-test Mean rate, 1.59 interventions per 100 Medicaid prescriptions (study pharmacies) vs. 0.67 (controls); P _ 0.001Pharmacists practicing in 110 study (financial incentive) and 90 control community pharmacies.
24

Program Author/Evaluation design Objectives /clinical area ResultsEffect size
Study pharmacists documented an average of 1.59 CS interventions per 100 prescriptions over a 20-month period, significantly more than controls, who documented an average of 0.67 interventions (P < .05) per 100 prescriptions.
Hillman et al., 1998
USA
RCT (2 arms);1993 to 1995;52 PC sites (26 intervention; 26 control)
Compliance with cancer screening for women age >50 y; aggregate compliance scores and improvement in scores over time
Repeated-measures ANOVA Absolute increase in total mean compliance scores for intervention group from baseline was 26.3%; control group was 26.4%.No significant differences between the groupsAggregate compliance scores and improvement in scores over time.
Gavagan, et al., 2010USA
A retrospective review of administrative data (2003-2007) was done to evaluate a natural quasi-experiment
With a control group
Rates of Papanicolaou screening Overall, there was no clinically significant effect of incentives on performance
Rates of mammography Overall, there was no clinically significant effect of incentives on performance
Rates of child immunizations Overall, there was no clinically significant effect of incentives on performance
An et al., 2008USA
RCT Clinical randomized trial? Compared with what: non PBF, standalone scheme
Intervention clinics
Smoking cessation referral rates Intervention clinics referred a mean of 11.4% (95% CI, 8.0%-14.9%) of their smokers compared with 4.2% (95% CI, 1.5%-6.9%) of smokers visiting usual care clinics (t47=3.45; P=.001) significant difference
25

Program Author/Evaluation design Objectives /clinical area ResultsEffect size
Glickman et al.,2007USACMSPremier program
Patients were treated between July 1, 2003, and June 30, 2006, at 54 hospitals in the CMS program and 446 control hospitals
3 years
pre-post with control group
Aspirin prescription rate Pvalue of comparison of intervention group to control group0.12
Smoking cessation counselling rates 0.05
In hospital mortality 0.21
Aspirin at discharge 0.04
Beta blockers at arrival 0.91
Beta blockers at discharge 0.98
ACE inhibitor at discharge 0.51
CMS composite score 0.16
Levin et al., 2006USA
Two year program
Pre-post design with control group
HbAIC screening PCHI’s performance in HbAIC screening in the index health plan improved over 2 years by 7 percentage points, compared with a statewide improvement of 4.9 percentage points (p < .05).
Eye exams For diabetic eye exams, PCHI’s performance improved 18.7 percentage points, compared to a slight decline in statewide performance (p < .05).
26

Program Author/Evaluation design Objectives /clinical area ResultsEffect size
LDL screening For diabetic LDL screening, PCHI improved by 13.2 percentage points, almost twice that of the state average (p < .05),
Nephropathy screening Nephropathy screening rate improved by 15.2 percentage points, over twice the state-wide improvement (p < .05).
Paediatric asthma controller use (PCHI improvement 1.7 percentage points, state improvement 3.9 percentage points, p > .05), 3.8* mean change (process drug).
27

Program Author/Evaluation design Objectives /clinical area ResultsEffect size
Mandel et al., 2007Cincinnati
USA
Between October 1, 2003,andNovember30,2006No control group but interrupted time series desing. Good quality, so will count as control
Asthma improvement in children
Influenza vaccination rates
all-payer asthma population receiving “perfect care” increased from 4% to 88%, with 18 of 44 practices (41%) achieving a perfect care percentage of 95% or greaterinfluenza vaccine increased from 22% at baseline (2003- 2004 season [September 1 through March 31]) to 41% for the 2004-2005 season, to 62% for the 2005-2006 season, with 7 of 44 practices (16%) achieving an influenza vaccination percentage of 80% or greater for the 2005- 2006 season.
28

Program Author/Evaluation design Objectives /clinical area ResultsEffect size
Lindenauer et al., 2007
CMS
USA
2 years
Natural experiment: pre-post with control.
multivariable modeling to estimate the improvement attributable to financial incentives
p4p implementedd with public reporting
Aspirin on arrival Percentage change 3.3**
Aspirin on discharge 0.9
ACE inhibitor 9.9**
Beta blocker on arrival 2.8**
Beta blocker on discharge 2.8**
LV assessment 5.1**
Ace inhibitor for LVSD 2.0
Antibiotic timing for pneumonia patients 4.3**
Vaccination for pneumonia patients 10.9**
Oxygen assessment 0.6
Appropriate care for MI 7.5**
Appropriate care for heart failure 6.0**
Appropriate care for pneumonia 7.1**
Composite process scores all 10 measures 4.3**
Greenberg et al., 2008
Before and after design with no control group Smoking cessation referral rates Staff referrals increased with program incentives (P=.008), with a total of 150 interventions occurring in the 3-month span.
Yao H et al., 2008 Implemented with a demand side intervention TB case detection and treatment The project achieved its case detection target: the total number
29

Program Author/Evaluation design Objectives /clinical area ResultsEffect size
ChinaPre-post design with control group
One year period evaluation
of new smear-positive TB cases identified in the intervention counties during the whole project period (November 2004–October 2005) was 7736, which was 136% of the project target established in the proposal, according to the baseline data of the intervention group. However, no improvement on TB case finding and case holding was found in the intervention group compared with the control group (Table 2). At baseline, the intervention group had a significantly higher case notification rate (P < 0.01).
Fagan et al., 2010
2004-2007Quasi experimental 9before after and control group)
Influenza vaccine Odds ratio1.79 (1.37-2.35)
Haemoglobin testing 0.44 (0.33-0.65)
Eye exam 0.98(0.61-1.58)
Ldl test 0.62(0.44-0.86)
Nephropathy test 0.96(0.62-1.46)
Management of hypertension with diabetes 1.11(0.58-2.13)
30

Program Author/Evaluation design Objectives /clinical area ResultsEffect size
Chien et al., 2010
USA
Study Design. Case-comparison and interrupted times series 2003–2007
Childhood Vaccination rates Hudson Health Plan members or by private practices were also significantly more likely to be immunized (Table 2, high number of Hudson enrolleesOR 5 1.65–1.73, po.001
Jha et al., 2012CMS
Pre-post with control group.
Premier vs non premierMortality rates for different conditions
30-day mortality
The rates of decline in mortality per quarter at the two types of hospitals were also similar (0.04% and 0.04%, respectively; difference, −0.01 percentage points; 95% CI, −0.02 to 0.01),
and mortality remained similar after 6 years under the pay-for-performance system (11.82% for Premier hospitals and 11.74% for non-Premier hospitals; difference, 0.08 percentage points; 95% CI, −0.30 to 0.46). 0.36 for interaction)
We found that the effects of pay for performance on mortality did not differ significantly among conditions for which outcomes were explicitly linked to incentives: acute myocardial infarction
CABG
Congestive heart failure
Pneumonia
Lynch et al.,1995 1990 general practitioners contract Uptake of childhood immunizations While this has led to an increase in the number of general
31

Program Author/Evaluation design Objectives /clinical area ResultsEffect size
practitioners providing the servicesSussman et al., 2000Boston, MassachusettsUSA
Before and after study (no control group) Percentage of the wRVU productivity- After the first year of operation of this plan, there was an overall 20% increase in PCP productivity.
Norton et al.,1992 RCT (2 arms);November 1980 to April 1983; 36 SNFs (18study facilities; 18 control facilities)Up to 4 years
Improvement in health status Patients in experimental homes were more likely to be discharged to home or to an ICF and had less likelihood of hospital admission or death (P _ 0.001)
Shen et al., 2003Maine, USA
CBA; FY 1991 to 1995 Substance abuse treatment The percentage of OSA outpatient clients classified as most severe users dropped by 7 percent ( po50.001) after the innovation of performance based contracting compared to the increase of 2 percent for Medicaid clients
Werner et al., 2012
CMSUSA
Pre-post design with control group5 years
In house mortality rates The performance of the hospitals in the project initially improved more than the performance of the control group: More than half of the pay-for performance hospitals achieved high performance scores, compared to fewer than a third of the control hospitals. However, after five years, the two groups’ scores were virtually identical. Improvements were largest among hospitals that were eligible for larger bonuses, were well financed, or operated in less competitive markets
Basinga et al., 2011
Rwanda
Pre-post with control groups Any prenatal care 0·002 p= 0•875
Four or more prenatal care visits 0·008 p= 0•875
Institutional delivery 0·081 p= 0•017
Tetanus vaccine during prenatal visit 0·051 p= 0•057
Standardised total quality score 0·157 p= 0•020
Younger than 23 months preventive visit, previous 4 weeks 0·119 p= 0•004
24–59 months preventive visit, previous 4 weeks 0·111 p= 0•000
32

Program Author/Evaluation design Objectives /clinical area ResultsEffect size
12–23 months fully immunised −0•055 p= 0•390
Canavan A. and Swai G. (2008)
Tanzania
Pre-post with control groups3 years
In patient department IPD RR: 0.82 (0.76-0.86) P<0.00001
Change in utilization Utilization in health facilities RR: 0.94 (0.83 to 1.08) p>0.40)
Sulku, 2011Turkey
Pre-post with control group5 years
Mortality rates Hospital mortality rates (increased non significantly: 0.01-0.012 p>0.05)
Mean outpatient visits Mean outpatient visits increase by 78% significantly p<0.01
Vergeer and Chansa, 2008.Zambia
Pre-post with control group. ANC No significant change in ANC, 4. No significant difference in intervention and control hospitals in relation to IPD/OPD. Variety of patterns across facilities
Ssengooba et al., 2012.
Pre-post with control group Maternal and child health process measures After 21⁄2 years and three survey rounds, the study found no discernable impact of bonuses on the provision of health services by the PNFP providers (group C). Twenty-two out of 23
33

Program Author/Evaluation design Objectives /clinical area ResultsEffect size
Uganda facilities receiving performance bonuses did reach at least one performance target, and 12 reached all three, but service levels at group B institutions similarly improved. If anything, facilities in the bonus group performed slightly worse than the facilities receiving only the untied base grant and about as well as the facilities in the control group.
Cutler et al., 2007
USA (California P4P)
Retrospective study: before and after (with control group)
Diabetes testing The LDL-C testing rate for patients in the CDCM programwas 91.5% versus 67.8% for the routine care group). The LDL-C goal attainmentrate for the CDCM program was 78.2%, significantly higher thanthe 55.7% rate for the routine care group (P < 0.001
Rosenthal et al., 2005USA California p4p
Cervical screening Compared with physician groups inthe Pacific Northwest, the California network demonstrated greater quality improvement after the pay-for-performance intervention only in cervical cancer screening (a 3.6% difference in improvement [P=.02]).
Mammography Difference in difference result not significant
Haemoglobin Difference in difference result not significant
Gilmore et al., 2007
Hawaii Medical Services
Before and after with control group Patient satisfaction on recommended care We found a consistent, positive association between having seen only program-participating providers and receiving recommended care for all 6 years with odds ratios ranging from 1.06 to 1.27 (95 percent confidence interval: 1.03–1.08, 1.09–1.40)
34

Program Author/Evaluation design Objectives /clinical area ResultsEffect size
AssociationYoung et al., 2007 Before and after with control group/similar to an
interrupted time series designDiabetes measures Based on the absence of a significant interaction term for each
measure in this context, the post-intervention trends were not different from the pre-intervention trends, indicating that the overall pattern of performance did not change after program
Twardella and Brenner, 2007
RCT Smoking cessation Self-reported smoking abstinence obtained at 12 months follow-up and validated by serum cotinine.In intention-to-treat analysis, smoking abstinence at 12 months follow-up as 3% (2/74), 3% (5/ 144), 12% (17/140) and 15% (32/219) in the usual care, and interventions
Scott et al., 2009PIP
Before and after with control group Diabetes testHbA1c test
Model (1) of Table II shows a statistically significant effect of 20% (1% level) forTreatment group 1. This marginal effect suggests that the average GP working in an average practice of the sample that joined the PIP program is more than 20 percentage points more likely to order an HbA1c test than a comparable GP in a practice that has not joined
Schauffler et al., 1999CaliforniaUSA
Before and after (no control group) CHILDHOOD IMMUNIZATIONS The majority of the HMOs exceeded their negotiated targets for most of the quality-of care measures However, they fell considerably short on childhood immunizations, and nearly half missed their targets on mammograms and Pap smears as well. Eight plans missed their targets for childhood immunizations, falling short by 3–12 percent. The five plans that met their targets exceeded them on average by 9.3 percent, with individual plans exceeding it by 2–19 percent. Only four plans missed their targets for cesarean section rates, and they were only about 0.7 percent off target.
CESAREAN SECTIONS.
MAMMOGRAPHIES.
PAP SMEARS
PRENATAL CARE
Kouides et al., 1993
RCT Immunization rates For practices in the incentive group, the mean immunization rate was 68.6% (SD 16.6%) compared with 62.7% (SD 18.07 o ) in the control group practices (P = .22). The median practice-specific improvement in immunization rate was +10.3% in the incentive group compared with +3.5% in the control group (P = .03).
St Jacques et al., 2004
Before and afterNo control group
N= 31 anaesthesiologists,
percentage of first cases of the day in the room at or before the scheduled in-room time
shows that the percentage of first cases of the day meeting the goal of being in the OR at or before their scheduled start time was significantly higher during the sixth month of the study (19 ± 15% vs. 61 ± 19%, p < 0.01),
35

Program Author/Evaluation design Objectives /clinical area ResultsEffect size
percentage of cases with an anesthesia prep time less than a target and that the percentage of cases meeting the goal of an anesthesia preparation time of less than 15 minutes increased over the study period (57 ± 18 vs. 73 ± 14, p < 0.01).
percentage of cases delayed due to waiting for an anesthesiology patient evaluation
delays from waiting for an anesthesia attending were not significantly changed, whereas delays from lengthy anesthesia preparation or emergence time were decreased (14 ± 9 vs. 3 ± 3, p < 0.01) during the study period.
Salize et al., 2009 Cluster-randomised smoking cessation trial. Main outcome was cost-effectiveness but abstinence rates also compared with mixed logistic regression
Smoking cessation The TI intervention was not effective compared with TAU. The point prevalence of abstinence at 12 months was 3.5% vs 2.7%, OR 1.29, 95% CI 0.25 to 6.84, p=0.75
McMenamin et al., 2003
Cross-sectional surveyControl group
Numbers of HMOs providing smoking cessation advice and other interventions such as self help materials and NRT
OR 3.63 (95% CI 1.70 to 7.76, p<0.001), providing NRT starter kit OR 2.75 (95% CI 1.33 to 5.65, p=0.006), providing written materials: on pharmacotherapy OR 2.13 (95% CI 1.04 to 4.33, p=0.034), counselling OR 3.11 (95% CI 1.50 to 6.44, p=0.002), self-help OR 2.33 (95% CI 0.93 to 5.84)
Chee et al, 2007GAVI Incentives for national governments
the evaluators utilized a regression model for 52 countries that received ISS funds from 1995 to 2005 and in-depth qualitative studies in six countries (3 matched pairs of countries with similar circumstances and starting baseline coverage and different results).
A relationship was found between ISS funding and in- creased immunization coverage.
Eichler et al., 2007Haiti: RBF for NGO
Before and after with no control group Immunization coverage for children 6.2%
Percentage of pregnant women receiving at least 3 prenatal care visits 2.2%
Percentage of deliveries assisted by a trained attendant 3%
Percentage of women receiving a postnatal care visit 7.8%
CORT 2007 The program was evaluated using a mix of quantitative (survey) and qualitative (interviews) methodsBefore and after with no control group
Institutional deliveries The proportion of institutional deliveries increased from 32.5% to 65.1% and the number of institutional deliveries in the public sector in Rajasthan state increased by 36% the year after the JSY was established compared to a slight decrease (−0.25%) the previous year (
Armour et al., Before and after: no control group. Cancer screening Results: From 2000 to 2001, CRC screening use increased from
36

Program Author/Evaluation design Objectives /clinical area ResultsEffect size
2004 23.4% to 26.4% (P < .01). Results from the multivariate logistic regression analysis revealed that the probability that a patient received a CRC screening was approximately 3 percentage points higher in the bonus year, 2001 (P < .01).
Chen et al., 2010 Longitudinal study with control groups Diabetes care Patients with diabetes who saw P4Pparticipating physicians were more likely to receive quality care than those who did not (odds ratio, 1.16; 95% confidence interval, 1.11-1.22; P <.001).Patients with diabetes who received quality care were less likely to be hospitalized than those who did not (incident rate ratio, 0.80; 95% confidence interval, 0.80-0.85; P <.001).During 1 year, there was no difference in hospitalization rates between patients with diabetes who saw P4P-participating physicians versus those who did not.However, patients with diabetes who saw P4P-participating physicians in 3 consecutive years were less likely to be hospitalized than those who did not (incident rate ratio, 0.75; 95% confidence interval, 0.61-0.93; P <.01).
Greene et al., 2004 Before and after with control groupStated that they had used a historical control but reported results for before and after studies
N= approximately 900 credentialed primary care physicians as of December 1999, October 2000, and December 2001.
Proper hospital care A statistical process control chart showed a shift toward recommended treatment patterns after our intervention. The rate of exceptions per episode of acute sinusitis decreased 20%, from 326 exceptions per 1000 episodes between January 1, 1999, and October 31, 2000, to 261 between November 1, 2000, and December 31, 2001. P < .005.
Decreased use of less effective or inappropriate antibiotics accounted for most of the change (199 to 136 exceptions per 1000 episodes [32% change]). Azithromycin use decreased 30%, from 97 to 68 prescriptions per 1000 episodes. P < .005.
Firstline antibiotic (amoxicillin and doxycycline) use increased 14%, from 451 to 514 prescriptions per 1000 episodes.
Inappropriate radiology use decreased 20%, from 15 to 12 per 1000 episodes. These changes were significant at P < .005.
37

Program Author/Evaluation design Objectives /clinical area ResultsEffect size
Bardach et al., 2014
RctParticipating practices (n=42 for each group) had similar baseline characteristics, witha mean (median) of 4592 (2500) patients at the incentive group practices and 3042 (2000) at thecontrol group practices.
Aspirin therapy, withIVD or DM
Odds ratio 1.28 (1.10 to 1.50) Pvalue= .001
Blood pressure controlNo IVD or DM 1.23 (1.05 to 1.44) Pvalue=.01
Blood pressure control IVD 0.71 (0.40 to 1.24) Pvalue=0.23
Blood pressure control DM 1.52 (1.12 to 2.07) Pvalue=.007
Blood pressure control IVD or DM 1.37 (1.07 to 1.75) Pvalue=.01
Cholesterol control 0.86 (0.67 to 1.09) Pvalue=.22
Smoking cessation intervention 1.30 (1.04 to 1.63) Pvalue= .02
Bischoff et al, 2012
Before and afterNo control groupN=123 residents
Completion of discharge summary With implementation of the bundle, the average time from patient discharge to completion of the discharge summary fell from 3.5 to 0.61 days (p<0.001).
Percentage of summaries completed on day of discharge The percentage of summaries completed on the day of discharge rose from 38% to 83% (p<0.001)
The percentage of summaries that included all recommended elements The percentage of summaries that included all recommended elements increased from 5% to 88% (p<0.001).
Boland et al., 2010 Before and after no control groupN=81 radiologist
Radiologist report turnaround time The mean C–F times for all radiologists significantly decreased from the baseline (42.7 hours) to the immediate period (31.6 hours) to the post period (16.3 hours) (p < 0.0001).
38

Program Author/Evaluation design Objectives /clinical area ResultsEffect size
Similarly the mean C–P time also declined for all three periods from 20.0 hours at baseline to 19.0 hours at the immediate period to 11.9 hours during the post period (p < 0.0001).
Kruse et al., 2013 Before and after with control group Smoking status documentation Documentation increased from 48% of 207,471 patients before P4P to 71% of 227,574 patients after P4P. Improvement occurred both among P4P-eligible patients, 56% to 83%(AOR, 3.6; 95% CI, 2.9 to 4.5) and the comparable subset of non-P4P-eligible patients, 56% to 80% (AOR, 3.0; 95% CI, 2.3 to 3.9).The difference in improvement between groups was significant (AOR, 1.3; 95% CI, 1.1 to 1.4, p=0.009).
Peabody et al., 2011
Controlled trialN = 10 for both populations
Composite scores of about 4 process measures at thirty-six months after the intervention, bonus sites were 9.7 percentage points higher than baseline (p < 0:001).
39

Supplementary file S7 P4P Typology tool (Ogundeji, 2015)Who received the incentive (Did Individuals or Groups receive the incentive)?Criteria for judging Individuals If the incentives are paid directly to individual health workers/clinicians/doctors only
If individual health worker/clinician/doctor’s income is supplemented as a result of the incentive (e.g. reflected in the rise of personal income) only
Criteria for judging Groups (including schemes where individuals and groups are paid bonuses)
If the incentive is paid to a group or an organization in which individual clinicians may or may not benefit from the incentive directlyGroups include any of the following
Hospital Clinical team General physician (GP) practice NGO Levels of government Faith based organizations
Type of incentive (Was the incentive in the form of Fines or Bonuses)?Criteria for judging Fines If the incentive is negative in the form of reduction in expected payments, penalty, punishment etc.
In some cases, bonuses may or may not be paid as wellCriteria for judging Bonuses If incentive is in the form of increase in payments, bonus, gifts etc. with NO fines leviedSize (Was the size of the incentive small or large)?Criteria for judging Small If the incentive in the P4P programme is smaller than 5% of any one of the following:
Salary of individual clinician/health worker/doctor Anticipated payments (to the health facility/hospital/clinical team) such as budgets (total
budget or budget for the particular intervention in question), fee for service (FFS) and capitation
Criteria for judging Large If the incentive in the P4P programme is 5% and above of any one of the following: Salary of individual clinician/health worker/doctor Anticipated payments (to the health facility/hospital/clinical team) such as budgets (total
budget or budget for the particular intervention in question), fee for service (FFS) and capitation
Timing of payment after achieving targets (time lag): was it short or long?
Criteria for judging short If incentive payment (or penalty) is received not more than 4 months after measurement and confirmation of performance
Criteria for judging long If incentive payment (or penalty) is received more than 4 months after measurement and confirmation of performance
Domain of performance measured (Was the domain of performance measure within clinicians control or out of clinicians’ control)?Criteria for judging within clinicians control
If incentive payments to health service providers are mostly/only based on processes and structures e.g. number of children immunized, routine measurement of blood pressure of patients every month, number of referrals made, rate of cancer screening
Criteria for judging out of clinicians control
If incentive payments to health service providers depend on achieving a change in health outcomes e.g. reduction in mortality rates from a specific disease, blood pressure reduction, patient experience etc.
Performance measure (payment scale) Absolute or relative measure?Criteria for judging Absolute measure
If incentive is paid (fine levied) to the health service provider that based on their performance, not relative to how other health providers perform.For example,
Improvement in performance typically improvement from some baseline measure, using performance score/ performance points achieved
Achieving performance at/above a predetermined target e.g. incentive paid per patient immunized, or 70% improvement from baseline
Criteria for judging Relative measure
If incentive payment is based on the performance of health service providers, relative to that of other providers.For example,
If bonuses are paid for to health service providers in a specific performance rank e.g. the providers above the top quartile of performance.
And/or If fines are levied on health service providers in certain ranks usually the bottom ranks e.g. the
providers below the lower quartile of performanceRisk: High risk or low risk? (based on judgements from Performance measure, Time lag, and Domain of performance measureCriteria for judging High risk If the P4P programme has 2 or more of the following features
If incentive payment (or penalty) is made after 4 months after measurement and confirmation of performance (long time lag)
If the domain of performance measure was mostly out of clinicians control If the perofmance measure (payment scale) is a relative measure
Criteria for judging Low risk If the P4P programme has 2 or more of the following features If incentive payment (or penalty) is made before or at 4 months after measurement and
confirmation of performance (short time lag) If the domain of performance measure was mostly within the clinicians control If the performance measure (payment scale) is an absolute measure
40

41

Supplementary file S8 Formulas and calculations used to convert effect estimates of P4P to standardized mean difference
FormulasConversion from percentage or number of events to odds ratioWhere sample size (N) and percentages or number of events were reported we estimated odds ratio (OR) and associated standard errors (SE), using the formulas below:OR = (Nei /Ni- Nei) / (Nec/Nc- Nec)Where:
Nei = number of events in intervention group Ni = total sample size in intervention group Nec= number of events in control group Nc= total sample size in control group
SE (logOR)= √{ (1/ Nei) + (1/ Ni- Nei) + (1/Nec ) + (1/ Nc- Nec)}
Conversion from odds ratio (OR) or mean difference (MD) to standardized mean difference (d)d = logoddsratio * √3/ πVarianced = Variance of log odds * 3/ π2
d= mean difference/SDSEd= √Varianced
SEd= SE*√3/ π
Combining effect sizes for multiple outcomes within a study Summary effect for two outcomes in a study
Variance
OrSummary effect for more the two outcomes in a study
Variance
Where v= mean of all variance, r= mean of all correlations.
Variance inflation factor (VIF)= Variance * VIF
Where m is the number of outcomes and r is the correlation Other important formulas used in the conversionIf a 95% confidence interval is available for an absolute measure of intervention effect (e.g. SMD, risk difference, rate difference), then the standard error can be calculated asSE = (upper limit CI – lower limit CI) / 3.92.Variance =SE2
SE = √Variance Standard deviation (SD) = √N * (upper CI limit-lower CI limit)/3.92 (FOR 95% CI)SD= √N * SE
42

Supplementary File S9 List of identified primary studies1. An LC, Bluhm JH, Foldes SS, Alesci NL, Klatt CM, Center BA (2008). A randomized trial of a pay-for-performance program
targeting clinician referral to a state tobacco quitline. Archives of Internal Medicine; 168(18):1993-1999.2. Armour BS, Friedman C, Pitts MM, Wike J, Alley L, Etchason J (2004). The influence of year-end bonuses on colorectal cancer
screening. Am J Managed Care; 10(9):617-6243. Ashworth M, Lea R, Gray H, Rowlands G, Gravelle H, Majeed A (2004). How are primary care organizations using financial
incentives to influence prescribing? Journal of Public Health; 26(1):48-51.4. Basinga P, Gertler P, Binagwaho A, Soucat A, SturdyJ, Vermeersch C. (2011). Paying primary health facilities for performance in
Rwanda. World Bank, Washington, DC, Policy research working paper 5190.5. Beaulieu, N. D., & Horrigan, D. R. (2005). Organizational processes and quality. Putting smart money to work for quality
improvement. HSR: Health Services Research, 40, 1318-1334. 6. Bardach, N. S., J. J. Wang, et al. (2013). "Effect of pay-for-performance incentives on quality of care in small practices with
electronic health records: a randomized trial." Jama 310(10): 1051-1059.7. Bischoff, K., A. Goel, et al. (2013). "The Housestaff Incentive Program: improving the timeliness and quality of discharge
summaries by engaging residents in quality improvement." BMJ Qual Saf 22(9): 768-774.8. Boland, G. W., E. F. Halpern, et al. (2010). "Radiologist report turnaround time: impact of pay-for-performance measures." AJR Am
J Roentgenol 195(3): 707-711.9. Calikoglu, S., R. Murray, et al. (2012). "Hospital pay-for-performance programs in Maryland produced strong results, including
reduced hospital-acquired conditions." Health Aff 31(12): 2649-2658.10. Calvert M, Shankar A, McManus RJ, Lester H, Freemantle N. (2009). Effect of the quality and outcomes framework on diabetes care
in the United Kingdom: retrospective cohort study. BMJ; 338:b1870.11. Campbell S, Reeves D, Kontopantelis E, et al. (2007). Quality of primary care in England with the introduction of pay for
performance. N Engl J Med ;357:181e90.12. Campbell SM, Reeves D, Kontopantelis E, et al. (2009) Effects of pay for performance on the quality of primary care in England. N
Engl J Med;361:368e78.13. Canavan A, Swai G. (2008). Payment for Performance (P4P) Evaluation: Tanzania Country Report for Cordaid Godfrey Swai,
National Consultant Width 1. KIT, Amsterdam.14. Cattaneo A, Borgnolo G, Simon G. (2001). Breastfeeding by objectives. European Journal of Public Health ; 11(4):397-401.15. Chang FC, Hu TW, Lin M, et al. (2008). Effects of financing smoking cessation outpatient services in Taiwan. Tob
Control ;17:183e9.16. Chee G, His N, Carlson K, Chankova S, Taylor P. (2007). Evaluation of the first five years of GAVI immunization services support
funding. Prepared for the GAVI Alliance Behtesda, MD: Abt Associates Inc,.17. Chen, J. Y., H. Tian, et al. (2010). "The effect of a PPO pay-for-performance program on patients with diabetes." Am J Manag Care
16(1): e11-19.18. Chien, A. T., D. Eastman, et al. (2012). "Impact of a pay for performance program to improve diabetes care in the safety net." Prev
Med 55 Suppl: S80-85.19. Chien, A. T., Z. Li, et al. (2010). "Improving timely childhood immunizations through pay for performance in Medicaid-managed
care." Health Serv Res 45(6 Pt 2): 1934-1947.20. Clinical Practice Improvement Centre. (2010). Clinical practice improvement payment: User guide V2.0, pilot scheme—phase two.
Brisbane, Australia: Queensland Health21. Coleman T, Lewis S, Hubbard R, Smith C. (2007) Impact of contractual financial incentives on the ascertainment and management
of smoking in primary care. Addiction; 102(5):803-808.22. CORT, Vadodara. Report on assessment of ASHA/JSY scheme (Rajasthan) (2007). Commissioned by Ministry of Health & Family
Welfare, Government of India. Draft.23. Cupples ME, Byrne MC, Smith SM, et al. (2008). Secondary prevention of cardiovascular disease in different primary healthcare
systems with and without pay-for-performance. Heart;94:1594e600.24. Cutler TW, Palmieri J, Khalsa M, Stebbins M (2007). Evaluation of the relationship between a chronic disease care management
program and California pay-for-performance diabetes care cholesterol measures in one medical group. Journal of Managed Care Pharmacy; 13(7):578-588.
25. Doran T, Kontopantelis E, Valderas JM, et al. (2011). Effect of financial incentives on incentivised and non-incentivised clinical activities: longitudinal analysis of data from the UK Quality and Outcomes Framework. BMJ.;342:d3590.
26. Eichler R, Auxila P, Antoine U, Desmangles B. (2007). Performance-based incentives for health: six years of results from supply. side programs in Haiti. CGD Working Paper #121.Washington, DC: Center for Global Development
27. Fagan PJ, Schuster AB, Boyd C, Marsteller JA, Griswold M, Murphy SM, et al. (2010). Chronic care improvement in primary care: evaluation of an integrated pay-for-performance and practice-based care coordination program among elderly patients with diabetes. Health Serv Res.;45:1763-82.
28. Fairbrother G, Hanson KL, Friedman S, Butts GC. (1999). The impact of physician bonuses, enhanced fees, and feedback on childhood immunization coverage rates. American Journal of Public Health; 89(2):171-175.
29. Fairbrother G, Siegel MJ, Friedman S, Kory PD, Butts GC. (2001). Impact of financial incentives on documented immunization rates in the inner city: results of a randomized controlled trial. Ambul Pediatr. ;1:206-12. [PMID: 11888402]
30. Felt-Lisk S, Gimm G, Peterson S. (2007). Making pay-for-performance work in Medicaid. Health Affairs; 26(4):W516-W527.31. Friedman, N. L., Kokia, E., & Shemer, J. (2003). Health value added (HVA): Linking strategy, performance, and measurement in
healthcare organizations. Israel Medical Association Journal, 5, 3-8. 32. Furth, R. (2006). Zambia Pilot Study of Performance-Based Incentives, USAID
http://www.qaproject.org/news/PDFs/ZambiaPerformancePilotStudyInitiatives.pdf (visited June 2008) 33. Gavagan TF, Du H, Saver BG, Adams GJ, Graham DM, McCray R, et al. (2010). Effect of financial incentives on improvement in
medical quality indicators for primary care. J Am Board Fam Med.;23:622-31. [PMID: 20823357]34. Gilmore AS, Zhao YX, Kang N, Ryskina KL, Legorreta AP, Taira DA et al. (2007). Patient outcomes and evidence-based medicine
in a preferred provider organization setting: A six-year evaluation of a physician pay-for-performance program. Health Services Research; 42(6):2140-2159.
35. Glickman SW, Ou FS, Delong ER, Roe MT, Lytle BL, Mulgund J et al. (2007). Pay for performance, quality of care, and outcomes in acute myocardial infarction. Jama-Journal of the American Medical Association; 297(21):2373-2380.
36. Grady KE, Lemkau JP, Lee NR, Caddell C. (1999). Enhancing mammography referral in primary care. Preventive Medicine; 26(6):791-800.
37. Greenberg MR, Weinstock M, Fenimore DG, Sierzega GM. (2008). Emergency department tobacco cessation program: staff participation and intervention success among patients. J Am Osteopath Assoc; 108(8):391-396.
38. Gross R, Elhaynay A, Friedman N, Buetow S. (2008). Pay-for-performance programs in P4P programs Israeli sick funds. J Health Organ Manag ; 22(1):23-35.
43

39. Grossbart, S. R. (2006). What’s the return? Assessing the effect of “pay-for-performance” initiatives on the quality of care delivery. Medical Care Research and Review, 63, 29S-48S.
40. Gulliford MC, Ashworth M, Robotham D, Mohiddin A. (2007). Achievement of metabolic targets for diabetes by English primary care practices under a new system of incentives. Diabetic Medicine 2007; 24(5):505-511.
41. Harries AD, Salaniponi FM, Nunn RR, Raviglione M. (2005). Performance-related allowances within the Malawi National Tuberculosis Control Programme. International Journal of Tuberculosis and Lung Disease; 9(2):138-144.
42. Hillman AL, Ripley K, Goldfarb N, Nuamah I, Weiner J, Lusk E. (1998). Physician financial incentives and feedback: failure to increase cancer screening in Medicaid managed care. Am J Public Health;88:1699-701. [PMID: 9807540]
43. Hillman AL, Ripley K, Goldfarb N, Weiner J, Nuamah I, Lusk E. (1999). The use of physician financial incentives and feedback to improve pediatric preventive care in Medicaid managed care. Pediatrics 1999; 104(4):931-935.
44. Hippisley-Cox, J., Vinogradova, Y., and Coupland, C. Final report for the Information Centre for Health and Social Care: time series analysis for 2001-2006 for selected clinical indicators from the QOF. http://www.qresearch.org/Public_Documents/Time%20Series%Analysis%20for%20selected%20clinical.pdf.
45. Jha, A. K., K. E. Joynt, et al. (2012). "The Long-Term Effect of Premier Pay for Performance on Patient Outcomes." New England Journal of Medicine 366(17): 1606-1615.
46. Kirschner, K., J. Braspenning, et al. (2013). "Assessment of a pay-for-performance program in primary care designed by target users." Fam Pract 30(2): 161-171.
47. Kontopantelis, E., D. Reeves, et al. (2012). "Recorded quality of primary care for patients with diabetes in England before and after the introduction of a financial incentive scheme: a longitudinal observational study." BMJ Quality & Safety.
48. Kruse, G. R., Y. Chang, et al. (2013). "Healthcare system effects of pay-for-performance for smoking status documentation." Am J Manag Care 19(7): 554-561.
49. Kouides RW, Bennett NM, Lewis B, Cappuccio JD, Barker WH, LaForce FM. (1998). Performance-based physician reimbursement and influenza immunization rates in the elderly. American Journal of Preventive Medicine; 14(2):89-95.
50. Kouides RW, Lewis B, Bennett NM, Bell KM, Barker WH, Black ER et al. (1993). A Performance-Based Incentive Program for Influenza Immunization in the Elderly. American Journal of Preventive Medicine; 9(4):250-255.
51. Kuo, R. N. C., Chung, K.-P., & Lai, M.-S. (2011). Effect of the pay-for-performance program for breast cancer care in Taiwan. American Journal of Managed Care, 17(5 Spec No.), e203-e211.Performance Management Program New Zealand 2006
52. Larsen DL, Cannon W, Towner S. (2003). Longitudinal assessment of a diabetes care management system in an integrated health network. J Manag Care Pharm; 9(6):552-558.
53. LeBaron CW, Mercer JT, Massoudi MS, Dini E, Stevenson J, Fischer WM et al. (1999). Changes in clinic vaccination coverage after institution of measurement and feedback in 4 states and 2 cities. Archives of Pediatrics & Adolescent Medicine; 153(8):879-886.
54. Lee, T.-T., Cheng, S.-H., Chen, C.-C., & Lai, M.-S. (2010). A pay-for-performance program for diabetes care in Taiwan: A preliminary assessment. American Journal of Managed Care, 16, 65-69.
55. Levin-Scherz J, DeVita N, Timbie J. Impact of pay-for-performance contracts and network registry on diabetes and asthma HEDIS (R) measures in an integrated delivery network. Medical Care Research and Review 2006; 63(1):14S-28S.
56. Li, J., Hurley, J., DeCicca, P., & Buckley, G. (2010). Physician response to pay-for-performance—Evidence from a natural experiment. Hamilton, Ontario, Canada: McMaster University.
57. Li, Y.-H., Tsai, W.-C., Khan, M., Yang, W.-T., Lee, T.-F., Wu, Y.-C., & Kung, P.-T. (2010).The effects of pay-for-performance on tuberculosis treatment in Taiwan. Health Policy and Planning, 25, 334-341.
58. Lindenauer PK, Remus D, Roman S, Rothberg MB, Benjamin EM, Ma A et al. (2007). Public reporting and pay for performance in hospital quality improvement. New England Journal of Medicine; 356(5):486-496.
59. Lynch M. (1995). Effect of Practice and Patient Population Characteristics on the Uptake of Childhood Immunizations. British Journal of General Practice; 45(393):205-208.
60. MacBride-Stewart SP, Elton R, Walley T. (2008). Do quality incentives change prescribing patterns in primary care? An observational study in Scotland. Family Practice; 25(1):27-32.
61. Magee GM, Hunter SJ, Cardwell CR, Savage G, Kee F, Murphy MC et al. (2010). Identifying additional patients with diabetic nephropathy using the UK primary care initiative. Diabet Med.; 27(12):1372-1378.
62. Mandel KE, Kotagal UR. (2007). Pay for performance alone cannot drive quality. Archives of Pediatrics & Adolescent Medicine; 161(7):650-655.
63. McGovern MP, Boroujerdi MA, Taylor MW, et al. (2008). The effect of the UK incentive-based contract on the management of patients with coronary heart disease in primary care. Fam Pract. ;25(1):33-39.
64. McMenamin SB, Schauffler HH, Shortell SM, et al. (2003). Support for smoking cessation interventions in physician organizations: results from a national study. Med Care;41:1396e406.
65. Millett C, Gray J, Saxena S, et al. (2003). Impact of a pay-for-performance incentive on support for smoking cessation and on smoking prevalence among people with diabetes. CMAJ;176:1705e10
66. Morrow RW, Gooding AD, Clark C. Improving physicians' preventive health care behavior through peer review and financial incentives. Arch Fam Med 1995; 4(2):165-169.
67. Norton EC. (1992). Incentive regulation of nursing homes. J Health Econ.;11: 105-28. 68. Oluwatowoju I, Abu E, Wild SH, Byrne CD. (2010). Improvements in glycaemic control and cholesterol concentrations associated
with the Quality and Outcomes Framework: a regional 2-year audit of diabetes care in the UK. Diabet Med. ;27(3):354-359.69. Peabody, J., R. Shimkhada, et al. (2011). "Financial incentives and measurement improved physicians' quality of care in the
Philippines." Health Aff 30(4): 773-781.70. Purdy S, Griffin T, Salisbury C, Sharp D. Emergency admissions for coronary heart disease: a cross-sectional study of general
practice, population and hospital factors in England. Public Health. 2011;125(1):46-54.71. Queensland Health. (2010). Clinical practice improvement payment. Retrieved from
http://www.health.qld.gov.au/cpic/service_improve/cpip.asp72. Rosenthal MB, Frank RG, et al. (2005). Early experience with payfor- performance: From concept to practice. JAMA;
294(14):1788–93. 73. Roski J, Jeddeloh R, An L, et al. (2003). The impact of financial incentives and a patient registry on preventive care quality:
increasing provider adherence to evidence-based smoking cessation practice guidelines. Prev Med 2003;36:291e9.74. Ryan AM. (2009). Effects of the Premier hospital quality incentive demonstration on Medicare patient mortality and cost. Health
Services Research; 44(3):821-842.75. Salize HJ, Merkel S, Reinhard I, et al. (2009). Cost-effective primary care-based strategies to improve smoking cessation: more value
for money. Arch Intern Med;169:230e576. Schauffler HH, Brown C, Milstein A. (1999). Raising the bar: The use of performance guarantees by the Pacific Business Group on
Health. Health Affairs; 18(2):134-142.77. Scott A, Schurer S, Jensen PH, Sivey P (2009). The effects of an incentive program on quality of care in diabetes management.
Health Economics , 18(9):1091-1108.
44

78. Serumaga B, Ross-Degnan D, Avery AJ, Elliott RA, Majumdar SR, Zhang F, et al. (2011). Effect of pay for performance on the management and outcomes of hypertension in the United Kingdom: interrupted time series study. BMJ. ; 342:d108. [PMID: 21266440]
79. Shen Y. (2003). Selection incentives in a performance-based contracting system. Health Serv Res.;38:535-52. 80. Simpson CR, Hannaford PC, Lefevre K, et al. (2006). Effect of the UK incentive-based contract on the management of patients with
stroke in primary care. Stroke;37:2354e60.81. Simpson CR, Hannaford PC, Ritchie LD, Sheikh A, Williams D. (2011). Impact of the pay-for-performance contract and the
management of hypertension in Scottish primary care: a 6-year population-based repeated cross-sectional study. Br J Gen Pract.;61:e443-51. [PMID:21722469]
82. Simpson CR, Hippisley-Cox J, Sheikh A. (2010). Trends in the epidemiology of smoking recorded in UK general practice. Br J Gen Pract;60:e121e7.
83. Srirangalingam U, Sahathevan SK, Lasker SS, Chowdhury TA. (2006). Changing pattern of referral to a diabetes clinic following implementation of the new UK GP contract. British Journal of General Practice; 56(529):624-626.
84. Ssengooba, F., B. McPake, et al. (2012). "Why performance-based contracting failed in Uganda – An “open-box” evaluation of a complex health system intervention." Social Science & Medicine 75(2): 377-383.
85. St Jacques PJ, Patel N, Higgins MS. (2004). Improving anesthesiologist performance through profiling and incentives. J Clin Anesth 4;16:523-8. [PMID:15590256
86. Strong M, South G, Carlisle R. (2009). The UK Quality and Outcomes Framework pay-for-performance scheme and spirometry: rewarding quality or just quantity? A cross-sectional study in Rotherham, UK. BMC Health Serv Res; 9:108.
87. Sussman AJ, Fairchild DG, Coblyn J, Brennan TA.(2001). Primary care compensation at an academic medical center: A model for the mixed-payer environment. Academic Medicine; 76(7):693-699.
88. Sutton, M., S. Nikolova, et al. (2012). Reduced mortality with hospital pay for performance in England. N Engl J Med 367(19): 1821-1828.
89. Tahrani AA, McCarthy M, Godson J, et al. (2007). Diabetes care and the new GMS contract: the evidence for a whole county. Br J Gen Pract ;57:483e5.
90. Tsai, W.-C., Kung, P.-T., Khan, M., Campbell, C., Yang, W.-T., Lee, T.-F., & Li, Y.-H. (2010). Effects of pay-for-performance system on tuberculosis default cases control and treatment in Taiwan. Journal of Infection, 61, 235-243.
91. Twardella D, Brenner H. (2007). Effects of practitioner education, practitioner payment and reimbursement of patients' drug costs on smoking cessation in primary care: a cluster randomised trial. Tobacco Control; 16(1):15-21.
92. Vaghela P, Ashworth M, Schofield P, Gulliford MC. (2008). Population intermediate outcomes of diabetes under pay for performance incentives in England from 2004 to 2008. Diabetes Care.
93. Vergeer P, Chansa C. Payment for Performance (P4P) Evaluation: Zambia Country Report for Cordaid. KIT, Amsterdam.94. Werner, R. M., R. T. Konetzka, et al. (2013). "The effect of pay-for-performance in nursing homes: evidence from state Medicaid
programs." Health Serv Res 48(4): 1393-1414.95. Yao H, Wei X, Liu J, Zhao J, Hu D, Walley JD. (2008). Evaluating the effects of providing financial incentives to tuberculosis
patients and health providers in China. International Journal of Tuberculosis and Lung Disease; 12(10):1166-1172.96. Young G, Meterko M, et al. (2007). Effects of paying physicians based on their relative performance for quality. Journal of General
Internal Medicine ;22(6):872–6.
45

Supplementary File S10 List of excluded studies
Reason for exclusion: Studies that did not evaluate the effects of P4P on healthcare quality/cost/performance/outcomes e.g. implementation studies or studies exploring the take up of p4p
1. Alshamsan R, Lee JT, Majeed A, Netuveli G, Millett C. Effect of a UK pay-for-performance program on ethnic disparities in diabetes outcomes: interrupted time series analysis. Ann Fam Med. 2012;10:228-34.
2. Anderson, K. K., Sebaldt, R. J., Lohfeld, L., Burgess, K., Donald, F. C., & Kaczorowski, J.(2006). Views of family physicians in southwestern Ontario on preventive care services and performance incentives. Family Practice, 23, 469-471
3. Ashworth M, Armstrong D, de Freitas J, Boullier G, Garforth J, Virji A. The relationship between income and performance indicators in general practice: a cross-sectional study. Health Serv Manage Res 2005; 18(4):258-264.
4. Ashworth M, Armstrong D. The relationship between general practice characteristics and quality of care: a national survey of quality indicators used in the UK Quality and Outcomes Framework, 2004-5. BMC Fam Pract. 2006;7:68.
5. Ashworth M, Golding S, Majeed A. Prescribing indicators and their use by primary care groups to influence prescribing. Journal of Clinical Pharmacy and Therapeutics 2002; 27(3):197-204.
6. Ashworth M, Golding S, Shephard L, Majeed A. Prescribing incentive schemes in two NHS regions: cross sectional survey. British Medical Journal 2002; 324(7347):1187-1188.
7. Ashworth M, Lloyd D, Smith RS, Wagner A, Rowlands G. Social deprivation and statin prescribing: a cross-sectional analysis using data from the new UK general practitioner 'Quality and Outcomes Framework'. Journal of Public Health 2007; 29(1):40-47.
8. Ashworth M, Medina J, Morgan M. Effect of social deprivation on blood pressure monitoring and control in England: a survey of data from the quality and outcomes framework. BMJ 2008; 337:a2030.
9. Ashworth M, Schofield P, Seed P, Durbaba S, Kordowicz M, Jones R. Identifying poorly performing general practices in England: a longitudinal study using data from the quality and outcomes framework. J Health Serv Res Policy. 2011;16(1):21-27.
10. Ashworth M, Seed P, Armstrong D, Durbaba S, Jones R. The relationship between social deprivation and the quality of primary care: a national survey using indicators from the UK Quality and Outcomes Framework. British Journal of General Practice 2007; 57(539):441-448.
11. Beith A, Eichler R, Weil D. Performance-based incentives for health: A way to improve tuberculosis detection and treatment completion? CGD Working Paper #122. Washington, DC: Center for Global Development, 2007.
12. Bennett NM, Lewis B, Doniger AS, Bell K, Kouides R, LaForce FM et al. A Coordinated, Community-Wide Program in Monroe County, New-York, to Increase Influenza Immunization Rates in the Elderly. Archives of Internal Medicine 1994; 154(15):1741-1745.
13. Bhattacharyya T, Mehta P, Freiberg AA. Hospital characteristics associated with success in a pay-for-performance program in orthopaedic surgery. Journal of Bone and Joint Surgery-American Volume 2008; 90A(6):1240-1243.
14. Bonis PA: Quality incentive payment systems: promise and problems. Journal of Clinical Gastroenterology 2005, 39(4 Suppl 2):S176-182.
15. Bottle A, Gnani S, Saxena S, Aylin P, Mainous AG III, Majeed A. Association between quality of primary care and hospitalization for coronary heart disease in England: national cross-sectional study. J Gen Intern Med. 2008;23(2):135-141.
16. Bottle A, Millett C, Xie Y, Saxena S, Wachter RM, Majeed A. Quality of primary care and hospital admissions for diabetes mellitus in England. J Ambul Care Manage. 2008;31(3):226-238.
17. Carey IM, DeWilde S, Harris T, Whincup PH, Cook DG. Spurious trends in coronary heart disease incidence: unintended consequences of the new GP contract? British Journal of General Practice 2007; 57(539):486-489.
18. Carey IM, Nightingale CM, Dewilde S, Harris T, Whincup PH, Cook DG. Blood pressure recording bias during a period when the Quality and Outcomes Framework was introduced. J Hum Hypertens. 2009;23(11):764-770.
19. Casale AS, Paulus RA, Selna MJ, Doll MC, Bothe AE, McKinley KE et al. "ProvenCare(SM)" a provider-driven pay-for-performance program for acute episodic cardiac surgical core. Annals of Surgery 2007; 246(4):613-623.
20. Casalino L, Gillies RR, Shortell SM, Schmittdiel JA, Bodenheimer T, Robinson JC et al. External incentives, information technology, and organized processes to improve health care quality for patients with chronic diseases. Jama-Journal of the American Medical Association 2003; 289(4):434-441.
21. Chang FC, Hu TW, Lo SY, et al. Quit smoking advice from health professionals in Taiwan: the role of funding policy and smoker socioeconomic status. Tob Control 2010;19:44e9.
22. Chang, H. J. (2004, June 6-8). Quality-based payment—Taiwan’s experience. Paper presented at Academy Health Annual Research Meeting, San Diego, CA.
23. Chen, T. T., Chung, K. P., Lin, I. C., & Lai, M. (2011). Unintended consequence of diabetes P4P program in Taiwan: Are patients with more comorbidities or more severe conditions likely to be excluded from the P4P program? Health Services Research, 46, 47-60.
24. Cheng, T. M. (2006, June 25-27). P4P in Taiwan. Paper presented at Academy Health Annual Research Meeting, Seattle, WA.25. Christensen DB, Neil N, Fassett WE, Smith DH, Holmes G, Stergachis A. Frequency and characteristics of cognitive services provided
in response to a financial incentive. J Am Pharm Assoc (Wash). 2000;40:609-17. [PMID: 11029841]26. Coleman K, Reiter KL, Fulwiler D. The impact of pay-for-performance on diabetes care in a large network of community health
centers. Journal of Health Care for the Poor and Underserved 2007; 18(4):966-983.27. Coleman T, Wynn AT, Barrett S, et al. Intervention study to evaluate pilot health promotion payment aimed at increasing general
practitioners’ antismoking advice to smokers. BMJ 2001;323:435e6.28. Coleman T, Wynn AT, Stevenson K, Cheater F. Qualitative study of pilot payment aimed at increasing general practitioners'
antismoking advice to smokers. British Medical Journal 2001; 323(7310):432-435.29. Crawley D, Ng A, Mainous AG, III, Majeed A, Millett C. Impact of pay for performance on quality of chronic disease management by
social class group in England. J R Soc Med 2009; 102(3):103-107.30. Damberg CL, Raube K, Teleki SS, Dela CE. Taking stock of pay-for-performance: a candid assessment from the front lines. Health Aff
(Millwood ) 2009; 28(2):517-525.31. de Brantes FS, D'Andrea BG. Physicians respond to pay-for-performance incentives: larger incentives yield greater participation. Am J
Manag Care 2009; 15(5):305-310.32. Doran T, Fullwood C, Gravelle H, et al. Pay-for-performance programs in family practices in the United Kingdom. N Engl J Med.
2006;355(4):375-384.33. Doran T, Fullwood C, Kontopantelis E, Reeves D. Effect of financial incentives on inequalities in the delivery of primary clinical care
in England: analysis of clinical activity indicators for the quality and outcomes framework. Lancet. 2008;372(9640):728-736.34. Doran T, Fullwood C, Reeves D, Gravelle H, Roland M. Exclusion of patients from pay-for-performance targets by english physicians.
New England Journal of Medicine 2008; 359(3):274-284.35. Doran T. Lessons from early experience with pay for performance. Disease Management & Health Outcomes 2008; 16(2):69-77.36. Doran, T., & Roland, M. (2010). Lessons from major initiatives to improve primary care in the United Kingdom. Health Affairs, 29,
1023-1029.
46

37. Downing A, Rudge G, Cheng Y, Tu YK, Keen J, Gilthorpe MS. Do the UK government's new Quality and Outcomes Framework (QOF) scores adequately measure primary care performance? A cross-sectional survey of routine healthcare data. Bmc Health Services Research 2007; 7.
38. Ettner SL, Thompson TJ, Stevens MR, Mangione CM, Kim C, Neil Steers W, et al; TRIAD Study Group. Are physician reimbursement strategies associated with processes of care and patient satisfaction for patients with diabetes in managed care? Health Serv Res. 2006;41:1221-41. [PMID: 16899004]
39. Fairbrother G, Friedman S, Hanson KL, Butts GC. Effect of the vaccines for children program on inner-city neighborhood physicians. Archives of Pediatrics & Adolescent Medicine 1997; 151(12):1229-1235.
40. Fairbrother G, Hanson KL, Butts GC, Friedman S. Comparison of preventive care in Medicaid managed care and medicaid fee for service in institutions and private practices. Ambulatory Pediatrics 2001; 1(6):294-301.
41. Feely J, Moriarty S, O'Connor P. Stimulating reporting of adverse drug reactions by using a fee. BMJ 1990; 300(6716):22-23.42. Fleetcroft R, Parekh-Bhurke S, Howe A, Cookson R, Swift L, Steel N. The UK pay-for-performance programme in primary care:
estimation of population mortality reduction. Br J Gen Pract. 2010;60(578):e345-e352.43. Fleetcroft R, Steel N, Cookson R, Howe A. “Mind the gap!”Evaluation of the performance gap attributable to exception reporting and
target thresholds in the new GMS contract: National database analysis. BMC Health Serv Res. 2008;8:131.44. Francis DO, Beckman H, Chamberlain J, Partridge G, Greene RA. Introducing a multifaceted intervention to improve the management
of otitis media: How do pediatricians, internists, and family physicians respond? American Journal of Medical Quality 2006; 21(2):134-143.
45. Gemmell I, Campbell S, Hann M, Sibbald B. Assessing workload in general practice in England before and after the introduction of the pay-for-performance contract. J Adv Nurs 2009; 65(3):509-515.
46. Gene-Badia J, Escaramis-Babiano G, Sans-Corrales M, Sampietro-Colom L, Aguado-Menguy F, Cabezas-Pena C et al. Impact of economic incentives on quality of professional life and on end-user satisfaction in primary care. Health Policy 2007; 80(1):2-10. Not an effectiveness evaluation
47. Gosden T, Sibbald B, et al.Paying doctors by salary: a controlled study of general practitioner behaviour in England. Health Policy 2003;64(3):415–23.
48. Gravelle H, Sutton M, Ma A. Doctor behaviour under a pay for performance contract: Further evidence from the quality and outcomes framework. 34, 1-31. 2008. The University of York, Centre for Health Economics. CHE Research Paper. Ref Type: Report
49. Gray J, Millett C, Saxena S, Netuveli G, Khunti K, Majeed A. Ethnicity and quality of diabetes care in a health system with universal coverage: Population-based cross-sectional survey in primary care. Journal of General Internal Medicine 2007; 22(9):1317-1320.
50. Guthrie, B., McLean, G., & Sutton, M. (2006). Workload and reward in the quality and outcomes framework of the 2004 general practice contract. British Journal of General Practice, 56, 836-841.
51. Halanych JH, Safford MM, Keys WC, Person SD, Shikany JM, Kim YI et al. Burden of comorbid medical conditions and quality of diabetes care. Diabetes Care 2007; 30(12):2999-3004.
52. Helm C, Holladay CL, Tortorella FR. The performance management system: Applying and evaluating a pay-for-performance initiative. Journal of Healthcare Management 2007; 52(1):49-62.
53. Heneghan C, Perera R, Mant D, Glasziou P. Hypertension guideline recommendations in general practice: awareness, agreement, adoption, and adherence. British Journal of General Practice 2007; 57(545):948-952.
54. Herrin J, Nicewander D, Ballard DJ. The effect of health care system administrator pay-for-performance on quality of care. Jt Comm J Qual Patient Saf 2008; 34(11):646-654.
55. Hippisley-Cox J, O'Hanlon S, Coupland C. Association of deprivation, ethnicity, and sex with quality indicators for diabetes: population based survey of 53 000 patients in primary care. British Medical Journal 2004; 329(7477):1267-1269.
56. Hughes E. Payment by results--a model for other diabetes healthcare systems? Prim Care Diabetes 2007; 1(2):111-113.57. Incentives and rewards best practices primer: Lessons learned from early pilots. 2006. The Leapfrog Group. Ref Type: Report58. Kantarevic, J., Kralj, B., & Weinkauf, D. (2010). Enhanced fee-for-service model and access to physician services: Evidence from
family health groups in Ontario (IZA Discussion Paper No. 4862). Bonn, Germany: Institute for the Study of LaborJ. 59. Karve AM, Ou FS, Lytle BL, Peterson ED. Potential unintended financial consequences of pay-for-performance on the quality of care
for minority patients. American Heart Journal 2008; 155(3):571-576.60. Katz, A., Bogdanovic, B., & Soodeen, R. (2010). Physician integrated network baseline evaluation: Linking electronic medical records
and administrative data. Winnipeg, Canada: Manitoba Centre for Health Policy61. Keating NL, Landrum MB, Landon BE, Ayanian JZ, Borbas C, Robert WF et al. The influence of physicians' practice management
strategies and financial arrangements on quality of care among patients with diabetes. Medical Care 2004; 42(9):829-839.62. Khunti K, Gadsby R, Millett C, Majeed A, Davies M. Quality of diabetes care in the UK: comparison of published quality-of-care
reports with results of the Quality and Outcomes Framework for Diabetes. Diabet Med. 2007;24(12):1436-1441.63. Kralewski JE, Rich EC, Feldman R, Dowd BE, Bernhardt T, Johnson C,et al. The effects of medical group practice and physician
payment methods on costs of care. Health Serv Res. 2000;35:591-613. [PMID: 10966087] 64. Kwaliteit Gezondheidszorg, UMC St Radboud. Ref Type: Report65. Lester, H., Schmittdiel, J., Selby, J., Fireman, B., Campbell, S., Lee, J., Whippy, A. & Madvig, P. 2010. The impact of removing
financial incentives from clinical quality indicators: longitudinal analysis of four Kaiser Permanente indicators. BMJ, 11.66. Li R, Simon J, Bodenheimer T, Gillies RR, Casalino L, Schmittdiel J et al. Organizational factors affecting the adoption of diabetes
care management process in physician organizations. Diabetes Care 2004; 27(10):2312-2316.67. Liu X, Mills A. The influence of bonus payments to doctors on hospital revenue: results of a quasi-experimental study. Applied Health
Economics & Health Policy 2003;2:91–8.68. Looking at lessons on quality from the Medicare pay-for-performance hospital demonstration. Qual Lett Healthc Lead 2005; 17(10):2-
13, 1.69. Ludwig Boltzmann Institut fur Health Technology Assessment. (2009, December). Schweregraddifferenzierung in der neurologischen
und trauma-rehabilitation: Internationale erfahrungen zur qualitats-, performancemessung und vergütung (No. 23b) [Classification of disease severity for neuro- and trauma rehabilitation: International experiences with measurement and remuneration of quality and performance].
70. Maestad O. (2007), Rewarding Safe Motherhood: How can Performance-Based Funding Reduce Maternal and Newborn Mortality in Tanzania?, CMI report series; 2007/17, http://www.cmi.no/publications/file/?2916=rewarding-safe-motherhood
71. Majeed A, Williams J, De Lusignan S, Chan T. Management of heart failure in primary care after implementation of the National Service Framework for Coronary Heart Disease: a cross-sectional study. Public Health 2005; 119(2):105-111.
72. May EL. Take the lead or take your chances: engaging physicians in pay-for-performance. Healthc Exec 2005; 20(2):24-28.73. McCarlie J, Reid E, Brady AJB. Audit of the new GMS contract Quality and Outcomes Framework: Raising standards in CHD. The
British Journal of Cardiology 14, 117-120. 2007. Ref Type: Journal (Full)74. McDonald, R., White, J., & Marmor, T. R. (2009). Paying for performance in primary medical care: Learning about and learning from
“success” and “failure” in England and California. Journal of Health Politics, Policy and Law, 34, 747-776.
47

75. McElduff P, Lyratzopoulos G, Edwards R, Heller RF, Shekelle P,Roland M. Will changes in primary care improve health outcomes? Modelling the impact of financial incentives introduced to improve quality of care in the UK. Qual Saf Health Care. 2004;13(3):191-197.
76. McGovern MP, Williams DJ, Hannaford PC, et al. Introduction of a new incentive and target-based contract for family physicians in the UK: good for older patients with diabetes but less good for women? Diabet Med. 2008;25(9):1083-1089.
77. McLean G, Guthrie B, Sutton M. Differences in the quality of primary medical care for CVD and diabetes across the NHS: evidence from the quality and outcomes framework. Bmc Health Services Research 2007; 7.
78. McLean G, Sutton M, Guthrie B. Deprivation and quality of primary care services: evidence for persistence of the inverse care law from the UK Quality and Outcomes Framework. Journal of Epidemiology and Community Health 2006; 60(11):917-922.
79. McMenamin SB, Schmittdiel J, Halpin HA, Gillies R, Rundall TG, Shortell SA. Health promotion in physician organizations - Results from a national study. American Journal of Preventive Medicine 2004; 26(4):259-264.
80. Mehrotra A, Pearson SD, Coltin KL, Kleinman KP, Singer JA, Rabson B et al. The response of physician groups to P4P incentives. Am J Manag Care 2007; 13(5):249-255.
81. Menachemi N, Struchen-Shellhorn W, Brooks RG, Simpson L. Influence of pay-for-performance programs on information technology use among child health providers: the devil is in the details. Pediatrics 2009; 123 Suppl 2:S92-S96.
82. Millett C, Bottle A, Ng A, et al. Pay for perfomance and the quality of diabetes management in individuals with and without co-morbid medical conditions. J R Soc Med. 2009;102(9):369-377.
83. Millett C, Car J, Eldred D, Khunti K, Mainous AG, Majeed A. Diabetes prevalence, process of care and outcomes in relation to practice size, caseload and deprivation: national cross-sectional study in primary care. Journal of the Royal Society of Medicine 2007; 100(6):275-283.
84. Millett C, Gray J, Bottle A, Majeed A. Ethnic disparities in blood pressure management in patients with hypertension after the introduction of pay for performance. Ann Fam Med 2008; 6(6):490-496.
85. Millett C, Gray J, Wall M, et al. Ethnic disparities in coronary heart disease management and pay for performance in the UK. J Gen Intern Med 2008;24:8e13.
86. Millett C, Netuveli G, Saxena S, Majeed A. Impact of pay for performance on ethnic disparities in intermediate outcomes for diabetes: longitudinal study. Diabetes Care 2008.
87. Mullen KJ, Frank RG, Rosenthal MB. Can you get what you pay for? Pay-for-performance and the quality of healthcare providers. 14886, 1-43. 2009. Cambridge, Massachusetts, National Bureau of Economic Research. NBER Working Paper Series
88. Murray J, Saxena S, Millett C, Curcin V, de Lusignan S, Majeed A. Reductions in risk factors for secondary prevention of coronary heart disease by ethnic group in south-west London: 10-year longitudinal study (1998-2007). Fam Pract. 2010;27(4):430-438.
89. O'Malley AS, Pham HH, Reschovsky JD. Predictors of the growing influence of clinical practice guidelines. Journal of General Internal Medicine 2007; 22(6):742-748.
90. Patel PH, Siemons D, Shields MC. Proven methods to achieve high payment for performance. J Med Pract Manage 2007; 23(1):5-11.91. Pearson SD, Schneider EC, Kleinman KP, Coltin KL, Singer JA. The impact of pay-for-performance on health care quality in
Massachusetts, 2001-2003. Health Affairs 2008; 27(4):1167-1176.92. Petersen, L. A., Simpson, K., Pietz, K., Urech, T. H., Hysong, S. J., Profit, J., Conrad, D. A., Dudley, R. A. & Woodard, L. D. 2013.
Effects of individual physician-level and practice-level financial incentives on hypertension care: a randomized trial. Jama, 310, 1042-50.
93. Pham HH, Landon BE, Reschovsky JD, Wu B, Schrag D. Rapidity and modality of imaging for acute low back pain in elderly patients. Arch Intern Med 2009; 169(10):972-981.
94. Pines JM. Profiles in patient safety: Antibiotic timing in pneumonia and pay-for-performance. Academic Emergency Medicine 2006; 13(7):787-790.
95. Pourat N, Rice T, Tai-Seale M, Bolan G, Nihalani J. Association between physician compensation methods and delivery of guideline-concordant STD care: Is there a link? Am J Managed Care 2005; 11(7):426-432.
96. Ramsay SE, Whincup PH, Lawlor DA, Papacosta O, Lennon LT, Thomas MC et al. Secondary prevention of coronary heart disease in older patients after the national service framework: population based study. British Medical Journal 2006; 332(7534):144-145.
97. Reid GS, Robertson AJ, Bissett C, Smith J, Waugh N, Halkerston R. Cervical Screening in Perth and Kinross Since Introduction of the New Contract. British Medical Journal 1991; 303(6800):447-450.
98. Reiter KL, Nahra TA, Alexander JA, Wheeler JR. Hospital responses to pay-for-performance incentives. Health Serv Manage Res 2006; 19(2):123-134.
99. Reschovsky JD, Hadley J, Landon BE. Effects of compensation methods and physician group structure on physicians' perceived incentives to alter services to patients. Health Services Research 2006; 41(4):1200-1220.
100. Ritchie LD, Bisset AF, Russell D, Leslie V, Thomson I. Primary and Preschool Immunization in Grampian - Progress and the 1990 Contract. British Medical Journal 1992; 304(6830):816-819.
101. Rittenhouse DR, Robinson JC. Improving quality in Medicaid - The use of care management processes for chronic illness and preventive care. Medical Care 2006; 44(1):47-54.
102. Rodriguez HP, Von Glahn T, Rogers WH, Safran DG. Organizational and market influences on physician performance on patient experience measures. Health Services Research 2009; 44(3):880-901.
103. Roland, M. (2006, September). Pay-for-performance: Too much of a good thing? A conversation with Martin Roland. Interview by Robert Galvin. Health Affairs, Web Exclusive, 25(5), w412-419.
104. Rosenthal MB, de Brantes FS, Sinaiko AD, Frankel M, Robbins RD, Young S. Bridges to Excellence - Recognizing High-Quality Care: Analysis of Physician Quality and Resource Use. Am J Managed Care 2008; 14(10):670-677.
105. Rosenthal MB, Fernandopulle R, Song HR, Landon B: Paying for quality: providers’ incentives for quality improvement. Health Affairs (Millwood) 2004, 23(2):127-141.
106. Ryan, A. M. and J. Blustein (2011). "The effect of the MassHealth hospital pay-for-performance program on quality." Health Serv Res 46(3): 712-728.
107. Safran DG, Rogers WH, Tarlov AR, Inui T, Taira DA, Montgomery JE et al. Organizational and financial characteristics of health plans - Are they related to primary care performance? Archives of Internal Medicine 2000; 160(1):69-76.
108. Saunders M, Schattner P, Mathews M: Diabetes ‘cycles of care’ in general practice - do government incentives help? Australian Family Physician 2008, 37(9):781-784.
109. Saxena S, Car J, Eldred D, Soljak M, Majeed A. Practice size, caseload, deprivation and quality of care of patients with coronary heart disease, hypertension and stroke in primary care: national cross-sectional study. Bmc Health Services Research 2007; 7.
110. Schmittdiel J, McMenamin SB, Halpin HA, Gillies RR, Bodenheimer T, Shortell SM et al. The use of patient and physician reminders for preventive services: results from a National Study of Physician Organizations. Preventive Medicine 2004; 39(5):1000-1006.
111. Scott, I. A. (2007). Pay for performance in health care: Strategic issues for Australian experiments. Medical Journal of Australia, 187, 31-35.
112. Shenkman E, Tian LL, Nackashi J, Schatz D. Managed care organization characteristics and outpatient specialty care use among children with chronic illness. Pediatrics 2005; 115(6):1547-1554.
48

113. Shohet C, Yelloly J, Bingham P, Lyratzopoulos G. The association between the quality of epilepsy management in primary care, general practice population deprivation status and epilepsy-related emergency hospitalisations. Seizure-European Journal of Epilepsy 2007; 16(4):351-355.
114. Shortell SM, Zazzali JL, Burns LR, Alexander JA, Gillies RR, Budetti PP et al. Implementing evidence-based medicine - The role of market pressures, compensation incentives, and culture in physician organizations. Medical Care 2001; 39(7):I62-I78.
115. Sigfrid LA, Turner C, Crook D, Ray S. Using the UK primary care Quality and Outcomes Framework to audit health care equity: preliminary data on diabetes management. Journal of Public Health 2006; 28(3):221-225.
116. Simon JS, Rundall TG, Shortell SM. Adoption of order entry with decision support for chronic care by physician organizations. Journal of the American Medical Informatics Association 2007; 14(4):432-439.
117. Simpson CR, Hannaford PC, McGovern M, Taylor MW, Green PN, Lefevre K et al. Are different groups of patients with stroke more likely to be excluded from the new UK general medical services contract? A cross-sectional retrospective analysis of a large primary care population. Bmc Family Practice 2007; 8.
118. Smith AL. Merging P4P and disease management: How do you know which one is working? Journal of Managed Care Pharmacy 2007; 13(2):S7-S10.
119. Smith CJ, Gribbin J, Challen KB, Hubbard RB. The impact of the 2004 NICE guideline and 2003 General Medical Services contract on COPD in primary care in the UK. QJM. 2008;101(2):145-153.
120. Soeters R., Habineza C., Peerenboom B.(2006), "Performance-based financing and changing the district health system: experience from Rwanda", Bulletin of the World Health Organization 2006;84:884-889.
121. Soeters, R. Musango, L.Meessen, B. (2005) Comparison of two output based schemes in Butare and Cyangugu provinces with two control provinces in Rwanda
122. Soeters, R. Perrot, J. Lozitto, A. (2006). Purchasing healthcare packages for the poor thorugh performance based contracting; which changes in the district health system does it require?
123. Soeters, R.. Griffiths, F. (2003). Improving government health services through contract management; a case from Cambodia. Health Policy and Planning. V 18; 74-83.
124. Sperl-Hillen JM, O'Connor PJ. Factors driving diabetes care improvement in a large medical group: Ten years of progress. Am J Managed Care 2005; 11(5):S177-S185.
125. Steel N, Bachmann M, Maisey S, Shekelle P, Breeze E, Marmot M et al. Self reported receipt of care consistent with 32 quality indicators: national population survey of adults aged 50 or more in England. British Medical Journal 2008; 337(7667).
126. Stevens VJ, Solberg LI, Quinn VP, et al. Relationship between tobacco control policies and the delivery of smoking cessation services in nonprofit HMOs. J Natl Cancer Inst Monogr 2005;35:75e80.
127. Strong M, Maheswaran R, Radford J. Socioeconomic deprivation, coronary heart disease prevalence and quality of care: a practice-level analysis in Rotherham using data from the new UK general practitioner Quality and Outcomes Framework. Journal of Public Health 2006; 28(1):39-42.
128. Sutton, M., R. Elder, et al. (2010). "Record rewards: the effects of targeted quality incentives on the recording of risk factors by primary care providers." Health Econ 19(1): 1-13.
129. Sutton M, McLean G. Determinants of primary medical care quality measured under the new UK contract: cross sectional study. British Medical Journal 2006; 332(7538):389-390.
130. Tahrani AA, McCarthy M, Godson J, et al. Impact of practice size on delivery of diabetes care before and after the Quality and Outcomes Framework implementation. Br J Gen Pract. 2008;58(553):576-579.
131. Trisolini M, Aggarwal J, Leung M, Pope GC, Kautter J: The Medicare Physician Group Practice Demonstration: lessons learned on improving quality and efficiency in healthcare. The Commonwealth Fund; 2008.
132. Trisolini M, Pope G, Kautter J, Aggarwal J. Medicare physician group practices: innovations in quality and efficiency. 971. 2006. The Commonwealth Fund. Ref Type: Report
133. Tsimtsiou Z, Ashworth M, Jones R. Variations in anxiolytic and hypnotic prescribing by GPs: a cross-sectional analysis using data from the UK Quality and Outcomes Framework. Br J Gen Pract. 2009;59(563):e191-e198.
134. Vamos EP, Pape UJ, Bottle A, Hamilton FL, Curcin V, Ng A, et al. Association of practice size and pay-for-performance incentives with the quality of diabetes management in primary care. CMAJ. 2011;183:E809-16. [PMID: 21810950]
135. Arpana R. Vidyarthi, MD, Adrienne L. Green, MD, Glenn Rosenbluth, and Robert B. Baron (2014), Engaging Residents and Fellows to Improve Institution-Wide Quality: The First Six Years of a Novel Financial Incentive Program, Acad Med, 89, 460-8.
136. Vina ER, Rhew DC, Weingarten SR, Weingarten JB, Chang JT. Relationship between organizational factors and performance among pay-for-performance hospitals. J Gen Intern Med 2009; 24(7):833-840.
137. Wang YY, O'Donnell CA, Mackay DF, Watt GCM. Practice size and quality attainment under the new GMS contract: a cross-sectional analysis. British Journal of General Practice 2006; 56(532):830-835.
138. Weber V, Bloom F, Pierdon S, Wood C. Employing the electronic health record to improve diabetes care: A multifaceted intervention in an integrated delivery system. Journal of General Internal Medicine 2008; 23(4):379-382.
139. Werner, R. M., Skira, M. and Konetzka, R. T. (2016), An Evaluation of Performance Thresholds in Nursing Home Pay-for-Performance. Health Services Research. doi: 10.1111/1475-6773.12467
140. Whalley D, Bojke C, Gravelle H, Sibbald B. GP job satisfaction in view of contract reform: a national survey. Br J Gen Pract 2006; 56(523):87-92.
141. Whalley D, Gravelle H, Sibbald B. Effect of the new contract on GPs’ working lives and perceptions of quality of care: a longitudinal survey. Br J Gen Pract. 2008;58(546):8-14.
142. Wickizer TM, Franklin G, Gluck JV, Fulton-Kehoe D. Improving quality through identifying inappropriate care: THe use of guideline-based utilization review protocols in the Washington state workers' compensation system. Journal of Occupational and Environmental Medicine 2004; 46(3):198-204.
143. Wilkinson E, Randhawa G, Roderick P. Quality and Outcomes Framework (QOF) improves scope for effective management of Type Indo-Asian patients with diabetes who are ten years younger at diagnosis than White European patients. Diabet Med. 2010:27(S1):104.
144. Williams PH, de Lusignan S. Does a higher ‘quality points’ score mean better care in stroke? An audit of general practice medical records. Inform Prim Care. 2006;14(1):29-40.
145. Wilson, R. (2006, November). Primary care renewal in Ontario—Focus on remuneration. Paper presented at the College of Family Physicians of Canada, Primary Care Forum, Ontario, Canada.
146. Woodson SB. Making the connection between physician performance and pay. Healthc Financ Manage 1999; 53(2):39-42, 44.147. Wright J, Martin D, Cockings S, Polack C. Overall Quality of Outcomes Framework scores lower in practices in deprived areas. British
Journal of General Practice 2006; 56(525):277-279.
No access to full article 1. Amundson, G., Solberg, L. I., Reed, M., Martini, E. M., & Carlson, R. (2003). Paying for quality improvement: Compliance with
tobacco cessation guidelines. Joint Commission Journal on Quality & Safety, 29, 59-65.2. Benavent J, Juan C, Clos J, Sequeira E, Gimferrer N, Vilaseca J. Using pay-for-performance to introduce changes in primary healthcare
centres in Spain: first year results. Qual Prim Care 2009; 17(2):123-131.
49

3. Berenbeim D: The medical group pay-for-performance initiative in California and diabetes care. Managed Care Interface 2003, Suppl C:3-4.
4. Berthiaume, J. T., Chung, R. S., Ryskina, K. L., Walsh, J., & Legoratta, A. (2006). Aligning financial incentives with quality of care in the hospital setting. Journal for Health Care Quality, 28, 36-50
5. Cameron PA, Kennedy MP, Mcneil JJ. The effects of bonus payments on emergency service performance in Victoria. Medical Journal of Australia 1999; 171(5):243-246.
6. Chung RS, Chernicoff HO, Nakao KA, Nickel RC, Legorreta AP. A quality-driven physician compensation model: four-year follow-up study. J Healthc Qual 2003; 25(6):31-37.
7. Fachklinik Herzogenaurach. (2010). Qualitätsbericht rehabilitation [Quality report rehabilitation] 2009. Hopfen am See, Germany: m&i-Klinikgruppe Enzensberg.
8. Hopkins JR. Financial incentives for ambulatory care performance improvement. Jt Comm J Qual Improv 1999; 25(5):223-238.9. Pedros C, Vallano A, Cereza G, Mendoza-Aran G, Agusti A, Aguilera C et al. An intervention to improve spontaneous adverse drug
reaction reporting by hospital physicians: a time series analysis in Spain. Drug Saf 2009; 32(1):77-83.10. Price Waterhouse Coopers. (2001). Evaluation of primary care reform pilots in Ontario phase 2 interim report. Toronto, Ontario,
Canada: Ontario Ministry of Health and Long-Term Care.11. Rubinstein A, Rubinstein F, Botargues M, Barani M, Kopitowski K. A multimodal strategy based on pay-per-performance to improve
quality of care of family practitioners in Argentina. J Ambul Care Manage 2009; 32(2):103-114.12. Ting HH, Galvin RS, Krumholz HM, Petersen LA, Block PC. Do economic incentives improve quality of health care? Implications for
pay-for-performance. ACC Cardiosource Review Journal 16[7], 22-25. 2007. Ref Type: Journal (Full)13. Walle, E. (2009). ERGOV: Ergebnisorientierte Vergütung in der neurologischen Rehabilitation [Pay for performance in neurological
rehabilitation]. Hopfen am See, Germany: m&iKlinikgruppe Enzensberg
Reason for exclusion: Descriptive studies 1. Ahmann AJ: Guidelines and performance measures for diabetes. merican Journal of Managed Care 2007, 13 Suppl 2:S41-46.2. Aligning incentives to promote quality care: lessons from pay-for-performance initiatives. Qual Lett Healthc Lead 2005; 17(12):2-7,
1.3. Anonymous: Aligning incentives in bridges to excellence. Managed Care Interface 2004, , Suppl: 5-6, 13.4. Anonymous: CA health plans collaborate in ‘pay for performance’ program to boost chronic care management. Disease Management
Advisor 2002, 8(4):54-58, 49.5. Australian National Audit Office. (2010). Practice incentives program (Audit Report No. 5 2010-11). Canberra: Commonwealth of
Australia.6. BlueCross BlueShield Association: The Performance Based Incentive Program (PBIP): A Model for Quality Improvement and Cost.
[http://www. bcbs.com/innovations/], Retrieved 28 February 2011 from.7. Buetow, S. (2008). Pay-for-performance in New Zealand primary health care. Journal of Health Organization and Management, 22,
36-47.8. Damberg CL, Raube K, Williams T, Shortell SM: Paying for performance: implementing a statewide project in California. Quality
Management in Health Care 2005, 14(2):66-79.9. District Health Boards New Zealand. PHO performance programme. Retrieved from www.dhbnz.org.nz/Site/SIG/pho/Default.aspx10. Duckett, S., Daniels, S., Kamp, M., Stockwell, A., Walker, G., & Ward, M. (2008). Pay for performance in Australia: Queensland’s
new clinical practice improvement payment. Journal of Health Services Research & Policy, 13, 174-177. 11. Frohlich, N., Katz, A., De Coster, C., Dik, N., Soodeen, R.-A., Watson, D., & Bogdanovic, B. (2006, August). Profiling primary care
physician practice in Manitoba. Winnipeg, Canada: Manitoba Centre for Health Policy.12. Greb S, Focke A, Hessel F, Wasem J: Financial incentives for disease management programmes and integrated care in German social
health insurance. Health Policy 2006, 78(2-3):295-305.13. Greene RA, Beckman H, Chamberlain J, Partridge G, Miller M, Burden D et al. Increasing adherence to a community-based
guideline for acute sinusitis through education, physician profiling, and financial incentives. Am J Managed Care 2004; 10(10):670-678.
14. Griffiths, F. Soeters, R. (2004) Improving workers performance through contract management, a case of Cambodia. 15. Health Care Incentives Improvement Institute: Bridges to Excellence.[http:// www.bridgestoexcellence.org/], Retrieved 28 February
2011 16. Health Net International: (2006) Guidelines for Implementing PBF in Afghanistan. 17. Integrated Healthcare Association: Integrated Healthcare Association (IHA), Pay for Performance (P4P) Program. Overview.
[http://www.iha.org/ pdfs_documents/p4p_california/P4PFactSheet_July2010.pdf], Retrieved 28 February 2011 from.18. Integrated Healthcare Association: Integrated Healthcare Association Pay for Performance (P4P) Program, Program
Results.[http://www.iha.org/ program_results.html], Retrieved 28 February 2011 from.19. Integrated Healthcare Association: Integrated Healthcare Association Pay for Performance (P4P) Program,
Awards.[http://www.iha.org/p4p_awards. html], Retrieved 28 February 2011 from.20. Jaiveer PK, Jaiveer S, Jujjavarapu SB, et al. Improvements in clinical diabetes care in the first year of the new General Medical
Services contract in the UK. Brit J Diabetes Vasc Dis. 2006;6(1):45-48.21. Kautter J, Pope GC, Trisolini M, Grund S. Medicare Physician Group Practice demonstration design: Quality and efficiency pay-for-
performance. Health Care Financing Review 2007; 29(1):15-29.22. Kirschner, K., Braspenning, J., Batenburg, J., van de Rijt, D., Muijrers, P., van Everdingen, C., Grol, R. (2008, March). Value for
money: Een model voor honoreren van kwaliteit in de huisartsenpraktijk. project transparantie huisartsenzorg (fase 2) [Value for money: a pay-for-performance program in general practice. Project transparency in general practice (phase 2)]. Nijmegen, Netherlands: Scientific Institute for Quality of Healthcare.
23. Kirschner, K., Braspenning, J., Gootzen, T., van Everdingen, C., Batenburg, J., Verstappen, W., Grol, R. (2009, April). Pay-for-performance in de huisartsenpraktijk [Pay-for-performance in general practice – an experiment in the Southern part of the Netherlands]. Een experiment in Zuid-Nederland. Nijmegen, Netherlands: Scientific Institute for Quality of Healthcare
24. Manitoba Health. (2007). Physician integrated network: Evaluation plan. Winnipeg, Manitoba, Canada: Author.25. Manitoba Health. (2010). PIN information management guide version 1.5. Winnipeg, Manitoba, Canada: Author.26. Manitoba Health. (n.d.). Physician integrated network (PIN). Retrieved from http://www.gov.mb.ca/health/phc/pin/index.html27. Medicare Australia. (2011). Practice incentives program. Retrieved from
http://www.medicareaustralia.gov.au/provider/incentives/pip/index.jsp28. Nalli GA, Scanlon DP, Libby D. Developing a performance-based incentive program for hospitals: a case study from Maine. Health
Aff (Millwood ) 2007; 26(3):817-824.29. New Zealand Ministry of Health. (2010). Primary health care. Retrieved from http://www.health.govt.nz/our-work/primary-health-
care30. NHS North West. (2008, November). A North West health system approach to advancing quality. Manchester, England: NHS North
West.(not an evalutation)
50

31. NHS North West. (n.d.). Advancing quality. Retrieved from http://www.advancingqualitynw.nhs.uk32. Premier, Inc. (2010). NHS Northwest and premier advancing quality program. Composite quality score and outcome methodologies
year one. Charlotte, NC: Author33. Roland, M. (2004). Linking physicians’ pay to the quality of care—A major experiment in the United Kingdom. New England
Journal of Medicine, 351, 1448-1454.34. Rosenthal MB, Camillus J. How four purchasers designed and implemented quality-based purchasing activities. 2007. Agency for
Healthcare Research and Quality. Ref Type: Report35. Sutton M, Elder R, Guthrie B, et al. Record rewards: the effects of targeted quality incentives on the recording of risk factors by
primary care providers. Health Econ 2010;19:1e13. Not extracted yet36. The Health and Social Care Information Centre. (2009). General and Personal Medical Services in England: 1998-2008. London,
England: Author.37. Ward, M., Daniels, S. A., Walker, G. J., & Duckett, S. (2007). Connecting funds with quality outcomes in health care: A blueprint for
a clinical practice improvement payment. Australian Health Review, 31(Suppl. 1), S54-S5838. West, D. (2008, November 27). Advancing quality in the North West. Health Service Journal. Retrieved from
http://www.hsj.co.uk/advancing-quality-in-the-north-west/1931028.article
Reason for exclusion: Evaluations of P4P targeted at patients 1. Clark RE, Drake RE, McHugo GJ, Ackerson TH. Incentives for community treatment. Mental illness management services. Med
Care. 1995;33:729-38. [PMID: 7596211]2. Boyle RG, Solberg LI, Magnan S, Davidson G, Alesci NL.Does insurance coverage for drug therapy affect smoking cessation?.
Health Affairs (Project Hope) 2002;21:162–8.3. Dey P, Foy R, Woodman M, Fullard B, Gibbs A. Should smoking cessation cost a packet? A pilot randomized controlled trial of
the cost-effectiveness of distributing nicotine therapy free of charge. British Journal of General Practice 1999;49:127–8.4. Curry SJ, Grothaus LC, McAfee T, Pabiniak C. Use and cost effectiveness of smoking-cessation services under four insurance
plans in a health maintenance organization. New England Journal of Medicine 1998;339(10):673–9.5. Halpin HA, McMenamin SB, Rideout J, Boyce-Smith G. The costs and effectiveness of different benefit designs for treating
tobacco dependence: results from a randomized trial. Inquiry 2006;43:54–65.6. Healy J, Sharman E, Lokuge B. Australia: Health system review. Health Systems in 7. Hughes JR, Wadland WC, Fenwick JW, Lewis J, Bickel WK. Effect of cost on the self-administration and efficacy of nicotine
gum: a preliminary study. Preventive Medicine 1991;20:486–96.8. Kaper J, Wagena EJ, van Schayck CP, Severens JL.Encouraging smokers to quit: the cost effectiveness of reimbursing the costs of
smoking cessation treatment. Pharmacoeconomics 2006;24:453–64.9. Kaper J, Wagena EJ, Willemsen MC, van Schayck CP. A randomized controlled trial to assess the effects of reimbursing the costs
of smoking cessation therapy on sustained abstinence. Addiction 2006;101:1656–61.10. Kaper J, Wagena EJ, Willemsen MC, van Schayck CP. Reimbursement for smoking cessation treatment may double the abstinence
rate: results of a randomized trial. Addiction 2005;100:1012–20.11. Schauffler HH, McMenamin S, Olson K, Boyce Smith G, Rideout JA, Kamil J. Variations in treatment benefits influence smoking
cessation: results of a randomised controlled trial. Tobacco Control 2001;10:175–80.12. Bond L, Davie G, Carlin JB, Lester R, Nolan T. Increases in vaccination coverage for children in child care, 1997 to 2000: an
evaluation of the impact of government incentives and initiatives. Australian and New Zealand Journal of Public Health 2002; 26(1):58-64.
13. Powell-Jackson T, Mazumdar S, Mills A, (2015). Financial incentives in health: New evidence from India's Janani Suraksha Yojana, Journal of Health Economics, Volume 43, Pages 154-169, ISSN 0167-6296
Reason for exclusion: Poor /unclear reporting of outcomes1. Balicer, R. D., Shadmi, E., Lieberman, N., Greenberg-Dotan, S., Goldfracht, M., Jana, L., Jacobson, O. (2011). Reducing health
disparities: Strategy planning and implementation in Israel’s largest health care organization. Health Services Research, 46, 1281-1299 2. Bishop, T. F., A. D. Federman, et al. (2012). "Association between physician quality improvement incentives and ambulatory quality
measures." Am J Manag Care 18(4): e126-134.3. Quy H, Lan N, Lonnroth K, Buu T, Dieu T, Hai T. Publicprivate mix for improved TB control in Ho Chi Minh City,Vietnam: an
assessment of its impact on case detection. International Journal for Tuberculosis and Lung Disease 2003; 7:464–71.4.Foels T, Hewner S. Integrating pay for performance with educational strategies to improve diabetes care. Popul Health Manag 2009;
12(3):121-129. Poor reporting: no information whatsoever on the incentive5. Robinson JC, Casalino LP, Gillies RR, Rittenhouse DR, Shortell SS, Fernandes-Taylor S. Financial incentives, quality improvement
programs, and the adoption of clinical information technology. Med Care 2009; 47(4):411-417.6.Williams TR, Raube K, Damberg CL, Mardon RE. Pay for performance: its influence on the use of IT in physician organizations. J Med Pract
Manage 2006; 21(5):301-306. Poor reporting 7.Chen, J. Y., H. Tian, et al. (2011). "Does pay for performance improve cardiovascular care in a "real-world" setting?" Am J Med Qual 26(5):
340-348.8.Joseph, S. B., M. J. Sow, et al. (2013). "E-prescribing adoption and use increased substantially following the start of a federal incentive
program." Health Aff 32(7): 1221-1227.9.Kiran, T., J. C. Victor, et al. (2012). "The relationship between financial incentives and quality of diabetes care in Ontario, Canada." Diabetes
Care 35(5): 1038-1046.10. Pinnarelli, L., S. Nuti, et al. (2012). "What drives hospital performance? The impact of comparative outcome evaluation of patients
admitted for hip fracture in two Italian regions." BMJ Qual Saf 21(2): 127-134.11. Rodrigues, R., L. Trigg, et al. (2014). "The public gets what the public wants: Experiences of public reporting in long-term care in
Europe." Health Policy 116(1): 84-94.12. Sanada, H., G. Nakagami, et al. (2010). "Evaluating the effect of the new incentive system for high-risk pressure ulcer patients on wound
healing and cost-effectiveness: a cohort study." Int J Nurs Stud 47(3): 279-286.
Reason for exclusion: Qualitative studies 1. Aryankhesal, A., T. A. Sheldon, et al. (2013). "Role of pay-for-performance in a hospital performance measurement system: a
multiple case study in Iran." Health Policy Plan 28(2): 206-214.2. Coleman, T. (2010). "Do financial incentives for delivering health promotion counselling work? Analysis of smoking cessation
activities stimulated by the quality and outcomes framework." BMC Public Health 10(167): 1471-2458.3. Gerdes, N., Funke, U. N., Schuwer, U., Kunze, H., Walle, E., Kleinfeld, A., Jäckel, W. H. (2009). Ergebnisorientierte vergutung der
rehabilitation nach schlaganfall. Entwicklungsschritte eines modellprojekts 2001-2008 [Pay for performance in rehabilitation after stroke–results of a pilot project 2001-2008]. Die Rehabilitation, 48, 190-201.
51

4. Gerdes, N., Funke, U., Schuwer, U., Themann, P., Kunze, H., Walle, E., von Ameln, M. (2008). Ergebnis-orientierte vergütung der rehabilitation nach schlaganfall. ergebnisse aus einem modellprojekt [Pay for performance in rehabilitation after stroke-findings from a pilot project]. Retrieved from http://forschung.deutsche-rentenversicherung.de/ForschPortalWeb/ressource?key=05_Gerdes.pdf found
5. Happell, B., C. Palmer, et al. (2010). "Mental Health Nurse Incentive Program: contributing to positive client outcomes." Int J Ment Health Nurs 19(5): 331-339.
6. Hochrhein-Institut. (n.d.). Ergebnisorientierte vergütung der rehabilitation nach schlaganfall (ERGOV) [Pay for performance in rehabilitation after stroke (ERGOV)]. Bad Säckingen, Germany: Hochrhein-Institut für Rehabilitationsforschung. Retrieved from http://www.hri.de/index.php?menuid=0&reporeid=59
7. Plever, S., I. McCarthy, et al. (2012). "Clinical Practice Improvement Payments: incentives for delivery of quality care." Australas Psychiatry 20(5): 407-412.
8. Schlingensiepen, I. (2009, July 23). Gute Reha-Ergebnisse, da gibt einen Bonus [Good outcomes for rehabilitation results in a bonus]. Ärzte Zeitung. Retrieved from http://www.aerztezeitung.de/politik_gesellschaft/krankenkassen/article/559098/gute-reha-ergebnisse-gibts-bonus.html
9. Steel N, Maisey S, Clark A, Fleetcroft R, Howe A. (2007). Quality of clinical primary care and targeted incentive payments: an observational study. Br J Gen Pract; 57(539):449-454.
52

Supplementary file S11 Characteristics of included studies
Recipient of incentive Size of incentive Risk Evaluation design Type
Individuals
Groups Small Medium Large Low High No control
Quasi-experimental
RCT A B C
Outcomes with statistically significant positive effect (N=190) n (%)
33 (17.3)
156 (81.7) 29 (16) 43 (23.8) 109 (60.2)
147 (78.2)
41 (21.8)
93 (48.9) 86 (45.3)
11 (5.8) 102 (57.3)
49 (27.5) 27 (15.2)
Other outcomes (N=80) no statistically
significant effect statistically significant
negative effect negative effect
n (%)
12 (15)
68 (85) 21 (27) 12 (15.4) 45 (57.6) 79 (75.2) 26 (24.8)
5 (6.3) 62 (77.5)
13 (16.2) 37 (47.5) 26 (33.3) 15 (19.2)
Total number of outcomes (270)n (%)
45 (16.7)
224 (83.3) 50 (19.3) 55 (21.2) 154 (59.5)
226 (77.1)
67 (22.9) 98 (36.3) 148 (55.2)
24 (8.5) 139 (54.8)
75 (29) 42 (16.2)
*type A-schemes with high chance of success, type B-schemes with medium chance of success, type C- schemes with low chance of success *number of studies= 96
53
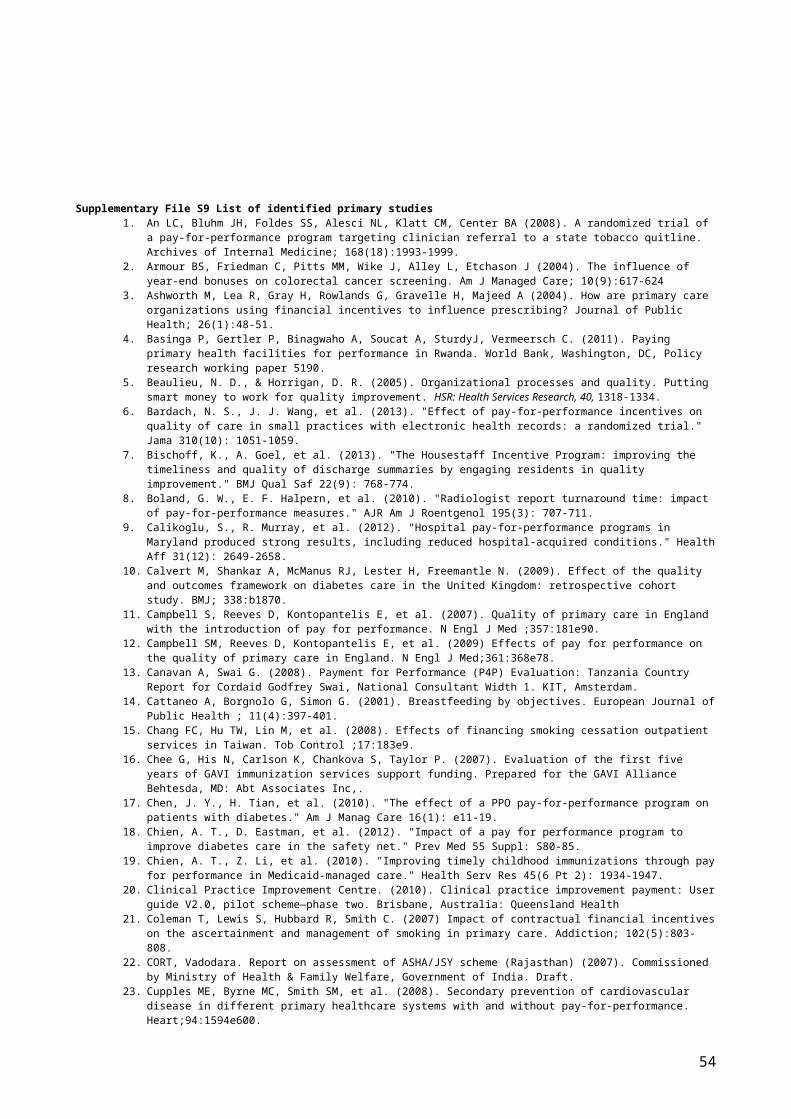
Supplementary file S12 List of included studies in the meta- analyses
1. Kouides RW, Bennett NM, Lewis B, et al. Performance-based physician reimbursement and influenza immunization rates in the elderly. American Journal of Preventive Medicine 1998; 14(2): 89-95.
2. An LC, Bluhm JH, Foldes SS, et al. A randomized trial of a pay-for-performance program targeting clinician referral to a state tobacco quitline. Arch Intern Med 2008; 168(18): 1993-9.
3. Basinga P, Gertler PJ, Binagwaho A, Soucat ALB, Sturdy J, Vermeersch CMJ. Effect on maternal and child health services in Rwanda of payment to primary health-care providers for performance: an impact evaluation. The Lancet 2011; 377(9775): 1421-8.
4. Salize HJ, Merkel S, Reinhard I, Twardella D, Mann K, Brenner H. Cost-effective primary care-based strategies to improve smoking cessation: more value for money. Arch Intern Med 2009; 169(3): 230-5.
5. Twardella D, Brenner H. Effects of practitioner education, practitioner payment and reimbursement of patients' drug costs on smoking cessation in primary care: a cluster randomised trial. Tob Control 2007; 16(1): 15-21.
6. Bardach NS, Wang JJ, De Leon SF, et al. Effect of pay-for-performance incentives on quality of care in small practices with electronic health records: a randomized trial. Jama 2013; 310(10): 1051-9.
7. Glickman SW, Ou FS, DeLong ER, et al. Pay for performance, quality of care, and outcomes in acute myocardial infarction. Jama 2007; 297(21): 2373-80.
8. Cutler TW, Palmieri J, Khalsa M, Stebbins M. Evaluation of the relationship between a chronic disease care management program and california pay-for-performance diabetes care cholesterol measures in one medical group. J Manag Care Pharm 2007; 13(7): 578-88.
9. Rosenthal MB, Frank RG, Li Z, Epstein AM. Early experience with payfor- performance: From concept to practice. JAMA 2005; 294(14): 1788–93.
10. Lee TT, Cheng SH, Chen CC, Lai MS. A pay-for-performance program for diabetes care in Taiwan: a preliminary assessment. Am J Manag Care 2010; 16(1): 65-9.
11. Campbell SM, Reeves D, Kontopantelis E, Sibbald B, Roland M. Effects of Pay for Performance on the Quality of Primary Care in England. New England Journal of Medicine 2009; 361(4): 368-78.
12. Sutton M, Nikolova S, Boaden R, Lester H, McDonald R, Roland M. Reduced mortality with hospital pay for performance in England. The New England journal of medicine 2012; 367(19): 1821-8.
13. Jha AK, Joynt KE, Orav EJ, Epstein AM. The Long-Term Effect of Premier Pay for Performance on Patient Outcomes. New England Journal of Medicine 2012; 366(17): 1606-15.
14. Lindenauer PK, Remus D, Roman S, et al. Public reporting and pay for performance in hospital quality improvement. The New England journal of medicine 2007; 356(5): 486-96.
15. Kontopantelis E, Reeves D, Valderas JM, Campbell S, Doran T. Recorded quality of primary care for patients with diabetes in England before and after the introduction of a financial incentive scheme: a longitudinal observational study. BMJ Quality & Safety 2012.
16. Cupples ME, Byrne MC, Smith SM. Secondary prevention of cardiovascular disease in different primary healthcare systems with and without pay-forperformance. Heart 2008; 94(1594).
17. Kuo RN, Chung KP, Lai MS. Effect of the pay-for-performance program for breast cancer care in Taiwan. Am J Manag Care 2011; 17(5 Spec No): e203-11.
18. Li YH, Tsai WC, Khan M, et al. The effects of pay-for-performance on tuberculosis treatment in Taiwan. Health policy and planning 2010; 25(4): 334-41.
19. Gilmore AS, Zhao Y, Kang N, et al. Patient outcomes and evidence-based medicine in a preferred provider organization setting: a six-year evaluation of a physician pay-for-performance program. Health services research 2007; 42(6 Pt 1): 2140-59.
20. Chien AT, Li Z, Rosenthal MB. Improving timely childhood immunizations through pay for performance in Medicaid-managed care. Health services research 2010; 45(6 Pt 2): 1934-47.
21. McMenamin SB, Schauffler HH, Shortell SM. Support for smoking cessation interventions in physician organizations: results from a national study. Med Care 2003; 41(1): 396-406.
22. Kruse GR, Chang Y, Kelley JH, Linder JA, Einbinder JS, Rigotti NA. Healthcare system effects of pay-for-performance for smoking status documentation. Am J Manag Care 2013; 19(7): 554-61.
23. Chen JY, Tian H, Taira Juarez D, et al. The effect of a PPO pay-for-performance program on patients with diabetes. Am J Manag Care 2010; 16(1): e11-9.
24. Gavagan TF, Du H, Saver BG, et al. Effect of Financial Incentives on Improvement in Medical Quality Indicators for Primary Care. J Am Board Fam Med 2010; 23: 622– 31.
25. Tsai WC, Kung PT, Khan M, et al. Effects of pay-for-performance system on tuberculosis default cases control and treatment in Taiwan. J Infect 2010; 61(3): 235-43.
26. Doran T, Kontopantelis E, Valderas JM, et al. Effect of financial incentives on incentivised and non-incentivised clinical activities: longitudinal analysis of data from the UK Quality and Outcomes Framework; 2011.
27. St Jacques PJ, Patel N, Higgins MS. Improving anesthesiologist performance through profiling and incentives. J Clin Anesth 2004; 16(7): 523-8.
54

28. Bischoff K, Goel A, Hollander H, Ranji SR, Mourad M. The Housestaff Incentive Program: improving the timeliness and quality of discharge summaries by engaging residents in quality improvement. BMJ Qual Saf 2013; 22(9): 768-74.
29. Chang FC, Hu TW, Lin M, Yu PT, Chao KY. Effects of financing smoking cessation outpatient services in Taiwan. Tob Control 2008; 17(3): 183-9.
30. Coleman T, Lewis S, Hubbard R, Smith C. Impact of contractual financial incentives on the ascertainment and management of smoking in primary care. Addiction 2007; 102(5): 803-8.
31. Calvert M, Shankar A, McManus RJ, Lester H, Freemantle N. Effect of the quality and outcomes framework on diabetes care in the United Kingdom: retrospective cohort study. BMJ 2009; 338.
32. Larsen DL, Cannon W, Towner S. Longitudinal assessment of a diabetes care management system in an integrated health network. J Manag Care Pharm 2003; 9(6): 552-8.
33. Simpson CR, Hannaford PC, Ritchie LD, Sheikh A, Williams D. Impact of the pay-for-performance contract and the management of hypertension in Scottish primary care: a 6-year population-based repeated cross-sectional study. Br J Gen Pract 2011; 61(588).
34. Simpson CR, Hippisley-Cox J, Sheikh A. Trends in the epidemiology of smoking recorded in UK general practice. Br J Gen Pract 2010; 60: 121-7.
35. Vaghela P, Ashworth M, Schofield P, Gulliford MC. Population intermediate outcomes of diabetes under pay for performance incentives in England from 2004 to 2008. Diabetes Care 2008.
36. Srirangalingam U, Sahathevan SK, Lasker SS, Chowdhury TA. Changing pattern of referral to a diabetes clinic following implementation of the new UK GP contract. British Journal of General Practice 2006; 56(529): 624-6.
37. Fagan PJ, Schuster AB, Boyd C, Marsteller JA, Griswold M, Murphy SM. Chronic care improvement in primary care: evaluation of an integrated pay-for-performance and practice-based care coordination program among elderly patients with diabetes. Health services research 2010; 45: 1763-82.
55

Supplementary file S13 Extraction of additional data for studies included in meta-analyses
Program Study Effect type Outcome InterventionData
ControlData
Reported effect size
LCI UCI d Standardized mean difference)
Vd
Standardized variance)SEd
Standardized standard error
Kouides et al 1998
Kouides et al 1998
% Change Immunization rates in the elderly
The mean immunization rate was 68.6% (SD 16.6%)N=53
62.7% (SD 18.0%) in the control group practices (P = .22).N=82
0.197
0.243
An et al., 2008 An et al., 2008
%Change Smoking cessation referral rates
11.4% (95% CI, 8.0%-14.9%)N=25
4.2% (95% CI, 1.5%-6.9%)N=24
0.059
0.089
Premier program
Glikman et al., 2007
Odds ratio CMS composite measure
0.91(95% CI 0.84-0.99)N=54
0.97(95% CI 0.94-0.99)N=446
-0.015
0.022
California P4P Cutler et al., 2007
% Change Diabetes care ldl test
72.8%N=165
55.7%N=1694
0.180
0.100
Rosenthal et al., 2005
Mean difference
Cervical screening N=300 3.6 0.115
0.003 0.058
Mammography 1.7 0.065
0.003r estimated at 0.5
Vd= 0.001
0.058
SEd
=0.032St Jacques, et al, 2004
St Jacques, et al, 2004
% change percentage of first cases of the day in the room at or before the scheduled in-room time
61 ± 19%, (SD)±6.5% (CI)N-1439
19 ± 15% (SD)±4.5% (CI)N= 1261
0.454
0.002 0.049
percentage of cases with an anesthesia prep time less than a target
73 ± 14% (SD)±5.1% (CI)N-1439
57 ± 18% (SD)±5.3% (CI)N= 1261
0.171
0.002 0.045
percentage of cases delayed due to waiting for an anesthesiology
3 ± 3% (SD)±1% (CI)N-1439
14 ± 9%% (SD)±2.9% (CI)N= 1261
0.399
Dtot
0.009
r= 0.75Vd total =0.0008
0.096
SE d=0.029
56

Program Study Effect type Outcome InterventionData
ControlData
Reported effect size
LCI UCI d Standardized mean difference)
Vd
Standardized variance)SEd
Standardized standard error
patient evaluation al= 0.341
Bischoff et al, 2012
Bischoff et al, 2012
(%)Before and after data
Percentage of summaries completed on day of discharge
38%N=563
83%N=2560
0.497
0.003 0.056
Inclusion of all recommended elements on summary
5%N=80
88%N=80
1.03
Dtotal=0.76
0.101
VD= 0.077
0.318
0.227
National Health Insurance P4P (NHI-P4P)Taiwan
Lee et al., 2010
Mean difference
Essential diabetes exams and tests
All patients in the P4P program (n = 12,499).
Comparison group (n = 26,172)
2.450 0.655
0.005
Rwanda PBF program
Basinga et al., 2011
Mean difference
Any prenatal care N=80 N=86 0·002 −0•021 0•025 0.013
0.006 0.079
Four or more prenatal care visits
0·008 −0•063 0•079 0.017
0.005 0.077
Institutional delivery
0·081 0·015 0·146 0.035
0.005 0.077
Tetanus vaccine during prenatal visit
0·051 −0·002 0·103 0.148
0.006 0.078
Standardized total quality score
0·157 0·026 0·289 0.188
0.006 0.078
Younger than 23 months preventive visit, previous 4 weeks
0·119 0·041 0·198 0.243
0.006 0.078
24–59 months preventive visit, previous 4 weeks
0·111 0·059 0·162 0.178
0.006 .079
12–23 months fully immunized
−0·055 −0·184 0·074 -0.065d=0.095
0.006r=0.50.002
0.078
0.041
57

Program Study Effect type Outcome InterventionData
ControlData
Reported effect size
LCI UCI d Standardized mean difference)
Vd
Standardized variance)SEd
Standardized standard error
QOF Campbell et al., 2009
Mean difference
Coronary heart disease
-0.250n=42
-0.401 0.100 -0.302
0.024 .155
Asthma -0.468n=42
-0.748 0.187 . -0.302
0.024 .154
Diabetes -0.220n=42
-0.313 -0.127 -0.717
0.023 0.153
Continuity of care 0.091n=42
0.025 0.157 0.413d=-0.227
0.023r=0.50.053
0.153
0.229
AQ Sutton et al, 2012
Percentage points
30 day Mortality for CABG and other heart related diseases
N 134435Percentage change -1.8%
N 722139
Percentage change -0.9%
1.3 0.4 2.1 0.166
0.013
Premier Jha et al., 2012
Percentage points
30 day Mortality for CABG and other heart related diseases
11.82%N= 137287
11.74%Control=1094034
0.08 −0.30 0.46 0.002
0.005
Premier Lindenauer et al., 2007
Percentage points
Composite measure of process indicators
N= 116613 N=192381 4.3 3.0 5.7 0.155
0.008
QOF Doran et al. 2011
Mean difference
Composite measure of process indicators
N=653 500 N=653 500 1.9 1.4 2.5 0.008
0.154
QOF Kontopantelis et al. 2012
Percentage points
Composite quality score on diabetes in the first year
67.3% Ntotal= 23,78060%
7.3 6.7 8.0 0.270
0.011
QOF
Before and afterQOF design
Simpson et al., 2011
OR Blood pressure below target <150/90
1.11 (1.04 to 1.19) 0.74 (0.67 to 0.82) N=315 0.097
0.030
58

Program Study Effect type Outcome InterventionData
ControlData
Reported effect size
LCI UCI d Standardized mean difference)
Vd
Standardized variance)SEd
Standardized standard error
QOF Srirangalingam et al., 2006
Percentage points
Number with HbA1c >7.4% (%)
No (%)32, 296 9.7%0.031 0.003
No (%)34, 285 10.6%
0.029 0.004
0.9 - 0.4, 1.3 1.1040.259
d=0.024
0.143
QOF Cupples et al., 2014
Percentage points
Smoking status documentation
No (%)76 (16.9)
N=44976/449-76=0.2040.013, 0.003
N (%) 40 (13.4)N=29940/229-40=0.2120.025 0.005
3.5 -1.8 8.6 OR=0.962.Se= 0.214
D= -0.009
0.118
QOF Vaghela et al, 2008
Percentage points
Diabetes outcome targetA1C <or=7.5%,
N =2087478N reaching target=1186695
N =1764063N reaching target=845522
0.086
0.0012 0.001
Blood pressure <or=145/85 mmHg
N =2087478N reaching target=1518780
N =1764063N reaching target=1064995
0.134
0.0012 0.001
Cholesterol <or=5 mmol/l was determined
N =2087478N reaching target=1545301
N =1764063N reaching target=1092954
3.99 3.92 4.07 0.134
d=0.118
0.0012
0.000002
0.001
0.001
National Health Insurance P4P (NHI-P4P)Taiwan
Chang et al, 2008
OR Smoking cessation
N= 3446 N=1823 0.96 0.87 1.06 SMD= -0.010SE of log odds=0.048
SE (d)= 0.026
National Health Kuo et al., OR Quality of care of 0.70 0.63 0.062 0.050 0.074 0.66 0.003
59

Program Study Effect type Outcome InterventionData
ControlData
Reported effect size
LCI UCI d Standardized mean difference)
Vd
Standardized variance)SEd
Standardized standard error
Insurance P4P (NHI-P4P)Taiwan
2011 breast cancer (enroless vs non enrollees)
N= 4,528 patients in total
4
National Health Insurance P4P (NHI-P4P)Taiwan
Li et al., 2010
OR TB cure rate in the first 12 months
N= 25754 N= 33536 1.338 1.159 1.544 0.070SE=0.098
0.054
Hawaii medical group
Gilmore et al., 2007
OR Recommended care (a composite score from 11 indicators)
N was not reported 1.27 1.09 1.40 0.057SE = 0.079
0.044
Hudson health plan
Chien et al., 2010
OR Childhood vaccinations
N=155 N=16 1.65 0.120SE= 0.24
0.132
McMenamin et al, 2003
McMenamin et al, 2003
OR Smoking cessation advise
3.63N=1104
1.7 7.76 0.309SE= 1.546
0.852
Salize et al 2009
Salize et al 2009
OR Smoking abstinence
N=20We might need patient sample here
N=21 1.28 0.25 6.48 0.059SE= 1.589
0.876
Twardella and Brenner, 2007
Twardella and Brenner, 2007
OR Smoking cessation
Participants: 577 patients in 82 practices
1.26
N=557
0.65 2.43 0.055SE= 0.454
0.250
Kruse et al., Kruse et al., OR Smoking status N =227574 N 207,471 1.3 1.1 1.4 0.06 0.042
60

Program Study Effect type Outcome InterventionData
ControlData
Reported effect size
LCI UCI d Standardized mean difference)
Vd
Standardized variance)SEd
Standardized standard error
2013 2013 Documentation 2SE= 0.077
Chen et al., 2010
Chen et al., 2010
OR Quality of diabetes care
19,193 32,365 1.16 1.11 1.22 0.035SE= 0.028
0.015
QOF Coleman et al., 2007
OR Brief advise to smokers
No N 3.03 2.89 3.09 0.265SE= 0.051
0.028
QOF Calvert et al., 2009
OR HbA1c levels of ≤7.5%
N=147 1.05 1.01 1.09 0.011SE= 0.020
0.011
QOF Simpson et al., 2010
OR Smoking status reporting
Total N= 525R=0.75
4.45 4.43 4.46 0.357
0.0042 0.004
Smoking cessation advise
6.75 6.66 6.85 0.457
0.0262 0.026
Smoking cessation referral
7.32 6.92 7.73 0.467
0.013 0.114
Quit rates 0.73 0.72 0.73 -.075d=0.3015
0.0012
r= 0.750.013
0.0010.115
Bardach et al, 2014Fagan et al., 2010
.
Bardach et al, 2014
OR Aspirin therapy, withIVD or DM
N=42R=0.75
N=42 1.28 1.10 1.50 0.059
0.003 0.056
Blood pressurecontrolNo IVD or DM
1.23 1.05 1.44 0.050
0.003 0.055
Blood pressurecontrolIVD
0.71 0.4 1.24 -0.82 0.014 0.118
61

Program Study Effect type Outcome InterventionData
ControlData
Reported effect size
LCI UCI d Standardized mean difference)
Vd
Standardized variance)SEd
Standardized standard error
Blood pressurecontrolDM
1.52 1.12 2.07 0.100
0.018 0.134
Blood pressurecontrolIVD or DM
1.37 1.07 1.75 0.075
0.009 0.096
Cholesterol control
0.86 0.67 1.09 -0.36 0.003 0.059
Smoking cessationintervention
1.30 1.04 1.63 0.063mean d=-0.119
0.0070.033
0.0830.183
Fagan et al., 2010
OR Influenza vaccine N= 1587Around diabetes= 0.75
N=19356 1.79 1.37 2.35 0.139
0.019 0.138
Hemoglobin testing
0.44 0.33 0.65 -0.196
0.031 0.176
Eye exam 0.98 0.61 1.58 -0.005
0.285 0.534
Ldl test 0.62 0.44 0.86 -0.114
0.053 0.231
Nephropathy test 0.96 0.62 1.46 -.010dtotal= -0.0372
0.184r=0.750.366
0.4290.605
Gavagan et al, 2010
Gavagan et al, 2010
0R Pap smears 0.162
0.043 0.208
Mammograms 0.093
0.096 0.309
Pediatric immunization
0.426r=0.5dtotal= 0.18
0.721
0.382
0.849
0.618
62

Program Study Effect type Outcome InterventionData
ControlData
Reported effect size
LCI UCI d Standardized mean difference)
Vd
Standardized variance)SEd
Standardized standard error
7Larsen et al , 2003
Larsen et al , 2003
% change Diabetes care N=943652.85
N= 578533.5%
0.190
0.019
Tsai et al., 2010
Tsai et al., 2010
% change Tb treatment N= 1643489.96% no default in treatment
N= 63887.30% no default in treatment
0.047
0.067
63
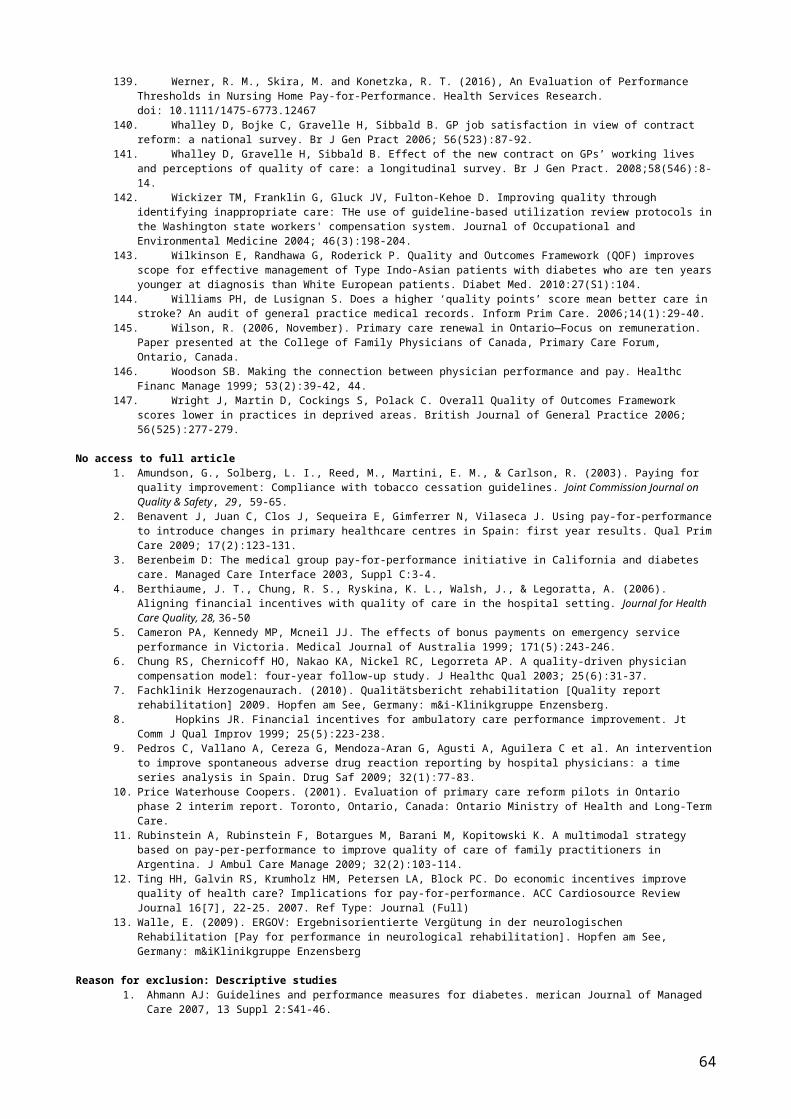
Supplementary file S14 Funnel plot and contour enhanced funnel plot for all 37 studies included in the meta-analysis
0.2
.4.6
.8s.
e. o
f effe
ctsi
ze
-2 -1 0 1 2effectsize
Funnel plot with pseudo 95% confidence limits
64

Supplementary file S15 Forest plot showing subgroup analyses by quasi-experimental evaluation design
65

Supplementary file S16 Random effects parameters of the multilevel logistic regression model
Random-effects
parameters
Estimate Standard
error
95% CI
P4P scheme sd(_cons) 3.51e−08 0.62 0.00-0.00
P4P study sd(_cons) 1.83 0.45 1.12-2.96
sd(_cons): standard deviation at each level
Supplementary file S17 Sensitivity analyses results for change in correlation values to account for multiple outcomes within schemes in the meta-regression modelExplanatory variables(Number of studies=36)
SMD (univariate model)[95% CI]
SMD(Multivariate model) [95% CI]
Who receives the incentive: payment to groups compared to payment to individuals
0.002 (-0.184, 0.193) P= 0.989
-0.009 (-0.200, 0.184) P= 0.925
Size of incentive: large incentive compared to small incentive
0.101 (-0.064, 0.272) P=0.220
0.116 (-0.077, 0.309) P=0.229
Perceived risk of not earning the incentive (Risk): low risk compared to high risk
0.009 (-0.146, 0.163) P=0.930
0.002 (-0.202, 0.139) P= 0.693Evaluation: -0.020 (-0.173, 0.142) P=0.834
Outcome variable: P4P effect estimate (standardized mean difference)
Supplementary file S18 sensitivity analyses results for change in categorisation of binary outcomes in the multilevel logistic regression modelExplanatory variables(Number of studies=96)
OR (univariate model) (95% CI)
OR multivariate model) (95% CI)
Who receives the incentive: payment to groups compared to payment to individuals
1.25 (0.31- 5.89)P=0.756
1.98 (0.72-6.88)P=0.350
Size of incentive: large incentive compared to small incentive
4.24 (1.02- 17.66)P=0.049
3.36 (1.09-10.88)P=0.039
Perceived risk of not earning the incentive (Risk): low risk compared to high risk
2.95 (0.78-9.86)P=0.113
0.68 (0.22-1.94)P=0.369
Evaluation design: No adequate control group compared to RCTs or quasi-experimental studies
23.22 (6.28-85.73)P<0.0001
24.09 (6.31-90.76)P<0.0001
66

67