views/catt training room: director’s row #46, 4 th floor 1 st session: tuesday, november 4-6,...
TRANSCRIPT
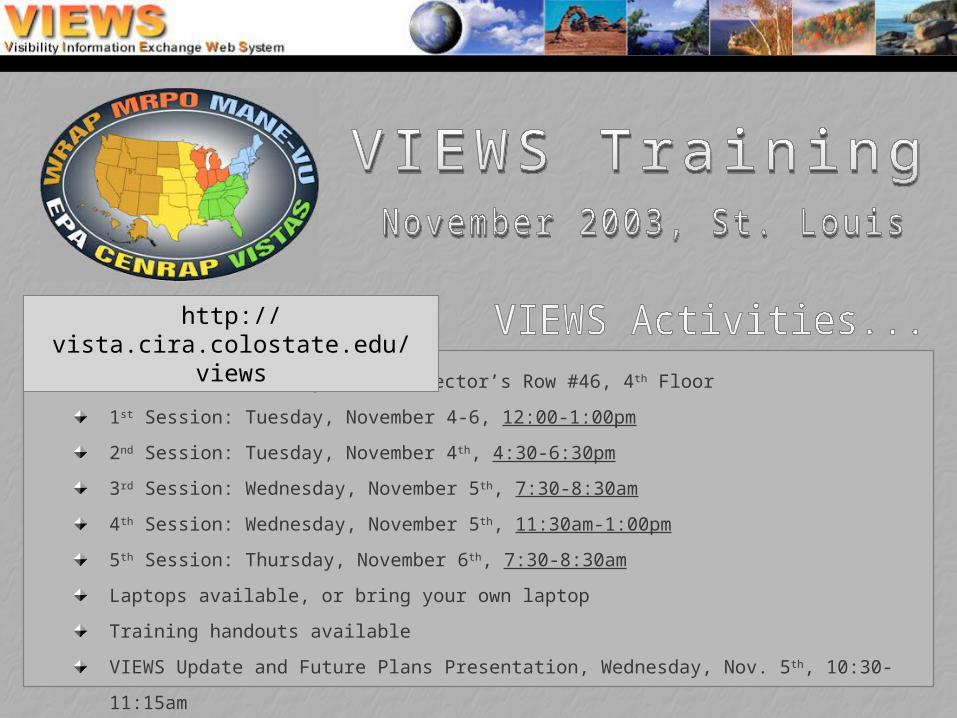
VIEWS/CATT Training Room: Director’s Row #46, 4th Floor
1st Session: Tuesday, November 4-6, 12:00-1:00pm
2nd Session: Tuesday, November 4th, 4:30-6:30pm
3rd Session: Wednesday, November 5th, 7:30-8:30am
4th Session: Wednesday, November 5th, 11:30am-1:00pm
5th Session: Thursday, November 6th, 7:30-8:30am
Laptops available, or bring your own laptop
Training handouts available
VIEWS Update and Future Plans Presentation, Wednesday, Nov. 5 th, 10:30-11:15am
http://vista.cira.colostate.edu/views

Click the “all” button to select every item in a list.
Click the “clear” button to de-select every item in a list.
Click the “site information” button to display detailed metadata for a single selected Site.
Click the “Select by RPOs” check boxes to select every site in an RPO.
Hold down the “Ctrl” key on your keyboard while using your mouse to select multiple, non-contiguous Sites.
To select multiple contiguous Sites, simply click on the list box and drag your mouse pointer.
Step-by-step instructions…

Sharper-looking maps
Dynamic layer display
Easier metadata browsing
Powerful data drill-down
More formatting options
Detailed legends
A large selection of layers
Faster site selection

Pie and doughnut charts
Bar & stacked bar charts
Line, curve, & area graphs
Scatter plots
Contour and surface charts
3D charts and graphs
Extensive formatting options
Easy-to-use chart controls
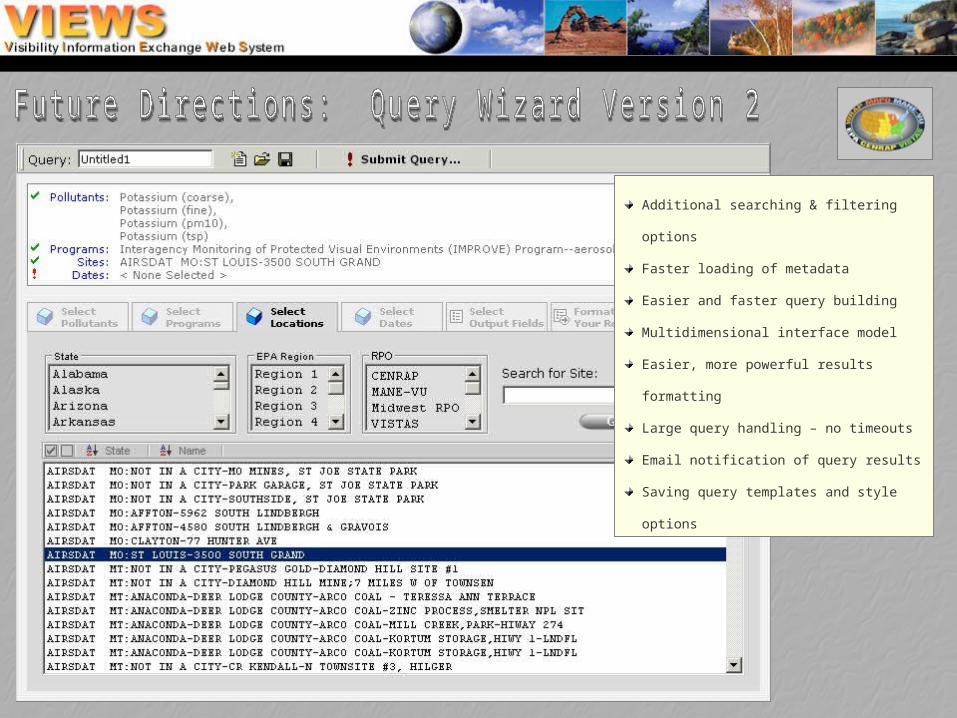
Additional searching & filtering options
Faster loading of metadata
Easier and faster query building
Multidimensional interface model
Easier, more powerful results formatting
Large query handling – no timeouts
Email notification of query results
Saving query templates and style options

ARS nephelometer, transmissometer
CASTNET drychem, vischem
EPA FRM frm data
EPA Speciation speciation data
IMPROVE aerosol, calculated variables, regional haze rule data
MOHAVE aerosol
PREVENT aerosol
REVEAL aerosol
SEAVS aerosol
SFU aerosol
NESCAUM aerosol
MOHAVE nephelometer, transmissometer
SEAVS nephelometer, transmissometer
BRAVO aerosol, nephelometer, transmissometer
SEARCH Continuous PM2.5, speciated aerosol, gaseous, surface met
SEARCH 24hr PM2.5, speciated aerosol
NPS Gaseous
GAViM PM2.5, speciated aerosol
Data Sets currently available from VIEWS:
Data Sets soon to be added to VIEWS (before Christmas 2003 *):

Thank You.http://vista.cira.colostate.edu/views
Join us in the training room (Director’s Row #46, 4th Floor)…
Ask questions, use the tools, and make us work…
Give us your comments, suggestions, and feedback
Visit our website: http://vista.cira.colostate.edu/views
Sign up for our newsletter
Become a member of our guest list