· web viewquestionnaire, results, and additional data. 2017 schooling in america survey....
TRANSCRIPT

Questionnaire, Results, and Additional Data 2017 Schooling in America Survey
August 18, 2017 to September 2, 2017
Total National Sample = 1,000
EdChoice, Survey Sponsor and Developer Braun Research, Inc., Survey Data Collection and Quality Control DIVISION_CODE
Total National
TOTAL ANSWERING 1000 UNWEIGHTED BASE 1000 NET: NORTHEAST 18.0% NEW ENGLAND 4.8% MIDDLE ATLANTIC 13.2% NET: MIDWEST 21.2% EAST NORTH CENTRAL 14.5% WEST NORTH CENTRAL 6.6% NET: SOUTH 37.5% SOUTH ATLANTIC 20.1% EAST SOUTH CENTRAL 5.8% WEST SOUTH CENTRAL 11.6% NET: WEST 24.3% MOUNTAIN 7.1% PACIFIC 16.3%
SPLIT1. CODE - SPLIT - 1
National Current &
Former Parents
Current Parents
Former Parents
TOTAL ANSWERING 1000 524 286 238 UNWEIGHTED BASE 1000 544 269 275 SPLIT A 50.0% 51.5% 53.7% 48.9% SPLIT B 50.0% 48.5% 46.3% 51.1%
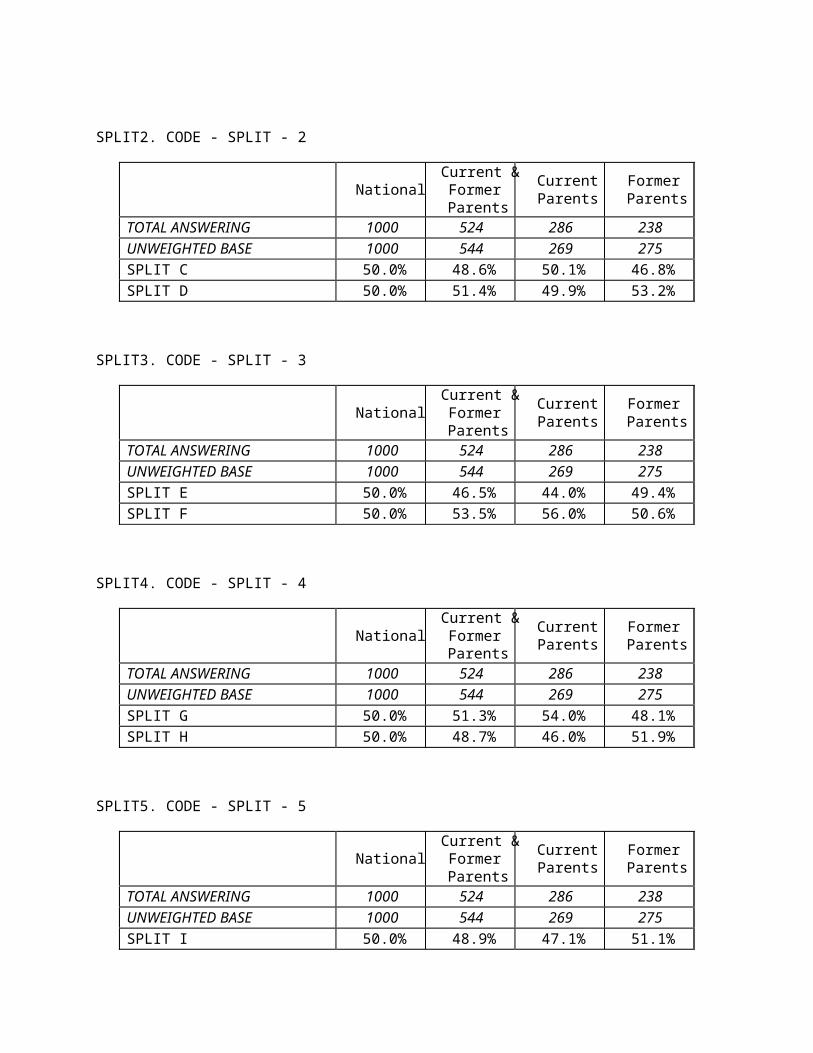
SPLIT2. CODE - SPLIT - 2
National Current &
Former Parents
Current Parents
Former Parents
TOTAL ANSWERING 1000 524 286 238 UNWEIGHTED BASE 1000 544 269 275 SPLIT C 50.0% 48.6% 50.1% 46.8% SPLIT D 50.0% 51.4% 49.9% 53.2%
SPLIT3. CODE - SPLIT - 3
National Current &
Former Parents
Current Parents
Former Parents
TOTAL ANSWERING 1000 524 286 238 UNWEIGHTED BASE 1000 544 269 275 SPLIT E 50.0% 46.5% 44.0% 49.4% SPLIT F 50.0% 53.5% 56.0% 50.6%
SPLIT4. CODE - SPLIT - 4
National Current &
Former Parents
Current Parents
Former Parents
TOTAL ANSWERING 1000 524 286 238 UNWEIGHTED BASE 1000 544 269 275 SPLIT G 50.0% 51.3% 54.0% 48.1% SPLIT H 50.0% 48.7% 46.0% 51.9%
SPLIT5. CODE - SPLIT - 5
National Current &
Former Parents
Current Parents
Former Parents
TOTAL ANSWERING 1000 524 286 238 UNWEIGHTED BASE 1000 544 269 275 SPLIT I 50.0% 48.9% 47.1% 51.1%

SPLIT J 50.0% 51.1% 52.9% 48.9% SURVTYPE. SURVEY TYPE
National Current &
Former Parents
Current Parents
Former Parents
TOTAL ANSWERING 1000 524 286 238 UNWEIGHTED BASE 1000 544 269 275 LANDLINE 35.5% 40.6% 20.5% 64.7% CELL PHONE 64.5% 59.4% 79.5% 35.3%
[BRAUN RESEARCH INTRODUCTION] CELL PHONE Hello, my name is ______________, I am calling for BR Interviewing, a national market research firm. We are not selling anything and will not be asking you for money, all your answers will be kept confidential. We are calling nationwide to ask questions about things that have been in the news and would like to include your opinions. If you are driving or doing anything that requires your full attention, I will need to call you back. Please know these calls are randomly monitored for quality and training purposes. LANDLINE Hello, my name is ______________, I am calling for BR Interviewing, a national market research firm. We are not selling anything and will not be asking you for money, all your answers will be kept confidential. We are calling nationwide to ask questions about things that have been in the news and would like to include your opinions. I'd like to ask a few questions of the youngest male age 18 years or older who is now at home?

[IF NO] May I ask a few questions of the youngest female age 18 years or older who is now at home? Please know these calls are randomly monitored for quality and training purposes. S1. Are you under 18 years old, OR are you 18 or older?
National Current &
Former Parents
Current Parents
Former Parents
TOTAL ANSWERING 1000 524 286 238 UNWEIGHTED BASE 1000 544 269 275 Under 18 ‐ ‐ ‐ ‐18 or older 100% 100% 100% 100% [Refused] ‐ ‐ ‐ ‐
S2. In what STATE do you currently live? [OPEN END. RECORD.]
National Current &
Former Parents
Current Parents
Former Parents
TOTAL ANSWERING 1000 524 286 238
UNWEIGHTED BASE 1000 544 269 275
Alabama 1.5% 1.0% 1.6% 0.3%
Alaska ‐ ‐ ‐ ‐Arizona 1.9% 2.0% 2.0% 1.9%
Arkansas 1.9% 2.0% 1.0% 3.2%
California 11.3% 10.8% 9.8% 12.1%
Colorado 1.6% 1.3% 1.2% 1.4%
Connecticut 1.5% 1.3% 0.8% 1.9%
Delaware 0.9% 0.7% 1.4% ‐District of Columbia 0.4% ‐ ‐ ‐
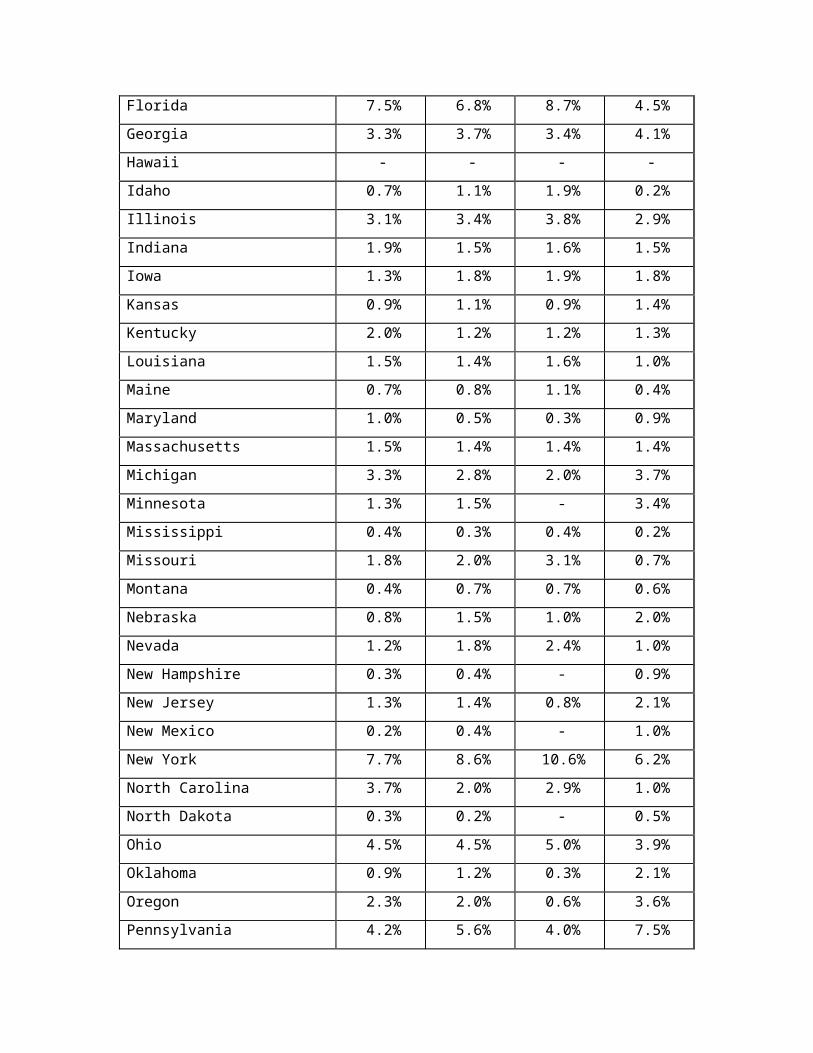
Florida 7.5% 6.8% 8.7% 4.5%
Georgia 3.3% 3.7% 3.4% 4.1%
Hawaii ‐ ‐ ‐ ‐Idaho 0.7% 1.1% 1.9% 0.2%
Illinois 3.1% 3.4% 3.8% 2.9%
Indiana 1.9% 1.5% 1.6% 1.5%
Iowa 1.3% 1.8% 1.9% 1.8%
Kansas 0.9% 1.1% 0.9% 1.4%
Kentucky 2.0% 1.2% 1.2% 1.3%
Louisiana 1.5% 1.4% 1.6% 1.0%
Maine 0.7% 0.8% 1.1% 0.4%
Maryland 1.0% 0.5% 0.3% 0.9%
Massachusetts 1.5% 1.4% 1.4% 1.4%
Michigan 3.3% 2.8% 2.0% 3.7%
Minnesota 1.3% 1.5% ‐ 3.4%
Mississippi 0.4% 0.3% 0.4% 0.2%
Missouri 1.8% 2.0% 3.1% 0.7%
Montana 0.4% 0.7% 0.7% 0.6%
Nebraska 0.8% 1.5% 1.0% 2.0%
Nevada 1.2% 1.8% 2.4% 1.0%
New Hampshire 0.3% 0.4% ‐ 0.9%
New Jersey 1.3% 1.4% 0.8% 2.1%
New Mexico 0.2% 0.4% ‐ 1.0%
New York 7.7% 8.6% 10.6% 6.2%
North Carolina 3.7% 2.0% 2.9% 1.0%
North Dakota 0.3% 0.2% ‐ 0.5%
Ohio 4.5% 4.5% 5.0% 3.9%
Oklahoma 0.9% 1.2% 0.3% 2.1%
Oregon 2.3% 2.0% 0.6% 3.6%
Pennsylvania 4.2% 5.6% 4.0% 7.5%

Rhode Island 0.6% 0.5% ‐ 1.2%
South Carolina 1.0% 1.1% 0.9% 1.2%
South Dakota 0.2% 0.2% ‐ 0.4%
Tennessee 1.9% 1.1% 0.8% 1.4%
Texas 7.3% 7.4% 10.3% 3.9%
Utah 1.0% 1.4% 2.2% 0.5%
Vermont 0.2% 0.2% 0.3% ‐Virginia 1.8% 1.6% 1.9% 1.2%
Washington 2.6% 2.8% 1.3% 4.7%
West Virginia 0.6% 0.8% 0.9% 0.6%
Wisconsin 1.7% 2.1% 1.9% 2.3%
Wyoming ‐ ‐ ‐ ‐Outside of USA ‐ ‐ ‐ ‐[Refused] ‐ ‐ ‐ ‐
CENSUSDIV. CENSUS DIVISION
National Current &
Former Parents
Current Parents
Former Parents
TOTAL ANSWERING 1000 524 286 238 UNWEIGHTED BASE 1000 544 269 275 New England 4.8% 4.6% 3.6% 5.7% Middle Atlantic 13.2% 15.6% 15.3% 15.9% East North Central 14.5% 14.2% 14.2% 14.3% West North Central 6.6% 8.4% 7.0% 10.1% South Atlantic 20.1% 17.3% 20.5% 13.4% East South Central 5.8% 3.7% 4.1% 3.3% West South Central 11.6% 11.9% 13.3% 10.3% Mountain 7.1% 8.7% 10.4% 6.6% Pacific 16.3% 15.6% 11.6% 20.4%

D1. [CODE FOR REGION]
National Current &
Former Parents
Current Parents
Former Parents
TOTAL ANSWERING 1000 524 286 238 UNWEIGHTED BASE 1000 544 269 275 [Northeast] 18.0% 20.2% 19.0% 21.6% [South] 37.5% 32.9% 37.9% 27.0% [Midwest] 21.2% 22.6% 21.1% 24.4% [West] 23.3% 24.3% 22.0% 27.0%
D2. [DO NOT READ. ASK ONLY IF UNSURE. CODE GENDER OF RESPONDENT.]
National Current &
Former Parents
Current Parents
Former Parents
TOTAL ANSWERING 1000 524 286 238 UNWEIGHTED BASE 1000 544 269 275 [Male] 49.0% 45.7% 51.0% 39.3% [Female] 51.0% 54.3% 49.0% 60.7%
“For this brief interview, if you are completely unsure about your answer or have no feelings for an answer, you can say ‘I Don’t Know’.” [ENTER AS “DK”] 1-1. Split A. What is the most important PROBLEM FACING YOU AND YOUR FAMILY that you believe the United States federal government should address? Please be as specific as possible, but limit your response to a few words or a short phrase. [OPEN END, and CODE]
National Current &
Former Parents
Current Parents
Former Parents
UNWEIGHTED BASE 500 275 137 138 ECONOMIC 23.7% 22.3% 27.4% 15.7% Low Wages/Few Jobs 12.2% 10.4% 13.7% 5.9% Economy/Recession 4.8% 6.1% 5.2% 7.2% Inflation 1.1% 1.4% 2.1% 0.4%

Poor Business Climate 0.6% 1.0% 0.7% 1.3% Unemployment 0.5% 0.3% 0.6% ‐ Trade Deficits/Wars. 0.1% ‐ ‐ ‐ Other Economic 4.8% 3.8% 5.8% 1.2% HEALTHCARE/HEALTH ISSUES 21.8% 20.8% 16.3% 26.8% Rising cost of health care 4.8% 6.3% 5.1% 7.8% Caring for the elderly/ Soc. Sec 2.3% 3.0% 1.3% 5.3% Availability of Care 1.7% 1.6% 2.2% 0.8% Obamacare/ACA 0.9% 0.5% ‐ 1.1% Prescription drug costs 0.6% 0.5% 0.6% 0.4% Veterans Administration/VA 0.5% 0.5% ‐ 1.1% Poor Coverage/Benefits 0.2% ‐ ‐ ‐ Other Health 11.9% 9.7% 8.6% 11.1% GOVERNMENT 11.7% 13.6% 11.7% 16.1% President Trump 5.2% 6.2% 5.0% 7.7% Immigration 2.6% 1.8% 1.3% 2.5% Gov't Regulations/Too Much 0.9% 1.7% 2.2% 1.0% Poor/Corrupt Leadership 0.4% 0.2% ‐ 0.4% Budget Shortfall/ Deficit 0.4% 0.3% ‐ 0.7% Congress 0.3% 0.2% ‐ 0.4% Gov't Spending/ Wasteful 0.2% 0.4% ‐ 0.9% Other Government 1.8% 2.9% 3.2% 2.4% INEQUALITY/RACISM 7.2% 6.6% 4.9% 8.8% Racism 3.9% 4.4% 1.9% 7.6% Poverty 1.3% 0.6% 1.1% ‐ Discrimination 0.8% 1.3% 1.4% 1.2% Other Inequality 1.1% 0.3% 0.4% ‐NATIONAL SECURITY/ DEFENSE 5.1% 6.3% 7.1% 5.2% Terrorism 2.3% 3.0% 3.2% 2.8% Middle East Issues. 0.5% 0.9% 1.5% ‐ War/Peace 0.2% ‐ ‐ ‐ North Korea. 0.1% ‐ ‐ ‐ Russia 0.1% 0.2% ‐ 0.5% Other National Security/Defense. 1.9% 2.2% 2.4% 1.9%
TAXES 5.0% 4.2% 2.1% 6.8% Tax Increases 2.0% 1.3% ‐ 3.0% Other Taxes 3.1% 2.9% 2.1% 3.8% EDUCATION 3.4% 3.9% 4.6% 2.9% School Financing 0.9% 1.3% 2.2% ‐ Quality of Education 0.5% ‐ ‐ ‐

Other Education 2.0% 2.6% 2.4% 2.9% RETIREMENT SAVINGS/ SOCIAL SECURITY 2.9% 4.2% 2.8% 6.0%
Soc. Security/Pensions/ Retirement Savings. 2.9% 4.2% 2.8% 6.0%
CRIME/SAFETY 2.8% 3.2% 3.4% 3.0% Crime 1.2% 1.1% 1.7% 0.4% Police Brutality 1.0% 1.4% 0.5% 2.6% Drugs/Alcohol 0.2% 0.4% 0.7% ‐ Other Crime 0.4% 0.3% 0.5% ‐ENVIRONMENT 2.1% 0.9% ‐ 2.2% Pollution 0.1% ‐ ‐ ‐ Other Environment 2.1% 0.9% ‐ 2.2% INFRASTRUCTURE/ TRANSPORTATION 0.2% 0.4% 0.6% ‐ Road & Bridge Maintenance 0.2% 0.4% 0.6% ‐OTHER/SPECIFIC ISSUES 7.7% 8.9% 9.9% 7.6% Decline in Moral Values 0.6% 0.7% 0.9% 0.5% Other (SPECIFY) 7.1% 8.2% 9.0% 7.1% NO PROBLEMS 12.3% 10.5% 11.7% 8.8%
1-2. What is the most important PUBLIC POLICY ISSUE that you believe the United States federal government should address? Please be as specific as possible, but limit your response to a few words or a short phrase.
National Current &
Former Parents
Current Parents
Former Parents
UNWEIGHTED BASE 500 269 132 137 HEALTHCARE/HEALTH ISSUES 25.6% 32.2% 32.9% 31.4% Obamacare/ACA 2.6% 3.6% 4.1% 3.0% Rising cost of health care 2.1% 3.3% 1.6% 5.2% Caring for the elderly/ Soc. Sec 1.4% 2.1% 0.9% 3.4% Availability of Care 0.8% 0.7% 0.9% 0.6% Poor Coverage/Benefits 0.5% ‐ ‐ ‐ Veterans Administration/VA 0.2% 0.3% 0.7% ‐ Malpractice/docs leaving state 0.2% 0.3% 0.6% ‐ Other Health 18.0% 22.1% 24.7% 19.2% GOVERNMENT 14.6% 12.1% 11.3% 13.0% Immigration 5.0% 4.0% 3.2% 4.8%
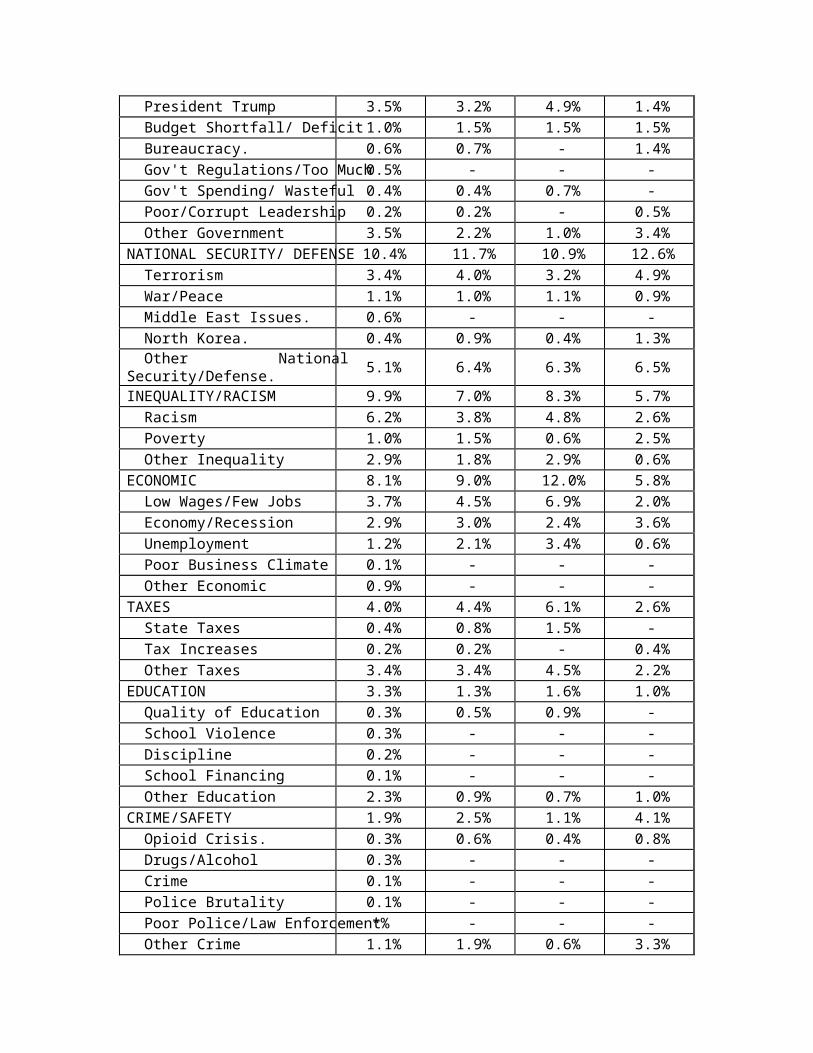
President Trump 3.5% 3.2% 4.9% 1.4% Budget Shortfall/ Deficit 1.0% 1.5% 1.5% 1.5% Bureaucracy. 0.6% 0.7% ‐ 1.4% Gov't Regulations/Too Much 0.5% ‐ ‐ ‐ Gov't Spending/ Wasteful 0.4% 0.4% 0.7% ‐ Poor/Corrupt Leadership 0.2% 0.2% ‐ 0.5% Other Government 3.5% 2.2% 1.0% 3.4% NATIONAL SECURITY/ DEFENSE 10.4% 11.7% 10.9% 12.6% Terrorism 3.4% 4.0% 3.2% 4.9% War/Peace 1.1% 1.0% 1.1% 0.9% Middle East Issues. 0.6% ‐ ‐ ‐ North Korea. 0.4% 0.9% 0.4% 1.3% Other National Security/Defense. 5.1% 6.4% 6.3% 6.5%
INEQUALITY/RACISM 9.9% 7.0% 8.3% 5.7% Racism 6.2% 3.8% 4.8% 2.6% Poverty 1.0% 1.5% 0.6% 2.5% Other Inequality 2.9% 1.8% 2.9% 0.6% ECONOMIC 8.1% 9.0% 12.0% 5.8% Low Wages/Few Jobs 3.7% 4.5% 6.9% 2.0% Economy/Recession 2.9% 3.0% 2.4% 3.6% Unemployment 1.2% 2.1% 3.4% 0.6% Poor Business Climate 0.1% ‐ ‐ ‐ Other Economic 0.9% ‐ ‐ ‐TAXES 4.0% 4.4% 6.1% 2.6% State Taxes 0.4% 0.8% 1.5% ‐ Tax Increases 0.2% 0.2% ‐ 0.4% Other Taxes 3.4% 3.4% 4.5% 2.2% EDUCATION 3.3% 1.3% 1.6% 1.0% Quality of Education 0.3% 0.5% 0.9% ‐ School Violence 0.3% ‐ ‐ ‐ Discipline 0.2% ‐ ‐ ‐ School Financing 0.1% ‐ ‐ ‐ Other Education 2.3% 0.9% 0.7% 1.0% CRIME/SAFETY 1.9% 2.5% 1.1% 4.1% Opioid Crisis. 0.3% 0.6% 0.4% 0.8% Drugs/Alcohol 0.3% ‐ ‐ ‐ Crime 0.1% ‐ ‐ ‐ Police Brutality 0.1% ‐ ‐ ‐ Poor Police/Law Enforcement *% ‐ ‐ ‐ Other Crime 1.1% 1.9% 0.6% 3.3%

RETIREMENT SAVINGS/ SOCIAL SECURITY 1.7% 2.2% 1.1% 3.3%
Soc. Security/Pensions/ Retirement Savings. 1.7% 2.2% 1.1% 3.3%
ENVIRONMENT 1.0% 0.9% ‐ 1.8% Other Environment 1.0% 0.9% ‐ 1.8% INFRASTRUCTURE/ TRANSPORTATION 0.3% 0.6% 0.6% 0.6%
Road & Bridge Maintenance 0.3% 0.6% 0.6% 0.6% OTHER/SPECIFIC ISSUES 11.1% 12.8% 15.3% 10.1% Decline in Moral Values 1.0% 1.4% 0.5% 2.4% Other (SPECIFY) 10.0% 11.4% 14.9% 7.7% NO PROBLEMS 12.6% 10.1% 7.6% 12.7%
1-COM. What is the most important PROBLEM FACING YOU AND YOUR FAMILY that you believe the United States federal government should address? What is the most important PUBLIC POLICY ISSUE that you believe the United States federal government should address? Please be as specific as possible, but limit your response to a few words or a short phrase.
National Current &
Former Parents
Current Parents
Former Parents
TOTAL ANSWERING 1000 524 286 238 UNWEIGHTED BASE 1000 544 269 275 HEALTHCARE/HEALTH ISSUES 23.7% 26.3% 24.0% 29.2% Rising cost of health care 3.4% 4.9% 3.5% 6.5% Caring for the elderly/ Soc. Sec 1.9% 2.6% 1.1% 4.3% Obamacare/ACA 1.8% 2.0% 1.9% 2.1% Availability of Care 1.3% 1.2% 1.6% 0.7% Poor Coverage/Benefits 0.3% ‐ ‐ ‐ Veterans Administration/VA 0.3% 0.4% 0.3% 0.6% Prescription drug costs 0.3% 0.3% 0.3% 0.2% Malpractice/docs leaving state 0.1% 0.2% 0.3% ‐ Other Health 14.9% 15.7% 16.1% 15.3% ECONOMIC 15.9% 15.9% 20.3% 10.6% Low Wages/Few Jobs 8.0% 7.5% 10.6% 3.9% Economy/Recession 3.9% 4.6% 3.9% 5.4% Unemployment 0.9% 1.2% 1.9% 0.3% Inflation 0.5% 0.7% 1.1% 0.2% Poor Business Climate 0.4% 0.5% 0.4% 0.6%

Trade Deficits/Wars. 0.1% ‐ ‐ ‐ Other Economic 2.8% 2.0% 3.1% 0.6% GOVERNMENT 13.2% 12.9% 11.5% 14.5% President Trump 4.3% 4.7% 5.0% 4.5% Immigration 3.8% 2.8% 2.2% 3.7% Gov't Regulations/Too Much 0.7% 0.9% 1.2% 0.5% Budget Shortfall/ Deficit 0.7% 0.9% 0.7% 1.1% Bureaucracy. 0.3% 0.3% ‐ 0.7% Poor/Corrupt Leadership 0.3% 0.2% ‐ 0.4% Gov't Spending/ Wasteful 0.3% 0.4% 0.3% 0.4% Congress 0.1% 0.1% ‐ 0.2% Other Government 2.7% 2.5% 2.2% 2.9% INEQUALITY/RACISM 8.5% 6.8% 6.5% 7.2% Racism 5.1% 4.1% 3.3% 5.1% Poverty 1.2% 1.1% 0.9% 1.3% Discrimination 0.4% 0.7% 0.7% 0.6% Other Inequality 2.0% 1.0% 1.6% 0.3% NATIONAL SECURITY/ DEFENSE 7.7% 8.9% 8.9% 9.0% Terrorism 2.9% 3.5% 3.2% 3.9% War/Peace 0.6% 0.5% 0.5% 0.5% Middle East Issues. 0.5% 0.4% 0.8% ‐ North Korea. 0.3% 0.4% 0.2% 0.7% Russia 0.1% 0.1% ‐ 0.2% Other National Security/Defense. 3.5% 4.2% 4.2% 4.2%
TAXES 4.5% 4.3% 4.0% 4.7% Tax Increases 1.1% 0.8% ‐ 1.7% State Taxes 0.2% 0.4% 0.7% ‐ Other Taxes 3.2% 3.1% 3.3% 3.0% EDUCATION 3.3% 2.6% 3.2% 1.9% School Financing 0.5% 0.6% 1.2% ‐ Quality of Education 0.4% 0.2% 0.4% ‐ School Violence 0.1% ‐ ‐ ‐ Discipline 0.1% ‐ ‐ ‐ Other Education 2.2% 1.8% 1.6% 1.9% CRIME/SAFETY 2.4% 2.9% 2.3% 3.6% Crime 0.7% 0.6% 0.9% 0.2% Police Brutality 0.6% 0.7% 0.3% 1.3% Drugs/Alcohol 0.2% 0.2% 0.4% ‐ Opioid Crisis. 0.2% 0.3% 0.2% 0.4% Poor Police/Law Enforcement *% ‐ ‐ ‐

Other Crime 0.7% 1.1% 0.6% 1.7% RETIREMENT SAVINGS/ SOCIAL SECURITY 2.3% 3.2% 2.0% 4.6%
Soc. Security/Pensions/ Retirement Savings. 2.3% 3.2% 2.0% 4.6%
ENVIRONMENT 1.6% 0.9% ‐ 2.0% Pollution *% ‐ ‐ ‐ Other Environment 1.6% 0.9% ‐ 2.0% INFRASTRUCTURE/ TRANSPORTATION 0.3% 0.5% 0.6% 0.3%
Road & Bridge Maintenance 0.3% 0.5% 0.6% 0.3% OTHER/SPECIFIC ISSUES 9.4% 10.8% 12.4% 8.9% Decline in Moral Values 0.8% 1.1% 0.7% 1.5% Other (SPECIFY) 8.6% 9.8% 11.7% 7.4% NO PROBLEMS 12.5% 10.3% 9.8% 10.8%
2. In the United States, do you feel things in K-12 Education are generally going in the right direction, or do you feel things have generally gotten off on the wrong track?
National Current &
Former Parents
Current Parents
Former Parents
TOTAL ANSWERING 1000 524 286 238 UNWEIGHTED BASE 1000 544 269 275 Right Direction 26.9% 26.8% 31.6% 21.1% Wrong Track 55.3% 58.4% 56.0% 61.2% [DK] 16.9% 13.8% 10.8% 17.4% [Refused] 0.8% 1.0% 1.5% 0.3%
3. Are you currently the parent or guardian of a child, who lives with you, and who is enrolled in any grade from Kindergarten through High School? If you have a child who will be in Kindergarten next school year, that qualifies as a “Yes”.
National Current &
Former Parents
Current Parents
Former Parents
TOTAL ANSWERING 1000 524 286 238 UNWEIGHTED BASE 1000 544 269 275 Yes 28.6% 54.5% 100% ‐
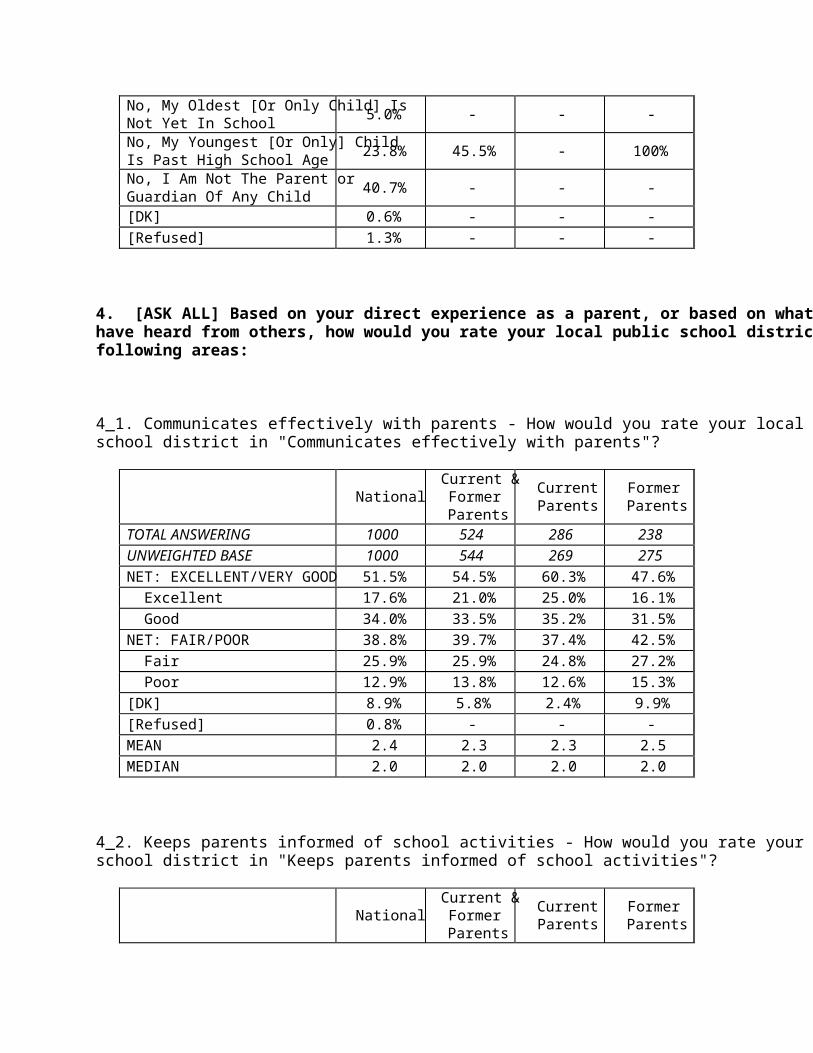
No, My Oldest [Or Only Child] Is Not Yet In School 5.0% ‐ ‐ ‐No, My Youngest [Or Only] Child Is Past High School Age 23.8% 45.5% ‐ 100%
No, I Am Not The Parent or Guardian Of Any Child 40.7% ‐ ‐ ‐[DK] 0.6% ‐ ‐ ‐[Refused] 1.3% ‐ ‐ ‐
4. [ASK ALL] Based on your direct experience as a parent, or based on what you have heard from others, how would you rate your local public school district in the following areas: 4_1. Communicates effectively with parents - How would you rate your local public school district in "Communicates effectively with parents"?
National Current &
Former Parents
Current Parents
Former Parents
TOTAL ANSWERING 1000 524 286 238 UNWEIGHTED BASE 1000 544 269 275 NET: EXCELLENT/VERY GOOD 51.5% 54.5% 60.3% 47.6% Excellent 17.6% 21.0% 25.0% 16.1% Good 34.0% 33.5% 35.2% 31.5% NET: FAIR/POOR 38.8% 39.7% 37.4% 42.5% Fair 25.9% 25.9% 24.8% 27.2% Poor 12.9% 13.8% 12.6% 15.3% [DK] 8.9% 5.8% 2.4% 9.9% [Refused] 0.8% ‐ ‐ ‐MEAN 2.4 2.3 2.3 2.5 MEDIAN 2.0 2.0 2.0 2.0
4_2. Keeps parents informed of school activities - How would you rate your local public school district in "Keeps parents informed of school activities"?
National Current &
Former Parents
Current Parents
Former Parents

TOTAL ANSWERING 1000 524 286 238 UNWEIGHTED BASE 1000 544 269 275 NET: EXCELLENT/VERY GOOD 59.5% 60.9% 65.4% 55.6% Excellent 21.5% 23.8% 29.1% 17.4% Good 38.0% 37.2% 36.3% 38.2% NET: FAIR/POOR 30.4% 32.4% 32.1% 32.7% Fair 21.3% 23.6% 25.7% 21.0% Poor 9.2% 8.8% 6.4% 11.7% [DK] 9.3% 6.7% 2.5% 11.7% [Refused] 0.8% ‐ ‐ ‐MEAN 2.2 2.2 2.1 2.3 MEDIAN 2.0 2.0 2.0 2.0
4_3. Provides school counseling services - How would you rate your local public school district in "Provides school counseling services"?
National Current &
Former Parents
Current Parents
Former Parents
TOTAL ANSWERING 1000 524 286 238 UNWEIGHTED BASE 1000 544 269 275 NET: EXCELLENT/VERY GOOD 50.2% 51.8% 57.5% 45.1% Excellent 15.4% 18.0% 23.5% 11.4% Good 34.9% 33.8% 34.0% 33.6% NET: FAIR/POOR 36.6% 38.6% 37.4% 40.1% Fair 25.0% 27.2% 27.9% 26.3% Poor 11.6% 11.4% 9.5% 13.7% [DK] 12.3% 9.6% 5.2% 14.9% [Refused] 0.8% ‐ ‐ ‐MEAN 2.4 2.4 2.2 2.5 MEDIAN 2.0 2.0 2.0 2.0
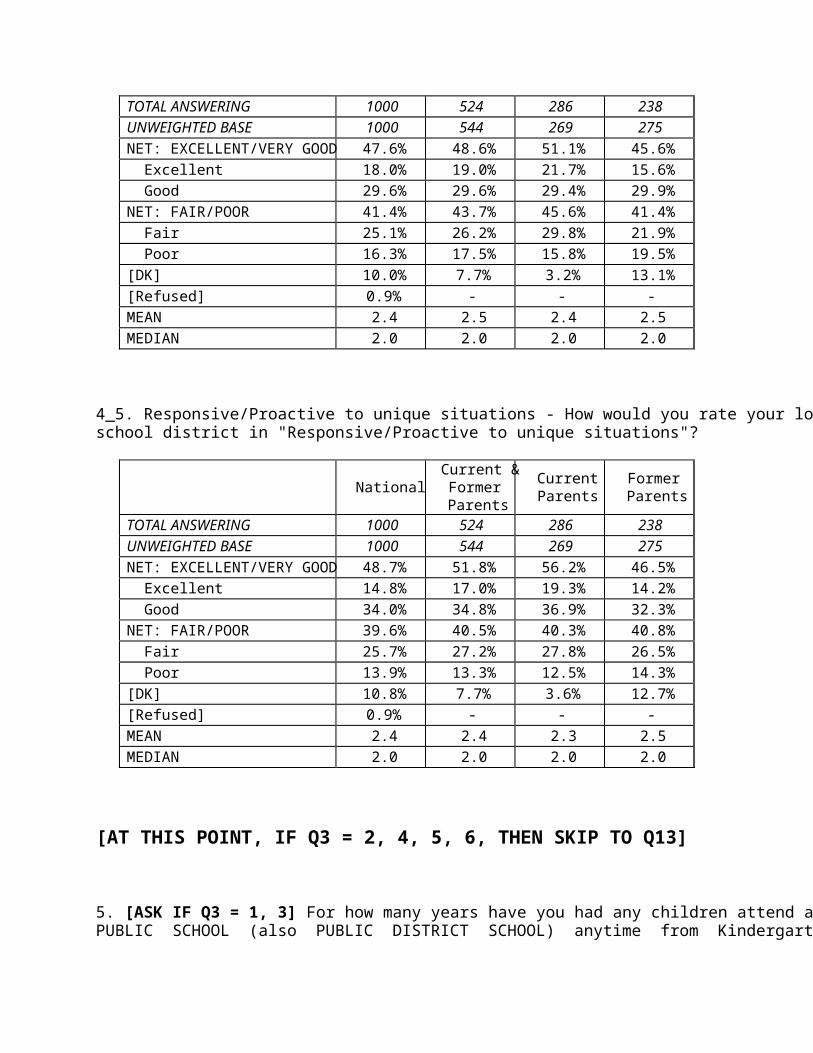
4_4. Provides additional academic supports outside the classroom - How would you rate your local public school district in "Provides additional academic supports outside the classroom"?
National Current &
Former Parents
Current Parents
Former Parents
TOTAL ANSWERING 1000 524 286 238 UNWEIGHTED BASE 1000 544 269 275 NET: EXCELLENT/VERY GOOD 47.6% 48.6% 51.1% 45.6% Excellent 18.0% 19.0% 21.7% 15.6% Good 29.6% 29.6% 29.4% 29.9% NET: FAIR/POOR 41.4% 43.7% 45.6% 41.4% Fair 25.1% 26.2% 29.8% 21.9% Poor 16.3% 17.5% 15.8% 19.5% [DK] 10.0% 7.7% 3.2% 13.1% [Refused] 0.9% ‐ ‐ ‐MEAN 2.4 2.5 2.4 2.5 MEDIAN 2.0 2.0 2.0 2.0
4_5. Responsive/Proactive to unique situations - How would you rate your local public school district in "Responsive/Proactive to unique situations"?
National Current &
Former Parents
Current Parents
Former Parents
TOTAL ANSWERING 1000 524 286 238 UNWEIGHTED BASE 1000 544 269 275 NET: EXCELLENT/VERY GOOD 48.7% 51.8% 56.2% 46.5% Excellent 14.8% 17.0% 19.3% 14.2% Good 34.0% 34.8% 36.9% 32.3% NET: FAIR/POOR 39.6% 40.5% 40.3% 40.8% Fair 25.7% 27.2% 27.8% 26.5% Poor 13.9% 13.3% 12.5% 14.3% [DK] 10.8% 7.7% 3.6% 12.7% [Refused] 0.9% ‐ ‐ ‐MEAN 2.4 2.4 2.3 2.5 MEDIAN 2.0 2.0 2.0 2.0
[AT THIS POINT, IF Q3 = 2, 4, 5, 6, THEN SKIP TO Q13] 5. [ASK IF Q3 = 1, 3] For how many years have you had any children attend a REGULAR PUBLIC SCHOOL (also PUBLIC DISTRICT SCHOOL) anytime from Kindergarten

through High School? If your family has no experience with a REGULAR PUBLIC SCHOOL, you can say “none” or “never.”
National Current &
Former Parents
Current Parents
Former Parents
TOTAL ANSWERING 524 524 286 238 UNWEIGHTED BASE 544 544 269 275 None/Never 6.5% 6.5% 6.9% 6.2% Less than 1 school year 2.7% 2.7% 4.5% 0.4% 1 2 years ‐ 8.2% 8.2% 14.0% 1.3% 3 5 years ‐ 9.6% 9.6% 16.3% 1.5% More than 5 years 69.0% 69.0% 55.0% 85.9% [DK] 3.6% 3.6% 2.7% 4.6% [Refused] 0.4% 0.4% 0.7% 0.1% MEAN 10.8 10.8 7.3 15.1 MEDIAN 11.0 11.0 6.0 13.0
6. [ASK IF Q5 = 2/3/4/5] To what extent are you satisfied or dissatisfied with your child’s REGULAR PUBLIC SCHOOL (also PUBLIC DISTRICT SCHOOL) experience?
National Current &
Former Parents
Current Parents
Former Parents
TOTAL ANSWERING 469 469 256 212 UNWEIGHTED BASE 485 485 243 242 NET: SATISFIED 72.8% 72.8% 72.9% 72.7% Very Satisfied 29.2% 29.2% 27.2% 31.7% Somewhat Satisfied 43.6% 43.6% 45.6% 41.0% NET: DISSATISFIED 25.3% 25.3% 25.6% 24.9% Somewhat Dissatisfied 17.1% 17.1% 16.7% 17.6% Very Dissatisfied 8.2% 8.2% 9.0% 7.4% [DK] 1.6% 1.6% 1.5% 1.7% [Refused] 0.3% 0.3% ‐ 0.7% MEAN 2.0 2.0 2.1 2.0 MEDIAN 2.0 2.0 2.0 2.0

7. [ASK IF Q3 = 1, 3] For how many years have you had any children attend a CHARTER SCHOOL anytime from Kindergarten through High School? If your family has no experience with a CHARTER SCHOOL, you can say “none” or “never.” [] [OPEN END. RECORD NUMBER. THEN LATER, BASED ON RESPONSE SELECT ONE OF THE FOLLOWING CATEGORIES, COMPUTE MEDIAN.] [IF NEEDED/REQUESTED, DEFINITION OF “CHARTER SCHOOL”: “Charter schools are public schools that have more control over their own budget, staff, and curriculum, and are exempt from many existing public school regulations.”]
National Current &
Former Parents
Current Parents
Former Parents
TOTAL ANSWERING 524 524 286 238 UNWEIGHTED BASE 544 544 269 275 None/Never 87.1% 87.1% 82.2% 92.9% Less than 1 school year 1.3% 1.3% 1.8% 0.6% 1 2 years ‐ 3.7% 3.7% 4.6% 2.6% 3 5 years ‐ 4.0% 4.0% 6.6% 0.9% More than 5 years 3.2% 3.2% 4.4% 1.7% [DK] 0.5% 0.5% 0.3% 0.7% [Refused] 0.2% 0.2% ‐ 0.5% MEAN 0.5 0.5 0.7 0.2 MEDIAN 0.0 0.0 0.0 0.0
8. [ASK IF Q7 = 2/3/4/5] To what extent are you satisfied or dissatisfied with your child’s CHARTER SCHOOL experience? [READ LIST]
National Current &
Former Parents
Current Parents
Former Parents
TOTAL ANSWERING 64 64 50 14 UNWEIGHTED BASE 59 59 45 14 NET: SATISFIED 75.1% 75.1% 72.5% 84.2% Very Satisfied 44.5% 44.5% 41.5% 55.2% Somewhat Satisfied 30.6% 30.6% 31.0% 28.9% NET: DISSATISFIED 22.6% 22.6% 27.5% 5.3% Somewhat Dissatisfied 8.2% 8.2% 9.0% 5.3% Very Dissatisfied 14.5% 14.5% 18.5% ‐[DK] 2.3% 2.3% ‐ 10.5% [Refused] ‐ ‐ ‐ ‐

MEAN 1.9 1.9 2.0 1.4 MEDIAN 2.0 2.0 2.0 1.0
9. [ASK IF Q3 = 1, 3] For how many years have you had any children attend a PRIVATE RELIGIOUS or NON-RELIGIOUS SCHOOL anytime from Kindergarten through High School? If your family has no experience with a PRIVATE SCHOOL, you can say “none” or “never.” [OPEN END. RECORD NUMBER. THEN LATER, BASED ON RESPONSE SELECT ONE OF THE FOLLOWING CATEGORIES, COMPUTE MEDIAN.]
National Current &
Former Parents
Current Parents
Former Parents
TOTAL ANSWERING 524 524 286 238 UNWEIGHTED BASE 544 544 269 275 None/Never 78.0% 78.0% 81.4% 73.9% Less than 1 school year 0.9% 0.9% 1.1% 0.6% 1 2 years ‐ 4.9% 4.9% 5.9% 3.7% 3 5 years ‐ 4.2% 4.2% 3.1% 5.5% More than 5 years 11.1% 11.1% 8.3% 14.5% [DK] 0.5% 0.5% 0.3% 0.7% [Refused] 0.5% 0.5% ‐ 1.0% MEAN 1.4 1.4 1.1 1.8 MEDIAN 0.0 0.0 0.0 0.0
10. [ASK IF Q9 = 2/3/4/5] To what extent are you satisfied or dissatisfied with your child’s PRIVATE RELIGIOUS or NON-RELIGIOUS SCHOOL experience? [READ LIST]
National Current &
Former Parents
Current Parents
Former Parents
TOTAL ANSWERING 110 110 52 58 UNWEIGHTED BASE 122 122 50 72 NET: SATISFIED 92.9% 92.9% 91.3% 94.3% Very Satisfied 57.9% 57.9% 53.0% 62.4% Somewhat Satisfied 34.9% 34.9% 38.2% 32.0% NET: DISSATISFIED 6.6% 6.6% 8.7% 4.7% Somewhat Dissatisfied 4.9% 4.9% 6.2% 3.8%

Very Dissatisfied 1.6% 1.6% 2.5% 0.8% [DK] ‐ ‐ ‐ ‐[Refused] 0.5% 0.5% ‐ 1.0% MEAN 1.5 1.5 1.6 1.4 MEDIAN 1.0 1.0 1.0 1.0
11. [ASK IF Q3 = 1, 3] For how many years have you HOMESCHOOLED at least one of your children a child anytime from Kindergarten through High School? If your family has no experience with HOMESCHOOLING, you can say “none” or “never.” [OPEN END. RECORD NUMBER. THEN LATER, BASED ON RESPONSE SELECT ONE OF THE FOLLOWING CATEGORIES, COMPUTE MEDIAN.]
National Current &
Former Parents
Current Parents
Former Parents
TOTAL ANSWERING 524 524 286 238 UNWEIGHTED BASE 544 544 269 275 None/Never 89.8% 89.8% 86.7% 93.4% Less than 1 school year 1.0% 1.0% 1.0% 1.0% 1 2 years ‐ 5.4% 5.4% 6.9% 3.5% 3 5 years ‐ 1.8% 1.8% 2.9% 0.6% More than 5 years 0.9% 0.9% 0.8% 1.0% [DK] 0.5% 0.5% 0.5% 0.5% [Refused] 0.6% 0.6% 1.1% ‐MEAN 0.2 0.2 0.2 0.2 MEDIAN 0.0 0.0 0.0 0.0
12. [ASK IF Q11 = 2/3/4/5] To what extent are you satisfied or dissatisfied with your child’s HOMESCHOOL experience? [READ LIST]
National Current &
Former Parents
Current Parents
Former Parents
TOTAL ANSWERING 48 48 33 14 UNWEIGHTED BASE 47 47 32 15 NET: SATISFIED 89.5% 89.5% 90.2% 87.9% Very Satisfied 53.6% 53.6% 44.7% 74.1% Somewhat Satisfied 36.0% 36.0% 45.5% 13.8% NET: DISSATISFIED 10.5% 10.5% 9.8% 12.1%

Somewhat Dissatisfied 3.4% 3.4% 2.8% 4.7% Very Dissatisfied 7.1% 7.1% 6.9% 7.3% [DK] ‐ ‐ ‐ ‐[Refused] ‐ ‐ ‐ ‐MEAN 1.6 1.6 1.7 1.5 MEDIAN 1.0 1.0 2.0 1.0
[RETURN TO ‘ASK ALL’ STARTING HERE…] 13. How much do you think is spent per year on each student in our country’s public schools? Your estimate of the national average–to the nearest thousand dollars–will represent the combined expenditures of local, state, and federal governments. [OPEN END. RECORD NUMBER. THEN LATER, BASED ON RESPONSE SELECT ONE OF THE FOLLOWING CATEGORIES]
National Current &
Former Parents
Current Parents
Former Parents
TOTAL ANSWERING 1000 524 286 238 UNWEIGHTED BASE 1000 544 269 275 $4,000 or Less 31.2% 29.9% 39.5% 18.4% $4,001 $8,000 ‐ 14.1% 15.5% 11.6% 20.0% $8,001 $12,000 ‐ 10.7% 10.6% 10.5% 10.7% $12,001 $16,000 ‐ 4.4% 5.3% 4.9% 5.9% Over $16,000 10.6% 9.9% 10.8% 8.8% [DK] 28.6% 28.9% 22.6% 36.3% [Refused] 0.3% ‐ ‐ ‐
14-1. Split C. Do you believe that public school funding in the United States is at a level that is: [READ]
National Current &
Former Parents
Current Parents
Former Parents
UNWEIGHTED BASE 500 264 133 131 Too High 10.9% 12.6% 13.1% 12.0% Too Low 54.3% 56.4% 58.6% 53.6% About Right 27.7% 26.1% 24.3% 28.4%

[DK] 7.0% 4.6% 4.0% 5.4% [Refused] 0.1% 0.2% ‐ 0.5%
14-2. Split D. According to the most recent information available, on average $11,392 is being spent per year on each student attending public schools in the United States. Do you believe that public school funding in our country is at a level that is: [READ]
National Current &
Former Parents
Current Parents
Former Parents
UNWEIGHTED BASE 500 280 136 144 Too High 18.9% 20.9% 21.6% 20.2% Too Low 38.2% 39.1% 38.1% 40.3% About Right 32.2% 31.8% 35.4% 27.7% [DK] 10.2% 7.7% 4.9% 10.7% [Refused] 0.4% 0.5% ‐ 1.1%
14-COM. Do you believe that public school funding in the United States is at a level that is: [READ] According to the most recent information available, on average $11,392 is being spent per year on each student attending public schools in the United States. Do you believe that public school funding in our country is at a level that is:
National Current &
Former Parents
Current Parents
Former Parents
TOTAL ANSWERING 1000 524 286 238 UNWEIGHTED BASE 1000 544 269 275 Too High 14.9% 16.9% 17.3% 16.4% Too Low 46.3% 47.5% 48.4% 46.5% About Right 30.0% 29.0% 29.9% 28.0% [DK] 8.6% 6.2% 4.4% 8.2% [Refused] 0.3% 0.4% ‐ 0.8%
15. In thinking about the schools in your area, what grade would you give: [GRADE OPTIONS: A, B, C, D, F, (Does Not Apply), or (DK)] 15_1. Regular Public Schools [or Public District Schools] - In thinking about the schools in your area, what grade would you give:

National Current &
Former Parents
Current Parents
Former Parents
TOTAL ANSWERING 1000 524 286 238 UNWEIGHTED BASE 1000 544 269 275 A 15.5% 15.5% 17.8% 12.8% B 29.2% 31.2% 28.7% 34.2% C 27.1% 26.1% 24.2% 28.4% D 12.9% 12.5% 15.1% 9.5% F 7.3% 7.6% 7.2% 8.1% [Does Not Apply] 1.6% 2.1% 2.0% 2.3% [DK] 6.4% 4.9% 5.1% 4.6%
15_2. Charter Schools [or Public Charter Schools] - In thinking about the schools in your area, what grade would you give:
National Current &
Former Parents
Current Parents
Former Parents
TOTAL ANSWERING 1000 524 286 238 UNWEIGHTED BASE 1000 544 269 275 A 14.1% 13.3% 15.5% 10.7% B 26.8% 23.3% 25.8% 20.2% C 18.0% 18.0% 19.8% 15.9% D 5.3% 4.8% 6.9% 2.2% F 4.9% 4.1% 3.7% 4.6% [Does Not Apply] 8.7% 11.7% 11.6% 11.9% [DK] 22.1% 24.8% 16.8% 34.5%
15_3. Private Schools [or Independent Schools, Parochial Schools, Religious Schools] - In thinking about the schools in your area, what grade would you give:
National Current &
Former Parents
Current Parents
Former Parents
TOTAL ANSWERING 1000 524 286 238 UNWEIGHTED BASE 1000 544 269 275 A 29.1% 30.4% 31.9% 28.5%

B 28.3% 25.6% 25.5% 25.8% C 14.1% 13.0% 13.6% 12.3% D 2.9% 3.1% 4.7% 1.3% F 2.4% 1.9% 1.8% 2.1% [Does Not Apply] 5.5% 7.6% 8.1% 7.0% [DK] 17.7% 18.4% 14.4% 23.1%
16-1. Split E. If it were your decision and you could select any type of school, what type of school would you select in order to obtain the best education for your child? [READ LIST]
National Current &
Former Parents
Current Parents
Former Parents
UNWEIGHTED BASE 500 256 124 132 Charter School [or Public Charter School] 16.3% 17.9% 15.2% 20.7%
Home School 10.0% 9.6% 8.3% 11.1% Private School [or Independent School, Parochial School, Religious School]
35.1% 36.4% 39.1% 33.5%
Regular Public School [or Public District School] 33.6% 33.4% 35.9% 30.6%
[DK] 4.9% 2.4% 0.7% 4.1% [Refused] 0.2% 0.3% 0.6% ‐
16-2. Split F. If it were your decision and you could select any type of school, and financial costs and transportation were of no concern, what type of school would you select in order to obtain the best education for your child? [READ LIST]
National Current &
Former Parents
Current Parents
Former Parents
UNWEIGHTED BASE 500 288 145 143 Charter School [or Public Charter School] 12.9% 12.6% 15.1% 9.4%
Home School 8.6% 5.2% 6.0% 4.2% Private School [or Independent School, Parochial School, Religious School]
42.0% 46.2% 45.6% 46.9%

Regular Public School [or Public District School] 29.1% 32.1% 31.2% 33.3%
[DK] 7.2% 3.6% 1.7% 6.1% [Refused] 0.1% 0.2% 0.4% ‐
16-COM. If it were your decision and you could select any type of school, what type of school would you select in order to obtain the best education for your child? If it were your decision and you could select any type of school, and financial costs and transportation were of no concern, what type of school would you select in order to obtain the best education for your child?
National Current &
Former Parents
Current Parents
Former Parents
TOTAL ANSWERING 1000 524 286 238 UNWEIGHTED BASE 1000 544 269 275 Charter School [or Public Charter School] 14.6% 15.1% 15.2% 15.0%
Home School 9.3% 7.3% 7.0% 7.6% Private School [or Independent School, Parochial School, Religious School]
38.5% 41.7% 42.8% 40.3%
Regular Public School [or Public District School] 31.4% 32.7% 33.3% 32.0%
[DK] 6.0% 3.0% 1.3% 5.1% [Refused] 0.1% 0.3% 0.5% ‐
17. What is the most important characteristic or attribute that would cause you to choose a [INSERT SCHOOL TYPE FROM Q16] for your child? Please use one word, or a very short phrase. [OPEN END, and CODE] “For the remainder of this interview, if you are completely unsure about your answer or have no feelings for an answer, feel free to say “I Don’t Know”.” [ENTER AS “DK”] 17_1. What is the most important characteristic or attribute that would cause you to choose a [INSERT SCHOOL TYPE FROM Q16] for your child? Please use one word, or a very short phrase.
National Current & Former
Current Parents
Former Parents

Parents UNWEIGHTED BASE 135 72 38 34 Individual attention/One ‐ on‐One/Customized 19.0% 21.0% 12.1% 31.8%
Better education/Quality 13.5% 9.4% 6.4% 13.1% Academics/Curriculum/ Courses (i.e. math, arts, etc.) 8.2% 10.3% 3.5% 18.6%
Class size/Student Teacher ratio ‐ 7.8% 10.0% 14.1% 4.9% Teachers/Better Teachers/ More professional 5.4% 2.8% 2.2% 3.5%
School Resources/Funding 4.8% 3.0% 2.5% 3.5% Against Government involvement/less government/more private control
4.2% 3.7% 1.9% 5.9%
Out comes/Results ‐ (i.e. graduation, college prep, success ‐rate)
2.8% 3.8% 4.8% 2.6%
Opportunities/Choices 2.7% 5.0% 4.3% 5.8% Quality/Good/Excellent 2.6% 4.8% 4.3% 5.4% Discipline/Structure/ Consistency 2.6% 2.1% 3.9% ‐Cost/Tuition/ Affordability 2.4% 4.5% 8.2% ‐Negative mentions of Public schools 2.1% 1.1% 2.0% ‐Safety/Less drugs/ Violence/Bullying 1.9% 2.0% ‐ 4.5%
More Challenging/High standards/Integrity 1.7% ‐ ‐ ‐Extracurricular activities/After‐school programs 1.5% 2.8% 5.1% ‐Special Ed classes 1.4% 2.6% 4.7% ‐Care about students 1.1% ‐ ‐ ‐Reputation 1.0% 0.9% 1.7% ‐Accountability/ Responsibility 1.0% 0.9% ‐ 1.9% Parental Involvement 0.9% 1.1% ‐ 2.4% Variety 0.8% 1.4% 2.6% ‐Prefer/Positive mentions of Charter schools 0.6% 1.1% 2.0% ‐Socialization/Social/ Peers/Other kids/students 0.5% ‐ ‐ ‐Fewer political influences 0.3% ‐ ‐ ‐No/None/Nothing 0.8% ‐ ‐ ‐Other 8.0% 10.3% 15.9% 3.4% Don't know/Refused 5.8% 1.0% 1.9% ‐

17_2. What is the most important characteristic or attribute that would cause you to choose a [INSERT SCHOOL TYPE FROM Q16] for your child? Please use one word, or a very short phrase.
National Current &
Former Parents
Current Parents
Former Parents
UNWEIGHTED BASE 88 35 18 17 Safety/Less drugs/ Violence/Bullying 20.8% 14.0% 20.4% 6.9%
Better education/Quality 13.8% 13.0% ‐ 27.2% Parental Involvement 6.7% 2.2% ‐ 4.7% Individual attention/One ‐ on‐One/Customized 5.6% 8.2% 3.6% 13.4%
Discipline/Structure/ Consistency 5.1% 5.7% ‐ 12.0% Academics/Curriculum/ Courses (i.e. math, arts, etc.) 4.2% 4.7% 8.9% ‐Negative mentions of Public schools 3.7% 4.9% 4.6% 5.1%
More of a "Real life" environment 3.0% 3.2% ‐ 6.7% Socialization/Social/ Peers/Other kids/students 2.7% ‐ ‐ ‐Fewer political influences 2.4% ‐ ‐ ‐Prefer/positive mentions of home schooling 2.2% 2.4% ‐ 5.1%
Quality/Good/Excellent 2.1% 5.2% 7.4% 2.8% Environment/Culture/ Community 2.0% ‐ ‐ ‐Teachers/Better Teachers/ More professional 2.0% ‐ ‐ ‐Class size/Student Teacher ratio ‐ 1.7% 4.3% ‐ 9.0% Freedom/Flexibility 1.7% ‐ ‐ ‐Opportunities/Choices 1.5% ‐ ‐ ‐Accountability/ Responsibility 1.4% 3.5% 6.7% ‐Morals/Values/Ethics 1.2% 1.8% 3.4% ‐Special Ed classes 1.1% 2.7% 5.2% ‐Convenience 1.1% 2.6% 5.0% ‐More Challenging/High standards/Integrity 0.9% ‐ ‐ ‐Extracurricular activities/After‐school programs 0.9% 2.1% 4.0% ‐

Against Government involvement/less government/more private control
0.7% 1.6% 3.1% ‐
Religion/Religious reasons/Parochial 0.6% ‐ ‐ ‐Someone I know/I have attended or worked at that school 0.4% ‐ ‐ ‐No/None/Nothing 2.5% ‐ ‐ ‐Other 16.8% 26.2% 30.8% 21.2%
17_3. What is the most important characteristic or attribute that would cause you to choose a [INSERT SCHOOL TYPE FROM Q16] for your child? Please use one word, or a very short phrase.
National Current &
Former Parents
Current Parents
Former Parents
UNWEIGHTED BASE 390 233 117 116 Individual attention/One ‐ on‐One/Customized 17.6% 20.1% 22.1% 17.6%
Class size/Student Teacher ratio ‐ 14.9% 13.0% 12.7% 13.4% Better education/Quality 13.1% 12.3% 10.5% 14.6% Discipline/Structure/ Consistency 9.1% 10.8% 9.5% 12.5% Religion/Religious reasons/Parochial 6.3% 6.6% 7.7% 5.2%
Teachers/Better Teachers/ More professional 6.2% 6.6% 6.3% 6.9%
Morals/Values/Ethics 4.2% 5.0% 3.8% 6.6% Out comes/Results ‐ (i.e. graduation, college prep, success ‐rate)
3.8% 3.4% 3.7% 3.0%
School Resources/Funding 3.5% 2.9% 5.1% ‐Safety/Less drugs/ Violence/Bullying 3.2% 2.9% 2.8% 3.1%
Academics/Curriculum/ Courses (i.e. math, arts, etc.) 2.8% 2.0% 1.7% 2.5%
Someone I know/I have attended or worked at that school 2.7% 2.6% 3.0% 2.1%
More Challenging/High standards/Integrity 2.6% 2.3% 3.0% 1.4%
Care about students 1.9% 2.2% 2.5% 1.7% Quality/Good/Excellent 1.7% 2.3% 3.7% 0.4%

Prefer/positive mentions of private/religious schools 1.5% 0.5% 0.4% 0.8%
Environment/Culture/ Community 1.4% 0.9% 1.6% ‐Reputation 1.4% 1.5% 2.2% 0.6% Against Government involvement/less government/more private control
1.4% 1.8% 3.2% ‐
Extracurricular activities/After‐school programs 1.3% 0.9% 1.6% ‐Negative mentions of Public schools 1.1% 0.7% ‐ 1.7%
Cost/Tuition/ Affordability 1.0% 0.4% 0.7% ‐Opportunities/Choices 0.7% 1.3% 1.1% 1.5% Parental Involvement 0.6% 0.3% 0.6% ‐More of a "Real life" environment 0.6% ‐ ‐ ‐Special Ed classes 0.6% ‐ ‐ ‐Accountability/ Responsibility 0.2% 0.4% 0.8% ‐Fewer political influences 0.2% 0.4% ‐ 0.9% Socialization/Social/ Peers/Other kids/students 0.2% 0.4% 0.6% ‐Variety 0.1% 0.2% ‐ 0.6% Freedom/Flexibility 0.1% 0.2% ‐ 0.5% No/None/Nothing 1.0% 0.9% 0.6% 1.3% Other 7.4% 7.9% 6.6% 9.5% Don't know/Refused 1.5% ‐ ‐ ‐
17_4. What is the most important characteristic or attribute that would cause you to choose a [INSERT SCHOOL TYPE FROM Q16] for your child? Please use one word, or a very short phrase.
National Current &
Former Parents
Current Parents
Former Parents
UNWEIGHTED BASE 322 183 89 94 Socialization/Social/ Peers/Other kids/students 16.4% 14.8% 17.8% 11.1%
Diversity 11.3% 15.9% 13.3% 19.1% Teachers/Better Teachers/ More professional 10.0% 10.7% 10.7% 10.7%
Better education/Quality 8.1% 6.7% 6.6% 6.7% Cost/Tuition/ Affordability 4.7% 5.9% 2.0% 10.6%

Prefer/Positive mentions of Public schools 4.0% 5.1% 2.1% 8.7%
Someone I know/I have attended or worked at that school 3.2% 2.9% 4.3% 1.2%
More of a "Real life" environment 2.9% 3.4% 2.3% 4.7% Quality/Good/Excellent 2.9% 4.3% 5.6% 2.8% Care about students 2.3% 3.9% 5.3% 2.2% Academics/Curriculum/ Courses (i.e. math, arts, etc.) 2.2% 2.3% 1.6% 3.1%
Convenience 1.8% 2.6% 3.0% 2.2% Discipline/Structure/ Consistency 1.7% 2.2% 3.0% 1.2% Individual attention/One ‐ on‐One/Customized 1.6% 2.4% 3.8% 0.6%
Environment/Culture/ Community 1.5% 1.9% 2.7% 0.8%
Extracurricular activities/After‐school programs 1.4% 0.9% 1.6% ‐Reputation 1.4% 0.4% 0.8% ‐School Resources/Funding 1.2% 1.1% 2.0% ‐Class size/Student Teacher ratio ‐ 1.1% 1.6% 2.8% ‐Out comes/Results ‐ (i.e. graduation, college prep, success ‐rate)
1.1% 2.0% 2.8% 1.0%
Accountability/ Responsibility 1.1% 1.4% 1.2% 1.6% More Challenging/High standards/Integrity 1.0% 0.8% 1.5% ‐Variety 0.8% 0.8% 1.0% 0.6% Morals/Values/Ethics 0.8% 0.9% 1.5% ‐Opportunities/Choices 0.7% 0.8% ‐ 1.8% Safety/Less drugs/ Violence/Bullying 0.7% 0.8% 0.4% 1.3%
Religion/Religious reasons/Parochial 0.4% ‐ ‐ ‐Negative mentions of Charter schools 0.3% ‐ ‐ ‐Parental Involvement 0.3% ‐ ‐ ‐Special Ed classes 0.3% 0.3% 0.5% ‐Freedom/Flexibility 0.2% ‐ ‐ ‐Negative mentions of Public schools 0.2% 0.4% 0.7% ‐Fewer political influences 0.2% 0.4% ‐ 0.9% Faculty/Staff/ Administration/ More professional ("Teacher" not mention)
0.2% ‐ ‐ ‐

No/None/Nothing 2.5% 1.7% 2.6% 0.6% Other 12.0% 10.1% 9.6% 10.9% Don't know/Refused 6.0% 2.3% 2.8% 1.6%
17. What is the most important characteristic or attribute that would cause you to choose a [INSERT SCHOOL TYPE FROM Q16] for your child? Please use one word, or a very short phrase.
National Current &
Former Parents
Current Parents
Former Parents
TOTAL ANSWERING 938 507 281 226 UNWEIGHTED BASE 935 523 262 261 Better education/Quality 11.6% 10.0% 7.8% 12.7% Individual attention/One ‐ on‐One/Customized 11.3% 13.3% 13.0% 13.7%
Class size/Student Teacher ratio ‐ 7.9% 8.0% 8.6% 7.2% Teachers/Better Teachers/ More professional 6.9% 6.9% 6.7% 7.1%
Socialization/Social/ Peers/Other kids/students 5.9% 5.2% 6.3% 3.7%
Discipline/Structure/ Consistency 5.2% 6.2% 5.7% 6.7% Safety/Less drugs/ Violence/Bullying 3.9% 2.9% 2.8% 3.0%
Diversity 3.8% 5.4% 4.5% 6.4% Academics/Curriculum/ Courses (i.e. math, arts, etc.) 3.6% 3.6% 2.5% 5.0%
Religion/Religious reasons/Parochial 2.8% 2.8% 3.3% 2.2%
School Resources/Funding 2.6% 2.1% 3.3% 0.6% Cost/Tuition/ Affordability 2.4% 2.8% 2.3% 3.6% Out comes/Results ‐ (i.e. graduation, college prep, success ‐rate)
2.4% 2.7% 3.3% 2.0%
Quality/Good/Excellent 2.3% 3.6% 4.7% 2.2% Someone I know/I have attended or worked at that school 2.2% 2.1% 2.8% 1.3%
Morals/Values/Ethics 2.1% 2.6% 2.4% 2.8% More Challenging/High standards/Integrity 1.7% 1.3% 1.8% 0.6%
Care about students 1.7% 2.3% 2.9% 1.5% More of a "Real life" environment 1.5% 1.4% 0.8% 2.1%

Extracurricular activities/After‐school programs 1.3% 1.3% 2.3% ‐Prefer/Positive mentions of Public schools 1.3% 1.7% 0.7% 2.9%
Environment/Culture/ Community 1.3% 1.0% 1.6% 0.3%
Against Government involvement/less government/more private control
1.3% 1.5% 1.9% 0.9%
Negative mentions of Public schools 1.2% 1.0% 0.9% 1.1%
Reputation 1.2% 0.9% 1.5% 0.3% Parental Involvement 1.2% 0.5% 0.3% 0.8% Opportunities/Choices 1.1% 1.6% 1.1% 2.1% Accountability/ Responsibility 0.8% 1.1% 1.2% 0.8% Convenience 0.7% 1.1% 1.4% 0.7% Special Ed classes 0.7% 0.7% 1.3% ‐Prefer/positive mentions of private/religious schools 0.6% 0.2% 0.2% 0.3%
Variety 0.5% 0.6% 0.7% 0.4% Fewer political influences 0.5% 0.3% ‐ 0.7% Freedom/Flexibility 0.3% 0.1% ‐ 0.2% Prefer/positive mentions of home schooling 0.2% 0.2% ‐ 0.4%
Negative mentions of Charter schools 0.1% ‐ ‐ ‐Prefer/Positive mentions of Charter schools 0.1% 0.2% 0.3% ‐Faculty/Staff/ Administration/ More professional ("Teacher" not mention)
0.1% ‐ ‐ ‐
No/None/Nothing 1.6% 1.0% 1.1% 0.7% Other 9.9% 10.4% 10.8% 9.9% Don't know/Refused 3.5% 0.9% 1.2% 0.5%
18. Based on what you know, or have heard from others… In general, do you favor or oppose “charter schools”? [PROBE:] Would you say strongly or somewhat favor/oppose?
National Current &
Former Parents
Current Parents
Former Parents
TOTAL ANSWERING 1000 524 286 238

UNWEIGHTED BASE 1000 544 269 275 NET: FAVOR 50.0% 49.9% 50.5% 49.1% Strongly Favor 17.4% 18.3% 15.8% 21.3% Somewhat Favor 32.6% 31.6% 34.8% 27.9% NET: OPPOSE 24.4% 24.6% 26.9% 21.8% Somewhat Oppose 14.6% 14.4% 16.1% 12.2% Strongly Oppose 9.8% 10.2% 10.8% 9.6% [Never Heard of Charter Schools, or DK] 23.3% 23.8% 20.3% 27.9%
[Refused] 2.2% 1.7% 2.2% 1.1% MEAN 2.2 2.2 2.3 2.1 MEDIAN 2.0 2.0 2.0 2.0
19. Charter schools are public schools that have more control over their own budget, staff, and curriculum, and are exempt from many existing public school regulations. In general, do you favor or oppose public charter schools? [PROBE:] Would you say strongly or somewhat favor/oppose?
National Current &
Former Parents
Current Parents
Former Parents
TOTAL ANSWERING 1000 524 286 238 UNWEIGHTED BASE 1000 544 269 275 NET: FAVOR 60.8% 60.4% 61.6% 58.9% Strongly Favor 21.2% 21.7% 20.7% 22.9% Somewhat Favor 39.6% 38.7% 40.9% 36.1% NET: OPPOSE 28.8% 28.3% 29.3% 27.0% Somewhat Oppose 18.3% 17.3% 18.7% 15.6% Strongly Oppose 10.5% 11.0% 10.6% 11.4% [DK] 9.9% 11.0% 8.7% 13.7% [Refused] 0.5% 0.3% 0.3% 0.3% MEAN 2.2 2.2 2.2 2.2 MEDIAN 2.0 2.0 2.0 2.0
20. Based on what you know, or have heard from others … In general, do you favor or oppose “school vouchers”? [PROBE:] Would you say strongly or somewhat favor/oppose? [ALLOW “DK” OR “REFUSE” ON FIRST RESPONSE]
National Current & Current Former

Former Parents
Parents Parents
TOTAL ANSWERING 1000 524 286 238 UNWEIGHTED BASE 1000 544 269 275 NET: FAVOR 37.1% 40.8% 42.3% 39.1% Strongly Favor 17.9% 19.9% 18.6% 21.6% Somewhat Favor 19.2% 20.9% 23.8% 17.5% NET: OPPOSE 23.8% 24.2% 21.1% 27.9% Somewhat Oppose 12.3% 11.9% 9.9% 14.2% Strongly Oppose 11.5% 12.3% 11.2% 13.7% [Never Heard of School Vouchers, or DK] 37.4% 33.9% 35.0% 32.6%
[Refused] 1.8% 1.1% 1.7% 0.4% MEAN 2.3 2.3 2.2 2.3 MEDIAN 2.0 2.0 2.0 2.0
21. A school voucher system allows parents the option of sending their child to the school of their choice, whether that school is public or private, including both religious and non-religious schools. If this policy were adopted, tax dollars currently allocated to a school district would be allocated to parents in the form of a “school voucher” to pay partial or full tuition for the child’s school. In general, do you favor or oppose a school voucher system? [PROBE:] Would you say strongly or somewhat favor/oppose?
National Current &
Former Parents
Current Parents
Former Parents
TOTAL ANSWERING 1000 524 286 238 UNWEIGHTED BASE 1000 544 269 275 NET: FAVOR 61.8% 61.2% 63.5% 58.5% Strongly Favor 28.4% 28.9% 30.4% 27.2% Somewhat Favor 33.3% 32.3% 33.1% 31.4% NET: OPPOSE 31.3% 33.6% 32.2% 35.4% Somewhat Oppose 13.7% 11.1% 11.5% 10.7% Strongly Oppose 17.6% 22.5% 20.7% 24.7% [DK] 6.3% 4.5% 3.6% 5.6% [Refused] 0.7% 0.6% 0.7% 0.4% MEAN 2.2 2.3 2.2 2.4 MEDIAN 2.0 2.0 2.0 2.0

22. Based on what you know, or have heard from others… In general, do you favor or oppose “education savings accounts” in K–12 education? [PROBE:] Would you say strongly or somewhat favor/oppose? [ALLOW “DK” OR “REFUSE” ON FIRST RESPONSE]
National Current &
Former Parents
Current Parents
Former Parents
TOTAL ANSWERING 1000 524 286 238 UNWEIGHTED BASE 1000 544 269 275 NET: FAVOR 44.7% 43.2% 49.9% 35.2% Strongly Favor 20.4% 19.8% 21.7% 17.4% Somewhat Favor 24.3% 23.4% 28.1% 17.9% NET: OPPOSE 12.1% 13.2% 10.3% 16.5% Somewhat Oppose 6.3% 6.6% 6.4% 6.8% Strongly Oppose 5.8% 6.6% 4.0% 9.8% [Never Heard of Education Savings Accounts, or DK] 41.2% 41.6% 36.6% 47.7%
[Refused] 2.0% 2.0% 3.2% 0.5% MEAN 2.0 2.0 1.9 2.2 MEDIAN 2.0 2.0 2.0 2.0
23. An "education savings account" in K–12 education – often called an ESA – establishes for parents a government-authorized savings account with restricted, but multiple uses for educational purposes. Parents can then use these funds to pay for: school tuition; tutoring; online education programs; therapies for students with special needs; textbooks or other instructional materials; or save for future college expenses. In general, do you favor or oppose an ESA system? [PROBE:] Would you say strongly or somewhat favor/oppose?
National Current &
Former Parents
Current Parents
Former Parents
TOTAL ANSWERING 1000 524 286 238 UNWEIGHTED BASE 1000 544 269 275 NET: FAVOR 71.1% 72.0% 74.0% 69.5% Strongly Favor 32.5% 33.5% 36.3% 30.1% Somewhat Favor 38.6% 38.5% 37.8% 39.4% NET: OPPOSE 18.9% 19.1% 20.0% 18.1% Somewhat Oppose 10.8% 10.8% 12.8% 8.3% Strongly Oppose 8.1% 8.4% 7.2% 9.8%

[DK] 9.5% 8.6% 6.0% 11.6% [Refused] 0.5% 0.3% ‐ 0.8% MEAN 1.9 1.9 1.9 2.0 MEDIAN 2.0 2.0 2.0 2.0
24. [If Q23 = “Strongly Favor” or “Somewhat Favor”] What is the most important reason you say you favor ESAs? Is your main reason that such a system provides: [READ LIST]
National Current &
Former Parents
Current Parents
Former Parents
TOTAL ANSWERING 710 377 211 166 UNWEIGHTED BASE 700 386 202 184 Access to Religious Instruction 3.6% 4.5% 5.1% 3.7% Access to Safer Learning Environment 11.2% 9.1% 9.1% 9.2%
Access to Better Academic Environment 31.7% 29.0% 32.1% 25.1%
Focus on More Individual Attention 19.8% 21.4% 21.2% 21.6%
More Freedom and Flexibility for Parents 27.2% 31.7% 26.3% 38.4%
[Something Else/Other] 3.0% 2.0% 2.7% 1.1% [DK] 2.7% 1.5% 2.4% 0.4% [Refused] 0.8% 0.9% 1.2% 0.5%
[IF NEEDED/REQUESTED, REMINDER DEFINITION OF “ESA”: An ESA establishes for parents a government-authorized savings account with restricted, but multiple uses for educational purposes. Parents can then use these funds to pay for: school tuition; tutoring; online education programs; therapies for students with special needs; textbooks or other instructional materials; or save for future college expenses.] 25. [If Q23 = “Strongly Oppose” or “Somewhat Oppose”] What is the most important reason you say you oppose ESAs? Is your main reason that such a system would: [READ LIST]
National Current &
Former Parents
Current Parents
Former Parents
TOTAL ANSWERING 189 100 57 43 UNWEIGHTED BASE 192 103 49 54 Benefit Unaccountable Private Education Providers 13.2% 12.6% 16.1% 7.9%
Cause Fraudulent Behavior 19.1% 16.8% 14.1% 20.3% Cause Student Transportation Problems 6.7% 3.9% 5.8% 1.4%
Divert Funding Away from Public Schools 33.0% 34.3% 33.4% 35.5%
Send Funding to Religious Education Providers 7.6% 8.3% 9.0% 7.3%
[Something Else/Other] 10.7% 12.4% 5.6% 21.3% [DK] 8.6% 11.8% 16.0% 6.2% [Refused] 1.1% ‐ ‐ ‐
[IF NEEDED/REQUESTED, REMINDER DEFINITION OF “ESA”: An ESA establishes for parents a government-authorized savings account with restricted, but multiple uses for educational purposes. Parents can then use these funds to pay for: school tuition; tutoring; online education programs; therapies for students with special needs; textbooks or other instructional materials; or save for future college expenses.] 26-1. Split G. Some people believe that ESAs should be available to all families, regardless of incomes and special needs. Do you agree or disagree with that statement? [PROBE:] Would you say strongly or somewhat agree/disagree?
National Current &
Former Parents
Current Parents
Former Parents
UNWEIGHTED BASE 500 283 148 135 NET: AGREE 65.7% 65.8% 69.7% 60.5% Strongly Agree 36.6% 36.1% 40.2% 30.6% Somewhat Agree 29.1% 29.7% 29.5% 29.9% NET: DISAGREE 25.6% 27.9% 28.0% 27.9% Somewhat Disagree 13.6% 15.3% 16.8% 13.3% Strongly Disagree 12.0% 12.6% 11.1% 14.6% [DK] 8.0% 5.5% 2.3% 9.7% [Refused] 0.7% 0.8% ‐ 1.9% MEAN 2.0 2.0 2.0 2.1 MEDIAN 2.0 2.0 2.0 2.0

26-2. Split H. Some people believe that ESAs should only be available to families based on financial need. Do you agree or disagree with that statement? [PROBE:] Would you say strongly or somewhat agree/disagree?
National Current &
Former Parents
Current Parents
Former Parents
UNWEIGHTED BASE 500 261 121 140 NET: AGREE 46.7% 43.3% 48.2% 38.2% Strongly Agree 19.9% 18.1% 23.7% 12.2% Somewhat Agree 26.8% 25.3% 24.5% 26.0% NET: DISAGREE 43.0% 47.7% 46.7% 48.7% Somewhat Disagree 19.6% 20.0% 19.9% 20.1% Strongly Disagree 23.5% 27.7% 26.8% 28.5% [DK] 10.1% 8.6% 5.1% 12.3% [Refused] 0.2% 0.4% ‐ 0.9% MEAN 2.5 2.6 2.5 2.7 MEDIAN 2.0 3.0 2.0 3.0
26-COM. Some people believe that ESAs should be available to all families, regardless of incomes and special needs. Do you agree or disagree with that statement? Some people believe that ESAs should only be available to families based on financial need. Do you agree or disagree with that statement? [PROBE] Would you say strongly or somewhat agree/disagree?
National Current &
Former Parents
Current Parents
Former Parents
TOTAL ANSWERING 1000 524 286 238 UNWEIGHTED BASE 1000 544 269 275 NET: AGREE 56.2% 54.9% 59.8% 48.9% Strongly Agree 28.2% 27.3% 32.6% 21.0% Somewhat Agree 27.9% 27.5% 27.2% 27.9% NET: DISAGREE 34.3% 37.5% 36.6% 38.7% Somewhat Disagree 16.6% 17.6% 18.3% 16.9% Strongly Disagree 17.7% 19.9% 18.3% 21.8% [DK] 9.0% 7.0% 3.6% 11.0% [Refused] 0.5% 0.6% ‐ 1.4%

MEAN 2.3 2.3 2.2 2.5 MEDIAN 2.0 2.0 2.0 2.0
27. A tax credit allows an individual or business to reduce the final amount of a tax owed to government. In a “tax-credit scholarship system,” a government gives tax credits to individuals or businesses if they contribute money to nonprofit organizations that distribute private school scholarships. [] A nonprofit organization gives a scholarship to a qualifying student who would like to enroll in a private school of their choice, including both religious and non-religious schools. The student’s parent then uses the scholarship to pay partial or full tuition for the chosen private school. In general, do you favor or oppose a tax-credit scholarship system? [PROBE:] Would you say strongly or somewhat favor/oppose?
National Current &
Former Parents
Current Parents
Former Parents
TOTAL ANSWERING 1000 524 286 238 UNWEIGHTED BASE 1000 544 269 275 NET: AGREE 62.0% 60.3% 61.5% 58.8% Strongly Favor 22.7% 22.9% 24.9% 20.5% Somewhat Favor 39.3% 37.4% 36.6% 38.3% NET: DISAGREE 25.8% 27.9% 28.5% 27.3% Somewhat Oppose 14.6% 14.0% 17.3% 10.1% Strongly Oppose 11.2% 13.9% 11.2% 17.2% [DK] 11.7% 11.5% 10.0% 13.2% [Refused] 0.5% 0.3% ‐ 0.7% MEAN 2.2 2.2 2.2 2.3 MEDIAN 2.0 2.0 2.0 2.0
“For the next several questions, we want to ask for your opinions on the roles and responsibilities of the United States federal government…” 28. Would you say you follow what’s going on in government and public affairs [READ]?
National Current &
Former Parents
Current Parents
Former Parents
TOTAL ANSWERING 1000 524 286 238 UNWEIGHTED BASE 1000 544 269 275

NET: ALWAYS/SOME OF THE TIME 74.7% 78.4% 76.0% 81.2% Always or most of the time 38.2% 41.5% 39.0% 44.5% Some of the time 36.6% 36.9% 37.1% 36.8% NET: ONLY NOW AND THEN/ NEVER 19.7% 18.9% 20.4% 17.1%
Only now and then 16.8% 16.2% 17.7% 14.4% Never 2.9% 2.7% 2.7% 2.8% [DK] 4.2% 2.0% 2.2% 1.6% [Refused] 1.4% 0.7% 1.3% ‐
29. How much of the time do you think you can trust the U.S. federal government in Washington D.C. to do what is right [READ]?
National Current &
Former Parents
Current Parents
Former Parents
TOTAL ANSWERING 1000 524 286 238 UNWEIGHTED BASE 1000 544 269 275 NET: ALWAYS/SOME OF THE TIME 41.6% 39.2% 40.0% 38.2% Always or most of the time 10.1% 8.6% 9.5% 7.6% Some of the time 31.4% 30.5% 30.5% 30.6% NET: ONLY NOW AND THEN/ NEVER 53.2% 58.5% 57.4% 59.8%
Only now and then 34.0% 37.3% 35.0% 40.1% Never 19.2% 21.2% 22.4% 19.7% [DK] 4.4% 2.3% 2.6% 2.0% [Refused] 0.9% ‐ ‐ ‐
30. For each of the following areas, please tell me how much of a role, if any, the federal government should play. Should the federal government play a major role, a minor role, or no role at all [INSERT ITEM; RANDOMIZE]? How about [INSERT ITEM]? [PROBE IF NECESSARY: Should the federal government play a major role, a minor role, or no role at all [ITEM]?] 30_1. Civil Rights - Should the federal government play a major role, a minor role, or no role at all in Civil Rights?

National Current &
Former Parents
Current Parents
Former Parents
UNWEIGHTED BASE 500 263 122 141 Major role 64.5% 66.1% 70.2% 61.6% Minor role 23.5% 23.7% 18.3% 29.6% No role at all 6.9% 5.5% 7.8% 3.1% [DK] 3.6% 3.7% 3.7% 3.7% [Refused] 1.5% 1.0% ‐ 2.1%
30_2. Economy - Should the federal government play a major role, a minor role, or no role at all in Economy?
National Current &
Former Parents
Current Parents
Former Parents
UNWEIGHTED BASE 500 281 147 134 Major role 62.0% 65.3% 61.1% 70.8% Minor role 25.7% 22.9% 24.1% 21.3% No role at all 6.4% 8.3% 9.5% 6.7% [DK] 4.3% 3.5% 5.3% 1.2% [Refused] 1.6% ‐ ‐ ‐
30_3. Elderly Care [such as Social Security and Medicare] - Should the federal government play a major role, a minor role, or no role at all in Elderly Care [such as Social Security and Medicare]?
National Current &
Former Parents
Current Parents
Former Parents
UNWEIGHTED BASE 500 263 122 141 Major role 63.0% 61.0% 61.1% 61.0% Minor role 24.8% 26.2% 23.3% 29.4% No role at all 8.0% 8.2% 7.5% 9.0% [DK] 3.1% 3.5% 6.1% 0.6% [Refused] 1.1% 1.1% 2.0% ‐

30_4. Energy - Should the federal government play a major role, a minor role, or no role at all in Energy?
National Current &
Former Parents
Current Parents
Former Parents
UNWEIGHTED BASE 500 281 147 134 Major role 57.6% 58.2% 57.4% 59.1% Minor role 28.7% 28.0% 25.6% 31.1% No role at all 6.8% 8.5% 11.7% 4.5% [DK] 5.8% 5.0% 4.7% 5.3% [Refused] 1.2% 0.3% 0.6% ‐
30_5. Environment - Should the federal government play a major role, a minor role, or no role at all in Environment?
National Current &
Former Parents
Current Parents
Former Parents
UNWEIGHTED BASE 500 263 122 141 Major role 59.6% 56.4% 59.9% 52.6% Minor role 28.9% 30.8% 23.8% 38.6% No role at all 7.0% 9.3% 11.9% 6.3% [DK] 3.9% 2.4% 2.2% 2.6% [Refused] 0.7% 1.2% 2.2% ‐
30_6. Food and Medicine Safety - Should the federal government play a major role, a minor role, or no role at all in Food and Medicine Safety?
National Current &
Former Parents
Current Parents
Former Parents
UNWEIGHTED BASE 500 281 147 134 Major role 69.8% 70.1% 62.2% 80.2% Minor role 20.8% 21.8% 27.2% 14.7% No role at all 3.9% 5.0% 6.6% 2.9% [DK] 4.5% 3.2% 4.0% 2.1% [Refused] 1.0% ‐ ‐ ‐

30_7. Healthcare [such as Obamacare, or Affordable Care Act] - Should the federal government play a major role, a minor role, or no role at all in Healthcare [such as Obamacare, or Affordable Care Act]?
National Current &
Former Parents
Current Parents
Former Parents
UNWEIGHTED BASE 500 263 122 141 Major role 56.3% 52.1% 56.3% 47.5% Minor role 23.1% 24.1% 16.9% 32.1% No role at all 15.4% 17.4% 20.3% 14.1% [DK] 4.3% 5.4% 4.5% 6.4% [Refused] 0.9% 1.1% 2.0% ‐
30_8. Higher Education [College] - Should the federal government play a major role, a minor role, or no role at all in Higher Education [College]?
National Current &
Former Parents
Current Parents
Former Parents
UNWEIGHTED BASE 500 281 147 134 Major role 40.7% 44.4% 48.8% 38.8% Minor role 36.8% 33.7% 28.8% 40.1% No role at all 15.2% 17.7% 18.4% 16.7% [DK] 5.8% 4.2% 4.0% 4.5% [Refused] 1.5% ‐ ‐ ‐
30_9. Immigration - Should the federal government play a major role, a minor role, or no role at all in Immigration?
National Current &
Former Parents
Current Parents
Former Parents
UNWEIGHTED BASE 500 263 122 141 Major role 70.5% 72.2% 72.4% 72.0% Minor role 17.1% 15.5% 12.0% 19.3% No role at all 5.8% 5.9% 6.2% 5.6% [DK] 5.1% 5.0% 6.6% 3.1% [Refused] 1.5% 1.5% 2.8% ‐
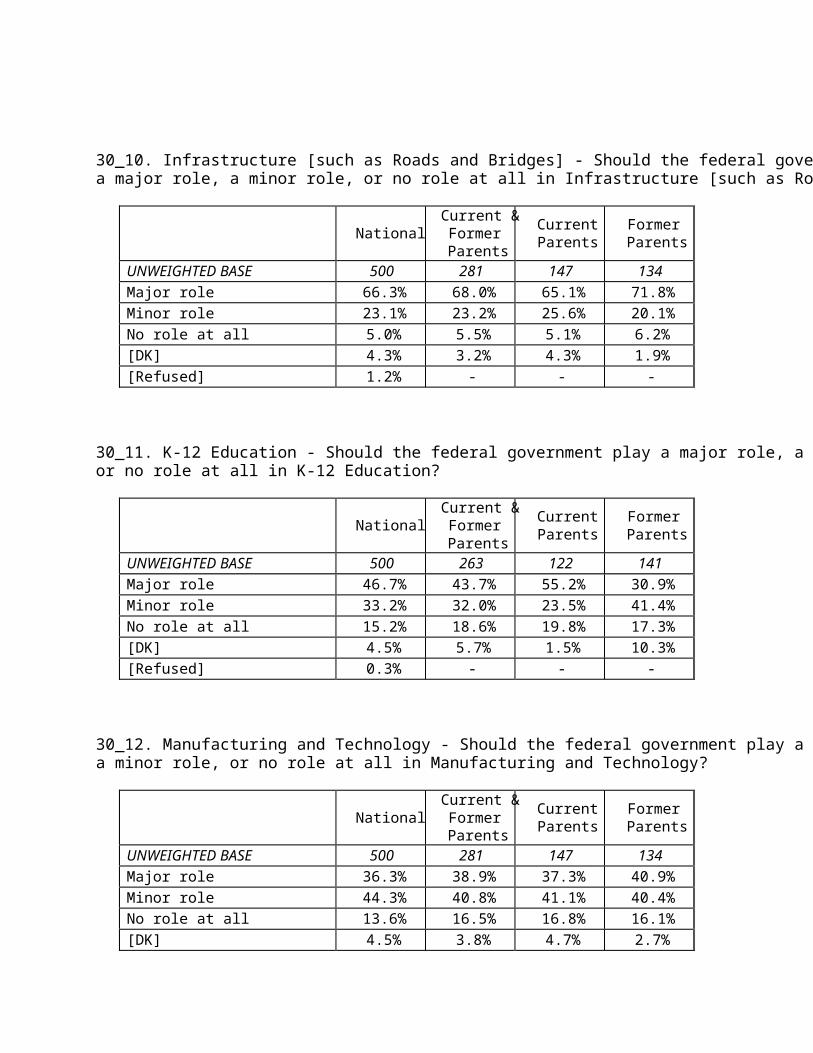
30_10. Infrastructure [such as Roads and Bridges] - Should the federal government play a major role, a minor role, or no role at all in Infrastructure [such as Roads and Bridges]?
National Current &
Former Parents
Current Parents
Former Parents
UNWEIGHTED BASE 500 281 147 134 Major role 66.3% 68.0% 65.1% 71.8% Minor role 23.1% 23.2% 25.6% 20.1% No role at all 5.0% 5.5% 5.1% 6.2% [DK] 4.3% 3.2% 4.3% 1.9% [Refused] 1.2% ‐ ‐ ‐
30_11. K-12 Education - Should the federal government play a major role, a minor role, or no role at all in K-12 Education?
National Current &
Former Parents
Current Parents
Former Parents
UNWEIGHTED BASE 500 263 122 141 Major role 46.7% 43.7% 55.2% 30.9% Minor role 33.2% 32.0% 23.5% 41.4% No role at all 15.2% 18.6% 19.8% 17.3% [DK] 4.5% 5.7% 1.5% 10.3% [Refused] 0.3% ‐ ‐ ‐
30_12. Manufacturing and Technology - Should the federal government play a major role, a minor role, or no role at all in Manufacturing and Technology?
National Current &
Former Parents
Current Parents
Former Parents
UNWEIGHTED BASE 500 281 147 134 Major role 36.3% 38.9% 37.3% 40.9% Minor role 44.3% 40.8% 41.1% 40.4% No role at all 13.6% 16.5% 16.8% 16.1% [DK] 4.5% 3.8% 4.7% 2.7%

[Refused] 1.2% ‐ ‐ ‐ 30_13. National Security/Defense - Should the federal government play a major role, a minor role, or no role at all in National Security/Defense?
National Current &
Former Parents
Current Parents
Former Parents
UNWEIGHTED BASE 500 263 122 141 Major role 82.5% 86.5% 81.4% 92.1% Minor role 12.3% 10.7% 13.8% 7.2% No role at all 2.5% 1.5% 2.2% 0.7% [DK] 2.3% 1.4% 2.7% ‐[Refused] 0.4% ‐ ‐ ‐
30_14. Natural Disasters - Should the federal government play a major role, a minor role, or no role at all in Natural Disasters?
National Current &
Former Parents
Current Parents
Former Parents
UNWEIGHTED BASE 500 281 147 134 Major role 78.2% 79.9% 76.9% 83.7% Minor role 12.9% 14.3% 16.3% 11.7% No role at all 2.3% 2.2% 2.9% 1.2% [DK] 4.9% 3.6% 3.9% 3.4% [Refused] 1.6% ‐ ‐ ‐
30_15. Poverty [such as Medicaid, Food Stamps] - Should the federal government play a major role, a minor role, or no role at all in Poverty [such as Medicaid, Food Stamps]?
National Current &
Former Parents
Current Parents
Former Parents
UNWEIGHTED BASE 500 263 122 141 Major role 61.9% 60.0% 60.1% 59.9% Minor role 24.6% 26.0% 21.2% 31.2% No role at all 8.0% 8.4% 12.0% 4.4%

[DK] 4.7% 5.2% 5.9% 4.5% [Refused] 0.8% 0.4% 0.8% ‐
30_16. Space Exploration [NASA] - Should the federal government play a major role, a minor role, or no role at all in Space Exploration [NASA]?
National Current &
Former Parents
Current Parents
Former Parents
UNWEIGHTED BASE 500 281 147 134 Major role 47.6% 48.2% 38.9% 60.3% Minor role 34.1% 32.4% 40.7% 21.7% No role at all 9.9% 12.4% 12.5% 12.3% [DK] 6.8% 6.6% 7.9% 4.9% [Refused] 1.6% 0.4% ‐ 0.8%
30_17. Terrorism - Should the federal government play a major role, a minor role, or no role at all in Terrorism?
National Current &
Former Parents
Current Parents
Former Parents
UNWEIGHTED BASE 500 263 122 141 Major role 82.2% 86.5% 81.2% 92.4% Minor role 10.1% 9.8% 13.7% 5.6% No role at all 3.9% 1.8% 2.9% 0.7% [DK] 3.1% 1.5% 2.3% 0.7% [Refused] 0.7% 0.3% ‐ 0.7%
30_18. Workplace Safety - Should the federal government play a major role, a minor role, or no role at all in Workplace Safety?
National Current &
Former Parents
Current Parents
Former Parents
UNWEIGHTED BASE 500 281 147 134 Major role 52.7% 54.4% 51.7% 57.9% Minor role 32.0% 30.3% 29.2% 31.7%

No role at all 9.9% 11.9% 13.9% 9.3% [DK] 4.0% 3.4% 5.2% 1.1% [Refused] 1.4% ‐ ‐ ‐
31. Now we have a few items about the federal government’s role in K–12 Education… For each of the following areas, please tell me how much of a role, if any, the federal government should play. Should the federal government play a major role, a minor role, or no role at all [INSERT ITEM; RANDOMIZE]? How about [INSERT ITEM]? [PROBE IF NECESSARY: Should the federal government play a major role, a minor role, or no role at all [ITEM]?] 31_1. Ensure that students' civil rights are protected - Should the federal government play a major role, a minor role, or no role at all in Ensure that students' civil rights are protected?
National Current &
Former Parents
Current Parents
Former Parents
UNWEIGHTED BASE 500 263 122 141 Major role 65.9% 64.5% 65.4% 63.4% Minor role 22.1% 24.6% 22.0% 27.4% No role at all 6.6% 7.4% 9.7% 4.7% [DK] 3.8% 2.7% 2.0% 3.4% [Refused] 1.5% 0.9% 0.8% 1.1%
31_2. Provide funding so low-income students can access a quality education - Should the federal government play a major role, a minor role, or no role at all in Provide funding so low-income students can access a quality education?
National Current &
Former Parents
Current Parents
Former Parents
UNWEIGHTED BASE 500 281 147 134 Major role 60.7% 59.1% 61.3% 56.1% Minor role 27.6% 29.2% 28.6% 29.8%
No role at all 6.7% 7.6% 6.5% 9.0% [DK] 3.6% 3.8% 3.5% 4.1% [Refused] 1.4% 0.4% ‐ 1.0%
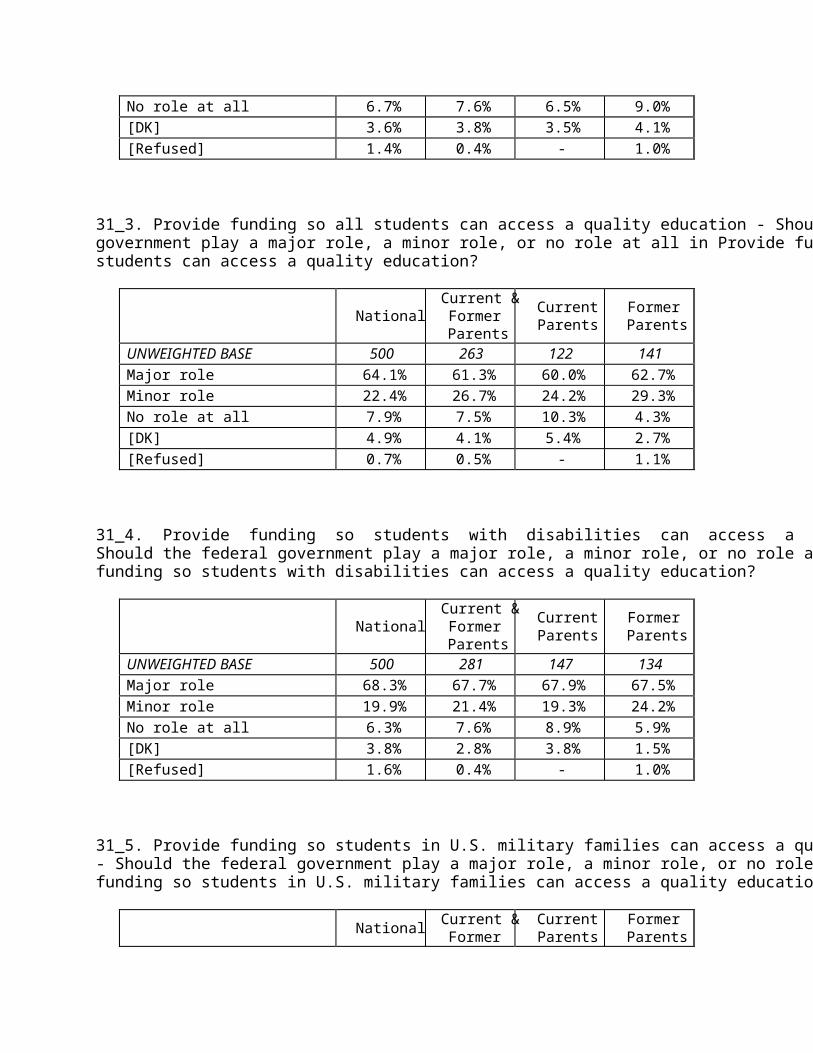
31_3. Provide funding so all students can access a quality education - Should the federal government play a major role, a minor role, or no role at all in Provide funding so all students can access a quality education?
National Current &
Former Parents
Current Parents
Former Parents
UNWEIGHTED BASE 500 263 122 141 Major role 64.1% 61.3% 60.0% 62.7% Minor role 22.4% 26.7% 24.2% 29.3% No role at all 7.9% 7.5% 10.3% 4.3% [DK] 4.9% 4.1% 5.4% 2.7% [Refused] 0.7% 0.5% ‐ 1.1%
31_4. Provide funding so students with disabilities can access a quality education - Should the federal government play a major role, a minor role, or no role at all in Provide funding so students with disabilities can access a quality education?
National Current &
Former Parents
Current Parents
Former Parents
UNWEIGHTED BASE 500 281 147 134 Major role 68.3% 67.7% 67.9% 67.5% Minor role 19.9% 21.4% 19.3% 24.2% No role at all 6.3% 7.6% 8.9% 5.9% [DK] 3.8% 2.8% 3.8% 1.5% [Refused] 1.6% 0.4% ‐ 1.0%
31_5. Provide funding so students in U.S. military families can access a quality education - Should the federal government play a major role, a minor role, or no role at all in Provide funding so students in U.S. military families can access a quality education?
National Current & Former
Current Parents
Former Parents

Parents UNWEIGHTED BASE 500 263 122 141 Major role 71.8% 73.2% 68.6% 78.2% Minor role 18.5% 15.2% 14.7% 15.6% No role at all 4.2% 6.3% 10.4% 1.6% [DK] 4.9% 4.9% 6.2% 3.5% [Refused] 0.7% 0.5% ‐ 1.1%
31_6. Provide funding for education research and data collection that can inform policymakers and the public - Should the federal government play a major role, a minor role, or no role at all in Provide funding for education research and data collection that can inform policymakers and the public?
National Current &
Former Parents
Current Parents
Former Parents
UNWEIGHTED BASE 500 281 147 134 Major role 48.4% 48.3% 48.3% 48.3% Minor role 34.0% 33.5% 36.2% 30.1% No role at all 9.4% 11.3% 9.2% 14.1% [DK] 6.6% 5.9% 5.4% 6.6% [Refused] 1.5% 1.0% 1.0% 1.0%
31_7. Provide funding to local and state education agencies - Should the federal government play a major role, a minor role, or no role at all in Provide funding to local and state education agencies?
National Current &
Former Parents
Current Parents
Former Parents
UNWEIGHTED BASE 500 263 122 141 Major role 59.7% 58.8% 63.8% 53.2% Minor role 29.5% 32.0% 26.3% 38.3% No role at all 5.9% 5.8% 7.5% 3.9% [DK] 4.0% 2.9% 2.4% 3.5% [Refused] 0.9% 0.5% ‐ 1.1%

31_8. Regulate schools, districts, and state education agencies - Should the federal government play a major role, a minor role, or no role at all in Regulate schools, districts, and state education agencies?
National Current &
Former Parents
Current Parents
Former Parents
UNWEIGHTED BASE 500 281 147 134 Major role 37.2% 40.2% 44.5% 34.8% Minor role 39.5% 37.5% 32.9% 43.6% No role at all 16.9% 18.5% 18.6% 18.4% [DK] 4.7% 3.1% 4.1% 1.8% [Refused] 1.6% 0.6% ‐ 1.4%
“Now the following questions should be pretty easy, and for statistical purposes only…” 32. Generally speaking, do you usually consider yourself a Republican, a Democrat, an Independent, or something else?
National Current &
Former Parents
Current Parents
Former Parents
TOTAL ANSWERING 1000 524 286 238 UNWEIGHTED BASE 1000 544 269 275 Democrat 34.6% 34.7% 32.4% 37.5% Republican 24.5% 27.5% 26.3% 28.8% Independent 27.8% 27.0% 28.1% 25.7% [Libertarian] 1.5% 0.5% 0.8% ‐[Other] 4.7% 4.1% 4.1% 4.2% [DK] 4.5% 3.9% 5.4% 2.1% [Refused] 2.4% 2.4% 2.9% 1.7%
33. How would you best describe where you live? [READ LIST]
National Current &
Former Parents
Current Parents
Former Parents
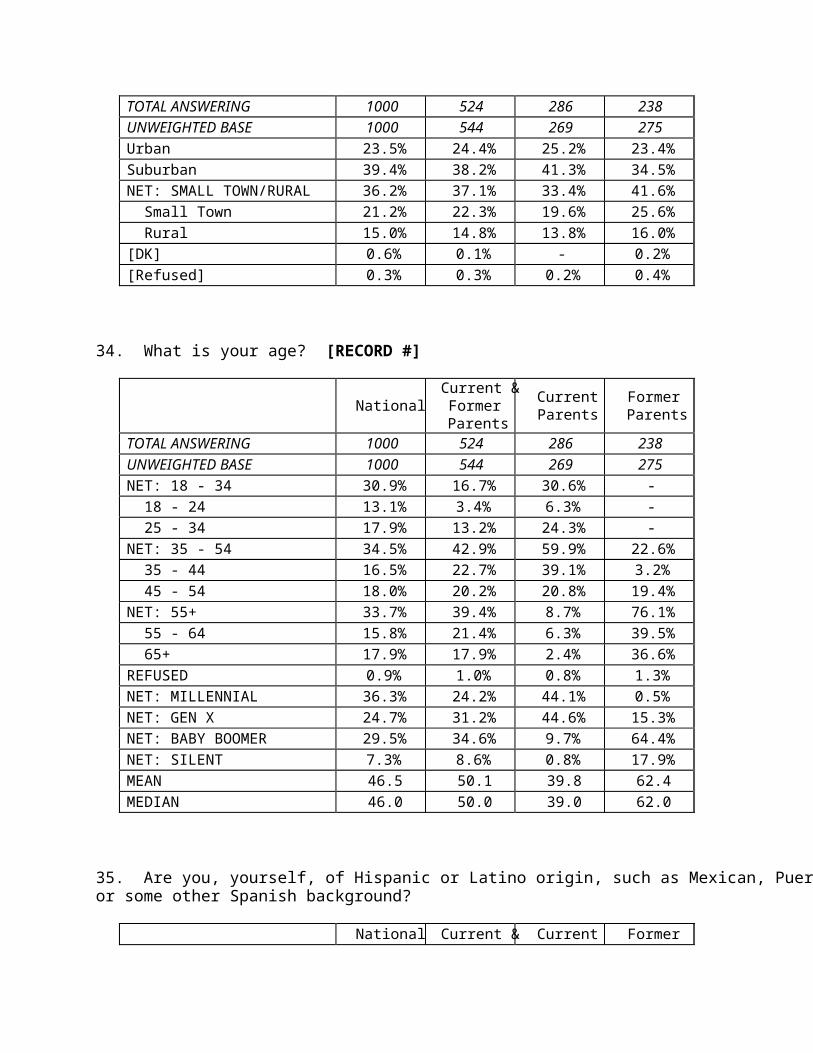
TOTAL ANSWERING 1000 524 286 238 UNWEIGHTED BASE 1000 544 269 275 Urban 23.5% 24.4% 25.2% 23.4% Suburban 39.4% 38.2% 41.3% 34.5% NET: SMALL TOWN/RURAL 36.2% 37.1% 33.4% 41.6% Small Town 21.2% 22.3% 19.6% 25.6% Rural 15.0% 14.8% 13.8% 16.0% [DK] 0.6% 0.1% ‐ 0.2% [Refused] 0.3% 0.3% 0.2% 0.4%
34. What is your age? [RECORD #]
National Current &
Former Parents
Current Parents
Former Parents
TOTAL ANSWERING 1000 524 286 238 UNWEIGHTED BASE 1000 544 269 275 NET: 18 34 ‐ 30.9% 16.7% 30.6% ‐ 18 24 ‐ 13.1% 3.4% 6.3% ‐ 25 34 ‐ 17.9% 13.2% 24.3% ‐NET: 35 54 ‐ 34.5% 42.9% 59.9% 22.6% 35 44 ‐ 16.5% 22.7% 39.1% 3.2% 45 54 ‐ 18.0% 20.2% 20.8% 19.4% NET: 55+ 33.7% 39.4% 8.7% 76.1% 55 64 ‐ 15.8% 21.4% 6.3% 39.5% 65+ 17.9% 17.9% 2.4% 36.6% REFUSED 0.9% 1.0% 0.8% 1.3% NET: MILLENNIAL 36.3% 24.2% 44.1% 0.5% NET: GEN X 24.7% 31.2% 44.6% 15.3% NET: BABY BOOMER 29.5% 34.6% 9.7% 64.4% NET: SILENT 7.3% 8.6% 0.8% 17.9% MEAN 46.5 50.1 39.8 62.4 MEDIAN 46.0 50.0 39.0 62.0
35. Are you, yourself, of Hispanic or Latino origin, such as Mexican, Puerto Rican, Cuban, or some other Spanish background?
National Current & Current Former
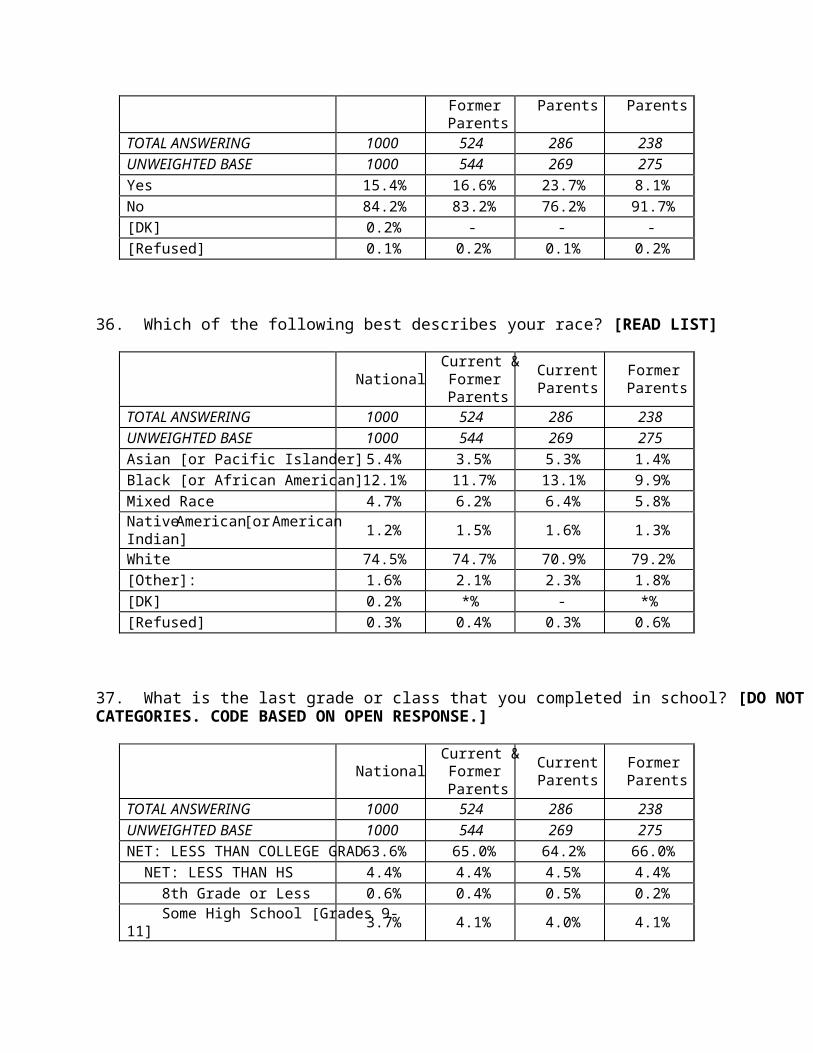
Former Parents
Parents Parents
TOTAL ANSWERING 1000 524 286 238 UNWEIGHTED BASE 1000 544 269 275 Yes 15.4% 16.6% 23.7% 8.1% No 84.2% 83.2% 76.2% 91.7% [DK] 0.2% ‐ ‐ ‐[Refused] 0.1% 0.2% 0.1% 0.2%
36. Which of the following best describes your race? [READ LIST]
National Current &
Former Parents
Current Parents
Former Parents
TOTAL ANSWERING 1000 524 286 238 UNWEIGHTED BASE 1000 544 269 275 Asian [or Pacific Islander] 5.4% 3.5% 5.3% 1.4% Black [or African American] 12.1% 11.7% 13.1% 9.9% Mixed Race 4.7% 6.2% 6.4% 5.8% Native American [or American Indian] 1.2% 1.5% 1.6% 1.3%
White 74.5% 74.7% 70.9% 79.2% [Other]: 1.6% 2.1% 2.3% 1.8% [DK] 0.2% *% ‐ *% [Refused] 0.3% 0.4% 0.3% 0.6%
37. What is the last grade or class that you completed in school? [DO NOT READ CATEGORIES. CODE BASED ON OPEN RESPONSE.]
National Current &
Former Parents
Current Parents
Former Parents
TOTAL ANSWERING 1000 524 286 238 UNWEIGHTED BASE 1000 544 269 275 NET: LESS THAN COLLEGE GRAD 63.6% 65.0% 64.2% 66.0% NET: LESS THAN HS 4.4% 4.4% 4.5% 4.4% 8th Grade or Less 0.6% 0.4% 0.5% 0.2% Some High School [Grades 9‐11] 3.7% 4.1% 4.0% 4.1%

High school Graduate [Grade 12 or GED Certificate] 28.0% 26.1% 26.3% 25.8%
NET: SOME COLLEGE 31.2% 34.5% 33.4% 35.9% Technical, Trade, or Vocational School [AFTER High School] 6.5% 7.9% 6.0% 10.2%
Some College [Associate's Degree, No 4 Yr Degree] ‐ 24.6% 26.6% 27.4% 25.7%
NET: COLLEGE GRAD OR MORE 36.0% 34.8% 35.8% 33.6% College Graduate [Bachelor's Degree., or Other 4 Yr Degree] ‐ 23.5% 21.5% 24.4% 18.0%
Post Graduate Training or ‐Professional Schooling After College [e.g., Toward a Master's Degree or Ph.D.; Law or Medical School]
12.4% 13.4% 11.5% 15.6%
[DK] 0.1% ‐ ‐ ‐[Refused] 0.4% 0.2% ‐ 0.4%
38. Please stop me when I read the category that best describes your current annual household income, before taxes? [READ LIST]
National Current &
Former Parents
Current Parents
Former Parents
TOTAL ANSWERING 1000 524 286 238 UNWEIGHTED BASE 1000 544 269 275 NET: LESS THAN $40,000 38.4% 34.2% 30.6% 38.5% Less than $20,000 17.4% 13.9% 13.6% 14.2% $20,000 to less than $40,000 21.0% 20.4% 17.0% 24.3% NET: $40,000 to less than $80,000 30.1% 29.5% 30.8% 27.9% $40,000 to less than $60,000 16.9% 16.9% 17.5% 16.3% $60,000 to less than $80,000 13.2% 12.6% 13.4% 11.6% NET: $80,000 OR MORE 25.8% 30.3% 35.5% 24.1% $80,000 to less than $100,000 10.9% 12.0% 14.4% 9.0% $100,000 to less than $150,000 9.1% 11.6% 12.0% 11.1% $150,000 or more 5.8% 6.7% 9.1% 3.9% DK 1.3% 1.4% 0.8% 2.2% Refused 4.4% 4.5% 2.2% 7.3%
LL1. Now thinking about your phone usage, do you have a working cell phone?

National Current &
Former Parents
Current Parents
Former Parents
TOTAL ANSWERING 355 213 59 154 UNWEIGHTED BASE 402 254 69 185 Yes 71.7% 75.2% 84.8% 71.5% No 25.9% 23.1% 15.2% 26.1% [DO NOT READ] DON'T KNOW/ REFUSED 2.4% 1.7% ‐ 2.4%
LL2. Does someone else in your household have a working cell phone?
National Current &
Former Parents
Current Parents
Former Parents
TOTAL ANSWERING 100 53 9 44 UNWEIGHTED BASE 60 34 8 26 Yes 13.4% 15.7% 41.6% 10.4% No 83.5% 80.4% 58.4% 84.8% [DO NOT READ] DON'T KNOW/ REFUSED 3.1% 4.0% ‐ 4.8%
CC. Now thinking about your phone usage, do you have a working home phone?
National Current &
Former Parents
Current Parents
Former Parents
TOTAL ANSWERING 644 311 227 84 UNWEIGHTED BASE 598 290 200 90 Yes 41.3% 43.8% 42.7% 46.8% No 57.9% 55.6% 56.4% 53.2% [DO NOT READ] DON'T KNOW/ REFUSED 0.8% 0.7% 0.9% ‐
PP. Of all the phone calls you and your household receive, are...?
National Current & Former
Current Parents
Former Parents

Parents TOTAL ANSWERING 535 305 150 154 UNWEIGHTED BASE 652 381 165 216 All or most calls received on your cell phone 36.7% 36.8% 49.6% 24.3%
Some calls received on your cell phone and some on your home phone, or
40.4% 45.2% 43.8% 46.4%
Very few or no calls received on your cell phone? 22.4% 17.7% 6.6% 28.6%
[DO NOT READ] DON'T KNOW/ REFUSED 0.6% 0.3% ‐ 0.7%
[PLEASE MAKE THE FOLLOWING TEXT AVAILABLE TO INTERVIEWERS ANYTIME A RESPONDENT ASKS ABOUT THE NATURE OF THE SURVEY SPONSOR OR ABOUT EDCHOICE] EdChoice is an independent, nonprofit, nonpartisan research organization that studies attitudes toward K-12 education issues facing the states and the country. The organization has no connection to the government, political parties, or any campaigns. Reports about its surveys are made available free of charge to the general public.