dspace.brunel.ac.ukdspace.brunel.ac.uk/bitstream/2438/11295/1/fulltext.docx · web viewc health...
TRANSCRIPT

The MAPS reporting statement for studies mapping onto generic preference-based outcome measures:
Explanation and elaboration
Authors: Stavros Petrou,a Oliver Rivero-Arias,b Helen Dakin,c Louise Longworth,d Mark
Oppe,e Robert Froud,a,f Alastair Grayc
a Warwick Clinical Trials Unit, Warwick Medical School, University of Warwick,
Coventry, UK.
b National Perinatal Epidemiology Unit, Nuffield Department of Population Health,
University of Oxford, Oxford, UK.
c Health Economics Research Centre, Nuffield Department of Population Health,
University of Oxford, Oxford, UK.
d Health Economics Research Group, Brunel University London, Uxbridge, UK.
e EuroQol Research Foundation, Rotterdam, The Netherlands.
f Norges Helsehøyskole, Campus Kristiania, Oslo, Norway
Contact for correspondence:
Professor Stavros Petrou, Warwick Medical School, University of Warwick, Coventry
CV4 7AL, UK.
Tel: 02476 151124
FAX: 02476 151586
E-mail: [email protected]
1

Abstract
Background: The process of ‘mapping’ is increasingly being used to predict health utilities,
for application within health economic evaluations, using data on other indicators or
measures of health. Guidance for the reporting of mapping studies is currently lacking.
Objective: The overall objective of this research was to develop a checklist of essential
items, which authors should consider when reporting mapping studies. The MAPS (MApping
onto Preference-based measures reporting Standards) statement is a checklist, which aims to
promote complete and transparent reporting by researchers. This paper provides a detailed
explanation and elaboration of the items contained within the MAPS statement.
Methods: In the absence of previously published reporting checklists or reporting guidance
documents, a de novo list of reporting items and accompanying explanations was created. A
two-round, modified Delphi survey with representatives from academia, consultancy, health
technology assessment agencies and the biomedical journal editorial community, was used to
identify a list of essential reporting items from this larger list.
Results: From the initial de novo list of 29 candidate items, a set of 23 essential reporting
items was developed. The items are presented numerically and categorised within six
sections, namely: (i) title and abstract; (ii) introduction; (iii) methods; (iv) results; (v)
discussion; and (vi) other. For each item, we summarise the recommendation, illustrate it
using an exemplar of good reporting practice identified from the published literature, and
provide a detailed explanation to accompany the recommendation.
Conclusions: It is anticipated that the MAPS statement will promote clarity, transparency
and completeness of reporting of mapping studies. It is targeted at researchers developing
mapping algorithms, peer reviewers and editors involved in the manuscript review process
for mapping studies, and the funders of the research. The MAPS working group plans to
assess the need for an update of the reporting checklist in five years’ time.
2

Introduction
The process of ‘mapping’ onto generic preference-based outcome measures is increasingly
being used as a means of generating health utilities for application within health economic
evaluations [1]. Mapping involves the development and use of an algorithm (or algorithms) to
predict the primary outputs of generic preference-based outcome measures, i.e. health utility
values, using data on other indicators or measures of health. The source predictive measure
may be a non-preference based indicator or measure of health outcome or, more
exceptionally, a preference-based outcome measure that is not preferred by the local health
technology assessment agency. The algorithm(s) can subsequently be applied to data from
clinical trials, observational studies or economic models containing the source predictive
measure(s) to predict health utility values in contexts where the target generic preference-
based measure is absent. The predicted health utility values can then be analysed using
standard methods for individual-level data (e.g. within a trial-based economic evaluation), or
summarised for each health state within a decision-analytic model.
Over recent years there has been a rapid increase in the publication of studies that use
mapping techniques to predict health utility values, and databases of published studies in this
field are beginning to emerge [2]. Some authors [3] and agencies [4] concerned with
technology appraisals have issued technical guides for the conduct of mapping research.
However, guidance for the reporting of mapping studies is currently lacking. In keeping with
health-related research more broadly [5], mapping studies should be reported fully and
transparently to allow readers to assess the relative merits of the investigation [6]. Moreover,
there may be significant opportunity costs associated with regulatory and reimbursement
decisions for new technologies informed by misleading findings from mapping studies. This
has led to the development of the MAPS (MApping onto Preference-based measures
reporting Standards) reporting statement, which we explain and elaborate on in this paper.
The aim of the MAPS reporting statement is to provide recommendations, in the form of a
checklist of essential items, which authors should consider when reporting a mapping study.
It is anticipated that the checklist will promote complete and transparent reporting by
researchers. The focus, therefore, is on promoting the quality of reporting of mapping studies,
rather than the quality of their conduct, although it is possible that the reporting statement
will also indirectly enhance the methodological rigour of the research [7]. The MAPS
reporting statement is primarily targeted at researchers developing mapping algorithms, the
funders of the research, and peer reviewers and editors involved in the manuscript review
3

process for mapping studies [5, 6]. In developing the reporting statement, the term ‘mapping’
is used to cover all approaches that predict the outputs of generic preference-based outcome
measures using data on other indicators or measures of health, and encompasses related forms
of nomenclature used by some researchers, such as ‘cross-walking’ or ‘transfer to utility’ [1,
8]. Similarly, the term ‘algorithm’ is used in its broadest sense to encompass statistical
associations and more complex series of operations.
The development of the MAPS statement
The development of the MAPS reporting statement was informed by recently published
guidance for health research reporting guidelines [5] and broadly modelled other recent
reporting guideline developments [9-14]. A working group comprised of six health
economists (SP, ORA, HD, LL, MO, AG) and one Delphi methodologist (RF) was formed
following a request from an academic journal to develop a reporting statement for mapping
studies. One of the working group members (HD) had previously conducted a systematic
review of studies mapping from clinical or health-related quality of life measures onto the
EQ-5D [2]. Using the search terms from this systematic review, as well as other relevant
articles and reports already in our possession, a broad search for reporting guidelines for
mapping studies was conducted. This confirmed that no previous reporting guidance had
been published. The working group members therefore developed a preliminary de novo list
of 29 reporting items and accompanying explanations. Following further review by the
working group members, this was subsequently distilled into a list of 25 reporting items and
accompanying explanations.
Members of the working group identified 62 possible candidates for a Delphi panel from a
pool of active researchers and stakeholders in this field. The candidates included individuals
from academic and consultancy settings with considerable experience in mapping research,
representatives from health technology assessment agencies that routinely appraise evidence
informed by mapping studies, and biomedical journal editors. Health economists from the
MAPS working group were included in the Delphi panel. A total of 48 of the 62 (77.4%)
individuals agreed to participate in a Delphi survey aimed at developing a minimum set of
standard reporting requirements for mapping studies with an accompanying reporting
checklist.
The Delphi panellists were sent a personalised link to a Web-based survey, which had
been piloted by members of the working group. Non-responders were sent up to two
4

reminders after 14 and 21 days. The panellists were anonymous to each other throughout the
study and their identities were known only to one member of the working group. The
panellists were invited to rate the importance of each of the 25 candidate reporting items
identified by the working group on a 9-point rating scale (1, “not important”, to 9, “extremely
important”); describe their confidence in their ratings (“not confident”, “somewhat confident”
or “very confident”); comment on the candidate items and their explanations; suggest
additional items for consideration by the panellists in subsequent rounds; and to provide any
other general comments. The candidate reporting items were ordered within six sections: (i)
title and abstract; (ii) introduction; (iii) methods; (iv) results; (v) discussion; and (vi) other.
The panellists also provided information about their geographical area of work, gender, and
primary and additional work environments. Data from the first round were sent via a secure
socket layer (SSL) to a firewalled structured query language (SQL) server at University of
Oxford. Once the round had closed, the data were exported in comma separated values (CSV)
format and quantitative data were imported into Stata (version 13; Stata-Corp, College
Station, TX) for analysis.
A modified version of the Research ANd Development (RAND)/ University of California Los
Angeles (UCLA) appropriateness method was used to analyse the round one responses [15]. This
involved calculating the median score, the inter-percentile range (IPR) (30th and 70th), and the
inter-percentile range adjusted for symmetry (IPRAS), for each item (i) being rated. The
IPRAS includes a correction factor for asymmetric ratings, and panel disagreement was judged to
be present in cases if IPRi>IPRASi [15]. We modified the RAND/UCLA approach by asking
panellists about ‘importance’ rather than ‘appropriateness’ per se. Assessment of importance
followed the classic RAND/UCLA definitions, categorised simply as whether the median
rating fell between 1 and 3 (unimportant), 4 and 6 (neither unimportant nor important), or 7
and 9 (important) [15].
The results of round one of the Delphi survey were reviewed at a face-to-face meeting of
the working group. The ratings and qualitative comments were made available to the working
group members in advance of the meeting. A total of 46 of the 48 (95.8%) individuals who
agreed to participate completed round one of the survey (see Appendix 1 for their
characteristics). Of the 25 items, 24 were rated as important, with one item (“Source of
Funding”) rated as neither unimportant nor important. There was no evidence of
disagreement on ratings of any items according to the RAND/UCLA method (see
Appendix 2a for details). These findings did not change when the responses of the MAPS
working group were excluded. Based on the qualitative feedback received in round one, items
5

describing “Modelling Approaches” and “Repeated Measurements” were merged, as were
items describing “Model Diagnostics” and “Model Plausibility”. In addition, amendments to
the wording of several recommendations and their explanations were made in the light of
qualitative feedback from the panellists.
Panellists participating in round one were invited to participate in a second round of the
Delphi survey. A summary of revisions made following round one was provided. This
included a document in which revisions to each of the recommendations and explanations
were displayed in the form of track changes. Panellists participating in round one were
provided with group outputs (mean scores and their standard deviations, median scores and
their IPRs, histograms and RAND/UCLA labels of importance and agreement level)
summarising the round one results (and disaggregated outputs for the merged items). They
were also able to view their own round one scores for each item (and disaggregated scores for
the merged items). Panellists participating in round one were offered the opportunity to revise
their rating of the importance of each of the items and informed that their rating from round
one would otherwise hold. For the merged items, new ratings were solicited. Panellists
participating in round one were also offered the opportunity to provide any further comments
on each item or any further information that might be helpful to the group. Non-responders to
the second round of the Delphi survey were sent up to two reminders after 14 and 21 days.
The analytical methods for the round two data mirrored those for the first round.
The results of the second round of the Delphi survey were reviewed at a face-to-face
meeting of the working group. The ratings and qualitative comments were again made
available to the working group members in advance of the meeting. A total of 39 of the 46
(84.8%) panellists participating in round one completed round two of the survey. All 23 items
included in the second round were rated as important with no evidence of disagreement on
ratings of any items according to the RAND/UCLA method (see Appendix 2b for details).
Qualitative feedback from the panellists participating in round two led to minor modifications to
wording of a small number of recommendations and their explanations. This was fed back to
the round two respondents who were given a final opportunity to comment on the readability
of the final set of recommendations and explanations.
Based on these methods, a consensus list of 23 reporting items was developed (Table 1).
This paper, prepared by the MAPS working group members, provides an explanation and
elaboration of each of the 23 reporting items.
How to Use this Paper
6

The remainder of this Explanation and Elaboration paper is modelled on those developed for
other reporting guidelines [9-14]. Each of the 23 reporting items is illustrated with an
exemplar of good reporting practice identified from the published literature. Some examples
have been edited by removing secondary citations or by deleting some text, the latter denoted
by the symbol […]. For each item, we also provide an explanation to accompany the
recommendation, supported by a rationale and relevant evidence where available. Although
the focus is on a list of essential requirements when reporting a mapping study, we highlight
places where additional information may strengthen the reporting. The 23 reporting items are
presented numerically and categorised within six sections, namely: (i) title and abstract; (ii)
introduction; (iii) methods; (iv) results; (v) discussion; and (vi) other. We recognise,
however, that reports will not necessarily address the items in the order we have adopted.
Rather, what is important is that each recommendation is addressed either in the main body of
the report or its appendices.
The MAPS Checklist
TITLE AND ABSTRACT
Item 1: Title
Recommendation: Identify the report as a study mapping between outcome measures. State
the source measure(s) and generic, preference-based target measure(s) used in the study.
Example: “Mapping CushingQOL scores to EQ-5D utility values using data from the
European Registry on Cushing's syndrome (ERCUSYN).”[16]
Explanation: Authors should clearly signal in their title that they report a study mapping
between outcome measures. To ensure that the report is appropriately indexed in electronic
databases, such as Medline or the Centre for Reviews and Dissemination (CRD) database,
authors are encouraged to use a specific term such as ‘mapping’, ‘cross-walking’ or ‘transfer
to utility’ in the title. The most common form of nomenclature in this body of literature is
‘mapping’ [2]. It is likely that this term will continue to be used by developers of algorithms
aimed at predicting health utility values using data from external measures. The source
7

measure(s) and generic, preference-based target measure(s) should be stated in the title where
character limits allow. It may also be useful to state the population or disease of interest in the
title where character limits allow. The use of nebulous terminology in the title increases the
risk of a report being incorrectly catalogued by indexers and therefore missed by database
searches.
Item 2: Abstract
Recommendation: Provide a structured abstract including, as applicable: objectives;
methods, including data sources and their key characteristics, outcome measures used and
estimation and validation strategies; results, including indicators of model performance;
conclusions; and implications of key findings.
Example: “Aims: The Roland Morris Disability Questionnaire (RMQ) is a widely used
health status measure for low back pain (LBP). However, it is not preference-based, and
there are currently no established algorithms for mapping between the RMQ and preference-
based health-related quality-of-life measures. Using data from randomised controlled trials
of treatment for low back pain, we sought to develop algorithms for mapping between RMQ
scores and health utilities derived using either the EQ-5D or SF-6D.
Methods: This study is based on data from the Back Skills Training Trial (BeST) where data
was collected from 701 patients at baseline and subsequently at 3, 6 and 12 months post-
randomisation using a range of outcome measures, including the RMQ, EQ-5D, and SF-12
(from which SF-6D utilities can be derived). We used baseline trial data to estimate models
using both direct and response mapping approaches to predict EQ-5D and SF-6D health
utilities and dimension responses. A multi-stage model selection process was used to assess
the predictive accuracy of the models. We then explored different techniques and mapping
models that made use of repeated follow-up observations in the data. The estimated mapping
algorithms were validated using external data from the UK Back Pain Exercise and
Manipulation (BEAM) trial.
Results: A number of models were developed that accurately predict health utilities in this
context. The best performing RMQ to EQ-5D model was a Beta regression with Bayesian
quasi-likelihood estimation that included 24 dummy variables for RMQ responses, age and
gender as covariates (mean squared error (MSE): 0.0380); based on repeated data. The
selected model for RMQ to SF-6D mapping was a finite mixture model that included the
8

overall RMQ score, age, gender, RMQ score squared, age squared, and an interaction term
for age and RMQ score as covariates (MSE: 0.0114); based on repeated data.
Conclusion: It is possible to reasonably predict EQ-5D and SF-6D health utilities from RMQ
scores and responses using regression methods. Our regression equations provide an
empirical basis for estimating health utilities when EQ-5D or SF-6D data are not available.
They can be used to inform future economic evaluations of interventions targeting LBP.”[17]
Explanation: The abstract should enable readers to understand the objectives, methods,
findings and implications of a mapping study. Abstracts will often be used by readers as a
filtering mechanism for deciding whether to access the full report. They also help editors and
peer reviewers quickly gauge the scope, processes and relevance of study findings. In
addition, several circumstances arise where full reports are not available to potential
audiences of the research. The abstract should therefore present optimal information about
the mapping study mirroring, within the word limit set by the publisher, the main body of the
report. It should not contain information excluded from the main body of the report.
The specific structure of the abstract will tend to be governed by the requirements of the
publisher. Abstracts that are structured under a series of sub-headings pertaining to the
objectives, methods, results and conclusions of the study tend to provide more complete and
accessible information than unstructured abstracts [18]. Structured abstracts of mapping
studies should include the following information, as appropriate: study objectives; methods,
including data sources and their key characteristics (locations or settings, population or
clinical characteristics, sample sizes), outcome measures used and estimation and validation
strategies; results, including indicators of model performance; conclusions; and implications
of key findings. No MeSH headings for mapping studies are currently available. Therefore,
one or more overall descriptors such as ‘mapping’ should also be included as report
keywords.
INTRODUCTION
Item 3: Study Rationale
Recommendation: Describe the rationale for the mapping study in the context of the broader
evidence base.
9

Example: “In some evaluations of services for older people, non-utility-based outcome
measures, especially those that are disease or condition specific, may be collected instead of
utility-based measures because these are regarded as being more suitable within such a
population[…]One limitation of using the former in an economic evaluation is the lack of
comparability of results across a broad set of interventions, which is overcome when utility-
based outcome measures are used instead. A regression-based algorithm or mapping
function to predict a utility-based outcome measure from a non-utility-based one will
therefore be useful in such instances when the ultimate goal is to carry out a CUA[…] This
paper reports the results of a regression-based exercise to map the Barthel index (BI), a non-
utility-based conventional clinical scale of functional independence, to the EuroQol EQ-5D,
a preference-based measure. Only one study, by van Exel et al.[…], has mapped the BI onto
the EQ-5D to date[…] This paper builds on the work by van Exel et al. but uses a much
larger sample of data from the largest evaluation of intermediate care services done and
published in the UK to date.”[19]
Explanation: The introduction should inform readers of the rationale for the mapping study
and what it is likely to add to the broader evidence base. A helpful structure that sets the
context for readers might cover the following: (i) a description of the need for a new mapping
algorithm between the outcome measures of interest, set, where applicable, within the context
of local methodological guidance for technology appraisal; (ii) an overview of previous
studies developing mapping algorithms, or exploring the key relationships, between the
outcome measures of interest, in the specific disease or population type; and (iii) insight into
how the new mapping algorithm might inform agencies concerned with regulatory and
reimbursement decisions. If a mapping algorithm between the specific source and target
measures assessed in the new study has previously been developed then the need for the new
research should be justified.
Item 4: Study Objective
Recommendation: Specify the research question with reference to the source and target
measures used and the disease or population context of the study.
10

Example: “In this analysis, we sought to map the MSWS-12 onto the EQ-5D in a North
American population with MS, using data from the North American Research Committee on
Multiple Sclerosis (NARCOMS) Registry.”[20]
“The purpose of the current study was to develop an algorithm for generating the EQ-5D
health utility index from the PDQ-8, so that a cost-utility analysis is possible when health
outcomes were assessed only by the PDQ-8 or PDQ-39 in studies of PD.”[21]
Explanation: The introduction should clearly specify the objective or hypothesis addressed
in the mapping study. Correct specification of the research question requires details of the
source and target measures that form the basis of the mapping study, and the disease or
population context of the study. It could also state whether direct mapping (onto index or
utility scores) or indirect (or response) mapping (onto dimension responses), or both, were
applied. Reporting of this item should therefore be considered in conjunction with that for
checklist recommendations 7 (source and target measures) and 10 (modelling approaches)
described below. If several objectives are addressed by the study, the primary objective
should be specified and key secondary objectives stated.
METHODS
Item 5: Estimation Sample
Recommendation: Describe how the estimation sample was identified, why it was selected,
the methods of recruitment and data collection, and its location(s) or setting(s).
Example: “The data were obtained from a study that investigated the relationship between
HRQoL, physical activity, diet and overweight status in children aged 11 to 15. A cross-
sectional survey of four secondary schools in England was carried out[…]Self-reported
demographic information including age, sex and ethnicity was also collected from the
children that completed the survey. The schools were selected on the basis of a close match in
examination results, percentage of children on free school meals and percentage of children
with special educational needs. 2,858 children were asked to participate in an anonymous
survey on two occasions, once in winter and again in summer. There were 869 respondents to
the winter survey and 1000 respondents to the summer survey and so the full dataset
11

comprised of 1,869 sets of responses. The study is described in detail elsewhere[…]It was
decided to use the 1000 respondents to the summer survey for the modelling reported here as
this constituted the larger sample, and to split this sample by geographical area to provide
the estimation (children from two schools in north west England) and validation (children
from two schools in south west England) samples.”[22]
Explanation: The data used to estimate the mapping algorithm may be from an existing
dataset or be collected from a sample recruited specifically for the mapping study. Studies
should report sufficient detail to enable the reader to understand how, and why, the estimation
sample was selected. Details should include the rationale for the selection of the sample,
inclusion and exclusion criteria, rationale for the sample size, methods of recruitment and
data collection, and the location(s) or setting(s) of the sample (see recommendation 15 for
further recommendations on the descriptive statistics that should be presented). When an
existing dataset is used to estimate the mapping algorithm, reference to an appropriate source
giving further details should be provided.
Item 6: External Validation Sample
Recommendation: If an external validation sample was used, the rationale for selection, the
methods of recruitment and data collection, and its location(s) or setting(s) should be
described.
Example: “The external validity of the best mapping algorithm was tested using a dataset
from the Elective Orthopaedics Centre (EOC) that was not made available to the authors
until after the final model was selected. This comprised a large observational cohort of
patients undergoing hip or knee replacement at an NHS treatment centre serving four NHS
trusts in South-West London from January 2004 onwards. Patients completed EQ-5D and
OKS preoperatively and 6, 12 and/or 24 months afterwards. Although recruitment is
ongoing, our analysis included only patients undergoing primary or revision knee
replacement before 31 March 2009 to avoid overlap with PROMs. After excluding patients
with incomplete data on OKS and/or EQ-5D, this external validation dataset included 10,002
observations from 4,505 patients.”[23]
12

Explanation: If an external validation sample is used, the rationale for the selection of the
sample should be provided to allow the reader to judge the generalisability of the external
validation sample to the evaluative context. Information on the methods of recruitment and
data collection, and the location(s) or setting(s) of the sample should be provided (see item 15
for further recommendations on the descriptive statistics that should be presented). When an
existing dataset is used to validate the mapping algorithm, reference to an appropriate source
giving further details should be provided. Key similarities and differences between the
estimation and external validation samples should be described alongside the likely
implications of these. See item 12 for recommendations for reporting validation methods.
Item 7: Source and Target Measures
Recommendation: Describe the source and target measures and the methods by which they
were applied in the mapping study.
Example: “At each assessment, demographic variables were recorded including sex, age,
ethnic origin, education level, current marital status, medical history, and total family
income. Patients also completed the Health Assessment Questionnaire Disability Index
(HAQ), including pain on a visual analogue scale (VAS) scored from 0 to 100 and EQ-5D,
among other items. The HAQ is based on patient reporting of the degree of difficulty the
patient has experienced over the past week in 8 categories: dressing and grooming, arising,
eating, walking, hygiene, reach, grip, and common daily activities. It is scored in increments
of 0.125 between 0 and 3 (although it is standard to consider it fully continuous), with higher
scores representing greater degrees of functional disability. There is a de facto mandatory
requirement for its inclusion in RA clinical trials, and it is also widely used as the driver for
many economic models. UK EQ-5D tariff values (or “index scores”) were applied for this
analysis to aid comparison with results from previous studies.”[24]
Explanation: The report should clearly describe the source and target measures used in the
mapping study. This should include descriptions of the health-related quality of life or health
status instruments, including the specific version(s) used (for example, the language version
of the EQ-5D), alongside any clinical measures. Where applicable, authors should indicate
the number and codification of dimensions (or domains) and levels (or facets) for each
measure. Details of how measures have been collapsed into summary scales should be
13

described, and whether higher scores indicate better or worse outcomes. Where a tariff of
preference-values has been applied to the data, the specific valuation method and source
should be stated. For the estimation sample and, where applicable, the external validation
sample, the report should state the mode of administration of the source and target measures
and the time-points at which they were collected. When an existing dataset is used, reference
to an appropriate source giving further details should be provided.
Item 8: Exploratory Data Analysis
Recommendation: Describe the methods used to assess the degree of conceptual overlap
between the source and target measures.
Example: “The rigor of the mapping approach rests on there being a considerable overlap
between the descriptive systems of the ‘‘starting’’ measure and the ‘‘target’’ measure […].
The overlap between the MSIS-29 and the EQ-5D and between the MSIS-29 and the SF-6D
would be expected to be substantial as each of the measures assesses HRQOL. A
diagrammatic representation of the areas of joint coverage is given in Fig. 1.”[25]
“We started our analyses by exploring the data to find the (dis)similarities between the two
instruments using Spearman correlations. The correlation matrix comprised the inter-item
correlations for all items of both questionnaires. Next, exploratory and confirmatory
principal component analyses (PCA) were applied to explore and compare the underlying
dimensional structures of the two instruments. For the exploratory PCA we selected those
constructs that had an eigenvalue > 1. For the confirmatory PCA we restricted the number of
constructs to those of the target instrument. In order to obtain a more interpretable set of
factors, varimax rotation - an orthogonal rotation of the factor axes - was used to rotate the
factors of both the exploratory and the confirmatory PCA.”[26]
Explanation: The estimation of mapping algorithms between indicators or measures of
health outcome and preference-based generic measures relies on conceptual overlap of the
dimensions (or domains) of the source and target measures. Studies should report if an
assessment of overlap has been made. This may include a qualitative assessment or a
quantitative/statistical assessment of content overlap. If statistical methods are used, report
which were selected and why these were appropriate. Sufficient level of detail describing the
14

statistical methods should be provided (e.g. if principal component analysis (PCA) was used,
report the type(s) of PCA used (e.g. exploratory, confirmatory), the selection criterion for the
extracted components (e.g. eigenvalues > 1; 5 components) and, if applied, the rotation
method (e.g. varimax rotation)).
Item 9: Missing Data
Recommendation: State how much data were missing and how missing data was handled in
the sample(s) used for the analyses.
Example: “Missing values in the eight PDQ-39 domain scores (3.0 %) were computed using
the Expectation–Maximization (EM) algorithm, assuming multivariate normal
distribution.”[27]
“Of all the records, 2471 records (16.0%) were dropped, as they did not have complete and
valid responses for the EQ-5D and SF-12, leaving a sample of 12,967 for analysis.”[28]
Explanation: Missing data may be a feature of the estimation and validation datasets. The
volume of missing data in the relevant datasets and the methods for handling missing data
should be clearly described. Complete case analyses have been widely applied within
mapping studies as they avoid introducing additional hurdles in the development of mapping
algorithms. However, the implementation of a complete cases analysis could reduce the
available sample size(s) significantly. Imputation methods may be applied for specific
source/target data or other variables included in the estimation of mapping algorithms. The
authors should clarify whether any information was imputed. If imputation methods are
implemented, it is important to justify this decision and state the variables that have been
imputed and the technique and software used for the imputation.
Item 10: Modelling Approaches
Recommendation: Describe and justify the statistical model(s) used to develop the mapping
algorithm.
15

Example: “In the response-mapping approach, regression analysis was used to explore the
association between responses to the SF-12 (using either individual items or PCS-12 and
MCS-12 summary scores, plus summary score polynomials and interactions) and responses
to each EQ-5D question[…]As the dependent variables are categorical variables with
discrete outcomes, one option would be the use of ordinal logistic regression to predict the
probability of each response level for each of the 5 questions[…]However, the standard
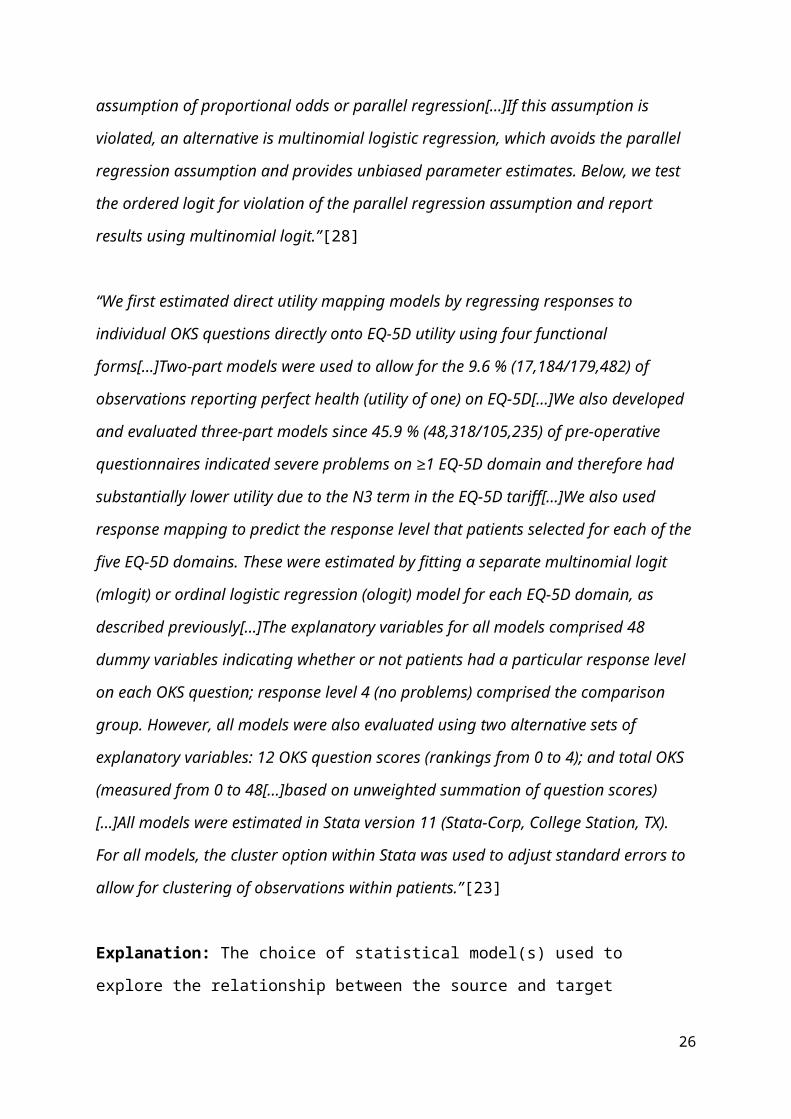
ordered logit model relies on an assumption of proportional odds or parallel regression[…]If
this assumption is violated, an alternative is multinomial logistic regression, which avoids the
parallel regression assumption and provides unbiased parameter estimates. Below, we test
the ordered logit for violation of the parallel regression assumption and report results using
multinomial logit.”[28]
“We first estimated direct utility mapping models by regressing responses to individual OKS
questions directly onto EQ-5D utility using four functional forms[…]Two-part models were
used to allow for the 9.6 % (17,184/179,482) of observations reporting perfect health (utility
of one) on EQ-5D[…]We also developed and evaluated three-part models since 45.9 %
(48,318/105,235) of pre-operative questionnaires indicated severe problems on ≥1 EQ-5D
domain and therefore had substantially lower utility due to the N3 term in the EQ-5D
tariff[…]We also used response mapping to predict the response level that patients selected
for each of the five EQ-5D domains. These were estimated by fitting a separate multinomial
logit (mlogit) or ordinal logistic regression (ologit) model for each EQ-5D domain, as
described previously[…]The explanatory variables for all models comprised 48 dummy
variables indicating whether or not patients had a particular response level on each OKS
question; response level 4 (no problems) comprised the comparison group. However, all
models were also evaluated using two alternative sets of explanatory variables: 12 OKS
question scores (rankings from 0 to 4); and total OKS (measured from 0 to 48[…]based on
unweighted summation of question scores)[…]All models were estimated in Stata version 11
(Stata-Corp, College Station, TX). For all models, the cluster option within Stata was
used to adjust standard errors to allow for clustering of observations within patients.”[23]
Explanation: The choice of statistical model(s) used to explore the relationship between the
source and target measures should be clearly stated and justified. Statistical models used in
mapping studies can be categorised into “direct” methods (onto index or utility scores) and
“indirect” or “response mapping” methods (onto dimensions responses). There are clear
16

advantages and disadvantages of each method and of different estimators, but clear guidance
about which to use in different circumstances is lacking [1]. Therefore, authors should
provide sufficient information about their modelling approach(es) so that readers can assess
the robustness of their overall estimation strategy. The estimators applied (e.g. ordinary least
squares (OLS), beta regression, two-part models) should be specified and justified. The
explanatory variables used in each model should be described, including the components of
the source measure, demographic and clinical characteristics and any first/second degree
polynomials or interaction terms. Authors should describe any selection procedure used to
remove non-significant variables or variables with counter-intuitive signs from the final
model(s). If stepwise regression (e.g. forwards, backwards, bidirectional or manual) was
implemented, this also needs to be described. For datasets with repeated measurements (e.g.
baseline and subsequent observations) for some or all individuals, authors should describe
what (if any) adjustments were made for repeated measures. If models were estimated using
only data at one time point from a longitudinal study (e.g. baseline), this should be stated.
The statistical software used should be reported. Authors should consider making any
programming code for estimation commands not routinely available in statistical packages
accessible to the end user.
Item 11: Estimation of Predicted Scores or Utilities
Recommendation: Describe how predicted scores or utilities are estimated for each model
specification.
Example: “Predictions from direct mapping models were estimated using the ‘predict post-
estimation’ command, with direct back-transformations applied to predictions from GLM and
fractional logit models. For OLS models, any utilities predicted to be >1 were set to one. For
two-part models, the expected utility for each patient was estimated as
Utility=Pr (Utility=1 )+ (1−Pr (Utility=1)) U (1)
where U equals the predicted utility conditional on imperfect health and Pr (Utility=1 ) the
predicted probability of having perfect health.”[23]
17

Explanation: Mapping studies should report sufficient detail to enable readers to understand
how different model specifications were applied. It is appropriate to state the post-estimation
command or option(s) used to generate predictions (particularly if several are available for
that function) and to give details of any back-transformation conducted (e.g. converting
disutilities into utilities or log-utilities to a natural scale). For models, such as OLS, that can
give predictions outside the observed range, reports should state whether values predicted to
be above the maximum for the instrument were set to the maximum (e.g. whether utilities
predicted to be >1 were set to 1). The expected value method [29] is generally the most
appropriate way to estimate predicted utilities for two-part models and response mapping
models; this is equivalent to using an infinite number of Monte Carlo draws [29] and (unlike
the highest or most-likely probability method) gives unbiased predictions.
Item 12: Validation Methods
Recommendation: Describe and justify the methods used to validate the mapping algorithm.
Example: “We employed in-sample cross-validation and out-of-sample validation techniques
to assess how each statistical model would generalize to an independent dataset. The goal
was to estimate how accurately our models predict the EQ-5D utility scores. These methods
provide a better picture of the model’s predictive accuracy than using R2 goodness-of-fit
measures[…]In-sample, cross-validation was performed using a k-fold technique in which
the primary dataset was randomly partitioned into k subsamples (k = 5). One subsample was
retained as the validation data for testing the predictive model, and the remaining 4
subsamples were used as training data. The cross-validation process was then repeated 5
times with each of the 5 subsamples used exactly once as the validation data[…]Out-of-
sample validation was conducted by using the independent validation dataset that contains
both the EQ-5D utility scores and the NEIVFQ 25 dimension scores[…].”[30]
Explanation: Ideally, a new mapping algorithm would be validated in a dataset different
from the one used to generate it [31]. If no validation is conducted, authors should state this
and justify this decision. The methods and datasets used to validate the mapping algorithm
should be described in full. Internal or in-sample validation (assessing model performance in
a subset of the same dataset used to estimate the algorithm) can be useful for avoiding over-
fitting when selecting the best model specification [32, 33]. Methods include a “hold-out
18

approach” (setting aside a proportion of individuals or observations, e.g. 50% or 25%, which
are used only for validation) and repeated k-fold cross-validation or leave-one-out cross-
validation (estimating the statistical model on multiple overlapping estimation samples drawn
repeatedly from the dataset and validating it on the remaining observations). External or out-
of-sample validation can be used to evaluate the final model and assess the prediction
accuracy that is likely to be achieved in other datasets [23]; where possible, the external
validation data would be collected using different methods from the estimation and internal
validation samples and accessed by the researchers developing the mapping algorithm after
the final model was selected [32]. Terminology varies and the same terms are often used to
describe different types of validation methods and datasets, so authors should give a full
account of the type of validation conducted and how it informed model selection.
Item 13: Measures of Model Performance
Recommendation: State and justify the measure(s) of model performance that determine the
choice of the preferred model(s) and describe how these measures were estimated and
applied.
Example: “We present the mean of the estimated EQ-5D, SF-6D index score, mean absolute
error (MAE), mean square error (MSE), and the root MSE (RMSE). The MAE is the average
of absolute differences between observed and estimated scores of all individuals, whereas the
MSE is the expected value of the squared difference between the observed and the estimated
scores[…] Both MAE and MSE measure the average precision at the individual level;
however, the MSE places greater weight on bigger errors. The lower the RMSE, the better
the model is performing. The best-performing models were selected on the basis of those with
the lowest RMSE. Performance of the selected models was then based on the MAE between
the observed and predicted index scores, and the model fit using R2. Although the MAE, MSE,
and RMSE are criteria for evaluating model performance, we present the models that have
the lowest RMSE. This is because the RMSE is measured in the same units as the data, is
representative of the size of a ‘typical’ error, and is more sensitive than other measures to the
occasional large error.”[34]
Explanation: Various measures can be used to assess model performance or choose between
alternative model specifications. Unless all models estimated are reported and given equal
19

prominence, authors should clearly report the primary measure that determined their choice
of preferred model(s) and the dataset in which this was assessed. Wherever possible, the
primary measure of model performance should have been pre-specified before analysis
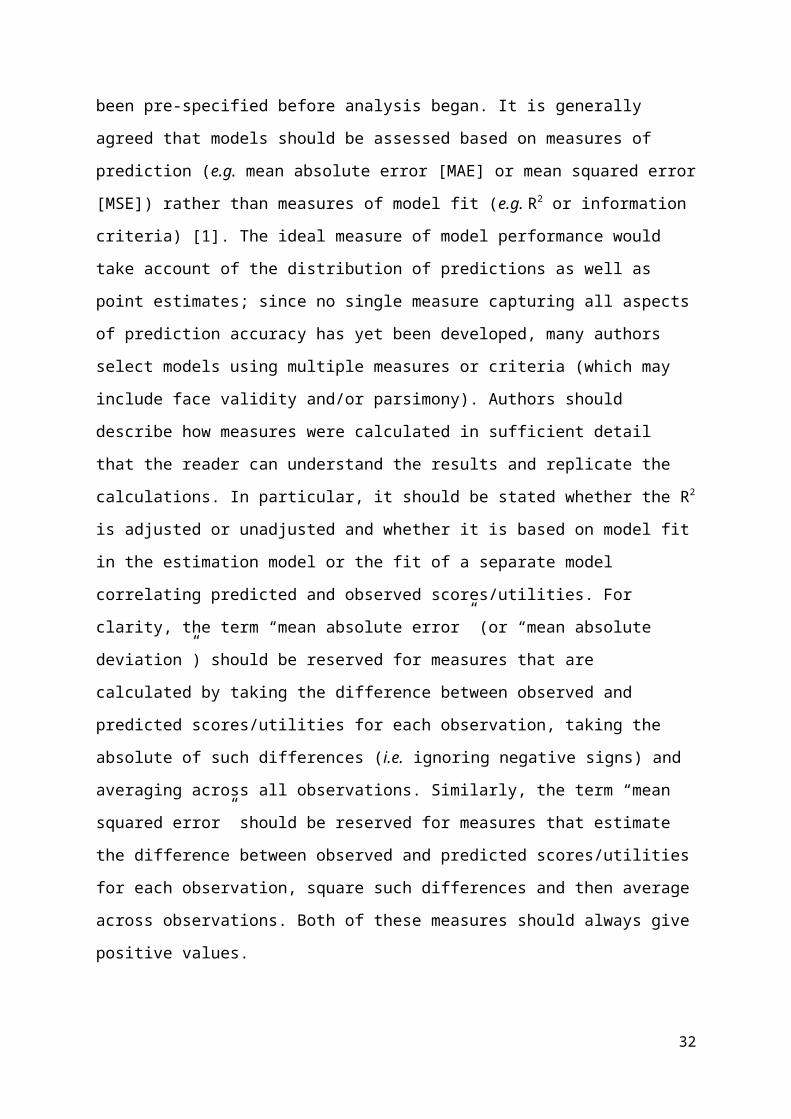
began. It is generally agreed that models should be assessed based on measures of prediction
(e.g. mean absolute error [MAE] or mean squared error [MSE]) rather than measures of
model fit (e.g. R2 or information criteria) [1]. The ideal measure of model performance would
take account of the distribution of predictions as well as point estimates; since no single
measure capturing all aspects of prediction accuracy has yet been developed, many authors
select models using multiple measures or criteria (which may include face validity and/or
parsimony). Authors should describe how measures were calculated in sufficient detail that
the reader can understand the results and replicate the calculations. In particular, it should be
stated whether the R2 is adjusted or unadjusted and whether it is based on model fit in the
estimation model or the fit of a separate model correlating predicted and observed
scores/utilities. For clarity, the term “mean absolute error” (or “mean absolute deviation”)
should be reserved for measures that are calculated by taking the difference between
observed and predicted scores/utilities for each observation, taking the absolute of such
differences (i.e. ignoring negative signs) and averaging across all observations. Similarly, the
term “mean squared error” should be reserved for measures that estimate the difference
between observed and predicted scores/utilities for each observation, square such differences
and then average across observations. Both of these measures should always give positive
values.
RESULTS
Item 14: Final Sample Size(s)
Recommendation: State the size of the estimation sample and any validation sample(s) used
in the analyses (including both number of individuals and number of observations).
Example: “Nine hundred five patients provided multiple observations from different time-
points (mean number of observations per patient 5.365; minimum 3; maximum 8). The actual
number of observations ranged from 3425 to 3945 and for paired comparisons (Table 2)
from 3230 to 3640.”[35]
20

Published with kind permission from Elsevier [35].
Explanation: The sample size for the estimation and any validation sample(s) used in the
analyses should be reported, and given for each model if this varies between models. Useful
information to report will include the number of observations per individual, the total number
of individuals and observations available for each measure, and the number of paired
observations for different combinations of measures. The number of observations may be
smaller than the total sample and may vary between models due to missing data.
Item 15: Descriptive Information
Recommendation: Describe the characteristics of individuals in the sample(s) (or refer back
to previous publications giving such information). Provide summary scores for source and
target measures, and summarise results of analyses used to assess overlap between the source
and target measures.
Example: “The [estimation] dataset contained 154 subjects, male and female at least 55
years of age diagnosed with wet AMD who were otherwise healthy[…]The [validation]
dataset had 401 subjects, male and female at least 50 years of age from Canada, France,
Germany, Spain, and UK[…]A total of 151 subjects were used to map between the NEI-VFQ
25 and the EQ-5D utility scores (Table 2). The majority of subjects were female (2.4:1).
Based on the better-seeing eye VA, most subjects were in the range of mild visual impairment
(n = 77). The mean estimated EQ-5D utility score was 0.7711 (SD = 0.21). Approximately
24% of subjects reported full health (n = 36). Thirty-two unique EQ-5D health states were
reported. For the NEI-VFQ 25 scores, subjects reported scores less than 60 in the domains of
general vision, difficulty with near vision, mental health symptoms due to vision, driving, and
21

role limitations due to vision. Subjects reported the lowest score in the NEI-VFQ 25 driving
dimension (mean = 43.18, SD = 35.82) (Table 3). The estimated EQ-5D utility scores showed
a negative skewness [-1.3445, standard error (SE) = 0.017] indicative of a ceiling effect
(Fig. 1a). Distributions of the 11 vision dimensions and the general health item of the NEI-
VFQ 25 and the EQ-5D utility scores are shown in Fig. 2.”[30]
Explanation: Sufficient descriptive detail should be reported to allow readers to understand
and assess relevant characteristics of the individuals in the estimation sample and any
validation sample. In addition to standard demographic measures, such as age and sex,
relevant characteristics may include disease characteristics, nationality and ethnicity.
Information on the source and target measures in the estimation sample and any validation
sample should include mean scores, standard deviations and ranges. If space permits, readers
may find it helpful if such information is presented or described graphically, for example in
plots showing the distribution of the scores/values of the source and target measures. Such
distributional information will help the reader assess whether the results are robust across the
full potential range of the source and target measures, how generalisable they are to other
populations, and whether the distributional assumptions of certain models are satisfied or
contravened. Formal statistical tests should also be reported in these circumstances.
Results of analyses used to assess overlap between the source and target measures (see
recommendation in Item 8) will require the presentation of narrative or statistical
information, depending on the analytical approach.
Item 16: Model Selection
Recommendation: State which model(s) is(are) preferred and justify why this(these)
model(s) was(were) chosen.
Example: “Based on MSE, the primary measure of prediction accuracy, a response mapping
algorithm using mlogit gave best predictions (MSE: 0.0356; Table 2), followed by the three
part model (MSE: 0.0358). However, the three-part model had lower MAE than mlogit
(0.1338 vs 0.1341). The ologit response mapping (MSE: 0.0359), two-part model (MSE:
0.0360) and OLS (MSE: 0.0363) also performed reasonably well. However, fractional logit
and GLM models gave relatively poor predictions (MSE: 0.0367–0.0397) and systematically
underestimated utilities by an average of 0.00063–0.0025. The mlogit model also
22

overestimated utilities for those with utility <0.5 by less than any other model (mean
residual: 0.160, vs 0.162–0.170) but underestimated utilities for patients with utility ≥0.5 by a
larger amount than any model other than ologit or GLM with gamma link (mean residual: -
0.078, vs -0.075 to -0.076).”[23]
Explanation: Various measures can be used to assess model performance or choose between
alternative model specifications. Authors should therefore clearly report which measure(s) of
model performance determined their choice of preferred model(s) and the dataset(s) in which
this was assessed (see recommendation in Item 13). Authors should report measures of
prediction accuracy for all models and may also provide measures of model fit for all models.
It may also be valuable to report such measures of model performance for subsets, for
example patients in different disease severity categories, or grouped according to
higher/lower health status, as in the example above.
Item 17: Model Coefficients
Recommendation: Provide all model coefficients and standard errors for the selected
model(s). Provide clear guidance on how a user can calculate utility scores based on the
outputs of the selected model(s).
Example: Table 6: Models results for the two best fitting models N=896 [22]
OLS (6) OLS (5)
Coefficient Standard
Error
Coefficient Standard
Error
Age -0.006136 (0.004741)
Gender -0.009385 (0.012292)
PedsQL PF 0.009067*** (0.002571) 0.009127*** (0.002568)
PedsQL EF 0.006807** (0.002533) 0.006611** (0.002530)
PedsQL SF 0.005630* (0.002831) 0.005705* (0.002829)
PedsQL SchF 0.005802* (0.002371) 0.006011* (0.002367)
23

PedsQL PF
Squared
0.000020 (0.000025) 0.000020 (0.000025)
PedsQL EF
Squared
-
0.000049**
(0.000018) -0.000048** (0.000018)
PedsQL SF
Squared
0.000011 (0.000016) 0.000011 (0.000016)
PedsQL SchF
Squared
-0.000017 (0.000015) -0.000017 (0.000015)
PedsQL PF * EF -0.000005 (0.000027) -0.000004 (0.000027)
PedsQL PF * SF -0.000053 (0.000029) -0.000055 (0.000029)
PedsQL PF * SchF -0.000066* (0.000030) -0.000066* (0.000030)
PedsQL EF * SF -0.000011 (0.000023) -0.000009 (0.000023)
PedsQL EF * SchF 0.000061** (0.000021) 0.000059** (0.000021)
PedsQL SF * SchF -0.000026 (0.000022) -0.000027 (0.000022)
Constant -0.335861** (0.118035) -
0.428496***
(0.094210)
Observations 896 896
Adjusted R2 0.2870 0.2868
MSE .0315 .0316
MAE .1063 .1067
Standard errors in parentheses * p < 0.05, ** p < 0.01, *** p < 0.001
PF, Physical Functioning; EF, Emotional Functioning; SF, Social Functioning;
SchF, School Functioning.
Published with kind permission from Springer Science and Business Media [22].
“For example, using the domain model, HUI3 utility is equal to:
1 − (0.06315 × DEV + 0.02621 × PHYS + 0.02349 × RHD − 0.00346 × HL − 0.00059 × A
GE − 0.01363 × FEMALE), where: age is in months; HL is in dB; DEV, PHYS and RHD
comprise OM8-30 domain/facet scores calculated using the standard scoring based on the
TARGET and Eurotitis datasets; and FEMALE is a dummy variable equal to 1 if the patient
is female and 0 if they are male.”[36]
24

Explanation: The results section of the report should provide sufficient information to enable
readers to calculate predicted utility scores for individuals in their own datasets based on the
outputs of the selected model(s). For all studies using regression techniques, authors should
therefore provide all model coefficients and their respective standard errors or 95%
confidence intervals for the selected model(s) (see also recommendation in Item 18). Studies
using other methods (e.g. Bayesian networks or cross-tabulation) should present all of the
necessary data or code for generating predictions, using an online appendix if appropriate.
Authors should provide sufficient detail to enable users to calculate predicted utility scores
from the coefficients reported and individual-level variation (see recommendation in Item
18), including information on how all variables were coded. It is recommended to also
provide an example in the text of how a user can calculate a utility score for an example
health state based on the selected model(s). For complex models (e.g. response mapping
models), it may be appropriate to provide separate syntax (e.g. [29]) in an online appendix
that will allow users to calculate predicted utilities.
Item 18: Uncertainty
Recommendation: Report information that enables users to estimate standard errors around
mean utility predictions and individual-level variability.
Example: “The covariance between mean PCS and MCS scores was 0.0133. The residual
variance estimate from the derivation sample was 0.02295.”[37]
“Probabilistic sensitivity analysis was used to allow for uncertainty in mapping coefficients
for the best performing FACT-G model. Regression coefficients were assumed to follow a
normal distribution and the covariance matrix for the model was used to allow for variability
and correlations between variables. It was necessary to run 100,000 simulations to obtain
convergence to a mean across simulations. For each simulation mean, the EQ-5D score was
calculated and percentiles were used to summarise the variability around the mean
estimate.”[38]
Explanation: Authors should provide information that enables users of the mapping
algorithm to accurately estimate standard errors around mean predicted utilities, individual
level predictions and associated variability. Most mapping studies published to date have
25
failed to report this information in sufficient detail, which may have resulted in an
underestimation of uncertainty [31]. This can seriously impact the subsequent estimation of
confidence intervals associated with treatment effects in a clinical study or the precision of
the incremental cost-effectiveness ratio in an economic evaluation. There are several methods
in the literature that permit the estimation of variances in mapping studies, including
parametric methods [37], non-parametric methods [39] and probabilistic sensitivity analysis
[40]. Although the information requirements vary between methods, all regression-based
mapping studies should report the variance-covariance matrix and residual error of the
original estimation and either the MAE, MSE or root-MSE for their selected model(s); for all
but the simplest models, the variance-covariance matrix may be best presented as an online
appendix.
Item 19: Model Performance and Face Validity
Recommendation: Present results of model performance, such as measures of prediction
accuracy and fit statistics for the selected model(s) in a table or in the text. Provide an
assessment of face validity of the selected model(s).
Example:
Source: Table 17, p81 [38]. Published with kind permission from the NIHR Journals Library [38].
26

“The only one of the 11 items that had an unexpected negative effect (although it was not
significant) was the first item in the Role-Emotional Function (RE) dimension. This item was
therefore dropped in the reduced model. For the two items in the Mental Health (MH)
dimension, we also had to combine two response alternatives to get a consistent regression
equation.”[41]
Explanation: The prediction accuracy of the selected model(s), including estimates of MAE
and/or MSE for the estimation dataset and all validation datasets, should be presented in
tables or in the text. Fit statistics such as R2 values or information criteria, such as Akaike
Information Criterion (AIC) and Bayesian Information Criterion (BIC) statistics, may also be
provided for the selected model(s). Presentation of measures of model performance for
different subgroups of individuals, for example those with good health and those with poor
health, or individuals stratified by subset ranges of utility scores across the target measure,
may provide readers an indication of the likely performance of the selected model(s) in
different clinical contexts [31]. Scatter plots showing the correlation between observed and
predicted utility values generated by the selected model(s) are also a useful aid to readers. In
order to inform readers about the face validity of the selected model(s), authors should state
whether all model coefficients have the expected signs, indicating that worse health in the
source measure is associated with lower utility scores in the target measure. Where authors
have sufficient information to make a priori hypotheses about the relative magnitude of the
model coefficients, authors should state whether those hypotheses were supported. The
rationale for including (or excluding) variables with unexpected coefficient signs or
magnitudes from the selected model(s) should be given and the implications should be
discussed, along with any possible explanations.
DISCUSSION
Item 20: Comparisons with Previous Studies
Recommendation: Report details of previously published studies developing mapping
algorithms between the same source and target measures and describe differences between
the algorithms, in terms of model performance, predictions and coefficients, if applicable.
27

Example: “Our models are compared to existing approaches[…]to determine whether their
mapping approaches are more or less reliable for a patient dataset. The existing models from
the literature are estimated using the published results and algorithms rather than re-
estimating the models using our dataset. We take this approach because mapping is used in
economic evaluations to estimate the EQ-5D using the SF-36 (or SF-12) when this is the only
health status measure that has been included in the trial. Therefore in practical applications
the published results and algorithms are used and it is not feasible to re-estimate the model…
Figure 2 shows observed and predicted EQ-5D utility scores for model (3) and for existing
approaches[…]The mapping relationship is similar across all approaches and they all
overpredict for more severe EQ-5D states. Table 3 shows mean error, mean absolute error
and mean square error of predicted compared to actual utility scores by EQ-5D utility range
for existing approaches[…]As indicated by Figure 2, the errors are higher for more severe
health states for all models. Our model performs better than the existing models as reported
by mean error, mean absolute error and mean square error.”[42]
“The approach used in the present study and the relation functions obtained are consistent
with previous studies reported in the literature using the HUI-3[…] and EQ-5D
questionnaires […]. An analysis of adalimumab trial data of almost 2000 patients permitted
transformation from HAQ-DI to HUI-3 (HUI-3 utility_0.76 – 0.286HAQ-
DI_0.056FEMALE), with an R2 measure of 0.49 […]. Despite the inclusion of gender, the R2
obtained in the referenced study was slightly lower than that obtained in the present study
(0.56). The comparison of the EQ-5D function with that reported previously is not directly
due to the different methodological approaches used. Although the final HAQ-DI scores in
the present study has been used to obtain the relation function, in the referenced study, the
individual scores were used. The methodology used in the present study resulted in a really
simple model with an acceptable R2 (0.54), only slightly lower than that obtained in the
referenced study. The added value of the utility equations calculated in our study is that they
reflect cultural differences in how patients with RA self-report their health state and utility
[…]. This generates more accurate estimates, given their grounding in studies with samples
of patients conforming to national, cultural, and disease characteristics.”[43]
Explanation: If alternative mapping algorithms between the source and target measures have
been developed by other studies, information on similarities and differences will be helpful
for the reader to judge the relative merits of the new algorithm. The authors should discuss
28

the degree of consistency of model performance with previous studies. Differences in the
range of predicted values for the target measure(s), and the degree of over-estimation of
utilities for poor health and under-estimation of utilities for good health should be considered
in comparisons of model performance. If previous studies have been conducted in the same
or similar disease area or population group, authors should also report systematic differences
in coefficient values for the same health domains between studies. If possible, previously
published mapping algorithms should be applied to the estimation dataset and a comparison
made of the predictions from the published models with the predictions from the new
algorithm. A discussion of differences in the mapping algorithms should be provided with a
consideration of the likely cause(s).
Item 21: Study Limitations
Recommendation: Outline the potential limitations of the mapping algorithm.
Example: “The analyses and results from the MIC study presented here are subject to five
limitations. Firstly, data were obtained from respondents registered with a panel company,
and may differ from the norm, minimally, in their willingness to complete online
questionnaires[…]Secondly, in order to minimise the response burden, respondents were
only asked to specify whether they had a current diagnosis of heart disease and whether
heart disease was their most serious illness. Consequently there was no information
regarding the type of heart disease or the duration of the illness. Greater precision may have
been achieved in the crosswalk functions with additional information. Thirdly, the same
algorithm was used to calculate the utilities for each of the six MAU instruments in each of
the countries. In principle, it would be better to adopt country-specific algorithms to
calculate the utilities for each instrument and for each country[…]Fourthly, three regression
estimators have been used in this study to develop mapping algorithms. Other candidate
techniques might also be considered, such as the censored least absolute deviations model
and the two-part model[…]The final limitation with the present results is that the mapping
algorithms have not been validated using external datasets. This is not uncommon in
published mapping studies when data are limited. However, external validation is an
important topic for further research.”[44]
29

Explanation: The limitations of the mapping algorithm should be discussed in order to help
potential users of the algorithm judge its applicability to their research or decision-making
context, and to allow them to couch its application with the appropriate caveats. These
limitations could include weaknesses in the accuracy of predictions, potential biases in the
estimation sample and whether the mapping algorithm performs less well for specific clinical
or population subgroups. Consideration should also be given to whether alternative
approaches or model specifications could have been used, the extent to which the authors
have been able to validate the final algorithm and any potential lack of generalisability to
specific patient or population groups.
Item 22: Scope of Applications
Recommendation: Outline the clinical and research settings in which the mapping algorithm
could be used.
Example: “The mapping was very successful in this study in that the model predicted the
EQ-5D levels and QALYs well for a separate data set. The question arises whether these
results are generalizable. The data used were collected from patients with esophageal
cancer. An advantage of this data set was that there were sufficient numbers of patients in
each of the levels of the five EQ-5D dimensions. This patient group, however, is unlikely to be
representative of the “average” cancer patient group. As well as the type and stage of cancer
factors such as age and sex may affect the predictive performance of the model. Although the
results showed that the model did predict well for a group of patients with different type of
cancer, namely breast cancer, the average age of the patients was similar in the two data
sets. Further research exploring predictive performance for different patient groups is clearly
required before the application of the model should become a recommended approach for
converting the EORTC QLQ-C30 data into EQ-5D values.”[45]
Explanation: Authors should indicate the circumstances in which they recommend the
application of the mapping algorithm in clinical contexts and future research studies,
including the specific patient and population groups in which it can be used. Authors should
also note the circumstances in which the presented algorithm should not be used.
OTHER
30

Item 23: Additional Information
Recommendation: Describe the source(s) of funding and non-monetary support for the
study, and the role of the funder(s) in its design, conduct and report. Report any conflicts of
interest surrounding the roles of authors and funders.
Example: “Acorda Therapeutics provided funding to support this research. The authors
maintained full control over the design and conduct of the study; collection, management,
analysis, and interpretation of the data; and preparation and review of the manuscript.
Acorda Therapeutics reviewed the final manuscript prior to submission.”[46]
“The authors declare that they have no competing interests.”[47]
Explanation: Although we are not aware of any evidence that suggests the funding source
may impart biases within the design and results of a mapping study, authors should be
transparent about the source(s) of funding for the study. Similarly, authors should report any
in-kind support or other sources of support for the study, for example, statistical or broader
research assistance and writing assistance by individuals or groups not included in the
authorship. The transparency surrounding source(s) of funding and nonmonetary support
required by other recent health-related reporting guidelines [12, 14] should also be followed
for mapping studies. The role of the funder(s) in its design, conduct and reporting of the
mapping study should be outlined. Furthermore, authors should report any real or perceived
conflicts of interests surrounding either their own roles or the role(s) of the funders(s) in the
study.
Discussion
Over recent years, there has been a rapid increase in the publication of studies that use
mapping techniques to predict health utility values. One recent review article identified
ninety studies published up to the year 2013 reporting 121 mapping algorithms between
clinical or health-related quality of life measures and the EQ-5D [2]. That review article
excluded mapping algorithms targeted at other generic preference-based outcome measures
that can generate health utilities, such as the SF-6D [48] and the Health Utilities Index (HUI)
31
[49], which have been the target of numerous other mapping algorithms (e.g. [50-54, 44, 1]).
Moreover, the popularity of the mapping approach for estimating health utilities is unlikely to
wane given the numerous contexts within health economic evaluation where primary data
collection is challenging. However, mapping introduces additional uncertainty and collection
of primary data with the preferred utility instrument is preferable.
The MAPS reporting statement was developed to provide recommendations, in the form
of a checklist of essential items, which authors should consider when reporting mapping
studies. Guidance for the reporting of mapping studies was not previously available in the
literature. The overall aim of MAPS is to promote clarity, transparency and completeness of
reporting of mapping studies. It is not intended to act as a methodological guide, nor as a tool
for assessing the quality of study methodology. Rather, it aims to avoid misleading
conclusions being drawn by readers, and ultimately policy makers, as a result of sub-optimal
reporting. In keeping with other recent health research reporting guidelines, this article
comprises an Explanation and Elaboration document to facilitate a deeper understanding of
the 23 items contained within the MAPS reporting statement. It should hopefully act as a
pedagogical framework for researchers reporting mapping studies. The structure of the
Explanation and Elaboration document follows that of other recent reporting explanatory
documents [9-14].
The development of the MAPS reporting statement, and its Explanation and Elaboration
document, was framed by recently published guidance for health research reporting
guidelines [5]. The Delphi panel was composed of a multi-disciplinary, multi-national team
of content experts and journal editors. The panel members included people experienced in
conducting mapping studies; of the 84 researchers who were first authors on papers included
in a recent review of EQ-5D mapping studies [2], 31 (36.9%) were included as panellists. We
have no evidence to believe that a larger panel would have altered the final set of
recommendations. The Delphi methodologies that we applied included analytical approaches
only recently adopted by developers of health reporting guidelines [15]. We are unable to
assess whether a strict adherence to the MAPS checklist will increase the word counts of
mapping reports. It is our view that the increasing use of online appendices by journals
should permit comprehensive reporting even in the context of strict word limits for the main
body of reports.
Evidence for other health research reporting guidelines suggests that reporting quality
improved after the introduction of reporting checklists [55-57], although there is currently no
empirical evidence that adoption of MAPS will improve the quality of reporting of mapping
32

research. Future research planned by the MAPS working group will include a before and after
evaluation of the benefits (and indeed possible adverse effects) of the introduction of the
MAPS reporting statement. It will also be necessary to update the MAPS reporting statement
in the future to address conceptual, methodological and practical advances in the field.
Potential methodological advances that might be reflected in an update might include shifts
towards more complex model specifications, better methods for dealing with uncertainty, and
guidance on appropriate use of measures of prediction accuracy, such as MAE and MSE. The
MAPS working group plans to assess the need for an update of the reporting checklist in five
years’ time.
In conclusion, this paper provides a detailed elaboration and explanation of the MAPS
reporting statement. We encourage health economic and quality of life journals to endorse
MAPS, promote its use in peer review and update their editorial requirements and
‘Instructions to Authors’ accordingly.
33

Acknowledgments
We are grateful to the following individuals, who consented to being acknowledged publicly,
for their comments and participation in the Delphi Panel: Roisin Adams, Roberta Ara, Nick
Bansback, Garry Barton, Andy Briggs, Chris Carswell, Gang Chen, Doug Coyle, Ralph
Crott, Richard Edlin, Alastair Fischer, Juan Manuel Ramos-Goñi, Ola Ghatnekar, Patrick
Gillard, Ning Yan Gu, Annie Hawton, Haomiao Jia, Kamran Khan, Billingsley Kaambwa,
Nick Kontodimopoulos, Quang Le, Jason Madan, Katherine MacGilchrist, David Meads,
Duncan Mortimer, Bhash Naidoo, Angus Ng, Nalin Payakachat, Simon Pickard, Rafael
Pinedo-Villanueva, Eleanor Pullenayegum, Jeff Richardson, Janet Robertson, Jeff Round,
Donna Rowen, Sean Rundell, Paulos Teckle, Matthijs Versteegh, Feng Xie, and Tracey
Young.
There are no conflicts of interest to declare. All authors contributed to the study design and
conduct, interpretation of results and report writing. SP acts as the guarantor.
Source of financial support: None. All members of the working group acted on a voluntary
basis.
34

References
1. Brazier JE, Yang Y, Tsuchiya A, Rowen DL. A review of studies mapping (or cross walking) non-preference based measures of health to generic preference-based measures. Eur J Health Econ. 2010;11(2):215-25. doi:10.1007/s10198-009-0168-z. 1425919854.
2. Dakin H. Review of studies mapping from quality of life or clinical measures to EQ-5D: an online database. Health Qual Life Outcomes. 2013;11:151. doi:10.1186/1477-7525-11-151. 1425925341.
3. Chuang LH, Whitehead SJ. Mapping for economic evaluation. Br Med Bull. 2012;101:1-15. doi:10.1093/bmb/ldr049. 1427393724.
4. Longworth L, Rowen D. NICE DSU Technical Support Document 10: The Use of Mapping Methods to Estimate Health State Utility Values. Sheffield, UK: Decision Support Unit, ScHARR, University of Sheffield2011.
5. Moher D, Schulz KF, Simera I, Altman DG. Guidance for developers of health research reporting guidelines. PLoS Med. 2010;7(2):e1000217. doi:10.1371/journal.pmed.1000217. 1425988566.
6. Moher D, Simera I, Schulz KF, Hoey J, Altman DG. Helping editors, peer reviewers and authors improve the clarity, completeness and transparency of reporting health research. BMC Med. 2008;6:13. doi:10.1186/1741-7015-6-13. 1425989043.
7. Narahari SR, Ryan TJ, Aggithaya MG, Bose KS, Prasanna KS. Evidence-based approaches for the Ayurvedic traditional herbal formulations: toward an Ayurvedic CONSORT model. J Altern Complement Med. 2008;14(6):769-76. doi:10.1089/acm.2007.0818. 1425997359.
8. Mortimer D, Segal L, Sturm J. Can we derive an 'exchange rate' between descriptive and preference-based outcome measures for stroke? Results from the transfer to utility (TTU) technique. Health Qual Life Outcomes. 2009;7:33. doi:10.1186/1477-7525-7-33. 1426002631.
9. Bossuyt PM, Reitsma JB, Bruns DE, Gatsonis CA, Glasziou PP, Irwig LM et al. The STARD statement for reporting studies of diagnostic accuracy: explanation and elaboration. Ann Intern Med. 2003;138(1):W1-12. 1426070562.
10. Tong A, Sainsbury P, Craig J. Consolidated criteria for reporting qualitative research (COREQ): a 32-item checklist for interviews and focus groups. Int J Qual Health Care. 2007;19(6):349-57. doi:10.1093/intqhc/mzm042. 1426070607.
11. Vandenbroucke JP, von Elm E, Altman DG, Gotzsche PC, Mulrow CD, Pocock SJ et al. Strengthening the Reporting of Observational Studies in Epidemiology (STROBE): explanation and elaboration. PLoS Med. 2007;4(10):e297. doi:10.1371/journal.pmed.0040297. 1426070521.
12. Liberati A, Altman DG, Tetzlaff J, Mulrow C, Gotzsche PC, Ioannidis JP et al. The PRISMA statement for reporting systematic reviews and meta-analyses of studies that evaluate health care interventions: explanation and elaboration. J Clin Epidemiol. 2009;62(10):e1-34. doi:10.1016/j.jclinepi.2009.06.006. 1426070400.
13. Moher D, Hopewell S, Schulz KF, Montori V, Gotzsche PC, Devereaux PJ et al. CONSORT 2010 explanation and elaboration: updated guidelines for reporting parallel group randomised trials. BMJ. 2010;340:c869. doi:10.1136/bmj.c869. 1426070468.
14. Husereau D, Drummond M, Petrou S, Carswell C, Moher D, Greenberg D et al. Consolidated Health Economic Evaluation Reporting Standards (CHEERS)--explanation and elaboration: a report of the ISPOR Health Economic Evaluation Publication Guidelines Good Reporting Practices Task Force. Value Health. 2013;16(2):231-50. doi:10.1016/j.jval.2013.02.002. 1426070220.
35

15. Fitch K, Bernstein S, Aguilar M, Burnand B, LaCalle J, Lazaro P, van het Loo M, McDonnell J, Vader J, Kahan J. The RAND/UCLA Appropriateness Method User’s Manual. Santa Monica 2001.
16. Badia X, Roset M, Valassi E, Franz H, Forsythe A, Webb SM. Mapping CushingQOL scores to EQ-5D utility values using data from the European Registry on Cushing's syndrome (ERCUSYN). Qual Life Res. 2013;22(10):2941-50. doi:10.1007/s11136-013-0396-7. 1426171638.
17. Khan KA, Madan J, Petrou S, Lamb SE. Mapping between the Roland Morris Questionnaire and generic preference-based measures. Value Health. 2014;17(6):686-95. doi:10.1016/j.jval.2014.07.001. 1426171738.
18. Wong HL, Truong D, Mahamed A, Davidian C, Rana Z, Einarson TR. Quality of structured abstracts of original research articles in the British Medical Journal, the Canadian Medical Association Journal and the Journal of the American Medical Association: a 10-year follow-up study. Curr Med Res Opin. 2005;21(4):467-73. 1426171950.
19. Kaambwa B, Billingham L, Bryan S. Mapping utility scores from the Barthel index. Eur J Health Econ. 2013;14(2):231-41. doi:10.1007/s10198-011-0364-5. 1426172138.
20. Sidovar MF, Limone BL, Lee S, Coleman CI. Mapping the 12-item multiple sclerosis walking scale to the EuroQol 5-dimension index measure in North American multiple sclerosis patients. BMJ Open. 2013;3(5). doi:10.1136/bmjopen-2013-002798. 1427580445.
21. Cheung YB, Tan LC, Lau PN, Au WL, Luo N. Mapping the eight-item Parkinson's Disease Questionnaire (PDQ-8) to the EQ-5D utility index. Qual Life Res. 2008;17(9):1173-81. doi:10.1007/s11136-008-9392-8. 1426172378.
22. Khan KA, Petrou S, Rivero-Arias O, Walters SJ, Boyle SE. Mapping EQ-5D utility scores from the PedsQL generic core scales. Pharmacoeconomics. 2014;32(7):693-706. doi:10.1007/s40273-014-0153-y. 1426172459.
23. Dakin H, Gray A, Murray D. Mapping analyses to estimate EQ-5D utilities and responses based on Oxford Knee Score. Qual Life Res. 2013;22(3):683-94. doi:10.1007/s11136-012-0189-4. 1426172714.
24. Hernandez Alava M, Wailoo A, Wolfe F, Michaud K. The relationship between EQ-5D, HAQ and pain in patients with rheumatoid arthritis. Rheumatology (Oxford). 2013;52(5):944-50. doi:10.1093/rheumatology/kes400. 1426173050.
25. Hawton A, Green C, Telford CJ, Wright DE, Zajicek JP. The use of multiple sclerosis condition-specific measures to inform health policy decision-making: mapping from the MSWS-12 to the EQ-5D. Mult Scler. 2012;18(6):853-61. doi:10.1177/1352458511429319. 1426173141.
26. Oppe M, Devlin N, Black N. Comparison of the underlying constructs of the EQ-5D and Oxford Hip Score: implications for mapping. Value Health. 2011;14(6):884-91. doi:10.1016/j.jval.2011.03.003. 1426173274.
27. Young MK, Ng SK, Mellick G, Scuffham PA. Mapping of the PDQ-39 to EQ-5D scores in patients with Parkinson's disease. Qual Life Res. 2013;22(5):1065-72. doi:10.1007/s11136-012-0231-6. 1426173407.
28. Gray AM, Rivero-Arias O, Clarke PM. Estimating the association between SF-12 responses and EQ-5D utility values by response mapping. Med Decis Making. 2006;26(1):18-29. doi:10.1177/0272989X05284108. 1426173679.
29. Ramos-Goñi J, Rivero-Arias, O, Dakin, H. . Response mapping to translate health outcomes into the generic health-related quality of life instrument EQ-5D: Introducing the mrs2eq and oks2eq commands Stata Journal 2013;13:474-91. 1426174053.
36

30. Payakachat N, Summers KH, Pleil AM, Murawski MM, Thomas J, 3rd, Jennings K et al. Predicting EQ-5D utility scores from the 25-item National Eye Institute Vision Function Questionnaire (NEI-VFQ 25) in patients with age-related macular degeneration. Qual Life Res. 2009;18(7):801-13. doi:10.1007/s11136-009-9499-6. 1426174588.
31. Longworth L, Rowen D. Mapping to obtain EQ-5D utility values for use in NICE health technology assessments. Value Health. 2013;16(1):202-10. doi:10.1016/j.jval.2012.10.010. 1426174703.
32. Eriksson L JE, Kettaneh-Wold N, Trygg J, Wikström C, Wold S. . Appendix I: Model derivation, interpretation and validation. Multi- and megavariate data analysis Part 1: Basic principles and applications. 2nd ed. Umea, Sweden: MKS Umetrics AB; 2006.
33. Blum A KA, Langford J. , editor. Beating the hold-out: bounds for K-fold and progressive cross-validation. . 12th Annual Conference on Computational Learning Theory.; 1999; New York: ACM.
34. Browne C, Brazier J, Carlton J, Alavi Y, Jofre-Bonet M. Estimating quality-adjusted life years from patient-reported visual functioning. Eye (Lond). 2012;26(10):1295-301. doi:10.1038/eye.2012.137. 1426175835.
35. Buxton MJ, Lacey LA, Feagan BG, Niecko T, Miller DW, Townsend RJ. Mapping from disease-specific measures to utility: an analysis of the relationships between the Inflammatory Bowel Disease Questionnaire and Crohn's Disease Activity Index in Crohn's disease and measures of utility. Value Health. 2007;10(3):214-20. doi:10.1111/j.1524-4733.2007.00171.x. 1426175976.
36. Dakin H, Petrou S, Haggard M, Benge S, Williamson I. Mapping analyses to estimate health utilities based on responses to the OM8-30 Otitis Media Questionnaire. Qual Life Res. 2010;19(1):65-80. doi:10.1007/s11136-009-9558-z. 1426176218.
37. Lawrence WF, Fleishman JA. Predicting EuroQoL EQ-5D preference scores from the SF-12 Health Survey in a nationally representative sample. Med Decis Making. 2004;24(2):160-9. doi:10.1177/0272989X04264015. 1426176452.
38. Longworth L, Yang Y, Young T, Mulhern B, Hernandez Alava M, Mukuria C et al. Use of generic and condition-specific measures of health-related quality of life in NICE decision-making: a systematic review, statistical modelling and survey. Health Technol Assess. 2014;18(9):1-224. doi:10.3310/hta18090. 1426176376.
39. Chan KK, Willan AR, Gupta M, Pullenayegum E. Underestimation of uncertainties in health utilities derived from mapping algorithms involving health-related quality-of-life measures: statistical explanations and potential remedies. Med Decis Making. 2014;34(7):863-72. doi:10.1177/0272989X13517750. 1426176681.
40. Ara R, Wailoo A. Using health state utility values in models exploring the cost-effectiveness of health technologies. Value Health. 2012;15(6):971-4. doi:10.1016/j.jval.2012.05.003. 1426176898.
41. Lundberg L, Johannesson M, Isacson DG, Borgquist L. The relationship between health-state utilities and the SF-12 in a general population. Med Decis Making. 1999;19(2):128-40. 1426177133.
42. Rowen D, Brazier J, Roberts J. Mapping SF-36 onto the EQ-5D index: how reliable is the relationship? Health Qual Life Outcomes. 2009;7:27. doi:10.1186/1477-7525-7-27. 1426177260.
43. Carreno A, Fernandez I, Badia X, Varela C, Roset M. Using HAQ-DI to estimate HUI-3 and EQ-5D utility values for patients with rheumatoid arthritis in Spain. Value Health. 2011;14(1):192-200. doi:10.1016/j.jval.2010.11.001. 1427583263.
44. Chen G, McKie J, Khan MA, Richardson JR. Deriving health utilities from the MacNew Heart Disease Quality of Life Questionnaire. Eur J Cardiovasc Nurs. 2014. doi:10.1177/1474515114536096. 1426245245.
37

45. McKenzie L, van der Pol M. Mapping the EORTC QLQ C-30 onto the EQ-5D instrument: the potential to estimate QALYs without generic preference data. Value Health. 2009;12(1):167-71. doi:10.1111/j.1524-4733.2008.00405.x. 1426177467.
46. Limone BL, Sidovar MF, Coleman CI. Estimation of the effect of dalfampridine-ER on health utility by mapping the MSWS-12 to the EQ-5D in multiple sclerosis patients. Health Qual Life Outcomes. 2013;11:105. doi:10.1186/1477-7525-11-105. 1426177579.
47. Goldsmith KA, Dyer MT, Buxton MJ, Sharples LD. Mapping of the EQ-5D index from clinical outcome measures and demographic variables in patients with coronary heart disease. Health Qual Life Outcomes. 2010;8:54. doi:10.1186/1477-7525-8-54. 1426177668.
48. Brazier J, Roberts J, Deverill M. The estimation of a preference-based measure of health from the SF-36. J Health Econ. 2002;21(2):271-92. 1426244550.
49. Feeny D, Furlong W, Boyle M, Torrance GW. Multi-attribute health status classification systems. Health Utilities Index. Pharmacoeconomics. 1995;7(6):490-502. 1426244646.
50. Yang Y, Wong MY, Lam CL, Wong CK. Improving the mapping of condition-specific health-related quality of life onto SF-6D score. Qual Life Res. 2014;23(8):2343-53. doi:10.1007/s11136-014-0668-x. 1426244912.
51. Lee L, Kaneva P, Latimer E, Feldman LS. Mapping the Gastrointestinal Quality of Life Index to short-form 6D utility scores. J Surg Res. 2014;186(1):135-41. doi:10.1016/j.jss.2013.08.006. 1426244970.
52. Roset M, Badia X, Forsythe A, Webb SM. Mapping CushingQoL scores onto SF-6D utility values in patients with Cushing's syndrome. Patient. 2013;6(2):103-11. doi:10.1007/s40271-013-0010-7. 1426245033.
53. Payakachat N, Tilford JM, Kuhlthau KA, van Exel NJ, Kovacs E, Bellando J et al. Predicting health utilities for children with autism spectrum disorders. Autism Res. 2014;7(6):649-63. doi:10.1002/aur.1409. 1426245111.
54. Goldfeld KS, Hamel MB, Mitchell SL. Mapping health status measures to a utility measure in a study of nursing home residents with advanced dementia. Med Care. 2012;50(5):446-51. doi:10.1097/MLR.0b013e3182407e0d. 1426245177.
55. Moher D, Jones A, Lepage L, Group C. Use of the CONSORT statement and quality of reports of randomized trials: a comparative before-and-after evaluation. JAMA. 2001;285(15):1992-5. 1426256489.
56. Delaney A, Bagshaw SM, Ferland A, Manns B, Laupland KB, Doig CJ. A systematic evaluation of the quality of meta-analyses in the critical care literature. Crit Care. 2005;9(5):R575-82. doi:10.1186/cc3803. 1426256559.
57. Plint AC, Moher D, Morrison A, Schulz K, Altman DG, Hill C et al. Does the CONSORT checklist improve the quality of reports of randomised controlled trials? A systematic review. Med J Aust. 2006;185(5):263-7. 1426256647.
38

Table 1: Checklist of item to include when reporting a mapping study
Section/Topic Item Number
Recommendation Reported on Page Number/ Line Number
Title and abstractTitle 1 Identify the report as a mapping study between outcome measures. State the
source measure(s) and generic, preference-based target measure(s) used in the study. _____________
Abstract 2 Provide a structured abstract including, as applicable: objectives; methods, including data sources and their key characteristics, outcome measures used and estimation and validation strategies; results, including indicators of model performance; conclusions; and implications of key findings. _____________
IntroductionStudy rationale 3 Describe the rationale for the mapping study in the context of the broader
evidence base. _____________Study objective 4 Specify the research question with reference to the source and target
measures used and the disease or population context of the study. _____________Methods
Estimation sample 5 Describe how the estimation sample was identified, why it was selected, the methods of recruitment and data collection, and its location(s) or setting(s). _____________
External validation sample
6 If an external validation sample was used, the rationale for selection, the methods of recruitment and data collection, and its location(s) or setting(s) should be described. ____________
Source and Target measures
7 Describe the source and target measures and the methods by which they were applied in the mapping study. _____________
Exploratory data analysis 8 Describe the methods used to assess the degree of conceptual overlap between the source and target measures. _____________
Missing data 9 State how much data were missing and how missing data was handled in the sample(s) used for the analyses. _____________
Modelling approaches 10 Describe and justify the statistical model(s) used to develop the mapping algorithm. _____________
39

Estimation of predicted scores or utilities
11 Describe how predicted scores or utilities are estimated for each model specification. _____________
Validation methods 12 Describe and justify the methods used to validate the mapping algorithm. _____________Measures of model
performance13 State and justify the measure(s) of model performance that determine the
choice of the preferred model(s) and describe how these measures were estimated and applied. _____________
ResultsFinal sample size(s) 14 State the size of the estimation sample and any validation sample(s) used in
the analyses (including both number of individuals and number of observations). _____________
Descriptive information 15 Describe the characteristics of individuals in the sample(s) (or refer back to previous publications giving such information). Provide summary scores for source and target measures, and summarise results of analyses used to assess overlap between the source and target measures. _____________
Model selection 16 State which model(s) is(are) preferred and justify why this(these) model(s) was(were) chosen. _____________
Model coefficients 17 Provide all model coefficients and standard errors for the selected model(s). Provide clear guidance on how a user can calculate utility scores based on the outputs of the selected model(s). _____________
Uncertainty 18 Report information that enables users to estimate standard errors around mean utility predictions and individual-level variability. _____________
Model performance and face validity
19 Present results of model performance, such as measures of prediction accuracy and fit statistics for the selected model(s) in a table or in the text. Provide an assessment of face validity of the selected model(s). _____________
DiscussionComparisons with
previous studies20 Report details of previously published studies developing mapping
algorithms between the same source and target measures and describe differences between the algorithms, in terms of model performance, predictions and coefficients, if applicable. _____________
Study limitations 21 Outline the potential limitations of the mapping algorithm. _____________Scope of applications 22 Outline the clinical and research settings in which the mapping algorithm
could be used. _____________
40

OtherAdditional information 23 Describe the source(s) of funding and non-monetary support for the study,
and the role of the funder(s) in its design, conduct and report. Report any conflicts of interest surrounding the roles of authors and funders. _____________
41

Appendix 1: Baseline characteristics of round one Delphi panellists (n=46)
Frequency Percentage (%)Gender
Female 12 26.09Male 34 73.91
Geographical locationEurope 27 58.70Africa 0 0.00Oceania 7 15.22North America 12 26.09Latin America 0 0.00Asia 0 0.00
Primary work environmentAcademia/Research Organisation 37 80.43Government/Health care administrator 4 8.70Clinical Practice 0 0.00Pharmaceutical/Biotech/Medical Device Industry/Consultancy 4 8.70Biomedical Journal/Medical Information 1 2.17Other 0 0.00
Secondary work environmentAcademia/Research Organisation 8 17.39Government/Health care administrator 3 6.52Clinical Practice 0 0.00Pharmaceutical/Biotech/Medical Device Industry/Consultancy 4 8.70Biomedical Journal/Medical Information 0 0.00Other 0 0.00
Research interests amongst those working in academia/research organisations
Economic evaluation or other health economic studies 36 78.26Clinical outcomes/Trialist 4 8.70Statistics 11 23.91Patient-reported outcomes 24 52.17Research methods 14 30.43Health care utilisation and policy studies 10 21.74Other 1 2.17
Primary affiliation of journal editorsGeneral interest medical journal 0 0.00Specialty medical journal 1 2.17General interest journal (not medical) 3 6.52Specialty journal (not medical) 3 6.52Other 1 2.17Not applicable 38 82.61
42

Appendix 2a: Importance, level of agreement, median ratings, interpercentile ranges (IPR), and interpercentile ranges adjusted for asymmetry (IPRAS) of round one items
Item Importance* Disagreement Median IPR IPRASItem 1: Title Important No 8 2 6.85
Item 2: Abstract Important No 8 2 6.85
Item 3: Study Rationale Important No 8 2 6.85
Item 4: Study Objective Important No 8 2 6.85
Item 5: Estimation Sample Important No 9 1 7.60
Item 6: External Validation Sample Important No 8 1 7.60
Item 7: Source and Target Measures Important No 9 1 7.60
Item 8: Exploratory Data Analysis Important No 7.5 1 6.10
Item 9: Missing Data Important No 7.5 1 6.10
Item 10: Modelling Approaches Important No 8.5 1 7.60
Item 11: Estimation of Predicted Scores or Utilities Important No 8 1 6.10
Item 12: Validation Methods Important No 8 1 7.60
Item 13: Measures of Model Performance Important No 8 1 7.60
Item 14: Repeated Measurements Important No 7 1 6.10
Item 15: Final Sample Size(s) Important No 8 2 6.85
Item 16: Descriptive Information Important No 8 2 6.85
Item 17: Model Selection Important No 8 1 7.60
Item 18: Model Coefficients Important No 9 1 7.60
Item 19: Model Diagnostics Important No 8 1 7.60
Item 20: Model Plausibility Important No 7 2 5.35
Item 21: Uncertainty Important No 8 2 6.85
Item 22: Comparisons with Previous Studies Important No 8 1 6.10
Item 23: Study Limitations Important No 8 2 6.85
Item 24: Applications Important No 8 3 6.10
Item 25: Source of Funding Neither* No 6.5 3 4.60
*An item was defined as important if its median rating was ≥ 7 and neither unimportant nor important if its median rating was 4-6.
43

Appendix 2b: Importance, level of agreement, median ratings, interpercentile ranges (IPR), and interpercentile ranges adjusted for asymmetry (IPRAS) of round two items
Item Importance* Disagreement Median IPR IPRASItem 1: Title Important No 8 2 6.85
Item 2: Abstract Important No 8 2 6.85
Item 3: Study Rationale Important No 8 2 6.85
Item 4: Study Objective Important No 9 1 7.60
Item 5: Estimation Sample Important No 9 1 7.60
Item 6: External Validation Sample Important No 9 1 7.60
Item 7: Source and Target Measures Important No 9 1 7.60
Item 8: Exploratory Data Analysis Important No 7 1 6.10
Item 9: Missing Data Important No 8 1 6.10
Item 10: Modelling Approaches Important No 8 1 7.60
Item 11: Estimation of Predicted Scores or Utilities Important No 8 2 6.85
Item 12: Validation Methods Important No 8 1 7.60
Item 13: Measures of Model Performance Important No 9 1 7.60
Item 14: Final Sample Size(s) Important No 8 1 7.60
Item 15: Descriptive Information Important No 8 1 7.60
Item 16: Model Selection Important No 9 1 7.60
Item 17: Model Coefficients Important No 9 0 8.35
Item 18: Uncertainty Important No 9 1 7.60
Item 19: Model Performance and Face Validity Important No 8 1 7.60
Item 20: Comparisons with Previous Studies Important No 7 1 6.10
Item 21: Study Limitations Important No 8 1 6.10
Item 22: Scope of Applications Important No 8 3 6.10
Item 23: Additional Information Important No 7 2 5.35
* An item was defined as important if its median rating was ≥ 7.
44