vietnam progress of energy efficiency and conservation
TRANSCRIPT

Hong Kong– March 18-23, 2019
VIETNAM PROGRESS OF
ENERGY EFFICIENCY AND CONSERVATION

OUTLINES
I• VIETNAM ENERGY OUTLOOK- UPDATED
II• ENERGY EFFICIENCY AND CONSERVATION
FOR DEVELOPMENT IN VIETNAM

UPDATE ENERGY INFOMATION

UPDATED ENERGY INFORMATIONPopulation: 96.5 million persons;
Area: 331,698 km2;
Urban population: 32.9 million persons (35.1%);
GDP (nominal): US$240.5 billion → 2,580 US$ per capita;
GDP growth rate in 2018: 6.7%;
Primary energy consumption: ~78.3 MTOE (→ 835.7 kgoe per capita);
Total electricity consumption: 192.93 TWh → 2,031.74 kWh per capita;
Electrification rate: 99.37% of rural households (end of 2018);

SOCIO-ECONOMIC TRENDS
1,5
88
,64
6
1,6
99
,50
1
1,8
20
,66
7
1,9
23
,74
9
2,0
27
,59
1
2,1
57
,82
8
2,2
92
,48
3
2,4
12
,77
8
2,5
43
,59
6
2,6
95
,79
6
2,8
75
,85
6
3,0
54
,47
0
3,2
62
,47
9
8.4%
7.0%7.1%
5.7%5.4%
6.4% 6.2%
5.3% 5.4%
6.0%
6.7%6.2%
6.8%
0.0%
1.0%
2.0%
3.0%
4.0%
5.0%
6.0%
7.0%
8.0%
9.0%
-
500,000
1,000,000
1,500,000
2,000,000
2,500,000
3,000,000
3,500,000
2005 2006 2007 2008 2009 2010 2011 2012 2013 2014 2015 2016 2017
% p
.a
Bn
. VN
D @
20
10
GDP and annual GDP growth rate
GDP GDP growth rate
GDP, 2.05
Population, 1.14
Urban population, 1.51
GDP per capita, 1.81
Electricity demand, 3.87
Primary commercial energy, 2.40
-
0.50
1.00
1.50
2.00
2.50
3.00
3.50
4.00
2 0 0 5 2 0 0 7 2 0 0 9 2 0 1 1 2 0 1 3 2 0 1 5 2 0 1 7
Trends for major energy economic indicators (2005=1)
1. GDP growth rate for 2005-2017: 6.2% p.a;
2. In 2005-2017:
Electricity intensity with respect to GDP: 0.53 1.00 kWh/USD 2010
Electricity elasticity with respect to GDP: 1.94 times
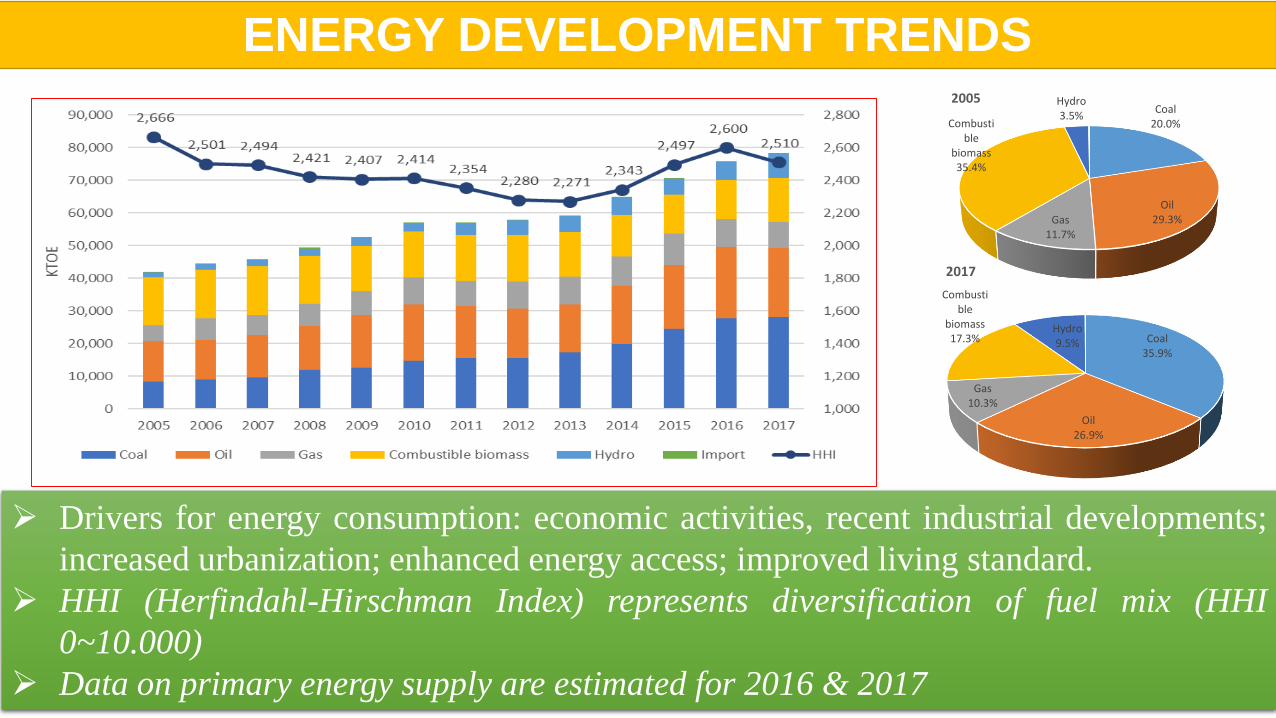
ENERGY DEVELOPMENT TRENDS
Coal20.0%
Oil29.3%Gas
11.7%
Combustible
biomass35.4%
Hydro3.5%
2005
Coal35.9%
Oil26.9%
Gas10.3%
Combustible
biomass17.3%
Hydro9.5%
2017
Drivers for energy consumption: economic activities, recent industrial developments;
increased urbanization; enhanced energy access; improved living standard.
HHI (Herfindahl-Hirschman Index) represents diversification of fuel mix (HHI
0~10.000)
Data on primary energy supply are estimated for 2016 & 2017
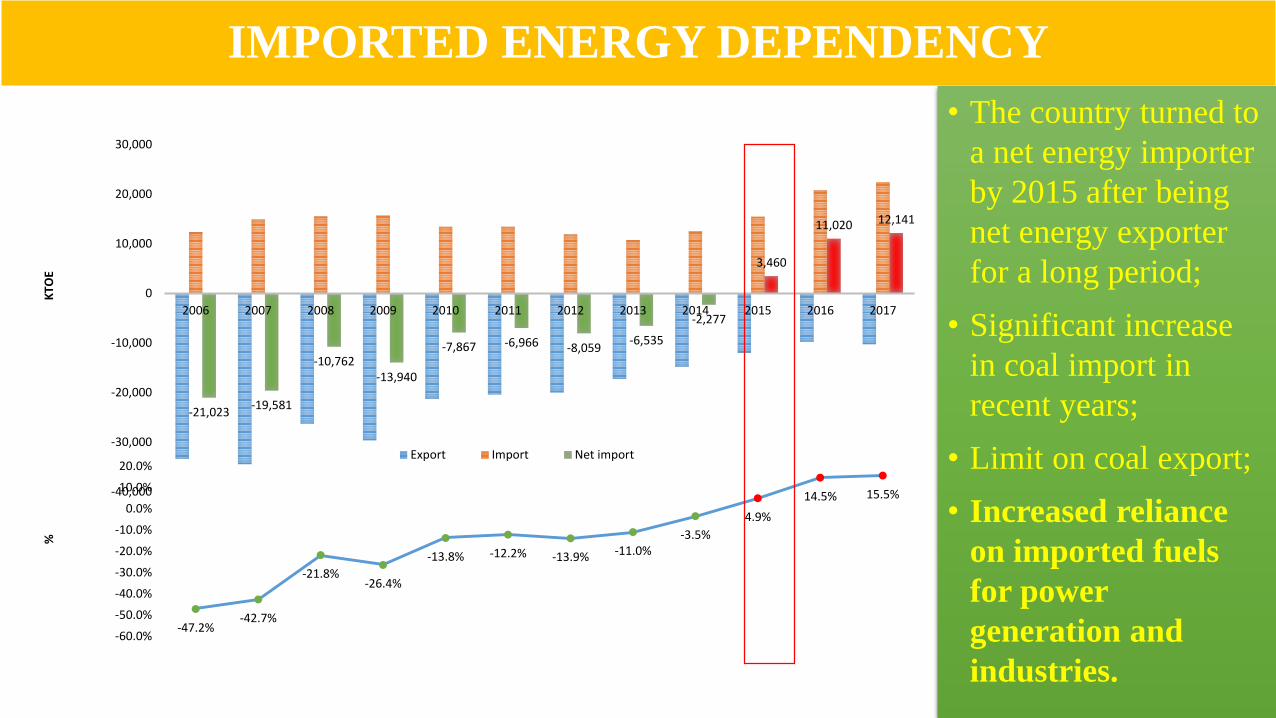
IMPORTED ENERGY DEPENDENCY
7
• The country turned to
a net energy importer
by 2015 after being
net energy exporter
for a long period;
• Significant increase
in coal import in
recent years;
• Limit on coal export;
• Increased reliance
on imported fuels
for power
generation and
industries.
-21,023-19,581
-10,762-13,940
-7,867 -6,966 -8,059-6,535
-2,277
3,460
11,020 12,141
-40,000
-30,000
-20,000
-10,000
0
10,000
20,000
30,000
2006 2007 2008 2009 2010 2011 2012 2013 2014 2015 2016 2017
KTO
E
Export Import Net import
-47.2%-42.7%
-21.8%-26.4%
-13.8% -12.2% -13.9% -11.0%-3.5%
4.9%
14.5% 15.5%
-60.0%
-50.0%
-40.0%
-30.0%
-20.0%
-10.0%
0.0%
10.0%
20.0%
%

VIETNAM: ENERGY TRANSMISSION SYSTEM
Vietnam Transmission System (Sep. 2016)
03 interconnected regions
500-220kV transmission grid
500 kV: 26 substations – 25800 MVA;
500 kV line: ~ 7360 km of line
Unit Quantity
500kV substation MVA 25800
500kV line km 7360
220kV substation MVA 42040
220kV line km 15800
Year North - Central Central - South
2015 1800 3500
2016 2000 4000
2017-2020 2400 4000
Transmission capacity
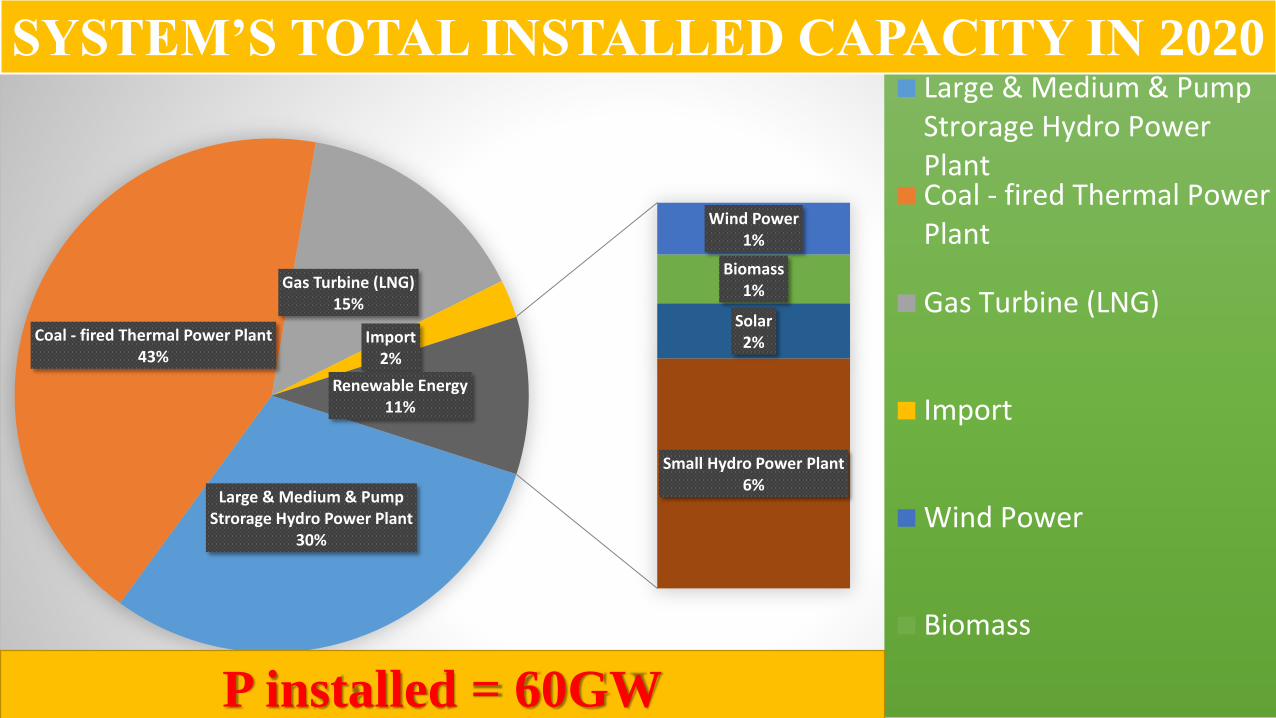
Large & Medium & Pump Strorage Hydro Power Plant
30%
Coal - fired Thermal Power Plant43%
Gas Turbine (LNG)15%
Import2%
Wind Power1%
Biomass1%
Solar2%
Small Hydro Power Plant6%
Renewable Energy11%
Large & Medium & PumpStrorage Hydro PowerPlantCoal - fired Thermal PowerPlant
Gas Turbine (LNG)
Import
Wind Power
Biomass
SYSTEM’S TOTAL INSTALLED CAPACITY IN 2020
P installed = 60GW

SYSTEM’S TOTAL INSTALLED CAPACITY IN 2030
Large & Medium & Pump Storage Hydro Power Plant
17%
Coal - Fired Thermal Power Plant42%
Gas Turbine (LNG)15% 3%Import
1%Wind Power5%
Biomass3%
Solar Power9%
Small Hydro Power Plant5%
Renewable Energy 16%
Large & Medium & Pump
Storage Hydro Power Plant
Coal - Fired Thermal Power
Plant
Gas Turbine (LNG)
Nuclear Power Plant
Import
Wind Power
Biomass
Solar Power
Small Hydro Power PlantPinstalled = 130GW
ENERGY EFFICIENCY AND CONSERVATION FOR DEVELOPMENT
IN VIETNAM

Content Unit 2015 2016 2017
Total primary energy
supplies
KTOE 70.588 77.402 80.38
Total energy end-users KTOE 59.47 62.35 65.67
Energy intensity kgOE/
1.000USD307.80 303.68 293.31
ENERGY-ECONOMIC INDICATORS IN VIETNAM, 2011-2015
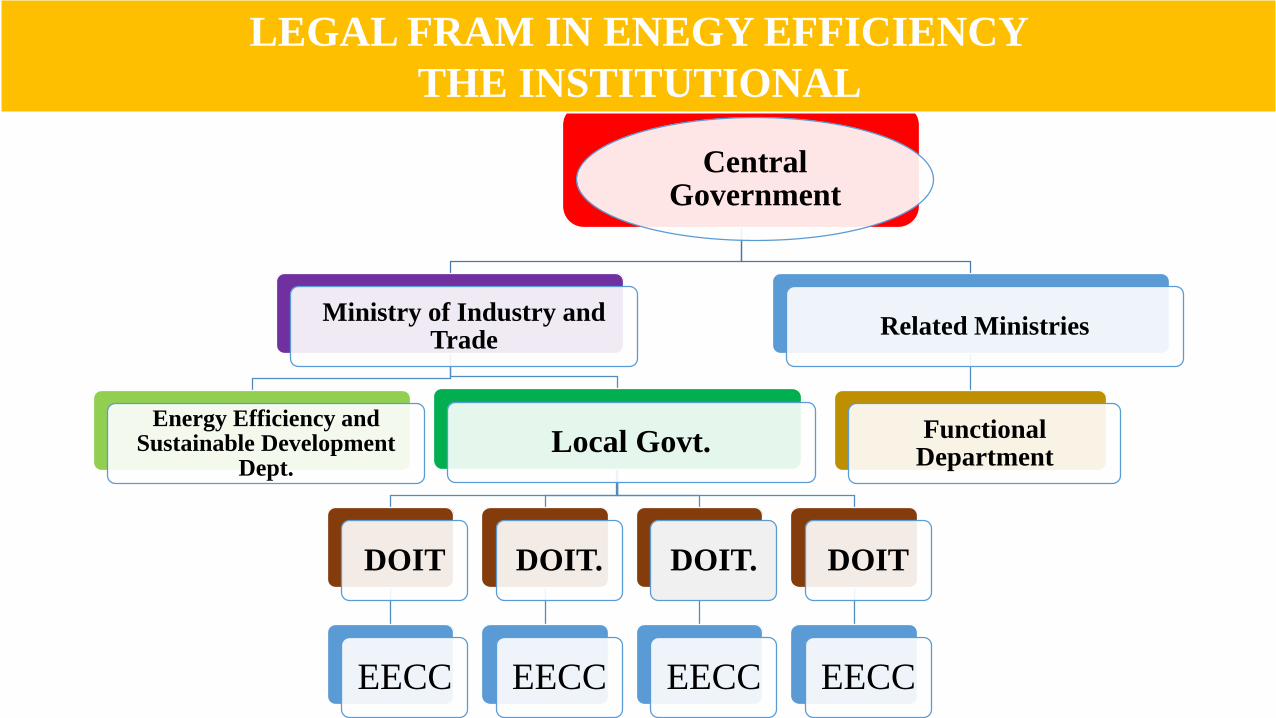
Central Government
Ministry of Industry and Trade
Energy Efficiency and Sustainable Development
Dept.Local Govt.
DOIT
EECC
DOIT.
EECC
DOIT.
EECC
DOIT
EECC
Related Ministries
Functional Department
LEGAL FRAM IN ENEGY EFFICIENCY
THE INSTITUTIONAL
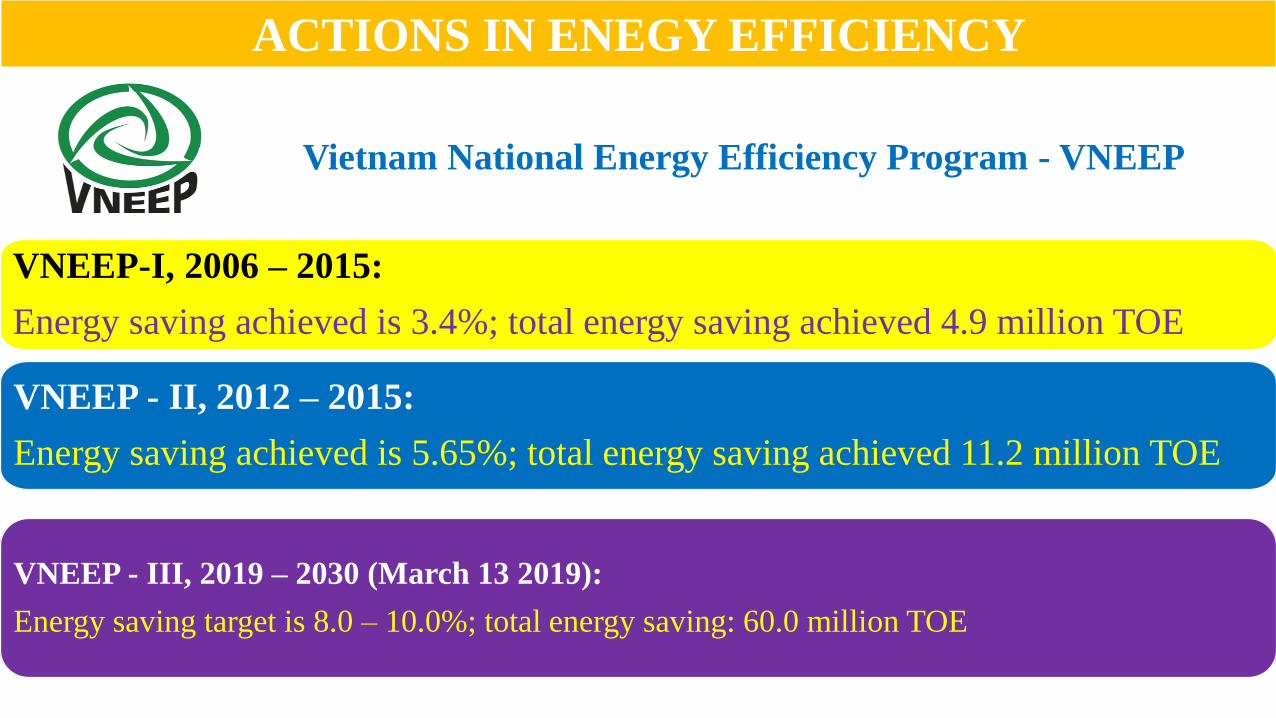
ACTIONS IN ENEGY EFFICIENCY
Vietnam National Energy Efficiency Program - VNEEP
VNEEP-I, 2006 – 2015:
Energy saving achieved is 3.4%; total energy saving achieved 4.9 million TOE
VNEEP - II, 2012 – 2015:
Energy saving achieved is 5.65%; total energy saving achieved 11.2 million TOE
VNEEP - III, 2019 – 2030 (March 13 2019):
Energy saving target is 8.0 – 10.0%; total energy saving: 60.0 million TOE

SPECIFICS OBJECTIVES IN VNEEP-31. Achieving the energy saving from 8 to 10% of total national energy consumption for the 2019 – 2030 period;
2. Reducing the power loss to below 6.0%;
3. Reducing the average energy consumption in industrial sectors/sub-sectors compared to the 2015 – 2018 period
(i) For the steel industry: from 5.00 to 16.50% depending on product type and production technology;
(ii) For the chemical industry: minimum 10.00%;
(iii) For the platics production industry: from 21.55 to 24.81%;
(iv) For the cement industry: minimum 10.89%;
(v) For the textile industry: minimum 6.80%;
(vi) For the alcohol, beer and soft drink industry: from 4.6 to 8.44% depending on product type and production scale;
(vii) For the paper industry: from 9.90 to 18.48% depending on product type and production scale;
4. Reducing 5% of gasoline, oil consumption in transportation compared to the fuel consumption demand forecast of the sector
until 2030; developing the regulation on fuel consumption level for 2-wheel motorbikes and cars of 9 seats and below which
are newly manufactured, assembled and imported
5. Achieving the target of 90% of industrial parks and 70% of industrial clusters accessing, applying EE&C solutions
6. Implementing energy labelling for 50% of building material products which require thermal insulation in buildings
7. Achieving the target of 100% of cities, provinces under the central government developing and approving local
plans/programs on EE&C
8. Training and awarding certificates to 5,000 energy managers/ energy auditors

THANK YOU