vietnam programmatic poverty assessment (ppa) · pdf filevietnam programmatic poverty...
TRANSCRIPT

Vietnam Programmatic Poverty Assessment (PPA)Poverty, Vulnerability, and Inequality in Vietnam
Issues Paper: October 2012
Introduction
Vietnam achieved rapid progress at reducing poverty over the past twenty years: the poverty headcount fell from 58 percent in the early 1900s to around 14 percent by 2008. High and sustained economic growth has been critical to Vietnam’s success, buttressed by egalitarian policies e.g. in provision of basic services, also investments in land and infrastructure to ensure widespread access to opportunities for the poor. But Vietnam is in the midst of rapid economic and social transformation – from a low income economy to a more diversified middle income economy with strong global linkages, from a traditional agrarian culture with well-developed family and community systems of support to one that is rapidly urbanizing and becoming more socially diversified, also more integrated with the outside world. Traditional systems of support have begun to break down; wider opportunities for economic advancement must be balanced against greater exposure to risk.
This transformation not only brings new challenges for poverty reduction, but also highlights Vietnam’s slow progress in addressing some of its past challenges. Vietnam has set ambitious targets for poverty reduction over the period of the 2011-2015 SEDP: poverty is targeted to fall by 2 percentage points a year -- from 14.2 percent in 2011 to only 6.2 percent in 2015. However in 2008 1, one-fifth of rural households still lived below Vietnam’s (basic-needs) poverty line, an increasing share were ethnic minorities, and the gap between the better off and poorest was continuing to rise. According to summary tables produced by GSO, the ‘rich-poor’ gap2, a measure of ‘absolute’ inequality, rose from 8.1 to 9.2 between 2002 and 2010. Ethnic minority households continue to fall behind while others prosper – by 2010, the share of ethnic minorities in the poorest 10 percent of the population has risen to 65 percent.
Vietnam is also facing new challenges: vulnerability is increasing and new forms of poverty arise as a result of rapid economic transformation and global integration. Many workers lost jobs; others received lower wages and reduced working hours due to reduced demand during the global economic crisis in late 2008 and 2009. 2010 witnessed rising food price inflation and a sharp increase in the costs of electricity and fuel, which put additional pressure on living conditions. Households in urban and peri-urban areas have been particularly hard hit by macro turbulence and high inflation, including rural-to-urban migrants who come to the city to seek better jobs and higher pay. Migrants often send money home to rural areas; the impacts of higher urban prices are thus also transmitted to rural areas. Urbanization is increasing at a rapid pace: the face of poverty and sources of vulnerability in urban areas are very different than traditional poverty concerns in rural areas. Vietnam’s poverty reduction policies traditionally have had a rural focus. New thinking and new policies are needed to address emerging issues linked to urban poverty and vulnerability.
1 2008 Vietnam Household Living Standards Survey (VHLSS) estimates. 2010 VHLSS poverty estimates are not yet available 2 Ratio of average incomes for the wealthiest quintile to the poorest quintile
1

In light of these old and new challenges, Vietnam needs to reframe its strategy to reduce poverty, vulnerability, and inequality with the specific aim of (1) ensuring more rapid progress for those left behind, with particular focus on ethnic minority households (2) consolidating gains and ensuring sustainable progress for lower income households and the near poor (who have exited poverty but still remain vulnerable) and (3) addressing new challenges, including rising inequality across regions and social groups, new vulnerabilities e.g. in jobs and employment, also linked to climate and weather related shocks; and challenges linked to rapid urbanization and an emerging group of urban poor and vulnerable households, including rural-to-urban migrants.
World Bank Partnership for Poverty Reduction in Vietnam
The Bank has long-standing program of Analytic and Advisory Assistance (AAA) and Technical Assistance (TA) to support data collection and poverty analysis in Vietnam, beginning with the first Vietnam Living Standards Survey (VLSS) in 1993 and continuing through to the present. The Government Statistics Office (GSO), with support from the World Bank and other international partners, has conducted comparable, nationally representative household surveys to monitor poverty in 1993, 1998, 2002, 2004, 2006, 2008, and 2010. The design of survey modules used to measure income and consumption in the Vietnam Household Living Standards Survey (VHLSS) has been kept very similar since 1993, as has the method used to calculate the poverty line and estimate core poverty statistics. Thus Vietnam has been in a unique position to generate comparable poverty statistics and to monitor trends since 1993.
Under the aegis of the World Bank, major reports have been prepared when new poverty data becomes available i.e. the 1995 Vietnam Poverty Assessment and Strategy (based on the 1993 VLSS); the 2000 Vietnam Country Economic Memorandum Attacking Poverty (1998 VLSS); the 2003 Vietnam Development Report Poverty (2002 VHLSS); the 2006 Poverty Update (2004 VHLSS); and the 2010 VASS poverty report Poverty Reduction in Vietnam: Achievements and Challenges (2006 and 2008 VHLSS). Over time, our approach has shifted from purely Bank-led analysis and reporting to joint efforts involving a range of government agencies, local think tanks and research institutes. The 2000 CEM was produced by a consortium of government research institutes, NGOs, and donors (the Poverty Working Group). A number of development partners as well as local researchers and research institutes were actively involved in the preparation of the 2003 VDR on poverty. With support from the World Bank and other donors, the Vietnam Academy of Social Sciences (VASS) led the preparation of the 2006 Poverty Update and recently completed a series of background papers on poverty, including a Participatory Poverty Assessment (PPA) in 2008. The key findings from the PPA and background papers are summarized in the 2008-2010 VASS poverty report, which has been widely distributed and has provided inputs for the Vietnam’s National Socio-Economic Development Strategy (SEDS) and 2011-2015 Socio-Economic Development Plan (SEDP).
The VASS report, based on data from the 2008 VHLSS, brings closure to an important period of high growth and rapid poverty reduction in Vietnam: poverty fell from 58 percent of the population in 1993 to only 14.5 percent in 2008. However there remains an important unfinished poverty agenda and national averages mask important gaps. Vietnam’s poverty line is low by international standards and, according to recent estimates from MOLISA and GSO, there are a number of provinces in mountainous and more
2

remote areas where more than half the population still live in poverty. Poverty rates among Vietnam’s diverse ethnic minority populations are still in excess of 50 percent. Looking forward, Vietnam will face new challenges e.g. rising vulnerability due to global integration and rapid urbanization, also higher exposure to natural and man-made disasters.
Rationale and Objectives: FY12 Programmatic PA
The Bank is launching a new Poverty Assessment (PA) for Vietnam, working in collaboration with country partners and building on a strong and ongoing program of technical assistance and capacity building for data collection and poverty analysis. VASS will work closely with the Bank on the next PA, focusing on specific themes and areas of inquiry. GSO will also be an important partner for poverty measurement and analytics. Many of the themes proposed to be taken up in the PA e.g. inequality, new sources of poverty in urban areas, were highlighted as important emerging issues in VASS’ own report. Moreover VASS has been asked by senior leadership in Vietnam to track and report (to the National Assembly, Party leaders) on key issues linked to sustainable and inclusive growth, including poverty, vulnerability and inequality. A formal round of consultations is planned for November, wherein government agencies, research institutes and think tanks, international partners and other stakeholders will asked for comments and suggestions, also encouraged to provide inputs (e.g. background studies, research papers). The aim is to engage with country partners and DPs more broadly with the aim of developing a shared and forward looking agenda for poverty reduction.
A series of background papers will be produced in FY12, culminating in an FY12 Poverty Assessment report planned for May, 2012. Pending agreement with GSO on revised GSO-WB poverty lines and welfare aggregates, a summary note on the 2010 poverty profile will be prepared in December, 2011. The exercise will draw on important new sources of data as well as new analyses: e.g. 2009 Population and Housing Census, 2009 Labor Force Survey, 2010 VHLSS, augmented by new qualitative field research.
The objectives of the Programmatic PA are two-fold: first, to stimulate debate and new thinking in Vietnam on a second generation of poverty issues, issues that are more relevant for Vietnam’s emerging middle income economy and rapidly changing social and cultural environment. How well are existing policies working? What new policies and programs are needed to address new challenges? Second, the work supports the design and subsequent implementation of the Bank’s new Country Partnership Strategy for Vietnam. It aims to provide a better analytic basis to plan our support for Vietnam’s poverty reduction and social protection agenda. Specifically: what role should the Bank play in supporting policy reforms and addressing both traditional and second generation poverty issues in Vietnam? How can we work better with other development partners, NGOs, and local research institutes and think-tanks on these issues?
This Issues Paper briefly summarizes what we know about poverty reduction in Vietnam and proposes activities to better address the remaining challenges – is there an unfinished poverty reduction agenda and what remains to be done? It recognizes that Vietnam is entering a new era; with support from DFID and other development partners, the Bank will continue to support improvements to the country’s poverty monitoring system, including better methods for measuring household welfare; more accurate spatial cost
3

of living indicators and a comprehensive update of poverty lines; also in-depth poverty analysis to better understand the heterogeneity of the poor (including spatial heterogeneity) and multi-dimensional sources of deprivation. Looking forward, the Programmatic PA aims to identify an emerging second generation set of poverty issues, to explore what public policies are needed to address new challenges e.g. linked to rising vulnerability, increasing social diversification and the likelihood of rising inequality as Vietnam accelerates its economic transformation.
Poverty Levels and Trends in - Vietnam
According to GSO poverty statistics, the headcount in Vietnam has fallen from 58 percent of the population in 1993 to only 14.5 percent by 2008. These estimates are based on a consistent (in real purchasing power) albeit conservative “basic needs” poverty line and a series of six broadly comparable household surveys. (Figure 1) Calculations using the World Bank’s international poverty line ($1.25/day, 2005 PPP) indicate similar progress; poverty measured by the international poverty line fell from over 65 percent of the population in 1993 to under 21 percent by 2008. Both sets of statistics highlight Vietnam’s very impressive progress in reducing poverty over the past two decades.
Figure 1: Poverty Reduction in Vietnam: 1993 - 2008
Source: VLSS 1993, 1998; VHLSS 2002, 2004, 2006, 2008
Sustained and broad-based economic growth has been central to Vietnam’s success. Poverty reduction achievements in the 1990s are generally attributed to market-oriented policies that created economic opportunities for the majority of the poor e.g. an egalitarian allocation of land, secure property rights to
4

land holdings. Economic reforms in the 1990s contributed to rapid development of the private sector (viz. the Company Law in 1990) so that small businesses could flourish, new entrants to the labor force find jobs in rapidly expanding services and industrial sectors, and Vietnam’s economy could benefit from rapid opening to global trade. Widespread access to basic education and health services, far better than the norm for countries as similar levels of development, ensured that Vietnam’s workers were well equipped to take advantage of the opportunities created by market-led growth.
Reform momentum continued in the 2000s and growth rates remained consistently high. Pro-poor programs became more diversified to address the needs of an increasingly diversified rural population, and new initiatives were introduced to address concerns about rising inequality between regions and socio-economic groups, e.g. targeted area development programs such as P-135 and program 30a, related policies to improve the living conditions of ethnic minorities viz. P-132, P-134 to expand access to land and adequate housing. Programs were also developed to address rising vulnerability e.g. the Hunger and Poverty Eradication Program (HEPR) and later NTP-PR, health insurance for the poor, and benefits paid to the most vulnerable under Decree 67. A new budget law went into effect in 2004 that facilitated rapid decentralization; 45 percent of public spending decisions are now made at provincial and lower levels. Equalization grants were put in place (provincial poverty rates enter the allocation formulas) to ensure adequate funding for capital and recurrent costs in less well-off provinces. For some of the poorest provinces, equalization grants from the central budget comprise more than 90 percent of the overall provincial budget.
These and other pro-poor policies formed an integral part of Vietnam’s first PRSP – the Comprehensive Poverty Reduction and Growth Strategy – finalized in 2003. The CPRGS created momentum within Government to mainstream poverty reduction in Vietnam’s planning processes. Poverty reduction and social development was introduced as a pillar of Vietnam’s 2006-2010 Socio-Economic Development Plan (SEDP) and this focus was continued in the new 2011-2015 SEDP and Vietnam’s 2011-2021 Socio-Economic Strategy (SEDS).
Although there was rapid progress in reducing poverty throughout the 1990s and well into the 2000s, recent evidence (e.g. based on the 2008 VHLSS) suggests that progress has slowed and there is a large and growing gap between some of the poorest households and the better off, as well as a persistent gap between different regions of the country and well as households living in urban and rural areas (Figure 2).
5

Figure 2: Poverty Reduction in Vietnam, Kinh/Hoa, Ethnic Minorities: 1993 - 2008
Source: VLSS 1993, 1998; VHLSS 2002, 2004, 2006, 2008
Over 50 percent of the remaining poor in 2008 were ethnic minority households; despite progress over the past two decades, nearly half of ethnic minority households still live below the poverty line, compared to only 9 percent of Kinh/Hoa majority households (in 2008).
The overall distribution of welfare (measured in per-capita expenditure terms) has changed over time in Vietnam (Figure 3); it has flattened and has becoming more skewed to the right due to rapid improvements in well-being for many households. This is the good news. However the distribution of welfare for ethnic minorities has changed much more slowly and still remains highly concentrated around the poverty line. (Figure 4) Preliminary analysis of the 2010 VHLSS suggests that both trends are continuing – Kinh/Hoa majority households continue to prosper, their distribution of welfare reflects overall improvements, but progress for minority households remains slow and the gap is widening.
6

Figure 3: Distribution of Per-Capita Expenditures: 1993 - 2008
Source: VASS, 2011 (VLSS 1993, 1998; VHLSS 2002, 2004, 2006, 2008)
Figure 4: 1993, 2006 Distribution of Per-Capita Expenditures: Ethnic Minorities, Kinh/Hoa Majority
7

Source: Baulch, Nguyen, Nguyen, and Pham, 2010
Aggregate measures of progress over time mask important differences across regions. According to successive rounds of the VHLSS, poverty has fallen rapidly in Red River Delta and the South East Region, where Hanoi and HCMC are located, but more slowly in other parts of the country. Poverty is becoming more concentrated in the Northwest Region and Central Highlands, both areas with a high proportion of ethnic minorities. According to the 2009 Population Census, ethnic minorities now comprise 55 percent of households in the Northern Midlands and Mountains (NE and NW Regions) and 44 percent of households in the Central Highlands, in contrast to less than 2 percent in Red River Delta (Hanoi and environs) and 5 percent in the South East (HCMC and environs). Regional patterns of poverty continue to have a strong ethnic dimension.
Figure 5: Poverty Rates by Region: 1993 – 2008
8

Source: VLSS 1993, 1998; VHLSS 2002, 2004, 2006, 2008
Vietnam’s Poverty Lines: International Comparisons
When assessing Vietnam’s performance in recent years, it is important to keep in mind that Vietnam’s GSO-WB ‘monitoring’ poverty line3 is low by international standards, and, unlike many other fast growing economies, this poverty line has not increased in real purchasing power since it was developed in the mid-1990s. Using a constant standard to assess progress has many advantages. But most countries raise their standards – and their national poverty lines -- as they become more affluent. The VHLSS poverty statistics cited in the previous section are based on a poverty line of only $1.10 person (2005 PPP), which is substantially lower than the $1.25 person/day (2005 PPP) “international” poverty line calculated by the World Bank and used to measure global progress in the poorest countries. The current
3 The reference is to the GSO/WB expenditure poverty lines, which uses a reference food basket and non-food shares from the 1993 VLSS.
9

international poverty line was constructed by averaging the national poverty lines (PPP 2005) for the 15 poorest countries in the world4 (ref. Chen, Ravallion, Sangrula; also World Bank, 2008 WDI Supplement on Poverty Data). Vietnam’s poverty line is among the lowest (in PPP terms) in East Asia. (Figure 6) As part of the Programmatic PA, we are working with GSO to update the GSO-WB poverty line to better reflect conditions and the aspirations of citizens living in Vietnam today.
Figure 6: International Equivalents of National Poverty Lines in East Asian Countries (PPP Constant 2005)
Source: World Bank PREM poverty team, internal calculations
Vietnam also has “official” poverty lines that traditionally have been proposed by MOLISA (Ministry of Labor, Invalids, and Social Affairs) and approved by the Prime Minister’s office. The official lines are used to determine budgets and define eligibility for number of targeted poverty reduction programs (e.g. NTP-PR, Program 30a). Vietnam’s official lines have been revised five times over the past 20 years, generally when a new SEDP is being prepared. New official lines were approved recently by the Prime Minister’s office (September, 2010): beginning in 2011, the official poverty line for urban areas will be VND 500,000 person/month ($1.61 person/day 2005 PPP) and the official line for rural areas will be VND 400,000 person/month ($1.29 person/day 2005 PPP). A second and higher set of official “near-poor” lines were also approved, which will give government greater leeway in expanding eligibility criteria when deemed desirable e.g. for determining eligibility for “near-poor” health insurance cards. The near-poor lines are 30 percent higher than the official poverty lines: VND 650,000 person/month for households living in urban areas and VND 520,000 person/month for rural households.
4 Malawi, Mali, Ethiopia, Sierra Leone, Niger, Uganda, Gambia, Rwanda, Guinea-Bissau, Tanzania, Tajikistan, Mozambique, Chad, Nepal and Ghana
10

The official poverty lines typically are ‘stable’ throughout the five year period of an SEDP. However Vietnam has entered a period of macroeconomic turbulence and has struggled with several bouts of high inflation (the most recent just ending). The official lines should be updated each year for inflation, preferably using a CPI that reflects the purchasing behavior of poor households. According to official estimates, 14.2 percent of the population was poor in the beginning of 2011, including 6.9 percent of households living in urban areas and 17.4 percent of households living in rural areas (Table 1).
Table 1: Official Poverty Rates by Sector and Region: 2010 VHLSS
Percent Poor (official estimates)
All Vietnam 14.2Urban 6.9Rural 17.4
RegionRed River Delta (including Hanoi) 8.4North East 24.2North West 39.4North Central Coast 24.0South Central Coast 16.9Central Highlands 22.2South East (including HCMC) 3.4Mekong Delta 12.6
Source: GSO Summary Tables for 2010 VHLSS, GSO website
Despite intense internal debate – some policy makers believe Vietnam should set more ambitious goals in the fight against poverty, given its rapid economic growth and vision of itself as a modern industrial society – the new official poverty lines for the 2011-2016 SEDP remain low by international standards. The new urban line is still well below $2 person/day (2005 PPP) and the new rural line is only a little above the $1.25 person/day lines applied in the world’s poorest countries. However, it should be noted that MOLISA (with GSO’s support) initially proposed a higher set of official poverty lines in 2010. They were requested by senior government officials to reduce the proposed lines in light of budget constraints.
As noted above, the World Bank is working with the GSO and other local partners to update the current GSO-WB poverty line, using a new and more diverse food reference basket (from the 2010 VHLSS), a more comprehensive measure of non-food spending including the flow of consumption from household assets (consumer durables and housing) and new spatial cost of living indices (SCOLIs). Initial work
11

suggests the new GSO-WB poverty line will be significantly higher in real purchasing power than the previous GSO-WB line, which has become outdated.
Why has Poverty Reduction Slowed in Recent Years?
The past three years have not been easy for Vietnam, despite the country’s continuing good growth performance. The most recent poverty data are from 2008, which was itself a difficult year. The Bank worked closely with the GSO to analyze whether the apparent slowdown in poverty reduction found in the 2008 VHLSS data was real or an artifice of the data. Although VHLSS survey instruments did not capture well month-to-month changes and the impacts of price volatility on household welfare (and have since been revised), our analysis strongly suggests a recent slowing in the pace of poverty reduction in Vietnam, particularly for some rural areas and among ethnic minority households.
There are a number of reasons for this, all requiring further investigation.
First, although Vietnam continued to deliver good rates of economic growth, households (particularly low income households) were affected by high (rice) price inflation in late 2007 and early 2008, followed by a sharp slow-down in construction (2008). The construction sector is an important source of employment for Vietnam’s (poor) unskilled workers. The impacts of the global financial crisis began to be felt in Vietnam in late 2008 and continued into 2009, with adverse impacts on employment and earnings, particularly for workers in export sectors of the economy. Many of these are migrants from rural areas who come to the cities (and industrial parks) for work and send money back to rural ‘sending’ households. Higher urban prices and lower wages worked to reduce the flow of remittances to rural areas. Effects were also felt economy-wide including e.g. by workers and household businesses in the informal sector. Income diversification and access to jobs in non-farm sectors has been an important driver of poverty reduction in Vietnam. Following a brief period of recovery, macro instability has led to another round of rising inflation in late 2010, with sharp increases in fuel and electricity costs, also food and foodstuffs. Recent qualitative studies (e.g. by Oxfam, the 2011 Rapid Impact Assessment/RIM led by VASS) suggest that low income households in urban areas have been particularly hard-hit by the rising cost of living.
Second, the pace of poverty reduction typically slows as the percentage of poor in the population gets low: the remaining poor are often among the most destitute; they include individuals who are very old, disabled, or have chronic conditions that make them unable (or in some cases unwilling) to work. Their economic progress is determined more by structural factors (limited education, poor health, low quality land) that do not change quickly. However even in 2008 using ‘old’ GSO-WB poverty lines, 18.7 percent of Vietnam’s 60 million rural inhabitants still lived below the poverty line (11.2 million people) and not all were old, sick, or chronically poor. It is too early to characterize Vietnam as having only “pockets” of poverty remaining.
Third, the recent slowdown may reflect embedded social inequities that have been difficult to overcome despite a variety of government-sponsored programs targeted at minority populations and poor areas; although ethnic minorities make up less than 15 percent of the population, they comprised over half of the remaining poor in 2008. Slow improvements in ethnic minority living conditions are reflected in other
12

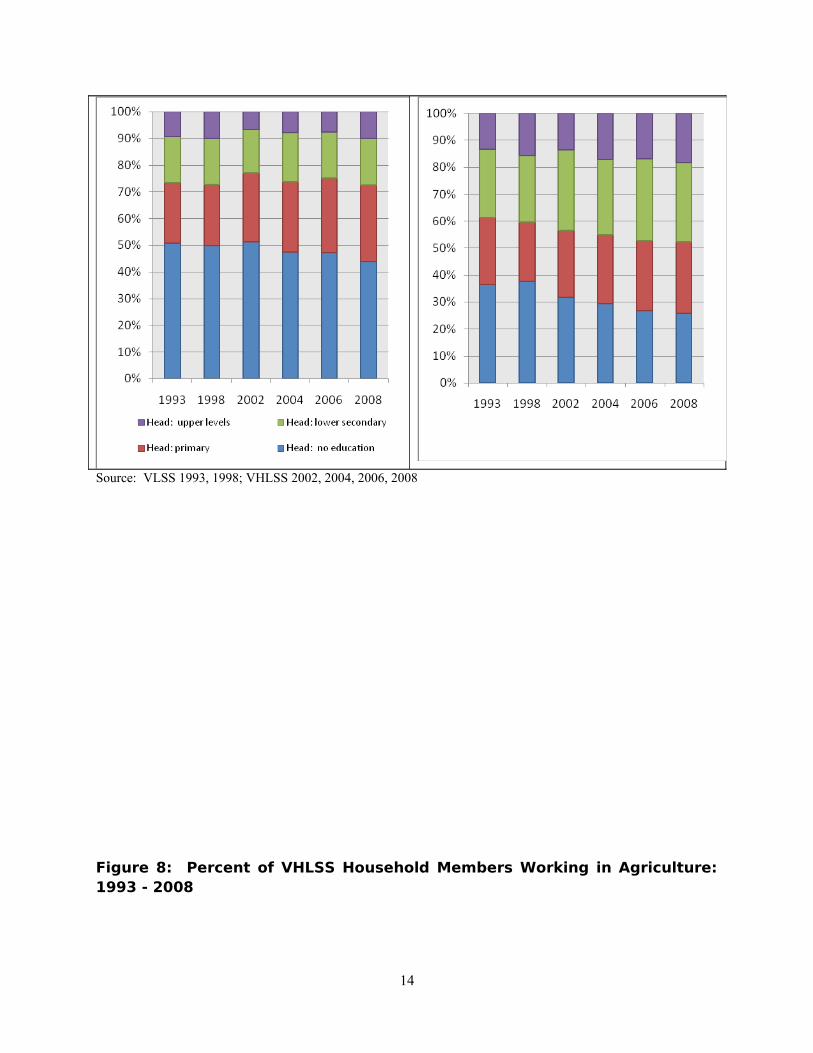
social indicators. Although education levels have improved among ethnic minorities, in 2008 an estimated 45 percent of ethnic minority household heads still had not completed primary school (compared to 25 percent of Kinh/Hoa household heads) and less than 10 percent of ethnic minority heads had completed upper secondary school or tertiary education. Moreover, VHLSS data indicate slow progress in upper secondary and higher education achievements for ethnic minority households (beginning in 1993), in sharp contrast to achievements among majority households (Figure 7). In light of their limited education achievements, it is not surprising that most members of ethnic minority households work primarily in agriculture (Figure 8) and as unskilled labor (Figure 9). This stands in sharp contrast to the continuing move out of agriculture and into (higher paid, higher skill) industry and services among the Kinh/Hoa majority. According to the 2008 VHLSS, 83 percent of workers from ethnic minority households still reported that agriculture was their primary sector of employment, as compared to only 44 percent of workers from Kinh/Hoa households. Preliminary analysis from the 2010 VHLSS suggests only marginal improvements in these areas: although school enrollments among children from minority households are rising, agriculture remains their primary source of income.
Figure 7: Education Levels of Household Head: 1993 – 2008
Ethnic Minority Households Kinh/Hoa Majority Households
13
Source: VLSS 1993, 1998; VHLSS 2002, 2004, 2006, 2008
Figure 8: Percent of VHLSS Household Members Working in Agriculture: 1993 - 2008
14

Source: VLSS 1993, 1998; VHLSS 2002, 2004, 2006, 2008
Figure 9: Percent of VHLSS Household Members Working as Unskilled Labor: 1993 - 2008
Source: VLSS 1993, 1998; VHLSS 2002, 2004, 2006, 2008
15

Reframing Poverty: Recognizing Heterogeneity and Diverse Sources of Deprivation
Much of the discourse around poverty and related poverty reduction policies treat the poor as homogeneous group. Official statistics report poverty trends over time and across regions using a single breakdown of poor and non-poor. Ensuing policy discussions focus almost exclusively on the national and urban/rural poverty headcounts: the poverty headcount is the headline measure. Targets are set by government and progress measured solely in terms of reductions in the poverty headcount. For example, the 2011-2015 SEDP aims to reduce the national poverty rate by 2 percentage points a year and poverty in the poorest districts by 4 percentage point a year. There are no regional targets for poverty reduction, nor do specific targets exist to reduce poverty specifically among ethnic minority populations.
Poverty reduction programs are themselves fairly general and not tailored to the specific (and diverse) needs of poor households. NTP-PR (National Targeted Program for Poverty Reduction) is the government’s main poverty reduction program. Households that fall below the official poverty line are in principal included on the MOLISA poverty list and thus eligible to receive a broad package of benefits (e.g. free or highly subsidized health cards, reduced tuition, subsidized credit, vocational training, and specific livelihoods support, including subsidized agriculture inputs). NTP-PR benefits are the same for all poor households on the list, regardless of their specific characteristics or the factors that work to keep them in poverty. There is no flexibility in the design of the NTP-PR that allows commune or district authorities (much less the intended recipients) to adapt support measures to local conditions and needs. Moreover and of critical importance, the number of households on the poverty list is determined by resource constraints: the deciding factor in choosing new poverty lines for the 2011-2015 SEDP was budget.
There is growing awareness among senior policy makers that the policies and programs that have worked to reduce poverty Kinh/Hoa majority households have not worked as well for ethnic minorities. And moreover, that poverty reduction policies and programs should be designed to reflect these differences. A number of special programs (primarily area-based) were launched in the mid 2000s to address the needs of minority households. These included e.g. Program 132 and Program 134, which aimed to provide agriculture land and housing to minority households, and Program 135, which focused primarily on increasing local infrastructure investment in poor communes in ethnic minority areas. Other programs have been developed to improve access to health care and to provide tuition subsidies for minority children. Already, Bank-supported programs in education have help to adjust education interventions for ethnic minority children to “make education services work for them”, for example through piloting the use of ethnic minority teaching assistants. These types of measures now need to be reflected in formal government policy.
Recent efforts to develop poverty reduction policies and programs that are more flexible and tailored to local conditions have met with mixed success. Efforts to implement reforms “from the top down” have also been stymied, despite broad recognition that existing programs are fragmented and poorly coordinated. Recent discussions about the third phase of P-135 are indicative: despite considerable investments under P-135 II and similar area-based schemes, there is evidence that poverty remains high among ethnic minority households, and living conditions are not improving as rapidly for minorities as they are for Kinh/Hoa majorities (refer to Figure 5). However the proposed design of P-135 III is similar in most important respects to P-135 II, no new diagnostic underpins the design of third phase, and there
16

limited discussion about why the current program has not achieved more. Although P-135 II has made important contributions (particularly through increased investment in local infrastructure), new and complementary measures are needed. Internal discussions are underway in the Bank on what these new measures might entail. In response to a request from MPI, the Bank is preparing a new poverty project in the Central Highlands, building on the lessons from P-135 and approaches piloted under the Northern Mountains Poverty Project. P-135 currently works in hundreds of communes scattered throughout poor districts and provinces and support for livelihood development is heavily focused on input subsidies and tied finance (e.g. for livestock). Complementary support to minorities/poor areas could be provided through a broader regional approach that supports market integration and improved transport links between poor communes/districts and regional growth centers, also creates local incentives for minorities to complete secondary school and participate in skills and vocational training and thus balance growth in agriculture incomes with better access to jobs in off-farm activities. The Bank is also working with MOLISA to develop and pilot new social assistance schemes, including e.g. cash transfer programs, also exploring the possibility of public works programs to create employment in agriculture slack seasons.
An important starting premise for the Programmatic PA is the recognition that the remaining poor in Vietnam are a diverse group, also that new forms of poverty are likely to be created as a result of Vietnam’s ongoing economic and social transition. This calls for a more heterogeneous concept of poverty than used currently – in effect, a typology of the poor that recognizes different causes of poverty and thus leads to a more variegated set of programs and policies, tailored to specific needs and local conditions. It also calls for more use of multi-dimensional concepts of poverty, looking beyond the income or expenditure dimension.
Early analysis suggests four broad (and sometimes overlapping) syndromes of poverty in Vietnam:
the destitute poor, who have little in the way of assets, including human capital, and who often have experienced idiosyncratic shocks, catastrophes, or other major problems that have left them without a viable livelihood;
the structural poor, who not only lack economic resources but whose poverty is strongly linked to structural characteristics, including social identity;
the vulnerable poor, whose exposure to idiosyncratic and broader sources of risk coupled with low endowments and incomes make them particularly vulnerable to poverty; and
the remaining mobile poor, who have more resources than either of the other groups and the greatest potential for upward mobility;
The vulnerable poor may have periods when incomes or expenditures put them above the poverty line, but they hover near the poverty line and are prone to frequent bouts of poverty. New sources of risk and rising vulnerability are concerns for all categories of the poor, but most critically for the destitute poor, who live under very difficult conditions, and the vulnerable poor, whose exposure to shocks and difficulties with coping make them unable to achieve sustainable improvements in living conditions. Risk exposure is likely to increase as Vietnam’s economic transition accelerates and markets become more globally integrated.
17

Exploring and understanding the factors that cause poverty is essential for designing effective policies and programs, particularly during periods of rapid change when both the causes and the nature of poverty are changing.
Further Extensions: Multi-dimensional Measures of Poverty
The Programmatic PA will also explore multi-dimensional measures of poverty, with the aim of assessing progress in reducing deprivations not only in terms of incomes and consumption (which affect all dimensions of well-being indirectly) but also in other measures directly linked to well-being. Standard poverty analysis assumes that, given adequate levels of income, a household will use its resources to purchase it preferred mix of goods and services. But governments may also want to target and monitor deprivations in specific social outcomes (e.g. child mortality, schooling achievements) or coverage of key social services (e.g. coverage of health insurance for low income households, access to clean water and sanitation). The MDGs are designed to capture different dimensions of poverty and well-being, in addition to income or consumption poverty.
Multi-dimensional poverty measures are likely to be particularly important for urban areas, where income poverty rates are low already. The recent UNDP-financed report ‘Urban Poverty Assessment in Hanoi and HCMC’ (UNDP and others, 2010) identified eight dimensions of poverty – deprivations in incomes, coverage of health insurance, coverage of social security, poor housing quality, access to local services (clean water and sanitation, electricity), social inclusion, and physical safety. The Programmatic PA will explore these and other dimensions. Whatever additional dimensions of poverty are used, it is important that these be understood and owned by policy makers and senior leaders in Vietnam.
Looking Forward: Questions to Address
Poverty has fallen rapidly throughout Vietnam and millions of households have become better off. Achievements in reducing income poverty are also reflected in steady improvements in human development indicators – e.g. schooling enrollments and achievements, infant and child mortality, access to clean water and sanitation. However substantial numbers of poor remain, even by Vietnam’s basic-needs poverty line, and challenges remain:
What were the main drivers of Vietnam’s success at reducing poverty over the past 20 years? Is this progress sustainable and what are the remaining gaps? Which households benefited most, and which still remain poor? What were the main barriers to progress?
Progress has been painfully slow for some groups (in particular ethnic minorities) and achievements vary substantially by geographic region. Stepping back:
Who are the remaining poor? Where do they live and what are their key characteristics?
Are there persistent deprivations in non-income dimensions of poverty? Have these changed over time? To what extent do households face multiple deprivations simultaneously? Are there specific populations who are particularly prone to multidimensional poverty?
18

Do ethnic minorities face unique or different constraints that set them apart from other (poor) households? Which policies have been most effective in overcoming these barriers? Are there any signs that minorities groups are gaining ground on majority populations? Are there particular population groups who are “pulling-away” from the rest?
Have some minorities done well despite constraints? What were the factors responsible for their success? Can these lessons be replicated or shared more widely?
Does geography, among other factors, affect access to non-agricultural employment for ethnic minorities? If ethnic minorities had more information about job opportunities, might this information substitute for some deficiencies in endowments (e.g., education or credit)? What are the expected impacts of the new rural areas program?
Are there still provinces and districts with high concentrations of poverty? Has the spatial distribution of poverty changed in recent years and in what ways? In light of changes, are area-based schemes still an effective way to reach the remaining poor, or should future efforts focus more on targeting poor people. What are the main correlates of improvements in welfare outcomes at the district level?
Looking ahead:
Are new poverty challenges emerging as Vietnam moves forward? For example, will new forms of poverty and vulnerability emerge as a result e.g. of economic restructuring and the expected slow-down in economic growth? How have recent bouts of inflation impacted on the poor, in particular the urban poor? What are the links between urbanization and poverty? What does the “urbanization of poverty” imply for rural poverty reduction? Who is most at risk and what types of policies are needed to respond?
What standards should Vietnam use in the future to measure and monitor poverty outcomes? At what level should Vietnam’s poverty lines be set? What can be learned from good practices in other rising middle income countries e.g. in terms of absolute and relative poverty lines, expenditure versus income based lines? How can multi-dimensional poverty measures be used more effectively?
Do different poverty standards apply in urban areas? Are relative or multi-dimensional poverty measures more relevant for assessing urban poverty and vulnerability?
Does the MOLISA poor list provide an adequate approach for targeting poor households? In light of changing patterns of poverty and more diverse sources of deprivation, should different targeting approaches be developed?
More generally, what should Vietnam aspire in terms of its future social development targets? Are the MDGs still a relevant indicators of progress?
Vietnam has reduced poverty through broad-based growth and a range of relatively egalitarian social policies. But the future is less clear:
19

Will future economic growth be accompanied by rising inequality – between socio-economic groups, between regions, between the young and the old, and also between urban and rural populations? Do traditional measures of inequality match popular perceptions of inequality? Are those popular perceptions linked to widely voiced concerns about worsening distributional outcomes?
How will new programs (like the new rural areas initiate) affect regional inequalities? Will they contribute to rising inequality between regions e.g. by choosing to work first in strong performing communes and districts?
How should Vietnam manage rising inequality and uneven growth? When countries grow rapidly but unevenly, tensions can develop between the haves and have-nots. How should this be managed in Vietnam? Is there a trade-off between growth enhancing and inequality reducing policies? Are there win-win policies that help to achieve both aims?
Taking all this into account:
What should be Vietnam’s future poverty reduction agenda, what are the “second generation” policies and programs needed to build on and accelerate past rapid progress? Are new policies and interventions needed (e.g. new social assistance programs, better coverage of social insurance)? Should existing policies and programs (e.g. NTP-PR and program 30a; P-135; the new rural areas program; area-based poverty reduction programs; education and health policies; social insurance) be revised and in what ways?
Are additional policy measures and programs needed in particular to address the needs of groups suffering chronic/extreme poverty, also ethnic minority households whose constraints may be more closely linked to ethnic identity?
Who will champion second generation poverty reduction policies and programs? Who are the key actors in government and outside?
What role should the World Bank (and other international partners) play in supporting future poverty reduction efforts? In particular, how can different actors work together better, building on areas of comparative advantage?
Proposed FY12 Poverty Assessment
Timeline
This Issues Paper is being circulated widely and will serve as the basis for a series of consultations with Government and other stakeholders, including local research institutes, NGOs, and development partners. The aim of these consultations is to listen to the views of various stakeholders, and even more importantly to encourage participation and inputs from the wider research and donor community. VASS and the World Bank will jointly chair the consultations: VASS will also discuss the key findings from their
20
recent poverty report, including how proposed new analytic work under the PA will build upon issues identified in their report for further research e.g. inequality, urban poverty and vulnerability.
Building on core analytic work on welfare measurement and poverty lines, a number of background studies are being launched and (draft) background papers are planned to be available by the end of February, 2012. Local institutes, NGOs and development partners will be encouraged to contribute to this work. Pending agreement with GSO on welfare aggregates and new GSO-WB poverty lines, the team will prepare the 2010 poverty profile by the end of the December for advance discussions with Government and other stakeholders.
A workshop will be organized in early March to discuss key findings from the background studies and papers, also to identify gaps and remaining questions. The team will invite wide participation in the workshop, including representatives from agencies involved in poverty reduction and social protection activities e.g. MOLISA, CEMA, as well as research institutes and donors who are contributing to the background papers and the report.
Drawing on background work and consultations, a summary Poverty Assessment report will be prepared to present key findings and to highlight broad policy and program implications. The report and background papers will be distributed in late May, and launched by means of a dissemination workshop in Hanoi. Follow on discussions and dissemination events are planned to take place after June.
Areas of Emphasis
Poverty touches on a wide range of issues in a rapidly developing country like Vietnam, including unmet challenges from the past as well as new challenges linked to globalization and rapid change. The Poverty Assessment will aim to be selective rather than comprehensive, to take a fresh look at old and new challenges, towards the end of helping Vietnam further reduce poverty, increase resilience, and promote greater equity through implementation of its development strategy. It will draw on existing and ongoing World Bank work (e.g. new work on social protection, preparation for a new Central Highlights poverty operation, the Urbanization Review, Country Social Analysis on Ethnicity and Development) as well as recent work by other organizations (e.g. the UNDP-financed Urban Poverty Study). As noted above the team would welcome additional inputs from DPs and other stakeholders.
The first part of the report will provide a diagnostic and updated profile of poverty in contemporary Vietnam. The second part will be comprised of a number of thematic chapters, focusing selectivity on old and new challenges. The third and final part will summarize key findings and draw out strategic and policy recommendations.
Part 1: A profile and diagnostic of poverty lies at the heart of every PA. We propose to take a fresh and cross-disciplinary look at what is poverty in Vietnam – moving beyond narrow definitions based on food security and basic needs (the concept used for Vietnam during in the 1990s and early 2000s) to explore broader dimensions of poverty, including absolute versus relative concepts of poverty, chronic and transitory/stochastic concepts, also the role of social and political assets and related deprivations. Poverty in contemporary Vietnam will be characterized as a multi-dimensional phenomenon, captured in part by
21

income poverty measures (e.g. income and consumption aggregates, poverty lines) but also drawing on wider measures e.g. deprivations in access to basic services, social and political assets, and greater exposure to risk. The work will also explore the impact of adjusting welfare measures for household composition including, for example adult equivalency adjustments, also adjustments to account for higher health costs for households elderly and ill members. Using different definitions of poverty, the diagnostic and profile will examine both the extent and nature of poverty in Vietnam: who are the (new and old) poor, where do they live, what are the major constraints they face and what opportunities are available that contribute to improved and more secure living conditions. The profile and diagnostic will identify groups that are being left behind (e.g. ethnic minorities) also new forms of poverty that are emerging e.g. linked to aging, labor transitions, rising vulnerabilities in urban areas.
Part 2: A series of new thematic studies will provide additional inputs for the PA, currently planned to focus on (1) potential impacts of economic restructuring, new growth models; (2) ethnic minority poverty; (3) inequality; (4) urbanization and poverty, including labor mobility and migration; (5) links between poverty and vulnerability, and related targeting and social protection issues.
Potential Impacts of Economic Restructuring on Poverty Reduction. Since early 2008, Vietnam has struggled with periods of economic turbulence and bouts of inflation. A decision has already been made on restructuring the economy, with the aim of improving both the efficiency and sustainability of growth. Although the details of the proposed restructuring are still being discussed, Vietnam needs to reduce the investment rate to a sustainable level and consider changes in the overall composition of investment. The aggregate rate of growth is likely to fall, at least in the short-run. The Programmatic PA will explore the implications of the anticipated slow-down in growth and the changing composition of investment: there will be slower progress in reducing poverty, both as a result of lower growth as well as the particular challenges in addressing the needs of Vietnam’s remaining poor (discussed earlier). It is important for Government to monitor the impacts of restructuring policies on poor and still-vulnerable households. New forms of poverty and vulnerability may arise as a result of specific policies put in place to restructure the economy. Many of the erstwhile poor still live close to the poverty line and it is important to protect hard-won gains in income and living conditions.
Ethnic Minority Poverty. Poverty is increasingly concentrated among ethnic minority households (Figure 10). A lot of research has been carried out over the years to describe deprivations among ethnic minorities, and to identify the factors that constrain improvements in their well-being. Many of these factors are structural, linked for example to low levels of education and poor quality schools, limited access to good land, also isolation and high transport costs. The Programmatic PA will aim to complement existing studies by trying to better identify the factors and processes that have led to improvements in livelihoods and rising welfare for some minority households. Specifically, we will look for examples of ‘positive deviance’ – have some ethnic minority households have done better, and if so what strategies did they employ, what were the contributions of public policies and programs to their successes? – rather than revisit the many and well know examples of deprivations among ethnic minorities. Building on earlier studies, we will also update past analyses of the role of endowments versus returns to endowments in determining welfare improvements: do ethnic minorities become better off as endowments improve (education levels improve, programs like P-135 increase investment in local infrastructure and services) or are there still substantial gaps in returns to endowments between EM and
22

majority households? How much of ethnic minority poverty can be explained by geographic isolation from non-agricultural employment opportunities? Does potential “access to information” about non-agricultural employment have any differential impact on employment of minority populations relative to the majority Kinh/Hoa? Again, what factors are responsible for different returns to endowments? Are returns to endowments systematically lower in minority regions, regardless of ethnicity? Do differences in the quality of local government help to explain differences in outcomes?
Figure 10: Share of Ethnic Minorities by Per-capita Consumption Decile: 2006-2010(Decile 1 is poorest, Decile 10 is wealthiest)
Source: 2006, 2008, 2010 VHLSS, World Bank staff estimates
Inequality is a comparatively new concern in Vietnam. Earlier studies (based primarily on data from the VHLSS) suggest that Vietnam achieved high rates of economic growth over the past decade but without an appreciable rise in inequality. The PA will revisit and extend some of the earlier analytic work on
23

income, expenditure, and asset inequalities, using a wider range of methods and inequality measures. Standard inequality measures (like the Gini coefficient) only capture increases in relative inequality. While relative inequality may not be rising in Vietnam, new analysis suggests that absolute inequality is rising as indicated e.g. by recent GSO tabulations that show an increase in the rich/poor gap (ratio of average incomes in the top quintile to the bottom quintile), also a widening in percentile means over time (see Figure 11 below)
Although empirical studies based on the VHLSS paint a mixed picture, there are growing concerns – in the press, among policy makers, among many groups in the population – that inequality is rising. The PA will also be informed by a new qualitative study of ‘perceptions of inequality’ that aims to explore the factors that fuel these concerns. Perceptions matter in determining behavior. The study will focus on a number of questions e.g. how important are perceived inequalities in opportunities versus outcomes like income or expenditures? Is ‘conspicuous consumption’ – fancy automobiles, motorcycles, large houses, of consumer durables such as cell phones, computers, and flat screen televisions – perceived as an indication of growing inequality? Do different groups perceive inequality differently e.g. the older generation as compared to younger generations, rural households as compared to urban households? How do government officials and senior policy makers view inequality?
Figure 11: Percentile Means for Per-Capita Expenditures: 2004-2010(Jan 2010 Constant VND)
Source: 2004, 2006, 2008, 2010 VHLSS: World Bank staff estimates
New poverty maps are being prepared for 2010, which will be used to revisit measures of regional inequalities. Progress at reducing poverty has been uneven across regions, and the remaining poor are increasingly concentrated in more remote regions. In contrast, preliminary analysis suggests that wealth (viz. the wealthiest 15 percent of households) is highly concentrated in major urban areas and in peri-
24

urban regions near large cities. The PA will assess trends in spatial inequality to see whether they are rising (as many believe), also what factors are responsible for rising spatial inequalities. Inequality decompositions will help to disentangle inter and intra regional sources of inequality. Work is also planned to analyze inequality within urban areas, and the gradient of urban poverty across city size and type. Local level estimates of distributional outcomes will also be analyzed to explore the relationship between subjective assessments of well-being and the two concepts of relative versus absolute inequality.
Urbanization and Poverty. The PA will explore the emerging impacts of Vietnam’s rapid urbanization on poverty and vulnerability. Vietnam’s rising urbanization implies also an urbanization of poverty. However, it is unclear where, amongst Vietnam’s many towns and cities, the poor are located. Are differences in urban poverty rates across localities linked to observable factors such as urban infrastructure and public service availability, proximity to major metropolitan areas, or proximate rural poverty conditions? There are growing concerns about poverty in urban areas linked to rising vulnerability e.g. to employment shocks, also increasing pressure on basic infrastructure and services, greater exposure to health risks, pollution, noise, congestion and social problems. Rising food prices, also higher electricity tariffs and fuel prices have had a particularly adverse impact on low-income urban households. Urban migrants also face higher risks. A background note will be prepared that takes stock of what we know about impacts of rural-to-urban migration, in contributing to rural livelihoods (including livelihoods security) as well as part of a broader transition in the workforce.
Movement of labor out of subsistence agriculture and into non-farm activities – both rural and urban – has been an important source of poverty reduction throughout the world, including in Vietnam. More specifically, there is growing interest in the role that non-agricultural employment plays both in raising household incomes and promoting mobility at the household level, and as part of a broader structural change taking place in Vietnam’s economy. Preliminary descriptive evidence from the VHLSS, for example, suggests that rural households in the middle of the income distribution have experienced significant increases in wage employment. A background paper on off-farm employment, income growth and income mobility will be prepared, with attention to both macro and micro aspects of the relationship between off-farm employment and growth. The “macro” component will examine the correlation between non-agricultural employment opportunities at the district (and/or province) level and subsequent growth. At the household level, the note will exploit panel components of the VHLSS to examine the role of off-farm employment in household income mobility.
Targeting the Poor, Risk and Vulnerability. While mobility and income diversification will continue to contribute to improvements in well-being for Vietnamese households, the factors that drove poverty reduction in earlier years may not be as important for addressing the needs of the remaining poor, who are an increasing diverse group. Many struggle with binding structural constraints -- low levels of education and poorer quality schools, poor health and nutrition, greater exposure to risk e.g. weather and climate shocks, poorer quality land and local infrastructure, physical and in some cases social isolation. Although economic growth will continue to play an important role, targeted poverty reduction programs – either area or household based – will become increasingly more important in reaching the hard-core poor in Vietnam. The PA will look at targeting mechanisms and policy measures e.g. included under the NTP-PR, as well as potential new initiatives linked to Vietnam’s new social protection strategy or community-based poverty reduction programs (Northern Mountains, new Central Highlands).
25
There are growing concerns about exposure to risk and increasing vulnerability; the past few years have not been easy ones for Vietnam due to external shocks (e.g. rising food prices in 2008, impacts of the financial crisis in late 2008 and 2009) as well as macro instabilities and periods of high inflation. Many regions in Vietnam are highly exposed to weather shocks that impact on production in the short-run, also to the emerging long run impacts of climate change. A background note on risk and shocks will be prepared, with particular focus on the links between risk exposure and chronic poverty. This work will linked also earlier described work on targeting and social protection.
Part 3: Supplementary Work. Supplementary activities – aimed to inform the PPA but also continue past the delivery date of the first report – have been proposed in two areas: (1) development of new social monitoring tools and (2) updating the Participatory Poverty Assessments carried out in 1999 in four provinces.
New Approaches to Social Monitoring. A number of countries have been experimenting with new technologies to rapidly collect and disseminate high frequency data on service delivery and the impact of social policies. Real-time information is collected via mobile phones, which have become widely available in many low income countries. Information is then disseminated through the web-based and social networking systems: access to computers and internet services has likewise been expanding rapidly, including through the media. Collecting information through cell phone surveys is less costly and quicker than traditional survey methods: real-time data can be collected, processed, and quickly made available to the public. The new methods help to promote more vibrant civil society and – if conditions are right – greater responsiveness on the part of local and higher levels of government. The Bank has played a catalytic role helping to advance these methodologies in a number of countries.
As background to the PA, the Bank will work with Vietnamese institutions to develop and pilot an innovative cell-phone based, high frequency data collection system. In its initial phase, the project will focus on a fairly narrow set of indicators that reflect coverage and quality of basic services, benefits received through poverty reduction and other social programs, and (possibly) local prices for agriculture inputs, commodities, key food items. The indicators can be revised as needed to reflect policy changes (e.g. implementation of a new subsidy) or emerging policy issues. Building on lessons learned, the work will be scaled up with the aim to cover more sites nationwide, drawing on a standard set of indicators and regular reporting. The project will not aim to be statistically representative but instead focus e.g. on poorer areas where there are concerns about the coverage and quality of basic services, also (possibly) provinces or districts where officials are interested in the results and keen to improve e.g. service delivery or social programs. In short, where there is demand for real time information.
Updating 1999 Participatory Poverty Assessments. Four participatory poverty assessments were carried out in 1999 led by the Swedish financed Mountain Rural Development Program (Lao Cai), Action Aid (Ha Tinh), Oxfam GB (Tra Vinh), and Save the Children UK (Ho Chi Minh City). These studies made important contributions to poverty discourse in the late 1990s: they helped to legitimize qualitative research in Vietnam, also brought into policy discussions important dimensions of poverty (e.g. lack of voice and participation, social exclusion) that are not well-captured in traditional household surveys. The PPAs ultimately helped to shape how poverty was conceptualized and discussed in Vietnam, including
26

the important role played by local institutions and actors. The PPAs highlighted e.g. the very different nature of poverty and vulnerability in urban areas (HCMC), the adverse impacts of high fees and ‘voluntary contributions’ on rural poor household (Ha Tinh), the importance of high indebtedness, growing landlessness and the need for more opportunities for off-farm employment (Tra Vinh), gender issues including domestic violence (all PPAs but particularly an issue in Lao Cai), and across the board, a strong local demand for more transparency, information, and greater voice and participation.
As an extension to the current PA, we are considering revisiting the communities initially included in the 1999 PPAs to update findings and to assess progress: how do living conditions in 1999 in PPA communities compare to living conditions today? Were the poverty challenges identified in 1999 adequately addressed and are they still concerns today? What are the new challenges? What factors have contributed to progress, which groups have done well and which (if any) have been left behind.
Next Steps: Strengthening Partnerships to Support Poverty Reduction in Vietnam
As noted above, we are keen to encourage broad participation in thinking through Vietnam’s old and new poverty challenges and preparing the next Programmatic PA. The Bank already is working closely with VASS and GSO on the Programmatic PA, and we would welcome participation from other stakeholders.
For purposes of the Programmatic PA, we propose to set up an informal advisory group with broad representation from local research institutes, think tanks, NGOs, development partners, and government staff (participating in their personal capacity). The Programmatic PA Advisory Group also would include representation from existing DP working groups that focus on specific aspects of poverty and social policy e.g. poverty among ethnic minorities (the P-135 DP group) and a recently established DP’s group working on social protection. The longer run objective is to revive and build upon the collaborative approaches that were put in place when MPI set up the joint Government-Donor-NGO Poverty Working Group (PWG) in 1999. The PWG served as the coordinating mechanisms for the 1999 Participatory Poverty Assessments, and also led the preparation of Vietnam’s second Poverty Assessment Attacking Poverty in 2000. It then served as the key convening forum for Government-donor/NGO dialogue on poverty issues until completion of the Comprehensive Poverty Reduction and Growth Strategy (CPRGS) some years later. It is hoped that the PA Advisory Group will ultimately develop into a similar mechanism for coordination on broader poverty and inequality concerns.
Selected References
Baulch, B, Nguyen Thi Minh Hoa, Nguyen Thi Thu Phuong, and Pham Thai Hung (2010). Ethnic Minority Poverty in Vietnam, Chronic Poverty Research Center Working Paper No. 169, February.
27

UNDP, Hanoi People’s Committee, HCMC People’s Committee (2010). Urban Poverty Assessment in Hanoi and Ho Chi Minh City. Hanoi.
Vietnam Academy of Social Sciences (March, 2011). Poverty Reduction in Vietnam: Achievements and Challenge. Hanoi.
World Bank (1995). Viet Nam: Poverty Assessment and Strategy. Washington DC: World Bank.
World Bank (1999). Vietnam Development Report 2000: Attacking Poverty. Hanoi: World Bank.
World Bank and others (2003). Vietnam Development report 2004: Poverty. Hanoi: World Bank.
28