vietnam oilseeds and products annual u.s. soybean exports grow as
TRANSCRIPT

THIS REPORT CONTAINS ASSESSMENTS OF COMMODITY AND TRADE ISSUES MADE BY
USDA STAFF AND NOT NECESSARILY STATEMENTS OF OFFICIAL U.S. GOVERNMENT
POLICY
Date:
GAIN Report Number:
Approved By:
Prepared By:
Report Highlights:
In 2011, U.S. soybean (SB) exports to Vietnam reached a record 227 thousand metric tons (TMT), an
increase of 26 percent over the previous year due to the operation of two new commercial oilseed
crushing facilities in Vietnam in the second quarter of 2011. Post expects imports of full fat soybean to
steadily increase in the next three to five years. The U.S. soybean exports are expected to double next
year accordingly. Vietnam’s soybean meal (SBM) imports reached a record 3.0 million metric tons
(MMT), but SBM imports are likely decrease in the coming years due to local production from these
two new crushing facilities.
Nguyen Huong
Dorsey Luchok
U.S. Soybean Exports Grow as Vietnam's Feed Production
Increases
Oilseeds and Products Annual
Vietnam
VN2018
4/5/2012
Required Report - public distribution
Executive Summary:
Vietnam’s oilseed production continued to fall well below demand from the food industry, the livestock
and aquaculture feed sectors, and the vegetable oil industry. Although plans have been set to expand
growing areas for major oilseeds crops, Post doubts that production will increase as much as the
Government of Vietnam desires due to the high input costs and generally low yields of oilseeds crops,
and slow expansion in growing areas.
Imports of soybeans in 2011 rose significantly due to the increased demand from the food processing,
livestock, and aquaculture feed industries, and the vegetable oil industry combined with a zero percent
import tariff. Vietnam’s soybean imports reached a record in 2011, surpassing one million metric tons
(MMT). This represents a 350 percent increase over the previous year; 22 percent of the total imported
volume was sourced from the United States. Post expects imports of full-fat soybeans to steadily
increase in the next three to five years. Soybean meal imports increased to a record 3.0 MMT to meet
the growing demand from the livestock, and aquaculture feed sectors. U.S. soybean meal imports fell to
66 thousand metric tons (TMT), a decrease of 85 percent from the previous year. This decline is due in
part to the opening of the first oilseed crushing facilities in Vietnam during 2011. Accordingly, Post
projects Vietnam’s SBM imports to decline slightly in 2012 and 2013 as the local production will fill
the growth of feed industries.
Vietnam’s shift to importing more beans for local crushing is a positive development for U.S. trade.
The United States has a larger market share and competitive advantage in exports of soybeans
compared to soybean meal within the Vietnamese market.
In 2011, for the first time Vietnam produced soy oil from commercial crushing facilities, but continued
to import an estimated 734 TMT of crude and refined vegetable oils of all types in 2011, a 1.7 percent
increase over 2010, to meet growing demand. Post expects total imports of vegetable oils to ultimately
remain constant in 2012, as the increase in local production will help meet growth in local consumption
and export demands.
Commodities:
Production:
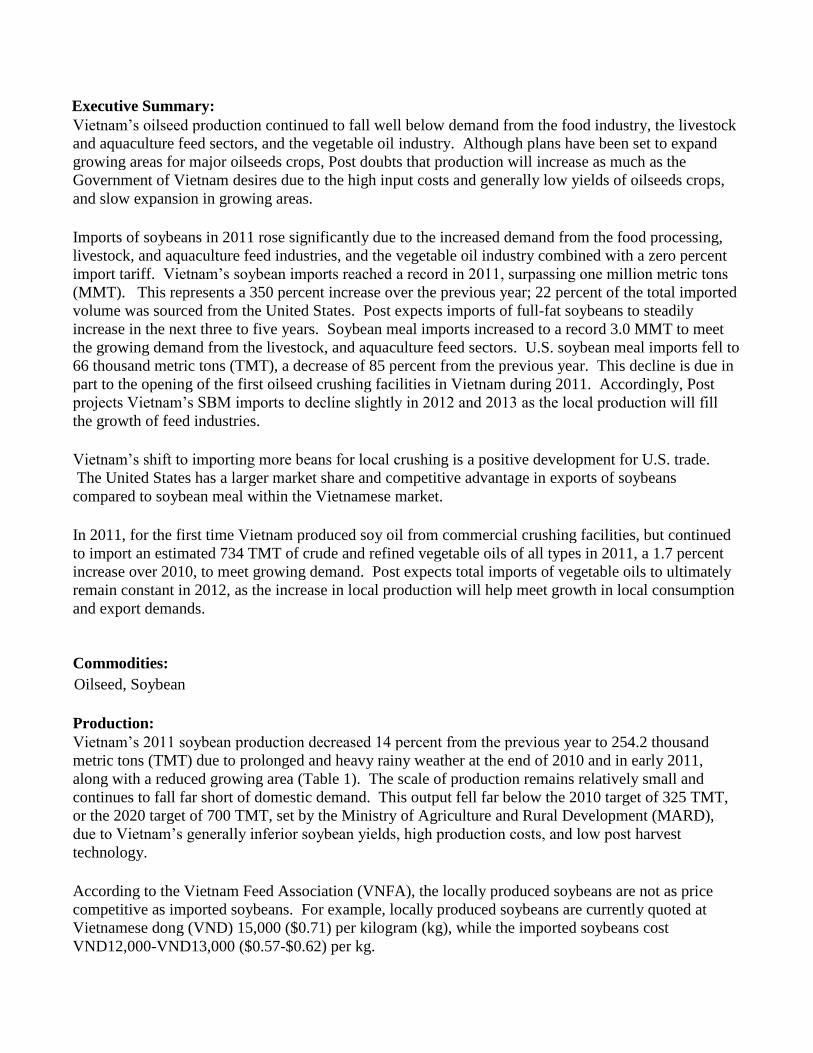
Vietnam’s 2011 soybean production decreased 14 percent from the previous year to 254.2 thousand
metric tons (TMT) due to prolonged and heavy rainy weather at the end of 2010 and in early 2011,
along with a reduced growing area (Table 1). The scale of production remains relatively small and
continues to fall far short of domestic demand. This output fell far below the 2010 target of 325 TMT,
or the 2020 target of 700 TMT, set by the Ministry of Agriculture and Rural Development (MARD),
due to Vietnam’s generally inferior soybean yields, high production costs, and low post harvest
technology.
According to the Vietnam Feed Association (VNFA), the locally produced soybeans are not as price
competitive as imported soybeans. For example, locally produced soybeans are currently quoted at
Vietnamese dong (VND) 15,000 ($0.71) per kilogram (kg), while the imported soybeans cost
VND12,000-VND13,000 ($0.57-$0.62) per kg.
Oilseed, Soybean
According to official government statistics, soybeans are currently grown in twenty five of Vietnam’s
sixty three provinces, with approximately 65 percent cultivated in the north and 35 percent in the south.
Earlier this year the Prime Minister approved the Master Plan for development of the agricultural
production sector until the year of 2020 with a vision to the year 2030. In this plan, the target set for
2020 is about an additional 100 thousand hectare (ha) for planned land soybean growing area, taking
advantage of the increase of cropland for rice, which soybean crops are often rotated with. Under the
Master Plan, by 2020 the cultivated area for soybeans will be about 350 thousand ha with a yield of 700
thousand tons, with a focus in the Red River Delta, midland, and mountainous areas in the North and
Western Highlands.
Vietnamese scientists are continuing research on biotech and other modern soybean varieties with
higher output levels and lower production costs in specific regions in Vietnam. MARD has approved
three biotech crop types for field trials – corn, cotton, and soybeans. However, no companies are
applying to implement Bt. soybean field trials at this time (only for Bt. corn). The field trial period is
expected to last for two or three years before final approval for commercialization is granted, if a
company does apply. As a result, there is no expectation that commercial production of any of biotech
oilseed crops will begin in the near future in Vietnam. With Vietnam’s Plant Variety Protection
System, which was set up under MARD’s Department of Crop Production in 2002, more and more crop
varieties including soybeans and peanuts (mostly local varieties) have been registered and approved for
plant variety protection, especially after Vietnam joined the International Union for the Protection of
New Varieties of Plants (UPOV) in 2006. This factor could motivate Vietnamese scientists to continue
research on better varieties.
Table 1: Soybean production
2007 2008 2009 2010 2011 2012* 2013*
Crop area (thousand ha) 190.1 192.1 146.2 197.8 173.6 200 230
Crop yield (MT/ha) 1.45 1.39 1.46 1.50 1.46 1.5 1.52
Total production (TMT) 275.5 267.6 213.6 296.9 254.2 300 350
Source: General Statistics Office (GSO), *Post estimates
Graph 1: Vietnam’s soybean growing area and production
Source: General Statistics Office (GSO), * Post estimates
Consumption:
Most of the soybeans locally produced in Vietnam, along with imported soybeans, are used to meet the
growing domestic demand for both human consumption and the animal feed industry. Major products
using soybeans include traditional non-fermented foods such as tofu, soy milk, and soy flour for the
food processing industry; smaller quantities are used for soy sauce, miso paste, the ice-cream industry,
and household-scale soybean oil production. Only a small portion of the soybeans produced in Vietnam
are used for animal feed. Roughly 60 percent of imported full fat soybeans went to crushing industry
(for soy oil and soybean meal), 18 percent went to animal feed industry, and 22 percent to human
consumption.
In 2011, commercial feed production in Vietnam grew by 8.5 percent in response to growing demand
from the livestock sector. MARD estimates that the demand for locally-produced commercial feed will
grow to 13,000 TMT by 2012, 16,000 TMT by 2015 and 19,000 TMT by 2020. Furthermore, local
consumption demand for healthier vegetable oil, including soy oil, is growing, and zero percent tariff
rate for soybean imports continues to make crushing plants an attractive investment in Vietnam. In
2011, Vietnam’s first two soybean crushing facilities began operating with total full capacity of 4,000
MT per day (see Photos 1, 2, 3, and 4). The new Bunge Vietnam crushing plant crushed a half million
metric tons (MMT) of soybeans from the United States, Argentina, Brazil, and Paraguay in its first 8
months of operation starting in May 2011. Quang Minh crushing plant used about 150 TMT of
soybeans, mainly from the United States and Argentina. In addition, the demand for locally produced
soy oil for export to other countries in the region is slowly growing (See table 31and 32 in the Oil
Section). Accordingly, Post projects the demand for imported full fat soybeans will be much higher in
the coming years.
Photo 1: Quang Minh Crushing Plant

Photo: Quang Minh Group
Photo 2, 3: Opening Ceremony of Quang Minh Crushing Plant on May 28th
, 2011
Photos: Quang Minh Group (QMC)
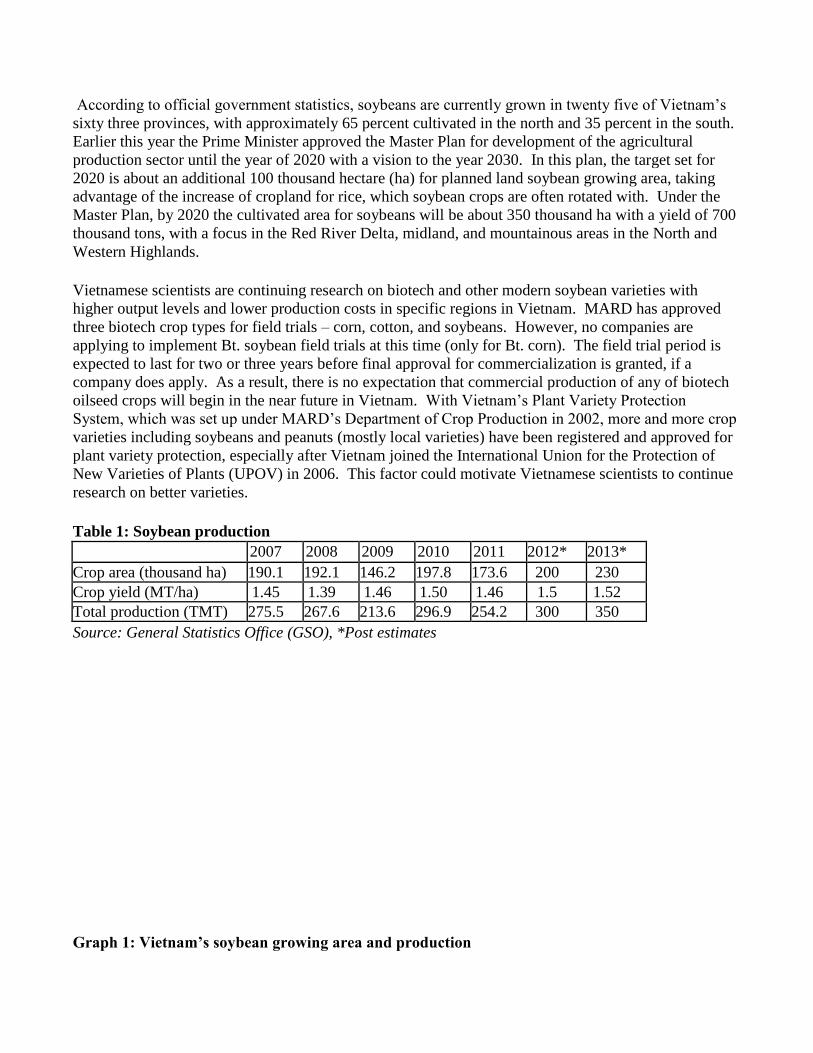
Photo 4: Opening Ceremony of Bunge Vietnam Crushing Plant on June 27th
, 2011
Photo: Bunge Vietnam
Trade:
Imports
In 2011, Vietnam imported more than one MMT of full fat soybeans, an enormous hike of 350 percent
over the previous year due to strong demand from both the food and feed sectors in the country. The
import value in 2011 also reached a record of almost $550 million, a 416 percent increase over the last
year. Approximately 49 percent of Vietnam’s soybean imports come from Brazil; 22 percent from the
United States, 16 percent from Argentina, and the rest are sourced from Canada, Uruguay, China, and
other countries (Table 2). This significant import growth is due to the operation of two new commercial
scale crushing plants in Vietnam, and strong demand from both the food and feed industries.
According to local traders, more deals with U.S. soybean exporters will likely happen in 2012.
Therefore, Post projects that Vietnam’s soybean imports from United States will double in 2012, up to
about 500 TMT.
The total import volume of full fat soybeans should increase significantly to about 1.5 MMT in the
calendar year of 2012, based on Post’s projection for the operation of Vietnam’s two oilseed crushing
plants and a strong demand from both the food and feed industries.
Marketing efforts in Vietnam for U.S. soybeans and soybean meal are continuously supported by the
American Soybean Association – International Marketing (ASA-IM) office in Hanoi. The USDA’s
Export Credit Guarantee Program (GSM-102 program) also supported the growth of soybean imports in
Vietnam (see Graph 2). The GSM-102 program started in Vietnam in late 2009, and up to now there are
ten Vietnamese banks approved. There has been a meteoric rise in use of the program in Vietnam from
$12.2 million in fiscal year (FY) 2009 to $92 million in FY 2011, for buying U.S. agricultural products
such as cotton, soybeans, soybean meal, dried distillers grains with solubles (DDGS), wheat, and other
animal feed products.
Graph 2: GSM-102 Export Credit Guarantee Program in Vietnam

Source
: FAS/USDA
Table 2: Soybean imports by sources
Country
2009 2010 2011
Quantity
(TMT) Value (million
$)
Quantity (TMT)
Value (million
$)
Quantity (TMT)
Value (million
$)
Total
Imports: 183.9 84.7 227.6 106.5 1,025 549.9
Brazil n/a n/a n/a n/a 506.9 258.2
USA 141.2 65.4 178.1 87.4 227.1 135.9
Argentina 3.7 1.9 13.3 6 159.8 87.6
Canada 6.2 3.1 17.8 8.5 88.2 47.6
Uruguay n/a n/a n/a n/a 26.9 15.4
China 20.5 3.4 13.7 2.2 9.8 1.6
Others 12.3 10.9 4.7 2.4 6.3 3.6
Source: General Customs Department, Global Trade Atlas, BICO data, Post adjusted statistics
Graph 3: Vietnam’s soybean imports (2007-2011)

Source: General Customs Department, Global Trade Atlas, Post adjusted statistics
Ports
Currently, soybeans imported to Vietnam are shipped by both containers and bulk vessels, through
major sea ports. However, according to local importers, the freight rate is considerably higher for
container cargo than for bulk cargo. Thus, bulk import shipments of soybeans are likely more
competitive and preferable for Vietnam. This logic holds as long as the crushing plants can find
sustained demand for the soybean oil created by the crushing process, and keep their plants running at
or near capacity.
Currently, Vietnam has three deep-water ports: 1) Phu My-Ba Ria Serece port and 2) Cai Mep Interflour
port, both located on the Thi Vai River of Ba Ria, Vung Tau Province, Southern Vietnam (about 30
miles from Ho Chi Minh City); and 3) Cai Lan port in Quang Ninh Province on the Northeast coast.
These ports can all handle large vessels (50,000+ tons). With its latest expansion in late 2010, the Cai
Mep Interflour port should be capable of receiving Panamax-sized 75,000 DWT vessels, which will
lower freight costs, thus making U.S. agricultural commodities (including soybeans) more competitive
for shipment to Vietnam. In addition, local traders/importers continue investing in expanding their
warehouse/storage capacity near seaports to meet the growing demand of agricultural product imports,
which includes soybeans, corn and wheat etc. For example, QMC invested in constructing 20 thousand
square meter (sqm) warehouse of 100 TMT capacity near the Cai Lan deep water sea port in Quang
Ninh province (see Photos 5, 6, and 7), and an 8 thousand sqm warehouse to store 40 TMT of goods at
Phu Thai water river port in Hai Duong province connecting with Cai Lan sea port; and a new 22
thousand sqm warehouse near Cai Mep deep wate port in Vung Tau Province able to store 120 TMT of
goods.
Photo 5: QMC’s automated uploading machine at Cai Lan sea port

Photo: Quang
Minh Group
Photo 6, 7: QMC’s warehouse at Cai Lan sea port
Photo: Quang Minh Group Photo: Quang Minh Group
Prices
Vietnam’s average import price for soybeans in 2011 was $537 per MT, about a 14 percent increase
over the previous year ($472 per MT), about a 22 percent increase over 2009 ($442), but still 7 percent
lower than the 2008 price ($575) (Graph 4). Local traders forecast that soybean import prices will
remain high due to strong demand in the world market, rising oil/gas prices, higher ocean freight costs,
and lower projected world production, especially in the United States and South American countries in
the crop year 2011/2012. Import prices for grade 2 full fat soybeans were quoted $560, $580 and $605
per MT, CFR Hai Phong in January, February and March 2012, respectively.
Graph 4: Vietnam’s average soybean import prices (2008-2011)

Source: General Customs Department, Post adjusted statistics
Import Tariffs
The tariff rate applied to soybeans (HS Code: 1201) imported from countries having Most
Favored Nation (MFN) status with Vietnam remains 0 percent with 5 percent VAT. Tariff rates for
other trade agreements are listed in Table 3.
Table 3: Soybean import tariffs
HS code Description Import tariffs (%) VAT
MFN AIFTA AANZFTA VJEPA AJCEP ACFTA AKFTA CEPT (1) (2) (3) (4) (5) (6) (7) (8) (9) (10) (11)
1201 Soybeans, whether or not broken
1201.00.10 - Suitable for
sowing 0 0 0 0 0 0 0 0 *
1201.00.90 - Other 0 4.5 5 4 5 5 5 0 *,
5
Source: Ministry of Finance
Notes:
MFN: Most Favored Nation
AIFTA: ASEAN-India Free Trade Agreement
AANZFTA: ASEAN-Australia-New Zealand Free Trade Agreement
VJEPA: Vietnam-Japan Economic Partnership Agreement
AJCEP: ASEAN Japan Comprehension Economic Partnership
ACFTA: ASEAN China Free Trade Agreement
AKFTA: ASEAN Korea Free Trade Agreement
CEPT: Common Effective Preferential Tariff
VAT: Value Added Tax
*: Not subject to Value Added Tax (VAT)
Production, Supply and Demand Data Statistics:

Table 4: Vietnam’s Production, Supply & Demand Table for Soybeans
Oilseed, Soybean
Vietnam 2010/2011 2011/2012 2012/2013
1000 HA, 1000 MT Market Year Begin: Jan
2011 Market Year Begin: Jan
2012 Market Year Begin: Jan
2013 USDA Official New Post USDA Official New Post USDA Official New Post
Area Planted 215 174 235 200 230 Area Harvested 198 174 215 200 230 Beginning Stocks 25 25 108 134 184 Production 297 254 350 300 350 MY Imports 850 1,025 1,300 1,500 1,650 MY Imp. from U.S. 200 227 500 500 700 MY Imp. from EU 0 0 0 0 0 Total Supply 1,172 1,304 1,758 1,934 2,184 MY Exports 0 0 0 0 0 MY Exp. to EU 0 0 0 0 0 Crush 550 620 1,100 1,150 1,350 Food Use Dom. Cons. 344 370 342 400 430 Feed Waste Dom. Cons. 170 180 180 200 220 Total Dom. Cons. 1,064 1,170 1,622 1,750 2,000 Ending Stocks 108 134 136 184 184 Total Distribution 1,172 1,304 1,758 1,934 2,184
Source: General Customs Office, Global Trade Atlas, Post adjusted statistics
Table 5: Vietnam’s Soybean Import Matrix

Country Vietnam
Commodity Soybeans
Time Period Jan-Dec Units: MT
Imports for: 2010 2011
U.S.A 178,111 U.S.A 227,134
Others Others Canada 17,818 Brazil 506,875
China 13,736 Argentina 159,818
Argentina 13,263 Canada 88,242
Uruguay 1,899 Uruguay 26,888
Ukraine 884 China 9,778
Cambodia 810 Ukraine 2,127
Thailand 410 India 2,107
Laos 242 Paraguay 667
Taiwan 175 Thailand 561
Japan 128 Cambodia 360
Total for Others 49,365 797,422
Others not Listed 175 497.8
Grand Total 227,651 1,025,054
Source: General Customs Office, Global Trade Atlas, Post adjusted statistics
Commodities:
Production:
According to MARD, Vietnam’s peanut production dropped by 9.5 percent in 2011 to 440.7 TMT, and
the planted crop area decreased by 9.1 percent due to prolonged and heavy rainy weather at the end of
2010 and in early 2011.
In the Master Plan for development of the agricultural production sector until the year of 2020 with a
vision to the year 2030, the target set for 2020 is about 150 thousand hectare (ha) for planned land
peanut growing area, taking advantage of the increase of cropland for rice, which peanut crops are often
rotated with, to make the cultivated area for peanuts about 300 thousand ha with an output of 800 TMT,
with a focus in the North Central coast, mountainous and midland areas in the North, and the South
Central Coast.
In 2012, Post expects the growing area to expand to 240 thousand ha and production to increase 20
percent to 530 TMT because farmers will be planting better varieties, although the crop area is unlikely
to expand back to 2008 and 2009 levels (Table 6, Table 11).
Table 6: Peanut production, 2008 - 2012
Oilseed, Peanut
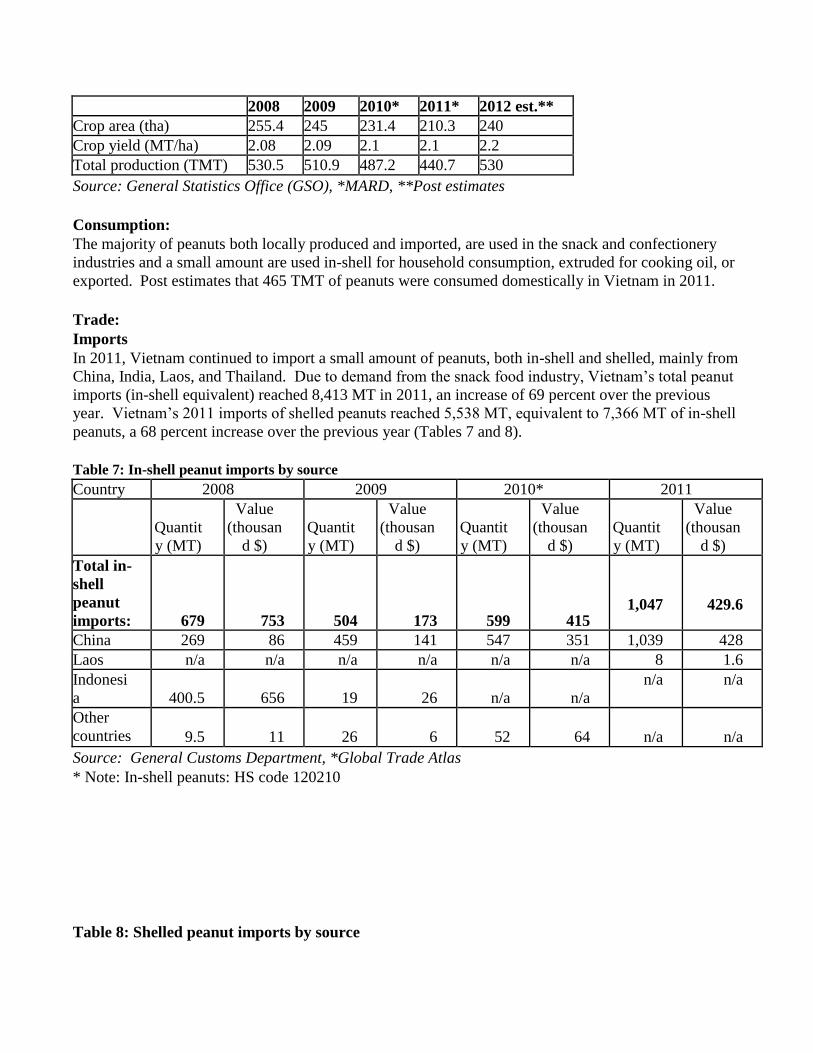
2008 2009 2010* 2011* 2012 est.**
Crop area (tha) 255.4 245 231.4 210.3 240
Crop yield (MT/ha) 2.08 2.09 2.1 2.1 2.2
Total production (TMT) 530.5 510.9 487.2 440.7 530
Source: General Statistics Office (GSO), *MARD, **Post estimates
Consumption:
The majority of peanuts both locally produced and imported, are used in the snack and confectionery
industries and a small amount are used in-shell for household consumption, extruded for cooking oil, or
exported. Post estimates that 465 TMT of peanuts were consumed domestically in Vietnam in 2011.
Trade:
Imports
In 2011, Vietnam continued to import a small amount of peanuts, both in-shell and shelled, mainly from
China, India, Laos, and Thailand. Due to demand from the snack food industry, Vietnam’s total peanut
imports (in-shell equivalent) reached 8,413 MT in 2011, an increase of 69 percent over the previous
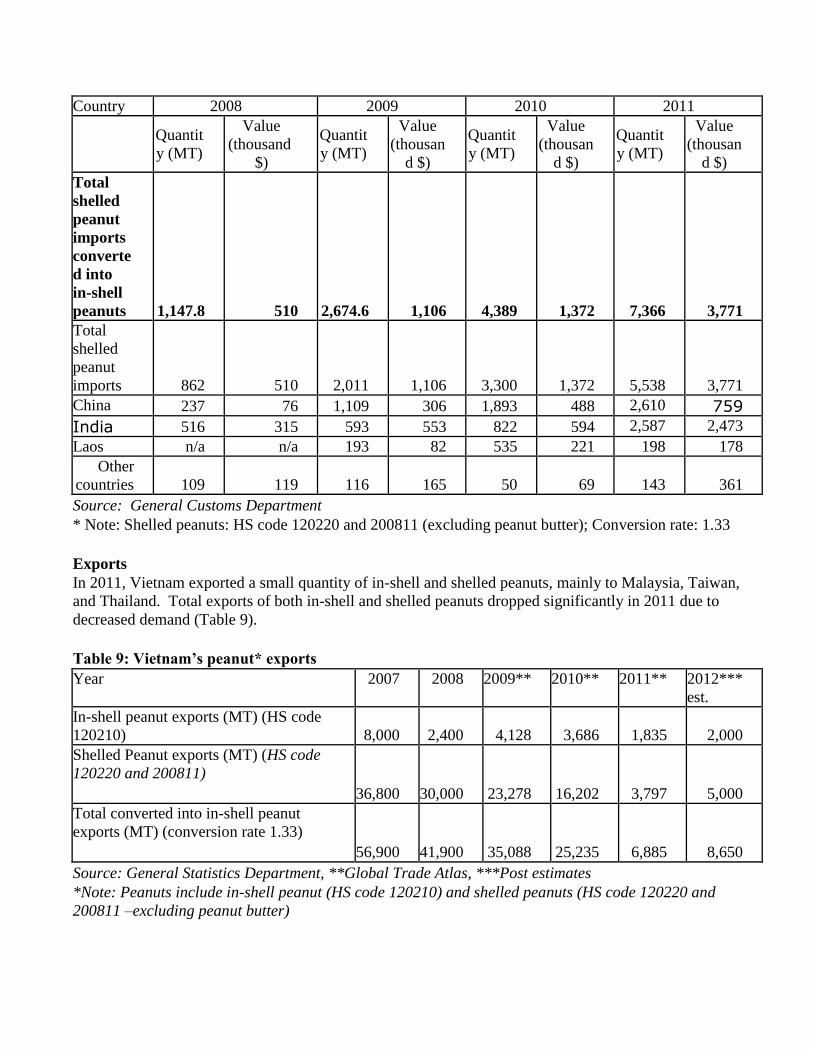
year. Vietnam’s 2011 imports of shelled peanuts reached 5,538 MT, equivalent to 7,366 MT of in-shell
peanuts, a 68 percent increase over the previous year (Tables 7 and 8).
Table 7: In-shell peanut imports by source
Country 2008 2009 2010* 2011
Quantit
y (MT)
Value
(thousan
d $) Quantit
y (MT)
Value
(thousan
d $) Quantit
y (MT)
Value
(thousan
d $) Quantit
y (MT)
Value
(thousan
d $)
Total in-
shell
peanut
imports: 679 753 504 173 599 415
1,047
429.6
China 269 86 459 141 547 351 1,039 428
Laos n/a n/a n/a n/a n/a n/a 8 1.6
Indonesi
a 400.5 656 19 26 n/a n/a n/a n/a
Other
countries 9.5 11 26 6 52 64
n/a
n/a
Source: General Customs Department, *Global Trade Atlas
* Note: In-shell peanuts: HS code 120210
Table 8: Shelled peanut imports by source
Country 2008 2009 2010 2011
Quantit
y (MT)
Value (thousand
$)
Quantit
y (MT)
Value
(thousan
d $)
Quantit
y (MT)
Value
(thousan
d $)
Quantit
y (MT)
Value
(thousan
d $)
Total
shelled
peanut imports
converte
d into in-shell
peanuts 1,147.8 510 2,674.6 1,106 4,389 1,372 7,366 3,771 Total
shelled
peanut
imports 862 510 2,011 1,106 3,300 1,372 5,538 3,771
China 237 76 1,109 306 1,893 488 2,610 759
India 516 315 593 553 822 594 2,587 2,473
Laos n/a n/a 193 82 535 221 198 178
Other
countries 109 119 116 165 50 69 143 361
Source: General Customs Department
* Note: Shelled peanuts: HS code 120220 and 200811 (excluding peanut butter); Conversion rate: 1.33
Exports
In 2011, Vietnam exported a small quantity of in-shell and shelled peanuts, mainly to Malaysia, Taiwan,
and Thailand. Total exports of both in-shell and shelled peanuts dropped significantly in 2011 due to
decreased demand (Table 9).
Table 9: Vietnam’s peanut* exports
Year 2007 2008 2009** 2010** 2011** 2012*** est.
In-shell peanut exports (MT) (HS code
120210) 8,000 2,400 4,128 3,686 1,835 2,000
Shelled Peanut exports (MT) (HS code
120220 and 200811)
36,800 30,000 23,278 16,202 3,797
5,000
Total converted into in-shell peanut
exports (MT) (conversion rate 1.33)
56,900 41,900 35,088 25,235 6,885
8,650
Source: General Statistics Department, **Global Trade Atlas, ***Post estimates
*Note: Peanuts include in-shell peanut (HS code 120210) and shelled peanuts (HS code 120220 and
200811 –excluding peanut butter)

Table 10: Peanut import tariffs
HS
code Description
Import tariffs (%) VAT
MFN AIFTA AANZFTA VJEPA AJCEP ACFTA AKFTA CEPT
(1) (2) (3) (4) (5) (6) (7) (8) (9) (10) (11)
1202 Peanuts, not roasted or otherwise cooked, whether or not shelled or broken
1202.10.10 - - Suitable for
sowing 0 0 0 0 0 0 0 0 *
1202.10.90 - - Other 10 8 10 7 6 5 5 0 *,
5
1202.20.00
- Shelled,
whether or not
broken 10 8 10 7 6 5 5 0 *,
5
2008 Fruits, nuts and other edible parts of plants, otherwise prepared or preserved, whether or not
containing added sugar or other sweetening matter or spirit, NESOI.
2008.11.10 - - - Roasted
ground nuts 32 35 30 32.5 30 15 20 5 10
2008.11.20 - - - Peanut
butter 22 35 30 32.5 30 15 20 5 10
2008.11.90 - - - Other 24 35 30 32.5 30 15 20 5 10
Source: Ministry of Finance; Notes: VAT*: 0 percent
Production, Supply and Demand Data Statistics:
Table 11: Vietnam’s Production, Supply & Demand Table for Peanuts*
Oilseed, Peanut
Vietnam 2010/2011 2011/2012 2012/2013
1000 HA, 1000 MT Market Year Begin: Jan
2011 Market Year Begin: Jan.
2012 Market Year Begin: Jan
2013 USDA Official New Post USDA Official New Post USDA Official New Post
Area Planted 0 220 0 250 260 Area Harvested 244 210 245 240 250 Beginning Stocks 30 30 30 7 25 Production 486 441 515 530 550 MY Imports 6 8 6 8 8 MY Imp. from U.S. 0 0 0 0 0 MY Imp. from EU 0 0 0 0 0 Total Supply 522 479 551 545 583 MY Exports 15 7 18 10 15 MY Exp. to EU 0 0 0 0 0 Crush 20 15 20 20 20 Food Use Dom. Cons. 457 450 484 490 520 Feed Waste Dom. Cons. 0 0 0 0 0 Total Dom. Cons. 477 465 504 510 540 Ending Stocks 30 7 29 25 28 Total Distribution 522 479 551 545 583

Source: General Customs Office, Global Trade Atlas, Post estimates
*Note: Peanuts include in-shell peanut (HS code 120210) and shelled peanuts (HS code 120220 and
200811 –excluding peanut butter)
Table 12: Vietnam’s Peanut* Import Matrix
Country Vietnam
Commodity Peanuts (in-shell basis)
Time Period Jan-Dec Units: MT
Imports for: 2010 2011
U.S. 0 U.S. 0
Others Others China 3,065 China 4,510
India 1,093 India 3,441
Laos 712 Laos 271
Hong Kong 52 Thailand 174
Thailand 66.5
Total for Others 4,988 8,396
Others not Listed 16
Grand Total 4,988 8,412
Source: General Customs Office, Global Trade Atlas
*Note: Peanuts include in-shell peanut (HS code 120210) and shelled peanuts (HS code 120220 and
200811 –excluding peanut butter)
Table 13: Vietnam’s Peanut* Export Matrix
Country Vietnam
Commodity Peanuts (in-shell basis)
Time Period Jan-Dec Units: MT
Imports for: 2010 2011
U.S. U.S. 283
Others Others Thailand 12,279 Malaysia 2,214
Indonesia 2,338 Taiwan 1,486
Malaysia 2,291 Thailand 1,245
Taiwan 2,051 Russia 1,174
Philippines 1,349
Canada 250
Singapore 233
Ukraine 145
Russia 133
Total for Others 21,069 6,119
Others not Listed 4,166 483
Grand Total 25,235 6,885

Source: Global Trade Atlas
*Note: Peanuts include in-shell peanut (HS code 120210) and shelled peanuts (HS code 120220 and
200811 –excluding peanut butter)
Commodities:
Production:
Vietnam has historically produced a negligible amount of soybean meal (SBM) due to a lack of
commercial crushing facilities. However, the Bunge crushing plant (3,000 MT per day capacity) and
the Quang Minh Group crushing plant (1,000 MT per day capacity) each began operation in the middle
of 2011 (See Commodities: Oilseed, Soybean - Photos 1, 2, 3, and 4). Reportedly, local SBM
production was estimated at about 490,000 MT in 2011 and is expected to increase significantly in the
coming years (see Table 14). This growing domestic SBM production reduces imports. However,
demand for soy oil serves as a potential limiting factor in meal production (See Commodities: Oil,
Soybean).
Table 14: Vietnam’s soybean meal production
2011 2012* 2013*
Bunge Vietnam Crushing Plant (TMT) 370 720 840
Quang Minh Crushing Plant (TMT) 120 180 240
Total SBM production (TMT) 490 900 1,080
Source: Local Producers, *Post estimates
Consumption:
Almost all SBM, both locally produced and imported, is used in the animal feed and the aquaculture
feed industries; only a small volume of imported soy flour is used for food (see Table 15 and Table 16).
According to the American Soybean Association office in Vietnam, about 70 percent of SBM goes to
hog feed, 15 percent to poultry feed, 10 percent to aquaculture feed, and 5 percent to other uses.
According to local producers and traders, most of locally produced SBM is consumed for domestic
animal feed industry in the country.
According to the Vietnam Animal Feed Association (VNFA), the country has currently 233 registered
feed manufacturers, of which 50 are foreign-invested and 11 are joint-ventures. The remaining firms
are domestic, but 60 percent of the market share is held by the foreign companies. Many local feed
mills are expanding their production to meet the growing demands in the country such as the new
Cargill feed mill with an additional capacity of 120,000 MT per year in Ha Nam Province (in northern
Vietnam), making Cargill’s overall animal feed production capacity in Vietnam up to more than
800,000 MT of feed per year. Indonesia-owned Japfa Vietnam plans to produce one million MT of feed
per year by 2015. The Thailand-owned CP group is building a new feed mill with a projected capacity
of 60,000 MT per month in the Hung Yen province. Vietnam’s Hong Ha Company added a new
production line to an existing feed mill with the potential to increase their capacity to 400,000 MT per
year in the Ha Nam province. A joint venture between Japanese firms Sojitz and Kyodo Shiryo will
invest 2 billion Japanese yen (US$25 million) to build an animal feed processing plant to produce a
projected 200,000 MT annually in the Long An province (on the outskirts of Ho Chi Minh City).
China’s Tongwei Co. Ltd. invested $10 million to build a livestock feed mill with an annual output of
Meal, Soybean

200,000 metric tons in the Hai Duong province (northern Vietnam). The Netherlands’ De Heus LLC
Vietnam has acquired its first aqua feed mill with a capacity of 100,000 MT per year in the Vinh Long
province; and Greenfeed Vietnam in the north is expanding its current mill of 12,000 MT per month to
30,000 MT per month in the Hung Yen province and is building a new feed mill in the Ha Nam
province.
Graph 5: Vietnam’s soybean meal consumption by sources
Source: General Customs Department, Global Trade Atlas, * BICO data,
Post adjusted statistics; Post estimates
The Vietnamese feed industry is currently facing a number of macroeconomic challenges that are likely
to continue for at least the next few years. For example, Vietnam’s inflation rate hit 23 percent in 2011,
and while it has declined significantly to around 15 percent during the first quarter of 2012, it is still
constraining businesses’ purchasing power. Vietnam's economy also faces challenges from low foreign
exchange reserves, an undercapitalized banking sector, high borrowing costs and rapidly increasing
energy costs. The latter two factors, in particular, have negatively impacted the bottom line for small to
medium-sized feed mills as they respectively increase the costs of imported feed materials and operating
machinery and mills. Taken together, all these factors are contributing to higher production costs for
animal feed in Vietnam.
The livestock husbandry sector has been experiencing difficulties of its own, including an uptick in the
prevalence of certain zoonotic diseases (foot and mouth disease in pigs and cattle; H5N1 avian influenza
in poultry; blue ear disease [PRRS disease] in pigs); production losses from bad weather; and higher
overall production costs due to the macroeconomic factors outlined previously. And, by extension,
disease outbreaks cause additional problems for the animal feed industry. However, according to
MARD, the livestock sector will recover and continue to develop in CY 2012. Post estimates that
Vietnam will need about 13 million MT (MMT) of industrial animal feed (about 20 percent SBM) for
the livestock sector and 3.5 MMT of fish feed (15-20 percent SBM) for the aquaculture sector in 2012.

Trade:
Imports
Vietnam continues to import SBM to offset the protein shortage in the country, while local production
currently meets about 14 percent of demand. Despite the government’s efforts, growth in oilseed
production has fallen far short of fulfilling the country’s protein needs. Under the current tariff
structure, SBM has zero import duty for imports from WTO member countries. This supports increase
of SBM imports into Vietnam in 2011.
Vietnam’s 2011 SBM imports reached a record of 2.999 MMT, a 9.4 percent increase over 2010 due to
surging demand from the feed industry. Post estimates SBM imports in CY 2012 (MY 2011) will
decrease to 2.66 MMT with an anticipated reduction in trade of about 11 percent less than the 2011
figure, and in CY 2013 (MY 2012) to be about 2.55 MMT due to the operation of two new industrial-
scale processing facilities in the middle of 2011.
In 2011, Argentina continued taking the largest market share in Vietnam and remained the largest
supplier of SBM to Vietnam. Argentina’s market share accounted for 44 percent in 2011, while India’s
market share was 37 percent, an increase from 29 percent in 2010.
U.S. SBM exports to Vietnam in 2011 dropped to 66 TMT, decreasing 85 percent from 2011. The U.S.
market share in Vietnam was very small, accounting for only 2.2 percent, a drop from 16 percent in
2010 (Table 15), although the quality of U.S. SBM is high to compared with other sources. According
to local traders, the drop in imports of U.S. SBM in 2011 could be due to several factors:
High prices for U.S. SBM
Cheaper prices of SBM offered from Argentina and India
Shorter shipping time from India
Increase in domestic production of SBM
U.S. SBM exports to Vietnam should rise somewhat in 2012 due to the increasing sophistication of the
Vietnamese feed industry requiring good quality products, but not to 2010 levels. The local feed
industry is starting to have a greater awareness of the quality of U.S. SBM and what that means for the
quality of their finished product.
Table 15: Soybean meal imports by source in the period 2007-2011
2007 2008 2009 2010 2011
S/N Total Imports: (TMT) 2,549 2,461 2,478 2,737 2,993 1 Argentina 731 415 983.8 1,137 1,326
2 India 1,563 1,751 1,014.6 804 1,119
3 USA 49 90 173.6 429 66
4 Brazil 42 73 69.5 273 401
5 China 46 47 171.2 45 27
6 UAE 66 32 3.3 1 n/a
7 Other countries 52 53 62 48 54
Source: General Customs Department, Global Trade Atlas, * BICO data, Post adjusted statistics
**Note: Soybean meal HS code: 2304
Graph 6: Vietnam’s soybean meal imports by sources in 2011

Source: General Customs Department, Global Trade Atlas, * BICO data, Post adjusted statistics
Vietnam also imports a small volume of full fat soybean flour (4,967 MT) for both the food and feed
industries, mainly from Malaysia, Taiwan, the United States, India, and China, accounting for 99
percent of total imports (Table 16).
Table 16: Soybean flour imports by sources
Country
2008 2009 2010 2011
Quantit
y
(MT)
Value (thousan
d $)
Quantity
(MT)
Value
(thousan
d $)
Quantit
y
(MT)
Value
(thousan
d $)
Quantity
(MT)
Value
(thousan
d $)
Total
Imports
:
9,093 9,051 5,568 3,933 4,720 3,258 4,967 2,994
Malaysi
a 8,979 6,325 5,042 3,543 4,588 3,157 3,276 2,314
Taiwan 12 7.3 0.2 0.3 15 9 980 319
USA *76 39* *110 *44 *48 29 312 164
India n/a n/a n/a n/a n/a n/a 223 93
China 2 5.5 18 15 33 26 109 14
Japan 14 2,667 11 18 21 30 41 68
South
Korea n/a n/a n/a n/a 15 7 26 23
Thailan
d 10 7.2 363 290 n/a n/a 0.03 0.4
Denmar
k n/a n/a 24 23 n/a n/a n/a n/a
Source: General Customs Department; * BICO data
**Note: Soybean flour HS code: 1208

A small volume (638 MT) of soybean hulls (HS code: 230250) with value of $194 thousand were also
imported from the United States, Japan, and China in 2011 to be used in the feed industry, especially for
dairy sector.
Prices Vietnam’s average import price for SBM in 2011 was $441 per metric ton, about 4.3 percent higher than
the previous year ($423), a 6.2 percent increase over 2009 ($415), but about 1.8 percent lower than 2008
($449) (Graph 7).
As of late March 2012, imported prices are quoted at around $475- $485/MT CFR Haiphong and at
around $490-$499 for the for U.S. SBM shipment in April 2011. These prices have all increased
compared with the previous month ($450-$460). Local traders projected that the import prices could be
volatile, but likely higher in next several months as demand is still high.
In the face of high prices, the feed industry in Vietnam will tend to use cheaper ingredients to lower
production cost; most of the growth in feed demand is filled by less expensive products such as DDGS,
copra meal, canola meal, and other meals. Table 17 shows a comparison of local prices of common
feed ingredients in Vietnam. However, an increasingly large segment of the industry recognizes the
value in using high-protein SBM, and will likely buy the U.S. product if other supplies are difficult to
acquire.
Graph 7: Vietnam’s average soybean meal import prices (2008-2011)
Source: General Customs Department, Post adjusted statistics
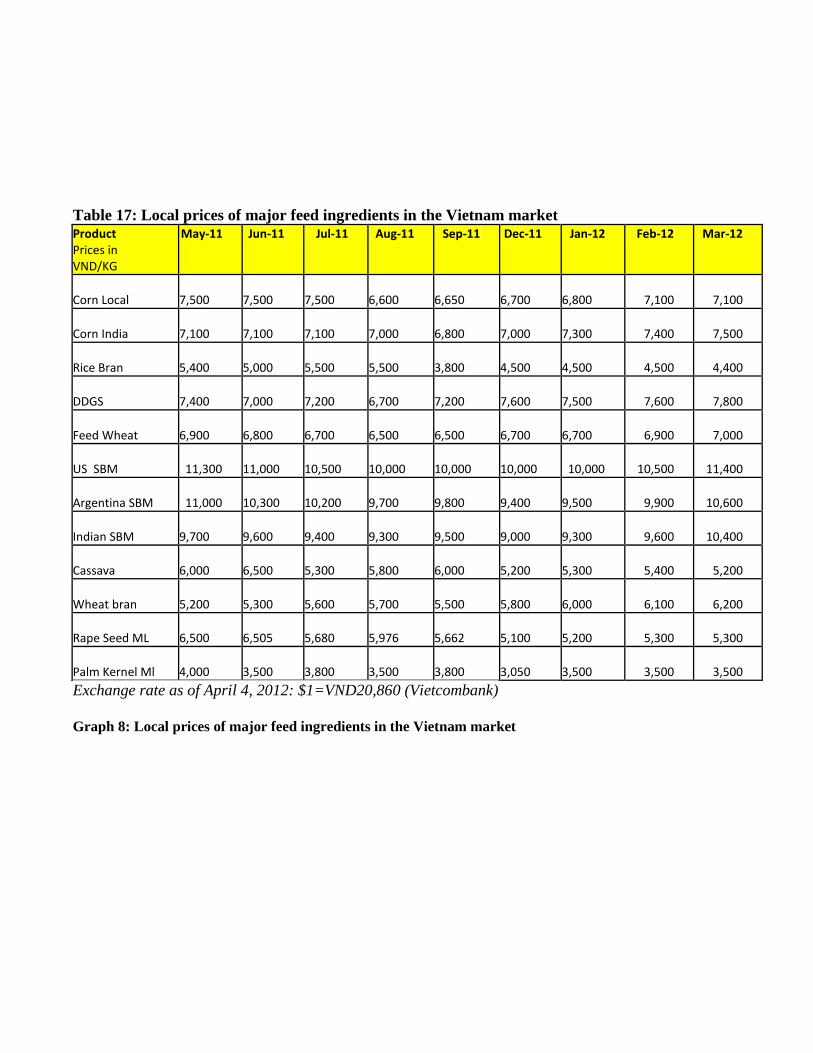
Table 17: Local prices of major feed ingredients in the Vietnam market Product Prices in VND/KG
May-11 Jun-11 Jul-11 Aug-11 Sep-11 Dec-11 Jan-12 Feb-12 Mar-12
Corn Local 7,500
7,500
7,500
6,600
6,650
6,700
6,800
7,100
7,100
Corn India 7,100
7,100
7,100
7,000
6,800
7,000
7,300
7,400
7,500
Rice Bran 5,400
5,000
5,500
5,500
3,800
4,500
4,500
4,500
4,400
DDGS 7,400
7,000
7,200
6,700
7,200
7,600
7,500
7,600
7,800
Feed Wheat 6,900
6,800
6,700
6,500
6,500
6,700
6,700
6,900
7,000
US SBM 11,300 11,000
10,500
10,000
10,000
10,000 10,000
10,500
11,400
Argentina SBM 11,000 10,300
10,200
9,700
9,800
9,400
9,500
9,900
10,600
Indian SBM 9,700
9,600
9,400
9,300
9,500
9,000
9,300
9,600
10,400
Cassava 6,000
6,500
5,300
5,800
6,000
5,200
5,300
5,400
5,200
Wheat bran 5,200
5,300
5,600
5,700
5,500
5,800
6,000
6,100
6,200
Rape Seed ML 6,500
6,505
5,680
5,976
5,662
5,100
5,200
5,300
5,300
Palm Kernel Ml 4,000
3,500
3,800
3,500
3,800
3,050
3,500
3,500
3,500
Exchange rate as of April 4, 2012: $1=VND20,860 (Vietcombank)
Graph 8: Local prices of major feed ingredients in the Vietnam market

Source: Local traders, ASA-IM office in Vietnam;
Import Tariffs The tax rates applied to SBM, full fat soybean flour, and soybean hulls imported from countries having Most Favored Nation (MFN) status with Vietnam have remained unchanged, see the oilseeds report from 2011.
Production, Supply and Demand Data Statistics:
Table 18: Vietnam’s Production, Supply & Demand Table for Soybean Meal** Meal, Soybean
Vietnam 2010/2011 2011/2012 2012/2013
1000 MT, PERCENT Market Year Begin: Jan
2011 Market Year Begin: Jan
2012 Market Year Begin: Jan
2013 USDA Official New Post USDA Official New Post USDA Official New Post
Crush 550 620 1,100 1,150 1,350 Extr. Rate, 999.9999 1 1 1 1 1 Beginning Stocks 18 18 124 104 110 Production 430 490 860 900 1,080 MY Imports 2,576 2,999 2,250 2,660 2,550 MY Imp. from U.S. 52 66 50 100 150 MY Imp. from EU 0 0 0 0 0 Total Supply 3,024 3,507 3,234 3,664 3,740 MY Exports 0 0 0 0 0 MY Exp. to EU 0 0 0 0 0 Industrial Dom. Cons. 0 0 0 0 0 Food Use Dom. Cons. 0 3 0 4 5 Feed Waste Dom. 2,900 3,400 3,100 3,550 3,650

Cons. Total Dom. Cons. 2,900 3,403 3,100 3,554 3,655 Ending Stocks 124 104 134 110 85 Total Distribution 3,024 3,507 3,234 3,664 3,740
Source: General Customs Office, Post adjusted statistics; Post estimates
**Note: Soybean meal includes soybean meal and cake (HS Code: 230400); Soy flour (HS Code:
120810); and soybean hulls (HS Code: 230250)
Table 19: Vietnam’s Soybean Meal Import Matrix
Country Vietnam
Commodity Soybean meal
Time Period Jan-Dec Units: MT
Imports for: 2010 2011 U.S. 429,160 U.S. 66,125
Others Others Argentina 1,136,548 Argentina 1,325,706
India 803,890 India 1,118,768
Brazil 272,579 Brazil 400,379
China 44,596 China 27,032
Singapore 23,420 Singapore 23,270
Taiwan 17,624 Taiwan 17,759
Malaysia 2,514 Malaysia 9,931
Thailand 1,060
United Arab Emirates 1,015
American Samoa 1,000
Total for Others 2,304,246 2,922,846
Others not Listed 3,772 3,792
Grand Total 2,737,178 2,992,764
Source: General Customs Department, Global Trade Atlas, BICO data, Post adjusted statistics
**Note: Soybean meal HS code: 2304
Commodities:
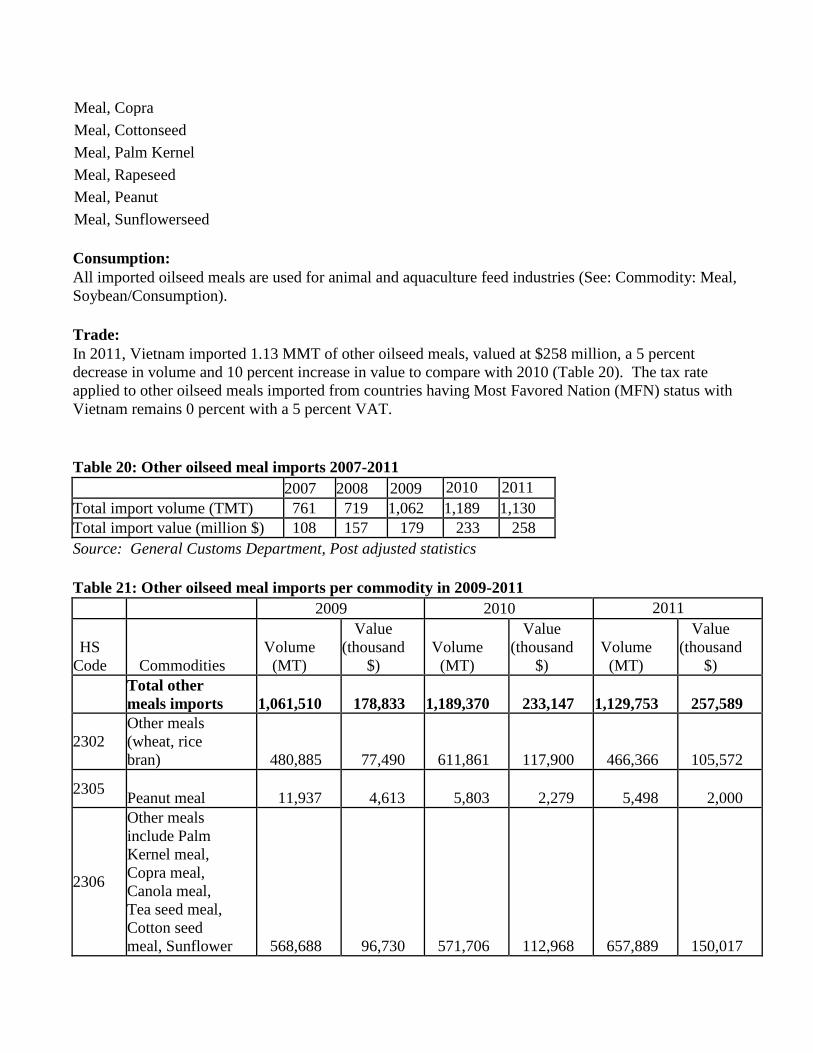
Consumption:
All imported oilseed meals are used for animal and aquaculture feed industries (See: Commodity: Meal,
Soybean/Consumption).
Trade:
In 2011, Vietnam imported 1.13 MMT of other oilseed meals, valued at $258 million, a 5 percent
decrease in volume and 10 percent increase in value to compare with 2010 (Table 20). The tax rate
applied to other oilseed meals imported from countries having Most Favored Nation (MFN) status with
Vietnam remains 0 percent with a 5 percent VAT.
Table 20: Other oilseed meal imports 2007-2011
2007 2008 2009 2010 2011
Total import volume (TMT) 761 719 1,062 1,189 1,130
Total import value (million $) 108 157 179 233 258
Source: General Customs Department, Post adjusted statistics
Table 21: Other oilseed meal imports per commodity in 2009-2011
2009 2010 2011
HS
Code Commodities Volume
(MT)
Value (thousand
$) Volume
(MT)
Value
(thousand
$) Volume
(MT)
Value
(thousand
$)
Total other
meals imports
1,061,510 178,833 1,189,370 233,147 1,129,753 257,589
2302 Other meals (wheat, rice
bran)
480,885 77,490 611,861 117,900 466,366 105,572
2305 Peanut meal
11,937 4,613 5,803 2,279 5,498 2,000
2306
Other meals
include Palm
Kernel meal,
Copra meal,
Canola meal,
Tea seed meal,
Cotton seed
meal, Sunflower 568,688 96,730 571,706 112,968 657,889 150,017
Meal, Sunflowerseed
Meal, Peanut
Meal, Rapeseed
Meal, Palm Kernel
Meal, Cottonseed
Meal, Copra

meal, Sesame
meal, Guar meal,
and other meals,
of which
Palm Kernel
meal 160,222 11,177 154,478 16,690
112,935 16,750
Copra meal 157,221 20,464 151,878 20,372 138,000 29,800
Canola meal 64,808 16,419 249,949 72,468 263,000 76,600
Tea seed meal 8,362 1,339 13,061 2,843 10,303 3,254
Sunflower meal 55 20 424 270 446 168
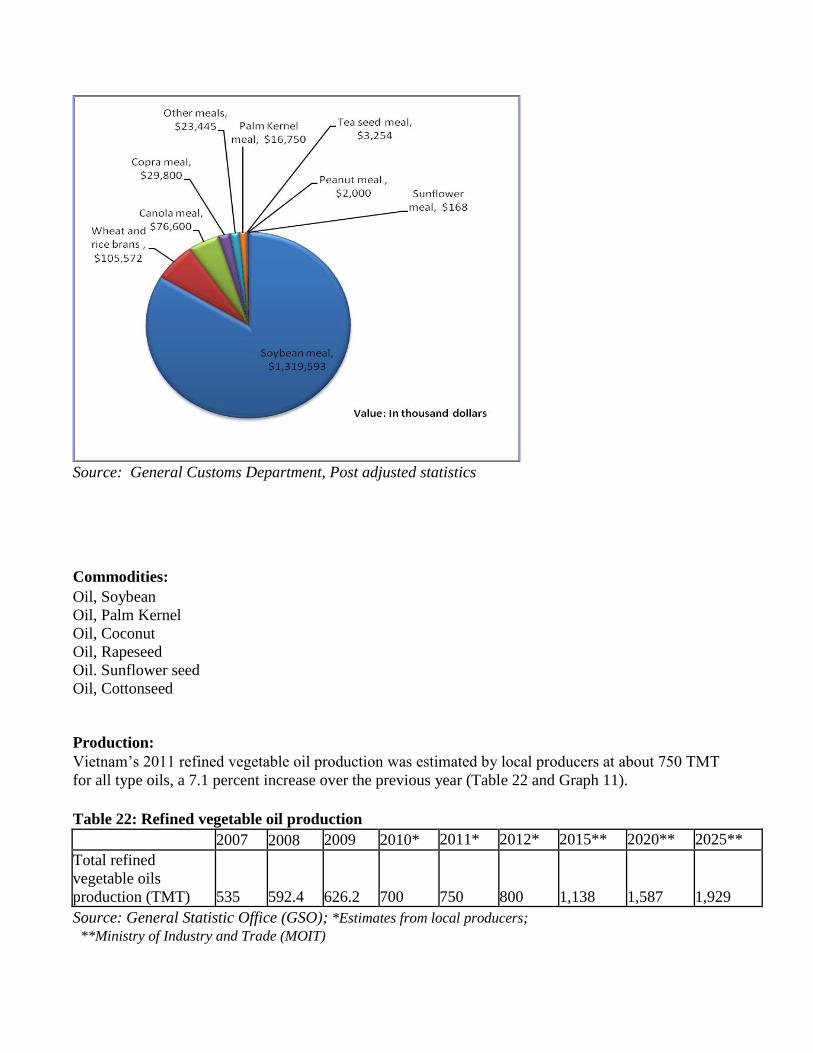
Other meals 178,020 47,311 1,916 325 133,205 23,445
Source: General Customs Department, ASA-IM office in Vietnam, Post adjusted statistics
Graph 9: Vietnam’s oilseed meal imports in 2011, by volume
Source: General Customs Department, Post adjusted statistics
Graph 10: Vietnam’s oilseed meal imports in 2011, by value
Source: General Customs Department, Post adjusted statistics
Commodities:
Oil, Soybean
Oil, Palm Kernel
Oil, Coconut
Oil, Rapeseed
Oil. Sunflower seed
Oil, Cottonseed
Production:
Vietnam’s 2011 refined vegetable oil production was estimated by local producers at about 750 TMT
for all type oils, a 7.1 percent increase over the previous year (Table 22 and Graph 11).
Table 22: Refined vegetable oil production
2007 2008 2009 2010* 2011* 2012* 2015** 2020** 2025**
Total refined
vegetable oils
production (TMT) 535 592.4 626.2 700 750 800 1,138 1,587 1,929
Source: General Statistic Office (GSO); *Estimates from local producers; **Ministry of Industry and Trade (MOIT)
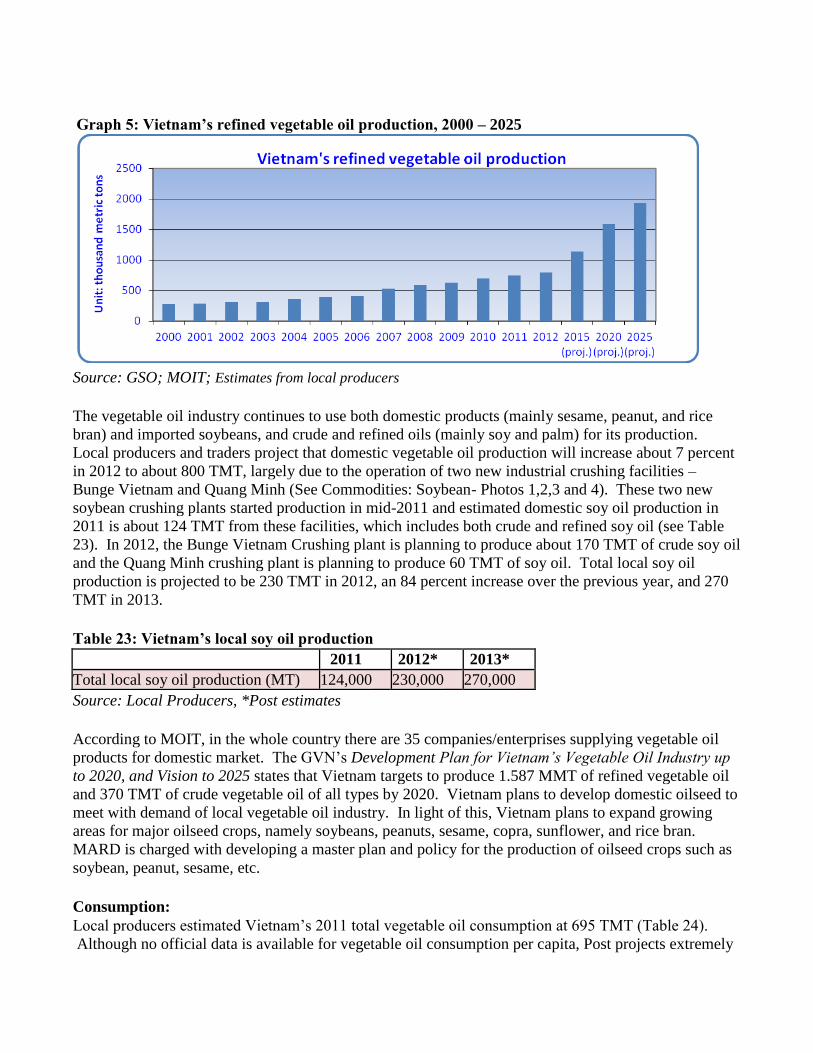
Graph 5: Vietnam’s refined vegetable oil production, 2000 – 2025
Source: GSO; MOIT; Estimates from local producers
The vegetable oil industry continues to use both domestic products (mainly sesame, peanut, and rice
bran) and imported soybeans, and crude and refined oils (mainly soy and palm) for its production.
Local producers and traders project that domestic vegetable oil production will increase about 7 percent
in 2012 to about 800 TMT, largely due to the operation of two new industrial crushing facilities –
Bunge Vietnam and Quang Minh (See Commodities: Soybean- Photos 1,2,3 and 4). These two new
soybean crushing plants started production in mid-2011 and estimated domestic soy oil production in
2011 is about 124 TMT from these facilities, which includes both crude and refined soy oil (see Table
23). In 2012, the Bunge Vietnam Crushing plant is planning to produce about 170 TMT of crude soy oil
and the Quang Minh crushing plant is planning to produce 60 TMT of soy oil. Total local soy oil
production is projected to be 230 TMT in 2012, an 84 percent increase over the previous year, and 270
TMT in 2013.
Table 23: Vietnam’s local soy oil production
2011 2012* 2013*
Total local soy oil production (MT) 124,000 230,000 270,000
Source: Local Producers, *Post estimates
According to MOIT, in the whole country there are 35 companies/enterprises supplying vegetable oil
products for domestic market. The GVN’s Development Plan for Vietnam’s Vegetable Oil Industry up
to 2020, and Vision to 2025 states that Vietnam targets to produce 1.587 MMT of refined vegetable oil
and 370 TMT of crude vegetable oil of all types by 2020. Vietnam plans to develop domestic oilseed to
meet with demand of local vegetable oil industry. In light of this, Vietnam plans to expand growing
areas for major oilseed crops, namely soybeans, peanuts, sesame, copra, sunflower, and rice bran.
MARD is charged with developing a master plan and policy for the production of oilseed crops such as
soybean, peanut, sesame, etc.
Consumption:
Local producers estimated Vietnam’s 2011 total vegetable oil consumption at 695 TMT (Table 24).
Although no official data is available for vegetable oil consumption per capita, Post projects extremely

strong growth in vegetable oil production, including soybean oil, as consumption demand remain high
and stable in the country for the next 15 years due to the country’s growing economy (GDP increased
6.78 percent in 2010 and 5.89 percent in 2011, with a projection of 6-6.5 percent in 2012) and
marketing campaigns by local oil producers recommending people use healthier vegetable oils instead
of animal fats (Graph 12). Consumer demand has been increasing. Due to higher living standards,
Vietnamese consumers, not only in big cities but also in small towns and rural areas, are slowly shifting
from the traditional choices of animal fats to vegetable and seed oils.
Vietnam’s vegetable oil consumption per capita was estimated to be 7.3-8.3 kg per person in 2011 per
Vietnam’s Industry Policy and Strategy Institute (IPSI). However, this level was far from the World
Health Organization’s recommendation of 13.5 kg per capita per year. Local producers projects
Vietnam’s per capita consumption will increase to 14.5kg per person per year by 2015.
Vegetable oil products from the Vietnam Vegetable Oil Industry Corporation (VOCARIMEX)
companies cover the mass and premium markets. The preferable brand names are Neptune, Mezan and
Simply from the Cai Lan Oils and Fats Company within VOCARIMEX. In 2011, a new vegetable oil
producer, Quang Minh Group and its Vinacommodities Company, supplied about 40 TMT of refined
vegetable oils, with a variety of brand names such as Mr. Bean, Oila, Soon Soon, and Otran, of which
about 20 TMT was consumed locally and 20 TMT was exported overseas to other countries like North
Korea, Singapore, Indonesia, Malaysia and
Hong Kong. The other producer, Bunge Vietnam, supplied about 95 TMT of crude soy oil, of which
30-35 percent was exported to South Korea and ASEAN countries.
Most imported soybean and palm oil is currently for food use; only a small volume of imported oil is
used in the industrial and cosmetic manufacturing sectors. Post expects consumption to increase to 240
TMT for soybean oil and 585 TMT for palm oil in 2012.
Table 24: Vietnam’s domestic vegetable oil consumption
Unit 2005 2006 2007 2008 2009 2010* 2011* 2015*
Total domestic
vegetable oil
consumption 1,000 MT 312 346 557 607 660 690 725 1,200
Per capita
vegetable oil
consumption Kg/person/year 3.75 4.12 6.54 7.04 7.6 7.8 7.9
14.5
Source: GSO; MOIT; IPSI; *Estimates from local producers
Graph 12: Vietnam’s domestic vegetable oil consumption per capita

Source: GSO, MOIT, IPSI; Estimates from local producers
Trade:
Imports of vegetable oils (both crude and refined)
Vietnam’s vegetable oil industry continues to rely on imported crude and refined oil. In 2011, Vietnam
imported an estimated 734 TMT of crude and refined vegetable oils of all types, a 1.7 percent increase
over 2010, to meet the growing demand (Table 25).
In 2011, the United States exports a small volume of various types of vegetable oils and fats to Vietnam
(Table 26). U.S. exports decreased in 2011, likely due to more availability of locally produced soy oil.
Total crude and refined palm oil imports accounted for almost 79 percent of total vegetable oil imports
and increased 8.6 percent in 2011 to 579 TMT (Tables 27 and 28).
Total crude and refined soy oil imports reached 127.5 TMT in 2010, a 31 percent drop from 2010,
accounting for about 17.4 percent of total imports due to an increase of local soy oil production from
new crushing plants. Only a tiny amount of other vegetable oils, including olive oil, sunflower oil,
canola oil, copra oil, peanut oil etc., were imported. Post forecasts that total vegetable oil imports in
2012 will slightly decrease because locally crushed oil will fill the growth in local demand.
Table 25: Total vegetable oil imports
Year 2008 2009 2010 2011
Total vegetable oil imports (TMT) 711.2 631.6 721.5 733.8
Total Crude vegetable oil imports 328.2 313.5 345.1 311.7
Total Refined vegetable oil imports 383 318.1 376.4 422.1
Source: General Customs Department, GTA
Graph 13: Vietnam’s vegetable oil imports
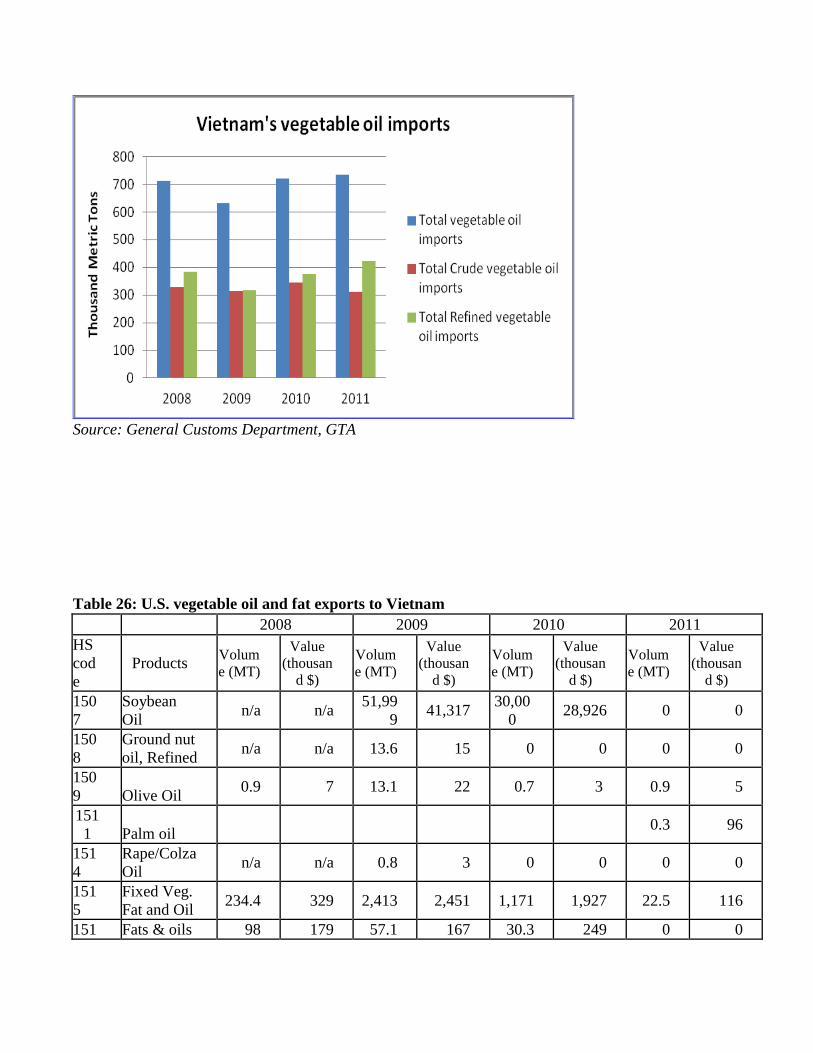
Source: General Customs Department, GTA
Table 26: U.S. vegetable oil and fat exports to Vietnam
2008 2009 2010 2011
HS
cod
e Products
Volum
e (MT)
Value
(thousan
d $)
Volum
e (MT)
Value
(thousan
d $)
Volum
e (MT)
Value
(thousan
d $)
Volum
e (MT)
Value
(thousan
d $)
150
7 Soybean
Oil n/a n/a
51,99
9 41,317
30,00
0 28,926 0 0
150
8 Ground nut
oil, Refined n/a n/a 13.6 15 0 0 0 0
150
9 Olive Oil 0.9 7 13.1 22 0.7 3 0.9 5
151
1 Palm oil 0.3 96
151
4 Rape/Colza
Oil n/a n/a 0.8 3 0 0 0 0
151
5 Fixed Veg.
Fat and Oil 234.4 329 2,413 2,451 1,171 1,927 22.5 116
151 Fats & oils 98 179 57.1 167 30.3 249 0 0

6 Hydrogen
151
7 Margarine 662.5 655 66.4 76 85.5 85 1,091 1,783
151
8
Process
Oil,
Animal/Ve
g.
16.3 31 n/a n/a 5.9 38 0 0
Total
1,012
1,201 54,56
3 44,051
31,29
3 31,228 1,115 2,000
Sources: Department of Commerce, U.S. Census Bureau, Foreign Trade Statistics (BICO report), GTA,
General Customs Office
Imports of crude vegetable oil
Vietnam’s total crude vegetable oil imports in 2011 were an estimated 311.7 TMT, about a 9.7 percent
decrease from the previous year (Table 27). Palm oil from Indonesia, Malaysia, Cambodia, and the
United States accounted for almost 59 percent of total crude vegetable oil imports. Soybean oil from
Argentina, Malaysia, Thailand, Brazil, and South Korea accounted for much of the remaining crude
vegetable oil imports. Only a tiny amount of rapeseed, sunflower, and olive crude oils were imported.
Table 27: Crude vegetable oil imports
Crude vegetable oil (TMT) 2007 2008 2009 2010 2011
Total, of which 274.6 328.2 313.5 345.1 311.7 Crude palm oil 161 199 203 214 184.7
Crude Soybean oil 114 129 106 131 117.9
Other crude vegetable oil 0.6 0.2 4.5 0.1 9.1
Sources: Estimates from traders, General Customs Office, Post Adjusted Statistics
Graph 14: Vietnam’s crude vegetable oil imports

Sources: Estimates from traders, General Customs Office, Post Adjusted Statistics
Imports of refined vegetable oil
Vietnam’s refined vegetable oil imports for 2011 increased by 12 percent over the previous year (Table
28). Palm oil imports from Malaysia, Indonesia, and other countries accounted for about 93 percent of
total refined vegetable oil. Soybean oil and other vegetable oils accounted for 7 percent of total refined
vegetable oil imports in 2011.
Table 28: Refined vegetable oil imports
Refined vegetable oil (TMT) 2007 2008 2009 2010 2011
Total, of which 273.7 383 318.1 376.4 422.1 Refined palm oil 272 305 299 319 394.4
Refined Soybean oil 1.6 78 16 55 9.6
Other refined vegetable oil 0.14 0.1 3.1 2.4 18.1
Source: Estimates from traders, General Customs Office, Post Adjusted Statistics
Graph 15: Vietnam’s refined vegetable oil imports

Source: Estimates from traders, General Customs Office, Post Adjusted Statistics
Import Tariff
The most updated tax rates that apply to crude and refined vegetable oils imported from countries
having Most Favored Nation (MFN) status with Vietnam are shown in the table below:
Table 29: Import tariffs for vegetable oils
Crude
Oil Refined
oil
Import duty Soybean oil (HS code 1507) 5% 15%
Peanut oil (HS code 1508) 5% 25%
Olive oil (HS code 1509) 5% 22%
Palm oil (HS code 1511) 5% 25%
Sunflower oil (HS code 1512) 5% 15%
Cottonseed oil (HS code 1512.21 and 1512.29) 5% 25%
Copra oil (HS code 1513) 5% 25%
Rapeseed oil (HS code 1514.11 and 1514.19) 5% 5%
Rapeseed oil (HS code 1514.91) 5% n/a
Rapeseed oil (HS code 1514.99) 5% 22%
Other vegetable oil (HS code 1515.11and 1515.19 ) 5% 10%
Corn seed oil (HS code 1515.21) 5% n/a
Jojoba oil (HS code 1515.30) 5% 10%
Sesame oil (HS code 1515.50) 5% 25%
Tengkawang oil (HS code 1515.90) 5% 25%
Other animal or vegetable oils (HS code 1516.10) 23% 23%
Vegetable fats and oils and their fractions (of soybean) (HS code 1516.20.11)
22% 22%
Vegetable fats and oils and their fractions (of other oilseeds) (HS code
1516.20) 25% 25%
Source: Ministry of Finance

Tariff rates for AIFTA, AANZ FTA, VJEPA, AJCEP, ACFTA, AKFTA, and CEPT are listed in Appendix 1 of the oilseeds report from 2011.
Exports
Currently, there is no available official export data for vegetable oils. In previous years, VOCARIMEX
companies were the main exporters of vegetables oils in Vietnam. In 2011, new producers also began
exporting vegetable oil products overseas (See: Commodity, Oil/Consumption). Local producers
estimated all type vegetable oil export volume at about 55 TMT in 2011.
According to the available trade data from the Global Trade Atlas, Vietnam exported over 35 TMT of
all type vegetable oils with the value of over $45 million (Table 30).
Table 30: Vietnam’s all type vegetable oil* and fat exports by countries
Importing
Countries
2009 2010 2011
$
Thousand Quantity
MT $
Thousand Quantity
MT $
Thousand Quantity
MT
South Korea
144 244 217 392 27,414 21,945
Japan
13,057 13,122 15,984 16,427 10,367 7,123
Malaysia
9 20 209 20,117 4,169 3,133
Thailand
1 - 67 27 1,272 983
China
23 48 164 211 1,006 921
Indonesia
57 80 226 355 749 837
Philippines
27 144 - - 115 336
Hong Kong - - - - 21 19
Other countries 9 20 209 20,117 4,148 3,114
Total Volume $
13,318 13,658 $ 16,867 37,529 $ 45,113 35,297 Source: Global Trade Atlas
*Note: Vegetable oil includes all oil products with HS code 1507, 1508, 1511, 1513, 1514, 1515, 1516,
1517, and 1518
According to MOIT’s Development Plan for Vietnam’s Vegetable Oil Industry up to 2020, and Vision
to 2025, Vietnam hopes to export 50 TMT, 80 TMT and 100 TMT oil of all types in the in the periods
of 2011-2015, 2016-2020 and 2021-2025, respectively.
Table 31: Vietnam’s vegetable oil and fat exports by value

2005 2007 2008 2009 2010 2011
Total vegetable oil exports (Million $) 13.7 49.3 99.6
77.4 n/a n/a
Source: GSO
Table 32: Vietnam’s soybean oil exports by countries
Importing
Countries
2009 2010 2011
$
Thousand Quantity
MT $
Thousand Quantity
MT $
Thousand Quantity
MT
South Korea 122 212 14 10* 27,232 21,471*
Malaysia 0 0 0 0 4,074 3,099*
Australia 264 0 153 0 231 0
Philippines 13 18 0 0 85 61
Hong Kong 0 0 0 0 21 19
Japan 0 0 0 0 9 5
Total Volume 399 230 167 10 31,652 24,655
Source: GTA. Note: *Crude soybean oil – HS code 1507.10
Production, Supply and Demand Data Statistics:
Table 33: Vietnam’s Production, Supply & Demand Table for Soybean Oil Oil, Soybean Vietnam 2010/2011 2011/2012 2012/2013
1000 MT, PERCENT
Market Year Begin: Jan
2011 Market Year Begin: Jan
2012 Market Year Begin: Jan
2013 USDA
Official New
Post USDA
Official New
Post USDA
Official New
Post Crush
550 620 1,100 1,150 1,350
Extr. Rate, 999.9999 0 0 0 0 0 Beginning Stocks 10 10 29 36 65 Production 100 124 200 230 270 MY Imports 100 128 80 60 50 MY Imp. from U.S. 0 0 0 0 0 MY Imp. from EU 0 0 0 0 0 Total Supply 210 262 309 326 385 MY Exports 0 25 0 35 45 MY Exp. to EU 0 0 0 0 0 Industrial Dom. Cons. 1 1 1 1 1 Food Use Dom. Cons. 180 200 225 225 260 Feed Waste Dom. Cons. 0 0 0 0 0 Total Dom. Cons. 181 201 226 226 261 Ending Stocks 29 36 83 65 79 Total Distribution 210 262 309 326 385
Source: General Customs Office, Global Trade Atlas (GTA), Local Producers, Post adjusted data

Table 34: Vietnam’s Crude Soy Oil Import Trade Matrix
Country Vietnam
Commodity Crude Soy oil
Time Period Jan-Dec Units: MT
Imports for: 2010 2011 U.S. 30,000 U.S.
Others Others Argentina 58,989 Argentina 75,440
Thailand 21,292 Malaysia 19,976
Malaysia 13,921 Thailand 19,499
China 5,882
Total for Others 100,084 114,915
Others not Listed 1,006 3,003
Grand Total 131,090 117,918
Source: General Customs Office, Global Trade Atlas, Post adjusted data
Table 35: Vietnam’s Refined Soy Oil Import Trade Matrix
Country Vietnam
Commodity Refined Soy oil
Time Period Jan-Dec Units: MT
Imports for: 2010 2011
U.S. 1 U.S. 1.7
Others Others Singapore 38,044 Malaysia 7,706
Malaysia 16,612 Thailand 1,470
Thailand 215 Singapore 297
Canada 50 South Korea 45
Taiwan 23 Taiwan 35
Canada 25
Total for Others 54,944 9,577.8
Others not Listed 11 3.5
Grand Total 54,956 9,582.9
Source: General Customs Office, Global Trade Atlas, Post adjusted data
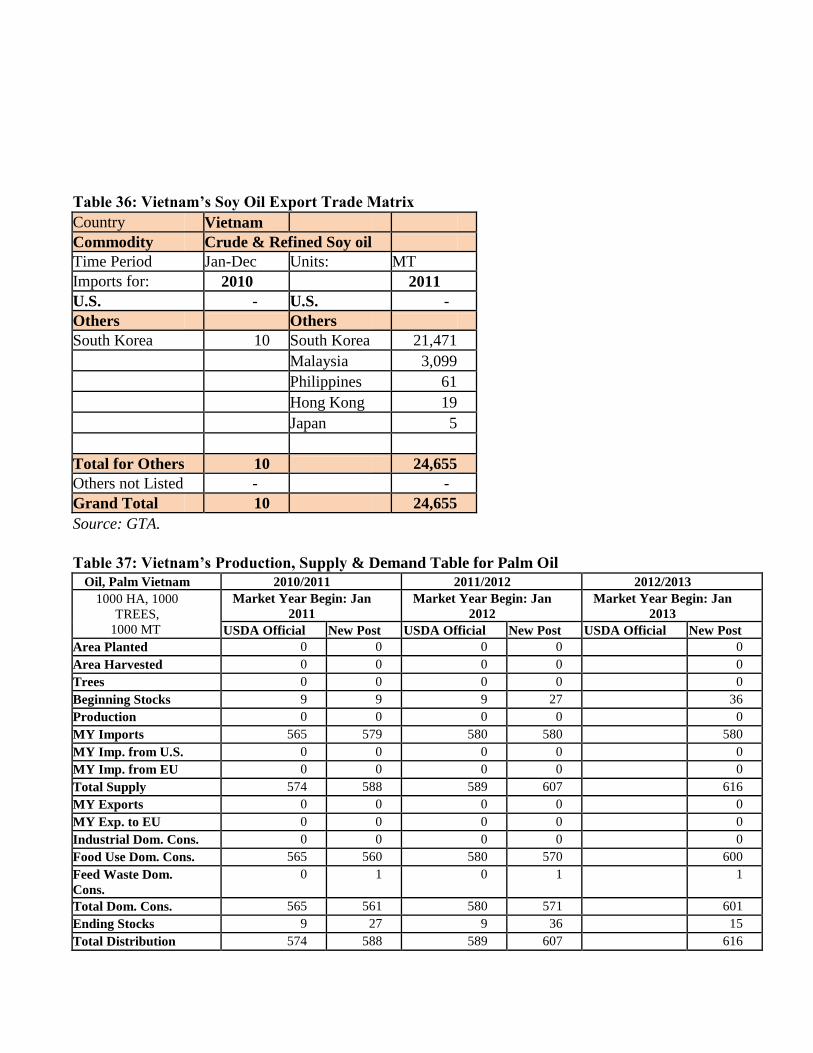
Table 36: Vietnam’s Soy Oil Export Trade Matrix
Country Vietnam
Commodity Crude & Refined Soy oil
Time Period Jan-Dec Units: MT
Imports for: 2010 2011
U.S. - U.S. -
Others Others
South Korea 10 South Korea 21,471
Malaysia 3,099
Philippines 61
Hong Kong 19
Japan 5
Total for Others 10 24,655
Others not Listed - -
Grand Total 10 24,655
Source: GTA.
Table 37: Vietnam’s Production, Supply & Demand Table for Palm Oil
Oil, Palm Vietnam 2010/2011 2011/2012 2012/2013 1000 HA, 1000
TREES, 1000 MT
Market Year Begin: Jan
2011 Market Year Begin: Jan
2012 Market Year Begin: Jan
2013 USDA Official New Post USDA Official New Post USDA Official New Post
Area Planted 0 0 0 0 0 Area Harvested 0 0 0 0 0 Trees 0 0 0 0 0 Beginning Stocks 9 9 9 27 36 Production 0 0 0 0 0 MY Imports 565 579 580 580 580 MY Imp. from U.S. 0 0 0 0 0 MY Imp. from EU 0 0 0 0 0 Total Supply 574 588 589 607 616 MY Exports 0 0 0 0 0 MY Exp. to EU 0 0 0 0 0 Industrial Dom. Cons. 0 0 0 0 0 Food Use Dom. Cons. 565 560 580 570 600 Feed Waste Dom.
Cons. 0 1 0 1 1
Total Dom. Cons. 565 561 580 571 601 Ending Stocks 9 27 9 36 15 Total Distribution 574 588 589 607 616
Source: Estimates from producers, General Customs Office, Global Trade Atlas,
Post adjusted data
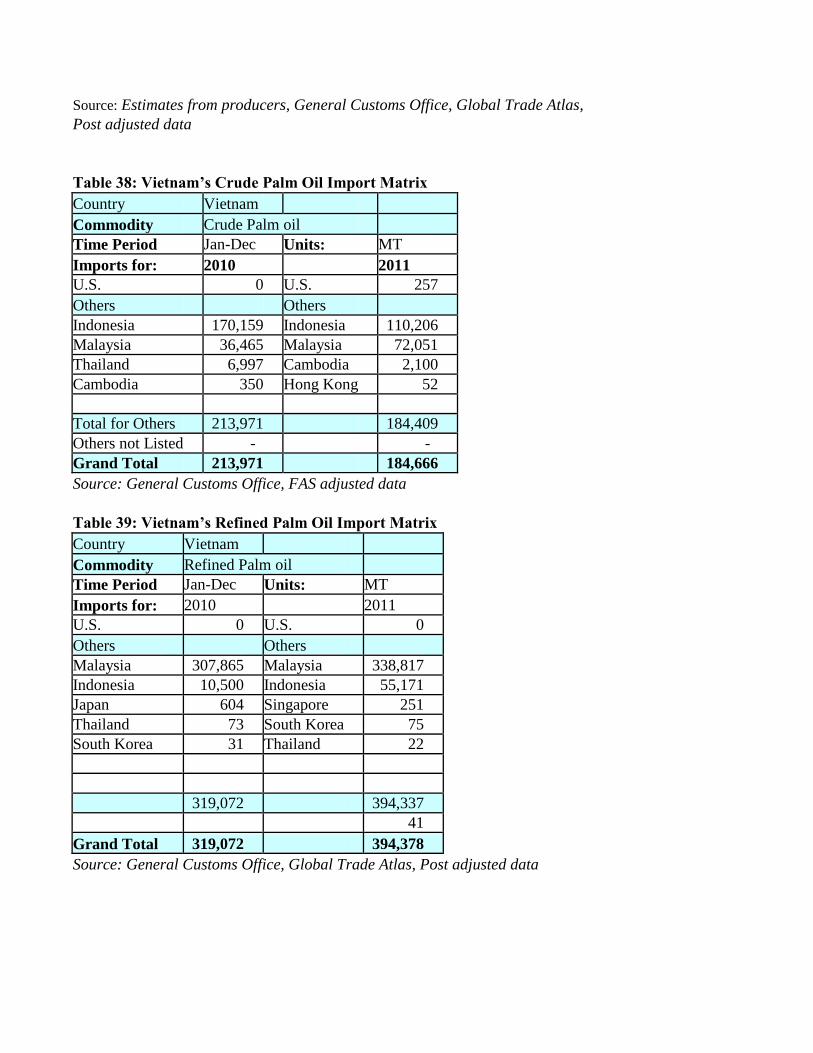
Table 38: Vietnam’s Crude Palm Oil Import Matrix
Country Vietnam
Commodity Crude Palm oil
Time Period Jan-Dec Units: MT
Imports for: 2010 2011 U.S. 0 U.S. 257
Others Others Indonesia 170,159 Indonesia 110,206
Malaysia 36,465 Malaysia 72,051
Thailand 6,997 Cambodia 2,100
Cambodia 350 Hong Kong 52
Total for Others 213,971 184,409
Others not Listed - -
Grand Total 213,971 184,666
Source: General Customs Office, FAS adjusted data
Table 39: Vietnam’s Refined Palm Oil Import Matrix
Country Vietnam
Commodity Refined Palm oil
Time Period Jan-Dec Units: MT
Imports for: 2010 2011
U.S. 0 U.S. 0
Others Others Malaysia 307,865 Malaysia 338,817
Indonesia 10,500 Indonesia 55,171
Japan 604 Singapore 251
Thailand 73 South Korea 75
South Korea 31 Thailand 22
319,072 394,337
41
Grand Total 319,072 394,378
Source: General Customs Office, Global Trade Atlas, Post adjusted data
