vietnam gov spending poverty
DESCRIPTION
fhfTRANSCRIPT

GOVERNMENT SPENDING AND POVERTY REDUCTION INVIETNAM
Shenggen Fan
Pham Lan Huong
Trinh Quang Long
(draft)
December 2003
Project report prepared for the World Bank funded project “Pro-poor spending inVietnam”, by International Food Policy Research Institute, Washington DC, and CentralInstitute for Economic Management, Hanoi. Shenggen Fan is a senior research fellow atthe International Food Policy Research Institute, Washington DC, Pham Lan Huong andTrinh Quang Long are researchers at the Central Institute for Economic Management,Hanoi.

2
Table of ContentI. Introduction ................................................................................................................... 4
II. Growth and Poverty Reduction.................................................................................. 5Economic Reforms and Economic Growth .................................................................... 5
Macroeconomic Stabilisation ..................................................................................... 7
Private Sector Development ....................................................................................... 7
SOE Reform ................................................................................................................ 7
Agricultural Sector Reform......................................................................................... 8
Trade and Investment Reform ..................................................................................... 8
Banking Sector Reform ............................................................................................... 8
Poverty and Inequality .................................................................................................... 9
III. Government Expenditure ........................................................................................ 10Trends and Levels ......................................................................................................... 10
Fiscal Decentralisation.................................................................................................. 11
IV. Agricultural R&D, Physical and Human Capital Development .......................... 11Agricultural Research and Development (R&D).......................................................... 11
Irrigation ....................................................................................................................... 12
Roads............................................................................................................................. 13
Electricity...................................................................................................................... 14
Telecommunication....................................................................................................... 14
Education ...................................................................................................................... 15
V. Effect of Government Spending: Econometric Model............................................ 16
VI. Data, Model Estimation and Results ...................................................................... 20
Data ............................................................................................................................... 20
Empirical Results .......................................................................................................... 21
Estimates of the Equations System............................................................................ 21
Marginal Returns to Government Spending ............................................................. 22
VII. Conclusions.............................................................................................................. 23
Major Findings.............................................................................................................. 23
Priorities for Future Government Investment ............................................................... 23
Limitations and Future Research Directions................................................................. 24

3
Tables ............................................................................................................................... 25Table 1: Poverty Incidence, 1993-2002........................................................................ 25
Table 2: Real Annual per Capita Expenditure and Annual Growth, 1993-2002 .......... 26
Table 3: Contribution of the Regions to Total Poverty, 1993-2002 (%) ...................... 27
Table 4: Poverty by Main Sectoral Occupation for People from 15 Years Old or HigherWho Have Job during the Past 12 Months (%)............................................................. 28
Table 5: Government Budget Spending on Major Infrastructure Sectors for the Period1993-2000 ..................................................................................................................... 29
Table 6: Government Budget Shares by Infrastructure Sector for the Period 1993-2000....................................................................................................................................... 30
Table 7: Estimates of the Equation System .................................................................. 31
Table 8: Investment Equations..................................................................................... 32
Table 9: Returns in Agricultural Production................................................................ 33
Table 10: Returns in Poverty Reduction...................................................................... 34
Figures.............................................................................................................................. 35Figure 1: Vietnam’s Economic Growth and Inflation, 1976-2000............................... 35
Figure 2: Government Spending on Some Types of Infrastructure and Basic Services36
Figure 3: Per Capita GDP, Budget Revenue and Budget Expenditure by Region ....... 37
Figure 4: Effect of Agricultural R&D on Poverty ........................................................ 38
Figure 5: Effect of Irrigation Investment on Poverty.................................................... 39
Figure 6: Effect of Road Investment on Poverty .......................................................... 40
Figure 7: Effect of Education Investment on Poverty .................................................. 41
Figure 8: Effect of Power Investment on Poverty ........................................................ 42
Figure 9: Effect of Telecommunication Investment on Poverty................................... 43
Bibliography .................................................................................................................... 44

4
I. IntroductionVietnam has made a remarkable achievement in lifting its large number of poor
out of poverty. The number of people living below the poverty line fell from 58% in1993 to 29% in 2002. Reforms implemented in the late 1980s and early 1990s,particularly those which decentralised the responsibility for agricultural production toindividual farmers, led to a dramatic increase in agricultural production. There was a 60%increase in farm income between 1993 and 1998 as well as improvements in income andemployment in the service sector.
In addition to these reform programs, improvement in technology, infrastructureand education has also contributed to this rapid growth. Without these improvements,such rapid economic growth and large-scale reduction in poverty would not have beenpossible. Thus, government investment and spending have been crucial to growth andpoverty reduction in Vietnam.
It is important to evaluate the relative contribution of government expendituresfor two reasons. First, gains in poverty reduction in the past are fragile. Many of thosewho escaped poverty in recent years remain vulnerable to household- and community-level shocks. Moreover, an increasing number of poor people are concentrated inunfriendly environments such as mountainous areas, and belong to certain populationgroup such as minorities. Consequently, it has become increasingly hard to achievefurther reduction in poverty.
Second, it is likely that public spending may decline as a part of macro-economicreforms. Therefore the government is required to do more with less. Information on therelative contributions of various types of public spending will help the Vietnamesegovernment to better target its resources in order to achieve more efficiently the twingoals of economic growth and poverty reduction.
The objective of this study is to analyse the impact of various types ofgovernment spending on growth and poverty reduction, using provincial level data overthe last decade. Government spending reduces poverty through many channels such asagricultural growth and improved non-farm employment. We will try to capture all thesedifferent effects if the data allow. This paper opens with a review of Vietnam’s economicreforms and growth over the past decade. We then sketch Vietnam’s poverty profile,highlighting changes over time, regional distribution, and differences among populationgroups. In the next two sections, we will review the trend and composition of governmentspending, agricultural R&D and infrastructure endowments in Vietnam over the lastdecade. Section 5 presents the analytical framework used to estimate the effect of varioustypes of government spending on growth and poverty reduction. The results are presentedin Section 6. We conclude the paper by offering future priorities for governmentinvestments.
5
II. Growth and Poverty Reduction
Economic Reforms and Economic Growth1
Since the country’s reunification in 1975, the development of Vietnam’s economycan be divided into three periods:
The period prior to the 1980s when Vietnam was a centrally planned economy.
The period between 1980 and 1988, when the economy can be regarded as amodified planned economy. Some microeconomic reforms were undertakenwithout any significant changes in macroeconomic management; and
The period since 1989 when the economy has been in transition, striving forindustrialisation and international integration.
Prior to the 1980s, Vietnam was a typical centrally planned economy with: (i)state or collective ownership of production means; (ii) government administered supplyof physical input and output; (iii) lack of business autonomy, absence of factor markets,highly regulated goods and services markets; (iv) a bias toward heavy industry ininvestments; and (v) a single government bank and a passive financial system with noeffective policies to mobilise domestic savings resulting in household reluctance to save.2Moreover, Vietnam was overwhelmingly dependent on external sources for investmentand was relatively autarkic, trading mostly within the former block of socialist countrieswithin the Council of Mutual Economic Assistance (CMEA). As a result, the economywas heavily distorted in resource allocation with poor incentives and restrictedinformation flows. Lack of incentives for competition among enterprises implied anabsence of pressure to raise productivity, a major source of economic growth.
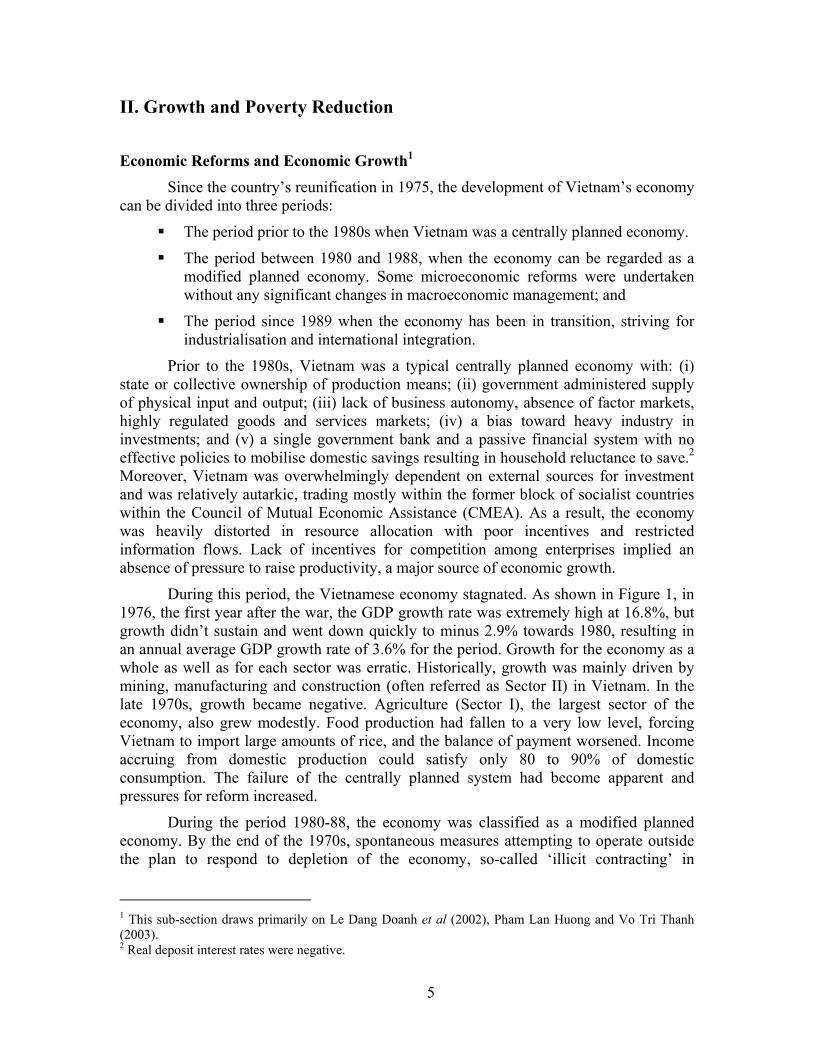
During this period, the Vietnamese economy stagnated. As shown in Figure 1, in1976, the first year after the war, the GDP growth rate was extremely high at 16.8%, butgrowth didn’t sustain and went down quickly to minus 2.9% towards 1980, resulting inan annual average GDP growth rate of 3.6% for the period. Growth for the economy as awhole as well as for each sector was erratic. Historically, growth was mainly driven bymining, manufacturing and construction (often referred as Sector II) in Vietnam. In thelate 1970s, growth became negative. Agriculture (Sector I), the largest sector of theeconomy, also grew modestly. Food production had fallen to a very low level, forcingVietnam to import large amounts of rice, and the balance of payment worsened. Incomeaccruing from domestic production could satisfy only 80 to 90% of domesticconsumption. The failure of the centrally planned system had become apparent andpressures for reform increased.
During the period 1980-88, the economy was classified as a modified plannedeconomy. By the end of the 1970s, spontaneous measures attempting to operate outsidethe plan to respond to depletion of the economy, so-called ‘illicit contracting’ in
1 This sub-section draws primarily on Le Dang Doanh et al (2002), Pham Lan Huong and Vo Tri Thanh(2003).2 Real deposit interest rates were negative.

6
agriculture and ‘fence breaking’ in manufacturing sector took place and wereinstitutionalised in the 6th Central Plenum of CPV in 1979. Some microeconomic reformswere introduced in 1981 to recognise and legalise these operations, so they can be seen as‘bottom-up’ reforms. The reforms included the ‘Three-Plan System’ for state-ownedenterprises (SOEs) and the ‘Contract System’ for the agricultural sector. These micro-reforms made a breakthrough in Vietnam’s economic policy, which created newincentives for producers in raising outputs during the period 1982-85. The economybecame more dynamic and as a result, Vietnam enjoyed a high rate of economic growthin the first half of the 1980s. Moreover, for the first time, Vietnam was food sufficient in1985, although at a low level.
However, growth was not sustainable and headed to a decline as the effects of themicroeconomic reforms became exhausted. The financial reform implemented in 1985 inan attempt to reverse the situation also failed as it was introduced without addressing thefundamental problems of resource misallocation and macroeconomic imbalances in theeconomy. Consequently, output expansion dropped and the rates of inflation acceleratedto several hundred percent per year with a peak of 774.7% in 1986. The real income ofthe majority of government employees fell sharply. Poor weather and poor incentives ledto a miserable agricultural harvest in 1987, with grain production down by nearly onemillion tons from the 1986 level. Regional food shortages caused real hardship in someareas. In the North, supply did not meet the demand, leading to a starvation in 21provinces and cities in the early 1988, affecting 9.3 million people, representing 39.7% offarm households, of which 3.6 million people were subject to serious starvation (NguyenVan Bich and Chu Tien Quang 1996).
The Sixth Party Congress in December 1986 was a turning point in Vietnam’seconomic policies. It recognised the existence and the essential role of a multi-ownershipstructure in Vietnam’s economy. It also emphasised the importance of expandingopportunities and choices for people in order to promote economic development andimprove standards of living. However, significant changes in this direction occurred onlysometimes after the approval of the Doimoi (Renovation) program by the Congress. InMarch of 1989, Vietnam adopted a radical and comprehensive reform package aimed atstabilising and opening the economy, and enhancing freedom of choice for economicunits and competition so as to change fundamentally the economic management systemin Vietnam.
Thus, economic reforms in Vietnam has been gradual except the economic reformpackage of 1989, which was considered most successful since the basic conditions werecreated for the transformation into a market-oriented economy. Since then the transitionhas been well under way. The government has adopted a range of further reforms inpricing policy, fiscal policy, the SOE sector, the external sector, the private sector, thefinancial sector and the labour market, all of which have been necessary for the transition.
During the 1990s the economic reforms have turned Vietnam into one of thefastest growing economies in the world, with an average GDP growth rate of 7.2% perannum. Inflation was kept under control at a low single-digit level. Between 1991 and2000, Vietnam’s GDP doubled. Agriculture grew at slightly over 5.6%, while industrialvalue-added increased rapidly at an average rate of 11.2% per year, albeit from a verylow base. The service sector expanded at 7% each year. High agricultural growth during

7
the 1990s has turned Vietnam from a rice-importing country into the second largest riceexporter in the world. Vietnamese agricultural competitiveness has been improved to theextent that it has become a major exporter of some agricultural products such as cashewnut, coffee, and pepper, in addition to rice. Vietnam has boosted its exports from US$854.2 million in 1987 to US$ 11,540.0 million in 1999.
We present below the key reforms undertaken since 1989.
Macroeconomic Stabilisation
Stabilisation of the economy has been achieved through several measures. Theseincluded controlling growth in credit and government expenditures. Money printing tofinance the budget deficits was replaced by issuing bonds and borrowing abroad. Interestrates were increased to positive levels in real terms. The government subsidies to SOEswere reduced and household consumption subsidies were eliminated. Militarydemobilisation and cutback in public investment also helped reduce governmentspending. Tight monetary and fiscal policy brought inflation down to a manageable level,from 775% in 1986 to 5% in 1993.
Macroeconomic stabilisation was successful in conjunction with priceliberalisation. Artificially low price setting by the government for most goods andservices were abolished, which created incentives for manufacturers and farmers toproduce, and at the same time relieved the fiscal burden. Other factors that contributed tooverall price stabilisation included a large devaluation and unification of the multipleexchange rates.
Private Sector Development
The Vietnamese government has taken several measures to increase the privatesector participation in production and distribution. These include recognition andencouragement of the private sector and creation of a legal framework for the operationof private businesses including FDI (Foreign Direct Investment). A legal framework forthe corporate sector has gradually been created through promulgation and amendment ofbusiness-related laws and regulations. Rapid growth in services and construction duringthe 1990s mainly came from a quick response of the private entrepreneurs. Nearly 2million newly established household businesses in urban areas helped to enhance theperformance of the economy and improve considerably the retail sales and servicenetwork. Some 23 thousand private enterprises, limited liability and joint-stockcompanies were registered under the Law on Private Enterprises and Company Law.
SOE Reform
In an attempt to make the operation of SOEs viable, the government hassubstantially reduced subsidies, diminished concessional credit to these enterprises andgiven them greater autonomy. Furthermore, inefficient and money-losing enterpriseshave been liquidated. From 1990 to 1994, the number of SOEs fell from 12 thousand to6.3 thousand, and 1.5 million SOE workers (out of the 4.05 million total SOE employees)

8
retired or were converted to part-time workers (Fahey 1995). SOEs relinquished habits ofrelying on the state subsidies and bailing out. Many of them acquired business autonomy,and reorganised production and management to adapt themselves to markets. Othersestablished joint ventures with foreign partners from which they acquired newtechnologies, technical and managerial skills, and export markets. These reforms led tosome positive improvements in the growth performance of the SOE sector in the first halfof the 1990s. Further reforms took place in the early 2000 through asset sales and leasingout of the SOE sector to reduce the role of the government.
Agricultural Sector Reform
Under the new agricultural policy, the farming household as basic economic unitin the rural economy has been formally recognised and the long-term land use rights hasbeen granted. Reform also entitled farmers to purchase, sell, and transfer factors ofproduction in the market, which were previously banned. They were also allowed to selltheir output surplus after fulfilling their obligations to the government. All thesemeasures created strong incentives for 10 million farming households to make long-terminvestment and expand agricultural production. The reform of the agricultural sector wasessential to poverty reduction as it is the largest sector of the economy and providesincome to some three quarters of the population.
Trade and Investment Reform
Vietnam has substantially liberalised its trade and investment policies since thelate 1980s. In an attempt to integrate its economy with the rest of the world, Vietnam hasentered into trade agreements with about 60 countries and has trade relations with some150 countries. It has implemented preferential trade agreement with the European Unionsince 1992.In addition, Vietnam has been a member of the Association of South EastAsian Nations since June 1995 and the Asia Pacific Economic Co-operation since 1998.Furthermore, it has signed an US-Vietnam bilateral trade agreement in 2000 and has beennegotiating for a WTO membership.
Liberalisation of investment climate has resulted in rapid growth in foreigninvestment between 1993 and 1997. The country has received foreign investment fromsome 60 countries. The Law on FDI promulgated in 1987 and subsequent amendmentsenabled Vietnam to attract a large volume of capital (about 8% of GDP) to renewtechnology and expand the markets. FDI has indeed become an important factor inVietnam’s economic growth during the 1990s (Le Dang Doanh 1999).
Banking Sector Reform
To facilitate the development of trade and the investment sector, the governmenthas also introduced reforms in the banking sector. In 1988, the mono-banking system wasreplaced by a two-tier system where functions of a central bank and commercial bankswere separated. However, the two-tier system could function only in 1990, when the lawson banking authorised the State Bank of Vietnam to assume traditional central bank

9
functions such as the conduct of monetary policy and the supervision of the financialsystem. Also, sectoral restrictions on the specialised banking activities and the entrybarriers were abolished. At present, in addition to the six state-owned commercial banks,a number of joint-stock banks, credit co-operatives/funds, joint-venture banks and foreignbanks are in operation in the country.
Poverty and InequalityVietnam has made substantial and steady progress in poverty reduction over the
past decade (see Table 1). Rural and urban poverty declined sharply during the 1990s,regardless of the poverty line used.3 The proportion of the population living below thepoverty line declined from over 70% at the end of 1980s to 58% in 1993, 37% in 1998,and 29% in 2002. The proportion of the food-poor fell from 25% in 1993 to 15% in 1998and 11% in 2002.4 The depth of poverty also declined for all population groups.
Available studies and statistics suggest that the decline in poverty in Vietnamreflects rising household expenditures and GDP per capita due to an increase in realincome during the 1990s. Table 2 clearly shows that income, and consequently,expenditure levels have been improved significantly over the 1990s. The real annual percapita expenditure was 1,936 thousand Vietnamese dong (VND) (equivalent to US$ 130)in 1992-93, VND 2,764 in 1997-98, and VND 3,229 in 2002. The annual averagehousehold per capita expenditure rose by 7.4% between 1993 and 1998, and by 4.0%between 1998 and 2002. These figures indicate a considerable improvement in livingstandards over the 1990s.
However, Vietnam still faces great challenges in poverty reduction in the future:
The poor is increasingly concentrated in rural areas. More than third of therural population was still under the poverty line in 2002, and rural pooraccounts for more than 90% of the total poor. Rural poverty was also deeperand more severe.
Ethnic disparity is very striking in Vietnam’s poverty profile. Ethnic minoritieshad substantially higher poverty rates and witnessed much smaller reductionsover the 1990s (only 17.1 percentage points for ethnic minorities versus 30.8for Kinh and Chinese). The poverty incidence within ethnic minority peoplewas the highest across all social groups. In 2002, ethnic minority people werestill as poor as the whole nation in the early 1990s. The regional povertyincidence suggests that the poorest ethnic minorities reside in the CentralHighlands. Poverty among ethnic minorities was also the most severe. Whileeconomic gains were widespread, they barely reached the remote areas wherethe ethnic minorities are concentrated, and consequently ethnic people arebeginning to lag behind.
3 The poverty line mentioned in this paper is calculated as expenditures required, given Vietnamese foodconsumption patterns, to deliver 2100 calories per person per day and a minimum quantum of non-foodexpenditure. The poverty line in 2002 is VND 1.916 million (US$ 124) per person per year.4 Sources: Poverty Working Group (1999), and data provided by GSO based on Vietnam Household LivingStandards Survey (VHLSS) 2001-02.

10
The gain in poverty reduction is characterised by large regional variations.While the incidence of poverty fell by 20.3 percentage points in the NorthernUplands (from 64.2 to 43.9%), it decreased by only 0.6 percentage points in theCentral Highlands (from 52.4 to 51.8%) (Table 3). Poverty declined the most inthe Southeast region. The proportion of the population living under the povertyline now varies from 10.6% in the South East to 58.1% in the CentralHighlands.
The above discussion suggests that despite the rapid decline in the number of thepoor during the past decade, the dramatic gains in poverty reduction in Vietnam duringthe past decade remain quite fragile. Progress in poverty reduction has also slowed downin the late 1990s. Moreover, poverty remains widespread, especially in mountainous andisolated areas, and among ethnic minorities. To maintain the past success in povertyreduction, the Vietnamese government should adopt poverty reduction policies specific toVietnam’s diverse regions and to targeted groups. In this regard, public spending policycan play an important role.
III. Government ExpenditureTrends and Levels
Figure 2 reveals that between 1993 and 2000, total budget expenditure on basicphysical and social infrastructure (education, healthcare, road, electricity, irrigation,water supply and telecommunication) has been rising in real terms. There was a sharpreduction in the government budget share for these sectors in 1994, but it was graduallyrecovered between 1995 and 1998. Over the last decade, the government has shifted itsspending priorities towards the sectors providing public goods and dedicated to thedevelopment of human capital.
The most favoured sectors in terms of public spending during the 1993-2000period were those that appeared to have large impact on poverty reduction (Tables 5 and6). They received the highest share of the government budget and also enjoyed higherrates of growth than the overall government budget. These sectors were: education, whichshared 13.78% of the annual budget and grew at 13.7% per annum; roads accounting for9.3% of the annual budget and growing at 13.8%; and health care with 6.22% of theannual budget and an annual growth rate of 7.47% between 1993 and 2000.
Most of these sectors had been enjoying increasing shares of the governmentbudget until the late 1990s when economic growth slowed down after the Asian financialcrisis. Consequently, government expenditures on electricity power andtelecommunication declined, with the levels of government expenditure in these twosectors in 2000 being substantially lower than those in 1993. Among the seven sectors,electricity accounted for the largest share of government spending in 1993, but bothgrowth and share of this sector has been plummeting thereafter. Government spending ontelecommunication declined sharply after 1996. Among other things, a possibleexplanation for the decline in public spending on electricity and telecommunication isthat they provide private goods rather than public ones, and the private sector has gearedits investments in these two sectors.

11
There is considerable evidence that the government public expenditure policyplays an important redistributive role in favour of the poor. The policy includesgovernment budget spending for the National Program for Hunger Eradication andPoverty Reduction and associated programs; the Program for Especially DisadvantagedCommunes in Mountainous and Remote areas, targeting of spending on education andhealth, cash transfers from richer to poorer provinces through the central governmentbudget; and pro-poor bias in the Public Investment Program 2001-05.
Fiscal DecentralisationFiscal decentralisation from the national to sub-national governments has been
underway since 1992, and has been institutionalised through the implementation of the1996 Budget Law and its amendments. The decentralisation of expenditures showed asteady increase at the sub-national level from 26% of total expenditures in 1992 to 43%in 1998.5
The decentralisation process combined with the provincial revenue redistributionby the national government allows poorer provinces supporting a higher level of basicservice delivery. As illustrated in Figure 3, although richer regions (the South East andRed River Delta) were able to collect much higher levels of revenues per capita (up toabove 25 times of the poorest region - the North West), per capita expenditure tended tobe lined up, with some favour towards poorer regions such as the North West and NorthEast. A similar trend of equalising per capita budget expenditure also has been observedover time. Nevertheless, the size of the net transfers is not strongly related to the depthand incidence of poverty in the provinces. The spending in two other poor regions ofVietnam (the North Central and Central Highlands) is rather low. The net transferstogether with the retained revenue may not be sufficient to fully cover the basic servicesfor the poor due to the geographic disadvantages of the region.
IV. Agricultural R&D, Physical and Human Capital DevelopmentAgricultural Research and Development (R&D)
Despite the government’s efforts to increase public investment in agriculturalresearch and development (R&D) during the past decade, this type of expenditureaccounted for only 1.7% of total public agricultural expenditure, which was much lowerthan that of Thailand and China (10% and 6% respectively; Fan and Pardey 1998).Between 1992 and 2002, the growth rate of public expenditure on agricultural R&D was4.83% per annum in real terms. In contrast to the reduction in recurrent expenditure(minus 8.34% per annum), the capital investment experienced a high growth rate of13.48% per annum, which to a larger extent was caused by the soaring expenditure onconstruction works (with an average growth at 23.74% per annum). The share of capitalinvestment in total agricultural R&D expenditure increased from 37.93% in 1992 to83.79% in 2002.
5 Source: Joint Government and Donor Working Group (2000).
12
However, the increasing share of capital investment led to reduction of publicexpenditure for research activities. According to a report by the joint Government andDonor Working Group (2000), only VND 10.5 million was spent on salary and recurrentexpenditure for each of the 4,773 research staff working for the 30 agricultural researchinstitutions in 1999. As a result, domestic research institutions can currently meet only10% of farmers' demand for high-yield crop varieties and livestock breeds, resulting in aheavy reliance on imports (Vietnam News Agency, quoted in Asia Online Times).
In the coming years, as highlighted in the Public Investment Program 2001-05,agricultural research should focus on creating and disseminating new varieties with highyield and value (Socialist Republic of Vietnam (SRV) 2003). In addition, newtechnologies such as biotechnology, post-harvesting and processing technologies, will bedeveloped in order to raise the value added of agricultural products. To achieve theseobjectives, it is required to undertake institutional and budgetary reform measures withinthe existing agricultural research system.
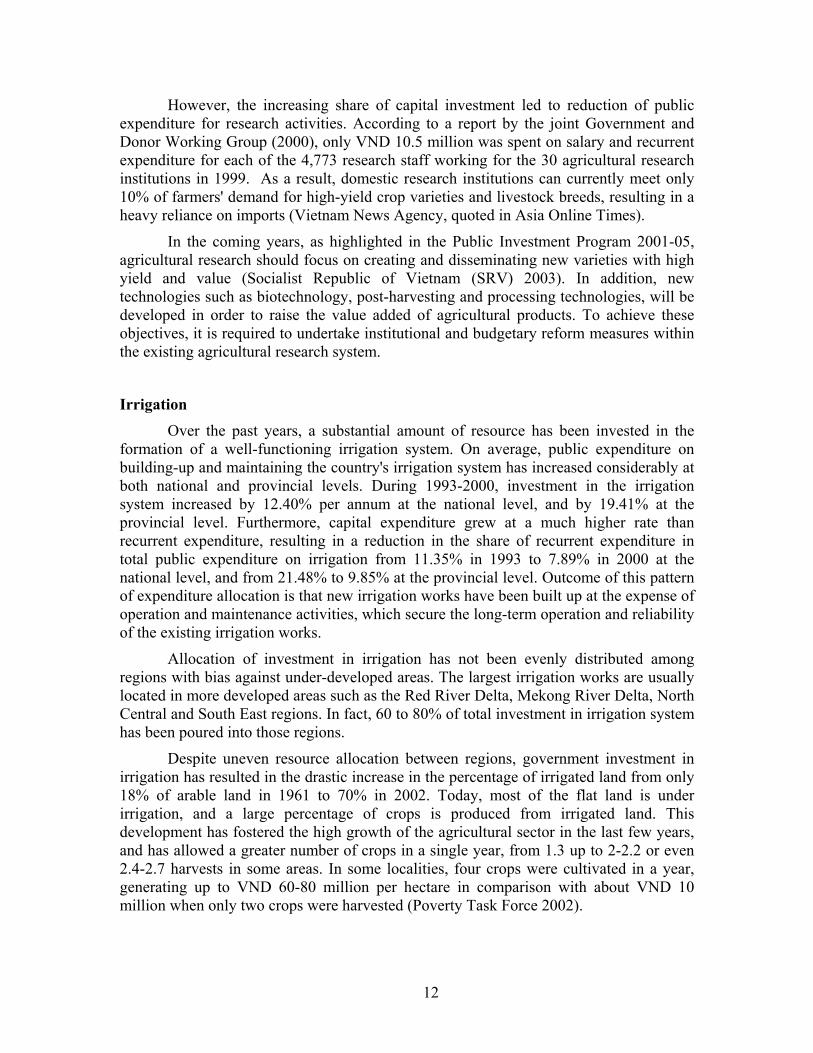
IrrigationOver the past years, a substantial amount of resource has been invested in the
formation of a well-functioning irrigation system. On average, public expenditure onbuilding-up and maintaining the country's irrigation system has increased considerably atboth national and provincial levels. During 1993-2000, investment in the irrigationsystem increased by 12.40% per annum at the national level, and by 19.41% at theprovincial level. Furthermore, capital expenditure grew at a much higher rate thanrecurrent expenditure, resulting in a reduction in the share of recurrent expenditure intotal public expenditure on irrigation from 11.35% in 1993 to 7.89% in 2000 at thenational level, and from 21.48% to 9.85% at the provincial level. Outcome of this patternof expenditure allocation is that new irrigation works have been built up at the expense ofoperation and maintenance activities, which secure the long-term operation and reliabilityof the existing irrigation works.
Allocation of investment in irrigation has not been evenly distributed amongregions with bias against under-developed areas. The largest irrigation works are usuallylocated in more developed areas such as the Red River Delta, Mekong River Delta, NorthCentral and South East regions. In fact, 60 to 80% of total investment in irrigation systemhas been poured into those regions.
Despite uneven resource allocation between regions, government investment inirrigation has resulted in the drastic increase in the percentage of irrigated land from only18% of arable land in 1961 to 70% in 2002. Today, most of the flat land is underirrigation, and a large percentage of crops is produced from irrigated land. Thisdevelopment has fostered the high growth of the agricultural sector in the last few years,and has allowed a greater number of crops in a single year, from 1.3 up to 2-2.2 or even2.4-2.7 harvests in some areas. In some localities, four crops were cultivated in a year,generating up to VND 60-80 million per hectare in comparison with about VND 10million when only two crops were harvested (Poverty Task Force 2002).

13
In the coming years, the Government considers investment in irrigation works asone of the priority areas in order to enhance the agricultural productivity. However, itshould be borne in mind that it has become more difficult to convert more land toirrigated areas because these lands may not be suitable for irrigation or crop production.The returns from future irrigation investment may decline as a result.
RoadsThe rehabilitation and modernisation of the country's decaying transport
infrastructure has been recognised as one of the main instruments to foster economicgrowth, and facilitate the process of poverty reduction. This priority was reflected in thecontinuously increasing resource allocation for the transport sector, both from the statefunding and private sources. Among all transport sub-sectors, road network is consideredthe most important. As a result, the rehabilitation and modernisation of the road networkaccounted for the largest share of public expenditure and for 94% of total transportspending, an increase of 17 percentage point from 1994 (Joint Government and DonorWorking Group 2000). Moreover, public spending for upgrading the country's roadnetwork grew at a rapid rate of around 13.51% per annum during the period 1993-2000.
As a result, the national average road density increased from 0.46 km road perkm2 in 1994 to 0.52 km of road per km2 in 1998. Many new roads have been built andconnected disadvantaged areas. However, higher investment in expanding the roadnetwork means lower public expenditure allocated for recurrent expenditure includingthat on operation and maintenance, given the total public expenditure for the sector. Infact, positive outcomes of the bias toward investment in the road network are only short-run, but adverse outcomes will be visible in the longer run. Firstly, in the future, the costto rehabilitating and maintaining those newly build roads will take much of the futurebudget for the sector, therefore resources for developing new roads will be insignificant.Secondly, the life of roads existing today with inadequate spending on operation andmaintenance will be substantially shorter.
Public spending on roads was not evenly distributed among regions, thus leadingto disparities in the level of road network development. The Red River Delta is the mostdeveloped region in terms of road density with 1.72 km of road per km2. In the Delta,100% communes have roads that allow access of automobiles to the commune centre.Some other regions, including the Southeast region, also developed relatively good ruralroad network (Poverty Task Force 2002). In a sharp contrast, roads were still ratherunder-developed in the poor regions. By the year 2000, 8.2% of all communes in theNorthern Uplands still have no motorised road to their centres. However, the figure waslower in the Mekong River Delta, where as much as 12.9% of total communes did nothave motorised road to the centres (Poverty Task Force 2002). Nevertheless, thetransportation system in Mekong River Delta was still viewed as more developed thanthat in the Northern Uplands because of the high density of navigable waterway (riverand canal).
There appears to be a close relationship between the level of economicdevelopment and the availability of a road network. Statistics show that around 85.9% ofcommunes without access to road were poor, which accounted for 19.1% of total poor

14
communes. This figure is three times higher than the national average. In the NorthernUplands for instant, poor communes without access to road made up 18.5% of total poorcommunes while the figures for the Central Coasts and Mekong River Delta were 23.8%and 29.9%, respectively.
From the discussion above, it can be seen that in the recent years, both nationaland sub-national governments have focused their efforts in developing a modernised,well-connected road system in developed areas and neglected or paid less attention to thedevelopment of a road system in the underdeveloped areas. This may result in wideninginequality between regions. In order to close the gap, the Vietnamese government hasidentified in the Public Investment Program for the period 2001-05 that much importanceis attached to the investment for rural development and national target programs,especially those for poverty reduction and job creation (SRV 2003).
ElectricityIn contrast to the investment trends in road and irrigation during the 1990s, public
investment in electricity experienced a downward trend at the rate of -32.23% althoughthe recurrent expenditure still rose by 5.93% in real terms. In contrast, at the provinciallevel, investment in electricity power continuously increased by as much as 19.04% perannum in real terms.
The pattern of investment in the electricity power sector, however, reflected ahigh demand on output of the sector in Vietnam. Currently, reach of on-grid electricitysupply at the district level is reasonable high at 96.4%. The problem lies in the poordistribution system from the district centre to communes and from communes tohouseholds. While 96.4% of all districts benefit from the national power system, only81.9% of the commune and 73.5% of household have access to that system. In fact, thisend-of-the-grid-line distribution system was mostly financed by the provincial budget.This partly explains relatively big gaps between regions and provinces. In some regionssuch as the Red River Delta, South East, and Mekong River Delta, access to the nationalpower system is relatively easy, as opposed to the situation in the Northern Uplands andCentral Highlands. Nearly 55% and 72% of the communes in the Northern Uplands andCentral Highlands respectively could not reach the national power system.
There is some correlation between poverty and electricity power provision, whereup to 63.4% of poor communes do not have electricity as opposed to a much lowerproportion of non-poor communes having no electricity (just 2.1%). Thus, electrificationin these poor communes requires a new way of financing electrification where hugefinancial assistance from the Government and specific conditions may be needed.
TelecommunicationThere are two separate periods with regard to the pattern of public expenditure on
telecommunication. The first half of the decade was characterised by huge investment ofpublic resources to modernise the telecommunication network. The annual averageexpenditure growth rate for the sector between 1993 and 1996 was extraordinarily high at148.70%. However, in the subsequent years from 1997 onward, this figure fell drastically

15
to minus 54.23%. This trend reflected the fact that in the first half of the decade, a largeamount of resources was used to modernise the sector with the "state-of-the-art"equipment, and then the demand for new equipment decelerated in the second half of1990s, when the public expenditure at the national level was turned to equipmentmaintenance and development of a new cable network. At the provincial level, a similarexpenditure pattern for the sector was also found.
Heavy investment in equipment for this sector during the first half of 1990s hasfacilitated the rapid growth of the total number of telephone lines. During the period1996-2000, the number of telephone lines rose by 2.8 times, or at an average rate of37.3% per annum. Although rural areas experienced a lower rate of growth than in urbanareas, this figure was still high at 27% per annum. The percentage of communes withtelephones was also up to 84.4% in 2002 from 31.5% in 1996. However, the number oftelephone lines differs among regions. The Red River Delta, South East and MekongRiver Delta continue to have higher shares of communes with telephones while thefigures were lower than the national average for the Northern Uplands, North CentralCoast and Central Highlands. The above pattern of telephone coverage reflects theuneven allocation of resources in public expenditure on telecommunication, under whichgreater attention has been paid to develop and upgrade the telecommunicationinfrastructure in the urban and more developed areas, and at the same time services wereunderdeveloped in disadvantaged and remote regions.
EducationFor a long time, the Government has considered education was not an end but a
mean for poverty reduction and economic development. A considerable amount ofresource had poured into this sector. During the period 1993-2000, the governmentspending for this sector increased by 13.40% per annum, and the provincial expenditureon education also rose by 15.03% per annum. Total expenditure for education was equalto 2.2% of Vietnam's GDP in 1992, and increased to 3.5% in 1998. Correspondingly,education sector received 17.4% of total public expenditure, an increase of 6.5 percentagepoints from 1992 (Joint Government and Donor Working Group 2000).
During the same period, salaries and wages, and non-wage recurrent expendituregrew at respectively 31.43% and 16.03% per annum, resulting in an increase in theirshare of total public expenditure on education from 26.71% in 1993 to 75% in 2000. Thishigh share of recurrent expenditure over total public expenditure for the education sectorwas in line with international experiences, particularly when associated with a highschool enrolment ratio, although there were still complaints that the current level ofteachers' salaries is not sufficient to adequately remunerate and motivate teachers. Highergrowth rate of recurrent expenditure implies that the share of capital investment will becorrespondingly reduced, which in turn would lead to either poor conditions of schools orcontinuation of a poor access to schools in some underdeveloped areas. However,comparing with other countries at a similar level of economic development, Vietnam hassuccessfully maintained a fairly significant level of capital investment for educationsector.

16
The existing financing mechanism, under which the district education authoritiesuse provincial resources to pay pre-primary and primary school teachers’ salaries fromprovincial resources and most expenditure at the central level poured into the highereducation system, leading to widening inequality between regions and betweenprovinces. In fact, differences in the level of financial resources available at the locallevel created the large variation in resources available at the school level. Thus, richerprovinces tend to collect more revenue, and also to spend substantially more oneducation. In contrast, provinces, which rely exclusively on the central subsidies, aremuch more constrained in their actual spending for education.
Thanks to large expenditure in the sector, Vietnam has achieved remarkableresults in reducing illiteracy, and in raising enrolment rates in all schooling levels. Nearlyall communes have at least one primary school. However, only 84.43% of communeshave at least a lower-secondary school. Currently, the national educational networkconsists of more than 12,000 pre-school units, 11,633 primary schools, 5,900 lowersecondary schools, and 644 upper secondary schools.
The illiteracy rate in Vietnam has astonishingly dropped in the past three decades,from 19% in 1971 to 7% in 1999. Most young Vietnamese have the ability to write andread, contributing to growth in both farm and non-farm sectors. Enrolment in primaryeducation has expanded, especially in rural areas although some regions, including theCentral Coast, Central Highlands and the Mekong Delta, still lag behind. In contrast withsome other developing countries, access to education of girls in Vietnam was not muchdifferent from that of boys. In some provinces, girl enrolment in the highest grade (gradefive) of primary education even represents 45% of all children enrolled. Expansion hasalso been remarkable for the next two levels of education. Over the last five years, therehas been a two-fold increase in enrolment in lower secondary education, and a four-foldincrease in enrolment in upper secondary education.
In the coming year, in order to improve the quality of human capital and publiceducation for the nation, the Government has determined to devote more resources forthis sector. About 5.3% of total investment will be used for the sector, of which the stateinvestment will account for 67% (SRV 2003).
V. Effect of Government Spending: Econometric ModelGovernment spending reaches the poor through many different ways. For
example, government fiscal spending in agricultural research improves agriculturalproductivity, which in turn reduces rural poverty. Moreover, improved agriculturalproductivity may also help to develop the rural non-farm economy and increase ruralwages through the so-called linkage effect. In addition, government spending ininfrastructure and education may also promote growth in employment and wages in thenon-farm sector, thereby contributing to poverty reduction. Thus, we use a simultaneousequation model to track these different effects on rural poverty.
(1) Y = f1(LAND, FERT, LABOR, DANIMAL, TRACTOR, PIRRI, LITE, PHONE,ELECT, ROADS, RS),

17
(2) NFE = f2(LITE, ROADS, PHONE, ELECT, LP),
(3) P=f3(LP, NFE, RPOP).
Equation (1) is a neo-classical production function for the agricultural sector. Thedependent variable is the value of agricultural production measured in constant prices (Y),while the independent variables are conventional inputs such as land (LAND), labour(LABOR), fertilisers (FERT), tractors (TRACTOR), draft animals (DANIMAL) and a set ofpublic input variables including roads (ROADS), telephone (PHONE), electricity(ELECT), irrigation (PIRRI), and education (LITE), and the stock of agricultural researchinvestment (RS).
Equation (2) is a non-farm employment determination equation. Non-farmemployment (NFE) is determined by public input variables such as education, roads,electricity, telecommunication and growth in agricultural labour productivity(LP=Y/LABOR).
Equation (3) models poverty determination in rural Vietnam. The dependentvariable (P) is the percentage of population below the poverty line. The independentvariables are growth in agricultural labour productivity, improved non-farm employment,and urbanisation (UP, or the percentage urban population in total population). Theinclusion of agricultural growth and non-farm employment in the poverty equation(instead of urban growth) is because rural poor accounts for more than 90% of the totalpoor in Vietnam. Improved rural wages may also affect poverty. But due to dataunavailability, the variable is not included. This may not cause a serious problem sincethere still exist a large labour surplus in rural Vietnam and rural wages may have not beenimproved much in the past.
The marginal impact of government spending, taking the example of agriculturalresearch and education investment as examples, can be derived from these threeequations as follow:
(4) dP/dRS = (∂P/∂LP)(∂Y/∂RS)+(∂P/∂NFE)(∂NFE/∂LP)(∂Y/∂RS),
(5) dP/dLITE = (∂P/∂LP)(∂Y/∂LITE)+(∂P/∂NFE)(∂NFE/∂LP)(∂Y/∂LITE)+(∂P/∂NFE)(∂NFE/∂LITE).

18
Equation (4) measures the marginal effect of poverty reduction of the researchstock variable.6 The first term on the right hand side is the direct poverty impact ofgrowth in agricultural production due to increased agricultural research. The secondterm measures the impact of agricultural research through improved non-farmemployment due to research induced production growth in agriculture.
Equation (5) is the marginal poverty reduction effect of improved education.Similar to Equation (4), the first two terms on the right hand side are the direct povertyreduction effect of improved education from growth in agricultural production and theindirect effect from improving non-farm employment opportunities. The third termcaptures the direct impact on poverty reduction by improving non-farm employment dueto improved education.
To estimate the stock of public spending, we proceed as follow. Beginning withthe work of Griliches, a large number of studies have included some aspects ofgovernment expenditures on agriculture as explanatory variables in production orproductivity functions. Government expenditures on agriculture can stimulate the privateaccumulation of capital that can lead to a change in productivity by increasing the stockof capital or by changing the quality or price of conventional inputs and outputs (i.e.,through a change in the technology used to produce those inputs and outputs) . Therelationship between government expenditures and changes in the stock of capital issometimes referred to as a capital formation or stock accumulation process. Usually thisstock cannot be observed directly, so it is more a part of the conceptual apparatus than anempirical tool. An empirically useful variant of the capital formulation or accumulationfunction, and the one described by Equation (4), is the function that relates output (orproductivity) to weighted sum of lagged values of government expenditures, rt-k, given by
(6) RSt = rt-1wt-1+rt-1wt-2+…rt-lwt-l.where wk's are weights of past expenditures and are normalised to one. In this
study, we estimate separate effects of public research and non-research expenditures.These types of expenditures have different, but largely unknown, lag structures betweenthe commitment of the public resources and their effects on agricultural output. Forexpediency, we restricted the lag length for research expenditures to be seven years withthe lag structure defined by the following weights: 0.05, 0.1, 0.2, 0.3, 0.2, 0.1, and 0.05for i =1,2,...7, respectively in Equation (3). Alston, Craig and Pardey (1997) have arguedpersuasively (and shown empirically using U.S. data) that these lag structures ought to bemuch longer (perhaps best modelled as infinite) and this is an issue we plan to explorewith these data at a subsequent time. The length and form of these lag structures are ofparamount importance when evaluating the returns to research. This is not attemptedhere. Our aims are much more modest, namely to explore the links between governmentspending and output growth and to ascribe some share of that output growth to thesepublic investments.
6 It is assumed that there is a constant return to scale. Under this assumption, the effect of growth in laborproductivity on poverty reduction is equivalent to that of growth in agricultural production, i.e.,(∂P/∂Y)(∂Y/∂RS)= (∂P/∂LP)(∂Y/∂RS).

19
For investment in irrigation, electricity, roads, equations (7) to (11) model therelationships between improved physical capitals and monetary stocks of these variableswhich are functions of the past government investments.
(7) IRRI = f4(IRS)
(8) ELECT=f5(PWRS)
(9) PHONE = f6(TELES)
(10) ROADS=f7(ROADS)
(11) LITE=f8(EDUS)
The monetary stocks of these variables are calculated using the perpetualinventory approach
(12) .Kδ)(1 1-t−+= tt IK
where Kt is the capital stock in year t, It is gross capital formation in year t, and δis the depreciation rate (5%). To obtain initial values for the capital stock, we used asimilar procedure to Kohli (1982):
(13) .)r(δ
00 +=
IK
Equation (13) implies that the initial capital stock in year 0 (K0) is capitalinvestment in year 0 (I0) divided by the sum of real interest rate (r) and depreciation rate.In the case of Vietnam, we assume a real interest rate of 5%. Sensitivity analyses wereconducted to see whether different depreciation rates and real interest rates would affectour final results. We found the impact to be negligible.

20
VI. Data, Model Estimation and ResultsData
Most of our data used in this study come from the Ministry of Agriculture andRural Development (MARD), the Ministry of Finance (MOF), and the Central Institutefor Economic Management (CIEM). MARD and CIEM compiled these variables fromvarious published and unpublished official government documents. MOF data areextracted from its database.
Poverty. Poverty is measured as the percentage of population below the nationalpoverty line.
Agricultural Output. Agricultural output is measured as the total production valueproduced in the agricultural sector expressed in constant prices. The agricultural sector inVietnam includes crop, animals, fishery, and forestry sub sectors.
Non-farm Employment. We use the percentage of rural non-farm employment intotal rural employment as our non-farm employment variable.
Urbanisation. The percentage of urban population in total population is used asthe urbanisation variable.
Agricultural Labour. Agricultural labour is the total number of workers whodevote more than 50% of their working time in the agricultural sector.
Land. Land input is total agricultural land used in agricultural production.
Fertiliser. The fertiliser variable refers to total chemical fertiliser used inagricultural production. Manurial fertiliser is also important in Vietnamese agriculture,but is excluded from input use due to data unavailability.
Tractor. The total number of tractors is used as the machinery variable. Due tolack of information, the number of tractors has not been converted into a standardisedsize.
Draft Animal. The draft animal input is measured as total number of draftanimals. In the case of Vietnam, draft animals are mainly water buffaloes.
Irrigation. The irrigation variable is measured as percentage of croplandirrigated.
Education. We use the percentage of rural population who are literate as oureducation variable.
Roads. The road variable is measured as length of roads in km per thousandsquare km.
Telephone. The number of telephone connections is used as the telephonevariable. This variable is used to proxy for the development of telecommunication.
Electricity. The percentage of rural households that has electricity connection isused as the electricity variable.
Agricultural Research. Research stock is used as our research variable. We useEquation (5) to convert past research expenditures into a research stock variable.

21
Government Spending. Government spending on education, electricity,telecommunication, roads, and irrigation includes spending on both fixed and currentexpenditures. The data are taken from the MOF.
Empirical ResultsWe first present the results of the estimated equation system, and then report the
marginal returns to public spending in terms of both increased agricultural production andreduced poverty.
Estimates of the Equations System
As we have discussed in the previous section, policy reforms and institutionalchanges have made great contribution to the rapid growth in rural Vietnam, in addition toincreased input use, technological change, and improvement in rural infrastructure andeducation. However, it is not our purpose to quantify these specific effects on ruralgrowth and poverty reduction. In order to avoid or minimise the bias on our estimates ofthe impact of public spending, we use year dummies in all equations in the system toproxy the year-specific policy reforms. Vietnam is also diverse geographically so tocapture the impact of agro-climatic effects, we also include provincial dummies in allequations.
The estimated coefficients of the equation system are presented in Table 7. Sincewe use double-log form for all the equations included in the system, the coefficients areelasticity of the dependent variables with respect to their independent variables in eachequation. For example, the coefficient for labour is 0.187 in the agricultural productionfunction, and this indicates that for every one percent increase in labour, agriculturalproduction will increase by 0.187%.
The estimated agricultural production function suggests that conventional inputssuch as land, labour, and fertiliser are still important in Vietnamese agriculture, withelasticities ranging from 0.137 to 0.187. The coefficients for tractor and draft animalinputs are statistically insignificant, however. One important finding from the estimatedagricultural production function is the high significance level of the public inputvariables. In particular, education variable, measured as the literacy rate of ruralpopulation, is the most significant, and is the largest in magnitude. The rest of the publicvariables such as irrigation, roads, access to telephone and electricity and agriculturalresearch have all contributed to growth in Vietnamese agriculture. However, except forelectricity and telephones, they are not statistically significant.
The estimated non-farm equation shows that all variables including improvementin education, roads, and access to telephone and electricity have significant impacts onrural non-farm employment. Growth in agricultural production has also a positive impacton rural non-farm employment.
The estimated poverty equation shows that growth in agricultural productivity andnon-farm employment has important impact on alleviating rural poverty in Vietnam. Forevery one percent growth in agricultural productivity, 561% of rural poor will be lifted

22
above the poverty line. More importantly, the non-farm employment variable has anelasticity of 0.997. But considering the indirect effect of agricultural growth on povertyreduction through the development of the non-farm employment, the effects of these twovariables are roughly the same.
Table 8 reports the results of the estimates of the relationship between monetarystocks and physical stocks of various types of public investments (except for agriculturalR&D). All coefficients are statistically significant, implying that we can use theserelationships to calculate the returns in agricultural growth and poverty reduction per unitof capital stock.
Marginal Returns to Government Spending
Table 9 presents the marginal returns in agricultural growth to various types ofgovernment spending measured as returns in dong per dong spending. This is equivalentto benefit-cost ratios. Agricultural research has the largest return in agriculturalproduction among all types of government spending. For every dong spent, almost 11dong of agricultural production value would be produced. Since agricultural research isconducted at the national level, it is only possible to calculate the impact at the nationallevel. The telephone investment has the second largest return with a benefit-cost ratio of6.73. Education investment has a similar return to telephone investment, and for everydong invested, 5.34 dong of agricultural production value would be produced. Road andelectricity also have good returns, with benefit-cost ratios of 3.50 and 2.18, respectively.Since most of the telecommunication investment is made at the central level, only theimpact at the national level was estimated. In contrast to other types of investments, thebenefit-cost ratio for irrigation investment is less than one, meaning the benefit generatedfrom irrigation cannot cover the cost. 7
The regional disaggregation reveals a large regional difference. For educationinvestments, it is Southeast, Red River Delta, and Mekong River Delta where the returnis the largest. For road investment, the regional difference is relatively small and allregions have high return. Although the table also show a large difference in returns toelectricity investment, it is difficult to evaluate whether it is the case in reality since theinvestment and final users of electricity may go beyond regions.
Table 10 is the estimated effects of government investment on poverty reduction.It is measured as number of poor lifted per billion dong invested (measured in 2000
7 Alston et al. (2000) developed an approach to convert a benefit-cost ratio to an internal rate of return orvice versa. It is assumed that the benefit stream is a perpetual annual flow, B, per year while the cost is aone time spending, C at time t. Thus the net present value of B is:
∑∑ ∞
=+
∞
==+≈+=
00/)1/()1/()(PV
jjj
jtjt iBiBiBB and the net present value of cost is
B/IRR IRR)(at )(PV)(PV ≈=≈ ttt BCC . Therefore, the benefit-cost ratio is:
IRR/i(B/IRR)(B/i)PV(C)PV(B)BC ttt =÷≈÷= .
Where i is the discount rate, IRR is the internal rate of return, and BC is the benefit cost ratio. Hence wecan also approximate the IRR as BC*i. If BC>1, then IRR is always greater than i.

23
prices).8 Among all types of government spending, agricultural research has the largestreturn in poverty reduction. For every billion dong spent on education, 246 poor wouldbe lifted above the poverty line. The poverty impact of telephone ranks the second, andfor every billion dong spend on roads, 207 poor would be lifted. Investments ineducation, roads and electricity also have very favourable return in poverty reduction.For every one billion dong invested, the number of poor reduced is 164, 103, and 90,respectively. Irrigation has the least poverty impact among all types of spendingconsidered in the study. For every one billion dong spending, only 23 poor is liftedabove the poverty line. The effect is less than 10% of agricultural research spending.
There is a great variation among regions in the effects of investment on povertyreduction. It is the North Central that has the largest poverty reduction impact from roadinvestment. For education, it is the Southeast where the return is the largest.
VII. ConclusionsThis section reports this study’s major findings, highlights implications for future
government investment priorities, and points out limitations and future researchdirections.
Major FindingsAgricultural growth and poverty reduction in Vietnam have been impressive for
the last one and half decades. Contributing to this is a series of policy reforms andimprovement in technology, infrastructure, and education. These improvements are inturn the results of government investments for the past several decades.
Using the provincial data on agricultural production, rural non-farm employment,poverty, and government investments, this study develops a simple econometric equationsystem to estimate the returns of various government investments on agricultural growthand poverty reduction. The results reveal that government investment in agriculturalresearch has the largest poverty reduction impact, followed by telephone, education,roads and electricity. Irrigation investment has the smallest impact on agriculturalgrowth. The ranking of poverty effects of these investment are the exactly the same aseffect on agricultural growth. This implies that there is no trade-off between agriculturalgrowth and poverty reduction when selecting investment priorities.
Priorities for Future Government InvestmentIt is clear that government spending has played an important role in agricultural
growth and poverty reduction. However, it is worrisome that the government hasreduced its investment in these areas. To gain further growth and poverty reduction, thegovernment has to gear up its investment in agricultural research, education and ruralinfrastructure.
8 One billion dong is equivalent to US$ 60,000 at the current exchange rate.

24
In terms of regional investment priorities, it is obvious that if the governmentintents to maximise the poverty reduction impact, more public resources should betargeted to the North Central and Highlands. However, if the government’s objective isto maximise agricultural growth, then resources should be targeted to Southeast andHighlands. It seems that more investment in Highlands can achiever both higher growthand more poverty reduction.
Limitations and Future Research DirectionsThis study has several limitations. Among the most critical is the data constraint.
Not only are many indicators related to rural public investment lacking, but also the poorquality and inconsistency of data pose serious problems concerning the reliability ofresults. Many assumptions have to be made to arrive our final results, although they arenot totally unrealistic. While we will continue to improve our data collection, thegovernment should put serious effort in organising and co-ordinating such an effort inlong run. In particular, government spending split by rural and urban areas is lacking.Dissaggregation of spending by province is unavailable for some sub-sectors. Data onphysical and human capitals such as road density, education level, rural electricityconsumption and irrigation also need to be standardised and systematically compiled overtime and by province. Long time series provincial annual data on income (both from farmand non-farm) and poverty are not available. Without such data or information, it isdifficult for the government to monitor and evaluate impacts of these various investmentsand to set government investment priorities to achieve stated objectives.
Second, a general-equilibrium analysis is needed to analyse how governmentinvestment in rural areas affects not only the agricultural sector and rural areas, but alsoother sectors and cities. Ignoring these impacts severely underestimates the overallimpact of public investment on poverty. A similar effort is also need to analyse theimpact of urban investment on poverty reduction. Without such information, it isdifficult to convince national policymakers to change urban bias of existing investmentpolicies.
Finally, an analysis of the political and institutional context of public investmentsand conditions for efficient provision of public goods and services is needed to improvethe efficiency of public investments. In particular, more attention needs to be given tohow the government can design a mechanism (policies, regulations, fiscal systems) tomobilise public resources to invest in rural areas, and how public provision can be mademore efficient by improving incentive systems, accountability, human capital, andmanagement.

TablesTable 1: Poverty Incidence, 1993-2002
(% of total population)Food poverty General poverty
1993 1998 2002 1993 1998 2002Total 24.9 15.0 10.9 58.1 37.4 28.9
Urban/Rural Urban 7.9 2.5 1.9 25.1 9.2 6.6Rural 29.1 18.6 13.6 66.4 45.5 35.6
Ethnicity Kinh & Chinese 20.8 10.6 6.5 53.9 31.1 23.1Others 52.0 41.8 41.5 86.4 75.2 69.3
Gender Male 26.0 16.2 12.0 61.0 39.9 31.2Female 21.0 10.6 6.6 48.3 28.2 19.9
RegionRed River Delta 24.2 8.5 5.3 62.7 29.3 22.4Northern Uplands 42.3 32.4 21.1 81.5 64.2 43.9North Central Coasts 35.5 19.0 17.5 74.5 48.1 43.9South Central Coasts 22.8 15.9 9.0 42.7 34.5 25.2Central Highlands 32.0 31.5 29.5 70.0 52.4 51.8South East 11.7 5.0 3.0 37.0 12.2 10.6Mekong River Delta 17.7 11.3 6.5 47.1 36.9 23.4

26
Table 2: Real Annual per Capita Expenditure and Annual Growth, 1993-2002Real annual per capita expenditure
(thousand VND)Annual growth in per
capita expenditure (%)Region1993 1998 2002 1993-98 1998-2002
Whole Vietnam 1936 2764 3229 7.4 4.0
Urban/rural Urban 3013 4829 5812 9.9 4.7Rural 1669 2166 2447 5.4 3.1Gap (urban/rural) 1.8 2.2 2.4 na na
Quintile 1. Poorest 854 1099 1197 5.2 2.22. Near poorest 1233 1632 1796 5.8 2.43. Middle 1582 2125 2386 6.1 2.94. Near richest 2098 2929 3401 6.9 3.85. Richest 3911 6032 7363 9.1 5.1Gap (richest/poorest) 4.6 5.5 6.2 na na
Ethnicity Kinh & Chinese 2041 2968 3454 7.8 3.9Others 1245 1524 1655 4.1 2.1Gap (Kinh/others) 1.6 1.9 2.1 na na
Gender Male 1849 2603 2981 7.1 3.4Female 2237 3349 4189 8.4 5.8Gap (female/male) 1.2 1.3 1.4 na na

27
Table 3: Contribution of the Regions to Total Poverty, 1993-2002 (%)1993 1998 2002
RegionShare ofpoverty
Share ofpopulation
Share ofpoverty
Share ofpopulation
Share ofpoverty
Share ofpopulation
Red River Delta 25.5 23.7 17.9 22.9 17.1 21.9Northern Uplands 18.9 13.5 25.2 14.7 22.2 14.6North Central Coast 16.4 12.8 17.8 13.8 20.4 13.4South Central Coast 7.7 9.4 7.8 8.5 7.4 8.5Central Highlands 3.8 3.2 5.2 3.7 10.4 5.8South East 9.6 15.1 4.9 15.0 5.3 14.6Mekong River Delta 18.1 22.4 21.2 21.5 17.2 21.3Total 100.0 100.0 100.0 100.0 100.0 100.0

28
Table 4: Poverty by Main Sectoral Occupation for People from 15 Years Old orHigher Who Have Job during the Past 12 Months (%)
Poverty Incidence Share of total poverty Share of populationSector 1993 1998 2002 1993 1998 2002 1993 1998 2002
Agriculture, forestryand fishery
66.1 44.4 38.9 85.7 84.3 84.0 73.9 67.1 58.7
Mining,manufacturing andconstruction
37.8 20.9 15.3 7.4 8.0 8.5 11.1 12.8 17.0
Services 28.1 12.7 9.9 5.7 6.4 6.4 11.6 15.5 18.6Others 20.8 9.1 4.9 1.2 1.3 1.1 3.4 4.7 5.7Total 57.0 34.8 27.6 100.0 100.0 100.0 100.0 100.0 100.0

Table 5: Government Budget Spending on Major Infrastructure Sectors for thePeriod 1993-2000
(billion VND, 1994 price)1993 1994 1995 1996 1997 1998 1999 2000
1. Roads 2,678 3,286 4,158 4,404 4,918 5,353 5,891 6,6392. Electricity power 6,463 2,002 654 525 379 286 365 4333. Irrigation 808 813 976 1,187 1,332 1,673 1,760 1,9334. Water supply 108 394 268 277 516 414 402 4025. Telecommunication 67 92 260 1,049 228 19 21 226. Education-training 4,020 5,011 5,918 6,137 7,359 8,638 8,534 9,9017. Health 2,451 2,557 2,638 2,823 3,192 3,528 3,823 4,058Total of 7 sectors 16,593 14,155 14,871 16,402 17,925 19,912 20,796 23,389Total budget 42,385 44,655 46,657 49,031 52,175 49,742 54,335 63,910

Table 6: Government Budget Shares by Infrastructure Sector for the Period 1993-2000
(% of total budget)
1993 1994 1995 1996 1997 1998 1999 2000Average93-00
Roads 6.32 7.36 8.91 8.98 9.43 10.76 10.84 10.39 9.26Electricity 15.25 4.48 1.40 1.07 0.73 0.58 0.67 0.68 2.76Irrigation 1.91 1.82 2.09 2.42 2.55 3.36 3.24 3.02 2.60Water supply 0.25 0.88 0.57 0.57 0.99 0.83 0.74 0.63 0.69Telecommunication 0.16 0.21 0.56 2.14 0.44 0.04 0.04 0.03 0.44Education-training 9.48 11.22 12.68 12.52 14.10 17.37 15.71 15.49 13.78Health 5.78 5.73 5.65 5.76 6.12 7.09 7.04 6.35 6.22Total of 7 sectors 39.15 31.70 31.87 33.45 34.36 40.03 38.27 36.60 35.75

31
Table 7: Estimates of the Equation System
Agricultural Production Function
Y = 0.137 LAND + 0.187 LABOR + 0.162FERT + 0.018 TRACTOR(5.71)* (4.32)* (2.73)* (1.47)
-0.055 ANIMAL + 0.035 PIRRI + 1.25 LITE + 0.111 ROADD(-2.33) (1.77)* (3.58)* (2.62)**
+ 0.038 PHONE + 0.004 ELECT +0.055 RDS +0.011 RAIN (1.44)** (0.56)* (2.42)* (0.54)
R2 = 0.964
Rural Non-farm Employment Equation
NFE = + 0.185 LITE + 0. 044 ROADD + 0.029 PHONE +0.0244 ELECT (1.78)* (4.11)* (1.98)* (2.21)*
+0.148 LP (3.06)*
R2=0.925
Poverty Equation
P = -0.561 LP - 0.977 NFE +0.041 R2=0.855(-8.11)* (-5.48)* (1.21)

32
Table 8: Investment EquationsIRRIP = 0.113 IRRIK R2 = 0.554
(3.06)*
LITE = 0.099 EDUK R2 = 0.935(8.63)*
ROADD = 0.638 TRANSK R2 = 0.868(8.56)*
PHONE = 0.411 TELEK R2 = 0.756(4.56)*
ELECT = 0.293 PWRK R2 = 0.876(3.32)*

33
Table 9: Returns in Agricultural Production
Agricultural
R&D Irrigation Roads Electricity Telephone Education
Dong Per Dong Spending
The Whole Country 11.00 0.76 3.50 2.49 6.73 5.34
Northern Uplands 0.38 2.17 0.90 2.46
Red River Delta 0.73 3.79 25.99 5.41
North Central 0.40 3.80 1.81 2.62
Central Coast 0.38 2.83 3.25 3.20
Highlands 0.51 3.60 0.87 5.10
Southeast 2.39 3.84 5.86 12.10
Mekong River Delta 0.67 3.96 2.11 5.39

34
Table 10: Returns in Poverty Reduction
Agricultural
R&D Irrigation Roads Electricity Telephone Education
Number of Poor per Billion Dong
The Whole Country 246.52 23.29 102.52 90.71 207.38 164.60
Northern Uplands 21.67 118.56 62.07 141.34
Red River Delta 14.28 70.79 495.58 106.42
North Central 26.84 241.36 136.07 175.11
Central Coast 23.39 167.01 67.30 198.89
Highlands 15.08 101.13 31.09 151.11
Southeast 50.18 76.41 149.27 253.46
Mekong River Delta 10.23 57.43 37.75 82.39

35
FiguresFigure 1: Vietnam’s Economic Growth and Inflation, 1976-2000
Source: Le Dang Doanh et al (2002).
-4
-2
0
2
4
6
8
10
12
77 78 79 80 81 82 83 84 85 86 87 88 89 90 91 92 93 94 95 96 97 98 99 00
GD
P G
row
th R
ate
(%)
-300-200-1000100200300400500600700800900
Infla
tion
Rat
e (%
)
GDP Growth Rate Inflation Rate

36
Figure 2: Government Spending on Some Types of Infrastructure and BasicServices
1994 prices, (billion VND)
0
2,000
4,000
6,000
8,000
10,000
12,000
1993 1994 1995 1996 1997 1998 1999 2000
Transportation Electricity IrrigationWater supply Telecommunication Education and trainingHealth care

37
Figure 3: Per Capita GDP, Budget Revenue and Budget Expenditure by Region(Thousand VND), 2000
0
2000
4000
6000
8000
10000
12000
14000
Red RiverDelta
North-East
North-West
CentralNorth
CentralSouth
CentralHighlands
SouthEast
MekongRiverDelta
GDP p. c. Budget revenue p.c. Budget expenditure p.c.

38
Figure 4: Effect of Agricultural R&D on Poverty
Agricultural RD Investment
Agricultural Production
POVERTY
Nonfarm Employment
0.055
-0.561 -0.977
0.148

39
Figure 5: Effect of Irrigation Investment on Poverty
Irrigation Investment
Agricultural Production
POVERTY
Nonfarm Employment
0.035
-0.561 -0.977
0.148
40
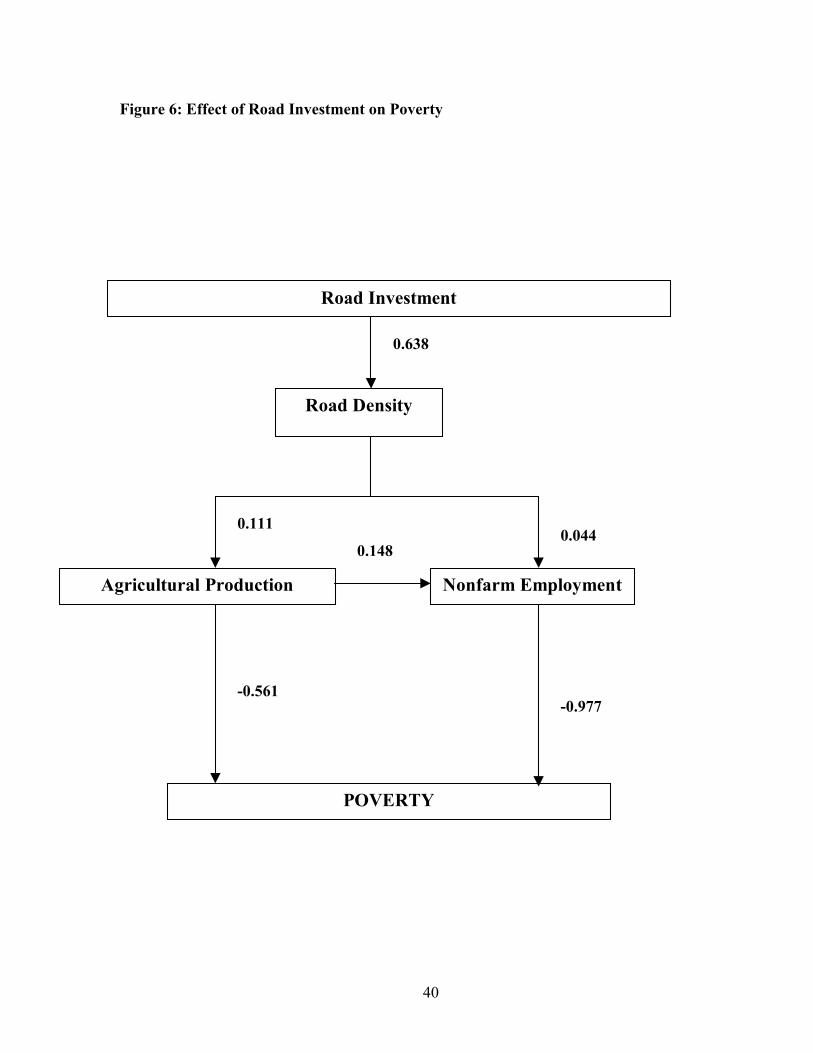
Figure 6: Effect of Road Investment on Poverty
Road Investment
Agricultural Production
POVERTY
Road Density
Nonfarm Employment
0.638
0.111 0.044
-0.561 -0.977
0.148

41
Figure 7: Effect of Education Investment on Poverty
Education Investment
Agricultural Production
POVERTY
Literacy Rate
Nonfarm Employment
0.099
1.32
-0.561 -0.977
0.148 0.023

42
Figure 8: Effect of Power Investment on Poverty
Power Investment
Agricultural Production
POVERTY
Household Access to Electricity
Nonfarm Employment
0.293
0.0197
-0.561 -0.977
0.148 0.005

43
Figure 9: Effect of Telecommunication Investment on Poverty
Telecommunication Investment
Agricultural Production
POVERTY
Telephone Connections
Nonfarm Employment
0.411
0.38
-0.561 -0.977
01.48 0.003

44
BibliographyAsia Times Online. 2002. Vietnam to Spend Big on Agricultural Development.
Vietnam News Agency. January 26th, 2002. Available at:http://www.atimes.com/se-asia/DA16Ae01.html.
Fahey, S., 1995. Changing labour relation. In Dilemmas of Development: VietnamUpdate 1994, B. T. Kerkvliet, ed. Canberra: Australian NationalUniversity.
Fan S. and P.Pardey. 1998. Government Spending on Asian Agriculture: Trends andProduction Consequence. In Agricultural Public Finance Policy in Asia.Tokyo: Asian Productivity Organization.
Joint Government and Donor Working Group. 2000. Vietnam Managing PublicResources Better: Public Expenditure Review 2000. Joint Report of theGovernment of Vietnam – Donor Working Group on Public ExpenditureReview, Hanoi.
Le Dang Doanh. 1999. Ten Years of Doi Moi: Where Is Vietnam’s Economy?Vietnamese Studies, 132(2).
Le Dang Doanh, Vo Tri Thanh, Pham Lan Huong, Dinh Hien Minh and NguyenQuang Thang. 2002. Explaining Growth in Vietnam, in Global ResearchProject (country studies), 2002.
MOLISA. 1997. Status of Labour – Employment in Vietnam 1996. Hanoi: StatisticalPublishing House.
MOLISA. 1999. Status of Labour – Employment in Vietnam 1998. Hanoi: StatisticalPublishing House.
Nguyen Van Bich and Chu Tien Quang. 1996. Economic Policy and its Role inAgricultural and Rural Development in Vietnam, Hanoi: National PoliticalPublishing House.
Pham Lan Huong and Vo Tri Thanh. 2003. Transition from Planning to MarketEconomy and Poverty Alleviation in Vietnam. In Trade Policy, Growthand Poverty in Asian Developing Countries. K. Sharma, ed. London andNew York: Routledge.
Poverty Working Group. 1999. Vietnam Development Report 2000: AttackingPoverty, Joint Report of the Government-Donor-NGO Poverty WorkingGroup, Consultative Group Meeting for Vietnam, December 14-15, 1999.Vietnam.
Socialist Republic of Vietnam. 2003. Public Investment Program in 2001-2005.Hanoi: Statistical Publishing House.
Poverty Task Force. 2002. Localizing MDGs for Poverty Reduction in Vietnam:Enhancing Access to Basic Infrastructure, Hanoi.