vietnam food processing market 2016
TRANSCRIPT

‹#›
Vietnam Food Processing Market 2016
Date of the report: 1st August 2016
Part of StoxPlus’s Market Research Report Series for Vietnam www.biinform.com
@ 2016 StoxPlus Corporation.
All rights reserved. All information contained in this publication is copyrighted in the name of StoxPlus, and as such no part of this publication may be
reproduced, repackaged, redistributed, resold in whole or in any part, or used in any form or by any means graphic, electronic or mechanical, including
photocopying, recording, taping, or by information storage or retrieval, or by any other means, without the express written consent of the publisher.

2
Date: 1st August, 2016
Dear Our Valued Customer,
Re: The publication of Vietnam Food Processing Market Report 2016
I am pleased to pleased to announce the publication of Vietnam Food
Processing Market Report 2016.
The purpose of research work is to have an in-depth understanding of
food processing market in Vietnam and assessing potential of the
market. We also highlighted current market size as well as potential
demand of commercial cold storage for each segment. We believe it
should be further studied and evaluated.
In addition to our experience in this industry, we have conducted
various discussions and interviews with industry players, distribution
partners at executive levels to grasp local insights and the practical
ways of the market in Vietnam.
We understand that this is a targeted but also an open research. We
would be happy to provide any further information to address any
questions that you may have, for any specific sector or target business
in Vietnam. Our ultimate objective is to bring real values to our clients
via in-depth research and practical local insights.
Should you have any questions, please contact I myself or our Managing
Director, Ms. Lan Nguyen at +84-4-35626962 (ext. 109) or her email:
Yours sincerely,
Nguyen Quang Thuan
CEO
StoxPlus Corporation
StoxPlus Joint Stock Company
Head Office
5th Floor, Anh Minh Building
36 Hoang Cau, Dong Da
Hanoi, Vietnam
telephone: +84 (4) 3562 6962
facsimile: +84 (4) 3562 5055
stoxplus.com
Ho Chi Minh City Branch
2nd Floor, May Plaza
63D Vo Van Tan Street, District 3
Ho Chi Minh City, Vietnam
telephone: +84 (8) 3823 3485
facsimile: +84 (8) 3827 3068

3
Table of Contents
Part Content Page
Executive Summary
1 Vietnam Food Processing Market Overview
1.1 Market structure and description
1.2 Market Size
1.3 Value chain structure
1.4 Major M&A
2 Segment Analysis
2.1 Processed Seafood
Seafood Industry
Supply Analysis
Demand Analysis
Distribution
Competitive Landscape
2.2 Processed Meat
Meat Industry
Supply Analysis
Demand Analysis
Distribution
Part Content Page
Competitive Landscape
2.3 Milk products
Milk Industry
Supply Analysis
Demand Analysis
Distribution
Competitive Landscape
2.4 Processed Fruit & Vegetables
Fruit & Vegetables Industry
Supply Analysis
Demand Analysis
Distribution
Competitive Landscape
3 Macroeconomic Situation & Regulatory Framework
Macroeconomics
Regulatory Framework
4
Executive Summary
This content is intentionally removed for demo purpose
5
Executive Summary (cont.)
This content is intentionally removed for demo purpose

6
Abbreviation
No. Abbrev. Stand for
1 bn billion
2 Agifish An Giang Fisheries Import & Export Co.
3 CHOLIMEX Cho Lon Import & Export Co.
4 CAGR Compound Annual Growth Rate
5 FPO Farmer Producer Organization
6 FMCG Fast-Moving Consumer Goods
7 FDI Foreign Direct Investment
8 F&V Fruit & Vegetables
9 Hanfoco Halong Canned Food Co.
10 IDP International Dairy Producers
11 IDI International Development Investment
12 MT Metric Ton
13 mn million
14 MARD Ministry of Agriculture and Rural Development
15 SAGRI Saigon Agriculture & Processed Food
16 SATRA Saigon Trading Group
17 STAPIMEX Soc Trang Seafood Jsc
18 SOE State-owned Enterprise
19 VEGETIGI Tien Giang Vegetables & Fruit Jsc
20 Tbd To Be Determined
21 US$ US Dollar
22 VASEP Vietnam Association of Seafood Exporters and Producers

7
Contents
Section 1: Vietnam Food Processing Market Overview
1.1 Market structure and description
1.2 Market Size
1.3 Value chain structure
1.4 Major M&A

8
Food processing market is comprised of 4 segments: Processed Seafood, Processed
Meat, Milk Products and Processed Fruit and VegetablesFigure 01: Market Structure
Section 1: Vietnam Food Processing Market Overview
Market Structure
Food Processing
Processed Meat
Processed Seafood
Milk Products
Processed Fruit and
Vegetables
This content is intentionally removed for demo purpose

9
Contents
Section 1: Vietnam Food Processing Market Overview
1.1 Market structure and description
1.2 Market Size
1.3 Value chain structure
1.4 Major M&A

10
Vietnamese food industry witnessed steady growth over the last few years fueled by
increasing expenditure of consumer
Section 1: Vietnam Food Processing Market Overview
Market Size & Segmentation
Figure 02: Total Food consumption 2011-2015
Source: StoxPlus, BMI
18.8
21.2
23.6
27.6
32.1
0
5
10
15
20
0
5
10
15
20
25
30
35
2011 2012 2013 2014 2015
US$bn
Food Consumption (USbn) % y-o-y
Figure 03: Average food and total expenditure per capita, 2006-
2014
Source: GSO, StoxPlus estimate
0
500
1000
1500
2000
2500
2006 2008 2010 2012 2014
'000 V
ND
Food Expenditure Total Expenditure
This content is intentionally removed for demo purpose

11
Key Development Milestones of Vietnam Food Processing Market
Section 1: Vietnam Food Processing Market Overview
Market Size & Segmentation
Figure 04: Food processing industry key development milestones (including major companies in each segment)
Source: StoxPlus
1957
20162014 2015
1954 1990 2001 2011 2016
We are here
Vinamilk
1976
1995CP Vietnam
19982001
Vissan
1970
20091954
This content is intentionally removed for demo purpose

12
Food processing industry is divided into 4 segments
Section 1: Vietnam Food Processing Market Overview
Market Size & Segmentation
FOOD PROCESSING
PROCESSED SEAFOOD
PROCESSED FRUIT AND VEGETABLES
PROCESSED MEAT
Milk products
This content is intentionally removed for demo purpose

13
Besides processed seafood, most food processing segments have grown, on average,
15% annually since 2011
Section 1: Vietnam Food Processing Market Overview
Market Size & Segmentation
Figure 05: Food processing market size, 2011-2015
Source: StoxPlus
Processed Seafood Processed Meat
Milk productsProcessed Fruit &
Vegetables
Food Processing
CAGR
CAGR CAGR
CAGR*CAGR is calculated for period 2010-2014. The sharp
decline in 2015 is excluded as an outlier.
This content is intentionally removed for demo purpose

14
Contents
Section 1: Vietnam Food Processing Market Overview
1.1 Market structure and description
1.2 Market Size
1.3 Value chain structure
1.4 Major M&A
15
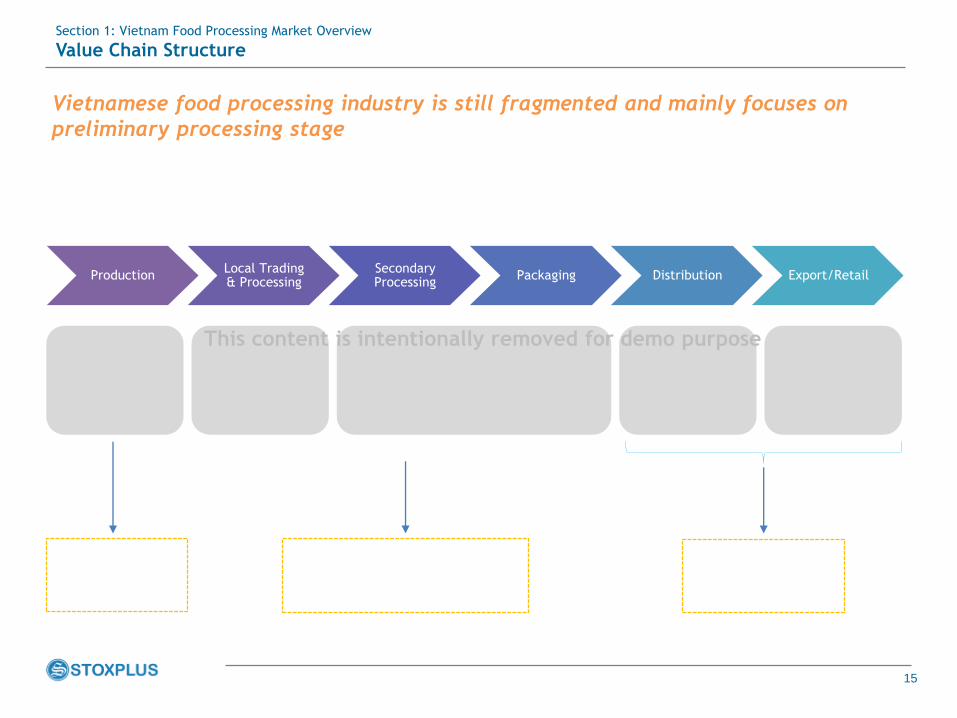
Vietnamese food processing industry is still fragmented and mainly focuses on
preliminary processing stage
Section 1: Vietnam Food Processing Market Overview
Value Chain Structure
ProductionLocal Trading & Processing
Secondary Processing
Packaging Distribution Export/Retail
This content is intentionally removed for demo purpose

16
Contents
Section 1: Vietnam Food Processing Market Overview
1.1 Market structure and description
1.2 Market Size
1.3 Value chain structure
1.4 Major M&A

17
Vietnam food processing industry witnessed some major M&A deals, especially from
South Korea
Section 1: Vietnam Food Processing Market Overview
Major M&A
Acquirer Country Target company Deal value Year
1 South
Korea
2015
2 Japan 2015
3 Thailand 2015
4 South
Korea
2015
5 Vietnam 2016
Figure 06: Significant M&A deals in food processing industry, 2015-2016
Source: StoxPlus
This content is intentionally removed for demo purpose

18
Contents
Section 2: Segment Analysis
2.1 Processed Seafood
2.2 Processed Meat
2.3 Milk Products
2.4 Processed Fruit & Vegetables
19
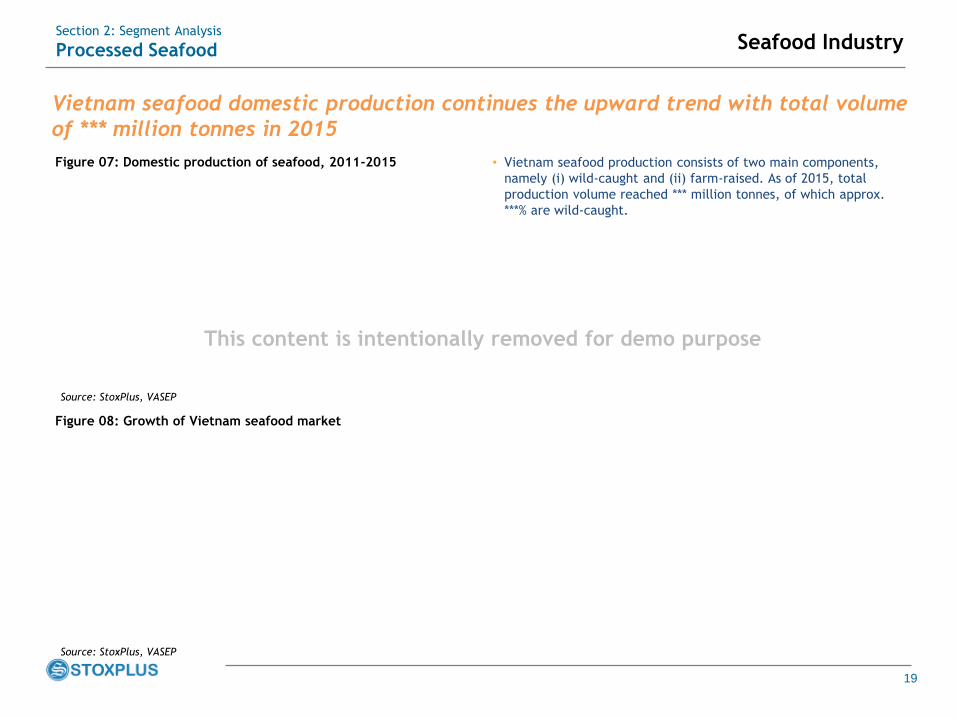
Vietnam seafood domestic production continues the upward trend with total volume
of *** million tonnes in 2015
Section 2: Segment Analysis
Processed Seafood
Figure 07: Domestic production of seafood, 2011-2015
Figure 08: Growth of Vietnam seafood market
• Vietnam seafood production consists of two main components,
namely (i) wild-caught and (ii) farm-raised. As of 2015, total
production volume reached *** million tonnes, of which approx.
***% are wild-caught.
Source: StoxPlus, VASEP
Source: StoxPlus, VASEP
Seafood Industry
This content is intentionally removed for demo purpose

20
Both imported and exported seafood are used mainly as raw materials for
reprocessing
Section 2: Segment Analysis
Processed Seafood
Figure 09: Vietnam seafood import and export value
Source: StoxPlus, General Customs
Seafood Industry
This content is intentionally removed for demo purpose

21
Section 2: Segment Analysis
Processed Seafood
Figure 10: Domestic production of processed seafood, 2011-2015
Source: StoxPlus, MARD
Supply
Domestic production of processed seafood was equivalent to ***% of total seafood
production, of which ***% went into export
This content is intentionally removed for demo purpose

22
The *** regions possess a much higher capacity as well as more diverse product
types
Section 2: Segment Analysis
Processed Seafood
Figure 11: Capacity of seafood processing companies, 2015
Source: StoxPlus, VASEP
North
Average Real Capacity/Designed
Capacity of Region
Mekong Delta
Southeast
%
Central
Types of BusinessAverage Capacity
(MT/year)
State-owned
Private/JSC
FDI
Main processed products:
Main processed products:
Main processed products:
Main processed products:
Supply
This content is intentionally removed for demo purpose

23
The concentration and high capacity of companies in *** and the *** are due to ***
Section 2: Segment Analysis
Processed Seafood
Figure 12: Distribution of seafood processing companies, 2015
Source: StoxPlus, VASEP
North
Mekong Delta
Southeast
Central
Supply
This content is intentionally removed for demo purpose

24
Most of the new factories are built in the South; however the biggest comes from
the leading player, ***, in Central Vietnam
Section 2: Segment Analysis
Processed Seafood
Figure 13: New investments in seafood processing
No Owner Type of
investment
Location Year in
Operation
Capacity Total area
(m2)
Total
Investment
(US$)
1 New 2015
2 New 2016
3 Expansion 2016
4 New 2016
5 Expansion 2018
6 New 2016
7 Expansion 2015
8 New 2016
Source: StoxPlus
Supply
This content is intentionally removed for demo purpose
25
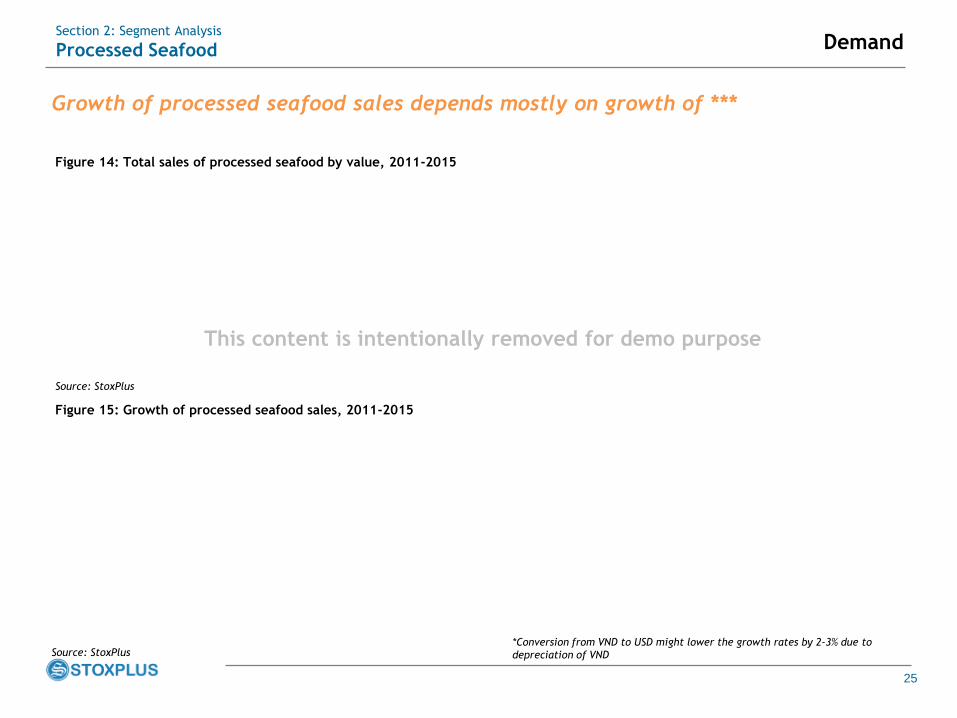
Growth of processed seafood sales depends mostly on growth of ***
Section 2: Segment Analysis
Processed Seafood
Figure 14: Total sales of processed seafood by value, 2011-2015
Source: StoxPlus
Figure 15: Growth of processed seafood sales, 2011-2015
Source: StoxPlus*Conversion from VND to USD might lower the growth rates by 2-3% due to
depreciation of VND
Demand
This content is intentionally removed for demo purpose
26
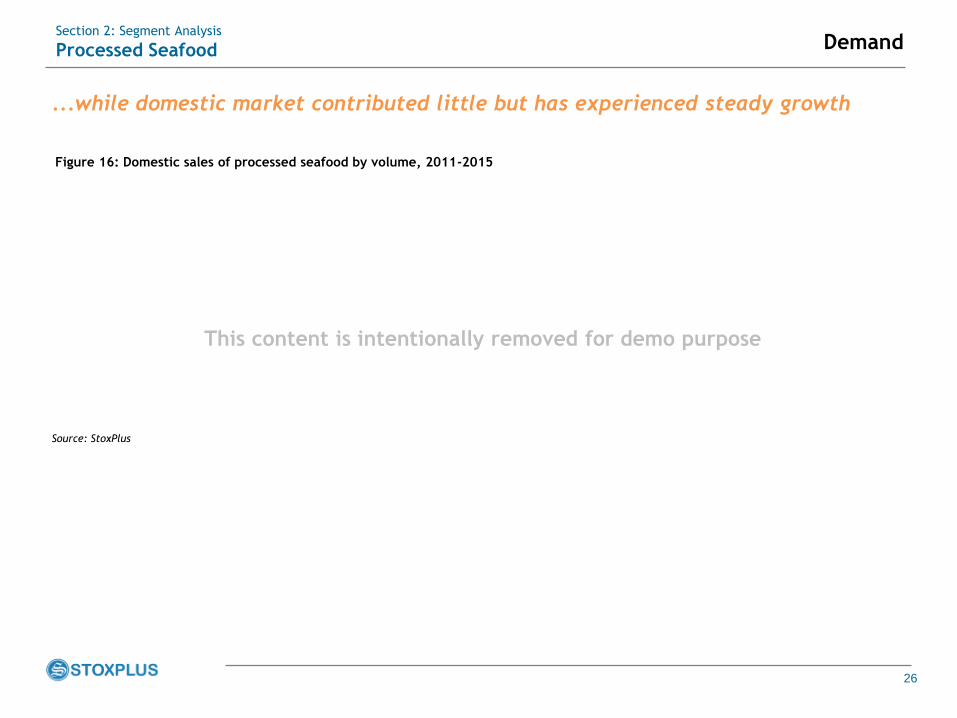
...while domestic market contributed little but has experienced steady growth
Section 2: Segment Analysis
Processed Seafood
Source: StoxPlus
Demand
Figure 16: Domestic sales of processed seafood by volume, 2011-2015
This content is intentionally removed for demo purpose

27
*** seafood are most preferred by both markets while domestic market also
consumed a relatively high amount of shelf stable seafood
Section 2: Segment Analysis
Processed Seafood
Figure 17: Breakdown of sub-segment of domestic processed
seafood by value, 2014-2015
Figure 18: Breakdown of sub-segment of export processed
seafood by value, 2014-2015
Domestic market Export market
Source: StoxPlus Source: StoxPlus
Demand
This content is intentionally removed for demo purpose

28
Section 2: Segment Analysis
Processed Seafood
Figure 19: Processed seafood value chain
Domestic
Export
Distribution
This content is intentionally removed for demo purpose
29
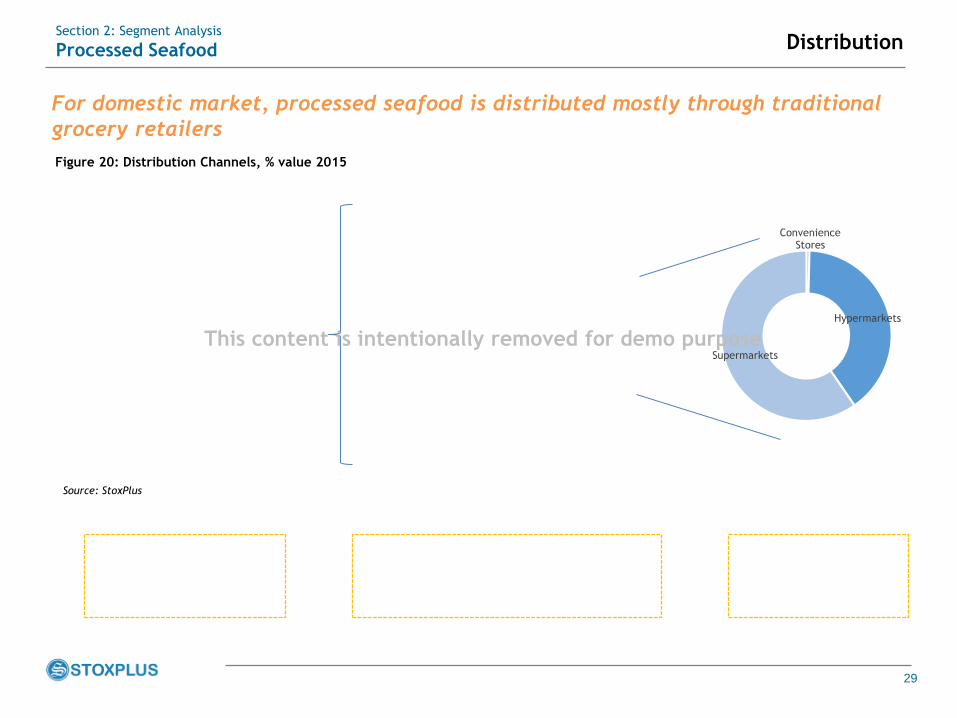
For domestic market, processed seafood is distributed mostly through traditional
grocery retailers
Section 2: Segment Analysis
Processed Seafood
Figure 20: Distribution Channels, % value 2015
Convenience Stores
Hypermarkets
Supermarkets
Source: StoxPlus
Distribution
This content is intentionally removed for demo purpose

30
Processed seafood still has great potential with the government support if supply is
adequately controlled and anti-dumping law is successfully negotiated
Section 2: Segment Analysis
Processed Seafood SWOT
WEAKNESSSTRENGTH
THREATSOPPORTUNITIES
This content is intentionally removed for demo purpose

31
DomesticExport
*** companies dominate export segment while *** is the leader in domestic with half
the market share
Section 2: Segment Analysis
Processed Seafood
Figure 21: Processed Seafood Market share, % retail value 2015
Competitive Landscape
Source: StoxPlus
This content is intentionally removed for demo purpose

32
The segment is dominated by *** with half the market share
Section 2: Segment Analysis
Processed Seafood Competitive Landscape
Export Market Import Market
This content is intentionally removed for demo purpose
33
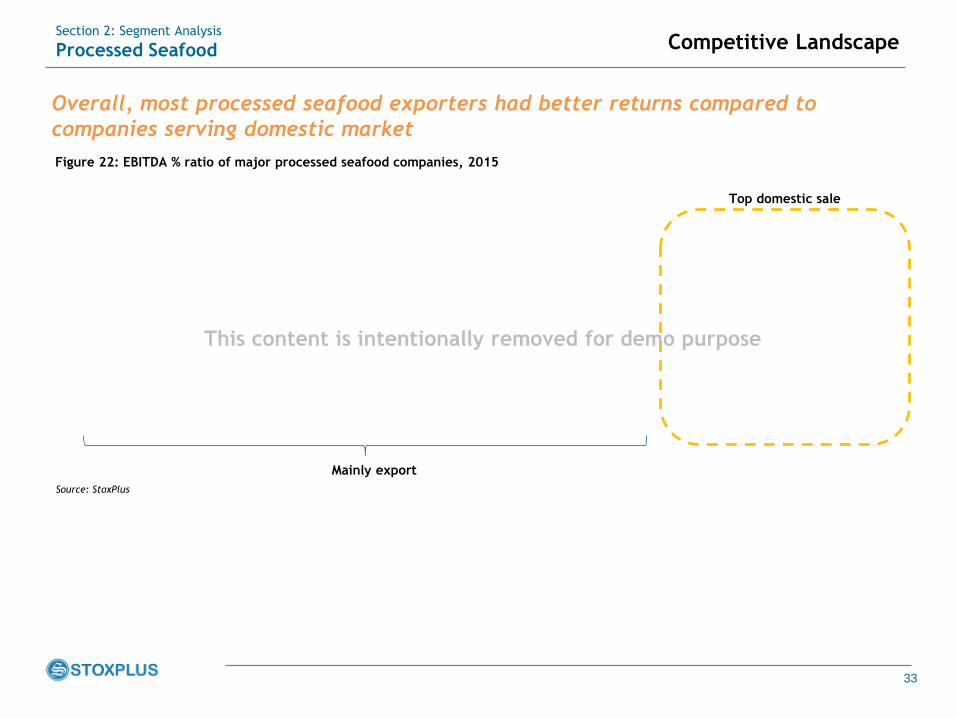
Overall, most processed seafood exporters had better returns compared to
companies serving domestic market
Section 2: Segment Analysis
Processed Seafood
Figure 22: EBITDA % ratio of major processed seafood companies, 2015
Competitive Landscape
Source: StoxPlus
Top domestic sale
Mainly export
This content is intentionally removed for demo purpose

34
Section 2: Segment Analysis
Processed Seafood
Ha Long Canned Food Joint Stock Corporation
Ownership structure
Company Profiling Products and Services
Financial highlights
Source: Reported FS
Competitive Landscape
This content is intentionally removed for demo purpose

35
Section 2: Segment Analysis
Processed Seafood
Special Aquatic Products Joint Stock Company – SEASPIMEX VIETNAM
Ownership structure
Company Profiling Products and Services
Financial highlights
Source: Reported FS
Competitive Landscape
This content is intentionally removed for demo purpose

36
Section 2: Segment Analysis
Processed Seafood
Angiang Fisheries Import Export Join Stock Company
Ownership structure
Company Profiling Products and Services
Financial highlights
Source: Reported FS
Competitive Landscape
This content is intentionally removed for demo purpose
37
Contents
Section 2: Segment Analysis
2.1 Processed Seafood
2.2 Processed Meat
2.3 Milk Products
2.4 Processed Fruit & Vegetables

38
Vietnam domestic meat production continues the upward trend with total volume of
*** million MT in 2015
Figure 23: Domestic production of meat, 2015
Figure 24: Meat import to Vietnam, 2015
• We estimated that total meat production for three categories
namely pork, poultry and beef amount to approximately *** by
2015.
Source: StoxPlus, VASEP
Section 2: Segment Analysis
Processed Meat
Source: StoxPlus, Department of Livestock (MARD)
Source: StoxPlus, Department of Livestock (MARD) from General Customs
Volume
'000 tonnesPrice
US$/kg
Market size
US$mn
Pork
Poultry
Beef & Veal
Meat Indsutry
This content is intentionally removed for demo purpose
39
Domestic production of processed meat is still at a fairly underdeveloped stage
Figure 25: Domestic production of processed meat, 2011-2015
Source: StoxPlus, MARD
Section 2: Segment Analysis
Processed Meat Supply
This content is intentionally removed for demo purpose

40
*** companies have a much bigger capacity than *** ones due to ***
Figure 26: Distribution of meat processing companies, 2015
Source: StoxPlus, MARD
Section 2: Segment Analysis
Processed Meat
Average Real Capacity/Designed
Capacity of Region
North
Central
South
Types of BusinessAverage Capacity
(MT/year)
State-owned
Private/JSC
FDI
Supply
This content is intentionally removed for demo purpose

41
Vietnam only has *** companies with industrial processing capacity of *** products
per year
Figure 27: Distribution of meat processing companies, 2015
Source: StoxPlus, MARD
Section 2: Segment Analysis
Processed Meat
Government-owned
Private/JSC
North
Central
South
Supply
This content is intentionally removed for demo purpose
42
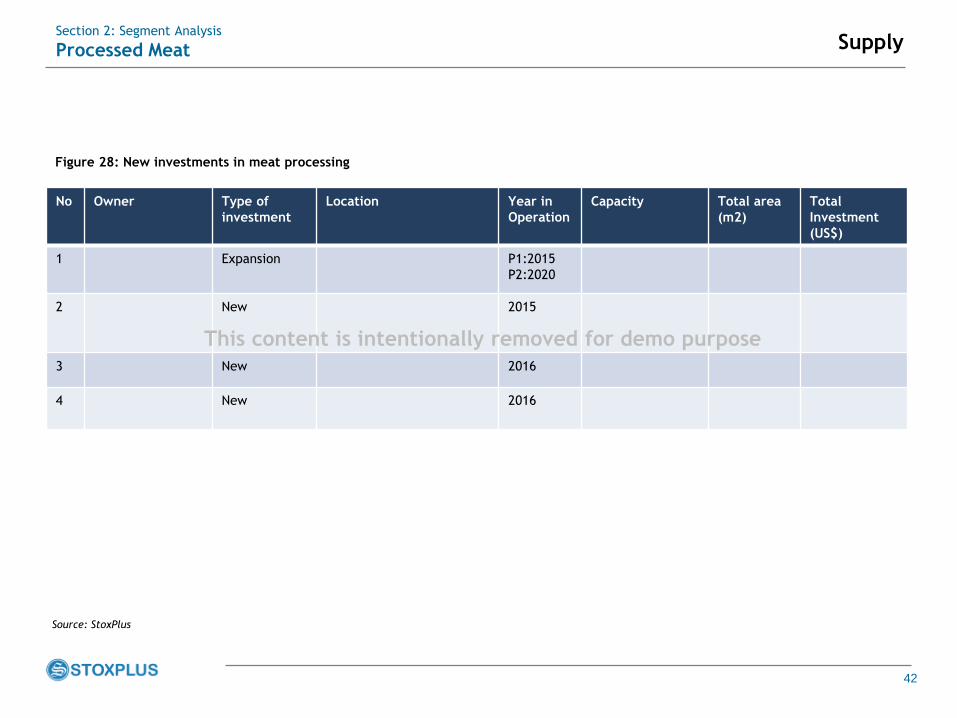
Section 2: Segment Analysis
Processed Meat
Figure 28: New investments in meat processing
No Owner Type of
investment
Location Year in
Operation
Capacity Total area
(m2)
Total
Investment
(US$)
1 Expansion P1:2015
P2:2020
2 New 2015
3 New 2016
4 New 2016
Source: StoxPlus
Supply
This content is intentionally removed for demo purpose

43
More competition resulted in *** growth rate of processed meat segment
Section 2: Segment Analysis
Processed Meat
Figure 29: Total sales of processed meat by value, 2011-2015
Source: StoxPlus
Figure 30: Total sales of processed meat by volume, 2011-2015
Source: StoxPlus
*Conversion from VND to USD might lower the growth rates by 2-3% due to
depreciation of VND
Demand
This content is intentionally removed for demo purpose

44
Shelf stable meat and chilled processed meat took up more than ***% of total value
and volume of processed meat
Section 2: Segment Analysis
Processed Meat
Figure 31: Breakdown of sub-segment of processed meat by
value, 2011-2015
Figure 32: Breakdown of sub-segment of processed meat by
volume, 2011-2015
Demand
This content is intentionally removed for demo purpose
45
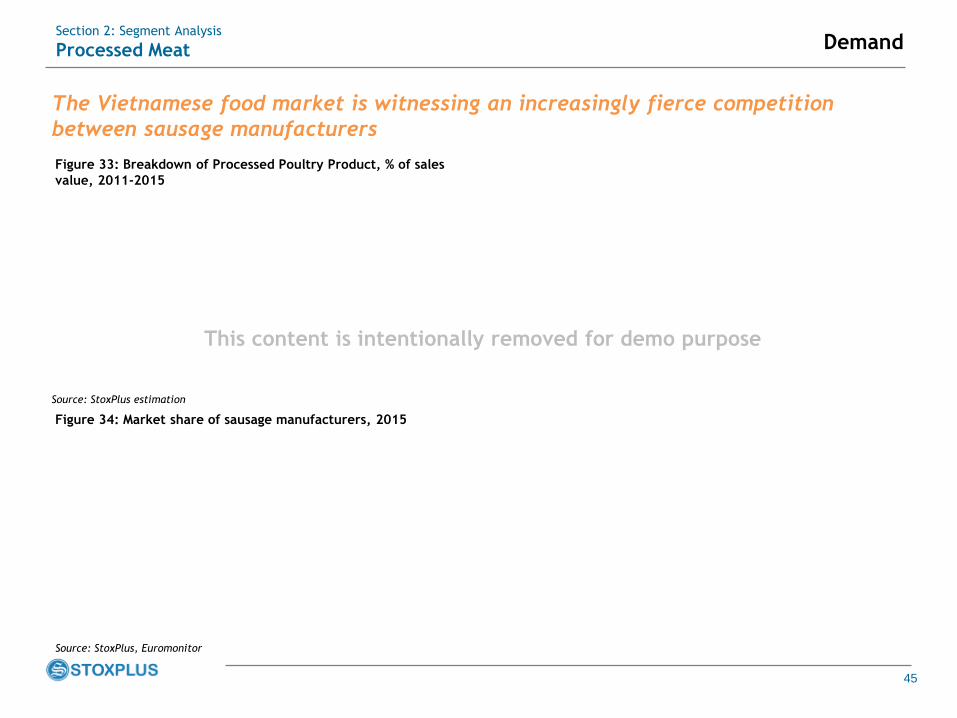
The Vietnamese food market is witnessing an increasingly fierce competition
between sausage manufacturers
Section 2: Segment Analysis
Processed Meat
Figure 33: Breakdown of Processed Poultry Product, % of sales
value, 2011-2015
Source: StoxPlus, Euromonitor
Figure 34: Market share of sausage manufacturers, 2015
Source: StoxPlus estimation
Demand
This content is intentionally removed for demo purpose

46
Vissan is a prime example showing remarkable profitability from processed meat
segment, especially in the *** category
Section 2: Segment Analysis
Processed Meat
Figure 35: Breakdown of Vissan gross profit margin structure,
9M2015
Source: StoxPlu, Vissan’s annual report
Demand
Steady and high gross profit margin
This content is intentionally removed for demo purpose

47
Section 2: Segment Analysis
Processed Meat
Figure 36: Processed meat value chain
Distribution
This content is intentionally removed for demo purpose

48
Section 2: Segment Analysis
Processed Meat
Figure 37: CP “3F” model (Feed – Farm – Food)
• All owned by CPCP Branding &
Marketing
Distribution
This content is intentionally removed for demo purpose

49
Similar to processed seafood, traditional grocery retailers is the dominating
distribution channel of processed meat
Figure 38: Distribution Channels, % value 2015
Section 2: Segment Analysis
Processed Meat
Source: StoxPlus
Distribution
This content is intentionally removed for demo purpose

50
Section 2: Segment Analysis
Processed Meat
WEAKNESSSTRENGTH
THREATSOPPORTUNITIES
SWOT
This content is intentionally removed for demo purpose

51
Figure 39: Processed meat Market share, % retail value 2015
Section 2: Segment Analysis
Processed Meat
Source: StoxPlus
Competitive Landscape
This content is intentionally removed for demo purpose
52
Section 2: Segment Analysis
Processed Meat
Domestic Companies Foreign-owned Companies
Competitive Landscape
This content is intentionally removed for demo purpose

53
Section 2: Segment Analysis
Processed Meat
Figure 40: Gross profit margin of major processed meat companies, 2014
Source: StoxPlus
Competitive Landscape
This content is intentionally removed for demo purpose

54
Section 2: Segment Analysis
Processed Meat
Vissan Co., ltd
Ownership structure
Company Profiling Products and Services
Financial highlights
Source: Reported FS
Competitive Landscape
This content is intentionally removed for demo purpose
55
Section 2: Segment Analysis
Processed Meat
Cau Tre Export Goods Processing Joint Stock Company
Ownership structure
Company Profiling Products and Services
Financial highlights
Source: Reported FS
Competitive Landscape
This content is intentionally removed for demo purpose

56
Company Profiling Production Sites
C.P Vietnam
Key financial indicators of C.P Vietnam in 2014
Source: StoxPlus
Production sites of C.P Vietnam (food processing business)
Source: Vietnam Fishery Society, Company Website
Phu Nghia – Ha Noi
• 01 food processing plant Ben Tre
• 01 seafood processing plant
Thua Thien – Hue
• 01 frozen shrimp processing
plant
Key Financials
Section 2: Segment Analysis
Processed Meat Competitive Landscape
This content is intentionally removed for demo purpose

57
Contents
Section 2: Segment Analysis
2.1 Processed Seafood
2.2 Processed Meat
2.3 Milk Products
2.4 Processed Fruit & Vegetables

58
Vietnam domestic milk production could only fulfill ***% of domestic demand,
leading to high import value of milk and milk products
Figure 41: Domestic production of milk, 2010-2015 Figure 42: Milk and milk products import to Vietnam, 2015
Source: StoxPlus, General Customs
Section 2: Segment Analysis
Milk Products
Source: StoxPlus, MARD
Supply
This content is intentionally removed for demo purpose

59
As Milk products is a concentrated industry, most factories belong to a few major
players with *** owning the most factories
Figure 43: Distribution of Milk products factories, 2015
Source: StoxPlus
Section 2: Segment Analysis
Milk Products
North
Central
South
Vinamilk
TH True Milk
Nutifood
Supply
This content is intentionally removed for demo purpose

60
Even though there are more factories in the ***, the ones in the *** have bigger
capacity since they were built more recently thus owning better technology
Figure 44: Capacity of major Milk products companies (mn liters),
2015
Source: StoxPlus
Section 2: Segment Analysis
Milk Products
North
Central
South
Total
***mn liters
Total
Total
Supply
This content is intentionally removed for demo purpose
61
To serve the growing industry, all main players in the industry continue to expand
or build new factories to increase their capacity
Section 2: Segment Analysis
Milk Products
Figure 45: New investments in Milk products
No Owner Type of
investment
Location Year in
Operation
Capacity Total area
(m2)
Total
Investment
(US$)
1
2
3
Source: StoxPlus
Supply
This content is intentionally removed for demo purpose
62
Valued at ***US$bn, Milk products is the largest food processing segment
Section 2: Segment Analysis
Milk Products
Figure 46: Total sales of Milk products by value, 2011-2015
Source: StoxPlus
Figure 47: Total sales of Milk products by volume, 2011-2015
Source: StoxPlus
*Conversion from VND to USD might lower the growth rates by 2-3% due to
depreciation of VND
Demand
This content is intentionally removed for demo purpose

63
*** dominated two thirds of the segment thanks to increasing *** consumption per
capita in the last 5 years
Figure 48: Breakdown of sub-segment of Milk products by %
value, 2011-2015
Section 2: Segment Analysis
Milk Products
Figure 49: Breakdown of sub-segment of Milk products by %
volume, 2011-2015
Demand
This content is intentionally removed for demo purpose

64
Growth was experienced across all segments with *** products having the highest
CAGR during 2011-2015 at ***%
Section 2: Segment Analysis
Milk Products
Figure 50: Breakdown of total sales of Milk products by value
(US$mn), 2011-2015
Source: StoxPlus
Demand
CAGR ***%
CAGR 12%
CAGR ***%CAGR ***%
This content is intentionally removed for demo purpose

65
Section 2: Segment Analysis
Milk Products
Figure 51: Milk products value chain
Distribution
This content is intentionally removed for demo purpose

66
Milk is distributed mainly in traditional grocery retailers…
Figure 52: Milk Distribution Channels, % value 2015
Section 2: Segment Analysis
Milk Products
Source: StoxPlus
Supermarkets and
hypermarkets share the
equally low contribution
Distribution
This content is intentionally removed for demo purpose

67
… while Yoghurt is becoming popular in modern grocery retailers
Figure 53: Yoghurt Distribution Channels, % value 2015
Section 2: Segment Analysis
Milk Products
Source: StoxPlus
Distribution
This content is intentionally removed for demo purpose
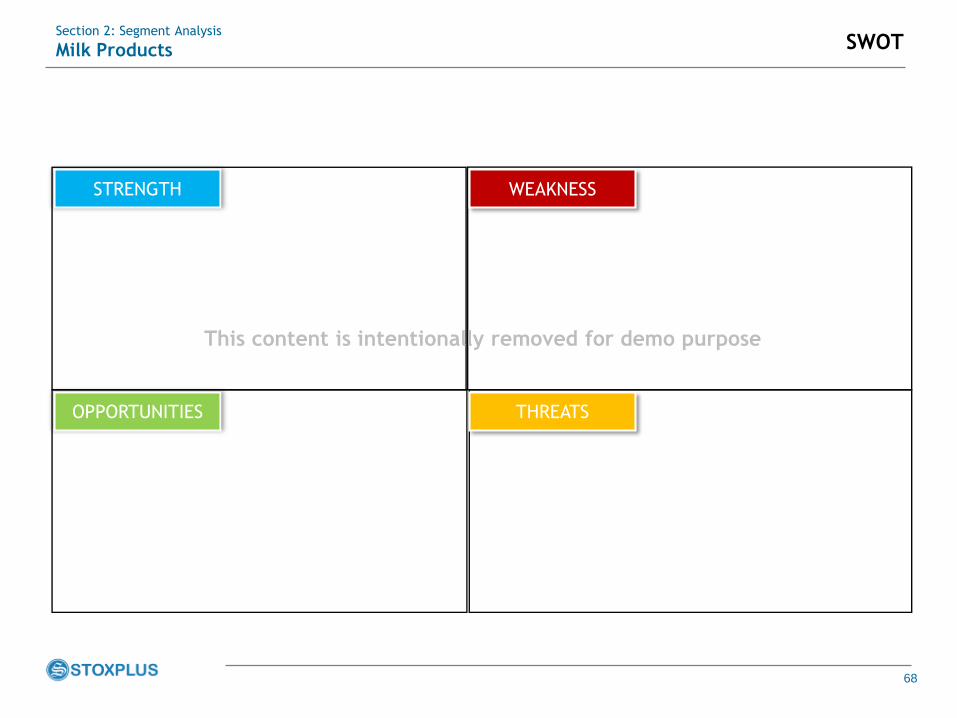
68
Section 2: Segment Analysis
Milk Products
WEAKNESSSTRENGTH
THREATSOPPORTUNITIES
SWOT
This content is intentionally removed for demo purpose
69
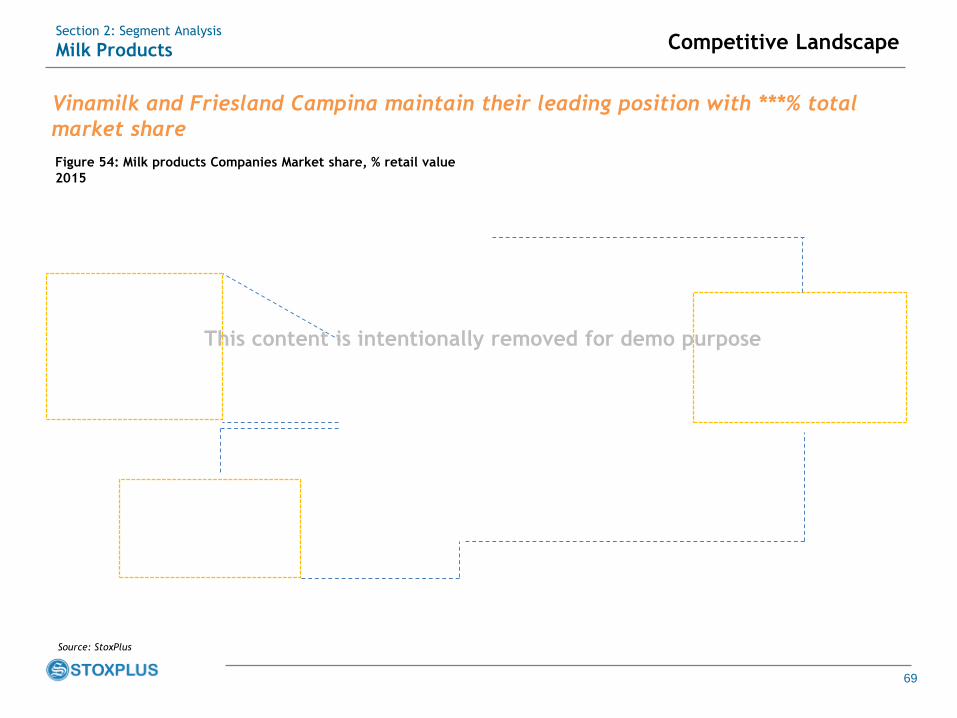
Vinamilk and Friesland Campina maintain their leading position with ***% total
market share
Figure 54: Milk products Companies Market share, % retail value
2015
Section 2: Segment Analysis
Milk Products
Source: StoxPlus
Competitive Landscape
This content is intentionally removed for demo purpose
70
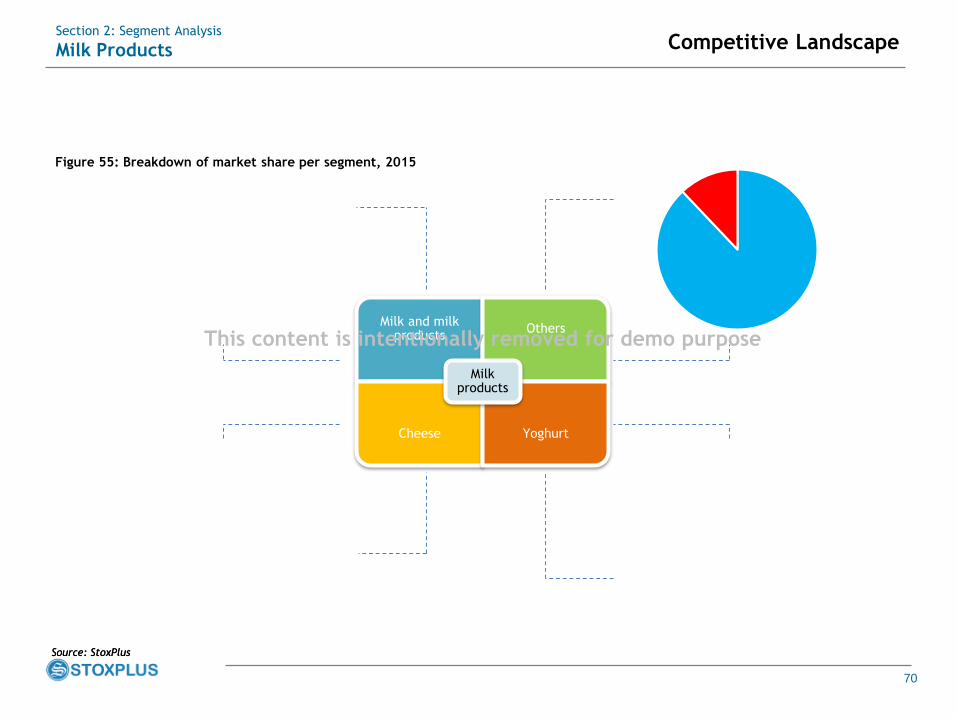
Section 2: Segment Analysis
Milk Products
Figure 55: Breakdown of market share per segment, 2015
Source: StoxPlusSource: StoxPlus
Milk and milk products
Others
Cheese Yoghurt
Milk products
Competitive Landscape
This content is intentionally removed for demo purpose

71
Section 2: Segment Analysis
Milk Products
Domestic Companies Foreign-owned Companies
Competitive Landscape
This content is intentionally removed for demo purpose
72
Section 2: Segment Analysis
Milk Products
Figure 56: Gross profit margin of major Milk products companies, 2013-
2014
Source: StoxPlus
Competitive Landscape
This content is intentionally removed for demo purpose
73
Vietnam Dairy Product Joint Stock Company (VINAMILK)
Ownership structure
Company Profiling Products and Services
Financial highlights
Section 2: Segment Analysis
Milk Products
Source: Reported FS
Competitive Landscape
This content is intentionally removed for demo purpose

74
FrieslandCampina Vietnam
Ownership structure
Company Profiling Products and Services
Financial highlights
Section 2: Segment Analysis
Milk Products
Source: Reported FS
Competitive Landscape
This content is intentionally removed for demo purpose

75
TH Food Chain Joint Stock Company (TH True Milk)
Ownership structure
Company Profiling Products and Services
Financial highlights
Section 2: Segment Analysis
Milk Products
Source: Reported FS
Competitive Landscape
This content is intentionally removed for demo purpose

76
Contents
Section 2: Segment Analysis
2.1 Processed Seafood
2.2 Processed Meat
2.3 Milk Products
2.4 Processed Fruit & Vegetables

77
Vietnam fruit & vegetables sector posts a good performance in the period 2010–
2015 with export value of US$***bn in 2015
Figure 57: Fruit & vegetables import/export value in Vietnam
Figure 58: Fruit & vegetables export volume by products
Source: Vinafruit
Section 2: Segment Analysis
Processed Fruit & Vegetables
Source: StoxPlus, General Customs
Fruit & Vegetables Industry
This content is intentionally removed for demo purpose

78
Domestic production of processed fruit & vegetables depends on the growth of
export market
Figure 59: Domestic production of processed F&V, 2011-2015
Source: StoxPlus estimation
Section 2: Segment Analysis
Processed Fruit & Vegetables Supply
This content is intentionally removed for demo purpose
79
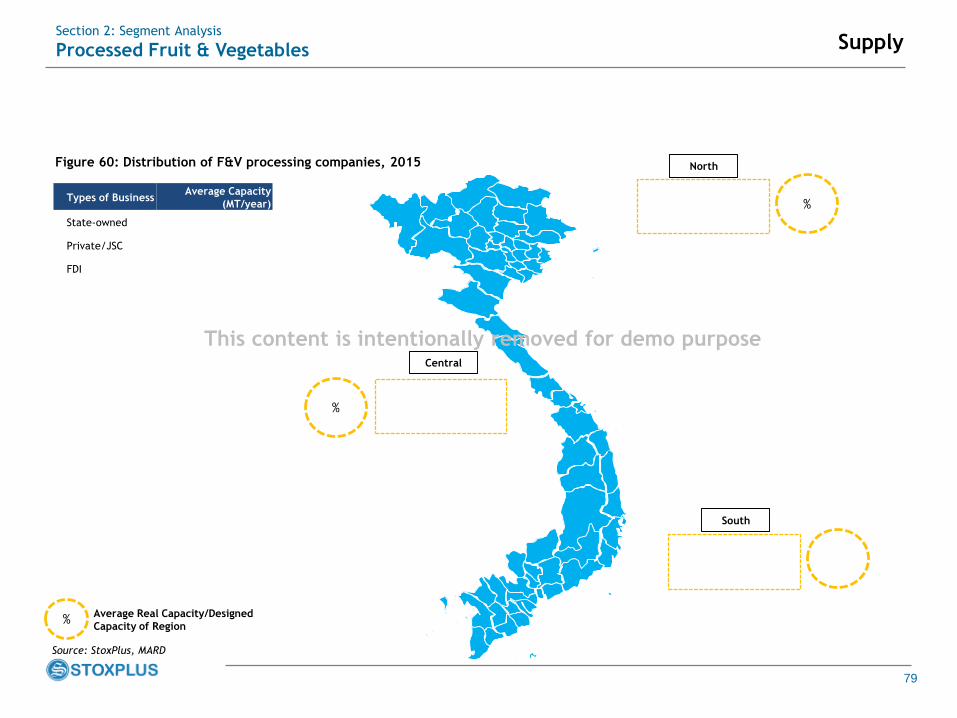
Figure 60: Distribution of F&V processing companies, 2015
Source: StoxPlus, MARD
Section 2: Segment Analysis
Processed Fruit & Vegetables
%
%
North
Central
South
Average Real Capacity/Designed
Capacity of Region%
Types of BusinessAverage Capacity
(MT/year)
State-owned
Private/JSC
FDI
Supply
This content is intentionally removed for demo purpose

80
There are only *** industrial-grade companies produce processed fruit & vegetables
in Vietnam
Figure 61: Distribution of F&V processing companies, 2015
Source: StoxPlus, MARD
Section 2: Segment Analysis
Processed Fruit & Vegetables
Government-owned
Private/JSC
FDI
North
Central
South
Supply
This content is intentionally removed for demo purpose

81
Most new investments come from companies that mainly serve the export market
Section 2: Segment Analysis
Processed Fruit & Vegetables
Figure 62: New investments in processed fruit & vegetables
No Owner Type of
investment
Location Year in
Operation
Capacity Total area
(m2)
Total
Investment
(US$)
1 New 2017
2 New 2017
3 New 2016
4 New 2017
5 New 2016
Source: StoxPlus
Supply
This content is intentionally removed for demo purpose

82
Vietnamese customers’ *** is the biggest barrier for domestic market to grow
Section 2: Segment Analysis
Processed Fruit & Vegetables
Figure 63: Domestic sales of processed F&V by value, 2011-2015
Source: StoxPlus
Figure 64: Domestic sales of processed F&V by volume, 2011-2015
Source: StoxPlus
*Conversion from VND to USD might lower the growth rates by 2-3% due to
depreciation of VND
Demand
This content is intentionally removed for demo purpose

83
The most popular products were *** due to its diverse uses
Figure 65: Breakdown of sub-segment of processed F&V by
value, 2011-2015
Figure 66: Breakdown of sub-segment of processed F&V by
volume, 2011-2015
Section 2: Segment Analysis
Processed Fruit & Vegetables Demand
This content is intentionally removed for demo purpose

84
Section 2: Segment Analysis
Processed Fruit & Vegetables
Figure 67: Processed fruit & vegetables value chain
Distribution
This content is intentionally removed for demo purpose
85
Figure 68: Distribution Channels, % value 2015
Section 2: Segment Analysis
Processed Fruit & Vegetables
Source: StoxPlus
Distribution
This content is intentionally removed for demo purpose

86
Section 2: Segment Analysis
Processed Fruit & Vegetables
WEAKNESSSTRENGTH
THREATSOPPORTUNITIES
SWOT
This content is intentionally removed for demo purpose

87
Figure 69: Processed Fruit & Vegetables Market share, % retail value
2015
Section 2: Segment Analysis
Processed Fruit & Vegetables
Source: StoxPlus
Competitive Landscape
This content is intentionally removed for demo purpose

88
Section 2: Segment Analysis
Processed Fruit & Vegetables
Domestic Companies Foreign-owned Companies
Competitive Landscape
This content is intentionally removed for demo purpose

89
Section 2: Segment Analysis
Processed Fruit & Vegetables
Figure 70: Net profit margin of major processed fruit & vegetables companies, 2013-2014
Source: StoxPlus
Competitive Landscape
This content is intentionally removed for demo purpose

90
Vietnam National Vegetable, Fruit and Agricultural Product Corporation JSC (Vegetexco)
Ownership structure
Company Profiling Products and Services
Financial highlights
Section 2: Segment Analysis
Processed Fruit & Vegetables
Source: Reported FS
Competitive Landscape
This content is intentionally removed for demo purpose

91
An Giang Fruit-Vegetables and Foodstuff Joint Stock Company (ANTESCO)
Ownership structure
Company Profiling Products and Services
Financial highlights
Section 2: Segment Analysis
Processed Fruit & Vegetables
Source: Reported FS
Competitive Landscape
This content is intentionally removed for demo purpose

92
Contents
Section 3: Macroeconomics & Regulatory Framework
3.1 Macroeconomics
3.2 Regulatory Framework

93
0%
5%
10%
15%
20%
25%
30%
Q1/05
Q2/05
Q3/05
Q4/05
Q1/06
Q2/06
Q3/06
Q4/06
Q1/07
Q2/07
Q3/07
Q4/07
Q1/08
Q2/08
Q3/08
Q4/08
Q1/09
Q2/09
Q3/09
Q4/09
Q1/10
Q2/10
Q3/10
Q4/10
Q1/11
Q2/11
Q3/11
Q4/11
Q1/12
Q2/12
Q3/12
Q4/12
Q1/13
Q2/13
Q3/13
Q4/13
Q1/14
Q2/14
Q3/14
Q4/14
Q1/15
Q2/15
Q3/15
Q4/15
Q1/16
Q2/16
GDP Growth CPI
Section 3: Macroeconomics & Regulatory Framework
Macroeconomics
Vietnamese economy to slow down after a strong year
Figure 71: Vietnam’s GDP growth (q-o-q) and CPI over the last 11 year
Source: StoxPlus, GSO
GDP Growth 1H2016
↑ 5.55%
CPI 1H2016
↑ 2.35%
Well performed
Struggled
Restructured & recovered
This content is intentionally removed for demo purpose

94
No. Country No. of projects US$mn
1 South Korea
2 Japan
3 Singapore
4 Taiwan
5 Hong Kong
6 China
7 BritishVirginIslands
8 Malaysia
9 Cayman Islands
10 Other
TOTAL
Section 3: Macroeconomics & Regulatory Framework
Macroeconomics
Foreign direct investment (“FDI”) to climb up in 1H2016
Figure 72: Registered and disbursed FDI in Vietnam, 2015-1H2016
Source: StoxPlus, MPI
Registered 1H2016
US$11.3bn (↑105%)
Disbursed 1H2016
US$7.3bn (↑15%)
Figure 73: Registered FDI into Vietnam, 1H2016
Source: StoxPlus, MPI
This content is intentionally removed for demo purpose
95
Section 3: Macroeconomics & Regulatory Framework
Macroeconomics
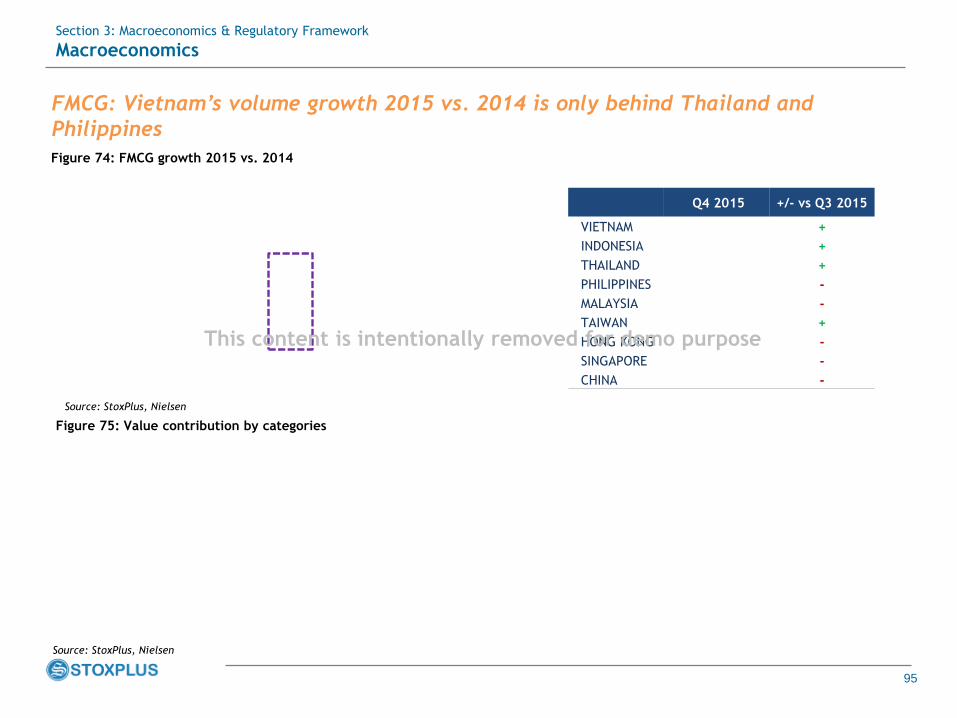
Figure 74: FMCG growth 2015 vs. 2014
Source: StoxPlus, Nielsen
Figure 75: Value contribution by categories
Source: StoxPlus, Nielsen
Q4 2015 +/- vs Q3 2015
VIETNAM +
INDONESIA +
THAILAND +
PHILIPPINES -
MALAYSIA -
TAIWAN +
HONG KONG -
SINGAPORE -
CHINA -
FMCG: Vietnam’s volume growth 2015 vs. 2014 is only behind Thailand and
Philippines
This content is intentionally removed for demo purpose

96
Contents
Section 3: Macroeconomics & Regulatory Framework
3.1 Macroeconomics
3.2 Regulatory Framework
97
Section 3: Macroeconomics & Regulatory Framework
Regulatory Framework
The government has set clear goals for segments within the food processing industry
This content is intentionally removed for demo purpose

98
Section 3: Macroeconomics & Regulatory Framework
Regulatory Framework
The government has set clear goals for segments within the food processing industry
(cont.)
This content is intentionally removed for demo purpose

99
Section 3: Macroeconomics & Regulatory Framework
Regulatory Framework
Hygiene and Food safety is becoming a main focus of regulation
This content is intentionally removed for demo purpose

100
Section 3: Macroeconomics & Regulatory Framework
Regulatory Framework
Hygiene and Food safety is becoming a main focus of regulation (cont.)
This content is intentionally removed for demo purpose

101
This page is intentionally left blank
Publishing License No. 2651 – 2016/CXBIPH/95 -47/HĐ dated on August 13th, 2016

‹#›
Contact us at StoxPlus
Lan Nguyen
Managing Director
+84 (0) 43562 69 62 (ext. 109)
+84 (0) 964 946 760
Hoang Le
Associate Research Manager
+84 (0) 43562 69 62 (ext. 109)
+84 (0) 985 152 028
Head Office
5th Floor, Anh Minh Building
36 Hoang Cau Street
Hanoi, Vietnam
+ 84 (4) 3562 6962
Ho Chi Minh City Branch
2nd Floor, May Plaza
63D Vo Van Tan Street, District 3
Ho Chi Minh City, Vietnam
+84 (8) 3823 3485