vietnam - 2030wrg · vietnam is experiencing increasing variability in water availability across...
TRANSCRIPT
AUGUST 2017Hydro-Economic Framework for Assessing Water Sector Challenges
VIETNAM
Viet Nam: Hydro-Economic Framework for Assessing Water Sector Challenges
|
Disclaimer, Rights and Permissions
The material in this work is subject to copyright. Because the 2030 WRG encourages dissemination of its
knowledge, this work may be reproduced, in whole or in part, for non-commercial purposes as long as
full attribution of this work is given.
The publication may contain advice, opinions, and statements of various information and content
providers. 2030 WRG does not represent or endorse the accuracy or reliability of any advice, opinion
statement, or other information provided by any information or content provider or any user of this
publication or other person or entity.
Any queries on rights and licenses, including subsidiary rights, should be addressed to [email protected]
or via mail to 2121 Pennsylvania Avenue N.W., Washington D.C., 20433, USA.
About 2030 Water Resources Group
The 2030 Water Resources Group is a unique public-private-civil society partnership that helps
governments to accelerate reforms that will ensure sustainable water resource management for the long
term development and economic growth of their country. It does so by helping to change the “political
economy” for water reform in the country through convening a wide range of actors and providing water
resource analysis in ways that are digestible for politicians and business leaders. The 2030 WRG was
launched in 2008 at the World Economic Forum and has been hosted by the International Finance
Corporation (IFC) since 2012.
Acknowledgments
This report is supported by 2030 WRG, in partnership with Ove Arup and Partners International Ltd
(ARUP), the Institute of Social and Environmental Transition – International (ISET) and local
Vietnamese water industry specialists. We wish to thank all the companies, organisations, institutions and
individuals that have shared their knowledge on water resources in Viet Nam to produce this report. In
particular, we acknowledge the contributions of the following individuals:
With the support of the Government of Hungary
2030 Water Resources Group: Christoph Jakob; Rochi Khemka
Primary Authors: Thomas Sagris (ARUP); Siraj Tahir (ARUP); Jennifer Möller-Gulland (Consultant);
Dr Nguyen Vinh Quang (ISET); Justin Abbott (ARUP); Lu Yang (ARUP);
Contributors: Dr Dao Trong Tu (Centre for Sustainable Water Resources Development and Adaption to
Climate Change); Dr Nguyen Van Tuan (Institute of Water Resources Planning); Dr Nguyen Ngoc Huy
(ISET); Dr Tran Van Giai Phong (ISET); Tung Nguyen (ARUP)
Peer Reviewers: Le Thi Kim Cuc (Ministry of Agriculture and Rural Development, Government of
Vietnam); Vinh Viet Nguyen (Vietnam Coffee Association); Bas Rozemuller (IFC); Hung Duy Le
(World Bank); Trinh Thi Long (WWF)
Contributors from stakeholder consultations: See Appendix A for details
Cover photo: Boats parked in the Hàn river passing through Da Nang, Vietnam (Jan 23, 2015).
Photo credit: Crhistopher Crouzet Source: http://ow.ly/eBUb30eB7CG

Viet Nam: Hydro-Economic Framework for Assessing Water Sector Challenges
|


Viet Nam: Hydro-Economic Framework for Assessing Water Sector Challenges
|
Foreword
Vietnam is experiencing increasing variability in water availability across regions and
seasons. Mitigating against the impacts of such changes requires a thorough assessment
of the water challenges and the design of multi-stakeholder solutions, grounded in sound
analytics.
Commissioned by the 2030 Water Resources Group, this analysis provides a high-level
assessment of the Vietnam water sector, aimed at assessing the water demand-supply gap,
mapping ongoing stakeholder initiatives, and identifying key private sector driven
solutions for priority areas.
With the intent of fostering greater collaboration between the public, private and civil
society on water resources management, this report aims to deepen the dialogue on
collective action within the country. It has been developed through extensive stakeholder
interviews and has been guided by a multi-stakeholder Advisory Group.
2030 Water Resources Group (2030 WRG), hosted by International Finance Corporation,
facilitates open, trust-based dialogue processes to drive action on water resources reform,
with the aim of closing the gap between water demand and supply by the year 2030.
We hope this document triggers an active dialogue between the stakeholders leading to
concrete action on water security solutions in Vietnam. We wish to acknowledge the
inputs of all the peer reviewers and contributors to this report.
Anders Berntell
Executive Director
2030 Water Resources Group


Viet Nam: Hydro-Economic Framework for Assessing Water Sector Challenges
|
Executive Summary
Viet Nam’s economic growth and social transformation over the past decades has lifted large portions of
the society out of poverty. However, it has also put pressure on sustainable resource use and
environmental protection, which is expected to put limits on future economic growth.
Building on Integrated Water Resource Management Framework (IWRM), this assignment presents a
high-level overview assessment of Viet Nam’s water sector with the aim of identifying water demand
reduction solutions to accelerate water sector transformation in Viet Nam regarding water security for
long-term economic growth, meeting environmental and domestic needs and enabling shared prosperity.
The analysis focuses on four river basins, which jointly generate approximately 80% of Viet Nam’s GDP,
namely, the Red Thai Binh, Mekong, SERC and Dong Nai river basins.
Key identified challenges include:
1. The river basins generating 80% of Viet Nam’s GDP are all expected to face ‘water stress’ in the
dry season by 2030. SERC river basin, a severely water stressed basin, it is even expected to not be
able to meet 28% of water demand in the dry season by 2030 (See Figure 1Error! Reference
source not found.).
Figure 1. Left: Water exploitation index (WEI) for Viet Nam's four key economic river basins;
Right: SERC river basin dry season water supply-demand gap
2. Over-exploitation of Viet Nam’s unmonitored groundwater resources, results in falling
groundwater levels, which caused land subsidence in Hanoi, Ho Chi Minh City and Da Nang, and
localised water shortages in the dry season, e.g. the Mekong, where 50% of Vietnam’s rice is
produced, and in the Central Highlands, where 88% of Viet Nam’s coffee is grown. Saline
intrusion to aquifers further reduces agricultural productivity in the Mekong and Red River.
3. Viet Nam’s surface waters face serious pollution, with only 10% of the municipal and industrial
wastewater treated. Rivers in and around major cities are considered ‘dead rivers’ – increasing
groundwater dependence and over-extraction. Untreated wastewater is used for irrigation
downstream, with unforeseen public health implications.
4. Aging water supply infrastructure and illegal connections reduces the availability of potable water
in cities.
5. Rapid expansion of hydropower in Viet Nam causes water sharing conflicts and issues related to
dam safety of small dams, potentially worsening water stress in the dry season. Further, reduced
sediment loads in rivers endangering Viet Nam’s agricultural productivity.
6. Drought events are increasing in frequency and severity impacting livelihoods and agricultural
production. The recent El Nino event between 2014 and 2016 caused the most severe drought Viet
Nam experienced in 90 years, severely impacting livelihoods and the economy.

Viet Nam: Hydro-Economic Framework for Assessing Water Sector Challenges
|
To identify the most cost-effective solutions to close the identified water supply-demand gap in SERC
and to move the Red Thai Binh, Mekong, SERC and Dong Nai river basins to a low water stress status
and to receive a high level estimate on overall costs, 24 measures (agricultural, municipal and industrial)
were reviewed for each river basin (refer to Figure 2Error! Reference source not found.). The analysis
focuses on water efficiency measures; water supply augmentation solutions were not assessed.
Figure 2: Overview of water
demand reduction requirements in
key economic river basins and
associated high level costs
In the Mekong river basin, agricultural measures alone, such as Alternative Wet and Dry (AWD) rice
management and use of quotas, were required to achieve the targeted reducing in water stress. It was
found that a combination of agricultural, such as AWD rice management, municipal, such as leakage
reduction, and industrial measures, such as industrial wastewater treatment, were the most cost-effective
combination for Dong Nai and Red-Thai Binh river basins. The situation in SERC river basin, however, is
so grave that all analyzed 24 measures were insufficient to achieve the targeted water stress level. It is
suggested that potential water supply augmentation measures are investigated.
Further, four deep dives were made for measures which, based on stakeholder consultations, were deemed
to have the highest impact, with following findings:
• Irrigation scheduling, which causes ‘induced water stress’ for coffee has the potential to reduce
total coffee water demand in the groundwater stressed Central Highlands by up to 25% or 577 mn
m3/yr. Coordination of already active stakeholders to support in overcoming challenges to a
widespread adoption is recommended.
• Alternate wet and dry (AWD) rice management practices reduce water demand for Viet Nam’s
most water intensive crop by 30% (up to 20 billion m3) while offering a business case for farmers in
increasing profits. Avenues to support the government in achieving and surpassing its goal to apply
AWD on an area of 1 mn ha can be explored.
• Reusing treated municipal wastewater has the potential to reduce Ho Chi Minh City’s water stress
to ‘low stress’ level by 2030. The potential of effluent reuse for non-potable water use is up to 3.7 mn
m3/d. The additional cost of upgrading the planned wastewater treatment works to meet suitable non
potable water standards is estimated at $0.25/m3. Areas on supporting the government in drafting
required regulation and in enabling investments from public and private organisations as PPP
arrangements can be explored.
• Treating wastewater from industrial clusters along the Nhue-Day River close to Hanoi can
considerably improve surface water quality. This would involve the treatment of 22 mn m3/yr of
industrial wastewater; the associated cost of the CETPs has been previously estimated at $97 mn

Viet Nam: Hydro-Economic Framework for Assessing Water Sector Challenges
|
(2010). Opportunities with MONRE, MARD, MOC and MOIT to improve the legal framework and
enforcement can be explored, as well as with infrastructure development companies on
commercialising CETPs and industrial water reuse systems.
The implementation of the recommended solutions, requires an integrated response by MARD, MoNRE,
MoST, People’s Committees, the Farmers Unions, as well as Private Enterprises and International
Organisations. An ad-hoc implementation of solutions may result in structural inefficiencies as well as
conflicting outcomes. The backbone of Viet Nam’s water sector transformation lies in addressing key
governance challenges to incentivise and enforce fundamental requirements for sustainable water
resource management, including:
1. Strengthening of IWRM by creating and implementing IWRM plans at river basin level;
2. Revision of economic and regulatory instruments, such as water prices, pollution charges and fines
to incentivise sustainable water resource management;
3. Amendment of existing laws and regulations to close loopholes for water users and polluters and
to allow for new solutions, such as treated wastewater reuse.
4. Enforcement of laws and regulations by demonstrating political will, building provincial
governments’ capacity and delivering the Government’s initiative of monitoring discharges online;
5. Coordination of roles and responsibilities across Ministries and Departments to avoid conflicting
roles, to enable management at river basin level and to facilitate data sharing within government
agencies and with the public to allow for informed decision making; and
6. Provision of technical support and capacity building locally to ensure sustainable and long-term
implementation of solutions.
Following IWRM principles, a strong coordination between the private and public sector, as well as civil
society is required. While the public sector will take the lead in institutional changes, such as amending
laws, regulations and economic and regulatory instruments, input from the private sector and civil society
should be considered. Private sector and civil society can play a leading role in providing technical
support and building capacity at the local level, e.g. via sustainable supply chain initiatives. Further, the
private sector is critical in contributing to innovative financing mechanisms, infrastructure provision and
information technology.


Viet Nam: Hydro-Economic Framework for Assessing Water Sector Challenges
|
Contents Page
Executive summary
Contents
Abbreviations
1 Introduction 1
1.1 Objectives of the assignment 1
1.2 Approach 1
1.3 Multi-stakeholder consultations 1
2 Viet Nam: In context 3
3 Setting the scene: Water management in Viet Nam 4
3.1 Institutions and governance 4
3.2 Viet Nam: National overview 8
4 Main challenges and implications 14
4.1 Water stress and water shortages 14
4.2 Water pollution 17
4.3 Climate change 19
4.4 Institutional issues 20
4.5 Implications of Viet Nam’s water challenges 21
5 On-going water initiatives 24
5.1 Focus area: water supply 25
5.2 Focus area: wastewater treatment 26
5.3 Focus area: agriculture 27
5.4 Focus area: climate change 27
6 Key solution areas 28
6.1 Good governance and institutional solutions 28
6.2 Technical solutions on river basin level 30
6.3 Assessment of cost effective solutions at key river basins 31
6.4 Solution delivery 35
7 Deep dives 40
7.1 Alternate wet and dry rice management practice 40
7.2 Enabling water efficiency for coffee production in the Central Highlands 44
7.3 Municipal wastewater treatment and reuse in Ho Chi Minh City 47
7.4 Industrial wastewater treatment around Hanoi 51
8 Conclusions and recommendations 55

Viet Nam: Hydro-Economic Framework for Assessing Water Sector Challenges
|
Appendices
Appendix A
List of stakeholders consulted
Appendix B
Map of river basins
Appendix C
Institutions and governance
Appendix D
Data used in the water demand assessment
Appendix E
Water demand, water gap and Water Exploitation Index
Appendix F
Water pollution challenges and regional water quality
Appendix G
List of ongoing initiatives
Appendix H
Interventions
Appendix I
Ma River Basin - Water gap
Appendix J
References

Viet Nam: Hydro-Economic Framework for Assessing Water Sector Challenges
|
Abbreviations
2030WRG 2030 Water Resources Group
ADB Asian Development Bank
ADM Archer Daniels Midland
AFD French Development Agency
ANCP Australian NGO Cooperation Program
AusAID Australian Agency for International Development
AWD Alternate Wetting and Drying
BOD Biochemical Oxygen Demand
BTC Belgian Development Agency
CECR Centre for Environment and Community Research
CEFACOM Center for Health Research and Development
CERETAD Centre for Research, Training and Development of Health Human Resource
CETP Centralised Effluent Treatment Plant
CIRAD French International Agricultural Research Centre for Development
COD Chemical Oxygen Demand
DANIDA Danish International Development Agency
DARD Department of Agriculture and Rural Development
DoC Department of Construction
DoF Department of Finance
DoH Department of Health
DoIT Department of Industry and Trade
DONRE Department of Natural Resources and Environment
DoST Department of Science and Technology
DoT Department of Transport
DPI Department of Planning and Investment
FAO Food and Agriculture Organization
FDC Finland Development Cooperation
FDI Foreign Direct Investment
GDP Gross Domestic Product
GIZ German International Development Agency
GoV Government of Viet Nam

Viet Nam: Hydro-Economic Framework for Assessing Water Sector Challenges
|
HCMC Ho Chi Minh City
HueWACO Thua Thien Hue Water Supply Company
HUNRE Hanoi University of Natural Resources and Environment
IBRD International Bank for Reconstruction and Development
IDA International Development Association
IDC Infrastructure Development Companies
IFC International Finance Corporation
IRRI International Rice Research Institute
IUCN International Union for Conservation of Nature
IWMI International Water Management Institute
JICA Japan International Cooperation Agency
MACC Marginal Abatement Cost Curve
MARD Ministry of Agriculture and Rural Development
MCD Centre for Marine life Conservation and Community Development
MLD Megalitres per day
MONRE Ministry of Natural Resources and Environment
MoC Ministry of Construction
MoF Ministry of Finance
MoH Ministry of Heath
MOIT Ministry of Industry and Trade
MONRE Ministry of Natural Resources and Environment
MoST Ministry of Science and Technology
MoT Ministry of Transport
MPI Ministry of Planning and Investment
MOPS Ministry of Public Security
MW Megawatt
NAWASCO Nghe An Water Supply Company
NOMAFSI Northern Mountainous Agricultural and Forestry Science Institute
NRW Non Revenue Water
NGO Non Governmental Organisation
OECD Organisation for Economic Co-operation and Development
OEPIW Order on exploiting and protecting irrigation work

Viet Nam: Hydro-Economic Framework for Assessing Water Sector Challenges
|
ODA Official Development Assistance
PPC Provincial People’s Committee
PPP Public Private Partnership
SAWACO Saigon Water Corporations
SDC Swiss Development Agency
SECO State Secretariat for Economic Affairs, Switzerland
SERC South East River Cluster
SIDA Swedish International Development Cooperation Agency
SNV Netherlands Development Organisation
SOE State Owned Enterprises
SRI System of Rice Intensification
TSS Total Suspended Solids
WEI Water Exploitation Index
WEPA Water Environment Partnership in Asia
WRL Water Resources Law
WWTW Wastewater Treatment Works
UNDP United Nations Development Programme
UNHABITAT United Nations Human Settlements Programme
USAID United States Agency for International Development
VEPA Viet Nam Environment Protection Agency
WB World Bank
VIUP Viet Nam Institute of Urban and Rural Planning
VND Vietnamese Dong
VNMC Viet Nam National Mekong Committee


| | 1
1 Introduction
2030WRG (www.2030wrg.org) is a public-private-civil society partnership that supports governments to
accelerate reforms with the aim to ensure sustainable water resources management for the long-term
development and economic growth of partner countries. 2030WRG supports the water sector
transformation through convening a wide range of actors and providing comprehensive water resources
analysis in ways that are digestible for politicians and business leaders.
Viet Nam is a country, which faces diverse water-related challenges whilst experiencing strong economic
growth. To respond to these challenges, a partnership between the Government of Viet Nam, 2030WRG
and the private sector is currently being explored.
In order to support all interested parties in identifying and aligning joint initiatives to work towards
sustainable water resource management which enable long-term economic growth, an “Analysis of the
water sector in Viet Nam” was commissioned to an international team comprising of Arup, the Institute of
Social and Environmental Transition – International (ISET) and local Vietnamese specialists.
1.1 Objectives of the assignment
The objective of the assignment is to conduct a high-level overview assessment of Viet Nam’s water
sector, with the aim of identifying water demand reduction solutions to drive economic growth (across
sectors including agriculture, industry, urban development).
2030 WRG aims to accelerate water sector transformation in Viet Nam with regard to water security for
long-term economic growth, meeting environmental and domestic needs and enabling shared prosperity.
With this objective, a multi-stakeholder Advisory Board was established to guide the current analysis, in
order to identify the water demand-supply gap, on-going initiatives, and cost-effective and technically
feasible solutions to close the gap.
1.2 Approach
The assignment approach comprises three main activities:
• Technical analysis based on recent robust scientific data to assess the overall water resources
situation and identify interventions to optimise water use;
• Extensive stakeholder consultations with the public and private sectors, non-governmental
organisations, development agencies and academia to obtain information on the water sector
challenges in Viet Nam and on-going water initiatives;
• Workshop to communicate findings, identify common issues and possible joint opportunities.
1.3 Multi-stakeholder consultations
Extensive field work was conducted including interviews and discussions with approximately 30 key
stakeholders. The stakeholders included government ministries and organisations, the private sector, non-
governmental organisations (NGOs), international organisations and academia. Stakeholders were
identified based on their influence on the water sector in Viet Nam and their vulnerability with respect to
future water resource challenges.
The interviews focused on exploring:
• Stakeholders’ roles and responsibilities related to water resource management
• On-going and recent water initiatives and programmes

| | 2
• Risks, barriers and opportunities related to water resource and water demand management in Viet
Nam
• Stakeholders’ views on possible solutions to identified risks
The list of stakeholders consulted is included in Appendix A.
Following the completion of this report, a high-level conference will be organised with key decision
makers from the public and private sectors and the civil society, in order to map the potential next steps of
2030WRG’s involvement in Viet Nam.

| | 3
2 Viet Nam: In context
The Socialist Republic of Viet Nam, home to 92 mn people, had a GDP of $159.2 bn in 2015, which
equates to $1,735 GDP per capita, and an estimated GDP growth rate of 10.6%.1
In 1986 the Government of Viet Nam (GoV) enacted ‘Doi Moi’ (renovation), which embraced economic
liberalisation policies including structural reforms to develop more competitive trade and export-driven
industries.2 Since then, the country has made huge strides in alleviating poverty and is now a middle-
income country. The central government still holds tight control over the economy with 40% of GDP
coming from State Owned Enterprises (SOE), though 500 SOEs were equitised by the end of 2015.3 Viet
Nam has been a member of the World Trade Organization since 2007 and joined the Trans-Pacific
Partnership free trade negotiations in 2010.4
Viet Nam’s geographic position near global supply chains, the growing consumer market, the pro-
business economic reforms and expected benefits from the completion of the Trans Pacific Partnership
combined with foreign investors’ desire to diversify manufacturing away from China has led to a steady
level of $17 bn/yr of Foreign Direct Investment (FDI) for the last five years. Korean and Japanese firms
have led the foreign investment pack. Investment and economic development challenges remain
significant, including weak legal infrastructure, low technical capacities, shortage of skilled labour, land
use limitations, unclear and bureaucratic decision-making, infrastructure needs, and uncertainties about
access to reliable and affordable energy in the future.
Foreign investment trends are dominated by manufacturing with an emphasis on high technological
content. Investment in infrastructure has also seen increases, including power generation, roads, railways,
and water treatment. Nonetheless, Viet Nam’s rapid growth in recent years has outpaced its infrastructure,
leading to major constraints to continued growth and investment. An estimated $200 bn investment in
new roads, bridges, ports, water sanitation, power, and other infrastructure is required to sustain growth
between now and 2020.5 While the population is shifting from rural to urban living and FDI is leading to
industrial growth, 48% of the labour force is still engaged in agriculture, 21% in industry and 31% in
services (2012).6
The impressive economic growth and dramatic changes in society have resulted in significant challenges
and growing disparities, which if left unchecked, could severely compromise the country’s sustainable
development. The Socio-Economic Development Strategy 2011-2020 calls for ‘breakthroughs’ in
structural reforms, environmental sustainability, social equity and macroeconomic stability to allow Viet
Nam to lay the foundations for a modern, industrialised society by 2020.7
With regard to water management Viet Nam is divided in 16 main river basins. Four river basins account
for approximately 80% of Viet Nam’s GDP – the Red -Thai Binh (25%), the Mekong Delta (17%), the
Dong Nai (28%) and the South East River Cluster SERC (10%).8 A location map of all basins is included
in Appendix B.


| | 4
3 Setting the scene: Water management in Viet Nam
3.1 Institutions and governance
Viet Nam is a single-party socialist republic country officially established in 1945. The country
administratively comprises of 63 provinces and cities, with Hanoi being the capital. The National
Assembly, "the highest organ of state power" according to the country’s Constitution, is elected once
every five years.
3.1.1 Institutional setting
Viet Nam has shifted its approach towards Integrated Water Resource Management (IWRM) when the
Law on Water Resources was enacted in 1998. As this law revealed many weaknesses, and for example,
did not regulate key aspects of water resource management, such as the protection of water resources, it
was revised in 2012 to meet Viet Nam’s new development policies and to be in line with the global
development context.i
A dedication towards IWRM is also reflected in the Approval of the National Strategy on Water
Resources to 2020 (Decision 81/2006/QD-TTg) which states that ‘water resource management must be
implemented in an integrated manner on a river basin basis’.
However, water resources are still mostly managed within the boundary of individual sectors and
provinces; as opposed to an integrated river basin management system. Viet Nam has – as part of the
Mekong River Commission – officially established the Mekong River Basin Committee.9 Since 2016, the
government and relevant ministries have discussed the establishment of another six major river basin
management committees. None has been officially launched to date, however, a committee in Sesan
Srepok River Basin, has been piloted by MONRE. Recently, the Da Nang city and the Quang Nam
province also established a joint committee to initiate dialogue on Vu Gia – Thu Bon river basin.
i DWR (2015) IWRM and National Water Resources Protection Policy. Accessible under:
http://dwrm.gov.vn/index.php?language=vi&nv=news&op=Hoat-dong-cua-Cuc-Tin-lien-quan/QUAN-LY-TONG-HOP-TAI-
NGUYEN-NUOC-VA-CHINH-SACH-BAO-VE-NGUON-NUOC-QUOC-GIA-4172

| | 5
3.1.2 Organisational structure of Viet Nam’s water management
Water resources management in Viet Nam is organised at four administrative levels of national,
provincial/city, district and commune. The basic institutional and organisational structure of water
resource management in Viet Nam is shown in Figure 3 with further details on each entity in Appendix C.
Figure 3. Organisational and Institutional structure of Viet Nam's water and wastewater sector
In summary, ministries, ministerial-level agencies and other agencies attached to the Government are
responsible for water resources management at national level and for the water management in large river
basins, reservoirs, industrial zones and factories.
People’s Committees at provincial/city and district levels and their attached agencies/divisions are
responsible for water resources management within localities, water management in medium-size
industrial zones and enterprises and the response to water-related incidents.
Clean water supply, irrigation and drainage companies, water professional associations and groups of
water users are also stakeholders in water and wastewater management.
3.1.3 Relevant laws and regulations, licenses and permits
Viet Nam’s key water policies and legal framework and their development over time are introduced in
Table 1. The first law on water resources, the most important legal document on water resources, was
issued in 1998, brought into force in 1999 and revised in 2012/13. Over 300 regulations have been used to
establish water policy at the national and subnational level.10

| | 6
Table 1. Viet Nam's key legal and regulatory framework related to water
Milestone Description
1999 Law on Water Resources
2000 Rural Water Supply and Sanitation Strategy to 2020
2001 Law on use and protection of irrigation systems
2004 Decree on licensing for exploitation of water resources
2005 Law on Environmental Protection
2006 National strategy on water resources to 2020
Establishment of Environmental Police
2009 Partial privatisation of water supply (socialisation or equitisation)
2011 Third revision of Water Resources and Sanitation Strategy to 2020 and Vision to
2050
2012 Principles and methods for calculating water supply fee
2013 Revised Law on Water Resources
2014 Policies and measures for mobilising funding to invest in water supply, waste water
sewage
Revised Law on Environmental Protection
Decree on drainage, sewage and waste water treatment
2015 Decree on waste and materials management
2016 Adjusted decree on payment for environmental service: increased fee of PES for
hydropower and water supply
2017 Law on Hydraulic / Irrigation Works (drafted and shared for comments since
March 2015)11
Irrigation Law (approved 19 June 2017)
Source: Authors and adopted from Nella Canales Trujillo et al (2015).12
Waste discharge activities and irrigation work systems (IWS) must be licensed by an authorised
government office (Article 37 WRL, Article 26 OEPIW), and are regulated by the Water Resources Law
(WRL), the Order on Exploiting and Protecting Irrigation Work (OEPIW), and the Decrees on drainage,
sewage and wastewater management and on waste and materials management. The latter, states that
‘wastewater must be collected, treated, re-used or transferred to functional units suitable for re-use or
treatment up to environmental technical standards before being discharged into the environment’ (Article
4). Industrial zones are obliged to have wastewater treatment systems to treat the entire wastewater
generated from operations. Companies outside of industrial zones must also have wastewater collection
and treatment systems (Article 37).
Up to 2011 water resource planning in Viet Nam focused on surface water resources with relatively minor
consideration of groundwater and groundwater resource protection. According to the 1999 Law on Water
Resources, permits are required for groundwater supply units and industrial wells. Recognition of
dwindling supplies and deteriorating quality has led the Prime Minister to issue Decision 1251/QD-TTg
in September 2008 and Decision 2065/QD-TTg in November 2010.13 Decision 1251 approves water
supply planning in key economic zones14 in three Northern, Central and Southern ecological regions,
calling for reasonable use of groundwater. Decision 2065 also approves water supply planning in the key
economic zones in the Mekong region including step-by-step reductions in groundwater use, with
cessation of groundwater exploitation in key economic zones by 2020.
The Government of Viet Nam grants the following types of water resources licenses and permits: 1)
Licence for underground water exploration; 2) Permit for surface water exploitation and use; 3) Licence
for exploitation and use of underground water; 4) Licence for sea water exploitation and use; and 5)
Licence for discharge of wastewater into water sources (Article 15, Decree 201/2013/ND-CP).
| | 7
3.1.4 Economic and regulatory instruments
Viet Nam’s economic instruments for charging organisations and individuals that use water and water
surface area, discharge wastewater into water sources, and violate water-related regulations are described
below. Applications of those instruments vary at different scales (national, subnational) and water uses.
Fee for domestic clean water: Circular 88/2012/TT-BTC of Ministry of Finance stipulates that
organisations and individuals using clean water for domestic purposes supplied by a water supply
company are charged based on the volume of water used measured by a water meter. The fee is paid
directly to the company.
Fee for industrial water uses: Organisations and industries can – depending on their location - receive
water from the water supply company or from the irrigation works. If they receive water from the water
supply company, the Provincial People’s Committee will – after consultation with the company - decide
the level of the fee (Circular 75/2012/TTLT-BTC-BXD-BNNPTNT). If water is supplied from the
irrigation works, the fees are described in Decree No. 67/2012/ND-CP.
Fee for water use from irrigation works: Water from the irrigation works is used for agricultural
activities, including aquaculture, as well as for non-food production or industrial purposes. Fee related to
this source of water includes fee / tariff for water resources use and costs for the operation and
management of the irrigation works.
Those using water from the irrigation works for agricultural activities pay the irrigation and drainage
management company based on irrigated area of crops; those using water from the irrigation works for
non-food production or industrial purposes pay based on volume of water consumed. These are stipulated
in Decree 67/2012/ND-CP of the Government.
However, in 2013 the Ministry of Finance issued Circular 41/2013/TT-BTC15, which exempted basically
all users from the irrigation fee, i.e. making irrigation water free to use.16 Farmers only had to manage and
pay for connecting their fields to the irrigation system.
Following discussions among scientists and relevant ministries on the inefficiency of the recent irrigation
fee policy (corruption issues and the heavy burden on the state budget)ii,17, a new Irrigation Law was
passed by the National Assembly on June 19, 2017.iii
The law introduced that irrigation services now need to be paid for by the users. Irrigation prices will
comply with the provisions stated in the Law of Price and shall include management costs, operation and
maintenance expenses, depreciation charges, and other reasonable actual expenses and allow for profits
which are deemed suitable to the marketplace. The affordability if the users to pay for irrigation products
and services will be considered when setting the price level. The state shall determine the price of
irrigation services and products and the roadmap for adjusting these is already approved by the competent
state agencies (Article 34).
Fee for wastewater discharge and environmental protection: Organisations and individuals, aside
from identified exempt cases18, pay for the treatment of discharged wastewater. The payment, besides an
annual fixed amount, is calculated based on volume of water used (for domestic consumption) and
pollution content of their discharge, in particular, for industrial, agricultural and service activities. Water
ii Operation costs—including personnel salary, management fees, irrigation (and discharge) system maintenance fee, pumping costs, etc.—of irrigation service companies are largely covered by the state budget. The costs for each company are calculated based on
agricultural areas the company can provide sufficient water for cropping. But in fact the companies do not provide enough water as
planned and/or the quality of service is lower than the budget allocated to them. The ask-and-give mechanism, poor/weak monitoring system and collusion (between budget provider and the irrigation companies) allow the companies to claim more than
what they provide. Cases have been exposed in Hanoi, Thanh Hoa, Gia Lai and Quang Ngai. iii The reference number of the Irrigation Water Law is 08/2017/QH14.

| | 8
supply and drainage companies, together with provincial, district and commune people’s committees, are
responsible for collecting the charges. These are then submitted to the state treasury and used for
environmental protection activities. This is promulgated in Decree 154/2016/ND-CP of the Government.
Fines on water pollution: MONRE/ DONRE in cooperation with the Environmental Police, which is
established under the Ministry of Public Security, are responsible for monitoring water quality and
identifying violations to regulations. Once a violation is identified, the Provincial People’s Committee is
informed and takes action. Fines are applied to organisations and individuals who violate water resources
and/or environmental protection regulations. Depending on nature of the violation, warning,
compensation, request for restoration, licence/permit stripping, or a combination of those measures, are
enforced by provincial and district people’s committees. This is stipulated in Decree 155/2016/ND-CP.
3.2 Viet Nam: National overview
3.2.1 Water resources
Viet Nam has a dense and complex river
network, with most of the large river systems
linked. The river system comprises
approximately 2,360 rivers which exceed a
length of 10 km. Viet Nam has sixteen main
river basins, of which nine river basins
contribute 90% of the total river basin area in the
country.19 These river basins are as follows: Red,
Thai Binh, Bang Giang-Ky Cung, Ma, Ca La,
Thu Bon, Ba, Dong Nai, and Mekong River
Basins. The average annual rainfall in Viet Nam
is about 1940-1960mm.20 Viet Nam’s total annual surface water runoff is estimated at 830-840 bn m3,
approximately 59% of which is available in the Mekong Basin and 17% in the Red-Thai Binh Basin.
According to FAO estimates, 43% of the surface water nationally can be sustainably exploited. In the dry
season which ranges (depending on location) from six to nine months (typically January to June), the total
natural discharge and rainfall is only 20-30% of total annual volumes.
Viet Nam has an irrigation water storage capacity of 12.48 bn m3, with 80% of these reservoirs
functioning as multi-purpose reservoirs.21 The bulk of the storage capacity (57%) is located in the North
and Central Coast. In addition, reservoir storage for hydropower purposes is estimated at 56.8 bn m3.
Hydropower is discussed further as a components of water demand in section 3.2.2.5.
Viet Nam’s total groundwater potential amounts to 63 bn m3/yr, i.e. 8.4% of the total annual water
availability.22 According to FAO estimates, only 7% of the groundwater is sustainably exploitable.
Groundwater in Viet Nam is assessed at a regional rather than a river basin level. For the purpose of this
study, an estimate of the groundwater allocation per river basin is used.
Climate change is expected to increase the total annual water run off by 15 bn m3, i.e. 1.5% of the current
annual water run off, by 2030.23 However, the seasonal distribution is predicted to change with dry season
run off reducing by10 bn m3/yr, while wet season run off increasing by 25 bn m3/yr. An overview of the
total water resources for Vie Nam’s main basins is shown in Figure 4.
Highlights:
• Total renewable water resources amount to
884 bn m3/yr, while only 42% is sustainably
exploitable
• 63% of water resources originate outside of
Viet Nam
• Hydropower, national and international, poses
challenges to reliable supply
• Urban water treatment plants only meet 55-
70% of potable water demand
• NRW ranges between 11.8-28.1% on a
national level, with NRW in large c cities
typically ranging between 22-28%.
| | 9
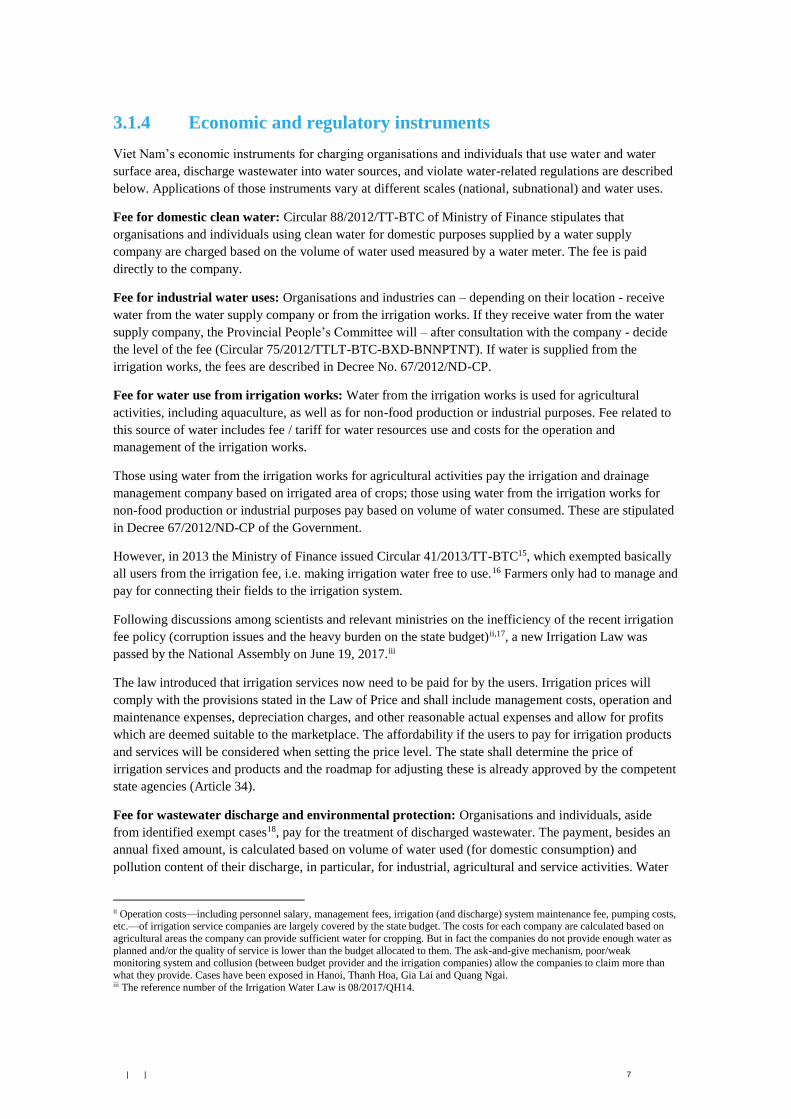
Figure 4. Left: National water run off in dry and wet seasons, 2016-2030; Right: Overview of exploitable
water resources in the dry season, per river basin (2016)
Source: Institute of Water Resource Planning (left); Current study (right)
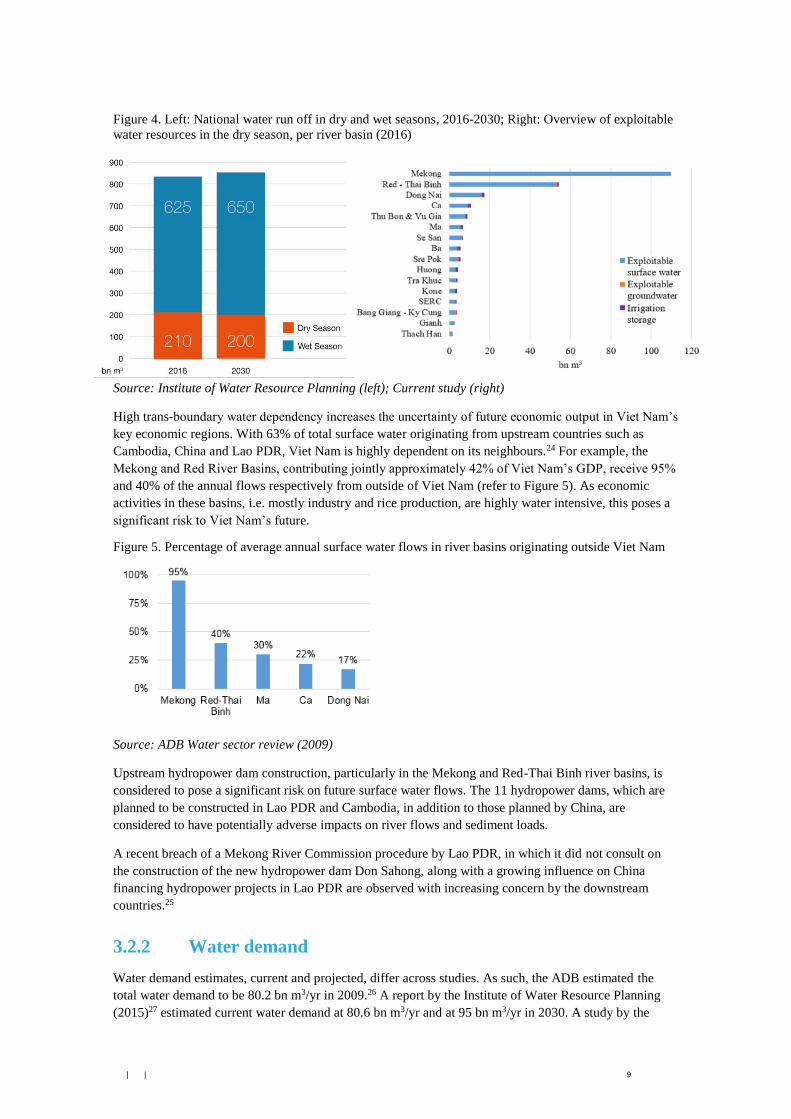
High trans-boundary water dependency increases the uncertainty of future economic output in Viet Nam’s
key economic regions. With 63% of total surface water originating from upstream countries such as
Cambodia, China and Lao PDR, Viet Nam is highly dependent on its neighbours.24 For example, the
Mekong and Red River Basins, contributing jointly approximately 42% of Viet Nam’s GDP, receive 95%
and 40% of the annual flows respectively from outside of Viet Nam (refer to Figure 5). As economic
activities in these basins, i.e. mostly industry and rice production, are highly water intensive, this poses a
significant risk to Viet Nam’s future.
Figure 5. Percentage of average annual surface water flows in river basins originating outside Viet Nam
Source: ADB Water sector review (2009)
Upstream hydropower dam construction, particularly in the Mekong and Red-Thai Binh river basins, is
considered to pose a significant risk on future surface water flows. The 11 hydropower dams, which are
planned to be constructed in Lao PDR and Cambodia, in addition to those planned by China, are
considered to have potentially adverse impacts on river flows and sediment loads.
A recent breach of a Mekong River Commission procedure by Lao PDR, in which it did not consult on
the construction of the new hydropower dam Don Sahong, along with a growing influence on China
financing hydropower projects in Lao PDR are observed with increasing concern by the downstream
countries.25
3.2.2 Water demand
Water demand estimates, current and projected, differ across studies. As such, the ADB estimated the
total water demand to be 80.2 bn m3/yr in 2009.26 A report by the Institute of Water Resource Planning
(2015)27 estimated current water demand at 80.6 bn m3/yr and at 95 bn m3/yr in 2030. A study by the

| | 10
Agriculture and Forestry University (2013) estimated water demand in 2013 at 115.4 bn m3/yr.28 To
understand the magnitude of water demand in 2016 and 2030 per river basin, this study uses the data from
the ADB study to project water demand in 2016 and 2030 based on assumptions specified below. The
information was complemented with current information on reservoir storage for hydropower generation.
Further details on the assumptions made are included in Appendix D.
3.2.2.1 Agriculture
While the agricultural sector only contributes 18% to the GDP, it comprises of 48% of the labour force
and uses 80% of total water resources - and continues to grow as a sector.29 Viet Nam is the top global
producer of pepper, the second largest global producer of coffee after Brazil, the third largest global
producer of aquaculture products and the fifth largest global producer of tea. Viet Nam is also the second
largest exporter of rice, a highly water intensive crop.30
In Viet Nam, 35% of the land is used for agriculture; 20.6% (11.8 mn ha) is arable land, 12% is used for
permanent crops and 2.1% for permanent pasture. Some 55% of the arable land (3.9 mn ha) is equipped
with irrigation infrastructure. The Mekong and the Red-Thai Binh river basins are Viet Nam’s key
agricultural areas, with 56% and 15% of the irrigation works installed respectively.
Rice is the dominant crop grown and irrigated in Viet Nam; 58% of the irrigated area is used for rice
production and 96% of the rice area is irrigated. Rice production is dominated in three regions: the
Southern Delta, which includes the Mekong Delta and accounts for approximately 50% of total rice
production, with the remaining share mostly produced in the Northern Delta and the Northern
Highlands.31
In Viet Nam, rice can be produced in four growing seasons and up to three times a year in the Mekong
Delta. The total production volume of rice amounted to 45 mn tonnes in 2014. Other key crops include
maize (1.2 mn ha, 5 mn tonnes), vegetables (0.89 mn ha, 16 mn tonnes), coffee (0.65 mn ha, 1.4 mn
tonnes), rubber (0.6 mn ha, 1 mn tonnes), cassava (0.6 mn ha, 10 mn tonnes) and sugar cane (0.3 mn ha,
20 mn tonnes).32
Water requirements for rice in Viet Nam range between 10,000-12,000 m3/ha in the winter-spring (dry)
growing season and approximately 5,000 m3/ha in the summer-autumn (wet) growing season.33 Almost
45% of Viet Nam’s irrigation water is used in the Mekong River Basin, almost exclusively for paddy
rice.34 According to the Agricultural Master Plan 2020, the rice production area shall not be expanded
beyond 3.8 mn ha. The target is to produce 41 to 43 mn tonnes/yr in 2020 and 44 mn tonnes/yr in 2030 in
order to ensure food security and export the balance.35
Coffee is predominantly grown in the Central Highlands (90%), with the Dak Lak province accounting
for about one third of the coffee growing area. Supplementary irrigation from either surface water or
groundwater is required during the dry season (Jan-April). Average water demand amounts to 4,000
m3/ha.
A university study from 2013 stated that ‘the irrigation system in Viet Nam is seriously degraded,
meeting only 50-60% of the design capacity’. It also found that the cost of irrigation in Viet Nam was the
highest across Southeast Asia.36
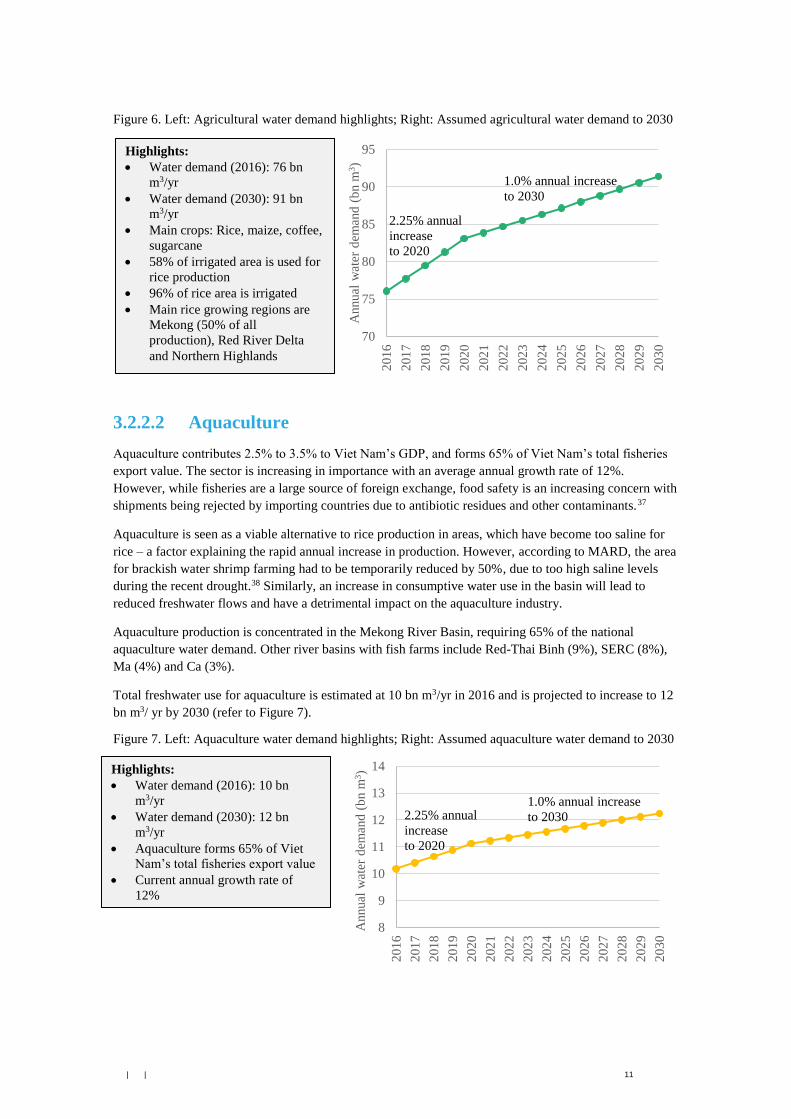
Total annual agricultural water use in 2016 is estimated at 76 bn m3 and is projected to increase to 91 bn
m3 by 2030 (refer to Figure 6). The increase in irrigation water demand is expected to level out after 2020
as the area of paddy rice production will be capped.
| | 11
Figure 6. Left: Agricultural water demand highlights; Right: Assumed agricultural water demand to 2030
3.2.2.2 Aquaculture
Aquaculture contributes 2.5% to 3.5% to Viet Nam’s GDP, and forms 65% of Viet Nam’s total fisheries
export value. The sector is increasing in importance with an average annual growth rate of 12%.
However, while fisheries are a large source of foreign exchange, food safety is an increasing concern with
shipments being rejected by importing countries due to antibiotic residues and other contaminants.37
Aquaculture is seen as a viable alternative to rice production in areas, which have become too saline for
rice – a factor explaining the rapid annual increase in production. However, according to MARD, the area
for brackish water shrimp farming had to be temporarily reduced by 50%, due to too high saline levels
during the recent drought.38 Similarly, an increase in consumptive water use in the basin will lead to
reduced freshwater flows and have a detrimental impact on the aquaculture industry.
Aquaculture production is concentrated in the Mekong River Basin, requiring 65% of the national
aquaculture water demand. Other river basins with fish farms include Red-Thai Binh (9%), SERC (8%),
Ma (4%) and Ca (3%).
Total freshwater use for aquaculture is estimated at 10 bn m3/yr in 2016 and is projected to increase to 12
bn m3/ yr by 2030 (refer to Figure 7).
Figure 7. Left: Aquaculture water demand highlights; Right: Assumed aquaculture water demand to 2030
Highlights:
• Water demand (2016): 76 bn
m3/yr
• Water demand (2030): 91 bn
m3/yr
• Main crops: Rice, maize, coffee,
sugarcane
• 58% of irrigated area is used for
rice production
• 96% of rice area is irrigated
• Main rice growing regions are
Mekong (50% of all
production), Red River Delta
and Northern Highlands
Highlights:
• Water demand (2016): 10 bn
m3/yr
• Water demand (2030): 12 bn
m3/yr
• Aquaculture forms 65% of Viet
Nam’s total fisheries export value
• Current annual growth rate of
12%
70
75
80
85
90
95
201
6
201
7
201
8
201
9
202
0
202
1
202
2
202
3
202
4
202
5
202
6
202
7
202
8
202
9
203
0
Annual
wat
er d
eman
d (
bn m
3)
2.25% annual
increase
to 2020
1.0% annual increase
to 2030
8
9
10
11
12
13
14
201
6
201
7
201
8
201
9
202
0
202
1
202
2
202
3
202
4
202
5
202
6
202
7
202
8
202
9
203
0
Annual
wat
er d
eman
d (
bn m
3)
2.25% annual
increase
to 2020
1.0% annual increase
to 2030

| | 12
3.2.2.3 Industry
Viet Nam has developed competitive manufacturing sectors with intensive low-cost labour and assembly
industries, which require extensive water use. Industry contributes 39% of the GDP and is growing fast
(at an estimated 7% in 2016). Main industrial activities include food processing (9% of GDP), chemical
industry (2%), textile and dyeing (6%), leather, paper and pulp production and automobile repair and
mechanics (6%).
Industries are concentrated around three key river basins, namely Red-Thai Binh, South East River
Cluster (SERC) and Dong Nai, and account for 80% of the industrial output. Some 65% of the craft
villages are located in the Red-Thai Binh River Basin. The Red-Thai Binh basin accounts for nearly half
of the total industrial water use nationwide, while the Dong Nai, Mekong and SERC basins account for
25%, 10% and 7% respectively.
Although industrial water demand is not disclosed or reported, Viet Nam’s standards for construction
No33:2006 (TCXDVN33:2006) indicates that industrial sectors such as liquid, milk, food processing and
paper have an estimated water demand of 45 m3/hectare/day. Published data indicates that industrial park
water demand can be significantly higher at 75 m3/hectare/day.
The total annual industrial water usage is estimated at 6 bn m3 in 2016 and is projected to increase to 15.6
bn m3 by 2030 (refer to Figure 8).
Figure 8. Left: Industrial water demand highlights; Right: Assumed industrial water demand to 2030
3.2.2.4 Municipal
Although Viet Nam’s population growth rate has stabilised at 1.03% (2017) from a high of 3% (1960),
there has been a rapid growth in urban population due to inward migration. This is the result of
employment opportunities in the growing industrial sector in cities and reduced employment in
agriculture due to mechanisation. Viet Nam has one of the fastest rates of urbanisation in the world, with
almost 43% of the country’s population expected to be living in cities by 2030.39 While more than two-
thirds of the population still live and work in provincial towns and villages, the cities of Hanoi, Ho Chi
Minh, Da Nang and Haiphong are growing rapidly.
Viet Nam as an emerging economy could grow at 5% or more per annum until 2030.40 This is likely to
result in an improvement of living standards and water supply and sanitation. Currently approximately
300 out of 635 towns and cities are planning projects to construct new water supply systems. The current
water demand of 30 mn people living in urban areas for drinking, sanitation, business and services are
estimated at 8 to 10 mn m3 per day. The total designed capacity of water treatment plants in urban areas is
about 5.4 mn m3/day i.e. it meets less than 70% of the urban water demand.
Highlights:
• Water demand (2016): 6 bn
m3/yr
• Water demand (2030): 15.6 bn
m3/yr
• GDP contribution of 39%;
average growth rate 7%
• 80% of industrial output come
from Red Thai Binh, SERC and
Dong Nai River Basins
4
6
8
10
12
14
16
18
20
201
6
201
7
201
8
201
9
202
0
202
1
202
2
202
3
202
4
202
5
202
6
202
7
202
8
202
9
203
0
Annual
wat
er d
eman
d (
bn m
3)
7% annual increase
to 2030

| | 13
Up to 62% of rural population is supplied with sanitary water and up to 30% with drinking water. Water
supply for domestic uses and sanitation activities of people in many urban areas and rural areas is largely
from groundwater.41
Data from over 90 water utilities in Viet Nam indicate an average water use of 110-120 l/capita/day. The
total annual municipal water usage is estimated at 3.1 bn m3 in 2016 and is projected to increase to 5.7 bn
m3 by 2030 (see Figure 9).
Figure 9. Left: Municipal water demand highlights; Right: Assumed municipal water demand to 2030
3.2.2.5 Hydropower generation
Hydropower generation has been a key enabler of economic growth and has particularly promoted the
industrialisation and modernisation of Viet Nam since 1990s. Viet Nam’s hydropower capacity in 2016
amounts to 16,982 MW. The bulk of the hydroelectric plant capacity is located in the Red -Thai Binh
basin (47%), followed by the Dong Nai (16%) and Se San (12%) basins. The total disclosed water
reservoir capacity amounts to 57 bn m3, but in reality it is likely to be higher.
According to the Power Development Plan 2011-2020, the total hydropower capacity will increase to
21,600 MW by 2020 and 27,800 MW by 2030.42 While the Open Mekong Database lists 29 hydroelectric
plants that are currently under construction (814 MW), the water storage capacity for the remaining 10
GW of planned expansion is not available yet. Future water capacity is, therefore, expected to be
significantly higher than illustrated in the 2030 scenario.
For the purpose of our assessment, the total hydropower demand is estimated at 57 bn m3 in 2016 and
assumed to be 63 bn m3 by 2030 (refer to Figure 10). A detailed overview per region, river basin and
plant scale is available in Appendix D.
Figure 10. Left: Hydropower capacity highlights; Right: Assumed hydropower water capacity to 2030
Highlights:
• Water demand (2016): 3 bn m3/yr
• Water demand (2030): 5.7 bn
m3/yr
• One of the fasted urbanisation
rates in the world
• Currently water treatment meets
less than 70% of the urban water
demand
Highlights:
• Water storage capacity (2016):
56.8 bn m3/yr
• Water storage capacity (2030):
62.7 bn m3/yr
• Hydropower is a key enabler to
economic development and
industrialisation
• Capacity is expected to increase
significantly by 2030
2
3
4
5
6
7
8
201
6
201
7
201
8
201
9
202
0
202
1
202
2
202
3
202
4
202
5
202
6
202
7
202
8
202
9
203
0
Annual
wat
er d
eman
d (
bn m
3)
4.5% annual increase
to 2030
55
56
57
58
59
60
61
62
63
64
65
201
6
201
7
201
8
201
9
202
0
202
1
202
2
202
3
202
4
202
5
202
6
202
7
202
8
202
9
203
0
Wat
er c
apac
ity (
bn m
3)
0.75% annual increase
to 2030

| | 14
4 Main challenges and implications
This section sets out the key water management challenges in Viet Nam, including water stress, water
pollution, climate change as well as institutional issues. It then summarises the implications and impacts
of these challenges both nationally and at river basin level.
4.1 Water stress and water shortages
It is well documented that water scarcity results in significant environmental, social and economic
impacts. The analysis focuses predominantly on the four river basins which account for approx. 80% of
Viet Nam’s GDP, namely the Red-Thai Binh (25%), Dong Nai (28%), Mekong Delta (17%) and SERC
(10%). The Mekong and Red Thai Binh river basins are also key in achieving Viet Nam’s food security,
as most rice is produced in these deltas.
4.1.1 Current and future water availability and demand
4.1.1.1 National level
On a national level, Viet Nam does not face an annual water supply and demand gap in 2016 or 2030. The
comparison of exploitable water resourcesiv and water demand for the dry season also reveals that Viet
Nam has sufficient resources to meet the current and future water demands (refer to Figure 11).
Figure 11. Dry season water demand by sector in Viet Nam
Source: Current study
4.1.1.2 River basin level
The water supply and demand assessment is more meaningful, though, at river basin level. The water
supply-demand gap indicates the difference between water demands from all sectors and the total
available water supply for a river basin, either at an annual or seasonal basis, such as dry-season
assessment undertaken in this study.
iv For the purposed of this analysis, exploitable water resources are defined as the sum of renewable surface water resources, groundwater potential and irrigation reservoirs

| | 15
The analysis shows that the Red-Thai Binh, Dong Nai and Mekong basins are not expected to face a dry
season water supply-demand gap by 2030. The SERC basin, however, is projected to face a water
shortage of approximately 770 mn m3/yr (28% of total demand) by 2030 (refer to Figure 12). Water
demand in SERC is not typical for Viet Nam as it is balanced across three sectors, namely, agriculture
(36%), aquaculture (29%) and industry (27%) rather than dominated by agriculture.v
Figure 12. Water demand projections (dry season only) for Mekong, Red-Thai Binh, Dong Nai and SERC
river basins
Source: Current study
4.1.2 Water Exploitation Index
The water exploitation index (WEI), or withdrawal ratio, is defined as the mean annual total abstraction
of fresh water divided by the long-term average ‘renewable’ freshwater resource availability and it allows
the assessment of the water stress in each river basin.vi These renewable resources are rivers and
recharging freshwater groundwater, and WEI helps to indicate whether the water abstraction rates balance
the needs of water by the people, industry and agriculture with the needs of water by the environment.
While the water supply-demand gap assessment is a good indicator of the river basins facing water
shortages, the WEI provides a more granular picture of how the total water demand puts pressure on the
available water resource and whether rates of abstraction are sustainable over the long term. The
thresholds are based on the view that freshwater ecosystems cannot remain healthy in water stressed
conditions.
v Please note that besides SERC, Ma river basin is also expected to face a water shortage of 310 mn m3 (8% of water demand). However, as the Ma river basin – mainly agricultural – is comparatively not as economically significant as the four river basins
mentioned above, it is not further analysed in the main report. Details can be found in Appendix I. vi Please note that the original methodology suggests to consider abstractions minus return flows. However, as this information is not available, total water abstractions are considered.
| | 16
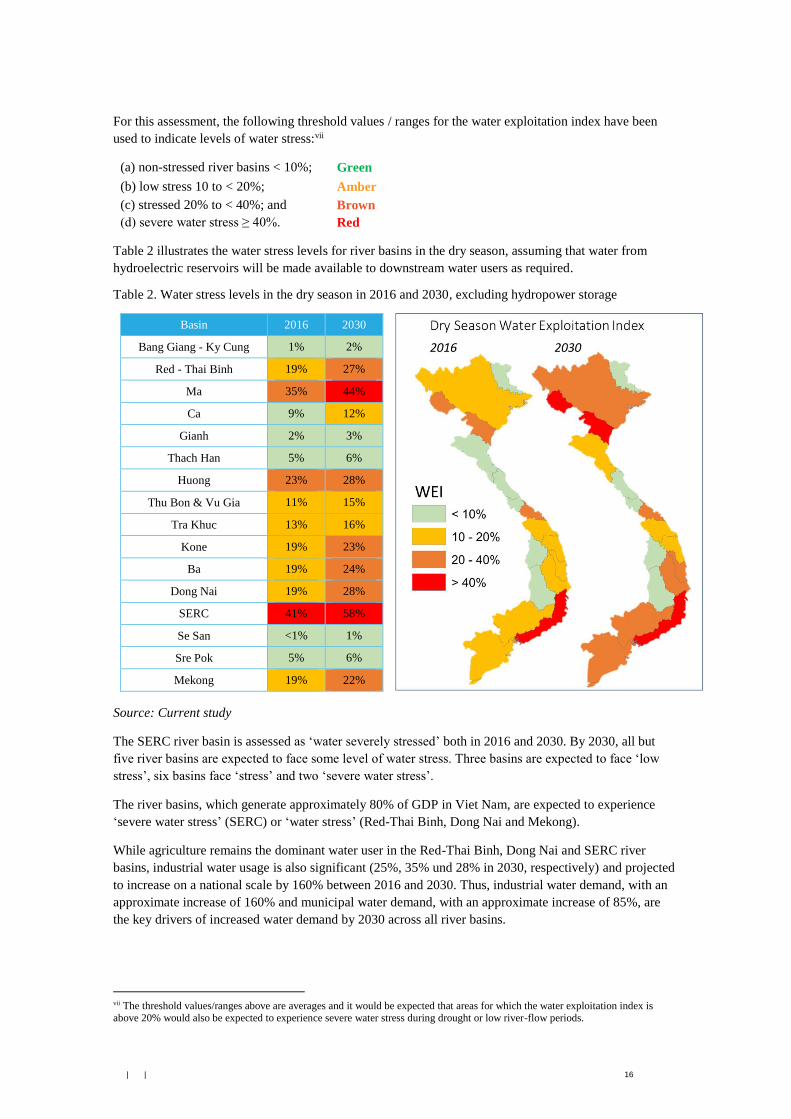
For this assessment, the following threshold values / ranges for the water exploitation index have been
used to indicate levels of water stress:vii
(a) non-stressed river basins < 10%; Green
(b) low stress 10 to < 20%; Amber
(c) stressed 20% to < 40%; and Brown
(d) severe water stress ≥ 40%. Red
Table 2 illustrates the water stress levels for river basins in the dry season, assuming that water from
hydroelectric reservoirs will be made available to downstream water users as required.
Table 2. Water stress levels in the dry season in 2016 and 2030, excluding hydropower storage
Basin 2016 2030
Bang Giang - Ky Cung 1% 2%
Red - Thai Binh 19% 27%
Ma 35% 44%
Ca 9% 12%
Gianh 2% 3%
Thach Han 5% 6%
Huong 23% 28%
Thu Bon & Vu Gia 11% 15%
Tra Khuc 13% 16%
Kone 19% 23%
Ba 19% 24%
Dong Nai 19% 28%
SERC 41% 58%
Se San <1% 1%
Sre Pok 5% 6%
Mekong 19% 22%
Source: Current study
The SERC river basin is assessed as ‘water severely stressed’ both in 2016 and 2030. By 2030, all but
five river basins are expected to face some level of water stress. Three basins are expected to face ‘low
stress’, six basins face ‘stress’ and two ‘severe water stress’.
The river basins, which generate approximately 80% of GDP in Viet Nam, are expected to experience
‘severe water stress’ (SERC) or ‘water stress’ (Red-Thai Binh, Dong Nai and Mekong).
While agriculture remains the dominant water user in the Red-Thai Binh, Dong Nai and SERC river
basins, industrial water usage is also significant (25%, 35% und 28% in 2030, respectively) and projected
to increase on a national scale by 160% between 2016 and 2030. Thus, industrial water demand, with an
approximate increase of 160% and municipal water demand, with an approximate increase of 85%, are
the key drivers of increased water demand by 2030 across all river basins.
vii The threshold values/ranges above are averages and it would be expected that areas for which the water exploitation index is above 20% would also be expected to experience severe water stress during drought or low river-flow periods.

| | 17
As discussed previously, the Mekong basin produces 50% of Viet Nam’s rice and water stress could pose
a national threat to food security and export revenues.
Water allocation conflicts between water for hydropower generation and other water uses during the dry
season could increase water stress levels further. Figure 13 shows that the Red – Thai Binh and Dong Nai
River Basins, which account for over 50% of Viet Nam’s GDP, are sensitive to hydropower storage. The
Red-Thai Binh River Basin is highly vulnerable, despite not showing a water supply-demand gap by
2030.
A detailed breakdown of the river basin specific stress levels, as well as the water demand per sector
(agricultural, industrial, municipal) is available in Appendix E.
Figure 13. Water Exploitation Index for key basins - with and without hydropower storage, 2016-2030
Source: Current study
4.2 Water pollution
In general, the quality of surface water, along with biodiversity, in the upstream end of Viet Nam's river
basins is relatively good. However, the water quality of river reaches flowing through urban areas,
industrial zones and crafts villages further downstream deteriorates, in some cases seriously, as most
municipal and industrial wastewater is discharged untreated into water bodies. Agricultural run-off from
an increased (over-) application of fertilisers and pesticides further reduces surface and groundwater
quality.
By the end of 2015, the total capacity of 35 centralised municipal wastewater treatment plants in Hanoi,
Ho Chi Minh City, Da Nang and other large cities was about 850,000 m3/day, which equates to 12-13%
of Viet Nam’s municipal wastewater treatment requirements.43 In addition, it has been estimated that
several thousands of decentralised wastewater treatment plants have been constructed and installed across
the country44 for the purpose of treating domestic wastewater from residential areas, hospitals, hotels and
office buildings. Despite this, only 50% of the hospitals and 7% of the 23,500 livestock farms in Viet
Nam have wastewater treatment systems as of 2014.45

| | 18
Wastewater discharged from industrial factories and industrial zones also exert great pressure on the
surface water environment in the country. While it is mandatory by law for industries to treat their
wastewater, in effect only 10% volume of the industrial wastewater is treated.46
Figure 14. Status of industrial wastewater management in Viet Nam47
A detailed assessment of the industrial sector in 2008 indicated that the top 3 polluting industries in Viet
Nam were paper and wood production, chemical production and processing and metal. Since then, the
food and drink and textile industries have grown rapidly and are responsible for large portions of the
industrial pollution load.
In addition, there are 5,000 craft villages in Viet Nam with over 65% of them located in the Red-Thai
Binh basin. These villages usually discharge untreated wastewater directly into water bodies without any
treatment.48
Indust
rial
was
tew
ater
dis
char
ges
• Industrial zones: Total effluent discharges of 450,000 m3/day.
• Industrial complexes: 610 operating complexes. No data of discharging.
• Craft villages: 5,000 villages; no data of wastewater discharging.
Indust
rial
was
tew
ater
tre
atm
ent
• Industrial zones: 60% of the effluent from 212 out of 283 operating industrial zones is treated for some pollutants. Only 35% is treated to required standards.
• Industrial complexes: 5% of operating industrial complexes have effluent treatment systems
• Craft villages: No treatment; direct discharges to environment.
Auto
mat
ic m
onit
ori
ng s
yst
em
• Industrial zones: Almost 40% of the 212 industrial zones have automatic monitoring system.
• Industrial complexes: Non automatic monitoring system.
• Craft villages: Non automatic monitoring system.

| | 19
An overview of Viet Nam’s water pollution challenges can be seen in Table 3. More detailed information
on water pollution hotspots and the status of the municipal and industrial wastewater treatment in Viet
Nam is available in Appendix F.
Table 3. Status of water quality in Viet Nam
Region
Rivers
Gro
un
dw
ate
r Pollution
Up
stre
am
Do
wn
stre
am
Urb
an
Ind
ust
ria
l
Ag
ricu
ltu
re
Sa
lin
e
Northwest Region 5 4 5 X
Northeast Region 5 2 4 X X X
Red River Delta 4 2 3 X X X X
North Central Coast 4 3 4 X X
South Central Coast 5 2 4 X X
Central Highlands 5 4 5 X
North East of Mekong 4 1 3 X X X
Mekong River Delta 4 2 3 X X X X
Notes:
• 5: good quality 1: very poor quality
• The assessment and scoring are based on the detailed
information provided in Appendix F.
4.3 Climate change
Viet Nam is expected to be one of the five most affected countries by climate change.49 ADB estimates
that costs due to climate change could amount annually up to 7% of Viet Nam’s GDP by 2100, which is
significantly higher than the global average.50 The Central Highlands Region will be hardest hit because
of decline agricultural value of up to 30% 51, according to World Bank report on economics of adaptation
to climate change.
Precipitation will be affected by the changing climate, with increased rainfall in the central part of the
country and reduced rainfall in the northern and southern parts. The coastal river basins are small and
more susceptible to rainfall changes (refer to Figure 15).
The Mekong Delta, Viet Nam’s rice bowl, is expected to receive on average 20% less rainfall than in the
1980s and experience delayed rainy seasons. In addition to the changes in rainfall, the climate models
predict that by 2070, the temperatures are likely to increase by 1.5°C and 2.0°C in coastal and inland
areas respectively resulting in increased evaporation by 7.7% - 8.4%. Together with the high irrigation
demands, there is an increased likelihood of declining surface water runoff and flows into the rivers.
Climate change is also expected to intensify climatic extremes, such as an increase in number and
intensity of storms leading to more frequent and more intense floods, as well as a greater variability and
intensity of droughts.52 The UN-REDD programme estimates that land use changes related to the
reduction of diversified production systems and native forests for agricultural production have made Viet
Nam even more susceptible to droughts and other impacts of climate change.

| | 20
Figure 15. Outputs of two climate models on predicted change in rainfall by 2050
Regions, which suffered from the El Nino-driven drought in 2014-2016, i.e. the Central Highlands, the
Southern Coast and the Mekong Delta, are expected to be more frequently and longer exposed to drought
conditions, as well as to more frequent flood conditions. It is expected that low-lying lands, such as the
Mekong Delta and the coastal areas will be affected by a sea level rise of 30 cm by 2050.53 In this
scenario, 13% of rice production area in the Mekong would be lost due to inundation and salinity
increase.54 Sea level rise would is also expected to have significant impacts on water supply, drainage and
water degradation.55
According to ADB estimates, a one-meter sea level rise would inundate a quarter of Ho Chi Minh City,
home to 6 mn people, and would submerge 11,000 km of roads.56 In a worst case scenario assessed by
WEPA, a five-meter sea level rise would result in a loss of 16% land area, reduce 35% GDP and affect
35% of the population.57
4.4 Institutional issues
Despite an elaborate policy framework comprising over 300 regulations, water sector management in Viet
Nam is challenged by unsustainable exploitation and use of water resources, water pollution, disconnect
between the national policies and practice at local level, and overall lack of policy and institutional
coordination within the water sector.58
While economic instruments exist (see 3.1.4), the current state of the environment shows that these are
not designed and enforced or incentivise sustainable water usage and optimal water allocation. With
agricultural water use constituting 80% of total water demand, and over-exploitation of groundwater
resulting in falling groundwater tables, e.g. in the Mekong Delta and Central Highlands, incentives for
sustainable agricultural water usage are imperative.
While a new Irrigation Law was passed in June 2017, which re-introduced payment for irrigation
services, the water price shall only be determined on the financial cost of irrigation water, i.e. operation
and maintenance cost, depreciation, management costs, other expenses and allowance for some profits for
the service provider. The water price, in this case, would not differentiate between water scarce and
abundant areas, thus lacking an incentive function for water savings and a potential re-allocation to more
productive uses. While the re-introduction of irrigation payments is a big step forward, it will lack the full
incentive function which is required for sustainable agricultural water usage.
| | 21
Overlap and inconsistency in water resource management functions at the central government level
(MONRE, MARD, MOIT, MOC, MOT, and MOH) also exist.59 MONRE is responsible for overall water
resources management, but rural water and water-related disasters (flood and drought) are under MARD
management and urban water is under the management of the Ministry of Construction.60 For example,
Decree 91/2002/ND-CP61 states that MONRE is the government agency responsible for the State
management of water resources. However, Decree 86/2002/ND-CP62 reassigns river basin management to
MARD. More recently, the Government Office has announced a decision of the Prime Minister to transfer
the task of river basin management from MARD back to MONRE again.63
Overlapping responsibilities between MONRE, MARD and province-level People’s Committees create
challenges in terms of managing licences and supervising activities. For example, irrigation divisions in
each province are responsible for licensing wastewater discharge permits into irrigation systems but they
do not have the capacity to monitor water quality at the discharge point.
Some provinces still prioritise the goal of economic growth and underestimate environmental
protection.64 MONRE inspection findings reveal that many industrial zones and industrial parks have
their own wastewater treatment systems but most of them are not functioning. According to MONRE’s
Minister Tran Hong Ha, in 2016, environmental incidents occurred in every type of water resources,
including the sea, rivers and lakes. Along with the process of economic development, the environment
has reached the ‘threshold of tolerance’.65
Monitoring, inspection, control and management of discharges is not transparent and lacks consistency.
Lack of resources, technology and coordination, result in weak enforcement of environmental standards.
Taking measures against environmental crime is challenging, as the authority and rights of the
Environmental Crime Prevention Police are stipulated dispersedly in a number of legal documents.66
Organisations and individuals take advantage of the loopholes or they are willing to pay fines for
violations rather than complying with the law.67 Recent environmental disasters, such as the Formosa
case, have revealed the weaknesses in the current system.68
4.5 Implications of Viet Nam’s water challenges
Drought events are increasing in frequency and severity impacting livelihoods and agricultural
production.
Viet Nam is affected by El Nino and La Nina events approximately every two to seven years with varying
intensity. Past El Nino events with severe impacts on environmental and socio-economic sectors in Viet
Nam occurred in 1982-82, 1997-98 and 2003. In 2003 coffee production was reduced by 25%.69 The
recent El Nino event between 2014 and 2016 was the most severe drought Viet Nam experienced in 90
years.70 Areas most affected include the Central Highlands and Central Coast, especially the provinces of
Ninh Thuan and Binh Thuan, which experienced serious water shortages and the Mekong Delta
experiencing saltwater intrusion.71 The Ministry of Planning and Investment estimated the economic
impact of the 2016 drought at VND15 trillion ($660 mn).
CGIAR (2016) reported that in the Central Highlands by early April 2016, discharges of main rivers were
reduced by 20-90%, water volumes in most reservoirs declined to 10-50% of the design capacity, 70% of
the cultivation areas (rained and irrigated) experienced severe drought affecting approximately 170,000
ha of crops. In Dak Lak alone the reduction of crops on 42,400 ha was estimated to be equivalent to a $60
mn loss. Freshwater was lacking for about 2 mn people, 1.75 mn people were reported to have a
compromised livelihood, with 1.1 mn people depending on food aid.72 Today, water reservoirs are again
filled to 70% design capacity. It can be expected that the impact of the drought in the Central Highlands
will be felt even after its end, as it has affected the perennial drought-sensitive coffee crops.
The drought hit the Mekong Delta in the critical growing season of the paddy rice, requiring farmers to
supplement irrigation with groundwater to save their crops. The reduced surface water flows allowed

| | 22
saltwater to intrude up to 70-90 km upstream, 20-30 km further than usual, making the water unfit for
irrigation. 13 provinces with approximately 180,000 ha irrigated area in the Mekong Delta (10% of total
irrigated area) were seriously affected by the drought and salinisation.73 According to FAO, rice
production fell by 1.1 mn tonnes (2.2% of national production) as a consequence. The longer term effects
from salinisation are currently assessed by the government.
Figure 16. Main challenges in the river basins of Viet Nam
Groundwater over-extraction poses threat to Viet Nam’s future water security and is expected to
substantially increase infrastructure costs due to land subsidence
Dependence on groundwater during the dry season for agriculture and uncontrolled industrial and urban
groundwater abstractions pose a severe pressure on Viet Nam’s groundwater resources. Adverse impacts
of groundwater over-exploitation manifest themselves already:
• Key urban areas, such as Hanoi, Ho Chi Minh City and Da Nang are experiencing land subsidence.
In Hanoi, for example, groundwater levels experienced a maximum drop from 18 to 32 meters since
2008 in central districts and an average land subsidence of 30-90 cm with the maximum subsidence

| | 23
of 104 cm being registered at the water supply station Phap Van. Increasingly buildings have to be
removed and rebuilt as a consequence. With business as usual, parts of Hanoi are expected to sink up
to 120 cm in between now and 2030, especially around vulnerable water supply stations.74 The
groundwater table in Ho Chi Minh City, Viet Nam’s economic powerhouse, reportedly decreased
annually by 1.5-2 meters between 2000 and 2006.75
• In the Mekong Delta, Viet Nam’s rice bowl, groundwater over-extraction is a serious concern, which
is believed to have caused increased saline intrusion and land subsidence in rural areas of 10 mm/yr
to 20 mm/yr and in urban and industrial areas of around 25 mm/yr.76
• In the central highlands, Viet Nam’s key coffee and horticulture producing area, groundwater tables
in Dak Lak and Dak Nong have dropped by 20% in the past 10 years. In the dry season, average
groundwater tables are 4-5 meters lower than in the 1980s, leaving farms and even domestic users
with inadequate water resources. Dense coffee irrigation and related land use change from forest
area to coffee plantation are assumed to be the cause of this issue.77
Rapid expansion of hydropower in Viet Nam causes water sharing conflicts and issues related to
dam safety of small dams.
The reservoirs of small hydropower dams are constructed mostly for hydropower generation, i.e. they are
not used for irrigation or flood control, while medium and large size hydropower plants often use multi-
purpose dams. The Institute of Energy has found that approved designs for storage reservoirs were
amended during construction and the reduced reservoir capacity leads to increased water discharges
during the wet season which aggravates downstream flooding. Water is also maintained in the dry
season, leading to water usage conflicts between hydropower, agriculture and urban areas.78 In 2013 the
Central Coast, including the Da Nang city, faced a severe water shortage affecting 1.7 mn people and
10,000 ha of agricultural land. The dam operator of Dak Mi 4 Hydropower Joint Stock Co refused to
release water to alleviate the impacts of the drought as this would impact their electricity operation,
despite the Prime Minister issuing a directive requesting the operators to release water.79
According to the Report of Committee on Science, Technology and Environment of the National
Assembly, 30% of small hydro dams are not technically verified. In 2016, 66% of small and medium
dams lacked safety plans, while 55% lacked flood prevention plans. While large and medium sized
hydropower projects (installed capacity >31 MW) require approval from MoIT, small dams (installed
capacity <30 MW) are under the responsibility of the Provincial People’s Committee, who frequently lack
the capacity to assess the technical proposals.80 The lack of compliance has led to multiple dam failures,
such as the dam break of Dak Mek 3 in 2012, which killed one person and injured several others. The
Dam Failure of Ian Krel 2 destroyed 200 ha of cropland.81
Reduced sediment loads in rivers may endanger productivity in key agricultural regions
Over centuries, the Red River and Mekong deltas were formed by sediments transported downstream
from its rivers. Recent hydropower development, in addition to legal and illegal sand mining activities in
Viet Nam and in upstream countries, are drastically reducing sediment loads and impacting soil fertility.
WWF estimated 50 mn tonnes of sand were extracted from the Lower Mekong mainstream in 2011 alone,
much more than the river produces in a year. These drastic disruptions of the sediment regime are already
reshaping landscapes downstream.82
The river bed in Mekong delta’s two main channels fell by more than a meter between 1998 and 2008,
resulting in salt water intruding even further inland and impacting fertile arable land. On average
12 meters of coastal land is lost annually and the reduced sediment load is also expected to contribute
to land subsidence.83
Rapid deforestation and land use change worsen natural disasters

| | 24
To increase the cultivation of coffee, a rapid deforestation was observed since 1997, with forest cover
being reduced from 65% to 42% in the Central Highlands over the past 10 years alone.84
The reduced soil infiltration capacity has contributed to the frequency and severity of floods from rainfall
and have increased the severity of drought events.85
Severe water pollution reduces surface water availability
Poor surface water quality reduces water availability to downstream users and increases water treatment
costs. As a result, groundwater is over-exploited (particularly in large cities) leading to issues analysed
earlier.
Agriculture in many cases uses the polluted river water for irrigation, which reduces yields86 and poses a
significant public health risk.
Aging water supply infrastructure and illegal connections reduces the availability of potable water
in cities.
Non-revenue water (NRW) ranges between 11.8-28.1% on a national level, while large cities typically
have NRW percentages of 22-28%. GoV has recognised the need to address this issue and has embarked
on an ambitious non-revenue water reduction programme to reduce average NRW to 15% by 2025.87 88
5 On-going water initiatives
More than 140 completed and ongoing water-related initiatives, programmes and projects, which have
commenced since 2006, were identified through secondary literature review and stakeholder interviews.
According to OECD, over $6.4 bn have been distributed as Official Development Assistance to water-
related sectors in Viet Nam since 2006. Of these, over 55% have been invested into the improvement of
water supply and sanitation systems in the country, 21% on agricultural water resource management, and
a further 7% on institutional and governmental capacity building (refer to Figure 17 and Appendix G).
The financial impact of irrigating with untreated industrial wastewater
Industrial effluents discharged untreated to agricultural areas considerably impact crop yields. Kai and
Yabe (2013) assessed paddy rice areas which are impacted by untreated industrial effluent in Can Tho,
one of the biggest rice producing areas in Mekong. They found that yields decrease by 0.67 tonnes/ha
(12%) and additional costs increase by 0.97 mn VND/ha (9%) resulting in 3.2 mn VND/ha (26%) loss
in profits. In addition, farmers are reported to have suffered from skin disease and only 1-2 rice crops
are planted each year (instead of three crops). The assessment did not include the impact on rice quality
and health implications which could be serious, especially in the long term.
Non-revenue water programme in Viet Nam
The programme includes: public awareness improvement activities; capacity building for local
authorities and water supply companies; establishment and improvement of NRW policy framework
and; technical improvements for network monitoring and maintenance. The methodology adopted for
the NRW reduction programme is in line with the Asian Development Bank’s Knowledge Product “The
Issues and Challenges of Reducing Non-Revenue Water”.
The programme cost is estimated to be around $500mn is largely funded by official development
assistance (98% ODA, 2% state budget). By addressing NRW, the government aims to dramatically
reduce investment requirements. It is estimated that reducing NRW to 15% will increase annual
revenues by $800mn and provide 1.3 mn m3/day additional water capacity.

| | 25
Water initiatives and programmes are predominantly funded by state development agencies and
international multilaterals. In the last decade, Development Assistance Committee (DAC) countries have
funded $3.4 bn of water related initiatives, with the JICA providing funding of over $1.8 bn. The World
Bank Group, including World Bank, IDA, and IFC, is another primary source of funding, with investment
amounting to $2.3 bn since 2006.
Various NGOs, such as IRRI, IUCN, WWF, and the Global Green Growth Institute, have extensive
programmes of technical and financial assistance to agricultural, micro-industries and civic sectors. A
number of private sector firms, many from the beverage industry, are also actively involved in developing
sustainable water-related projects, working in collaboration with NGOs, and international multilaterals.
Figure 17. Overview of funding distribution to water sector initiatives in Viet Nam from 2006 to 2015
Source: OECD
5.1 Focus area: water supply
12 of the 16 river basins in Viet Nam, including Mekong, DERC, Dong Nai and Red-Thai Binh, are
facing challenges from water shortage, groundwater over-abstraction, and competition for water
resources. These prevailing challenges are reflected in a strong focus of initiatives on water supply (refer
to Figure 18).
More than half of the water supply initiatives are delivered through infrastructure improvement. The
World Bank and IFC’s Urban Water Supply and Wastewater Project (2012-2019) is increasing access to
sustainable water services and environmental sanitation in selected urban areas in Red-Thai Binh. ADB is
delivering a joint venture with the State General Reserve Fund of Oman, State Capital Investment
Corporation of Vietnam, state-owned technology enterprise Newtatco, VietinBank Capital, and the Hanoi
Water Limited Company, to expand a water treatment plant on the Da River to supply Hanoi with
drinking water. JICA is delivering a project to improve An Duong Water Treatment Plant in Hai Phong
City. In Mekong, the French Development Agency (AFD) delivered the Phuoc Hoa and Saigon River
project (2003-2012), including the construction of Phuoc Hoa dam and associated transfer canals, to
provide better distribution of water between the provinces and amongst competing activities from
agriculture, industries, hydropower and civic demand.
In addition to infrastructure delivery, 15% of the water supply initiatives reviewed are focused on
capacity building, improving national governance structure and technology advancement. For instance,
ADB is helping increase access to clean water in Viet Nam by improving the efficiency of water supply
companies (2013-onging), with the first tranche covered Ho Chi Minh City. The programme is now in
tranche four and has been extended to four more provinces in Red-Thai Binh.

| | 26
5.1.1 Private sector and civil society initiatives
Coca Cola is working with UN-Habitat and Research Center for Family Health & Community
Development (CEFACOM) to increase the coverage of clean water provision through the delivery of
water provision facilities in Dong Nai (2004-ongoing). Grundfos’s Water2Life programme (2013-2016)
delivered over 80,000 metres of pipelines to bring safe water to ten communities in Mekong. The
Viet Nam Water Partnership, a non-profit network facilitated by the Global Water Partnership (GWP),
was established in 2002 to promote integrated water resource management with a focus on governance
and capacity building. UNDP collaborated with CEO Water Mandate and a number of private firms in the
manufacturing sector to improve water management, mitigate water-related risks and water stress on
communities (2011-2012).
Figure 18. Sectorial and geographical distribution of water initiatives in Viet Nam
5.2 Focus area: wastewater treatment
ADB is working with Ho Chi Minh City People’s Committee and their government to finance sound
wastewater and drainage system to future-proof the city’s infrastructure for socio-economic growth
(2016-ongoing). The Swiss Development Agency (SDC), in collaboration with KfW banking group and
BUSADCO, delivers sanitation improvement projects in four provincial centres in Red-Thai Binh (2010-
2018) and SERC (2009-2016) through the construction of wastewater treatment facilities, and the
rehabilitation and extension of sewer systems. A proportion of the wastewater treatment initiatives also
focus on capacity building and governance. For instance, the World Bank and IFC are improving the
compliance with industrial wastewater treatment regulations in four provinces in Red-Thai Binh and
Dong Nai, through the development of a rating methodology and public disclosure for industrial
wastewater treatment (2013-2019).
5.2.1 Private sector and civil society initiatives
The Global Green Growth Institute (GGGI) is working with Ministry of Planning and Investment (MPI),
Ministry of Construction (MOC), UNDP, Provincial and City People’s Committees (PPCs and CPCs),
UN-Habitat and Viet Nam National Mekong Committee (VNMC) to promote green growth in the
Mekong Delta through supporting the implementation of water-sector green growth policies, with a focus
on wastewater management.

| | 27
5.3 Focus area: agriculture
Infrastructure improvement and rehabilitation is a key focus of water initiatives in the agriculture sector.
A number of AFD-led projects, delivered with partners such as the Northern Mountainous Agricultural
and Forestry Science Institute (NOMAFSI) and the French International Agricultural Research Centre for
Development (CIRAD), focused on agricultural water resource rehabilitation and capacity building in
Dong Nai (2006), SERC (2008), and Red-Thai Binh (2010-2016). These projects aimed to improve
drainage, irrigation system and crop yield through the construction and rehabilitation of hydraulic
structures such as dykes, pumping stations and canals. The World Bank and ADB are also active in the
rehabilitation of irrigated agricultural production systems in Red-Thai Binh and Dong Nai through
projects such as the Viet Nam Irrigated Agriculture Improvement Project, Sustainable Rural Infrastructure
Development Project, and Productive Rural Infrastructure Sector Project. In Mekong, the World Bank
and IFC are working to improve rice and coffee farming practices and support the implementation of the
agricultural restructuring plan through improving market linkages, technology access and finance
facilitation (2015-2020).
5.3.1 Private sector and civil society initiatives
Food and drink company Nestlé is working with SDC and the Vietnamese authorities to encourage local
coffee growers to optimise their water use through the assessment of water footprint of coffee production
and providing training on seasonal water consumption optimisation (2014-2017). In Mekong, the
International Union for Conservation of Nature (IUCN) is working with SDC, AFD and local NGOs on
integrated water resource management for agriculture. Coca Cola and WWF have been involved in a
wetland restoration project in Mekong (2007-2010) to improve water resource management in fishery and
agriculture.
One of the key NGOs is IRRI, which has been providing assistance in Viet Nam since 1963 in a wide
range of collaboration in the fields of rice breeding material exchange, rice varietal improvement,
resource management, and capacity building. Most recently it has been providing assistance in The
Alternate Wetting and Drying (AWD) Rice Management Practice and System of Rice Intensification
(SRI) to increase productivity and yield of crops.
5.4 Focus area: climate change
Climate change related water initiatives largely focus on education and capacity building to improve
resilience to climate risks and disasters. The Belgian Development Agency (BTC) is promoting integrated
water management and urban development in relation to climate change in a number of provinces in
SERC, through the development of appropriate operational climate change modelling and institutional
capacity to apply the national strategy on climate change at regional level. USAID is working with Pacific
Disaster Centre and Ministry of Agriculture and Rural Development (MARD) to develop and implement
an initial VinAWARE early warning and decision support system for central-level officials in Hanoi and
flood management offices at provincial level in central Viet Nam (2012-2015).
5.4.1 Private sector and civil society initiatives
A small number of infrastructure improvement projects have been identified, all of which focus on
improving infrastructure resilience to flooding. Examples include UNDP’s flood proofing programme in
Mekong river delta and climate resilience of coastal communities in Red-Thai Binh. In terms of capacity
building, UNDP is leading on a number of climate change related projects in Red-Thai Binh, including
building community resilience to climate-related disasters through training (2007-2008), and addressing
climate risk to critical infrastructure assets through policy integration and knowledge sharing (2012-
2017). No private sector initiatives have been identified relating to climate change.

| | 28
6 Key solution areas
6.1 Good governance and institutional solutions
The foundation of Viet Nam’s water sector transformation lies in good water governance and adherence
to Integrated Water Resource Management principles. Figure 19 illustrates the OECD Principles on
Water Governance. The principles are divided into three categories: Effectiveness, Efficiency, and Trust
and Engagement. To implement solutions, clear sustainable water policy goals and targets at all levels of
government need to be determined, implemented and meet expected targets (effectiveness). Further,
benefits of sustainable water management and welfare need to be maximized at the least cost to society
(efficiency). Finally, public confidence needs to be built, while inclusiveness of stakeholders through
democratic legitimacy and fairness for society at large needs to be ensured.
Figure 19 OECD Principles on Water Governance (Source: OECD) 89
In Viet Nam, water governance does not as yet meet the standards required to enable implementation of
sustainable and integrated water resource management.
While IWRM is mentioned in policy documents, currently there is no assessment of groundwater
availability at a river basin level, nor the presence of integrated water resource management (IWRM)
plans, thus providing no basis for sustainable water resource management. Policy-makers and industry
groups should collaborate with government departments, donors, NGOs and the community to
collaboratively move towards delivering IWRM plans at river basin level.
In order to allow informed decision making by all stakeholders, an open-access, solid and verified
database of water resource related information is required. Currently even the government departments
have difficulties in accessing relevant data as, e.g. MONRE’s Centre for Water Resources Inventory
and Planning collects data on groundwater; MONRE’s Department of Hydro-metrology collects data of
surface water and river basins; while MARD’s Department of Water Resources manages data on
irrigation system/works.90
| | 29
During the stakeholder interviews it was stated that publically available data may have been adjusted
to reflect certain standpoints rather than reality. With the Law on Access to Information issued in late
2016, and the implementation guidance Circular released in March 2017, there is an opportunity to
address this issue and build trust and to increase confidence amongst stakeholders.
As a reaction to nation-wide protests on the Formosa incident, in which the Taiwanese steel company is
made responsible for leaking toxic discharges to the environment which killed approximately 70 tonnes
of fish and impacted numerous livelihood in 2016,91 the Prime Minister led a meeting across Ministries in
which the seriousness of enforcing wastewater regulation was stressed. As an immediate reaction, a
publicly accessible online monitoring system of companies’ discharges will be launched.
A Memorandum of Understanding was signed between the Department of Science, Technology and
Environment (MONRE) and Microsoft to support the development of an e-government and national
database architecture for natural resources and environment.92 While this monitoring system, once
implemented, can be seen as a strong tool to make polluters accountable for their actions, clarity on
which governmental body can provide discharge permits and under which conditions and minimum
requirements, as well as how the enforcement of penalizing offenders will be realised are equally
important questions which need to be addressed.
A lack of a clear regulatory framework and its enforcement, a lack of capacity at provincial
government departmentsviii 93 and missing incentives for sustainable water resource management
are key challenges, which need to be addressed.
Considering that less than 10% of the water resources are available from groundwater, the unmanaged
abstraction across all sectors is causing serious concerns. To address this, Viet Nam’s water resource
planning has to be adapted to include groundwater as a key resource. While Decision 206594 seeks to
reduce groundwater abstraction in industrial zones and stop it in key zones by 2020, measures need to be
put in place to also sustainably manage groundwater in agriculture and urban areas.
The new Irrigation Law (2017), provides an opportunity for revising the incentives for agricultural
groundwater. While the price levels are yet to be determined, it seems as if these should be set with the
objective of cost recovery, rather than setting incentives for sustainable water abstraction.
One key challenge will be on how the law will deal with rice irrigation, the primary water user in Viet
Nam. The preceding discussions seem to suggest that rice farmers will be exempted from paying an
irrigation levy. Furthermore, the on-going agricultural reforms have the potential to relax the land use
requirements determined by the government, allowing farmers to maximise crop per drop. It is crucial
that these two on-going policy changes consider the importance of sustainable water resource
management.
There is also a lack of technical capacity at local levels, where large majority of operational decisions
are made. Increased training and support at local level can improve the management of the water
resources and pollution in local river basins. The on-going discussion on the establishment of river basin
management committees therefore needs to be accelerated and implemented.
At the meeting of the central government in April 2017, a number of solutions have been proposed by the
Ministry of Natural Resources and Environment to address environmental issues such as promoting
environmental planning, promulgating criteria for screening and publicising polluting and disgruntled
industries. In particular, the urgent issues are to review and adjust financial mechanisms, mobilise
resources for environmental protection, especially the mobilisation mechanism on the principle that
polluters pay correctly.

| | 30
6.2 Technical solutions on river basin level
Following the principles of Integrated Water Resources Management (IWRM), key solutions within a
river basin are assessed, considering agricultural, industrial and municipal solution areas.
There are opportunities to address Viet Nam’s water resource management issues through the
identification and implementation of cost-effective water demand reduction measures at the four key river
basins which generate 80% of the country’s GDP. This section assesses:
• Measures to close the identified water supply-demand gap for SERC basin
• Measures to move the Red Thai Binh, Mekong, SERC and Dong Nai basins to a low water stress
status (WEI<20%) by 2030.
The implementation of 24 measures targeting the agricultural, industrial and municipal sectors were
reviewed for each river basin. In order to allow the prioritisation of measures, the cost-effectiveness (i.e.
the cost of making one unit of water available) as well as the overall impact (i.e. the quantity of water this
measure could make available in each river basin), of each measure was assessed. The list of measures, as
well as an overview on the assumptions made related to scale, impact and costs of each measure can be
found in Appendix H.
As the focus of the analysis is on water efficiency measures, water supply augmentation options (such as
reservoir storage, additional groundwater aquifer recharge and desalination) were not included in the
methodology. It is recognised, though, that could be part of the solution in certain river basins.
Agriculture water demand accounts for majority of the water use. This is reflected in the solutions
presented in the following sub-sections.
6.2.1 Methodology
A cost curve was used to assess the various interventions and the demand and availability gap. This
process is not a substitute for other economic tools and analyses, nor is it a substitute for basin-level
planning. It provides, though, a relatively simple picture of the primary solution sets available and any
major trade-offs. The measures identified were compiled with local experts and describe the highest
potential opportunities to reduce water demand. As the Viet Nam water demand is dominated by
agriculture, the study predominantly considered solutions in this sector.
Figure 17 provides an overview of the methodology used for the assessment. The cost curve’s horizontal
axis measures the amount of water made available by each measure. The vertical axis of the cost curve
measures the cost per unit of water required by each measure in the year of the cost curve. This is the
annualised capital cost, plus the net operating cost compared to business as usual.
The wider a measure on the horizontal axis, the larger its net impact is on water availability to close the
supply-demand gap. The height of the measure’s height on the vertical axis, indicates its financial cost.
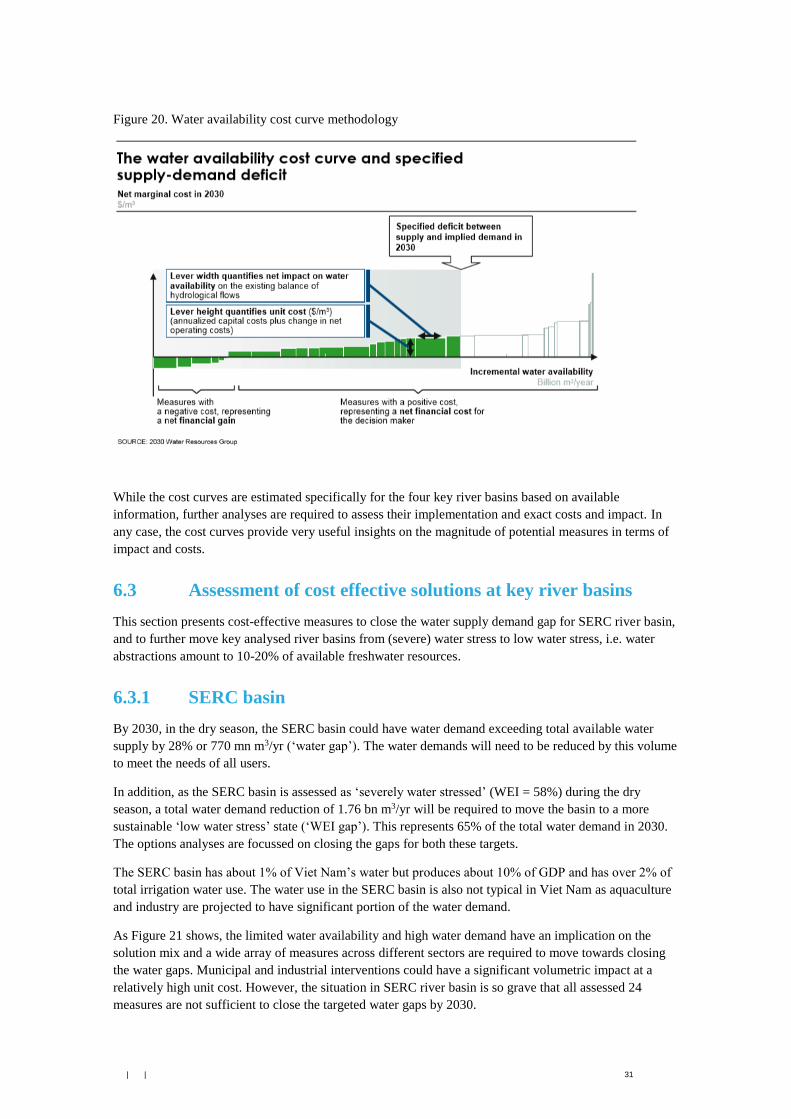
| | 31
Figure 20. Water availability cost curve methodology
While the cost curves are estimated specifically for the four key river basins based on available
information, further analyses are required to assess their implementation and exact costs and impact. In
any case, the cost curves provide very useful insights on the magnitude of potential measures in terms of
impact and costs.
6.3 Assessment of cost effective solutions at key river basins
This section presents cost-effective measures to close the water supply demand gap for SERC river basin,
and to further move key analysed river basins from (severe) water stress to low water stress, i.e. water
abstractions amount to 10-20% of available freshwater resources.
6.3.1 SERC basin
By 2030, in the dry season, the SERC basin could have water demand exceeding total available water
supply by 28% or 770 mn m3/yr (‘water gap’). The water demands will need to be reduced by this volume
to meet the needs of all users.
In addition, as the SERC basin is assessed as ‘severely water stressed’ (WEI = 58%) during the dry
season, a total water demand reduction of 1.76 bn m3/yr will be required to move the basin to a more
sustainable ‘low water stress’ state (‘WEI gap’). This represents 65% of the total water demand in 2030.
The options analyses are focussed on closing the gaps for both these targets.
The SERC basin has about 1% of Viet Nam’s water but produces about 10% of GDP and has over 2% of
total irrigation water use. The water use in the SERC basin is also not typical in Viet Nam as aquaculture
and industry are projected to have significant portion of the water demand.
As Figure 21 shows, the limited water availability and high water demand have an implication on the
solution mix and a wide array of measures across different sectors are required to move towards closing
the water gaps. Municipal and industrial interventions could have a significant volumetric impact at a
relatively high unit cost. However, the situation in SERC river basin is so grave that all assessed 24
measures are not sufficient to close the targeted water gaps by 2030.

| | 32
Figure 21. SERC River Basin – cost curve of solutions to close the dry season water gap and reduce water
stress to ‘low water stress’ in 2030
While the analysis only focuses on water efficiency measures, it becomes clear that water supply
augmentation measures will need to be assessed in future to understand whether these are sufficient to
ensure water security for SERC river basin. For example, aquifer recharge with an estimated unit cost of
$0.5-1/m3 is likely to be a cost-effective solution, while increasing reservoir storage capacity at an
estimated cost $2-5/m3 could also be explored. Seawater desalination is another potential source of supply
augmentation, however the costs95 are greater than identified options, has a higher energy use, and a
greater environmental impact. The feasibility of any water supply augmentation interventions will require
detailed technical assessment.
Assuming that water supply augmentation measures are feasible, the implementation cost to close the
water supply-demand gap in 2030 is estimated at least $900 mn. Reducing the basin’s water stress level to
low will require an estimated total cost of at least $3 bn.

| | 33
6.3.2 Red-Thai Binh basin
The Red-Thai Binh basin is assessed as ‘water stressed’ (WEI=27%) during the dry season by 2030 and a
total water demand reduction of 4.9 bn m3/yr will be required to move to a ‘low water stress’ state. This is
the target ‘WEI gap’ for options analysis in Red Thai Basin.
It is a diverse basin with significant rice production (15% of Viet Nam’s rice irrigation) and home to
booming industrial areas and craft villages and large urban conurbations such as the capital Hanoi.
Figure 22 shows that agricultural interventions, including sprinkler irrigation, alternate wet and dry
(AWD) rice management practice, no till agricultural and irrigation scheduling, managing
evapotranspiration using quotas and system of rice intensification (SRI) are the most cost effective and
could close approximately 50% of the water gap. Less cost effective municipal and industrial
interventions at an estimated $0.2-0.4/m3 are required to fully close the 4.9 bn m3/yr water gap.
A deep dive into industrial wastewater treatment and reuse in the Hanoi area is available in Chapter 7.
Figure 22. Red-Thai Binh River Basin – cost curve of solutions to reduce water stress in the dry season in
2030
It is estimated that reducing the basin’s water stress level to ‘low’ will require a total cost of $2 bn.

| | 34
6.3.3 Dong Nai Basin
The Dong Nai River Basin is assessed as ‘water stressed’ (WEI=28%) during the dry season by 2030 and
a total water demand reduction of 1.85 bn m3/yr will be required to move to a ‘low water stress’ state.
This is the target ‘WEI gap’ for options analysis in Dong Nai Basin.
Dong Nai is home to HCMC and significant industrial development. The basin has about 4% of the
nation’s water and produces 28% of the GDP.
As Figure 23 illustrates, that whilst agricultural measures are cost effective, they can only close
approximately 30% of the 1.8 bn m3/yr water gap. Municipal and industrial interventions, including
leakage reduction and wastewater treatment should be part of the solution basket. Due to the clustering of
factories in industrial parks and zones in the basin, the implementation cost of industrial measures may
benefit from economies of scale.
A deep dive on reusing treated municipal wastewater in Ho Chi Minh City is available in Chapter 7.
Figure 23. Dong Nai River Basin – cost curve of solutions to reduce water stress in the dry season in 2030
It is estimated that reducing the basin’s water stress level to ‘low’ will require a total cost of $650 mn.
6.3.4 Mekong Basin
The Mekong River Basin is assessed as ‘water stressed’ (WEI = 22%) during the dry season by 2030 and
a total water demand reduction of 2.5 bn m3/yr will be required to move to a ‘low water stress’
classification, the basis of the ‘water gap’ analysis for Mekong Basin.
The Mekong basin has about 60% of Viet Nam’s water and produces 17% of the GDP and 50% of the
country’ rice. Approximately 75% of the basin’s water demand is for agriculture.

| | 35
Given the large area of rice cultivation, agricultural water efficiency interventions such as alternate dry
and wet rice management (AWD) could unlock significant reduction in water demand. Figure 24 shows
that the implementation of a handful of cost-effective agricultural interventions would suffice to close the
targeted water gap.
A deep dive on AWD is available in Chapter 7.
Figure 24. Mekong River Basin - cost curve of solutions to reduce water stress in the dry season in 2030
Due to the low cost and potential financial benefits of the assessed interventions (such as increased yield),
it is estimated that reducing the basin’s water stress level to ‘low’ could result in a cost saving of $650
mn.
6.4 Solution delivery
While section 6.3 illustrated the most cost-effective solutions to reduce water stress in the analysed river
basins to the target value, it needs to be understood what is required to deliver these solutions within the
framework of Integrative Water Resource Management (IWRM).
The successful implementation of the identified solutions depends on one or a combination of the
following:
• Incentives: The water user (farmer, industry, public service or citizen) requires an incentive to change
their behaviour towards sustainable water resource management
• Regulation (enforcement): Existing regulation needs to be stronger and more consistently enforced so
that water users frame their decisions within the regulatory context
• Regulation (new): A new regulation needs to be implemented to allow for the delivery of the solution

| | 36
• Finance: Financial support is required to implement the solution
• Technical support/ Capacity building: If technologies are part of the solution, support needs to be
provided in how to select and operate these. If no technologies are required, changes in practices
require capacity building.
Table 4 Requirements for successful solution delivery across all 24 measures
ID Category Identified solutions Responsible Institution
Ince
nti
ve
Re
gula
tio
n
(en
forc
em
en
t)
Re
gula
tio
n (
new
)
Fin
ance
Tech
nic
al s
up
po
rt /
Cap
acit
y b
uild
ing
1 Agricultural Managing evapotranspiration using quotas
MARD, Provincial People’s Committee (PPC), and irrigation companies
x x x
2 Agricultural Agricultural rainwater harvesting with fertigation
MARD, PPC, irrigation companies, and farm communities
x x x x
3 Agricultural Canal lining MARD, PPC, irrigation companies, and farm communities
x x x
4 Agricultural Drip irrigation MARD, PPC, irrigation companies, and farm households
x x x x
5 Agricultural Irrigation scheduling MARD, PPC, irrigation companies, and farm households
x x x
6 Agricultural Irrigation scheduling using satellite information
MARD, PPC, irrigation companies x x x
7 Agricultural Mulching MARD, PPC, farm households x
8 Agricultural Precision farming MARD, MOST, PPC, farm households x x x
9 Agricultural Soil techniques/no-till agriculture
MARD, MOST, PPC, farm households x x
10 Agricultural Sprinkler irrigation MARD, PPC, irrigation companies, and farm households
x x x x
11 Agricultural System of rice intensification (SRI)
MARD (extensional services), PPC, farm households
x x x
12 Agricultural Alternate Wet And Dry Rice Management Practice (AWD)
MARD (extensional services), PPC, farm households
x x x
13 Agricultural Change in irrigation practice (induced water stress)
MARD (extensional services), PPC, farm households
x x x
14 Industrial Industrial metering of non-revenue water
MARD, MOIT, MONRE, MOPS (Environment police), PPC
x x x x
15 Industrial Institutional capacity building to manage industrial water use
MOIT, MOH, MOST, MONRE, PPC x
16 Industrial Water recycling from industrial parks
MOIT, MOH, MOST, MONRE, PPC x x (x) x x
17 Industrial Zero discharge from industrial parks
MOIT, MOH, MOST, MONRE, PPC x x (x) x x
18 Industrial Industrial wastewater treatment MOIT, MOH, MOST, MONRE, PPC x x x x
19 Municipal Dual-flush toilets (retrofit) MOC, city developers (investors), PPC, City People’s Committee, city inhabitants
x x (x) x x
20 Municipal Faucets (new and retrofit) MOC, city developers (investors), businesses, PPC, City People’s Committee, city inhabitants
x x (x) x x
21 Municipal Municipal leakage
MOC, water suppliers, city developers (investors), businesses, PPC, City People’s Committee, city inhabitants
x x x x
22 Municipal Pressure management (in water supply networks)
MOIT, MOH, MOST, MONRE, PPC, City People’s Committee
x x x x
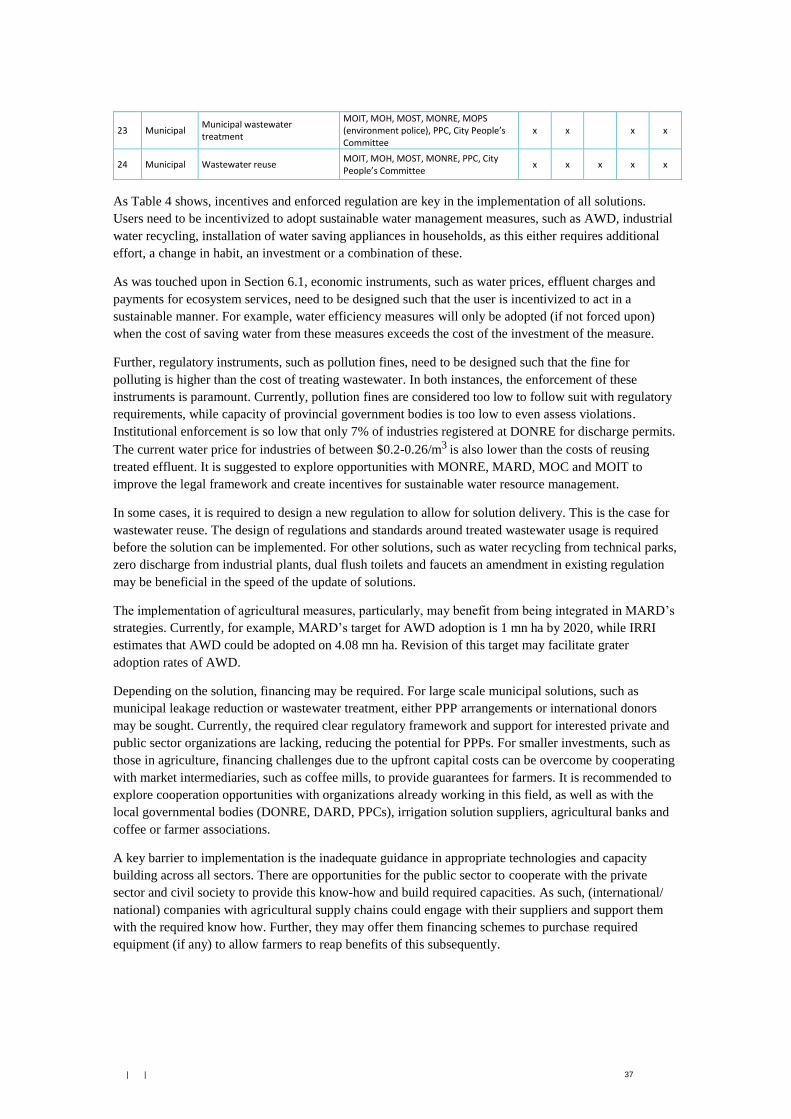
| | 37
23 Municipal Municipal wastewater treatment
MOIT, MOH, MOST, MONRE, MOPS (environment police), PPC, City People’s Committee
x x x x
24 Municipal Wastewater reuse MOIT, MOH, MOST, MONRE, PPC, City People’s Committee
x x x x x
As Table 4 shows, incentives and enforced regulation are key in the implementation of all solutions.
Users need to be incentivized to adopt sustainable water management measures, such as AWD, industrial
water recycling, installation of water saving appliances in households, as this either requires additional
effort, a change in habit, an investment or a combination of these.
As was touched upon in Section 6.1, economic instruments, such as water prices, effluent charges and
payments for ecosystem services, need to be designed such that the user is incentivized to act in a
sustainable manner. For example, water efficiency measures will only be adopted (if not forced upon)
when the cost of saving water from these measures exceeds the cost of the investment of the measure.
Further, regulatory instruments, such as pollution fines, need to be designed such that the fine for
polluting is higher than the cost of treating wastewater. In both instances, the enforcement of these
instruments is paramount. Currently, pollution fines are considered too low to follow suit with regulatory
requirements, while capacity of provincial government bodies is too low to even assess violations.
Institutional enforcement is so low that only 7% of industries registered at DONRE for discharge permits.
The current water price for industries of between $0.2-0.26/m3 is also lower than the costs of reusing
treated effluent. It is suggested to explore opportunities with MONRE, MARD, MOC and MOIT to
improve the legal framework and create incentives for sustainable water resource management.
In some cases, it is required to design a new regulation to allow for solution delivery. This is the case for
wastewater reuse. The design of regulations and standards around treated wastewater usage is required
before the solution can be implemented. For other solutions, such as water recycling from technical parks,
zero discharge from industrial plants, dual flush toilets and faucets an amendment in existing regulation
may be beneficial in the speed of the update of solutions.
The implementation of agricultural measures, particularly, may benefit from being integrated in MARD’s
strategies. Currently, for example, MARD’s target for AWD adoption is 1 mn ha by 2020, while IRRI
estimates that AWD could be adopted on 4.08 mn ha. Revision of this target may facilitate grater
adoption rates of AWD.
Depending on the solution, financing may be required. For large scale municipal solutions, such as
municipal leakage reduction or wastewater treatment, either PPP arrangements or international donors
may be sought. Currently, the required clear regulatory framework and support for interested private and
public sector organizations are lacking, reducing the potential for PPPs. For smaller investments, such as
those in agriculture, financing challenges due to the upfront capital costs can be overcome by cooperating
with market intermediaries, such as coffee mills, to provide guarantees for farmers. It is recommended to
explore cooperation opportunities with organizations already working in this field, as well as with the
local governmental bodies (DONRE, DARD, PPCs), irrigation solution suppliers, agricultural banks and
coffee or farmer associations.
A key barrier to implementation is the inadequate guidance in appropriate technologies and capacity
building across all sectors. There are opportunities for the public sector to cooperate with the private
sector and civil society to provide this know-how and build required capacities. As such, (international/
national) companies with agricultural supply chains could engage with their suppliers and support them
with the required know how. Further, they may offer them financing schemes to purchase required
equipment (if any) to allow farmers to reap benefits of this subsequently.

| | 38
6.4.1 Private sector:
The OECD Water at a Glance data shows that most developing countries, including Viet Nam, have
sought to involve the private sector to varying degrees, as a source of financing, but also to improve
efficiency in service delivery, reduce costs, contribute to long-term sustainability and favour technology
transfer.
The private sector operating in water and sanitation in Viet Nam is diverse with varied interests and
background. It includes international investors, water operators, industries and industrial parks,
agricultural operators, large users (such as the beverage and mining companies) and the finance
community, as well as joint ventures between public and private companies.
Private actors, in the form of small-scale providers, have also helped alleviate the deficiencies of service
provision where it has failed to keep pace with rapid population growth and urban migration, e.g. the
involvement of international companies under Build-Operate-Transfer (BOT) model to support the state
owned Water Service Companies.
There is opportunity to expand private sector involvement in water supply sanitation provision. However,
there is little private sector participation in publicly financed infrastructure projects. Primarily the private
sector has been involved where funding has been provided by international financial institutes, such as
ADB, or industrial units associated with international corporations. The recent municipal wastewater
treatment plant for Ho Chi Minh City being funded by Japanese Government and awarded to consortium
of Veolia, Hitachi, and POSCO E&C (of South Korea) is such an example.
Although foreign exchange controls have been removed which has improved the scene for foreign direct
investment, factors such as lack of minimum returns guarantees, inadequate loan security, and lack of
common procedures and standardized contracts still act as hindrance for international private sector
involvement where they are likely to face competition with local SOEs.96
Actions by the private sector, both local and international, is critical in delivering the identified solutions
identified in previous sections of this report. Some examples of their involvement are listed below (the list
is not exhaustive):
• Infrastructure provision in municipal, agricultural and industrial sectors for water supply and efficient
water use. (e.g. canal lining, drip irrigation, municipal leakage, metering, pressure management)
• Infrastructure provision in municipal, agricultural and industrial sectors for effluent treatment and
water reuse. (e.g. industrial wastewater treatment and recycling, municipal wastewater treatment,
• Training and capacity building for better and more sustainable water management practices. (e.g.,
improved irrigation practices incl. SRI and AWD, capacity building for industries on water efficiency
and pollution prevention).
• Information technology and information provision. (e.g., satellite data for irrigation scheduling and
precision farming.)
The institutional assessment has highlighted that there is unclear allocation of responsibilities across
different the government tiers and agencies and the multiplicity of government agencies responsible for
implementation and oversight has led lack of clarity for private sector. In addition, the lack of
enforcement of existing regulations as well as lack of financial incentives has led to lack of compliance
by private sector, e.g. fines for pollution at times are lower than instituting effluent treatment and
discharge compliance.
There is likely to be greater potential involvement of international water sector in industrial wastewater
treatment of the industrial parks, which are required under existing regulations to treat industrial effluent
before discharge. The enforcement of current laws, which are likely require institutional capacity

| | 39
building, can act as financial incentives to these industries to improve their wastewater treatment and thus
water quality of the receiving bodies.
The new Irrigation Law, which commoditises the water, may, despite seemingly only to aim at cost
recovery rather than setting incentives, enhance the economic incentives for the local private sector (both
industrial and agricultural) in implementing measures to increase water efficiency and reducing pollution
from their operations.
The international private sector also has a role to play through capacity building of their local partners,
financial support, or through procurement contracts aligned with sustainable water management in
corporate social and environmental policies. A number of international corporations already have
implemented such measures in both industrial and agricultural sectors, e.g. requiring local suppliers to
meet environmental and water efficiency standards in their operations and providing technical and
financial support. These exemplars operations could be promoted and replicated.

| | 40
7 Deep dives
Building on the previous chapter on solutions to close the water gap and move water stressed river basins
towards experiencing only ‘low water stress’, three solutions areas were selected for a deeper analysis.
Following stakeholder consultations, the solution areas were selected based on their potential impact,
regional relevance and feasibility of implementation. Selected deep dives include:
• Alternate wet and dry (AWD) rice management practice;
• Municipal wastewater treatment and reuse in Ho Chi Minh City; and
• Industrial wastewater treatment around Hanoi.
A fourth solution area was investigated as a response to declines in groundwater levels in the Central
Highlands:
• Enabling water efficiency for coffee production in the Central Highlands;
As agricultural water usage amounts to 80% in Viet Nam, two deep dives were selected in this area. The
deep dives provide an improved understanding on the impact, cost and barriers of implementation of
analysed measures. They also provide an indicative roadmap on implementation and relevant
stakeholders.
7.1 Alternate wet and dry rice management practice
7.1.1 The challenge
Rice is the dominant crop grown in Viet Nam and accounts for 58% of the total irrigated area. Majority of
the rice is grown in three regions: The Southern Delta (including the Mekong Delta) accounts for
approximately 50% of total rice production, followed by the Northern Delta and the Northern
Highlands.97 The climate in Viet Nam allows almost year round rice production, with up to three crops a
year grown in the Mekong Delta.
With an approximate 10,000 -12,000 m3/ ha water demand, rice requires very high volumes of water. This
issue is exacerbated due to old and inefficient irrigation systems and practices leading to high water
inefficiencies in rice production. Uncontrolled over-abstraction of groundwater in the key rice producing
areas of Mekong and Red Rivers is causing increased rate of depreciation in groundwater table. This not
only is leading to saline intrusion but also reduced irrigation efficiency in rice growth.
7.1.2 The solution
The Alternate Wetting and Drying (AWD) Rice Management Practice has the potential to reduce water
usage by 30% compared to continuous flooding. Research by Ha (2014) has found that the application of
AWD in Viet Nam can reduce water usage by 40-50%.
Using AWD practices can increase yield by up to 12% (or 0.7 t/ha) while simultaneously reducing the
costs for farmers ($38/ha) and thus increasing the profits for farmers by 25 to 37%. It also has added
benefit of reducing methane (CH4) emissions by an average of 48%.98
The AWD practice has been developed by International Rice Research Institute (IRRI) in cooperation
with national research institutions and has been piloted a number of countries including Viet Nam. It is
based on the research finding that rice plants can tolerate up to 30% reduction in water supply during the
main growing period when compared to conventional irrigation without affecting yields. The objective of
the practice is to manage soil moisture within the top layer of the soil medium to enable plant growth. The
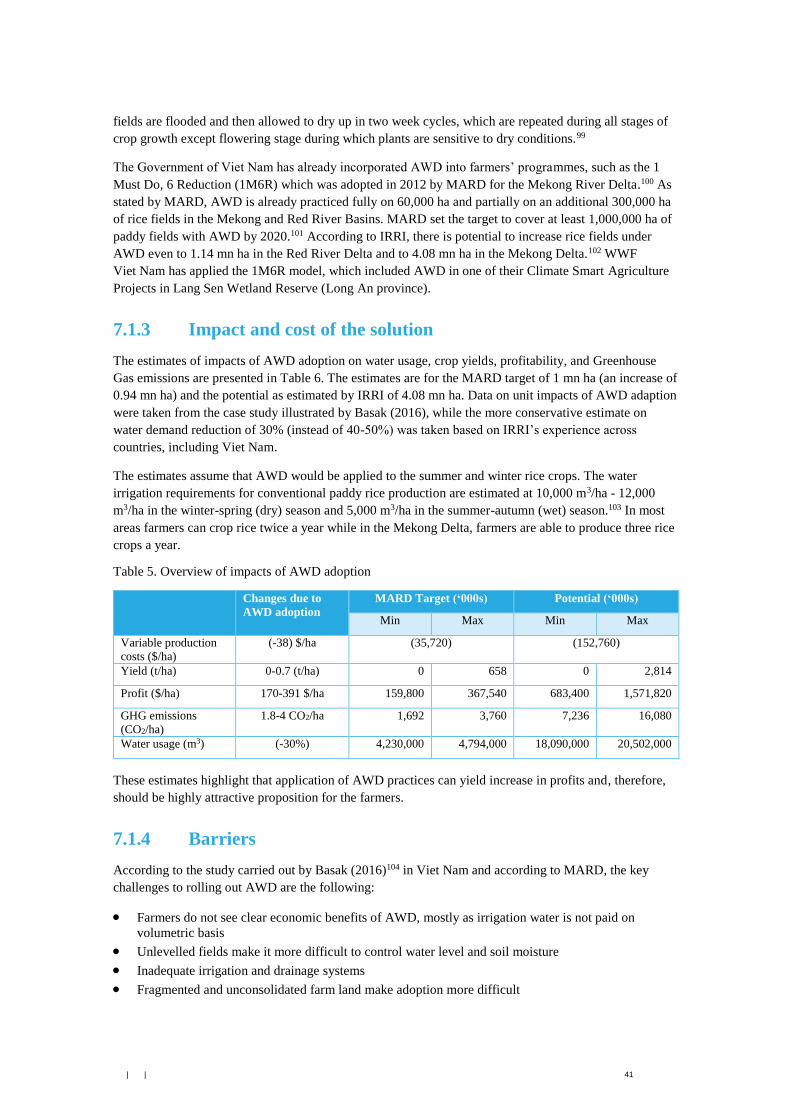
| | 41
fields are flooded and then allowed to dry up in two week cycles, which are repeated during all stages of
crop growth except flowering stage during which plants are sensitive to dry conditions.99
The Government of Viet Nam has already incorporated AWD into farmers’ programmes, such as the 1
Must Do, 6 Reduction (1M6R) which was adopted in 2012 by MARD for the Mekong River Delta.100 As
stated by MARD, AWD is already practiced fully on 60,000 ha and partially on an additional 300,000 ha
of rice fields in the Mekong and Red River Basins. MARD set the target to cover at least 1,000,000 ha of
paddy fields with AWD by 2020.101 According to IRRI, there is potential to increase rice fields under
AWD even to 1.14 mn ha in the Red River Delta and to 4.08 mn ha in the Mekong Delta.102 WWF
Viet Nam has applied the 1M6R model, which included AWD in one of their Climate Smart Agriculture
Projects in Lang Sen Wetland Reserve (Long An province).
7.1.3 Impact and cost of the solution
The estimates of impacts of AWD adoption on water usage, crop yields, profitability, and Greenhouse
Gas emissions are presented in Table 6. The estimates are for the MARD target of 1 mn ha (an increase of
0.94 mn ha) and the potential as estimated by IRRI of 4.08 mn ha. Data on unit impacts of AWD adaption
were taken from the case study illustrated by Basak (2016), while the more conservative estimate on
water demand reduction of 30% (instead of 40-50%) was taken based on IRRI’s experience across
countries, including Viet Nam.
The estimates assume that AWD would be applied to the summer and winter rice crops. The water
irrigation requirements for conventional paddy rice production are estimated at 10,000 m3/ha - 12,000
m3/ha in the winter-spring (dry) season and 5,000 m3/ha in the summer-autumn (wet) season.103 In most
areas farmers can crop rice twice a year while in the Mekong Delta, farmers are able to produce three rice
crops a year.
Table 5. Overview of impacts of AWD adoption
Changes due to
AWD adoption
MARD Target (‘000s) Potential (‘000s)
Min Max Min Max
Variable production
costs ($/ha)
(-38) $/ha (35,720) (152,760)
Yield (t/ha) 0-0.7 (t/ha) 0 658 0 2,814
Profit ($/ha) 170-391 $/ha 159,800 367,540 683,400 1,571,820
GHG emissions
(CO2/ha)
1.8-4 CO2/ha 1,692 3,760 7,236 16,080
Water usage (m3) (-30%) 4,230,000 4,794,000 18,090,000 20,502,000
These estimates highlight that application of AWD practices can yield increase in profits and, therefore,
should be highly attractive proposition for the farmers.
7.1.4 Barriers
According to the study carried out by Basak (2016)104 in Viet Nam and according to MARD, the key
challenges to rolling out AWD are the following:
• Farmers do not see clear economic benefits of AWD, mostly as irrigation water is not paid on
volumetric basis
• Unlevelled fields make it more difficult to control water level and soil moisture
• Inadequate irrigation and drainage systems
• Fragmented and unconsolidated farm land make adoption more difficult

| | 42
• Lack of capacity of farmers to implement AWD correctly (and lack of understanding to trust this
approach)
• Lack of policies to encourage farmers in application of AWD.
7.1.5 Roadmap
Currently the Law on Water Resources is under revision and is expected to come into effect in May 2017.
Following this, MARD will have the technical lead on setting the water price for irrigation as well as
guiding its implementation. In stakeholder discussions, MARD has expressed interest in receiving
external support for revising the irrigation water price to incentivise farmers to adopt water efficient
practices, e.g. AWD.
MARD has also expressed interest in getting technical support for other measures required to expand
AWD, such as levelling rice fields (e.g. laser land levelling technologies), creating awareness and
capacity (e.g. with farmers’ trainings), as well as infrastructure investments to improve the irrigation
systems.
There is potential for additional measures to support these activities, such as development of a
stakeholder platform in which all organisations working towards AWD, such as farmers’ organisations,
local NGOs, international NGOs, (sub-) governmental units have the opportunity to connect and scale
ideas and implementation. Detailed directions for up-scaling AWD is required from national level to
province, district and commune level. The governmental institutions could particularly benefit in
cooperating with local NGOs in creating awareness and capacity among the farmers.
As 50% of the rice is produced in the Mekong Delta, it is our recommendation that it should be the initial
focus for rolling out of any AWD programme. Once it has been successfully implemented there it can be
followed on in Northern Delta and Northern Highlands. The small average farm size in the North and
Centre of Viet Nam (0.13 ha/household) created a challenge to the adoption of AWD and will require
greater level of support for outreach and adoption (IRRI et al).105
Alternatively, the full 1 Must Do, 6 Reduction (1M6R) Approach can be adopted. This approach requires
farmers to use quality seeds (1 MUST) and to reduce seed density, fertilizer, herbicide, water, post-
harvest loss and GHG emissions (6 Reductions). This approach is more holistic than just applying AWD
and thus results in wider beneficial environmental effects, beyond water savings. Stakeholders should be
engaged to understand the optimal solution.
A targeted analysis can further refine identification of areas in the Mekong Delta that should be
prioritised, taking into account criteria such as existing infrastructure, adequate farm level size and
levelled fields.
7.1.6 Key Stakeholders and enablers
• MARD and MONRE
• Central Agricultural Extension Services (MARD): Provide technical support at provincial, district
and commune level
• DONRE and DARD
• International Rice Research Institute (IRRI)
• Water User Associations
• Irrigation and Drainage Management Companies
• Farmer’s organisations
• Sustainable Rural Development:106 An NGO that follows a participatory approach towards
sustainable rural development, incl. farmer field classes, focus groups, community based

| | 43
organizations, and training of trainer (ToT) courses around cropping, water management, irrigation
etc.

| | 44
7.2 Enabling water efficiency for coffee production in the
Central Highlands
7.2.1 The challenge
Groundwater tables have been falling by 20% in the past 10 years in the Central Highlands, particularly in
Viet Nam’s key coffee producing areas of Dak Lak and Dak Nong. In the dry season, average
groundwater tables are on average 4-5 meters lower than in the 1980s, resulting in increased cost of
abstraction and reduced water availability not only for agriculture and domestic use. Groundwater
withdrawals for coffee irrigation are assumed to be the key driver, as the groundwater tables are
comparatively lower around dense coffee plantation areas.107 Land use changes, i.e. the conversion from
forests to coffee plantations, are assumed to have aggravated the situation, due to the higher water
requirements of coffee plantations as compared to the forest and due to the reduced infiltration rats of run-
off to the aquifers.
The Central Highlands were particularly hard hit during the recent drought between 2014 and 2015. This
is of high significance as 88% of the coffee is produced in these areas, with Dak Lak (32%), Lam Dong
(24%) and Dak Nong (19%) accounting for majority of the coffee production.108 During the dry season
between January and April, coffee requires supplementary irrigation,109 which in these areas is usually
sourced from groundwater sources.110
Further, D’haeze 111found that due to the rapid expansion, the ‘coffee area in Dak Lak province exceeds
the spatial extents in terms of sustainability’ and that there was a ‘mismatch between the present land use
pattern and the natural resource base’. This issue has also been identified by MARD, which set a target to
reduce overall coffee production area in the Central Highlands from 577,121 ha to 542,500 ha – a 6%
decrease. This reduction could impact the majority of the 600,000 coffee farmers in Viet Nam.
Only a few large farms were found to use drip irrigation for coffee production, offering potential scope
for increasing the water use efficiency.112 However, as 75% of the farmers are smallholders, there are
challenges around awareness raising, high upfront capital costs and barriers to access credit.
7.2.2 The solution
Water stress conditions for plants, where the water supply to their roots becomes limiting, has an effect on
their growth and development. For coffee plants, Amarasinghe et al113 have identified that changing the
irrigation patterns to artificially ‘induce plant water stress’ between January and April could result in
reduced water use, but also increase green bean yields. The achievement of this targeted irrigation
scheduling can be supported by the usage of precision irrigation systems.
MARD recommends an irrigation application of 650 litres/plant/round in three rounds.114 However, due
to insufficient information, many smallholder famers were found to irrigate twice this recommended
level.115 Amarasinghe et al also found that further reducing water application to 150-300 litres/ plant/
round could save 500 to 1000 m3/ha / year of irrigation water, while even increasing yields.
In addition to the above measure, achieving the target set by MARD for sustainable levels of coffee
productions will also aid in reducing the abstraction of groundwater.
7.2.3 The Impact
According to ADB (2009), 20% of Viet Nam’s groundwater resources are located in the Central
Highlands (12.6 mn m3/yr). However, according to FAO, only 7% (or 0.824 mn m3/yr) of these
groundwater resources can be sustainably abstracted across Viet Nam.

| | 45
While a location specific assessment would be required, this can be used as an estimate to understand the
magnitude of the challenge. Current average water demand for coffee production is estimated at
4,000 m3/ha, which amounts to an annual water demand of 2.3 bn m3/yr – of which less than 1% can be
met by sustainable groundwater abstraction.
Depending on the percentage of coffee area adopting the induced water stress production method, the
following water savings can be potentially realised (see Table 6Error! Reference source not found. b
elow):
Table 6. Water saving scenarios for adoption of 'induced water stress' method for coffee irrigation
Water savings if % area
adopts method
% area adopting induced
water stress method
Minimum
(mn m3)
Maximum
(mn m3)
10% 29 58
30% 87 173
50% 144 289
70% 202 404
90% 260 520
100% 289 577
Assuming the best case of 100% adaption rate and maximum water savings, 25% of water demand can be
saved. Assuming a more likely 50% adaption rate and a conservative estimated on water savings, 6%
could be saved.
Further, a yield increase to a minimum of 4,000 kg/ha has been observed for areas applying the induced
water stress method. Average yield of green coffee beans vary between 2,161 kg/ha (in 2009) to 3,458
kg/ha (2006). This can also be explained that farmers participating in this method pay greater attention
also to other inputs, such as fertilisers. Given that coffee production currently isn’t very profitable for
farmers, and farmers are switching to other cash crops, the change in irrigation methodology can be
expected to result in higher profits from increased yield and reduced inputs.116
Table 10 illustrates that the reduction of the coffee plantation area to meet the MARD target can save 6%
(138 mn m3/yr) of total coffee water demand in the Central Highlands.
Table 7. Water savings for MARD targeted reduction of coffee area
Current area (ha) 577,121
Target area (ha) 542,500
Water usage 2014 (mn m3/yr) 2,308
Target water usage (mn m3/yr) 2,170
Water reduction (mn m3/yr) 138
% reduction 6%
The above demonstrates that a greater scale of water saving can be achieved by expanding the adoption
rate of the induced water stress method.
7.2.4 Barriers
As 75% of the coffee growers are smallholding farmers, increasing the transaction costs of implementing
any programme is a major barrier to any initiative where up-front capital costs are required. Furthermore,
it can be assumed that smallholders are more reserved in adopting new methods, fearing the risk of losing

| | 46
their livelihood. These fears can be alleviated by starting pilot projects in which positive results are
demonstrated and adequate training and capacity building of the farmers to ensure that these methods are
properly applied.
A targeted irrigation system is necessary to implement the induced water stress methods. This will also
require stakeholder consultations and site assessments to identify whether drip irrigation is required, or
whether the same results can be achieved by less efficient irrigation schemes, such as sprinkler irrigations.
If drip irrigation should be required, the initial capital costs of approx. $2,200 to $2,450/ha were found to
be prohibitive for smallholders.117 Even where cost benefit assessment can show that the costs can be
recovered through increased level of profits, smallholders can face challenges in accessing credit due to
lack of collateral.118
The latter challenge can be overcome by establishing a collaborative scheme involving government, key
agricultural banks and coffee mills, where the mills can offer to pay the bank in the event of farmer
default. The coffee farmer needs to bring his harvest to the mill for processing, thus, offering an indirect
collateral to the bank. A similar financial model is being adopted in Karnataka (India) and had enabled
sugarcane farmers to access finance for drip irrigation.
7.2.5 Roadmap
The following steps are recommended to assess the potential impact of suggested projects:
• Stakeholder engagement, including researchers of identified case studies, private sector
implementation teams, farmer organisations etc. to gain deeper insights into project requirements and
options for scaling up
• Discussion with irrigation supply companies, banks, Viet Nam coffee and cocoa association, and
Farmers Union on potential credit schemes for drip irrigation
• Launch of a pilot project/ illustration of already implemented projects by Nestlé.
• Focus on presenting the switch to induced water stress irrigation as business case to the farmers, as
yields can increase and inputs, such as fertilizers, decrease, resulting in higher profits.
• Design and implement capacity building programmes for farmers to correctly adopt irrigation method
• Raise awareness via Provincial People’s Party Committee and or radio/ TV broadcast and social
media.
7.2.6 Key Stakeholders and enablers
• Researchers including IWMI, Embden Drishaus and Epping (EDE) Consulting, Western Highlands
Agriculture and Forestry Science Institute (WASI), Viet Nam
• Nestlé / Nestlé Farmer Connect network in Viet Nam
• Swiss Agency for Development and Cooperation
• Farmers Union
• Agricultural Banks
• Viet Nam Coffee and Cocoa Association
• Irrigation system supplier
• DONRE and DARD
• Provincial People’s Committee

| | 47
7.3 Municipal wastewater treatment and reuse in Ho Chi Minh
City
7.3.1 The challenge
Ho Chi Minh City is a delta city and the largest conurbation in Viet Nam. The city has a population of
approximately 8.5 mn projected to increase to 10 mn by 2025 and is the economic hub of Viet Nam with
an estimated gross domestic product (GDP) of $43.7 bn.
The current domestic and industrial water demand is estimated at approximately 3,500,000m3/d. Although
the majority of the water is abstracted from surface water sources, groundwater overexploitation has led
to declines in groundwater levels, deteriorating water quality due to saline intrusion and land subsidence.
Surface water quality is impacted by agricultural and aquaculture activities upstream and untreated
wastewater discharges.
At present, all industrial zones in HCMC are reported to have central wastewater treatment plants which
generate approximately 240 000 m3/d of treated wastewater.119
Less than 10% of the total municipal wastewater discharges are currently treated and the government is
actively exploring opportunities to expand the existing network and wastewater treatment capacity to 70%
by 2020 and 100% by 2030. The current plans for municipal wastewater treatment investment is
summarised in Table 8.
Table 8. Existing and planned wastewater treatment capacity in Ho Chi Minh City
Wastewater Treatment
Plants
Capacity (m3/d) Status Project value
($m)
Bing Hung Phase 1: 141,000
Phase 2: upgrade to 469,000
Completed
Ongoing
-
131.5
Bing Hung Hoa 30,000 Completed -
Nhieu Loc-Thi Nghe Phase 1: 480,000 (2020)
Phase 2: upgrade to 600,000 (2025)
Phase 3: upgrade to 830,000 (2040)
Ongoing
Planned
Planned
495 (WB loan)
N/A
N/A
Tham Luong-Ben Cat Phase 1: 131,000
Phase 2: upgrade to 250,000
Planned
Planned
85
N/A
Tay (West) Sai Gon WwTW 150,000 Planned 80
Bac Sai Gon 1 170,000 Planned N/A
Tan Hoa – Lo Gom 300,000 Planned N/A
Binh Tan 180,000 Planned N/A
Other (6 no) 850,000 Planned N/A
7.3.2 The solution
The anticipated growth in wastewater treatment provides an opportunity to reuse effluent for non-potable
water uses and reduce the dependency on freshwater sources.
The typical wastewater effluent standards in Viet Nam can be achieved by secondary treatment and are
presented in Table 9. If the process is designed appropriately, the anticipated plant performance should be
significantly better than these effluent standards.

| | 48
Table 9. Wastewater effluent standards in Viet Nam
The US EPA’s guidelines for water reuse (2012)120 provide guidance on the use of treated effluent for
different uses (refer to Table 10). Although irrigation of food crops with treated effluent is common
globally, WHO guidelines provide procedures to minimise risks of microbial contamination of crops,
especially those grown for raw consumption such as certain vegetables and fruits.
Table 10. Suggested effluent reuse treatment and uses
Primary treatment
Sedimentation
Secondary treatment
Biological oxidation and
disinfection
Tertiary/advanced treatment
Chemical coagulation, filtration and
disinfection
• No uses recommended at this
level
• Surface irrigation of orchards
and vineyards
• Non-food crop irrigation
• Restricted landscape
impoundments
• Groundwater recharge of non-
potable aquifer
• Wetlands, wildlife habitat,
stream augmentation
• Industrial cooling processes
• Landscape and golf course
irrigation
• Toilet flushing
• Vehicle washing
• Food crop irrigation
• Unrestricted recreational
impoundment
7.3.3 Impact and cost of the solution
The use of secondary treatment with disinfection should enable the limited use of treated effluent for
industrial and urban uses. Additional tertiary treatment and disinfection would allow the extensive use of
treated effluent. The non-potable water demand in Ho Chi Minh City in 2025 is estimated at over
4,000,000m3/d.121 Effluent reuse could meet between 500,000 and 3,700,000m3/day of this demand.
Parameters Units Effluent Standard
(QCVN 14-2008 Class A)
pH
5-9
BOD (20oC) mg/l 30
TSS mg/l 50
Total Diluted Solids mg/l 500
Sulphur mg/l 1
Ammonia mg/l 5
Nitrate (NO3) mg/l 30
Oil mg/l 10
Total surface active agent mg/l 5
Phosphate (PO4) mg/l 6
Total Coliform MPN/100 ml 3,000

| | 49
Table 11. Potential of effluent reuse for non-potable water use in Ho Chi Minh City (2025 estimates)
* Assumed that 50% of the use could be met through effluent reuse
** Assumed that 20% of the use could be met through effluent reuse
The cost of the planned wastewater treatment works is likely to be in the region of $0.25/m3 of water
treated. The additional costs to meet the Options 1 and 2 effluent treatment requirements are estimated at
$0.1/m3 and $0.25/m3 of water treated respectively.122 Therefore, the total costs for Options 1 and 2 are
$0.35/m3 and $0.45/m3 of water treated respectively.
The cost for the treated effluent distribution system has been excluded as the layout will be governed by a
number of factors, including the locations of planned water reuse facilities in relation to potential users,
topography, soil and geological conditions, land use, right-of-ways and existing and planned roads.
7.3.4 Barriers to implementation
The total cost for treating and reusing treated effluent ($0.35-0.45/m3) compares unfavourably to the
water tariff for potable water which is up to $0.4/m3. In addition, the treated effluent volumes currently
available are low and it is unlikely they will increase significantly before 2020. They should be sufficient,
though, to commence a small scale pilot trial on the feasibility of this solution.
Retrofitting water reuse collection and transmission networks is costly and can cause severe disruption to
a megacity like Ho Chi Minh City. Therefore, the greatest opportunities for water reuse projects are likely
to be in serving new urban and industrial areas and agricultural/green areas near the city.
Decision No 1930/QD-TTg (20 November 2009) describes the development of urban drainage and
wastewater up to 2025 and the vision to 2050. It includes the extensive 20-30% of treated wastewater
from domestic properties in Viet Nam and reuse for water planning, road cleaning and other urban water
uses. This is supported by other Vietnamese legislation which endorse resource recovery and reuse
including wastewater treatment and reuse. Although there are some contradictions in legislation,123 the
most important issues are inadequate guidance in appropriate wastewater treatment technologies and
insufficient funding mechanisms. This leads to lack of implementation and support for projects and
programmes which could assist interested public and private sector organisations.124
Users Description Demand
(m3/day)
Option 1-
Secondary
treatment and
disinfection
Option 2 -Tertiary
treatment and
disinfection
Urban Road washing and fire
extinguishing
340,000 No Yes
Garden & park watering 199,000 No Yes
Toilet flushing and cloth
washing
1,020,000 No Yes
Watering golf courses and
sport facilities
19,000 No Yes
Greening belt 58,000 Yes Yes
Industry Industrial use: 623,000 No Depends on use*
Cooling water 160,000 Yes Yes
Others 249,000 No Depends on use*
Agriculture Irrigation and aquaculture 1,391,000 Non-food crops
only**
Yes
Landscape and
recreation
Ponds and water parks 46,000 No Yes
Total 4,105,000 496,200 3,669,000

| | 50
7.3.5 Roadmap
There are opportunities to support potential municipal water reuse opportunities by:
• Working with ministries such as MONRE, MARD and the MoC to improve the legal framework,
provide technical guidance on water quality standards and finance advice.
• Engaging with HCMC Department of Planning and Investment to confirm the current wastewater
treatment programme and aspirations.
• Reviewing the HCMC planning standards to promote the installation of dual distribution systems for
new developments.
• Explore opportunities with the private sector and developers with regards to the construction,
operation and commercialisation of non-potable networks.
7.3.6 Key stakeholders and enablers
• JICA and the World Bank as key stakeholders in wastewater treatment projects in Ho Chi Minh City
• HCMC Department of Planning and Investment
• MONRE
• MARD (if treated effluent is used for agriculture)
• MoC
• Local authorities
• Developers of commercial and residential buildings and sites
• Farmers’ organisations

| | 51
7.4 Industrial wastewater treatment around Hanoi
7.4.1 The challenge
Hanoi is Viet Nam’s second city with a population of 7.6 mn in 2016, expected to increase to 9 mn by
2030.125 28% of the country’s industrial production (by value) was generated in Red River Delta, large
portion of it produced in and around Hanoi.
Hanoi’s six key industries, namely textile; food processing; chemicals; mechanical manufacturing;
electronics; and information technology, have been critical to the city’s industrial development and
contribute 60 percent of the city’s total industrial production value and employ for 50% of the industrial
workforce (Viet Nam Chamber of Commerce and Industry).126 In addition to the industries in Hanoi,
there are numerous craft villages in adjoining provinces of Hay Tay and Bac Ninh. These include high
water use industries, such as food processing, metalwork, paper, and textiles.
The primary source of pollution is untreated domestic wastewater from North and South Tu Liem
Districts and Ha Dong District, followed by industrial wastewater from production facilities and Tu Liem
industrial cluster, and Phu Do craft village. Of the 550,000 mn m3 of wastewater discharged into the river,
both treated and untreated, industries accounts for 24% of the wastewater effluent and the craft villages
accounting for 4% of the wastewater effluent discharged into the Nhue-Day River.127
Though there are legislative requirements for all government and privately operated Industrial Zones to
treat industrial effluent prior to discharge, there is a lax enforcement of these regulations. Table 12 below
presents the lack of appropriate treatment in most industrial facilities in Nhue-Day sub-basin.128
Table 12. Presence of industrial water treatment in Nhue-Day basin in 2010
City Industrial Parks Industrial Clusters Industrial points Craft villages
Total Without
CETP
Total Without
CETP
Total Without
CETP
Without WW
treatment
Hanoi 13 12 37 35 43 43 257
Ha Nam 11 10 6 6 5 5 14
Nam Dinh 11 10 16 16 - - 75
Source: World Bank 2010
This heavily polluted water from Nhue River is used to water more than 80,000 ha of cultivation land. A
considerable amount of the river water is infiltrates into groundwater and used as the water supply for
millions of inhabitants along Nhue River (IWRP, 2010). Pollution levels in water supplied from
My Dinh II plant prompted its closure in 2014 by VEA129, and similar incidences are likely to increase
unless water quality in the basin improves.
7.4.2 The solution
7.4.2.1 Municipal effluent treatment
Most industries and industrial estates are located in suburban districts where neither municipal sewers nor
centralized municipal wastewater treatment is available in most areas. However, the expansion of
drainage and new Municipal ETPs can also capture and treat the industrial effluents. Hanoi has four ETPs
in operation with design capacity of 248,000 m3/d, but according to MONRE currently operating at
133,300 m3/d due to lack of drainage infrastructure.130

| | 52
Expanded drainage network and at least an additional 650,000 m3/day treatment capacity will be required
by 2030 to capture and treat all the wastewater effluent in Hanoi. There is a stated intention of Municipal
Government to invest VND 42 Trillion ($2 bn) by 2020 to upgrade both drainage and effluent treatment
capacity.131
7.4.2.2 Industrial zone CETP and wastewater reuse
The state owned and private Industrial Zones (IZ), as well as Industrial Clusters and industrial units in
craft villages in Hanoi, Ha Nam, and Bac Ninh, discharge 60,000 m3 of untreated effluent into the Nhue-
Day Basin every day. There is opportunity to implement CETP in these clusters and craft villages, along
with training for better wastewater management practices. Currently, the World Bank and IFC are
working in four industrialised provinces, including three IZs in Nam Dinh and four IZs in Ha Nam, to
improve compliance with industrial wastewater treatment regulations. Work carried out include the
development of environmental monitoring infrastructure and the improvement in environmental
enforcement activities.
Table 13. Cost of CETP for treatment of industrial effluents
City
Industrial Parks Industrial Clusters Industrial points
Flow (m3/d) Capital Cost
($ mn)
Flow (m3/d) Capital Cost
($ mn)
Flow (m3/d) Capital Cost
($ mn)
Hanoi 63,900 33.0 37,900 18.8 6,200 3.3
Ha Nam 17,530 9.5 1,670 0.93 580 0.32
Nam Dinh 3,170 22.8 9,600 8.4 - -
Total 65.3 28.13 3.62
Source: World Bank 2010
The industrial water use tariff in Hanoi of 4,500 to 6,000 VND/m3 (or $0.2 to $0.26) is significantly lower
when compared to the additional cost of treating industrial effluent for reuse. To incentivise wastewater
reuse at Industrial Zone level, the costs for effluent discharge will need to be raised to provide appropriate
financial incentives.
In the absence of such incentives, the most suitable outcome will be to ensure that the treated effluent
meets the water quality guidelines by WHO and FAO for crop irrigation purposes.
7.4.2.3 Craft villages – on site treatment
For the industries that lie outside of the Industrial Clusters onsite treatment is not feasible in majority of
the circumstances. However, there may be an opportunity to implement decentralised ETP to treat both
effluents from industrial and domestic premises.
7.4.3 Impact of the solution
MONRE estimates the industrial effluent accounts for 61 tonnes of BOD/day in the Nhue-Day basin and
municipal wastewater accounts for 162 tonnes of BOD/day, accounting for 27% and 73% of the total
BOD load.132
Treatment of the wastewater effluent will improve the state of water bodies in Nhue-Day sub-basin,
increase the utility of the water for irrigation and aquaculture, and reduce the health risks and hazards for
residents living in proximity of the polluted water bodies.

| | 53
In addition, recent research has indicated that improvement of water quality can enable 10-12% reduction
in water use to grow the same yield of crop.132 Therefore, treating the wastewater effluents can reduce the
water gap in the sub-basin by 10% if adequate abstraction management controls are put in place.
7.4.4 Barriers
As of 2010, only 7% of industries that would need a Wastewater Discharge Permit (WWDP) were
registered with DONRE with regards to their wastewater discharge permits.133 Without adequate
incentives, such as enforcement by DONRE or DARD, this number will stay low and the information
about pollution levels will not be captured.
Decree 67 on Environmental Protection Charges for Wastewater instituted tariffs for pollution of the
environment based on three organic indicators (BOD, COD, TSS) and four heavy metal indicators
(Mercury, Lead, Arsenic, Cadmium). However, these sampling measurements are costly and there is
limited capacity at local level for this.
Decree 81 allows for sanctions for violation of environmental regulations. Unfortunately the low level of
fines does not provide a strong enough disincentive to environmental violations. Industries often prefer to
pay fines than to solve the environmental problem.
Under the regulation, a CETP does not need to be built before the start of operations of a new Industrial
Park. This can result in a period where untreated effluent is discharged into the environment.
The regulation do not require an industry in an Industrial Zone to be connected to an existing or proposed
CETP and the industrial unit can choose to treat its wastewater and obtain a discharge license. For
Infrastructure Development Companies (IDC), that provide, own and operate CETP, this is a problem as
it is difficult to design CETP without knowledge of flow and loading. It also is a financial risk for IDC if
some industries do not use the CETP.
The tariffs (VND 4000/m2 and 3,000 to 5000 VND/m3 of wastewater) are too low for full cost recovery
and do not provide financial incentives for IDC to invest in CETPs. Provinces are reluctant to increase
fees for fear of losing investors. Even with low rates, industries are often reluctant to pay these tariffs.
Craft villages currently have almost no environmental management and control.
7.4.5 Roadmap
There are opportunities to support potential industrial water treatment and reuse opportunities by:
• Working with ministries such as MONRE, MARD and MOIT to improve the legal framework
regarding connection requirements to industrial zone CETP.
• Working with MONRE, MOIT and VEPA to improve legal framework and sanction structure on
breach of environmental regulations, linking to the current World Bank / IFC initiatives in industrial
pollution management.
• Engaging with Hanoi DOIT, DONRE and DARD to review industrial water and wastewater tariff
structure.
• Assisting Infrastructure Development Companies on financing of CETP and Industrial Water Reuse
systems.
In addition, opportunities can be explored with the private sector and developers with regards to the
construction, operation and commercialisation of CETP and non-potable networks within Industrial
Zones and Industrial Clusters.

| | 54
7.4.6 Key Stakeholders and enablers
The key stakeholders for industrial water management in Viet Nam are listed in Table 14.
Table 14. List of key stakeholders and enablers for waste water management at industrial units in Viet
Nam
Stakeholders Industrial Estate Standalone
industries
Craft Villages
(Hanoi & Ha
Tay)
Craft Villages
(Ha Nam & Nam
Dinh)
MONRE ✓ ✓
DPI ✓
DOIT
✓ ✓
DONRE
✓
DARD
✓
Industrial Management
Boards
✓
District Authorities ✓ ✓
Provincial Industrial Zones
Authorities
✓
River Basin Committees ✓ ✓ ✓ ✓
Provincial People’s
Committees
✓ ✓ ✓
Infrastructure Development
Companies (IDC)
✓
VEPA ✓ ✓ ✓ ✓


| | 55
8 Conclusions and recommendations
The analysis shows that by 2030 all but five river basins in Viet Nam are expected to face some level of
water stress in the dry season. Key river basins for the Vietnamese economy will face ‘water stress’ or
even ‘severe water stress’ at the same timescale. The situation may deteriorate further as hydroelectric
power generation – the engine of Viet Nam’s past industrialisation and modernisation – has reached such
large proportions that water sharing conflicts between electricity generation, agriculture, industry and
municipalities have already occurred in critical dry periods.
Falling groundwater tables due to groundwater over-exploitation are causing challenges in meeting
demand in the dry season, with implications in the Mekong, where 50% of Vietnam’s rice is produced,
and in the Central Highlands, where 88% of Vietnam’s coffee is grown. Falling groundwater tables are
also linked to land subsidence in Hanoi, Ho Chi Minh City and Da Nang. With only 10% of the municipal
and industrial wastewater treated, Viet Nam’s surface waters face serious pollution issues. Many rivers in
and around major cities are considered ‘dead rivers’ resulting in an increase in groundwater dependence.
Due to lack of clean water resource, polluted water is used for irrigation downstream with unforeseen
public health implications.
The report recommends prioritisation of cost-effective interventions to address water stress and water
pollution issues in the key basins:
• South East River Corridor (SERC): A water demand reduction of 770 mn m3/yr is required to
close the water gap by 2030, while 1.8 bn m3 are required to reduce the water stress level from
‘severely water stressed’ to ‘low water stress’. This is a significant challenge, as this accounts for as
much as 65% of the total basin water demand. Together with the implementation of selective cost
effective demand management interventions, consideration of water supply augmentation measures
(such as aquifer recharge and increased reservoir storage) is necessary to close the water gaps. The
cost to eliminate the water gap is estimated at $900 m, while achieving a ‘low water stress’ status
will require an estimated total cost of at least $3 bn.
• Red-Thai Bin basin: To move the basin from ‘water stressed’ to ‘low stress’ status during the dry
season by 2030, a total water demand reduction of 4.9 bn m3/yr is required. A mix of agricultural,
municipal and industrial interventions could achieve the required target at a cost of $2 bn.
• Dong Nai basin: To move the basin from ‘water stressed’ to ‘low water stress’ status during the dry
season by 2030, a total water demand reduction of 1.85 bn m3/yr is required. A suite of agricultural,
municipal and industrial interventions could achieve the required target at an estimated cost of $650
mn.
• Mekong basin: To move the basin from ‘water stressed’ to ‘low water stress’ status during the dry
season by 2030, a total water demand reduction of 2.5 bn m3/yr is required. Given that 76% of the
basin’s water demand is from agriculture, a handful of cost effective agricultural interventions are
sufficient to achieve the target. Adoption of the optimum measures could result in a total saving of
$650 mn.
Deep dives were conducted to provide a more detailed insight into selected interventions which were
identified as ‘high impact’ areas for a future work plan in Viet Nam. These are as follow:
• Alternate Wet and Dry (AWD) Rice Management Practice: Water efficiency measures in rice
production can have a great impact on reducing agricultural water demand. AWD has the potential to
reduce demand by 30% and is endorsed by the Government of Vietnam. The MARD target for AWD
adoption is 1 mn ha by 2020, while IRRI estimates that AWD could be adopted on 4.08 mn ha.
Achievement of the MARD target could reduce water demand by up to 4.79 bn m3/yr. AWD also
results in yield increases which could present a business case for farmers. Engagement with MARD
is recommended to revise irrigation incentives as part of the decree development for the new law on
Hydraulic/ Irrigation infrastructure. In addition, there may be collaboration opportunities to convene
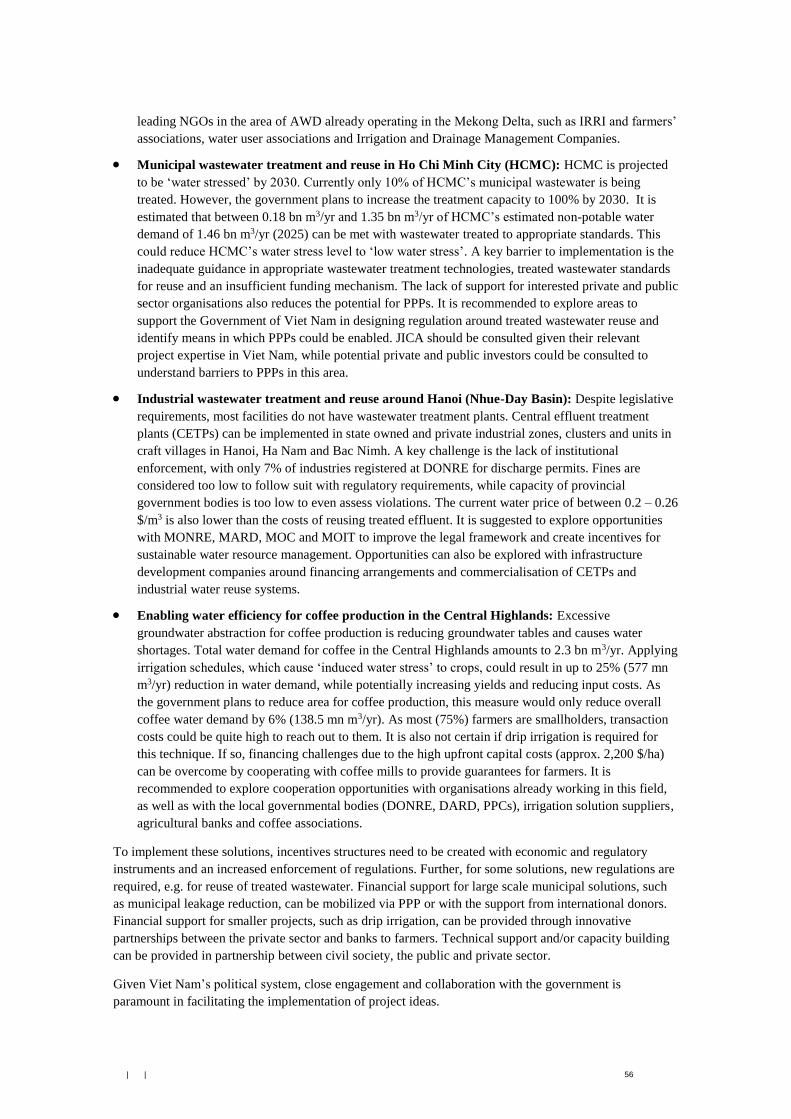
| | 56
leading NGOs in the area of AWD already operating in the Mekong Delta, such as IRRI and farmers’
associations, water user associations and Irrigation and Drainage Management Companies.
• Municipal wastewater treatment and reuse in Ho Chi Minh City (HCMC): HCMC is projected
to be ‘water stressed’ by 2030. Currently only 10% of HCMC’s municipal wastewater is being
treated. However, the government plans to increase the treatment capacity to 100% by 2030. It is
estimated that between 0.18 bn m3/yr and 1.35 bn m3/yr of HCMC’s estimated non-potable water
demand of 1.46 bn m3/yr (2025) can be met with wastewater treated to appropriate standards. This
could reduce HCMC’s water stress level to ‘low water stress’. A key barrier to implementation is the
inadequate guidance in appropriate wastewater treatment technologies, treated wastewater standards
for reuse and an insufficient funding mechanism. The lack of support for interested private and public
sector organisations also reduces the potential for PPPs. It is recommended to explore areas to
support the Government of Viet Nam in designing regulation around treated wastewater reuse and
identify means in which PPPs could be enabled. JICA should be consulted given their relevant
project expertise in Viet Nam, while potential private and public investors could be consulted to
understand barriers to PPPs in this area.
• Industrial wastewater treatment and reuse around Hanoi (Nhue-Day Basin): Despite legislative
requirements, most facilities do not have wastewater treatment plants. Central effluent treatment
plants (CETPs) can be implemented in state owned and private industrial zones, clusters and units in
craft villages in Hanoi, Ha Nam and Bac Nimh. A key challenge is the lack of institutional
enforcement, with only 7% of industries registered at DONRE for discharge permits. Fines are
considered too low to follow suit with regulatory requirements, while capacity of provincial
government bodies is too low to even assess violations. The current water price of between 0.2 – 0.26
$/m3 is also lower than the costs of reusing treated effluent. It is suggested to explore opportunities
with MONRE, MARD, MOC and MOIT to improve the legal framework and create incentives for
sustainable water resource management. Opportunities can also be explored with infrastructure
development companies around financing arrangements and commercialisation of CETPs and
industrial water reuse systems.
• Enabling water efficiency for coffee production in the Central Highlands: Excessive
groundwater abstraction for coffee production is reducing groundwater tables and causes water
shortages. Total water demand for coffee in the Central Highlands amounts to 2.3 bn m3/yr. Applying
irrigation schedules, which cause ‘induced water stress’ to crops, could result in up to 25% (577 mn
m3/yr) reduction in water demand, while potentially increasing yields and reducing input costs. As
the government plans to reduce area for coffee production, this measure would only reduce overall
coffee water demand by 6% (138.5 mn m3/yr). As most (75%) farmers are smallholders, transaction
costs could be quite high to reach out to them. It is also not certain if drip irrigation is required for
this technique. If so, financing challenges due to the high upfront capital costs (approx. 2,200 $/ha)
can be overcome by cooperating with coffee mills to provide guarantees for farmers. It is
recommended to explore cooperation opportunities with organisations already working in this field,
as well as with the local governmental bodies (DONRE, DARD, PPCs), irrigation solution suppliers,
agricultural banks and coffee associations.
To implement these solutions, incentives structures need to be created with economic and regulatory
instruments and an increased enforcement of regulations. Further, for some solutions, new regulations are
required, e.g. for reuse of treated wastewater. Financial support for large scale municipal solutions, such
as municipal leakage reduction, can be mobilized via PPP or with the support from international donors.
Financial support for smaller projects, such as drip irrigation, can be provided through innovative
partnerships between the private sector and banks to farmers. Technical support and/or capacity building
can be provided in partnership between civil society, the public and private sector.
Given Viet Nam’s political system, close engagement and collaboration with the government is
paramount in facilitating the implementation of project ideas.

Appendix A
List of stakeholders consulted

| | 57

| | Page A1
A1 List of stakeholders consulted
Organisation Name Position
Centre for Environment and
Community Research (CECR) Mr Nguyen Tien Dung Project Coordinator
Centre for Environment and
Community Research (CECR) Ms Dinh Thu Hang Project officer
Centre for Environment and
Community Research (CECR) Ms Lo Thanh Hoa Team leader
Coca Cola Ms Nguyen Thi Y Nhu Government Relation
Manager
Embassy of Canada Ms Le Thi Mai Huong Development Officer
Embassy of Canada Mr Robert Foote Project Director
Embassy of Israel Ms Nguyen Thi Bao An Mashav Officer
General Department of Water
resources, MARD Mr Nguyen Viet Anh Vice Head
General Department of Water
resources, MARD Mr Nguyen Van Hung Specialist
Hanoi University of Natural Resources
and Environment (HUNRE) Ms Hoang Thi Nguyet Minh Vice Head
JICA Mr Hiroshi Anzo Advisor
JICA Mr Nguyen Vu Tiep Programme Officer
Khang Thinh group (Netafim partner) Mr Vo Trung Director
MARD Mr Truong Duc Toan Technical staff
MASAN group Mr Phan Nhat Long Director
Ministry of Construction Mr Tran Bien Trung Technical staff
MONRE Mr Thuận Deputy Director
MONRE Ms Le Thi Viet Hoa Head
MONRE Ms Vu Hoai Thu Chief of office cum Head
MONRE Ms Nguyen Thu Phuong Specialist
MONRE Mr Hoang Minh Tuyen Director
Nestlé Viet Nam Ltd Ms Huynh Thi Thanh Truc Government Relation
Manager
Netafim Ms Vu Ha Country representative
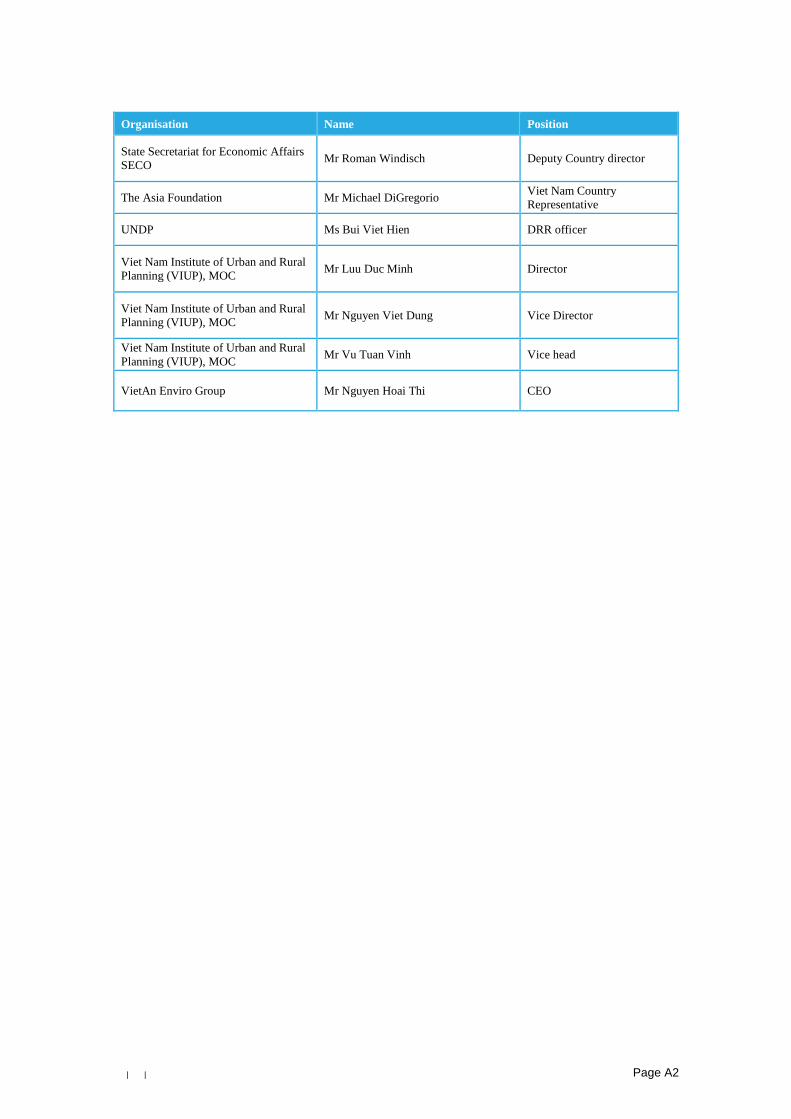
| | Page A2
Organisation Name Position
State Secretariat for Economic Affairs
SECO Mr Roman Windisch Deputy Country director
The Asia Foundation Mr Michael DiGregorio Viet Nam Country
Representative
UNDP Ms Bui Viet Hien DRR officer
Viet Nam Institute of Urban and Rural
Planning (VIUP), MOC Mr Luu Duc Minh Director
Viet Nam Institute of Urban and Rural
Planning (VIUP), MOC Mr Nguyen Viet Dung Vice Director
Viet Nam Institute of Urban and Rural
Planning (VIUP), MOC Mr Vu Tuan Vinh Vice head
VietAn Enviro Group Mr Nguyen Hoai Thi CEO

Appendix B
Map of river basins

| | Page A4
Table 15. Map of key river basins in Viet Nam
Appendix C
Institutions and governance

| | Page B1
C1 Institutions and governance
Table 16. Organisational and Institutional structure of Viet Nam's water sector
Administrative
level
Institution Responsibility
Central National Water
Resources Council
Supporting the Prime Minister making measures to water
resources protection, exploitation and sustainable use;
Preventing, combating and overcoming water harmful effects134
Ministry of Natural
Resources and Environment - MONRE
Overall state management of water resources
Develop strategies, plans
Water volume, water quality monitoring
Develop models of economical and efficient use of water;
Wastewater discharge control (to rivers, lakes, etc.)
Ministry of Agriculture
and Rural Development - MARD
Dyke and irrigation works management; flood control; rural
water supply/drainage; water used for aquaculture
Ministry of Industry and
Trade - MOIT
Hydropower, water for industries
Ministry of Construction
- MOC
Urban and industrial water supply and sewerage/drainage
Ministry of Science and
Technology - MOST
Water quality standards appraisal and issuance; and water-
related technology invention licensing
Ministry of Transport -
MOT
Waterway transport
Ministry of Heath - MOH Drinking water quality
Ministry of Finance -
MOF
Unified financial management of ODA capital sources for
investment in water supply development; State budget
management for water projects; Coordinates methods for
determining clean water consumption prices, price brackets
and their implementation
Water resources related environmental tax/fee/charges
Ministry of Planning and
Investment - MPI
Encourage and mobilise domestic and foreign investment
capital sources for water supply, waste water works;
Coordinates mobilisation of ODA capital sources for investment in water supply development
Ministry of Public
Security - MOPS (public
security)
Water pollution investigation and monitoring
Regional Mekong River Basin
Committee of Viet Nam
Support the Prime Minister making measures to water
resources development, management and use of Mekong basin in Viet Nam135
Provincial Provincial People’s
Committee (PPC)
State investor in irrigation system and water quality at
provincial level; Water supply at provincial and district level,
Response to water related incidents
Department of Natural
Resources and Environment -DONRE
Direct water quality control/management at provincial and
district levels, water volume and monitoring
Department of
Agriculture and Rural Development - DARD
State management role over agricultural irrigation system
within provincial responsibility. Rural water supply;

| | Page B2
Administrative
level
Institution Responsibility
Irrigation canals, reservoirs for watering within province and dykes; Food processing
Department of Industry
and Trade - DOIT
Hydro power; Water for industries
Department of
Construction - DOC
Urban water supply and drainage within the province
Department of Science
and Technology - DOST
Contribution to water quality standards development;
Guidance to application of water quality standards
Department of Transport
- DOT
Waterway transport
Department of Health -
DOH
Drinking water quality standards and monitoring
Department of Finance -
DOF
ODA/State budget for water projects
Department of Planning
and Investment - DPI
Encouragement and mobilisation of domestic and foreign
investment, and ODA capital sources for water supply
development
Department of Natural
Resources and Environment - DONRE
Water pollution investigation and monitoring within province
District District People’s
Committee136
Monitor and protection of water resources; Response to water
related incidents
Commune Commune People’s
Committee
Monitor and protection of water resources; Response to water
related incidents
Service
providers and
Associations
Water Supply Company Utility at urban level for water supply, sometimes they
include water treatment
Drainage and sewerage
company
Public utility enterprise
Viet Nam Water and
Sewerage Association
Professional association, predominantly focus on urban water
companies
Irrigation Management
Company
Irrigation providers
Urban Environmental
Company
Waste water collection, treatment in urban areas
Water User Association Group of farmers taking care of inner field irrigation system


Appendix D
Data used in the water demand
assessment

| | Page D1
D1 Water demand
D1.1 Water demand estimation and forecast
Table 17. Assumptions used to project water demand to 2030
Sector Growth assumptions Assumed increase in water demand
(abstraction) by 2030
Irrigation • Agriculture growth (including forest and
fisheries) since 2009 is estimated at
3.5%.137 A third of the growth is
attributed to the forest and fisheries. After
2020 rice plant area is not to increase
further. Move towards cash and
plantation crops is likely.
• 2009-2020: 3.5% annual GDP increase
for agriculture, forest and fisheries
• 2020-2030: 3% annual GDP increase for
agriculture, forest and fisheries
• 2009-2020: 2.25% annual increase in
water demand
• 2020-2030: 1% annual increase in water
demand. Increase halved due to steady
rice plant area which is the largest water
user. Cash and plantation crops are less
water intensive in terms of water use
(m3/ha).
Industry • 7% average annual increase • 7% average annual increase in water
demand
Municipal 2030 assumptions:
• Viet Nam population reaches 105 mn;
• Daily water use of 150 l/person/day
• Equivalent to 4.5% annual increase in
water demand
Aquaculture • Assume increases in line with irrigation
sector
• Assume increases in line with irrigation
sector
Hydropower
generation • Additional reservoirs under construction
estimated at 5.9 bn m3
• Equivalent to a cumulative increase of
10% in water demand. This assumption
is likely to be underestimating the
increase in reservoir storage for
hydropower generation.
D1.2 Hydropower
Table 18. Overview of hydropower capacity and respective reservoir capacity, per scale and region and
river basin, for operating plants (2016)
Total Capacity MW % capacity of
total
Reservoir
(mn m3)
% reservoir of
total
Hydropower
Operation 16,981.47 56,836.44
Small 1,365.97 8% 2,796.51 5%
Medium 2,204.50 13% 5,914.54 10%
Large 13,389.00 79% 48,125.39 85%
Unknown 22.00 0% - 0%
Region
Northeast 525.49 3% 2,669.91 5%
Northwest 7,536.50 44% 25,245.27 44%
North Central Coast 1,121.30 7% 11,171.36 20%
South Central Coast 2,320.55 14% 5,310.16 9%
Central Highlands 4,775.23 28% 8,022.26 14%

| | Page D2
Total Capacity MW % capacity of
total
Reservoir
(mn m3)
% reservoir of
total
Southeast 702.40 4% 4,417.48 8%
River Basin
Ba 712.93 4% 1,512.30 3%
Bang Giang - Ky Cung 35.90 0% 0.37 0%
Ca 440.30 3% 2,223.16 4%
Dong Nai 2,722.30 16% 8,091.07 14%
Red Thai Binh 7,992.79 47% 27,904.98 49%
Huong 316.00 2% 1,949.20 3%
Kone 141.90 1% 310.00 1%
Ma 377.00 2% 6,950.83 12%
Se San 1,980.20 12% 3,371.43 6%
SERC 126.00 1% 42.89 0%
Sre Pok 869.20 5% 1,222.94 2%
Thach Han 6.00 0% 58.00 0%
Thu Bon & Vu Gia 1,059.60 6% 2,661.65 5%
Tra Khuc 186.05 1% 537.63 1%
Mekong 15.30
Table 19. Overview of hydropower capacity and respective reservoir capacity, per scale and region and
river basin, for selected future hydropower plants (2030)
Hydropower Total Capacity MW % capacity of
total
Reservoir (mn
m3)
% reservoir of
total
Under construction 549.4 971.55
Ma 422 77% 412.15 42%
SERC 5.5 1% 0.4 0%
Sesan 49.9 9% 1.7 0%
Sre Pok, Ia Lop, Ia H'leo 30 5% 9.3 1%
Tra Khuc, Ve, Tra Bong 42 8% 548 56%
Source: Open Development Mekong Database138
Note: Reservoir capacity was not available for all hydroelectric plants; it is likely that the actual reservoir
capacity is higher.

| | Page D3
Figure 25. Reservoir capacity for hydroelectric plants in Viet Nam
D2 Population
Viet Nam has one of the fastest rates of urbanisation in the world, with almost 43% of the country’s
population expected to be living in cities by 2030.139 While more than two-thirds of the population still
live and work in provincial towns and villages, the cities of Hanoi, Ho Chi Minh, Danang and Haiphong
are growing rapidly, as can be seen in Figure 26.
This rapid urbanisation without adequate infrastructure provision, such as water supply and sanitation, has
led to negative impacts on the water environment from discharges of untreated municipal and industrial
waste.
Figure 26. Population Density in Viet Nam (source: Agroviet)

| | Page D4
D3 Agriculture and aquaculture
Although agriculture is fading as the most important economic sector in Viet Nam, it is still the main
source of raw materials for the processing industries and a major contributor to exports. Rice production,
in particular, plays an important role in Viet Nam’s food security and rural economy. Other key crops
include maize and sugarcane. The primary agricultural areas are the Mekong Delta and the Red River
Delta; these two basins account for 70% of the water uses in the country.140
Aquaculture has grown significantly in recent years averaging over 12% annual growth since 1990.141
The river basins with the highest water demand for aquaculture are the Mekong, Red – Thai Binh, Dong
Nai and Ma.
Figure 27. Distribution of rice
growing area in Viet Nam 142
Figure 28. Distribution of coffee
growing area in Viet Nam143
Figure 29. Distribution of
Sugarcane growing areas in Viet
Nam.

| | Page D5
D4 Industry
Large portion of the industrial production occurs in designated Industrial Zones and Industrial Parks,
locations of which are shown in Figure 30.
Figure 30. Map of industrial zones/parks
D5 Other data
Viet Nam Export data (2015). Available at: http://wits.worldbank.org/detailed-country-analysis-
visualization.html [8 May 2017]
Open Aid Data database (2015). Available at: http://www.openaiddata.org/ [8 May 2017]
Open Development Mekong. (2017). [online] Available at: https://opendevelopmentmekong.net/
[Accessed 10 April 2017].

Appendix E
Water demand, water gap and
Water Exploitation Index

| | Page E1
E1 Water supply-demand gap
The tables below illustrate exploitable available water resources and water demand by sector in the dry
season in 2016 and 2030. A water gap occurs when exploitable water availability is insufficient to meet
water demand, i.e. the value in the water gap column is negative (highlighted in red). Positive values
indicate that there is no water gap.
E1.1 2016 Dry season (excluding storage for hydroelectric power
generation)
Table 20. Water use and water gap during dry season (2016)
Basin
2016 Dry Season
Exploitable
Water
Availability
Water Demand (in mn m3)
Irrigation Industry Municipal Aquaculture Hydropower Water Gap
Bang Giang - Ky Cung 2,157 178 15 8 19 - 1,937
Red - Thai Binh 24,240 9,947 1,730 652 504 - 11,408
Ma 3,701 2,792 89 76 279 - 464
Ca 5,642 1,048 19 82 219 - 4,275
Gianh 1,075 38 12 7 7 - 1,011
Thach Han 703 62 12 6 15 - 609
Huong 2,555 1,005 16 54 87 - 1,393
Thu Bon & Vu Gia 4,662 1,040 128 46 112 - 3,335
Tra Khuc 2,139 630 9 8 28 - 1,464
Kone 2,129 804 35 20 18 - 1,251
Ba 3,341 1,270 18 31 27 - 1,995
Dong Nai 8,606 2,522 854 414 229 - 4,587
SERC 1,903 818 288 111 665 - 22
Se San 3,253 35 11 6 3 - 3,199
Sre Pok 3,276 432 14 29 38 - 2,763
Mekong 47,416 15,995 285 241 3,937 - 26,957
Total 116,795 38,614 3,535 1,790 6,187 -
Source: Current study

| | Page E2
E1.2 2030 Dry season (excluding hydroelectric power generation)
Table 21. Water use and water gap during dry season (2030)
Basin
2030 Dry Season
Exploitable
Water
Availability
Water Demand (in mn m3)
Irrigation Industry Municipal Aquaculture Hydropower Water Gap
Bang Giang - Ky Cung 2,182 213 39 14 22 - 1,892
Red - Thai Binh 24,783 11,984 4,461 1,207 607 - 6,525
Ma 3,756 3,359 231 140 336 - -310
Ca 5,735 1,263 50 152 264 - 4,006
Gianh 1,098 49 27 11 10 - 1,000
Thach Han 717 77 27 9 19 - 585
Huong 2,585 1,225 36 87 106 - 1,131
Thu Bon & Vu Gia 4,741 1,336 256 67 144 - 2,937
Tra Khuc 2,172 771 18 11 34 - 1,338
Kone 2,157 995 71 29 22 - 1,041
Ba 3,382 1,541 42 51 33 - 1,716
Dong Nai 8,766 2,998 2,202 766 273 - 2,527
SERC 1,933 969 742 205 787 - -770
Se San 3,315 55 28 11 4 - 3,217
Sre Pok 3,317 505 42 64 44 - 2,662
Mekong 48,542 19,068 856 521 4,694 - 23,403
Total 119,181 46,409 9,127 3,346 7,399 -
Source: Current study

| | Page E3
E2 Water Exploitation Index
The calculation of WEI figures is presented below without the inclusion of storage for hydroelectric
power generation.
E2.1 WEI excluding the impact of hydropower storage
Table 22. Water Exploitation Index for river basins
Basin
2016 2030
Dry Season (in mn m3) WEI Dry Season (in mn m3) WEI
Water
demand
Water
Availability Dry season
Water
demand
Water
Availability Dry season
Bang Giang - Ky Cung 220 18,117 1% 289 18,175 2%
Red - Thai Binh 12,832 65,740 20% 18,258 66,993 27%
Ma 3,236 9,226 35% 4,066 9,355 43%
Ca 1,368 13,905 10% 1,729 14,117 12%
Gianh 64 3,345 2% 98 3,397 3%
Thach Han 94 2,035 5% 132 2,067 6%
Huong 1,162 5,144 23% 1,454 5,214 28%
Thu Bon & Vu Gia 1,327 11,777 11% 1,803 11,960 15%
Tra Khuc 675 5,243 13% 834 5,320 16%
Kone 877 4,754 18% 1,117 4,821 23%
Ba 1,346 6,915 19% 1,666 7,009 24%
Dong Nai 4,019 21,603 19% 6,239 21,972 28%
SERC 1,881 4,628 41% 2,703 4,699 58%
Se San 54 12,344 0% 98 12,486 1%
Sre Pok 513 11,502 4% 655 11,598 6%
Mekong 20,458 110,510 19% 25,139 113,111 22%
Source: Current study
Note: Water demand refers to water abstraction, not consumption

Appendix F
Water pollution challenges and
regional water quality

| | Page F1
F1 Wastewater treatment
F1.1 Municipal wastewater management
Most drainage and sewerage systems in large cities of Viet Nam are
combined sewer systems, primarily serving as stormwater drainage,
with only a few newly developed urban areas employing separate
sewer and drainage systems. Although 60% of households dispose
wastewater to a public system, much of this is directed informally to
the drainage system and only 10% is treated.144 While 90% of households dispose wastewater to septic
tanks, only 4% of septage is treated. Sludge management is generally poor in most cities (see Figure 31).
By the end of 2015, the total capacity of 35 centralised wastewater treatment plants in Hanoi, Ho Chi
Minh City, Da Nang and other large cities was about 850,000 m3/day, which equates to 12-13% of Viet
Nam’s requirements.145 The focus of wastewater expenditure to date has been in constructing treatment
facilities, but this has not always been accompanied by appropriate collection systems.
Figure 31. Status of urban wastewater management in Viet Nam146
In addition, it has been estimated that several thousands of decentralised wastewater treatment plants have
been constructed and installed across the country147 for the purpose of treating domestic wastewater from
residential areas, hospitals, hotels and office buildings. Despite this, only 50% of the hospitals and 7% of
the 23,500 livestock farms in Viet Nam have wastewater treatment systems as of 2014.148
F1.2 Industrial wastewater management
Viet Nam has more than 500,000 manufacturing facilities generated
more than 630,000 tonnes of hazardous industrial waste and 17,000
tonnes of hazardous medical waste. In addition, every year more than
100,000 tonnes of pesticides are consumed while the Ministry of
Natural Resources and Environment (MONRE) inspects more than
100 small-scale domestic waste incinerators that are likely to emit dioxin, furan, and air pollution.149
Highlight:
• Only 10% of industrial
wastewater is treated
Highlight:
• Only 12-13% of
municipal wastewater is
treated

| | Page F2
Wastewater discharged from industrial factories and industrial zones exert great pressure on the surface
water environment in the country.
A detailed assessment of the industrial sector in 2008 indicated that the top 3 polluting industries in Viet
Nam were paper and wood production, chemical production and processing and metal. Since then, the
food and drink and textile industries have grown rapidly and are responsible for large portions of the
industrial pollution load. Each sector discharges specific pollutants. For example, wastewater from:
• Mechanical and metallurgical industries contain heavy metals and mineral oil;
• Textile, dye and paper industries contain solids and organic pollution;
• Food industry contains solids and particularly impacts on biochemical oxygen demand (BOD) as
well as discharging nutritive substances such as nitrogen and phosphorus compounds and
others.150
While it is mandatory by law for industries to treat their wastewater, in effect only 10% of industrial
wastewater is treated.151 According to the Ministry of Natural Resources and Environment, of the 283
industrial parks, about 70% have invested in wastewater collection and treatment system. However,
during recent inspections 137 polluting facilities with a discharge capacity of more than 200 cubic meters
a day were identified.
Figure 32. Estimated BOD5 and Total Suspended Solids (TSS) contribution by industries152
Finally, there are 5,000 craft villages in Viet Nam with over 65% of them located in the Red-Thai Binh
River Basin. These villages usually discharge untreated wastewater directly into water bodies without any
treatment.153

| | Page F3
F2 Water pollution
F2.1 Groundwater pollution
Groundwater pollution is increasingly becoming a problem in Viet Nam, particularly in industrial and
craft villages, as well as agricultural areas. In addition, groundwater faces major challenges associated
with organic and coliform contamination that is hundreds or thousands of times over the current standards
and increasing phosphate pollution. In Dong Nai River Basin, polluting land use activities and discharge
of untreated wastewater and industrial effluent has impacted groundwater quality and is posing a
significant risk to users.154
F2.2 River pollution
Pollution from organic matter, exceeding standards, is most common. Heavy metal pollution is mostly
concentrated in the tributaries near mining and industrial production facilities. Likewise, oil pollution
mainly occurs in reaches with navigation activities and in those receiving industrial wastewater from
production facilities and ports. Effluent from the textile and pulp and paper industries, in particular, has
cyanide and ammonia concentrations that can be up to 84 times higher than the discharge standards.
The heaviest polluted rivers include those passing through dense industrial and municipal areas and crafts
villages. According to policy brief (2016) from the Center for Environment and Community Research,
three rivers passing through Hanoi can be classified as ‘drainage systems’, namely To Lich (Hanoi), Set
river (Hanoi), Kim Nguu (Hanoi), while on a national scale the following rivers can be considered to be
‘dead rivers’: Ngu Huyen Khue (Bac Ninh), Buoi (Thanh Hoa), Nhue-Day (Hanoi and Ha Nam), Thi Vai
(Dong Nai), Da Do (Hai Phong), Gam (Cao Bang), Nam Cat (Bac Can).155
Further, water quality is of serious concern for economically significant rives including the Cau River and
Nhue River in the Red-Thai Binh River Basin, which pass close to/ through Hanoi, the Sai Gon River and
the wider Dong Nai River Basin, passing through Ho Chi Minh City, and the Hau River in the Mekong
River Basin. 65% of craft villages, which typically do not have wastewater treatment plants, are located in
the Red-Thai Binh River. Pollution levels in these rivers are considered ‘serious’ and become even more
critical in the dry season.
Besides, salinity intrusion in downstream estuaries is becoming increasingly common in the South West,
South East and Central Coast.
F2.3 Urban surface water pollution
While there have been measures to improve urban surface water quality, surface water bodies within big
cities like Ho Chi Minh City, Da Nang and Hanoi still face a pitiful state.
Taking Hanoi as an example, Figure 33 demonstrates that water bodies consistently show COD levels
beyond 80mg/l in 2015, which by far exceed the standard required to use it for domestic or even
agricultural use.

| | Page F4
Figure 33. COD content in selected urban surface water areas in Hanoi, 2011-2015
F3 Regional water quality
F3.1 Northwest Region
The primary economic activities in this region are agriculture, forestry and mining. The water quality is
generally considered as good, there is some localized deterioration near the few urbanized locations in the
region. Ground water quality is reportedly good and well within the national standards.
F3.2 North East Region
The rivers of this region generally have good water quality.
The upstream reaches of the Red River in the Lao Cai province, and some of the larger tributaries in Lo,
Gam, Cau, Thuong and Luc Nam have good water quality. (Class A and B of the National Standards).
The water quality in the tributaries passing through dense urban and industrial areas do not meet national
water quality standards, with a hot spot near the town of Viet Tri.
The Cau River originates in Bac Kan province, and flows through Bac Kan, Thai Nguyen, Bac Giang,
Bac Ninh, Vinh Phuc and Hai Duong. As Figure 35 shows, the water quality decreases starting in Thai
Nguyen due to discharge of industrial and municipal wastewater. It further deteriorates to the worst water
quality index levels as it passes Bac Giang and Bac Ninh due to industrial water and discharges from craft
villages. Most serious pollution challenges come from the craft villages located between Dong Anh
(Hanoi) to Van An Ninh in Ngu District and Khe District. This downstream surface water can only be
used for navigation.

| | Page F5
Figure 34. Water Quality of the Cau River based on the Water Quality Index (2014)
Figure 35. Evolution of excess rate of selected water quality parameters in surface water in Cau River,
2011-2015
Source: Viet Nam 5-year Environmental Report 2011-2015

| | Page F6
The ground water quality is generally good, however is likely to be affected by ingress of polluted
freshwater from the riverine system. The groundwater in coastal zone suffers from saline intrusion, which
is likely to worsen due to climate change linked sea level rise.
F4 Red River Delta
The upstream water quality meets the standards in most parts and is suitable for industrial and domestic
use. However, there are pollution hotspots near effluent discharge outlets from industrial areas.
Nhue-Day River flows through Hoa Binh, Hanoi, Ha Nam, Nam Dinh and Ninh Binh. Water quality
deteriorates rapidly as it passes Ha Dong, Thanh Tri and Thanh Oai (Ha Noi) due to industrial, municipal
and craft village wastewater discharges. As Figure 36 shows, the water quality index is mostly below 50,
i.e. the water quality is so bad that river can only be used for navigation and for stretches below 25 not
even for that.
Figure 36. Annual average water quality index of the Nhue River, 2011-2015
Similar to other regions, groundwater is generally acceptable levels but at an increasing risk from
pollution ingress from water bodies as well as saline intrusion in the coastal zones.
F4.1 North Central Coastal Region
Agriculture and tourism are primary economic activity in the area. The upstream water quality is
generally within acceptable standards.
The quality of water in rivers passing through urban centres and industrialised areas is in poor state, with
levels of BOD5, COD, NH4 and PO4 above acceptable levels in National Water Quality Standards.
The groundwater is generally to acceptable standards for consumption, however subject to complex
chemical composition in the plains and subject to saline intrusion in the low lying coastal areas.
Increase in industrial development and increased urbanisation will further degrade the water quality in the
areas, unless adequate municipal and industrial effluents are put through appropriate treatment before
discharge.

| | Page F7
F4.2 South Central Coastal Region
The primary economic activity include tourism, fisheries and aquaculture, mining and industry.
Upstream water quality is to acceptable national standards. However, high level of pollution is present in
water bodies in coastal cities like Da Nang, Quy Nhon and Nha Trang.
There are high level of heavy metals and other toxic substances in water bodies passing through mining
zones.
Groundwater has not been affected by pollution in the water bodies and is generally to acceptable
standards. However, there is a long term risk due to ingress of pollution from untreated discharges from
mines, municipalities and industry into surface water bodies.
F4.3 Central Highlands Region
This region is predominantly used for agriculture and forestry, and growing cash crops such as coffee.
There is high level of seasonality in rainfall, with long dry season and high risk of droughts in period
from January to May.
There is limited monitoring water quality information for this region. However as its primarily
agricultural, the level of pollution are low compared to other regions.
There is potential for increased pollution from agricultural sources, e.g. from fertiliser use, in future if
sustainable practices are not employed.
F4.4 Northeast Mekong
This region has high level of industrial activity and a high level of urbanisation, with large volumes of
untreated or minimally treated effluent being discharged into the water bodies.
Pollution hotspots are present in Dong Nai, Thi Vai and Sai Gon rivers, whereas Thi Vai River is heavily
polluted with industrial effluent from Bien Hoa and Phu My industrial zones. Sources of pollution
include, coliforms, nitrogen, phosphorus, and heavy metals (chromium, lead, mercury and arsenic)
The Dong Nai River Basin, includes some large rivers such as Dong Nai, La Nga, Be, Sai Gon and Vam
Co rivers. Dong Nai, Binh Duong, Ho Chi Minh, Lam Dong, Binh Phuoc, Dak Nong, Binh Thuan, Ninh
Thuan, Long An, Tay Ninh and Ba Ria - Vung Tau. Many areas across the entire river basin were
seriously polluted from industrial, municipal, agriculture and aquaculture wastewater discharges.
While the situation has been found to have improved between 2006 and 2010, there are still several
pollution hotspots. The water quality of the Dong Nai River and Sai Gon River deteriorates when passing
through Ho Chi Minh City due to industrial and municipal discharges. There are many river stretches in
which the water quality is unfit for domestic and agricultural uses according to water quality standards
QCVN 08-MT: 2015 / BTNMT A1 and QCVN 08-MT: 2015 / BTNMT B1. Further downstream, Thu
Dau Mot Town and Tan Uyen District pose a further pollution hotspot due to industrial and municipal
wastewater discharges.
The superficial aquifers in seashore band (between Mekong and Dong Nai River) have high level of
salinity. Deeper aquifers have lower level of contamination and can be used for consumption.

| | Page F8
Figure 37. COD content in surface waters across Dong Nai River, 2011-2015
Figure 38. COD content across the Saigon River, 2011-2015
F4.5 Mekong River Delta Region
Mekong River Delta is one of the most densely populated regions in the world, with agriculture,
aquaculture and food processing industry dominating the local economy.
While the water quality of the Mekong River Basin can be considered as good at large, the water quality
of the two largest rivers, namely the Hau and the Tien River, deteriorates in industrial zones and urban
areas, such as the My Tho fishing port and My Tho industrial zone. The level of pollution, mainly from
organic matter, nutrients, micro-organisms and alumn, has been increasing over the years, has led in Kien
Giang to water quality levels unfit for domestic or agricultural water usage. Pollution intensity is
increasing over the years, a particularly worrying trend as 50% of Viet Nam’s rice is produced in the
Mekong Delta.
Besides, salinity intrusion in downstream estuaries is becoming increasingly common in the South West,
South East and Central Coast.

| | Page F9
The groundwater in coastal areas of the delta suffers from saline intrusion, and superficial aquifers in
many other parts have been registered with high nitrogen levels.
The coastal waters are in poor state due to the high levels of untreated effluents being discharged into
these coastal waters.
Figure 39. COD levels across the Mekong River Basin, 2011-2015

Appendix G
List of ongoing initiatives

| | Page G1

| | Page G2

| | Page G3

Appendix H
Interventions
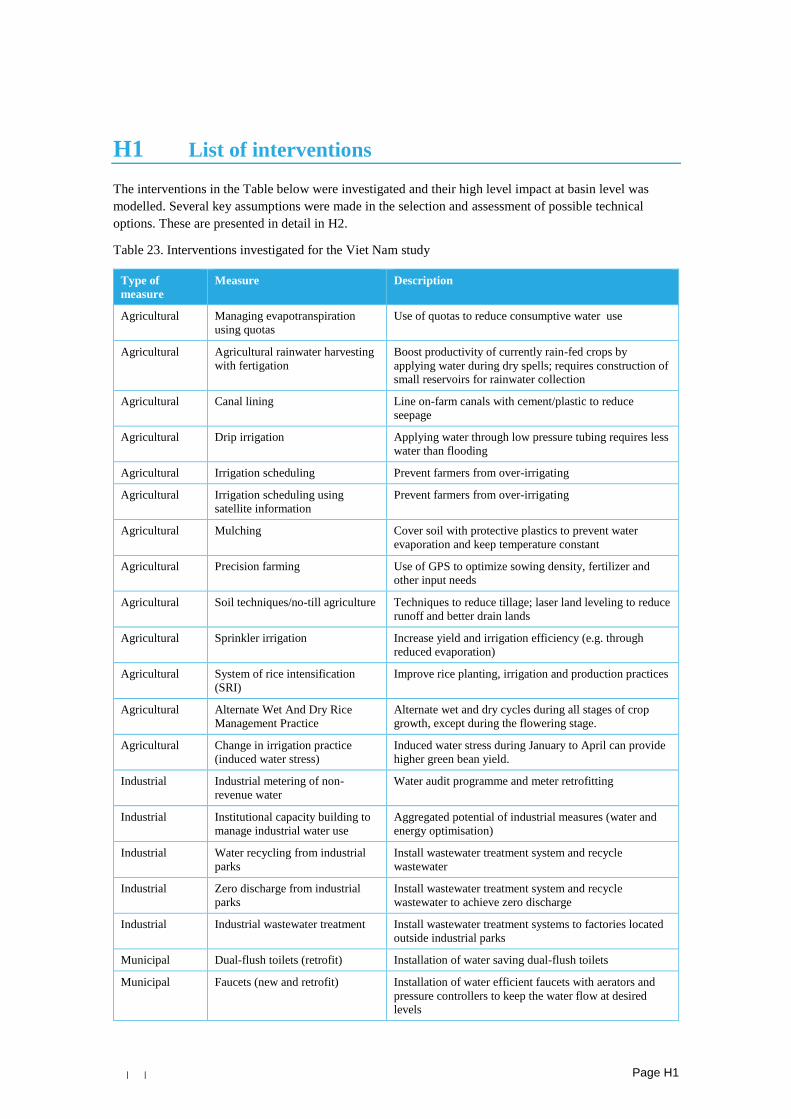
| | Page H1
H1 List of interventions
The interventions in the Table below were investigated and their high level impact at basin level was
modelled. Several key assumptions were made in the selection and assessment of possible technical
options. These are presented in detail in H2.
Table 23. Interventions investigated for the Viet Nam study
Type of
measure
Measure Description
Agricultural Managing evapotranspiration
using quotas
Use of quotas to reduce consumptive water use
Agricultural Agricultural rainwater harvesting
with fertigation
Boost productivity of currently rain-fed crops by
applying water during dry spells; requires construction of small reservoirs for rainwater collection
Agricultural Canal lining Line on-farm canals with cement/plastic to reduce
seepage
Agricultural Drip irrigation Applying water through low pressure tubing requires less
water than flooding
Agricultural Irrigation scheduling Prevent farmers from over-irrigating
Agricultural Irrigation scheduling using
satellite information
Prevent farmers from over-irrigating
Agricultural Mulching Cover soil with protective plastics to prevent water
evaporation and keep temperature constant
Agricultural Precision farming Use of GPS to optimize sowing density, fertilizer and
other input needs
Agricultural Soil techniques/no-till agriculture Techniques to reduce tillage; laser land leveling to reduce
runoff and better drain lands
Agricultural Sprinkler irrigation Increase yield and irrigation efficiency (e.g. through
reduced evaporation)
Agricultural System of rice intensification
(SRI)
Improve rice planting, irrigation and production practices
Agricultural Alternate Wet And Dry Rice
Management Practice
Alternate wet and dry cycles during all stages of crop
growth, except during the flowering stage.
Agricultural Change in irrigation practice
(induced water stress)
Induced water stress during January to April can provide
higher green bean yield.
Industrial Industrial metering of non-
revenue water
Water audit programme and meter retrofitting
Industrial Institutional capacity building to
manage industrial water use
Aggregated potential of industrial measures (water and
energy optimisation)
Industrial Water recycling from industrial
parks
Install wastewater treatment system and recycle
wastewater
Industrial Zero discharge from industrial
parks
Install wastewater treatment system and recycle
wastewater to achieve zero discharge
Industrial Industrial wastewater treatment Install wastewater treatment systems to factories located
outside industrial parks
Municipal Dual-flush toilets (retrofit) Installation of water saving dual-flush toilets
Municipal Faucets (new and retrofit) Installation of water efficient faucets with aerators and
pressure controllers to keep the water flow at desired levels

| | Page H2
Type of
measure
Measure Description
Municipal Municipal leakage Reduction of water lost through leak detection and repair
in water distribution networks
Municipal Pressure management
(municipal)
Improved pressure management in water distribution
system
Municipal Municipal wastewater treatment Treatment of domestic effluent discharges
Municipal Wastewater reuse Treatment and reuse of domestic effluent discharges
H2 Key volume and cost assumptions
The key volume and cost assumptions used in the study along with the data sources are summarised
below.
Table 24. Volume and cost assumptions used in the Viet Nam study
ID Type of measure Key volume assumptions Key cost assumptions Source(s)
1 Managing
evapotranspiration using quotas
20% of all irrigation areas.
Reduced water use by 20-40%.
$0.05/m3 2030WRG Managing Water
Use in Scarce Environments Catalogue
(Hai Basin case study)
2 Agricultural
rainwater harvesting with fertigation
Applicable to all crops
(predominantly in mountain areas).
Yield improvement 25%
i.e. 20% water usereduction per unit yield.
Potential: 10% increase by
2030.
CapEx 240-280 $/ha
10-20 $/ha OpEx
increase, mainly additional repairs
2030WRG Charting our
Water Future
3 Canal lining Applicable crops: oil crops,
vegetables, roots and
tubers, sugarcane, fruits, cotton.
No yield improvement;
Gross water savings 3%.
Potential area: From 26%
to 40% of total crop area (mostly dry areas)
Fertilizer, fuel and
electricity savings
OpEx savings 6 $/ha
Upfront CapEx/ha: $1,200
World Bank, Project in Viet
Nam
4 Drip irrigation Applicable to all crops,
vegetables, roots and
tubers, sugarcane, fruits,
cotton, coffee; excluding
rice
Gross water savings 35%
Yield improvement 15%,
assumes fertigation as part of system;
Potential 20% of total crop
area
Reduced cost for
fertilizer, labor, fuel,
electricity and pest
control; increases for
repairs, and interest on capital ~150-250 $/ha
~2,200 $/ha CapEx
2030WRG Charting our
Water Future
Local data
5 Irrigation
scheduling
Yield improvement 5-20%
Gross water savings 12%
Applied to additional 5%
grain area and 10% commercial crop areas
Fertiliser, fuel and
electricity savings; cost
for informative device on soil moisture level.
CapEx: 100 $/ha
2030WRG Charting our
Water Future
2030WRG Managing Water
Use in Scarce Environments

| | Page H3
ID Type of measure Key volume assumptions Key cost assumptions Source(s)
Catalogue (several case studies)
6 Irrigation
scheduling using satellite information
Yield improvement 5-20%
Gross water savings 13%
Applied to additional 5%
grain area and 10% commercial crop areas.
2 $/ha setup
2 $/ha per annum
2030WRG Managing Water
Use in Scarce Environments
Catalogue (Western Cape
case study)
7 Mulching Applicable to all types of
crops, excluding rice
Yield improvement 10%
Gross water savings: 11%
Applied to additional 30%
crop cover area by 2030
Equipment to apply film
on the field
300 $/ha every 3 seasons
2030WRG Charting our
Water Future
8 Precision farming Applicable to all annuals
crops
Yield improvement 10-15%
Gross water savings: 11%
Potential: Apply to
additional 15% of the land by 2030
Fertilizer costs increase
by half of projected yield
increase, and labor costs
increase due to skill
required.
CapEx of 310 $/ha, 600
$/ha for tractor and spreader.
2030WRG Charting our
Water Future
9 Soil techniques/ no-
till agriculture
Applicable to annuals, i.e.
all crops.
Yield increase 5%.
Gross water savings 12%.
Potential on 20% for rice and commercial crops.
Reduced cost for
fertilizer, labor, fuel;
increases for pest control,
weed control
Operational savings of 40-60 $/ha
Assumes laser levelers are
purchased by a
centralized group and has
full utilization over year (45 $/ha)
2030WRG Charting our
Water Future
10 Sprinkler irrigation Applicable to 40% of the
crops (excluding rice fields)
Yield increase 5-10%
Gross water savings 12-15%
CapEx of ~200 $/ha for a
small mobile sprinkler unit.
Operational savings of
50-100 $/ha in fertilizer, fuel, electricity and labour
2030WRG Charting our
Water Future
11 System of rice
intensification (SRI)
Applicable to rice
Yield increase 5%
Gross water savings 15%
Potential: From 5% to 30%
of total crop area by 2030
Savings of 11% on overall
rice cultivation costs;
reduces seed, fertilizer,
pesticide costs and in
some cases energy cost
Opex: 70 $/ha
2030WRG Charting our
Water Future
USAID, Ghana trial
12 Alternate Wet And
Dry Rice
Management Practice
Applicable to rice
Yield increase 0-12%
Gross water savings 30%
Potential: 25% of total rice area
Operational savings of 38
$/ha
International Rice Research
Institute
13 Change in irrigation
practice (induced water stress)
Applicable to coffee
Gross water savings 12.5%
Potential: adaptation by 50% of the coffee area
Reduced cost for
fertilizer, labor, fuel,
electricity and pest
control; increases for
2030WRG Charting our
Water Future
Amarasinghe et al (2015)
Toward sustainable coffee

| | Page H4
ID Type of measure Key volume assumptions Key cost assumptions Source(s)
repairs, and interest on capital ~150-250 $/ha
~2,200 $/ha CapEx
production in Viet Nam: More coffee with less water
14 Industrial metering
of non-revenue water
Target 50% of industry
outside industrial parks
Assumed 10% reduction
0.05 $/m3; this includes
an allowance for increased revenue
2030WRG Managing Water
Use in Scarce Environments
Catalogue (Ekurhuleni case study)
15 Institutional
capacity building to
manage industrial water use
Target 20% of industry
outside industrial parks
Average of 6.5% water use reduction
0.05-0.60 $/m3 water
saved (depending on
industry sector and
existing infrastructure).
This study uses 0.3 $/m3
water.
2030WRG Managing Water
Use in Scarce Environments Catalogue (Jordan case study)
16 Water recycling
from industrial parks
Assumes wastewater reuse
measures will achieve 25% water saving
Applied at industrial park level (CETP)
30% penetration by 2030
0.1-0.25 $/m3 water saved 2030WRG Managing Water
Use in Scarce Environments
Catalogue (Jeddah and Udaipur case studies)
17 Zero discharge from
industrial parks
Assumes wastewater reuse
measures will achieve zero-
discharge 75% of savings).
Applied at industrial park level (CETP)
20% penetration by 2030
Water savings partially
offset by higher energy
cost
2.5 $/m3 water saved
2030WRG Managing Water
Use in Scarce Environments
Catalogue (several case studies)
2030WRG Industrial Water Use in Bangladesh
18 Industrial
wastewater treatment
Target 50% of industry
outside industrial parks
Action will result in more available water
Treatment cost of 0.4
$/m3
As per municipal wastewater
treatment
19 Dual-flush toilets
(retrofit)
Target 4,000,000
households (15% of total
households) by 2030
Retrofit converting mechanism.
Dual-flush toilets use 18
l/c/d less than conventional toilets
Average cost of 50 $/unit 2030WRG Charting our
Water Future
20 Faucets (new and
retrofit)
Target 4,000,000
households (15% of total households) by 2030
Retrofit converting mechanism.
Reduced water use by 20 l/c/d
Average cost of 30 $/unit 2030WRG Charting our
Water Future
21 Municipal leakage Municipal leakage 24%-
31%
Reduce 40% of total
leakage by 2030
0.05-0.2 $/m3 water saved 2030WRG Charting our
Water Future
2030WRG Managing Water
Use in Scarce Environments
Catalogue (several case studies)
22 Pressure
management (municipal)
3% water demand savings
via pressure reduction
0.05 $/m3 water saved 2030WRG Managing Water
Use in Scarce Environments
Catalogue (Cape Town case
study)

| | Page H5
ID Type of measure Key volume assumptions Key cost assumptions Source(s)
23 Municipal
wastewater treatment
Applicable to domestic
effluent discharges
Action will result in more available water
Potential: Up to 70% by 2030.
Treatment cost of 0.25
$/m3
Waste-water treatment
technologies: a general review, UN
World Bank Wastewater project in HCMC
(adjusted for inflation)
24 Wastewater reuse Applicable to domestic
effluent discharges; In
addition to municipal
wastewater treatment intervention.
Potential: Up to 20% by 2030.
Treatment cost of 0.4
$/m3
2030WRG Charting our
Water Future

Appendix I
Ma River Basin - Water gap

| | Page I1
I1 Closing the water supply´-demand gap: Ma basin
By 2030 the Ma basin could face a dry season water shortage of 310 mn m3, or 8% of the total
water demand (refer to Figure 40).
Figure 40. Water demand projections for Ma river basin
Agriculture is the predominant water user in the Ma basin accounting for 83% of the total water
demand and therefore this is the sector with the greatest potential for improved water management
and the implementation of water efficiency measures.
As Figure 41 shows, the adoption of sprinkler irrigation systems and alternate wet and dry (AWD)
rice management practice and change in soil techniques (no-till agriculture) are estimated to be
sufficient to reduce agricultural water demand and close the predicted gap. More information on
applying AWD in Viet Nam can be found in the deep dives in Section 7.
Due to the low cost and potential financial benefits of the assessed interventions (such as increased
yield), it is estimated that the gap could close resulting in a total cost saving of $115 mn.

| | Page I2
Figure 41. Ma River Basin – cost curve of solutions to close the dry season water gap in 2030


| | Page J1
Appendix J
References
1 World Bank Database. Available at: http://databank.worldbank.org/data/reports.aspx?source=world-development-
indicators&preview=on [8 May 2017] 2 The below section has been taken from 2030 WRG: Viet Nam Scoping Paper. 3 CIA Factbook. Available at: https://www.cia.gov/library/publications/the-world-factbook/geos/vm.html [8 May 2017] 4 CIA Factbook. Available at: https://www.cia.gov/library/publications/the-world-factbook/geos/vm.html [8 May 2017] 5 USAID Success Stories, Viet Nam. Available at: https://www.usaid.gov/results-data/success-stories/Viet Nam-promotes-
public-private-partnerships-infrastructure [8 May 2017] 6 CIA Factbook. Available at: https://www.cia.gov/library/publications/the-world-factbook/geos/vm.html [8 May 2017] 7 CIA Factbook. Available at: https://www.cia.gov/library/publications/the-world-factbook/geos/vm.html [8 May 2017] 8 ADB (2009). Water sector review. The ratio is assumed to have remained similar. 9 Mekong River Basin Committee of Vietnam was established by Decision 237-CP dated 18 September 1978 of the
Governmental Council (currently Government). The Committee, led by Minister of Ministry of Water Resources (now
General Department of Water Resources under Ministry of Agriculture and Rural Development), is in charge of providing
comments to the Governmental Council, guiding the country’s Mekong River related provinces, and
discussing/negotiating with other Mekong countries, on management, use and exploitation of the river’s water resources
(Article 2, Decision 237-CP). However, recently in 2016 Ministry of Natural Resources and Environment proposed to
establish a new Mekong River Basin Committee. The new Committee is proposed to be in charge of management, use and
exploitation of water resources within the country boundary only (Mekong River in Vietnam’s territory is named Cuu
Long River). For more details: http://dwrm.gov.vn/index.php?language=vi&nv=news&op=Hoat-dong-cua-Cuc-Tin-lien-
quan/De-xuat-thanh-lap-6-Uy-ban-Luu-vuc-song-4951 [8 May 2017] 10 Nella Canales Trujillo, Vu Xuan Nguyet Hong and Shelagh Whitley. Mapping current incentives and investment in Viet
Nam's water and sanitation sector: informing private climate finance. Working paper 417. ODI and CIEM. May 2015. 11 This is a new law which has been discussed since March 2015. The name/title of this law has not been confirmed yet as
MARD prefers “Law on Irrigation Works” as it is related to irrigation facilities, while MONRE prefers “Law on Hydraulic
Works”, as it is related to flow of water/hydrology. Interview with Dr Dao Trong Tu, April 8, 2017. 12 Nella Canales Trujillo, Vu Xuan Nguyet Hong and Shelagh Whitley (2015). Mapping current incentives and investment
in Viet Nam's water and sanitation sector: informing private climate finance. Working paper 417. ODI and CIEM. 13 Nguyen Ngoc Huy et al (2015). Institutional challenges for peri-urban water supply in Can Tho, Viet Nam. Available at: http://pubs.iied.org/10756IIED/ [8 May 2017] 14 Vietnam now has 24 key economic zones approved by Prime Minister Decisions 747/1997/QD-TTg, 1018/1997/QD-
TTg, 44/1998/QD-TTg, 145/2004/QD-TTg, 146/2004/QD-TTg, 148/2004/QD-TTg, 159/2007/QD-TTg, 492/2009/QĐ-
TTg, and 245/2014/QD-TTg. Available at:
http://chinhphu.vn/portal/page/portal/chinhphu/noidungvungkinhtetrongdiemquocgia?articleId=10000721 [8 May 2017] 15 Circular 41/2013/TT-BTC on guidance of the implementation of Decree 67/2012/ND-CP which amends and
supplements some articles of Decree 143/2003/ND-CP detailing the Ordinance on Exploitation and Protection of Irrigation
Works. 16 Areas exempted from the irrigation fee includes: a) Agricultural land used for research, trial production, b) annual
crop land with at least one rice crop in a year, c) salt-making land, d) agricultural land allocated by the State, e)
agricultural land allocated to poor households, f) agricultural land within the allocation quota for households and
individuals inherited, donated, transferred of land-use-rights, contracted land. 17 Cases that have been exposed in Hanoi, Thanh Hoa, Gia Lai and Quang Ngai: Available at:
http://baophapluat.vn/doanh-nghiep/ngan-sach-cap-bu-thuy-loi-phi-la-moi-ngon-cho-tham-nhung-218899.html,
http://baogialai.com.vn/channel/722/201404/con-bat-cap-trong-thuc-hien-chinh-sach-mien-thu-thuy-loi-phi-2306926/,
http://baoquangngai.vn/channel/2034/2009/05/1709641/ [8 May 2017]

| | Page J2
18 Exempt cases (indicated in Article 5, Decree 154/2016/DN-CP) include: 1) Water discharged from hydropower plants,
circulating water in production and processing establishments which are not discharged into the environment in any forms
(solids, liquids, gases); 2) Sea water used to produce salt dissolved; 3) Daily-life/Domestic wastewater from organizations,
individuals and households in areas where the State is implementing the price subsidy regime in order to have water prices
suitable to the socio-economic situation; 4) Daily-life/Domestic wastewater from organizations, individuals and
households in rural communes and those without clean water supply systems; 5) Water cooled equipment, machinery not
directly exposed to contaminants, has its own exit path; 6) Natural rainwater runoff (except for the area of the chemical
plants); 7) Wastewater from fishery and fishing vessels of fishermen; and 8) Daily-life/Domestic wastewater collected and
treated by the centralised units up to the relevant standards and technical regulations for discharge into the environment. 19 ADB (2009). Water sector review. 20 DWRM (2015). Quản lý tài nguyên nước để phát triển bền vững. Available at:
http://dwrm.gov.vn/index.php?language=vi&nv=news&op=Hoat-dong-cua-Cuc-Tin-lien-quan/QUAN-LY-TAI-
NGUYEN-NUOC-DE-PHAT-TRIEN-BEN-VUNG-4173 [8 May 2017] 21 MARD (31 August 2016). Approval of survey results on management, exploitation and utilisation of irrigation works. 22 FAO Aquastat database. Value accounts for groundwater/ surface water overlap in estimates. 23 Institute of Water Resources Planning, MARD (2016). Various reports. 24 Institute of Water Resource Planning, MARD. 25 Interview with the Embassy of Canada on 4 April 2017. 26 ADB (2009). Water sector review. 27 Institute of Water Resources Planning (2015). Report on Conflict of water use in the downstream of reservoirs and
adapting measures. 28 Le Quoc Tuân (2013). Environment Faculty, Agriculture and Forestry University, Water resources and existing situation
of use. 29 CIA Factbook Viet Nam. Available at: https://www.cia.gov/library/publications/the-world-factbook/geos/vm.html [8
May 2017] 30 FAO Database. 2016. Available at: http://www.fao.org/faostat/en/#home [8 May 2017] 31 Basak (2016). Benefits and Costs of climate change mitigation technologies in paddy rice. Focus on Bangladesh and
Viet Nam. 32 FAO Database. 2016. Available at: http://www.fao.org/faostat/en/#home [8 May 2017] 33 Institute for Water Resource Planning. 34 ADB (2009). Water sector review. 35 ASEM (2016). Overall plan on agricultural production development to 2020, vision to 2030. Available at:
http://asemconnectViet Nam.gov.vn/default.aspx?ZID1=14&ID1=2&ID8=16364 [8 May 2017] 36 HCMUAF (2013). Báo cáo tài nguyên nước và hiện trạng sử dụng nước, Available at:
http://www2.hcmuaf.edu.vn/data/quoctuan/Tai%20nguyen%20nuoc%20va%20hien%20trang%20su%20dung%20n
uoc.pdf [8 May 2017] 37 Available at: http://www.worldfishing.net/news101/regional-focus/Viet Nam-targets-us$7bn-fisheries-exports [8 May
2017] 38 Available at: http://www.worldfishing.net/news101/regional-focus/Viet Nam-targets-us$7bn-fisheries-exports [8 May
2017] 39 World Urbanisation Prospects. The 2014 Revision. United Nations. 40 PwC (2015). The World in 2050, Will the shift in global economic power continue? 41 Department of Water Resources Management, MONRE, 2015. Water management for sustainable development. 42 This source considers the revision to the PDP 7 Viet Nam Energy online (March 2016) Adjusting Viet Nam National
Power Development Planning in March 2016. Available at:
http://nangluongViet NamViet Nam.vn/news/en/electricity/adjusting-Viet NamViet Nam-national-power-development-
planning.html [8 May 2017] 43 Tien, N.H. (2015). Drainage and wastewater treatment planning in Viet Nam
Water Forum – Promoting Sustainable Development Investment held on 17th October 2013 in Ho Chi Minh City, Viet
Nam. 44 Viet-Anh (2010). Why DEWATS is still not popular in Viet Nam. Water Practice & Technology, 5(4),
doi:10.2166/wpt.2010.117 45 Bui, Hoai Nam (2015). Current situation and policies on wastewater management in Viet Nam 46 HCMUAF (2013). Báo cáo tài nguyên nước và hiện trạng sử dụng nước, Available at:
http://www2.hcmuaf.edu.vn/data/quoctuan/Tai%20nguyen%20nuoc%20va%20hien%20trang%20su%20dung%20nuoc.pd
f [8 May 2017]

| | Page J3
47 Bui, Hoai Nam (2015). MONRE, Current situation and policies on wastewater management in Vietnam 48 MONRE (March 2017). Xử lý nước thải đô thị còn nhiều thách thức. Available at:
http://dwrm.gov.vn/index.php?language=vi&nv=news&op=Tai-nguyen-nuoc/Xu-ly-nuoc-thai-do-thi-con-nhieu-thach-
thuc-5623 [8 May 2017] 49 World Bank (2011). Climate Risk and Adaptation Profile. Available at:
http://sdwebx.worldbank.org/climateportalb/doc/GFDRRCountryProfiles/wb_gfdrr_climate_change_country_profile_for_
VNM.pdf. [8 May 2017] 50 Sanath Ranawana (2016). Asian Development Bank: Greater Mekong Sub-region Natural Capital Partnership: key
conclusions from recent Ministerial-level meeting. Available at: https://www.slideshare.net/OECDdev/sanath-ranawana-
asian-development-bank-greater-mekong-subregion-natural-capital-partnership-key-conclusions-from-recent-
ministeriallevel-meeting [8 May 2017] 51 World Bank (2010) Economics of Adaptation to Climate Change 52 ISET PPP 53 53 UN-REDD (2016). Position Paper Increasing Resilience to Droughts in Viet Nam 54 Zhu and Trinh (2016). Climate change impacts on agriculture in Viet Nam (IFPRI and MARD). 55 ISET PPP 56 Sanath Ranawana (2016). Asian Development Bank: Greater Mekong Sub-region Natural Capital Partnership: key
conclusions from recent Ministerial-level meeting. Available at: https://www.slideshare.net/OECDdev/sanath-ranawana-
asian-development-bank-greater-mekong-subregion-natural-capital-partnership-key-conclusions-from-recent-
ministeriallevel-meeting [8 May 2017] 57 Mai Trong Nhuan. Water environment in Viet Nam: opportunities and challenges for sustainable
MANAGEMENT IN the context of climate change. Available at:
http://www.wepa-db.net/pdf/1003forum/2_vn_maitrongnhuan.pdf [8 May 2017] 58 World Bank (2015). Implementation completion and results report on series of development policy loan. Available at:
http://documents.worldbank.org/curated/en/536531475520595946/ICR-Main-Document-P122667-2016-09-29-17-23-
Final-09302016.docx [8 May 2017] 59 CEWAREC (2015). Quản lý tài nguyên nước phục vụ phát triển bền vững ở Việt Nam. Available at:
http://www.cewarec.org/QUAN-LY-TAI-NGUYEN-NUOC-PHUC-VU-PHAT-TRIEN-BEN-VUNG-O-VIET-
NAM_5_33765.aspx [8 May 2017] 60 Ho Chi Minh City, DONRE (2013). Thể chế và nguồn nhân lực quản lý tài nguyên nước
Available at: http://www.donre.hochiminhcity.gov.vn/thong-tin-hoat-dong/Lists/Posts/Post.aspx?List=69909867-b3bb-
4e0c-9a71-f2a26c0b25bb&ID=2990 [8 May 2017] 61 Decree 91/2002/ND-CP dated 11 November 2002 regulates the functions, tasks, powers and organisational structure of
the Ministry of Natural Resources and Environment. 62 Decree 86/2002/ND-CP dated 5 November 2002 regulates the functions, tasks, powers and organisational structure of
the ministries and ministerial-level agencies. 63 Le Quoc Tuan (2013). Thể chế và hiện trạng sử dụng tài nguyên nước. Available at:
http://www2.hcmuaf.edu.vn/data/quoctuan/Tai%20nguyen%20nuoc%20va%20hien%20trang%20su%20dung%20nuoc.pd
f [8 May 2017] 64 MONRE (2015). Six-month report on state management on implementation of Law on Environmental Protection 2014. 65 MONRE (2017). Chỉ có 5% cụm công nghiệp có hệ thống xử lý nước thải. Available at:
http://www.baomoi.com/chi-5-cum-cong-nghiep-co-xu-ly-nuoc-thai-tap-trung/c/20793172.epi [8 May 2017] 66 Canh Sat Nhan Dan (2015). Improvement of authority for Environmental Police to meet the requirements of the task of
fighting against environmental crimes and violations. People's Police Journal. Number 1/2015. Available at:
http://www.canhsatnhandan.vn/Home/Print/1502/Hoan-thien-tham-quyen-cua-luc-luong-Canh-sat-phong-chong-toi-pham-
ve-moi-truong-dap-ung-yeu-cau-nhiem-vu-dau-tranh-phong-chong-toi-pham-va-vi-pham-phap-luat-ve-moi-truong [8 May
2017] 67 Pham Quy Ngo. The fight against crime and violations of the law on environmental protection. Viet Nam Environment
Administration Magazine (VEM). Available at: http://tapchimoitruong.vn/pages/article.aspx?item=C%C3%B4ng-
t%C3%A1c-%C4%91%E1%BA%A5u-tranh-ph%C3%B2ng,-ch%E1%BB%91ng-t%E1%BB%99i-ph%E1%BA%A1m-
v%C3%A0-vi-ph%E1%BA%A1m-ph%C3%A1p-lu%E1%BA%ADt-v%E1%BB%81-b%E1%BA%A3o-v%E1%BB%87-
m%C3%B4i-tr%C6%B0%E1%BB%9Dng--40736 [8 May 2017] 68 DWRM (2013). Tài Ngên Nước. Xả thải gây ô nhiễm và một số vấn đề trong quản lý. Available at:
http://dwrm.gov.vn/index.php?language=vi&nv=news&op=Tai-nguyen-nuoc/Xa-thai-gay-o-nhiem-va-mot-so-van-de-
trong-quan-ly-5587 [8 May 2017] 69 CIGAR (2016). The drought crisis in the Central Highlands of Viet Nam.

| | Page J4
70 UN-REDD (2016). Position Paper Increasing Resilience to Droughts in Viet Nam. 71 Interview MARD on 5 April 2017. 72 CIGAR (2016). The drought crisis in the Central Highlands of Viet Nam. 73 Viet Nam Pictorial (2016). Mekong Delta Struggling with Drought, Saline Intrusion. Available at: http://Viet Nam.vnanet.vn/english/mekong-delta-struggling-with-drought-saline-intrusion/225781.html [8
May 2017] 74 Phi and Strokova (2015). Prediction Maps of Land Subsidence caused by groundwater exploitation in Hanoi, Viet Nam.
Resource Efficient Technologies 1, 80-89. 75 N. P. Don et al. (2011). Potential of Wastewater Reclamation to Reduce Fresh Water Stress in Ho Chi Minh City-Viet
Nam, Journal of Water Sustainability, Volume 1, Issue 3, 279-287. 76 DWRM (2015). Ứng phó sụt lún ở đồng bằng Sông Cửu Long. Available at:
http://dwrm.gov.vn/index.php?language=vi&nv=news&op=Tai-nguyen-nuoc/Ung-pho-sut-lun-o-Dong-bang-song-Cuu-
Long-Quan-ly-hop-ly-nuoc-ngam-gia-tang-giai-phap-dong-bo-5606 [8 May 2017] 77 Sre Pok MK 17 Report. 78 Institute of Energy (2011). Strategic environmental assessment for the electricity plan between 2011 and 2015 and
toward 2030. Energy Institute. Hanoi, Vietnam. 79 RFA. (16 April 2013) Tussle Over Dam Water Adds to Viet Nam Drought Woes. Available at:
http://www.rfa.org/english/news/Viet Nam/dam-04162013190004.html [8 May 2017] 80 Dao Trong Tu. Water resources management for sustainable development in Viet Nam. Centre for Sustainable Water
Resources Development and Adaptation to Climate Change (CEWAREC). 2015. 81 Pham Huu Ty (2015). Dilemmas of hydropower development in Viet Nam: Between dam-induced displacement
and sustainable development. Available at: https://books.google.com.vn/books?id=m41ZBgAAQBAJ&pg=PA35&lpg=PA35&dq=hydropower+downstream+conflict
+Viet
Nam&source=bl&ots=Fiqj2UvejR&sig=OMZsJGG8TA2zzl3VNqPJyn0CrsQ&hl=en&sa=X&redir_esc=y#v=onepage&q
=hydropower%20downstream%20conflict%20Viet Nam&f=false [8 May 2017]82 The Third Pole. (19 March 2016) Why silt is so important for the Mekong. Available at:
https://www.thethirdpole.net/2016/09/13/why-silt-is-so-important-for-the-mekong/ [8 May 2017]83 The Third Pole. (19 March 2016) Why silt is so important for the Mekong. Available at:
https://www.thethirdpole.net/2016/09/13/why-silt-is-so-important-for-the-mekong/ [8 May 2017]84 Sre Pok MK 17 Report85 Sre Pok MK 17 Report86 Khai, Huynh Viet, and Mitsuyasu Yabe (2013). Impact of Industrial Water Pollution on Rice Production in Viet Nam.
INTECH Open Access Publisher87 Asian Development Bank (2010). The issues and challenges of reducing non-revenue water. Philippines.88 Asian Development Bank (2013). Viet Nam NRW Reduction Program. Asia Water Week.89 OECD (2015) OECD Principles on Water Governance. https://www.oecd.org/cfe/regional-policy/OECD-Principles-on-
Water-Governance-brochure.pdf90 Direct interview with Department of Water Resources Management (MONRE) in April 2017.91 Available at: https://www.theguardian.com/environment/2016/jul/01/Viet Nam-blames-toxic-waste-water-fom-steel-
plant-for-mass-fish-deaths [8 May 2017]92 MONRE (2017). Ministry collaborates with Microsoft to enhance IT potential. Available at:
http://english.Viet Namnet.vn/fms/science-it/173602/ministry-collaborates-with-microsoft-to-enhance-it-potential.html [8
May 2017]93 Dao Trong Tu (2015). Water resources management for sustainable development in Viet Nam. Centre for Sustainable
Water Resources Development and Adaptation to Climate Change94 Nguyen Ngoc Huy et al. (2015). Institutional challenges for peri-urban water supply in Can Tho, Viet Nam. Available
at: http://pubs.iied.org/10756IIED/ [8 May 2017]95 Water Reuse Association (2012) Seawater Desalination Costs – White Paper96 ADB (2007) Private Sector Development and Operations: Harnessing Synergies with Public Sector97 Basak (2016). Benefits and Costs of climate change mitigation technologies in paddy rice. Focus on Bangladesh and
Viet Nam.98 Basak (2016). Benefits and Costs of climate change mitigation technologies in paddy rice. Focus on Bangladesh and
Viet Nam.99 IRRI (2016). Overview of AWD.

| | Page J5
100 IRRI, IAE and CCAFS. Applying and scaling up of alternate wetting and drying for paddy rice in Viet Nam. Presented
at Greater Mekong Forum on Water Food and Energy in Phnom Penh, Cambodia on 21-23 October. 101 Interview with MARD, Department of Irrigation and Dam Safety. 102 IRRI, IAE and CCAFS. Applying and scaling up of alternate wetting and drying for paddy rice in Viet Nam. Presented
at Greater Mekong Forum on Water Food and Energy in Phnom Penh, Cambodia on 21-23 October. 103 Institute of Water Resource Planning 104 Basak (2016). Benefits and Costs of climate change mitigation technologies in paddy rice. Focus on Bangladesh and
Viet Nam 105 IRRI, IAE and CCAFS. Applying and scaling up of alternate wetting and drying for paddy rice in Viet Nam. Presented
at Greater Mekong Forum on Water Food and Energy in Phnom Penh, Cambodia on 21-23 October. 106 Sustainable Rural Development (2016). Sustainable Agriculture & Livelihoods. Available at:
http://srd.org.vn/index.php/our-work/sustainable-agriculture-livelihoods [8 May 2017] 107 Sre Pok MK 17 Report. 108 MARD. Available at: vietrade.gov.vn [8 May 2017] 109 Amarasinghe et al (2015). Towards sustainable coffee production in Viet Nam: More coffee with less water. 110 Cheesman, J., Bennett, J. (2005). Natural resources, institutions and livelihoods in Dak Lak, Viet Nam. Research
Report No. 1. Managing Groundwater Access in the Central Highlands (Tay Nguyen), Viet Nam. Australian Centre for
International Agricultural Research (ACIAR) – Project: ADP/2002/015. 111 D’haeze, Dave, et al. "Environmental and socio-economic impacts of institutional reforms on the agricultural sector of
Vietnam: Land suitability assessment for Robusta coffee in the Dak Gan region." Agriculture, ecosystems & environment
105.1 (2005): 59-76. 112 Viet Nam Television (2013). Công nghệ tưới nước nhỏ giọt vẫn nan giải ở Tây Nguyên. Available at:
http://vtv.vn/trong-nuoc/cong-nghe-tuoi-nuoc-nho-giot-van-nan-giai-o-tay-nguyen-78541.htm [8 May 2017] 113 Amarasinghe et al (2015). Towards sustainable coffee production in Viet Nam: More coffee with less water. 114 Cheesman, J., Son, T.V.H., Bennett, J. (2007). Valuing irrigation water for coffee production in Dak Lak, Viet Nam: A
marginal productivity analysis. Research Report No. 6. Managing Groundwater Access in the Central Highlands (Tay
Nguyen), Viet Nam. Australian Centre for International Agricultural Research (ACIAR). Project: ADP/2002/015. 115 D’haeze, D. (2008). Coffee input costs: Evolution of production costs for Viet Namese coffee. Paper presented at the
14th Annual AICC Coffee Outlook Conference, Ho Chi Minh City, Viet Nam, 7th to 9th December 2008. 116 Amarasinghe et al (2015). Towards sustainable coffee production in Viet Nam: More coffee with less water. 117 Viet Nam television (2013). Công nghệ tưới nước nhỏ giọt vẫn nan giải ở Tây Nguyên. Available at:
http://vtv.vn/trong-nuoc/cong-nghe-tuoi-nuoc-nho-giot-van-nan-giai-o-tay-nguyen-78541.htm [8 May 2017] 118 Interview with Netafim on 25 November 2016 119 Dan et al. Project report on wastewater reuse in industrial and service sectors in Ho Chi Minh City. Ho Chi Minh City,
Viet Nam: Department of Science and Technology. 120 US EPA (2012). Available at: https://watereuse.org/wp-content/uploads/2015/04/epa-2012-guidelines-for-water-
reuse.pdf 121 Dan et al. (2011). Potential of Wastewater Reclamation to Reduce Fresh Water Stress in Ho Chi Minh City-Viet Nam. 122 Stefania Arborea et al (2017). Cost–Benefit Analysis of Wastewater Reuse in Puglia. 123 Loan, Nguyen Thi Phung (2010). Working Paper Series 52: Legal framework for the water sector in Viet Nam. Centre
for Development Research (ZEF), University of Bonn: Bonn, Germany. 124 Evans and al (2014). Policy support for wastewater use in Hanoi, 37th WEDC International Conference, Hanoi, Viet
Nam 125 Ha Noi people’s committee (2016). Quy hoach chung thanh pho Ha Noi den nam 2030. Available at:
http://www.xaydung.gov.vn/c/document_library/get_file?p_l_id=47703&folderId=47604&name=16237 [8 May 2017] 126 Hai, Duc. "Hanoi Promoting Key Industries." Vietnam Business Forum - VCCI. N.p., (29 Mar. 2012). Available at
http://www.vccinews.com/news_detail.asp?news_id=25697 [accessed: 10 April 2017] 127 Dang, Trung Dinh, Sango Mahanty, and Nguyen Thanh Van-Vietnam’S. Craft. villages and water pollution: A review
of previous research. Working paper for the project Crafting Sustainability: Addressing water pollution from Vietnam’s
Craft Villages Australian National University Canberra, 2010. 128 World Bank (2010). Industrial Wastewater Management in River Basins Nhue-Day and Dong Na0 – Final Report 129 Contaminated Water Threatens Hanoi Residents. Viet Nam Environment Adminstration, 9 July 2014. Available at:
http://vea.gov.vn/en/news/news/Pages/Contaminated-water-threatens-Hanoi-residents.aspx. [10 Apr. 2017] 130 Duong Than An, Wastewater Management and Sanitation Practices in Vietnam, (MONRE). Available at:
http://www.unescap.org/sites/default/files/5-
Waste%20water%20management%20and%20sanitation%20practices%20in%20Viet%20Nam.pdf

| | Page J6
131 "Vietnam Business Forum - VCCI". Vccinews.com. N.p., http://www.ngocentre.org.vn/news/hanoi-invest-2b-waste-
water-treatment-until-2020. [10 May 2017]. 132 Khai, Huynh Viet, and Mitsuyasu Yabe (2013). Impact of Industrial Water Pollution on Rice Production in Viet Nam.
INTECH Open Access Publisher. 133 Dang, Trung Dinh, Sango Mahanty, and Nguyen Thanh Van-Vietnam’S. Craft. villages and water pollution: A review
of previous research. Working paper for the project Crafting Sustainability: Addressing water pollution from Vietnam’s
Craft Villages Australian National University Canberra, 2010. 134 Tạp Chí Môi Trường: Chức năng, nhiêm vu cua Hội đồng quốc gia về tài nguyên nước. Available at: http://tapchimoitruong.vn/pages/article.aspx? [8 May 2017] 135 Ủy Ban Sông Mê Kông Việt Nam: Giới thiệu về Ủy Ban Sông Mê Kong Việt Nam. Available at:
http://vnmc.gov.vn/newsdetail/255/uy-ban-song-me-cong-viet-nam.aspx [8 May 2017] 136 Point 2, Article 71, Law on Water Resources 2012. 137 World Bank (2016). Databank. Available at: http://data.worldbank.org/indicator/ [12 May 2017] 138 Open development Viet Nam (by June 2016) Hydropower plants in Viet Nam. Available at: https://opendevelopmentmekong.net/dataset/?id=danh-sach-cac-th-y-di-n-t-i-vi-t-nam-tinh-d-n-thang-06-2016 [8 May
2017] 139 United Nations, World Urbanisation Prospects (2014 revision). 140 Department of Water Resources Management, MONRE, (2015) Water management for sustainable development. 141 Asian Development Bank (2009). Technical Assistance Consultant's Report, Socialist Republic of Viet Nam: Water
Sector Review. 142 "Agriculture, Forestry and Fishing". Gso.gov.vn. N.p., 2017. http://www.gso.gov.vn/default_en.aspx?tabid=778. [10
Apr. 2017]. 143 World Agroforestry centre, Coffee as driver of forest change in the Central Highlands of Viet Nam. 144 World Bank (2013). Socialist Republic of Viet Nam Performance of the Wastewater Sector in Urban Areas: A Review
and Recommendations for Improvement - Viet Nam Urban Wastewater Review. World Bank. 145 Tien, N.H. (2015). Drainage and wastewater treatment planning in Viet Nam
Water Forum – Promoting Sustainable Development Investment held on 17th October 2013 in Ho Chi Minh City, Viet
Nam. 146 World Bank (2013). Socialist Republic of Viet Nam Performance of the Wastewater Sector in Urban Areas: A Review
and Recommendations for Improvement - Viet Nam Urban Wastewater Review. World Bank 147 Viet-Anh (2010). Why DEWATS is still not popular in Viet Nam. Water Practice & Technology, 5(4),
doi:10.2166/wpt.2010.117 148 Bui, Hoai Nam (2015). Current situation and policies on wastewater management in Viet Nam 149 MONRE (2017). Chỉ có 5% cụm công nghiệp có hệ thống xử lý nước thải. Available at:
http://www.baomoi.com/chi-5-cum-cong-nghiep-co-xu-ly-nuoc-thai-tap-trung/c/20793172.epi [8 May 2017] 150 Ministry of Industry and Trade (2010). Estimates. 151 HCMUAF (2013). Báo cáo tài nguyên nước và hiện trạng sử dụng nước, Available at:
http://www2.hcmuaf.edu.vn/data/quoctuan/Tai%20nguyen%20nuoc%20va%20hien%20trang%20su%20dung%20nuoc.pd
f [8 May 2017] 152 Ministry of Industry and Trade (2010) 153 MONRE (March 2017). Xử lý nước thải đô thị còn nhiều thách thức. Available at:
http://dwrm.gov.vn/index.php?language=vi&nv=news&op=Tai-nguyen-nuoc/Xu-ly-nuoc-thai-do-thi-con-nhieu-thach-
thuc-5623 [8 May 2017] 154 ADB (2009). Water Sector Review. 155 The Center for Environment and Community Research (October 2016). Policy brief on "Water monitoring”.