vidyasagar university journal of library and …eprints.rclis.org/23996/3/journal vol...
TRANSCRIPT

Vidyasagar UniversityJournal of
Library and Information Science
VOLUME 18-19, 2013-14

Vidyasagar University Journal of Library and Information Science (VUJLIS)
ISSN : 0972-8570
Chief Editor : Pijush Kanti Jana
Advisory Board :
Juran Krishna Sarkhel
Krishnapada Majumdar
Arjun Dasgupta
Editorial Committee :
Pijush Kanti Jana
Durga Sankar Rath
Smita Sett
Soumen Mallik
Nivedita Bhattacharyya
Bidyarthi Dutta
Snigdha Naskar
The Vidyasagar Unviersity Journal of Library and Information Science (VUJLIS) is a peer
reviewed journal, published annually by the Vidyasagar University, Midnapore, West
Bengal in the belief that the Library and Information Science students, scholars, faculties and
information professionals should integrate intellect in an attempt to understand the
contemporary challenges and complexities of the information activities. Our motto is to link
theory and practice by accumulating contribution of both researchers and practitioners for
translating their understanding into action, and hence, VUJLIS draws special attention to our
openness to such thinking as well approaches. The VUJLIS endeavors to disseminate
information concerning recent developments in library and information science at national
and international levels.
Signed articles are responsibility of the authors. Views expressed in this journal do not
necessarily reflect neither the views of the Editorial Committee nor of the Department of
Library and Information Science, Vidyasagar University.
Publication Frequency : Annual
Annual Subscription : Rs. 75.00 / $ 15 / £8
Published by Dr. Jayanta Kishore Nandi, Registrar (Actg.), Vidyasagar University,
Midnapore - 721 102. West Bengal and Printed at Giri Printers, Midnapore. Ph. 276286

Volume : 18-192013–2014
VIDYASAGAR UNIVERSITY
Journal ofLibrary and Information Science
ISSN : 0972-8570
Vidyasagar UniversityMidnapore
West Bengal

Vidyasagar University
ournal of Libraryand InformationScience
VOLUME 18-19, 2013-2014 ISSN : 0972-8570
Webometric Analysis of Management Institutes: A Case Study in West Bengal 1Tapan Kumar Mandal, Biplab Chkrabarti
Measuring Customers Satisfaction in Library and Information Centre (LIC) inService Economy-Methods and Processes – An Approach for Development 24S. B. Banerjee
Collection of Vidyasagar University Central Library: A Bibliometric Study 30Pijush Kanti Jana, Debabrata Maity
An analytical study of Biotechnology Open Access Journals archived in DOAJ 45S Banerjee, B Chakraborti
Globalizing College Libraries Using ICT : A Case Study 54Chaudhuri Mafijul Kabir
Annals of Library and Information Studies: An Analysis of Citation Pattern 61Swati Misra, Bidyarthi Dutta
Who Should Be A Librarian? Neuropsychology, Prefrontal Cortex and Aging ofLIS entrants 79Soumen Mallik
Visual Representation of Information and Modern Libraries 94Anila Sulochana, Devika P Madalli, Durga Sankar Rath

Webometric Analysis of Management Institutes:A Case Study in West Bengal
Tapan Kumar Mandal*
Biplab Chkrabarti**
*Asst. Librarian, Indian Statistical Institute, 203 B T Road, Kolkata-110**Professor, DLIS, University of Calcutta
AbstractAn attempt has been made to find out the overall web ranking of all the AllIndia Council for Technical Education (AICTE) approved management schoolsincluding the National Management Schools in West Bengal for the analysisof the link, rich files and scholars. Data which were collected through the web,Majestic SEO -a third party readymade software have been used to identifyand measure inlinks and external links. For the webometric study it can besaid that although webometric study have some limitations (such ascommercial search engines are not valid for a foundation for qualitativewebometric analysis), it is very useful in link analysis as well as to find outthe overall web ranking of the institutes which is having their own domain.Based on the observations suitable suggestions have been proposed.
1 Introduction
The concept of ranking system for higher academic institutions has been grown up especiallyafter 1990s due to the impact of globalization on higher education. The global ranking of highereducational institutions especially colleges, research institutes or university systems is a mammothtask. Besides, there exists no universally accepted methodology to be followed while ranking theuniversities or institutes. Previously, bibliometric indicators (like counting citations, number ofpublished articles, and score of impact factor) and other related factors (student-teacher ratio,number of awards received, etc.) were used to be utilized to rank the universities or institutionsor persons based on their achievements.But, with the tremendous advancement in transformation of print media to digital media and thepopularity of Internet paved way to generate the new methodologies for ranking universities orinstitutes. Some major international initiatives on ranking the colleges and universities are: (a)Academic Ranking of World Universities (ARWU), Shanghai; (b) Center for College Affordability& Productivity, USA; (c) Global Universities Ranking, Russia; (d) Macleans, Canada; (e) Ranking

2 Mandal & Chkrabarti
VUJLIS, 18-19, 2013-14 ISSN : 0972-8570
Forum of Swiss Universities; (f) Ranking Web of World Universities (RWWU) by CybermetricsLab (www.webometrics.info); (g) Times Higher Education (THE) Ranking etc.Now-a-days, ranking based on website analysis or statistics is getting more and more popularbecause of reduced time involvement and easy access to data. Webometrics describesquantitatively and analyses statistically the organization, storage, distribution of information usingmathematical and statistical techniques. Webometrics was triggered by the assumption that theweb is an enormous document repository with many of these documents being academic. Moreover,the web has its own citation indexes in the form of commercial search engines can also delivertheir results automatically to investigators’ computer programs, allowing large-scale investigations.One of the most visible outputs of webometrics is the ranking of world universities based upontheir web sites and online impact.Webometrics includes link analysis, web citation analysis, search engine evaluation and purelydescriptive studies of the web. These are reviewed hereafter, in addition to one recent application,e.g. : the analysis of the Web 2.0 phenomena. It is to be noted that there exists some research ondeveloping web-based metrics for web sites to evaluate various aspects of their construction,such as usability and information content. According to Almind and Ingwersen(1997),”the studyof web-based content with primarily quantitative methods for social science research goalsusing techniques that are not specific to one field of study”. According to Björneborn andIngwersen (2004), webometrics is “the study of quantitative aspects of the construction and useof information resources structure and technologies on the web drawing on Bibliometric andInformetric approaches”. According to Thelwall, M. (2009),” webometrics is (a) a set ofquantitative techniques for tracking and evaluating the impact of web sites and online ideas and(b) the information science research field that developed these ideas. Webometric techniquesinclude link analysis, web mention analysis, blog analysis and search engine evaluation, but fromthe perspective of digital library evaluation the main method is link analysis.”1 Objectives
1. To find out the top ranking management institutes in West Bengal.2. To rank management institutes/ universities/ colleges using WIF-inlinks.3. To rank management institutes /universities/ colleges using Webometric Ranking.
3 Review of Related Literature
Peter Ingwersen investigates the results and meaningfulness of applying the Social ScienceCitation Index (SSCI, ISI, USA) to publication and citation studies of nine selected SocialScience research areas in Scandinavia by analysing the international visibility, the research profiles,and relative citation impact (Ingwersen, 2010).

Webometric Analysis of Management Institutes: A Case Study in West Bengal 3
ISSN : 0972-8570 VUJLIS, 18-19, 2013-14
Gaby Haddow and Paul Genoni analyse citations for Australian social science journals to determinethe differences between data drawn from Web of Science and Scopus. They suggest that theScopus database provides higher number of citations for more of the journals. (Haddow andGenoni, 2010).A.J. Nederhof and E. Van Wijk developed a method to identify and map the internationally mostvisible research topics occurring in the social and behavioral sciences, as well as the topics whichchanged most over a decade. They compared two periods: 1981–1985 and 1986–1990 (Nederhof and Wijk, 1997).Amara, Nabil and Réjean Landry examine the research outputs of scholars in business schoolsand shows how their performance assessment is significantly affected when using data extractedeither from the Thomson ISI Web of Science (WoS) or from Google Scholar (GS)( Nabil&Landry, 2012). J. E. Hirsch proposes the index h, defined as the number of papers with citation number =h, asa useful index to characterize the scientific output of a researcher (Hirsch, 2005).Liv Danman Fugl defines the most important rules in his thesis entitled” Fundamental methodologiesand tools for the employment of webometric analyses” to keep in mind before performingwebomertic analyses. (Fugl, 2001).
4 Methodology
4.1 Scope and Coverage
All the All India Council for Technical Education (AICTE) approved management schools includingthe National Management Schools in West Bengal have been covered for the analysis of thelinks, rich files and scholars to find out the overall web ranking. For webometric analysis thedata were collected during October-December, 2013. All the management institutes of WestBengal have been considered for the purpose of ranking using webometric indicators (Videtable: 1).
1ABS Academy of Science,Technology & Management
Durgapur absacademy.com
2Advanced College of Management
Kakinara acmkolkata.org
3Apex Management Institute
Kolkata apexindia.org
4Army Institute of Management
Kolkata aim.ac.in
5Aryabhatta Institute of Engineering and Management
Durgapuraiemd.org
6Bengal College of Engineering & Technology
Durgapurbcetdgp.ac.in

4 Mandal & Chkrabarti
VUJLIS, 18-19, 2013-14 ISSN : 0972-8570
7Budge Budge Institute of Technology
Kolkata bbit.edu.in
8Calcutta Business School
Bisnhupur, 24pgs (S)
calcuttabusinessschool.org
9Calcutta Institute of Engineering and Management
Kolkataiemcal.com
10Calcutta Institute of Technology
Kolkataciemcal.org
11 Department of Business Administration, The University of Burdwan
Burdwan buruniv.ac.in
12 Department of Business Administration, University of Kalyani
Nodia klyuniv.ac.in
13Department of Business Management, University of Calcutta
Kolkatabmcaluniv.org
14 Department of Management Studies, National Institute of Technology
Durgapur nitdgp.ac.in
15Dr. B.C. Roy Engineering College, Durgapur
Durgapur bcrec.net.in
16Durgapur Society of Management Science
Durgapurdsmsindia.com
17Future Business School
Kolkata teamfuture.in
18Future Institute of Engineering and Management
Kolkata teamfuture.in
19George College (Department of Management Studies)
Kolkata georgecollege.org
20Globsyn Business School
Kolkata globsyn.edu.in
21Goenka College of Commerce and Business Administration
Kolkatagoenkacollege.net
22Gurunanak Institute of Technology
Kolkatagnit.ac.in
23Haldia Institute of Technology
Midnapur (E)hit-haldia.net
24 ILEAD: Institute of Leadership, Entrepreneurship & Development
Kolkatailead.net.in
25IMS Business School
Kolkataimscal.org
26Indian Institute of Management, Kolkata
Joka iimcal.ac.in
27Indian Institute of Social Welfare and Business Management
Kolkata iiswbm.edu
28Indian Institute of Technology, Kharagpur
Midnapur (W) iitkgp.ernet.in/vgsom
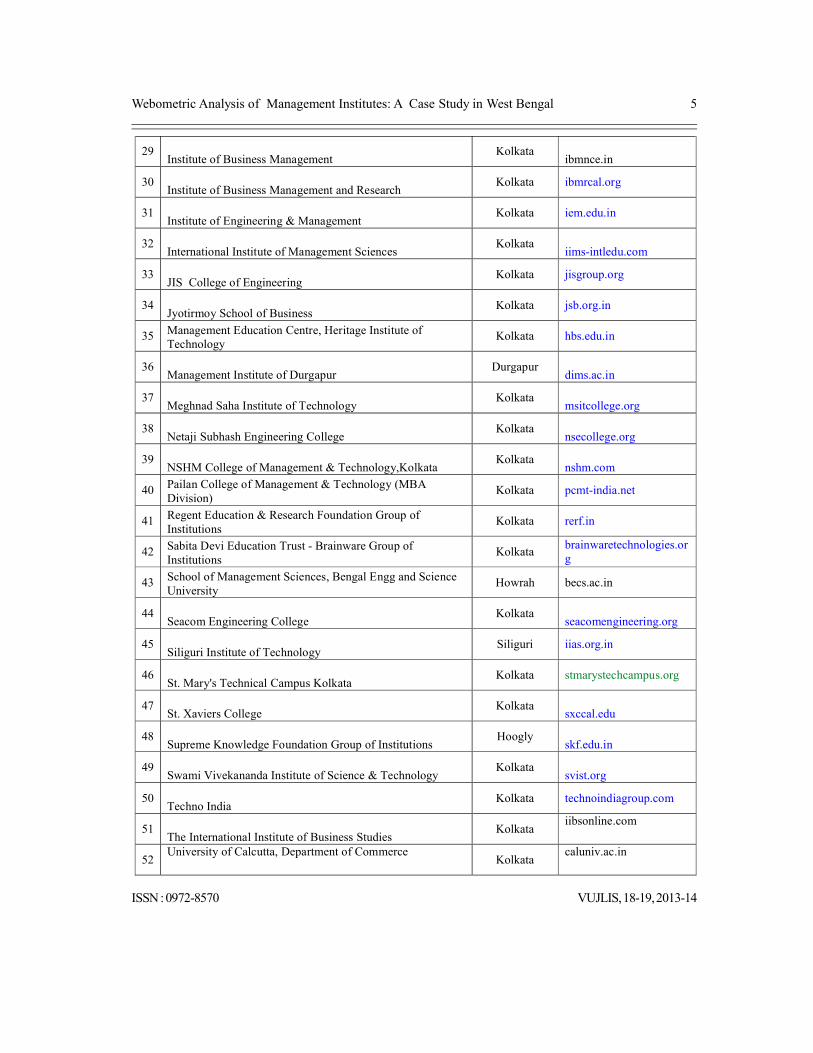
Webometric Analysis of Management Institutes: A Case Study in West Bengal 5
ISSN : 0972-8570 VUJLIS, 18-19, 2013-14
29Institute of Business Management
Kolkataibmnce.in
30Institute of Business Management and Research
Kolkata ibmrcal.org
31Institute of Engineering & Management
Kolkata iem.edu.in
32International Institute of Management Sciences
Kolkataiims-intledu.com
33JIS College of Engineering
Kolkata jisgroup.org
34Jyotirmoy School of Business
Kolkata jsb.org.in
35 Management Education Centre, Heritage Institute of Technology
Kolkata hbs.edu.in
36Management Institute of Durgapur
Durgapurdims.ac.in
37Meghnad Saha Institute of Technology
Kolkatamsitcollege.org
38Netaji Subhash Engineering College
Kolkatansecollege.org
39NSHM College of Management & Technology,Kolkata
Kolkatanshm.com
40 Pailan College of Management & Technology (MBA Division)
Kolkata pcmt-india.net
41 Regent Education & Research Foundation Group of Institutions
Kolkata rerf.in
42 Sabita Devi Education Trust - Brainware Group of Institutions
Kolkatabrainwaretechnologies.org
43 School of Management Sciences, Bengal Engg and Science University
Howrah becs.ac.in
44Seacom Engineering College
Kolkataseacomengineering.org
45Siliguri Institute of Technology
Siliguri iias.org.in
46St. Mary's Technical Campus Kolkata
Kolkata stmarystechcampus.org
47St. Xaviers College
Kolkatasxccal.edu
48Supreme Knowledge Foundation Group of Institutions
Hooglyskf.edu.in
49Swami Vivekananda Institute of Science & Technology
Kolkatasvist.org
50Techno India
Kolkata technoindiagroup.com
51The International Institute of Business Studies
Kolkataiibsonline.com
52University of Calcutta, Department of Commerce
Kolkatacaluniv.ac.in

6 Mandal & Chkrabarti
VUJLIS, 18-19, 2013-14 ISSN : 0972-8570
4.2 Selection of Search Engines
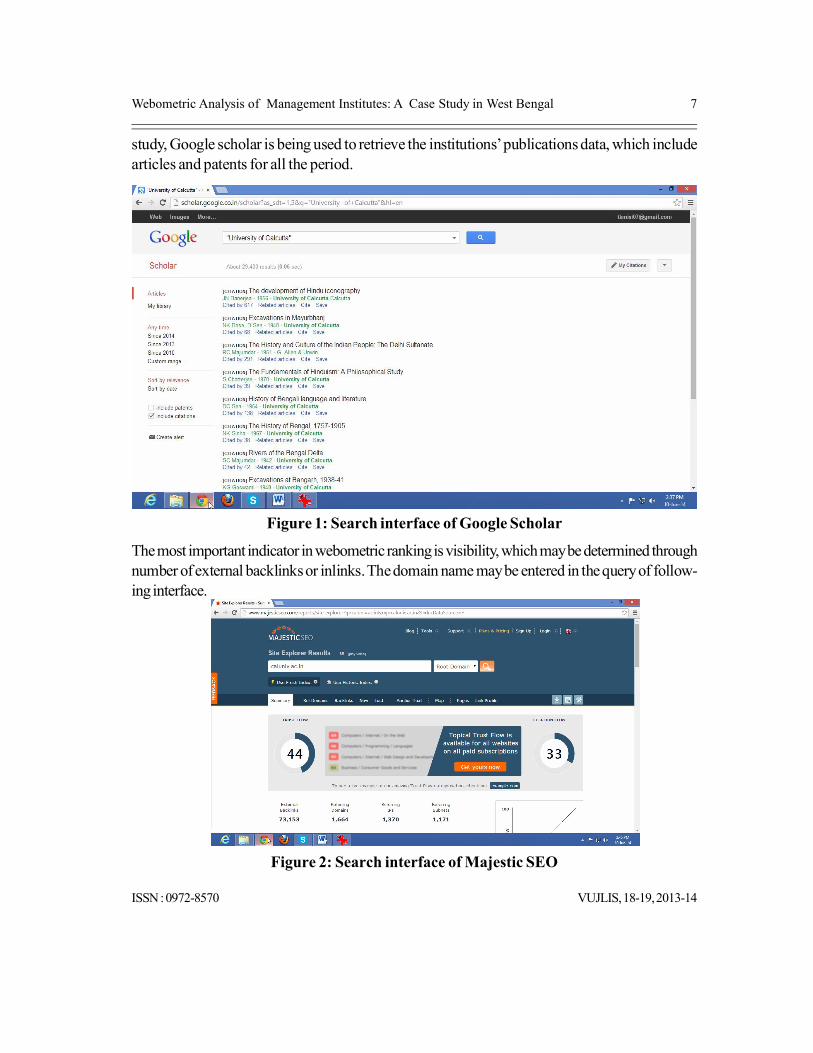
Selection of search engines plays a vital role in webometric research. Commercial search engineslike AltaVista, Yahoo!, Google and All The Web are usually used for collecting data in webometricresearch but recently most of the commercial search engines are not supporting the webometricresearch. Search engine ‘Google’ has been chosen to collect data on ‘Number of webpages’and ‘Rich Files’. Rich file consists of predominantly used four file types (.pdf, .doc, .docx andppt). For collecting rich files, Google search engines have been used. The data have been col-lected during September-December, 2013. The syntax site: asci.org.in filetype:pdf is used tocollect data. On the other hand, Google Scholar is used to collect data on scholar value. Searchengines SEO tools like majestic SEO or ahref may be used to collect data on inlinks. In ourstudy, inlinks i.e. external backlinks are collected using majestic SEO tool (www.majesticseo.com).On submission of domain name in the query box, data on external inlinks are obtained.
4.3 Choice of Indicators
Four indicators i.e Size (webpage), Visibility (inlinks), Rich Files and Scholar (Google scholar)as used in Ranking Web of Business Schools (http://business-schools.webometrics.info/) areused in the present study to rank management institutes in India.
Table 2—Indicators used
4.4 Data Collection
The current study retrieves data on size and rich files during September-December, 2013 usingGoogle search engine. Data on Rich Files (.pdf, .doc, .docx, and .ppt) were collected with thehelp of query like site: caluniv.ac.in filetype:doc (file type .doc and domain name for Univer-sity of Calcutta).In order to retrieve data from Google Scholar (scholar.google.com), university name were usedin the exact query expression to get the precise results for each university under study. In the
S.N Indicators Symbols Descriptions Weights1. Size S Total number of web pages indexed by
search engines40
2. Visibility V Total number of inlinks indexed by search engines
50
3. Rich Files R Total number of rich files comprising of .doc, .pdf, .ps, .ppt
5
4. Scholar Sc Number of publications retrieved from Google Scholar for articles and patents
5
Total 100
Webometric Analysis of Management Institutes: A Case Study in West Bengal 7
ISSN : 0972-8570 VUJLIS, 18-19, 2013-14
study, Google scholar is being used to retrieve the institutions’ publications data, which includearticles and patents for all the period.
Figure 1: Search interface of Google Scholar
The most important indicator in webometric ranking is visibility, which may be determined throughnumber of external backlinks or inlinks. The domain name may be entered in the query of follow-ing interface.
Figure 2: Search interface of Majestic SEO
8 Mandal & Chkrabarti
VUJLIS, 18-19, 2013-14 ISSN : 0972-8570
4.5 Ranking Criteria and Weights
The success and popularity of any ranking method is based on right combination of indicators.Ranking of all the management institutes is made based on four indicators: size (40%), visibility(50%), rich files (5%) and scholar (5%). Methodology along with indicators with correspondingweights are followed as in Ranking Web of Business School (http://business-schools.webometrics.info/en/Methodology).
4.6 Scoring Procedure
The data for each institute as extracted through search engine is being plotted in the excel sheet;called master table (annex-I) against above mentioned 4 indicators. In order to normalize thedata, all the institutes are arranged in descending order of magnitudes one by one using eachindicators and assigned ranks to them.
Finally, the index score for each university/institute is calculated by multiplying the values of eachvariable (rank obtained by each indicator) with its corresponding weight using formula (2) asmentioned below.
Here, the webometric ranking function is described as follows:
WR = f (S, V, R, Sc, C,Wg, Ug, P,H, Pr)………………………………(1)
For calculation,
Value for WR = (40% * S+ 50%* V + 5%* R + 5%* Sc)
……………………………….....(2)
After obtaining final score using the above formula, institutes or universities are arranged in as-cending order of magnitude to obtain the final rank against each universities/institutes.
5 Results and Discussion
Table 2: Institutes are arranged based on number of webpages
1School of Management Sciences, Bengal Engg and Science University
Howrah becs.ac.in142097
2University of Calcutta, Department of Commerce
Kolkatacaluniv.ac.in 19031
3 Indian Institute of Management,Kolkata Joka iimcal.ac.in 14668
4Department of Business Administration, The University of Burdwan
Burdwan buruniv.ac.in11340
5 Apex Management Institute Kolkata apexindia.org 8621
6Department of Management Studies, National Institute of Technology
Durgapur nitdgp.ac.in 7127
Midnapur

Webometric Analysis of Management Institutes: A Case Study in West Bengal 9
ISSN : 0972-8570 VUJLIS, 18-19, 2013-14
7Indian Institute of Technology, Kharagpur
Midnapur (W)
iitkgp.ernet.in/vgsom6795
8 Institute of Engineering & Management Kolkata iem.edu.in 3312
9 St. Xaviers College Kolkata sxccal.edu 269510 Advanced College of Management Kakinara acmkolkata.org 1340
11Department of Business Administration, University of Kalyani
Nodia klyuniv.ac.in 1340
12NSHM College of Management & Technology,Kolkata
Kolkatanshm.com
1278
13Sabita Devi Education Trust - Brainware Group of Institutions
Kolkata brainwaretechnologies.org 1056
14ILEAD: Institute of Leadership, Entrepreneurship & Development
Kolkatailead.net.in
1054
15Bengal College of Engineering & Technology
Durgapurbcetdgp.ac.in
673
16Swami Vivekananda Institute of Science & Technology
Kolkatasvist.org
648
17Calcutta Business School
Bisnhupur, 24pgs (S) calcuttabusinessschool.org
645
18 Jyotirmoy School of Business Kolkata jsb.org.in 596
19Regent Education & Research Foundation Group of Institutions
Kolkata rerf.in 577
20 Institute of Business Management Kolkata ibmnce.in 536
21Indian Institute of Social Welfare and Business Management
Kolkata iiswbm.edu 489
22 Gurunanak Institute of Technology Kolkata gnit.ac.in 455
23Aryabhatta Institute of Engineering and Management
Durgapuraiemd.org
440
24 Future Business School Kolkata teamfuture.in 404
25Future Institute of Engineering and Management
Kolkata teamfuture.in 404
26The International Institute of Business Studies
Kolkataiibsonline.com
376
27Supreme Knowledge Foundation Group of Institutions
Hooglyskf.edu.in
367
28Pailan College of Management & Technology (Mba Division)
Kolkata pcmt-india.net 358
29 Siliguri Institute of Technology Siliguri iias.org.in 344
30Haldia Institute of Technology
Midnapur (E) hit-haldia.net
336
31Calcutta Institute of Engineering and Management
Kolkataiemcal.com
332

10 Mandal & Chkrabarti
VUJLIS, 18-19, 2013-14 ISSN : 0972-8570
32 Budge Budge Institute of Technology Kolkata bbit.edu.in 257
33 Army Institute of Management Kolkata aim.ac.in 235
34Department of Business Management, University of Calcutta
Kolkatabmcaluniv.org
192
35 JIS College of Engineering Kolkata jisgroup.org 189
36George College (Department of Management Studies)
Kolkata georgecollege.org 158
37Management Education Centre, Heritage Institute of Technology
Kolkata hbs.edu.in 154
38Goenka College of Commerce and Business Administration
Kolkatagoenkacollege.net
150
39International Institute of Management Sciences
Kolkataiims-intledu.com
131
40 Techno India Kolkata technoindiagroup.com 124
41 Seacom Engineering College Kolkata seacomengineering.org 122
42ABSAcademy of Science,Technology & Management
Durgapur absacademy.com 97
43 Management Institute of Durgapur Durgapur dims.ac.in 96
44 Globsyn Business School Kolkata globsyn.edu.in 95
45Dr. B.C. Roy Engineering College, Durgapur
Durgapur bcrec.net.in 79
46 Meghnad Saha Institute of Technology Kolkata msitcollege.org 71
47 Netaji Subhash Engineering College Kolkata nsecollege.org 70
48 IMS Business School Kolkata imscal.org 55
49 Durgapur Society of Management Science Durgapur dsmsindia.com 37
50 Calcutta Institute of Technology Kolkata ciemcal.org 22
51 St. Mary's Technical Campus Kolkata Kolkata stmarystechcampus.org 6
52Institute of Business Management and Research
Kolkata ibmrcal.org 1
Table 3: Institutes are arranged based on number of inlinks
Sl no Institute
City Domaininlinks (V)
1 Indian Institute of Management,Kolkata Joka iimcal.ac.in 79972
2University of Calcutta, Department of Commerce
Kolkatacaluniv.ac.in 79572
3 JIS College of Engineering Kolkata jisgroup.org 43765
4Department of Management Studies, National Institute of Technology
Durgapur nitdgp.ac.in 41471
5Indian Institute of Technology, Kharagpur
Midnapur (W)
iitkgp.ernet.in/vgsom28189
The International Institute of Business
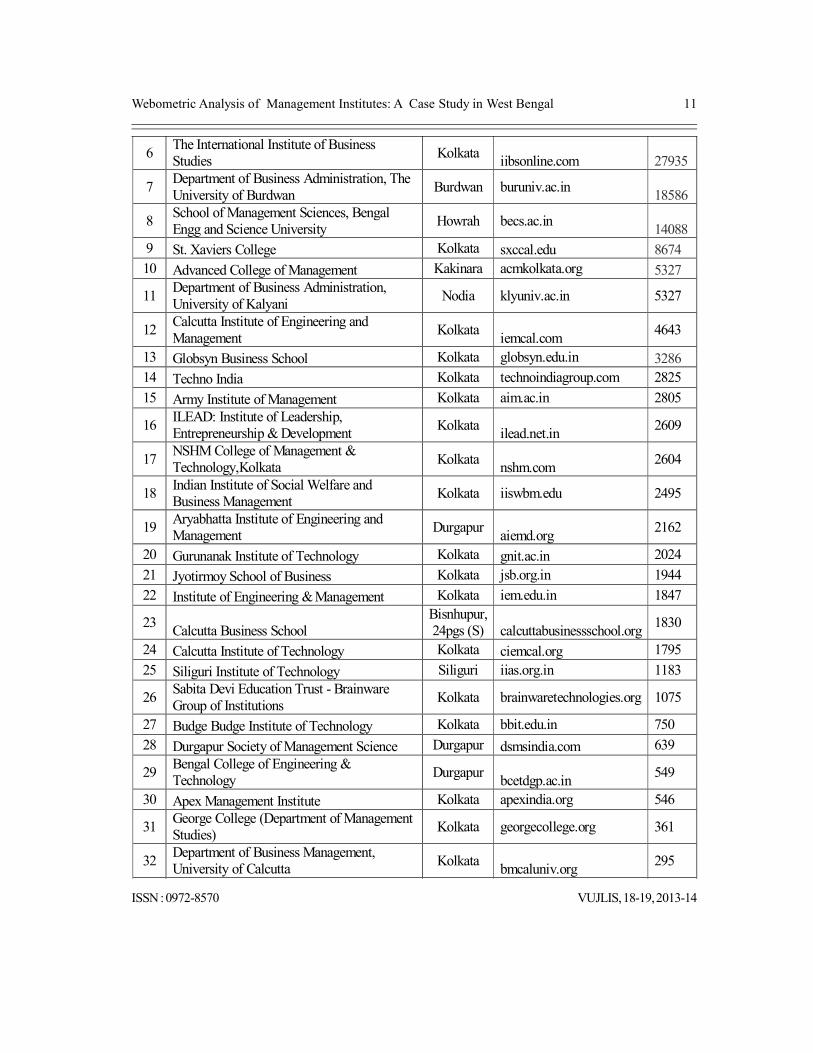
Webometric Analysis of Management Institutes: A Case Study in West Bengal 11
ISSN : 0972-8570 VUJLIS, 18-19, 2013-14
6The International Institute of Business Studies
Kolkataiibsonline.com 27935
7Department of Business Administration, The University of Burdwan
Burdwan buruniv.ac.in18586
8School of Management Sciences, Bengal Engg and Science University
Howrah becs.ac.in14088
9 St. Xaviers College Kolkata sxccal.edu 867410 Advanced College of Management Kakinara acmkolkata.org 5327
11Department of Business Administration, University of Kalyani
Nodia klyuniv.ac.in 5327
12Calcutta Institute of Engineering and Management
Kolkataiemcal.com
4643
13 Globsyn Business School Kolkata globsyn.edu.in 328614 Techno India Kolkata technoindiagroup.com 2825
15 Army Institute of Management Kolkata aim.ac.in 2805
16ILEAD: Institute of Leadership, Entrepreneurship & Development
Kolkatailead.net.in
2609
17NSHM College of Management & Technology,Kolkata
Kolkatanshm.com
2604
18Indian Institute of Social Welfare and Business Management
Kolkata iiswbm.edu 2495
19Aryabhatta Institute of Engineering and Management
Durgapuraiemd.org
2162
20 Gurunanak Institute of Technology Kolkata gnit.ac.in 2024
21 Jyotirmoy School of Business Kolkata jsb.org.in 1944
22 Institute of Engineering & Management Kolkata iem.edu.in 1847
23Calcutta Business School
Bisnhupur, 24pgs (S) calcuttabusinessschool.org
1830
24 Calcutta Institute of Technology Kolkata ciemcal.org 1795
25 Siliguri Institute of Technology Siliguri iias.org.in 1183
26Sabita Devi Education Trust - Brainware Group of Institutions
Kolkata brainwaretechnologies.org 1075
27 Budge Budge Institute of Technology Kolkata bbit.edu.in 750
28 Durgapur Society of Management Science Durgapur dsmsindia.com 639
29Bengal College of Engineering & Technology
Durgapurbcetdgp.ac.in
549
30 Apex Management Institute Kolkata apexindia.org 546
31George College (Department of Management Studies)
Kolkata georgecollege.org 361
32Department of Business Management, University of Calcutta
Kolkatabmcaluniv.org
295
Goenka College of Commerce and Business

12 Mandal & Chkrabarti
VUJLIS, 18-19, 2013-14 ISSN : 0972-8570
33Goenka College of Commerce and Business Administration
Kolkatagoenkacollege.net
295
34 Institute of Business Management Kolkata ibmnce.in 273
35Supreme Knowledge Foundation Group of Institutions
Hooglyskf.edu.in
187
36Pailan College of Management & Technology (MBA Division)
Kolkata pcmt-india.net 183
37Swami Vivekananda Institute of Science & Technology
Kolkatasvist.org
180
38 Meghnad Saha Institute of Technology Kolkata msitcollege.org 166
39 Future Business School Kolkata teamfuture.in 140
40Future Institute of Engineering and Management
Kolkata teamfuture.in 140
41 IMS Business School Kolkata imscal.org 138
42Haldia Institute of Technology
Midnapur (E) hit-haldia.net
131
43 Netaji Subhash Engineering College Kolkata nsecollege.org 104
44 Management Institute of Durgapur Durgapur dims.ac.in 70
45 Seacom Engineering College Kolkata seacomengineering.org 65
46ABSAcademy of Science,Technology & Management
Durgapur absacademy.com 59
47 Dr. B.C. Roy Engineering College, Durgapur Durgapur bcrec.net.in 57
48Institute of Business Management and Research
Kolkata ibmrcal.org 54
49International Institute of Management Sciences
Kolkataiims-intledu.com
37
50 St. Mary's Technical Campus Kolkata Kolkata stmarystechcampus.org 25
51Management Education Centre, Heritage Institute of Technology
Kolkata hbs.edu.in 14
52Regent Education & Research Foundation Group of Institutions
Kolkata rerf.in 13
Webometric Analysis of Management Institutes: A Case Study in West Bengal 13
ISSN : 0972-8570 VUJLIS, 18-19, 2013-14
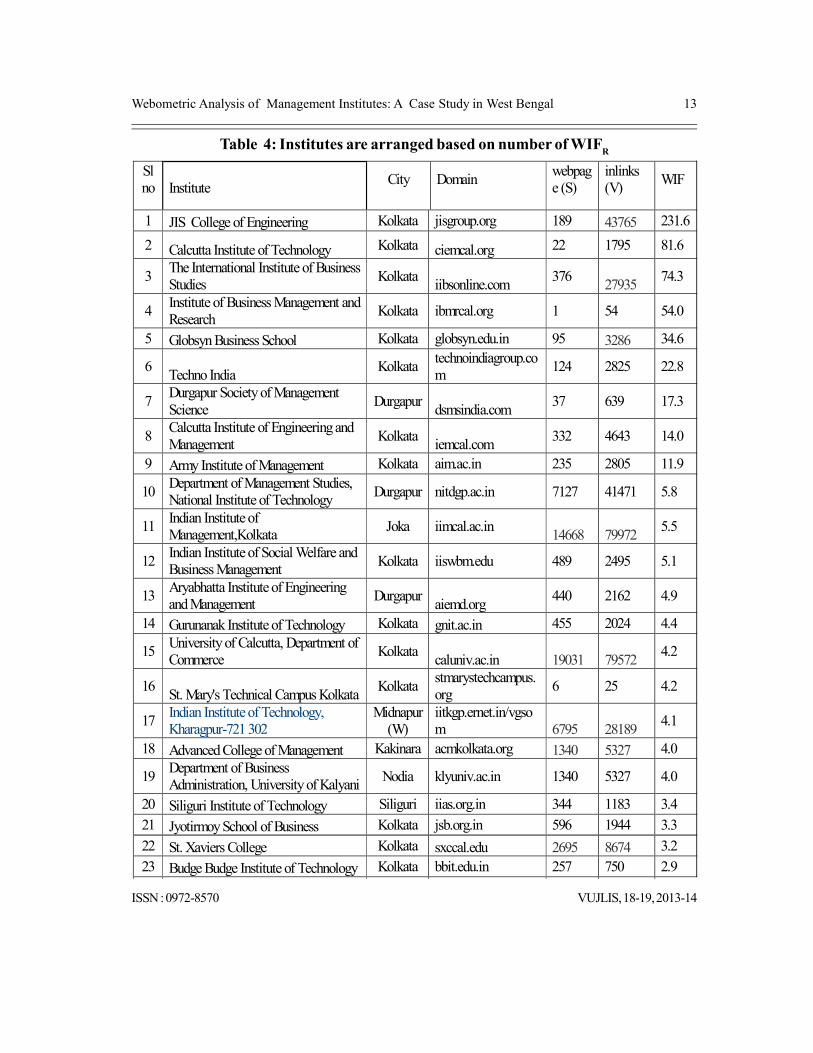
Table 4: Institutes are arranged based on number of WIFR
Sl no Institute
City Domainwebpage (S)
inlinks (V)
WIF
1 JIS College of Engineering Kolkata jisgroup.org 189 43765 231.6
2 Calcutta Institute of Technology Kolkata ciemcal.org 22 1795 81.6
3The International Institute of Business Studies
Kolkataiibsonline.com
37627935
74.3
4Institute of Business Management and Research
Kolkata ibmrcal.org 1 54 54.0
5 Globsyn Business School Kolkata globsyn.edu.in 95 3286 34.6
6Techno India
Kolkatatechnoindiagroup.com
124 2825 22.8
7Durgapur Society of Management Science
Durgapurdsmsindia.com
37 639 17.3
8Calcutta Institute of Engineering and Management
Kolkataiemcal.com
332 4643 14.0
9 Army Institute of Management Kolkata aim.ac.in 235 2805 11.9
10Department of Management Studies, National Institute of Technology
Durgapur nitdgp.ac.in 7127 41471 5.8
11Indian Institute of Management,Kolkata
Joka iimcal.ac.in14668 79972
5.5
12Indian Institute of Social Welfare and Business Management
Kolkata iiswbm.edu 489 2495 5.1
13Aryabhatta Institute of Engineering and Management
Durgapuraiemd.org
440 2162 4.9
14 Gurunanak Institute of Technology Kolkata gnit.ac.in 455 2024 4.4
15University of Calcutta, Department of Commerce
Kolkatacaluniv.ac.in 19031 79572
4.2
16St. Mary's Technical Campus Kolkata
Kolkatastmarystechcampus.org
6 25 4.2
17Indian Institute of Technology, Kharagpur-721 302
Midnapur (W)
iitkgp.ernet.in/vgsom 6795 28189
4.1
18 Advanced College of Management Kakinara acmkolkata.org 1340 5327 4.0
19Department of Business Administration, University of Kalyani
Nodia klyuniv.ac.in 1340 5327 4.0
20 Siliguri Institute of Technology Siliguri iias.org.in 344 1183 3.4
21 Jyotirmoy School of Business Kolkata jsb.org.in 596 1944 3.3
22 St. Xaviers College Kolkata sxccal.edu 2695 8674 3.2
23 Budge Budge Institute of Technology Kolkata bbit.edu.in 257 750 2.9Bisnhupu

14 Mandal & Chkrabarti
VUJLIS, 18-19, 2013-14 ISSN : 0972-8570
24Calcutta Business School
Bisnhupur, 24pgs
(S)calcuttabusinessschool.org
645 1830 2.8
25 Ims Business School Kolkata imscal.org 55 138 2.5
26ILEAD: Institute of Leadership, Entrepreneurship & Development
Kolkatailead.net.in
1054 2609 2.5
27Meghnad Saha Institute of Technology
Kolkatamsitcollege.org
71 166 2.3
28George College (Department of Management Studies)
Kolkata georgecollege.org 158 361 2.3
29NSHM College of Management & Technology,Kolkata
Kolkatanshm.com
1278 2604 2.0
30Goenka College of Commerce and Business Administration
Kolkatagoenkacollege.net
150 295 2.0
31Department of Business Administration, The University of Burdwan
Burdwan buruniv.ac.in11340 18586
1.6
32Department of Business Management, University of Calcutta
Kolkatabmcaluniv.org
192 295 1.5
33 Netaji Subhash Engineering College Kolkata nsecollege.org 70 104 1.5
34Sabita Devi Education Trust -Brainware Group of Institutions
Kolkatabrainwaretechnologies.org
1056 1075 1.0
35Bengal College of Engineering & Technology
Durgapurbcetdgp.ac.in
673 549 0.8
36 Management Institute of Durgapur Durgapur dims.ac.in 96 70 0.7
37Dr. B.C. Roy Engineering College, Durgapur
Durgapur bcrec.net.in 79 57 0.7
38ABS Academy of Science, Technology & Management
Durgapur absacademy.com 97 59 0.6
39Institute of Engineering & Management
Kolkata iem.edu.in 3312 1847 0.6
40Seacom Engineering College
Kolkataseacomengineering.org
122 65 0.5
41Pailan College of Management & Technology (MBA Division)
Kolkata pcmt-india.net 358 183 0.5
42Supreme Knowledge Foundation Group of Institutions
Hooglyskf.edu.in
367 187 0.5
43 Institute of Business Management Kolkata ibmnce.in 536 273 0.5
44Haldia Institute of Technology
Midnapur (E) hit-haldia.net
336 131 0.4
45 Future Business School Kolkata teamfuture.in 404 140 0.3
46Future Institute of Engineering and Management
Kolkata teamfuture.in 404 140 0.3
International Institute of Management

Webometric Analysis of Management Institutes: A Case Study in West Bengal 15
ISSN : 0972-8570 VUJLIS, 18-19, 2013-14
47International Institute of Management Sciences
Kolkataiims-intledu.com
131 37 0.3
48Swami Vivekananda Institute of Science & Technology
Kolkatasvist.org
648 180 0.3
49School of Management Sciences, Bengal Engg and Science University
Howrah becs.ac.in142097 14088
0.1
50Management Education Centre, Heritage Institute of Technology
Kolkata hbs.edu.in 154 14 0.1
51 Apex Management Institute Kolkata apexindia.org 8621 546 0.1
52Regent Education & Research Foundation Group of Institutions
Kolkata rerf.in 577 13 0.0
Ranking the institutes based on WIF may not be the good indicators because the overall resultsare highly influenced by either high value of webpages or low value of inlinks.
6 Overall Ranking
Following table reflects the ranking of the institutes using the methodology adopted by RankingWeb of Business Schools (http://business-schools.webometrics.info/)
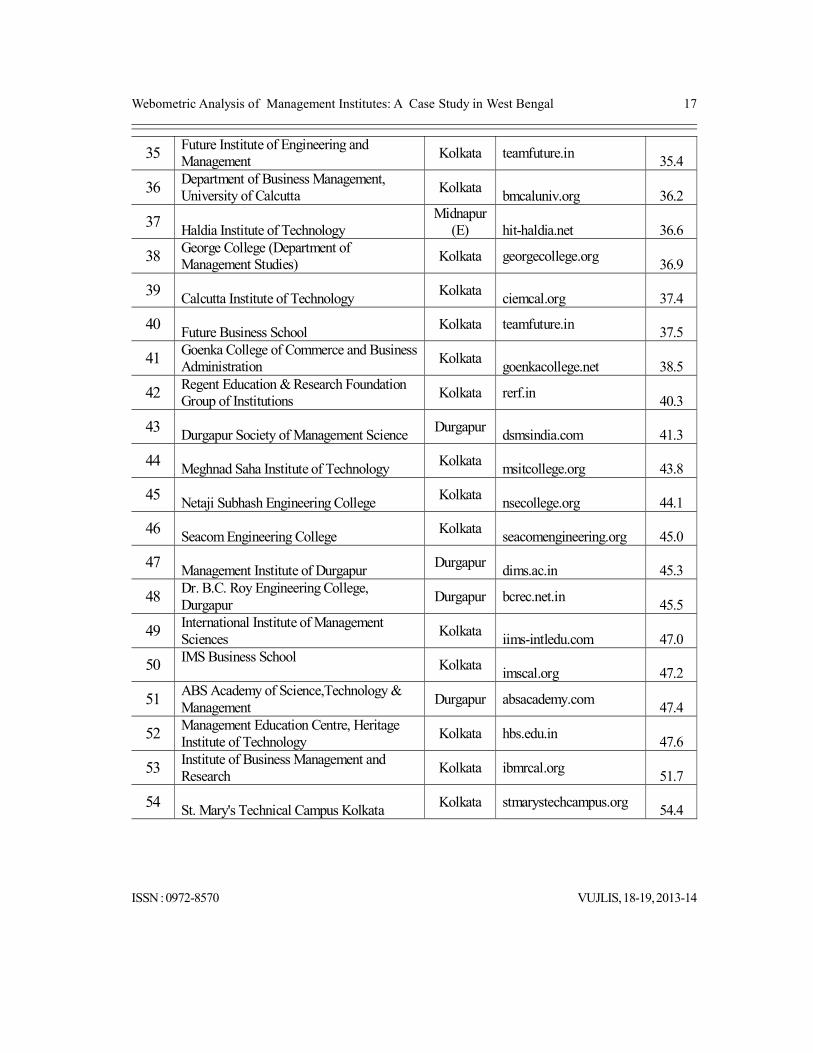
Table 5: Overall Ranking of the Management Institutes
Rank Institute
City DomainRank Score
1 Indian Institute of Management,KolkataKolkata iimcal.ac.in
3.0
2 University of Calcutta, Department of Commerce
Kolkatacaluniv.ac.in 4.4
3 School of Management Sciences, Bengal Engg and Science University
Howrah becs.ac.in4.9
4 Department of Management Studies, National Institute of Technology
Durgapur nitdgp.ac.in5.4
5 Department of Business Administration, The University of Burdwan
Burdwan buruniv.ac.in6.2
6 St. Xaviers CollegeKolkata
sxccal.edu 9.2
7Indian Institute of Technology, Kharagpur
Midnapur (W)
iitkgp.ernet.in/vgsom9.3
8 Department of Business Administration, University of Kalyani
Nodia klyuniv.ac.in9.9
9 Advanced College of ManagementKakinara acmkolkata.org
15.0
10 NSHM College of Management & Technology, Kolkata
Kolkatanshm.com 17.1

16 Mandal & Chkrabarti
VUJLIS, 18-19, 2013-14 ISSN : 0972-8570
11 JIS College of EngineeringKolkata jisgroup.org
17.8
12 Institute of Engineering & ManagementKolkata iem.edu.in
17.9
15 ILEAD: Institute of Leadership, Entrepreneurship & Development
Kolkatailead.net.in 19.2
16 The International Institute of Business Studies
Kolkataiibsonline.com 19.4
17 Indian Institute of Social Welfare and Business Management
Kolkata iiswbm.edu21.0
18 Apex Management InstituteKolkata apexindia.org
22.7
19 Calcutta Institute of Engineering and Management
Kolkataiemcal.com 23.1
20 Jyotirmoy School of BusinessKolkata jsb.org.in
23.4
21 Calcutta Business School Bisnhupur, 24pgs (S)
calcuttabusinessschool.org 24.2
22 Aryabhatta Institute of Engineering and Management
Durgapuraiemd.org 24.5
23 Army Institute of ManagementKolkata aim.ac.in
24.8
24 Sabita Devi Education Trust - Brainware Group of Institutions
Kolkatabrainwaretechnologies.org 24.8
25 Gurunanak Institute of TechnologyKolkata
gnit.ac.in 24.9
26 Bengal College of Engineering & Technology
Durgapurbcetdgp.ac.in 27.2
27 Techno IndiaKolkata technoindiagroup.com
27.9
28 Globsyn Business SchoolKolkata globsyn.edu.in
28.6
29 Siliguri Institute of TechnologySiliguri iias.org.in
29.8
30 Swami Vivekananda Institute of Science & Technology
Kolkatasvist.org 30.5
31 Institute of Business ManagementKolkata
ibmnce.in 30.6
32 Budge Budge Institute of TechnologyKolkata bbit.edu.in
32.6
33 Supreme Knowledge Foundation Group of Institutions
Hooglyskf.edu.in 33.5
34 Pailan College of Management & Technology (MBA Division)
Kolkata pcmt-india.net34.3
Future Institute of Engineering and
Webometric Analysis of Management Institutes: A Case Study in West Bengal 17
ISSN : 0972-8570 VUJLIS, 18-19, 2013-14
35 Future Institute of Engineering and Management
Kolkata teamfuture.in35.4
36Department of Business Management, University of Calcutta
Kolkatabmcaluniv.org 36.2
37Haldia Institute of Technology
Midnapur (E) hit-haldia.net 36.6
38 George College (Department of Management Studies)
Kolkata georgecollege.org36.9
39 Calcutta Institute of TechnologyKolkata
ciemcal.org 37.4
40 Future Business SchoolKolkata teamfuture.in
37.5
41 Goenka College of Commerce and Business Administration
Kolkatagoenkacollege.net 38.5
42 Regent Education & Research Foundation Group of Institutions
Kolkata rerf.in40.3
43 Durgapur Society of Management ScienceDurgapur
dsmsindia.com 41.3
44 Meghnad Saha Institute of TechnologyKolkata
msitcollege.org 43.8
45 Netaji Subhash Engineering CollegeKolkata
nsecollege.org 44.1
46 Seacom Engineering CollegeKolkata
seacomengineering.org 45.0
47 Management Institute of DurgapurDurgapur
dims.ac.in 45.3
48Dr. B.C. Roy Engineering College, Durgapur
Durgapur bcrec.net.in45.5
49 International Institute of Management Sciences
Kolkataiims-intledu.com 47.0
50 IMS Business SchoolKolkata
imscal.org 47.2
51ABS Academy of Science,Technology & Management
Durgapur absacademy.com47.4
52 Management Education Centre, Heritage Institute of Technology
Kolkata hbs.edu.in47.6
53 Institute of Business Management and Research
Kolkata ibmrcal.org51.7
54 St. Mary's Technical Campus KolkataKolkata stmarystechcampus.org
54.4
18 Mandal & Chkrabarti
VUJLIS, 18-19, 2013-14 ISSN : 0972-8570
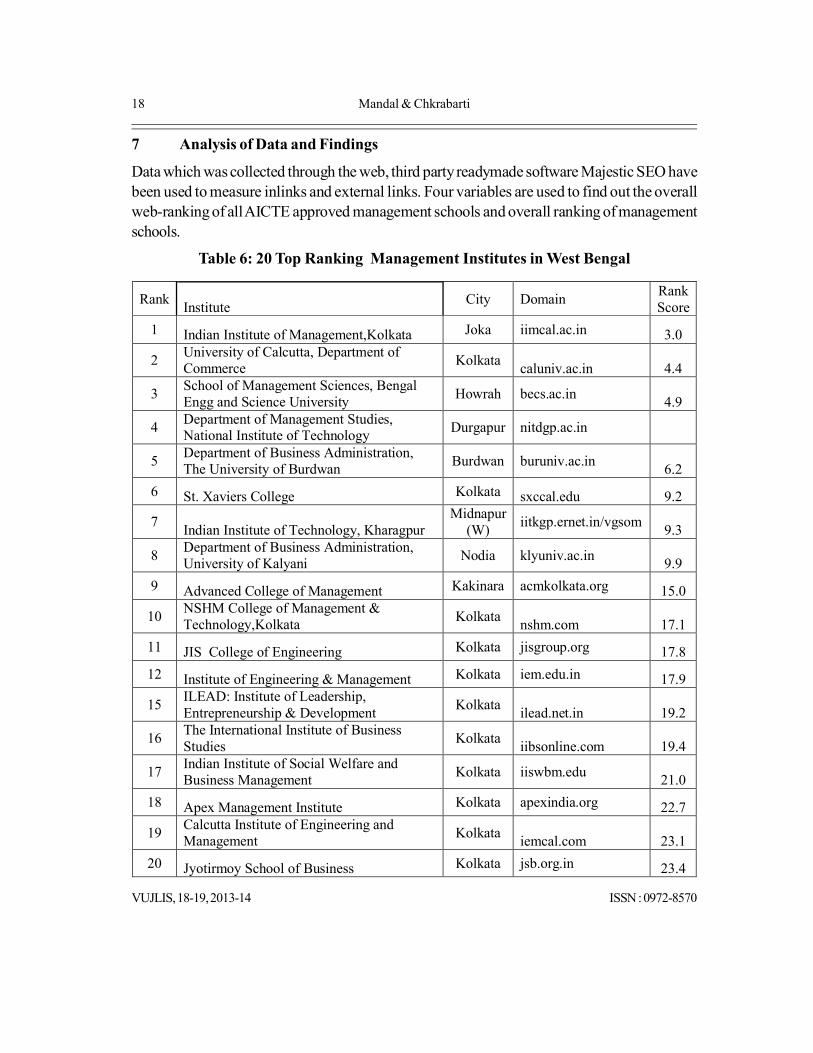
7 Analysis of Data and Findings
Data which was collected through the web, third party readymade software Majestic SEO havebeen used to measure inlinks and external links. Four variables are used to find out the overallweb-ranking of all AICTE approved management schools and overall ranking of managementschools.
Table 6: 20 Top Ranking Management Institutes in West Bengal
RankInstitute
City DomainRank Score
1 Indian Institute of Management,Kolkata Joka iimcal.ac.in 3.0
2University of Calcutta, Department of Commerce
Kolkatacaluniv.ac.in 4.4
3School of Management Sciences, Bengal Engg and Science University
Howrah becs.ac.in4.9
4Department of Management Studies, National Institute of Technology
Durgapur nitdgp.ac.in
5Department of Business Administration, The University of Burdwan
Burdwan buruniv.ac.in6.2
6 St. Xaviers College Kolkata sxccal.edu 9.2
7Indian Institute of Technology, Kharagpur
Midnapur (W)
iitkgp.ernet.in/vgsom9.3
8Department of Business Administration, University of Kalyani
Nodia klyuniv.ac.in9.9
9 Advanced College of Management Kakinara acmkolkata.org 15.0
10NSHM College of Management & Technology,Kolkata
Kolkatanshm.com 17.1
11 JIS College of Engineering Kolkata jisgroup.org 17.8
12 Institute of Engineering & Management Kolkata iem.edu.in 17.9
15ILEAD: Institute of Leadership, Entrepreneurship & Development
Kolkatailead.net.in 19.2
16The International Institute of Business Studies
Kolkataiibsonline.com 19.4
17Indian Institute of Social Welfare and Business Management
Kolkata iiswbm.edu21.0
18 Apex Management Institute Kolkata apexindia.org 22.7
19Calcutta Institute of Engineering and Management
Kolkataiemcal.com 23.1
20 Jyotirmoy School of Business Kolkata jsb.org.in 23.4
Webometric Analysis of Management Institutes: A Case Study in West Bengal 19
ISSN : 0972-8570 VUJLIS, 18-19, 2013-14
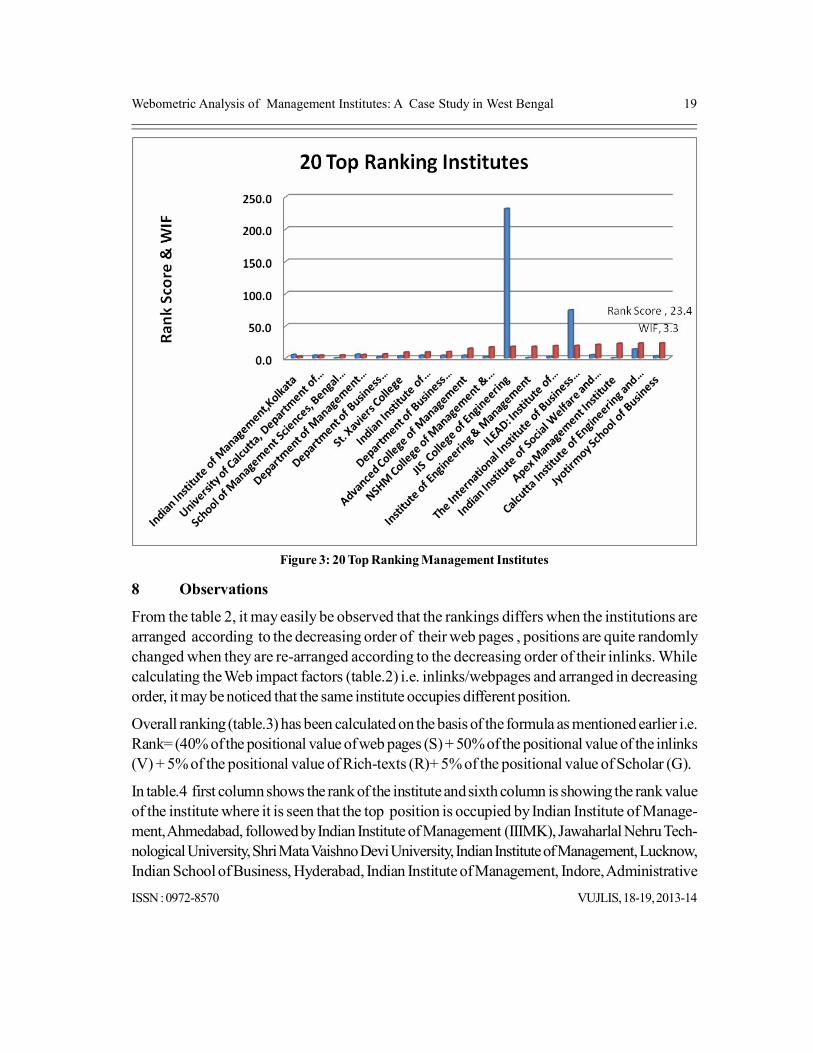
Figure 3: 20 Top Ranking Management Institutes
8 Observations
From the table 2, it may easily be observed that the rankings differs when the institutions arearranged according to the decreasing order of their web pages , positions are quite randomlychanged when they are re-arranged according to the decreasing order of their inlinks. Whilecalculating the Web impact factors (table.2) i.e. inlinks/webpages and arranged in decreasingorder, it may be noticed that the same institute occupies different position.
Overall ranking (table.3) has been calculated on the basis of the formula as mentioned earlier i.e.Rank= (40% of the positional value of web pages (S) + 50% of the positional value of the inlinks(V) + 5% of the positional value of Rich-texts (R)+ 5% of the positional value of Scholar (G).
In table.4 first column shows the rank of the institute and sixth column is showing the rank valueof the institute where it is seen that the top position is occupied by Indian Institute of Manage-ment, Ahmedabad, followed by Indian Institute of Management (IIIMK), Jawaharlal Nehru Tech-nological University, Shri Mata Vaishno Devi University, Indian Institute of Management, Lucknow,Indian School of Business, Hyderabad, Indian Institute of Management, Indore, Administrative
20 Mandal & Chkrabarti
VUJLIS, 18-19, 2013-14 ISSN : 0972-8570
Staff College of India, Hyderabad, Indian Institute of Management, Kolkata, respectively.
9 Inferences, Suggestions and Limitations
It has been observed that some institutes are having same domain as compared to the other
institutions from the same group as it has been seen in case of Narula Institute of Technology
and JIS group of Kolkata. In these cases it has been taken as only one domain of the first institute
as per the alphabetical order. It has also been observed that some institutes don’t have their own
domain, so they are not included in the present study. While studying web pages several pecu-
liarities had been noticed as mentioned above. Some management schools are having the same
domain in respect of their parent institutions, i.e. management schools are the departments of
their main institutes. For example, Vinod Gupta School of Management is one of the depart-
ments of Indian Institute of Technology, Kharagpur, So the researcher had to take the IITKGP
domain for their web pages and inlinks, scholars, rich text counting. Same is the case for Univer-
sity of Calcutta. It has a department of Business Administration which does not have separate
domain, so the researcher has to consider the domain of Calcutta University itself. And for this
reason the positional value has became much higher compared to other stand alone institutes
having their own domain with less web pages, inlinks, scholars as well as rich text and which
ultimately effects the overall ranking also.
Limitations: For the webometric study it can be said that although webometric study have
some limitations (such as commercial search engines are not valid for a foundation for qualitative
webometric analysis), it is very useful in link analysis as well as to find out the overall web ranking
of the institutes which is having their own domain. While conducting webometric analysis, one
has to be aware of the specific nature of motivations for making hyperlinks within different types
of websites, and the other aspect is that of making oneself aware of the quality of search engines
and other data collection tools that are being used (Fugl, 2001).
Based on the proceeding observations it may be proposed for further study to be done within
the domain as :
to launch more qualitative research about the motivations for hyper linking, and
to initiate better tools which are to be used within the informetric domain, it may be
much more sure about the precision in defining boundaries and limitations for the
research, when performing webometric studies.

Webometric Analysis of Management Institutes: A Case Study in West Bengal 21
ISSN : 0972-8570 VUJLIS, 18-19, 2013-14
Apppendix I: Ranked List of Management Institutes in W.B.
Rank Domain Webpage (S)
Inlinks (V)
WIF .pdf .doc .docx
.ppt Richfiles [ R ]
Scholar (G)
S V R G Rank Score
1 iimcal.ac.in 14668 79972 5.5 573 23 8 1 605 170 3 1 10 16 3.0
2 caluniv.ac.in 19031 79572 4.2 2940 30 0 0 2970 1 2 2 4 48 4.4
3 becs.ac.in 142097 14088 0.1 5600 941 56 751 7348 592 1 8 2 7 4.9
4 nitdgp.ac.in 7127 41471 5.8 885 427 56 2 1370 1880 7 4 8 3 5.4
5 buruniv.ac.in 11340 18586 1.6 603 6 156 153 918 1370 5 7 9 5 6.2
6 sxccal.edu 2695 8674 3.2 2110 1050
161 473 3794 342 10 9 3 10 9.2
7 iitkgp.ernet.in/vgsom
6795 28189 4.1 7 3 0 0 10 10 8 5 32 40 9.3
8 klyuniv.ac.in 1340 5327 4.0 2460 113 43 0 2616 1700 11 10 5 4 9.9
9 acmkolkata.org 1340 5327 4.0 1 0 0 0 1 1 12 11 44 50 15.0
10 nshm.com 1278 2604 2.0 105 0 0 0 105 12 13 18 19 39 17.1
11 jisgroup.org 189 43765 231.6 111 73 29 39 252 394 38 3 14 8 17.8
12 iem.edu.in 3312 1847 0.6 103 53 2 1 159 68 9 25 15 21 17.9
13 ilead.net.in 1054 2609 2.5 43 4 0 0 47 0 17 17 24 54 19.2
14 iibsonline.com 376 27935 74.3 3 0 0 0 3 2 29 6 39 57 19.4
15 iiswbm.edu 489 2495 5.1 1500 585 57 402 2544 212 24 21 6 12 21.0
16 apexindia.org 8621 546 0.1 18 0 0 0 18 2 6 33 30 46 22.7
17 iemcal.com 332 4643 14.0 0 0 0 0 0 113 34 12 49 20 23.1
18 jsb.org.in 596 1944 3.3 1 0 0 0 1 158 21 24 42 17 23.4
19 calcuttabusinessschool.org
645 1830 2.8 18 0 0 0 18 17 20 26 29 34 24.2
20 aiemd.org 440 2162 4.9 25 0 0 0 25 15 26 22 27 35 24.5
21 aim.ac.in 235 2805 11.9 45 40 12 12 62 12 36 16 45 2 24.8
22 brainwaretechnologies.org
1056 1075 1.0 31 1 0 0 32 1 16 29 26 52 24.8
23 gnit.ac.in 455 2024 4.4 0 0 0 0 0 128 25 23 48 19 24.9
24 bcetdgp.ac.in 673 549 0.8 0 0 0 0 0 33 18 32 52 28 27.2

22 Mandal & Chkrabarti
VUJLIS, 18-19, 2013-14 ISSN : 0972-8570
25 technoindiagroup.com
124 2825 22.8 14 0 0 0 14 52 44 15 31 25 27.9
26 globsyn.edu.in 95 3286 34.6 74 0 0 0 74 39 48 14 21 27 28.6
27 iias.org.in 344 1183 3.4 0 0 0 0 0 181 32 28 46 14 29.8
28 svist.org 648 180 0.3 228 80 21 0 329 3 19 40 13 45 30.5
29 ibmnce.in 536 273 0.5 123 2 0 0 125 5 23 37 16 42 30.6
30 bbit.edu.in 257 750 2.9 1 0 0 0 1 30 35 30 43 29 32.6
31 skf.edu.in 367 187 0.5 119 1 0 0 120 20 30 38 17 33 33.5
32 pcmt-india.net 358 183 0.5 5 0 0 1 6 175 31 39 33 15 34.3
33 teamfuture.in 404 140 0.3 0 0 0 0 0 67 27 42 50 22 35.4
34 bmcaluniv.org 192 295 1.5 0 0 0 0 0 42 37 35 51 26 36.2
35 hit-haldia.net 336 131 0.4 131 260 8 131 530 726 33 45 12 6 36.6
36 georgecollege.org 158 361 2.3 4 0 0 0 4 4 40 34 34 43 36.9
37 ciemcal.org 22 1795 81.6 71 0 0 0 71 56 54 27 22 24 37.4
38 teamfuture.in 404 140 0.3 0 0 0 0 0 6 28 43 55 41 37.5
39 goenkacollege.net 150 295 2.0 3 0 0 0 3 15 42 36 37 36 38.5
40 rerf.in 577 13 0.0 58 0 0 0 58 0 22 55 23 56 40.3
41 dsmsindia.com 37 639 17.3 0 0 0 0 0 13 53 31 54 38 41.3
42 msitcollege.org 71 166 2.3 0 0 0 0 0 135 50 41 47 18 43.8
43 nsecollege.org 70 104 1.5 13400
2810
74 160 16444 187 51 46 1 13 44.1
44 seacomengineering.org
122 65 0.5 3 0 0 0 3 59 45 48 36 23 45.0
45 dims.ac.in 96 70 0.7 19 1 0 0 20 21 47 47 28 31 45.3
46 bcrec.net.in 79 57 0.7 1170 467 56 227 1920 262 49 50 7 11 45.5
47 iims-intledu.com 131 37 0.3 2 1 0 0 3 14 43 52 38 37 47.0
48 imscal.org 55 138 2.5 2 0 0 0 2 2 52 44 41 47 47.2
49 absacademy.com 97 59 0.6 4 0 0 0 4 0 46 49 35 55 47.4
Webometric Analysis of Management Institutes: A Case Study in West Bengal 23
ISSN : 0972-8570 VUJLIS, 18-19, 2013-14
50 hbs.edu.in 154 14 0.1 2 0 0 0 2 4 41 54 40 44 47.6
51 ibmrcal.org 1 54 54.0 0 0 0 0 0 24 55 51 53 30 51.7
52 stmarystechcampus.org
6 25 4.2 0 0 0 0 0 1 56 53 56 53 54.4
References
1. Amara, Nabil; Réjean Landry (2012).Counting citations in the field of business and management: whyuse Google Scholar rather than the Web of Science. Scientometrics, 93(3), 553-81.
2. Fugl, Liv Danman (2001). Fundamental methodologies and tools for the employment of webometricanalyses. Thesis submitted to The Royal School of Library and Information Science, Denmark.
3. Gaby Haddow and Paul Genoni (2010). Citation analysis and peer ranking of Australian social sciencejournals. Scientometrics, 85(2), 471-87.
4. Goswami, Prashant. Webometric Study of Universities Websites of Uttar Pradesh. MPHIL. Disserta-tion, Vikram University, Ujjain. 2006-07.
5. Hirsch, J E (2005). An index to quantify an individual’s scientific research output. Proceedings of theNational Academy of Sciences 102(46), 1569-72
6. http://business-schools.webometrics.info/ page visited on 2nd October,2013
7. http://business-schools.webometrics.info/en/Methodology.(Visited on 2nd October,2013)
8. http://webometrics.wlv.ac.uk/, (Visited on 7th May,2013).
9. Ingwersen, Peter (2010).The International Visibility and Citation Impact of Scandinavian Research Ar-ticles in Selected Social Science Fields: The Decay of a Myth. Scientometrics, 49(1):39-61
10. Mayr, P and F. Tosques (2005). Google web APIs: An instrument for webometric analysis? (Visitedon:20th January , 2011) from: http://www.ib.huberlin.de/%2007Emayr/arbeiten/ISSI2005_Mayr_Toques.pdf
11. Nederhof, A.J. and E. Van Wijk, (1997). Mapping the social and behavioral sciences world-wide: Use ofmaps in portfolio analysis of national research efforts. Scientometrics,40 (2), 237-74
12. San Rafael, CA: Morgan & Claypool (2009). Synthesis Lectures on Information Concepts, Retrieval,and Services, Vol. 1, No. 1.
13. Thelwall, M. (2009). Introduction to Webometrics: Quantitative Web Research for the Social Sciences.http://webometrics.wlv.ac.uk/, (Visited on 7th May, 2013).
14. Thelwall, M. (2012).Webometrics: The Evolution of a Digital Social Science Research Field. OII Sympo-sium “Social Science and Digital Research: Interdisciplinary Insights”, March 2012. http://podcasts.ox.ac.uk/webometrics-evolution-digital-social-science-research-field-audio (Visited on 7th May,2013).
Measuring Customers Satisfaction in Library and InformationCentre (LIC) in Service Economy-Methods and
Processes – An Approach for DevelopmentS. B. Banerjee*
1 Introduction
Libraries and information centre are social organizations entailing social responsibilities. Librariesare involved with social culture and social economic activities of the society. Its responsibilities tothe society are immense, its involvement with the human development is linked with the develop-ment of the civilization, an achieved state of organized social life. These organized social lives aresequenced with the value of human development in different ages. All libraries impart knowledge.Such a social institution has to be managed with equal care and importance as is done in case ofother social units. Management of libraries is incumbent on the government or parent body orany other funding agencies.
1.1 Library Management and Customers
Management of a library should be reasonably synchronized with the management of a corpo-rate unit with the same methods and managerial practices despite the fact that the libraries doposses some special features which are unlike those of business units. But both of them beingsocial organizations have to depend upon the customers / consumers who directly or indirectlybuy and use the products or services to enjoy its benefits. Customers / consumers being theprime factor measuring the degree or extent of satisfaction have become the cardinal task for itssustenance.
AbstractThis paper intends to describe an integrated view of knowledge economy andservice economy. The role of library service providers to cater the demand ofinformation seekers is also highlighted here. As quality is a key ingredienttowards the measurement of users' satisfaction, different parameters havebeen evolved to measure the quality of the library services. Inconsistenciesin the system of developing manpower have been stressed in this discussion.
*Formerly, Deputy Manager (Information), Hindustan Paper Corporation Ltd, Kolkata - 700016
Measuring Customers Satisfaction in Library and Information Centre (LIC) ... 25
ISSN : 0972-8570 VUJLIS, 18-19, 2013-14
1.2 Library and Knowledge Economy
In these days of multifaceted diversities and knowledge economy, the libraries, whatever may beits type, size and characteristic, feature, have become the most indispensable and key centres toprovide knowledge. More emphatically it can be said that rapid advancement of information andcommunication technology (ICT), keeping pace with the globalization of economy, has broughtabout knowledge. Ideation, innovation, creation, dissemination and use of new knowledge havebecome imperative for, knowledge economy is not confined to the growth of high-tech and ICT,but on the creation of new concepts, new thought, ideas and knowledge.
1.3 Knowledge Economy and Service Economy: An Integrated View
Service economy is an offshoot of knowledge economy. Knowledge economy envisages thestate of a society which embraces all phases of development. Productivity of the knowledgework and that of the knowledge worker are the primary elements of the knowledge economy.OECD views it as a development of the high and medium manufacturing and knowledge inten-sive service industries followed by development of the business / industry, education and health.The transition from manufacturing industry to service industry is also a distinctive step for thesociety’s moving into the service economy. Certain characteristics of service economy wouldclarify the coalescence of the knowledge economy and service economy. Firstly, all servicesoffer expertise to support economic activities. Such expertise may be treated as knowledge andexperience and managerial support, financial avenues, technology etc. Secondly, the fundamen-tal orientation of services means their economic contribution can be measured in relation to thebenefits they bestow. Thirdly, services are small, single unit activities. The service units are ofdifferent nature and grow in different sectors of the economy and finally services are performed.Obviously, qualitative performance of any service is a must. Services are in fact engines andvehicles of growth.
2 Services, Quality, Customer Satisfaction: The Fulcrum for the L&IC
No library can be a service unit without having any user to serve. These users or the customersof the library services indirectly pay the cost of services they consume and also the cost ofmaintenance of the library. The customers use the library services only when it meets their needsand purpose and obviously the question of meeting their satisfaction comes.
2.1 Customers Satisfaction
A customer is satisfied when its précised needs are met. The perception of the customers varies.To understand the customers need, it is imperative to understand their perceived needs. It will berelevant to say that quality, service and satisfaction are interrelated. Services are performed. So,quality of the services is prerequisite for creating data perception of the service. Therefore,

26 Banerjee
VUJLIS, 18-19, 2013-14 ISSN : 0972-8570
providing high quality and superior customer service should be the motto of the library. Again,quality is based on the perception of the customer. Therefore quality should be defined as theperception what a customer perceives.
2.2 Customer’s Mental Process for Perceiving the Quality or the Judging Value
Customers are interested to consume the benefits and the values of the service they receive fromthe library. They make a mental estimate of the worth they would get. No doubt, it is difficult toaccess the intangible benefits a library renders. But despite the difficulties, a library professionalhas to make out or device ways and means to permeate into the customer’s mindset to evaluatethe quality of the services. Relevantly, the cost of poor quality of the service needs to be gauged.Following points may be discussed to this regard.
Cost of Performance
The cost of performing right thing at the right time is associated with the art and expertise of doingthings that error free and will not have to be done again.
Failure Cost
The cost of doing something again or reworking will be damaging the quality of service.
Detection Cost
The cost of detecting or to find quality problems tells badly upon a library’s performance.
Cost of Prevention
Cost of prevention of making bad image of any library needs be seriously thought over. Sinceservice is performance the quality of the services can be ensured only when the library profes-sionals perform their professional activities qualitatively. For this purpose adequate care shouldbe taken to enhance their competency and expertise by way of providing them with continuouseducation primarily for the updatation and up gradation of knowledge.
3 Need for Developing Customer Service System for Measuring Satisfaction
With a view to measuring customer’s satisfaction in libraries, it is essential to evolve a customer’sservice system for which the following parameters need be taken into consideration.
Goal Setting and Library’s Commitments
All the libraries cannot have the same goal even in the case of public libraries notwithstanding theUNECO manifesto for public libraries 1994. The public libraries are to grow in different placesin different socio-economic, political and socio-cultural environment. Being a social organizationit has to meet both expressed and potential need, demand and requirement of the customers ofthe area where it is situated. No library is comprehensive enough to meet all the demands of its
Measuring Customers Satisfaction in Library and Information Centre (LIC) ... 27
ISSN : 0972-8570 VUJLIS, 18-19, 2013-14
customers. It is therefore an utmost requirement of a library to make its customers clearly knownwhat resources it does possess and what services it can exactly extend to its customers.
To have a Clear Understanding Regarding the Customers / Users of the Libraries
Serious attempts should be made to know the customers / consumers of the library services andto understand them totally. These can be ensured by knowing their likes and dislikes of theservices, the library renders. The changes of their interest / need for their pursuit of knowledge,their expectations now and in future, what motivates them to cling to the services of the libraryand what exactly to be done to satisfy them to be gauged. For this purpose some distinctivemethods to be taken into consideration. (1) Survey by questionnaire method. (2) By interviewingthem personally with interview schedule duly prepared or by chit-chatting with them informallyon various issues of the library and by having meeting with them in the libraries at regular frequen-cies, say one’s a week or twice a month on a particular fixed date. This will enable the library tobuild up the resources up to the satisfaction of its customers and to design the service productsaccording to their changing needs.
Standardization of the Quality Performance of the Service
Services are performed and so the quality of performance will ensure satisfaction of the custom-ers / consumers of the services of a library. Quality of service is intangible as it is based on one’sperception. However this intangibility can be transformed to tangibility or visibility by observingthe customer’s dislikes, reluctance in the delay in delivery of the services not making available tohim what exactly he wants, unbecoming communication and in compatible dealing with him etc.
Inconsistencies in the LIS Manpower Development Programs
Superior service and its quality performance are incumbent upon the appropriately developedLIS professionals in the LIS schools most of which give more attention to technical skill, empha-sizing more on digitization and ICT overlooking the utmost need for interpersonal skill, soft skilland communication skill, the most important prerequisites to ensure quality in the performance ofservices in a library. Unfortunately the Continuing Education Programmes (CEP) also do not giveimportance to this regard. Hence it has become imperative for any library to import, immediatelyafter appointment, both induction and orientation training emphasizing more on the interpersonalskill, soft skill, communication skill, in the same manner as any Finishing School does.
The Need for Invocation of Reward System for Quality Service
Recalling Abraham Maslow’s hierarchy of human needs “Social” and “Esteem / Ego” needsshould be taken into consideration and accomplishment of quality performance of the libraryservices be rewarded financially and / or by conferring Memento / Certificate of Honor / Appre-ciation etc. we should not overlook the fact that the human psychology is always keen to receive

28 Banerjee
VUJLIS, 18-19, 2013-14 ISSN : 0972-8570
affection, love, regards and respects. No human being perhaps is prepared to sacrifice his selfprestige. So the library professionals should be made to till that they are valuables to the libraries.Similarly, identified highly satisfied customers also should be rewarded and publicized for generalinformation.
Going in for Continuous Improvement Programme
The quality of any service / performance cannot remain static / fixed for all time to come. Itschange is absolute and perennial. Keeping these in view the task is to indulge in the programmeof activities to detect the lapses and short comings of the library. All out attempts should be madeto improve the library services continuously by doing away with its lapses and short comings.
Customers Complaints and its Management
Complaints are the most important instruments to measure the customer’s satisfaction in libraryand in any organization. In reality, most of the customers in library particularly, although may havegrievances, do not feel like expressing it in writing which creates retardation in the library perfor-mance. Most of the consumers may hesitate to disclose their names as complainants or perhapsdo not find essay language to complain. It will be better therefore to design a “Complaint form”which should include all possible grievances a library customer may have, with clearly statedanswer “Yes / No” to help the customers to tick mark. Besides the management of complaints, a“Feedback” form may also be designed and used. A sample of such form is shown below:
Name of the LibraryWe are interested to know your opinion regarding the services we render to you. Please by putting the number in the blank space before each statement below express your opinion. 1 2 3 4 5 Never Once Half the time Often Very Often
------------- 1) Telephone is answered by the third ring.------------- 2) The person answering the telephone is courteous.------------- 3) The library is conveniently located, easy to reach.------------- 4) The ambiance of the library is warm and inviting.------------- 5) The library hours are convenient to me.------------- 6) The library staff greets me immediately.Many other relevant statements, suitable to library may be added.
4 Conclusion
Transformation of the economy, from the archaic to globalised, has been first making a compel-ling situation for frequent use of libraries whatever may be its types, sizes and characteristics. Thechased situation has also been forcing the libraries to induct new technologies, new methods and

Measuring Customers Satisfaction in Library and Information Centre (LIC) ... 29
ISSN : 0972-8570 VUJLIS, 18-19, 2013-14
process. Fortunately or unfortunately these methods and process are technology oriented inother words technologies have outweighed the human approaches and efforts to improve theservices singularly. For organization, manipulation and monitoring the library resources and forretrieval of services technology is essential; but more essential is the human approaches, efforts,attitudes and longs for extending the services to the best satisfaction of the library customers. Thetime is now adequately appropriate for taking care for the customers of the library services. TheLIS courses should also be reviewed and re-designed accordingly.

Collection of Vidyasagar University Central Library:A Bibliometric Study
Pijush Kanti Jana*Debabrata Maity**
* Professor , Dept of Library and Information Science, Vidyasagar University** Librarian, Mohisda R N High School, Keshpur, Paschim Medinipur
AbstractImplementation of sampling procedure and selection of random samplingtechnique are the key concepts in this study. Systematic sampling method hasbeen followed for the collection of data with a sample size of 1000 books inVidyasagar University Central Library. This paper shows different aspects ofbooks eg., distribution of library collection by their subjects, price, year ofpublication, edition, language, country of publication, authorship pattern etc.Analysis of average cost of books in different subject fields and average costper page of a book in different page limits are also another feature of thisstudy.
1 Introduction
The Vidyasagar University started its academic activities in the year 1985 with just 6 post gradu-ate departments but now it has 27 postgraduate departments with other diploma courses. In themonth of July, 1996 the Central Library, Vidyasagar University started its functioning from theAdministrative Building officially. From the beginning of the establishment of the library it hasbeen suffering from both staff and funds. Still during the last three decades its performance isquite satisfactory in all respect. Therefore, about after 30 years of its journey it needs to knowthe nature of its collection development. But it is not easy to find out the nature of its collectionwhen its total stock exceeds one lac. Therefore, a moderate sample size has been chosen irre-spective of analysis the whole collection. Again, a systematic sampling technique has been fol-lowed for selection of books in the sample.
2 Objectives
The objectives of this study are to find out nature and characteristics of books collected inVidyasagar University Central Library and particularly with a view to examine the followingaspects:

Collection of Vidyasagar University Central Library: A Bibliometric Study 31
ISSN : 0972-8570 VUJLIS, 18-19, 2013-14
1) To find out subject-wise distribution of books.
2) To see language-wise distribution of books.
3) To know country-wise publication of books.
4) To observe authorship pattern of the collection.
5) To find out subject-wise average price and average pages per book.
6) To help the authority to take decision for selection of books.
7) To help the authority to take decision for allocation of funds.
3 Methodology
At present there are 1,02,048 books in the Central Library, Vidyasagar University. To fulfill theobjectives of the study, it is not possible to study all books in the collection. Therefore, a randomsampling method has been adopted for collection of books. Here, at the first stage, a sample sizeof 1000 books has been chosen for collection of data. In this case, as a complete list of thebooks from which sample is to be drawn is available, so the systematic sampling for collection ofdata is selected. A systematic sampling is formed by selecting one unit at random and then select-ing additional units at evenly- spaced intervals until the sample has been formed. The first item isselected at random generally by following the lottery method. Subsequent items are selected bytaking every k-th item from the list where ‘k’ refers to the sampling interval or sampling ratio i.e.,the ratio of population size to the size of the sample. Symbolically,
K = (N/n) Where, K = Sampling interval,
N= size of the universe,
n= sample size.
The universe size of this study is first 100000 books in the library and the sample size is 1000books. So, value of K is (100000/1000) = 100. The first book (i.e., first sample unit) has beenselected from the first hundred books by lottery method and the accession number of that bookis 82.Then the sampling interval 100 has been added to each sample unit to get the accessionnumber of the book of the next sample until to form the sample. Hence, the accession number ofthe books of the sample units are 82, 182, 282, 382 . . . 99982.
Again, to collect necessary information from the sample units, following steps have been fol-lowed:
Required information has been collected directly from Online Public Access Catalogue(OPAC) of the Central Library, Vidyasagar University. Sometimes to collect data Acces-sion Register of the organization has also been consulted and in few cases relevant informa-tion has also been collected directly from books.
32 Jana & Maity
VUJLIS, 18-19, 2013-14 ISSN : 0972-8570
As initial page numbers of many books are not available in OPAC, so this study is basedonly on the textual pages of the books.
The data so collected are systematically arranged in various tables and which are subse-quently analyzed.
First emphasis is to classify the books according to the department existed in VidyasagarUniversity. Then some other important subjects are also selected separately.
Diagrammatic representation has also been made in many cases for better presentation ofdata.
Recommendation and conclusions have been made on the basis of analysis of the data.
4 Analysis of Data
The data collected through systematic sampling are systematically arranged in different tablesand those tables are then analyzed to fulfill the objectives of this study.
4.1 Subject-wise Distribution of Books
The books collected through systematic sampling are basically grouped into subjects associatedwith different departments. However, books are also grouped into subjects like Research Meth-odology, Operations Research or Computer which are generalia in nature. Some books are alsogrouped into other category which includes books on Bibliography, General Dictionary, GeneralEncyclopedia, Theory of Natural Sciences, Medical Science, Agriculture, Arts, Philosophy &Theory of Literature, Germanic Literature, Greek Literature, Assamese Literature, Marathi Lit-erature, Biography etc. Due to very nature of the subjects associated with each department it ishard enough to isolate books on each Department rather it is better to group the collection ondifferent subjects. In many cases book on a subject does not represent the book on that depart-ment.
Collection of Vidyasagar University Central Library: A Bibliometric Study 33
ISSN : 0972-8570 VUJLIS, 18-19, 2013-14
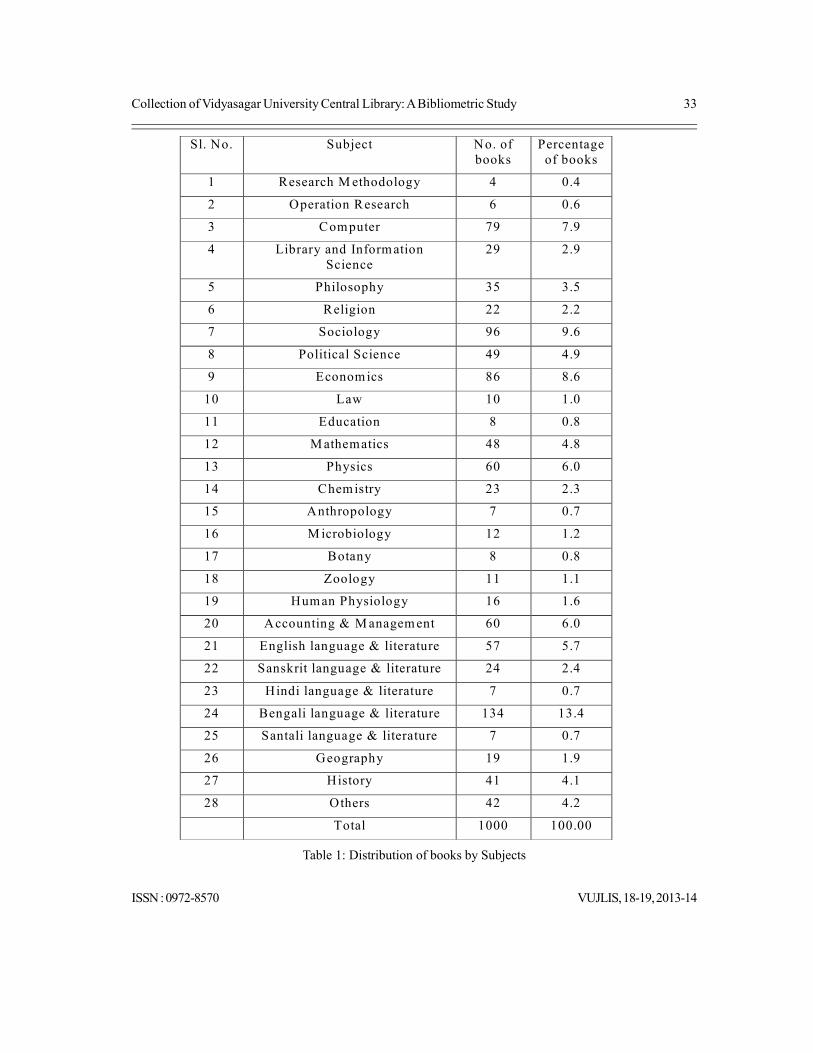
Sl. No. Subject No. of books
Percentage of books
1 Research M ethodology 4 0.4
2 Operation Research 6 0.6
3 Computer 79 7.9
4 Library and Information Science
29 2.9
5 Philosophy 35 3.5
6 Religion 22 2.2
7 Sociology 96 9.6
8 Political Science 49 4.9
9 Economics 86 8.6
10 Law 10 1.0
11 Education 8 0.8
12 M athematics 48 4.8
13 Physics 60 6.0
14 Chemistry 23 2.3
15 Anthropology 7 0.7
16 M icrobiology 12 1.2
17 Botany 8 0.8
18 Zoology 11 1.1
19 Human Physiology 16 1.6
20 Accounting & M anagem ent 60 6.0
21 English language & literature 57 5.7
22 Sanskrit language & literature 24 2.4
23 Hindi language & literature 7 0.7
24 Bengali language & literature 134 13.4
25 Santali language & literature 7 0.7
26 Geography 19 1.9
27 History 41 4.1
28 Others 42 4.2
Total 1000 100.00
Table 1: Distribution of books by Subjects
34 Jana & Maity
VUJLIS, 18-19, 2013-14 ISSN : 0972-8570
It is evident from Table- 1 that the library has a giant collection of books on Bengali Languageand Literature (13.4%). Collection of books on Sociology (9.6%), Economics (8.6%) and Com-puter (7.9%) are also remarkable. Good collection of books are also found on Physics (6.0%),Accounting & Management (6.0%), English Language and Literature (5.7%), Political Science(4.9%), Mathematics (4.8%) and History (4.1%). General collection (4.2%) in the library is alsosatisfied.
4.2 Distribution of Books According to their Price and on Broad Classes
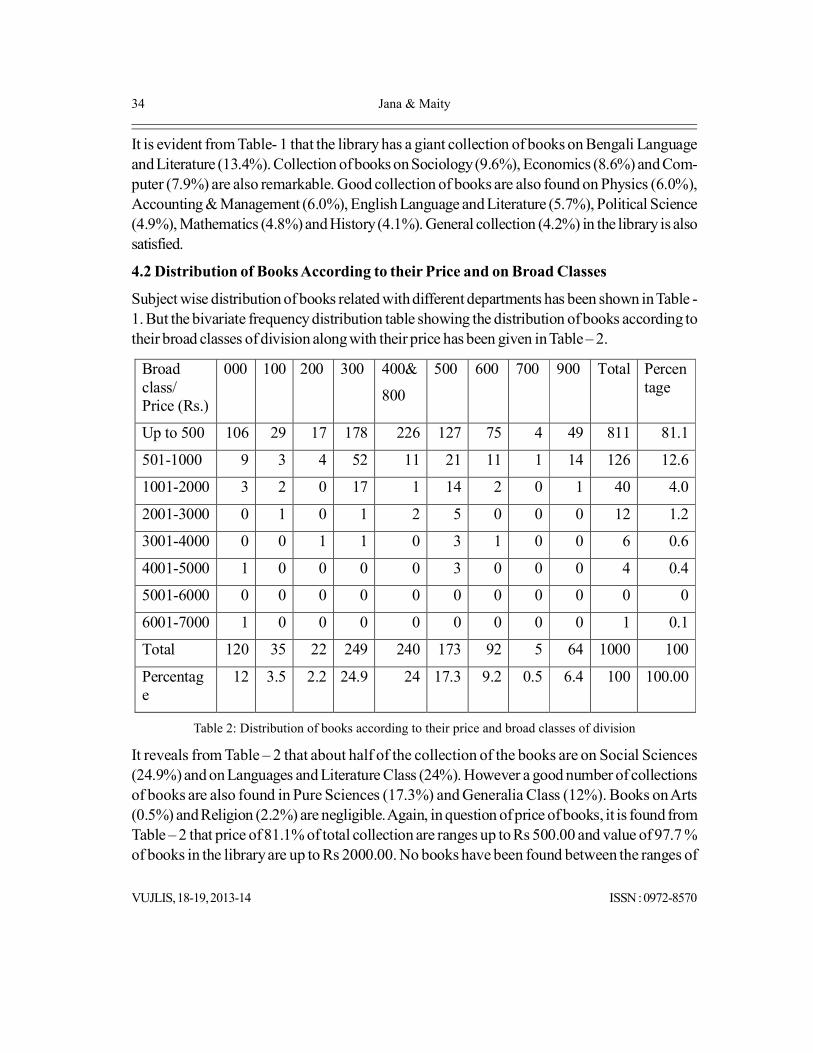
Subject wise distribution of books related with different departments has been shown in Table -1. But the bivariate frequency distribution table showing the distribution of books according totheir broad classes of division along with their price has been given in Table – 2.
Broad class/ Price (Rs.)
000 100 200 300 400&
800
500 600 700 900 Total Percentage
Up to 500 106 29 17 178 226 127 75 4 49 811 81.1
501-1000 9 3 4 52 11 21 11 1 14 126 12.6
1001-2000 3 2 0 17 1 14 2 0 1 40 4.0
2001-3000 0 1 0 1 2 5 0 0 0 12 1.2
3001-4000 0 0 1 1 0 3 1 0 0 6 0.6
4001-5000 1 0 0 0 0 3 0 0 0 4 0.4
5001-6000 0 0 0 0 0 0 0 0 0 0 0
6001-7000 1 0 0 0 0 0 0 0 0 1 0.1
Total 120 35 22 249 240 173 92 5 64 1000 100
Percentage
12 3.5 2.2 24.9 24 17.3 9.2 0.5 6.4 100 100.00
Table 2: Distribution of books according to their price and broad classes of division
It reveals from Table – 2 that about half of the collection of the books are on Social Sciences(24.9%) and on Languages and Literature Class (24%). However a good number of collectionsof books are also found in Pure Sciences (17.3%) and Generalia Class (12%). Books on Arts(0.5%) and Religion (2.2%) are negligible. Again, in question of price of books, it is found fromTable – 2 that price of 81.1% of total collection are ranges up to Rs 500.00 and value of 97.7 %of books in the library are up to Rs 2000.00. No books have been found between the ranges of

Collection of Vidyasagar University Central Library: A Bibliometric Study 35
ISSN : 0972-8570 VUJLIS, 18-19, 2013-14
Rs 5001 – 6000 and there is only 1 (0.1%) book is found between the ranges of Rs 6001 –7000.
4.3 Publication Year and Distribution of Books
The first book was accessioned in the Accession Register of the Central Library, VidyasagarUniversity on 10.09.1986. Therefore, books are grouped into those which are published beforethe year 1986 ie, up to the year 1985 and then in different years. The last publication year i.e.,2012 has been chosen as the last book of the population has been published in that year. Again,from the study it is found that there is only one book which has been published in the year 1903and there is another book which has been published in the year 1949. So, there are 176 (17.6%)books which have been published during the years 1950 to 1985.
Sl. No. Year No. of books Percentage of books
1 Up to 1985 178 17.8
2 1986 47 4.7
3 1987 45 4.5
4 1988 44 4.4
5 1989 34 3.4
6 1990 28 2.8
7 1991 17 1.7
8 1992 11 1.1
9 1993 20 2.0
10 1994 36 3.6
11 1995 37 3.7
12 1996 38 3.8
13 1997 45 4.5
14 1998 29 2.9
15 1999 17 1.7
16 2000 32 3.2
17 2001 32 3.2
18 2002 25 2.5
19 2003 24 2.4

36 Jana & Maity
VUJLIS, 18-19, 2013-14 ISSN : 0972-8570
19 2003 24 2.4
20 2004 28 2.8
21 2005 29 2.9
22 2006 27 2.7
23 2007 37 3.7
24 2008 39 3.9
25 2009 47 4.7
26 2010 23 2.3
27 2011 12 1.2
28 2012 17 1.7
29 Not available 2 0.2
Total 1000 100.00
Table 3: Publication of books according to their year of publication
Table – 3 shows that pattern of publication year of books are decrease gradually considering theintroduce of different new departments year after year and which is due to purchase of lessbooks or of purchasing books which are published earlier. However, the study shows that thecollection of books published in the years 1991, 1992, 1999, 2011 and 2012 are decreaseremarkably.
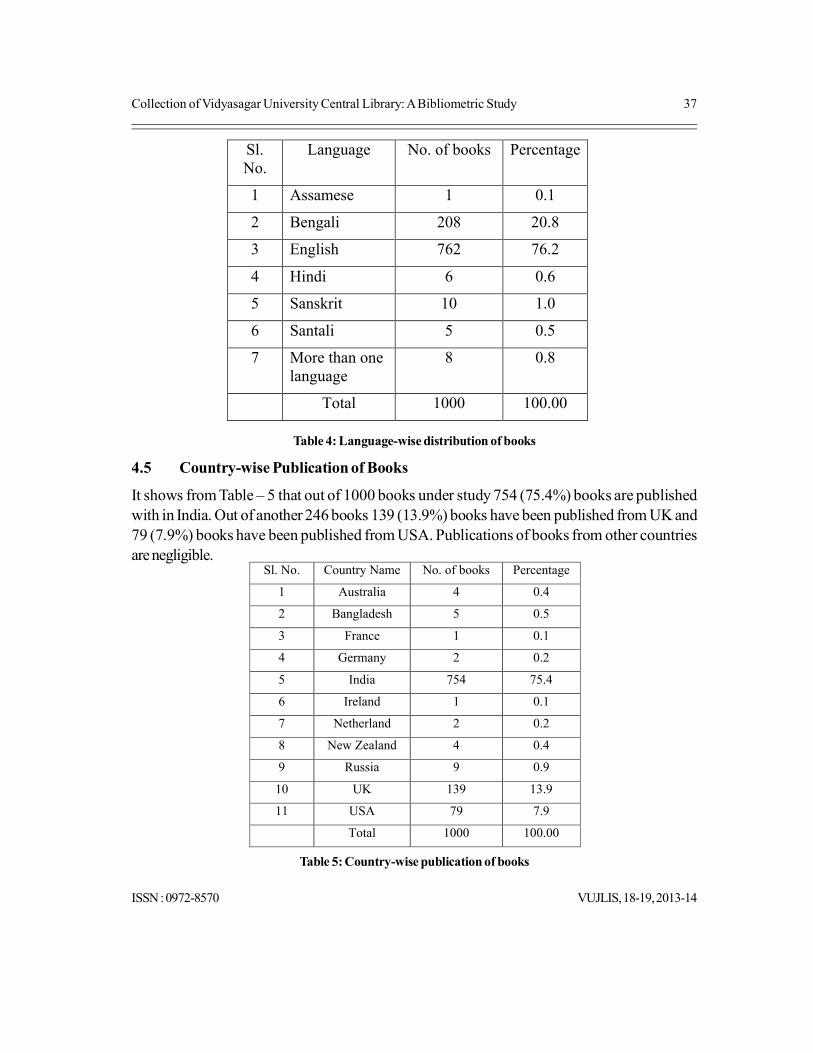
4.4 Language-wise Distribution of Books
It is evident from Table – 4 that the books available in the library are written mainly in six lan-guages. It also revels from the Table that more than three- fourth (76.2%) of the collection arewritten in English language and 20.8% of the collections are in Bengali language. Collections ofbooks in other languages are miserable. It is interesting to say that 0.8% books are written inmore than one language and which is due to explanation of the text in some other languages.
Collection of Vidyasagar University Central Library: A Bibliometric Study 37
ISSN : 0972-8570 VUJLIS, 18-19, 2013-14
Sl. No.
Language No. of books Percentage
1 Assamese 1 0.1
2 Bengali 208 20.8
3 English 762 76.2
4 Hindi 6 0.6
5 Sanskrit 10 1.0
6 Santali 5 0.5
7 More than one language
8 0.8
Total 1000 100.00
Table 4: Language-wise distribution of books
4.5 Country-wise Publication of Books
It shows from Table – 5 that out of 1000 books under study 754 (75.4%) books are publishedwith in India. Out of another 246 books 139 (13.9%) books have been published from UK and79 (7.9%) books have been published from USA. Publications of books from other countriesare negligible.
Table 5: Country-wise publication of books
Sl. No. Country Name No. of books Percentage
1 Australia 4 0.4
2 Bangladesh 5 0.5
3 France 1 0.1
4 Germany 2 0.2
5 India 754 75.4
6 Ireland 1 0.1
7 Netherland 2 0.2
8 New Zealand 4 0.4
9 Russia 9 0.9
10 UK 139 13.9
11 USA 79 7.9
Total 1000 100.00

38 Jana & Maity
VUJLIS, 18-19, 2013-14 ISSN : 0972-8570
4.6 State -wise Publication of Books
It reveals from the study that out of 1000 books selected for the study 754 (75.4%) books werepublished in India and 246 (24.6%) were published outside India. State wise publication ofthose 754 books has been given in Table – 6.
Table 6: State -wise publication of books
The Table shows that out of 754 books 418 (55.44%) books were published from Delhi, 266(35.28%) books were published from West Bengal. Except the states of Andhra Pradesh,Maharashtra, Rajasthan and Uttar Pradesh publication from other states were miserable.
4.7 Authorship Pattern of Books
It reveals from the Table – 7 that out of 1000 books under study 673 (67.3%) books have beenpublished by single author, 179 (17.9%) books have been published by two authors, 41 (4.1%)books have been published by three authors. Books published by more than three authors arenegligible.
Sl. No. State Name No. of books Percentage
1 Andhra Pradesh 14 1.86
2 Delhi 418 55.44
3 Gujarat 2 0.26
4 Karnataka 4 0.53
5 Madhya Pradesh 1 0.13
6 Maharashtra 16 2.12
7 Pondicherry 1 0.13
8 Rajasthan 10 1.33
9 Tamilnadu 4 0.53
10 Uttar Pradesh 18 2.39
11 West Bengal 266 35.28
Total 754 100.00

Collection of Vidyasagar University Central Library: A Bibliometric Study 39
ISSN : 0972-8570 VUJLIS, 18-19, 2013-14
Sl. No. Authorship No. of book(s) Percentage
1 1 author 673 67.3
2 2 authors 179 17.9
3 3 authors 41 4.1
4 4 authors 5 0.5
5 5 authors 2 0.2
6 6 authors 3 0.3
7 7 authors 1 0.1
8 10 authors 1 0.1
9 1 editor 52 5.2
10 2 editors 24 2.4
11 3 editors 3 0.3
12 Corporate
Body
13 1.3
13 Government
Publication
3 0.3
Total 1000 100.00
Table 7: Authorship pattern of books
Again, in question of editorial publication 52 (5.2%) books have been published by single editor,24 (2.4%) books have been published by two editors and only 3 (0.3%) books have beenpublished by three editors. Books published by corporate body and government publication are13(1.3%) and 3 (0.3%) respectively.
4.8 Distribution of Books by their Edition
Time to time new edition of books should be added to the collection to cope up with develop-ment of any subject field. From this study it shows that edition of books are distributed fromedition 1 to edition 16. Table – 8 depicts that there are 788 (78.8%) books in the library with itsfirst edition, books in the library with its 2nd edition are 88 (8.8%), 3rd edition are 51 (5.1%), 4th
edition are 21 (2.1%) and so on. Books having its edition from 7 and onwards are miserable.

40 Jana & Maity
VUJLIS, 18-19, 2013-14 ISSN : 0972-8570
Sl. No. Edition No. of books Percentage
1 1 788 78.8
2 2 88 8.8
3 3 51 5.1
4 4 21 2.1
5 5 15 1.5
6 6 14 1.4
7 7 7 0.7
8 8 5 0.5
9 9 2 0.2
10 10 1 0.1
11 11 3 0.3
12 12 1 0.1
13 14 1 0.1
14 15 1 0.1
15 16 1 0.1
16 23 1 0.1
Total 1000 100.00
Table 8: Distribution of books by their edition
4.91 Subject-wise Average Price of Books
Average price of books based on different subjects are depicted in Table – 91. It reveals fromthe Table that average cost of books is highest for the books on the subject Microbiology andwhich is Rs. 1537.34 per book. The next positions are goes in favour of the subjects Anthropol-ogy, Chemistry, Zoology and Human Physiology with average price of books of Rs 876.43, Rs869.34, Rs 705.71 and Rs 550.43 respectively.

Collection of Vidyasagar University Central Library: A Bibliometric Study 41
ISSN : 0972-8570 VUJLIS, 18-19, 2013-14
Table 91: Subject-wise average price of books
Sl. No. Subject No. of books Average price/book
1 Research M ethodology 4 210
2 Operation Research 6 195.04
3 Computer 79 347.20
4 Library and Information Science 29 494.14
5 Philosophy 35 394.70
6 Religion 22 423.63
7 Sociology 96 392.99
8 Political Science 49 364.88
9 Economics 86 409.26
10 Law 10 465.70
11 Education 8 371.24
12 M athematics 48 364.21
13 Physics 60 425.395
14 Chemistry 23 869.34
15 Anthropology 7 876.43
16 Microbiology 12 1537.34
17 Botany 8 393.25
18 Zoology 11 705.71
19 Human Physiology 16 550.43
20 Accounting & M anagem ent 60 343.82
21 English language & literature 57 286.33
22 Sanskrit language & literature 24 157.38
23 Hindi language & literature 7 236.43
24 Bengali language & literature 134 71.76
25 Santali language & literature 7 71.43
26 Geography 19 411.92
27 History 41 309.70
28 Others 42 347.25
Total 1000

42 Jana & Maity
VUJLIS, 18-19, 2013-14 ISSN : 0972-8570
Average price of books on the subjects Physics, Law, Library and Information Science, Eco-nomics, Geography, Religion are ranges from Rs 400 – 500. Again, average price of the bookson Computer, Philosophy, Sociology, Political Science, Education, Mathematics, Botany andAccounting & Management and History are ranges from Rs 300 – 400. The Table also revealsthat average price of books on Bengali and Santali Language and Literature is less than Rs100.00 and which are only about Rs 71.
4.92 Distribution of Books in their Price and Pages
Average price of a book in relation to its page number has been presented in Table – 92. Itshows that out of 1000 books a maximum of 230 books belong to pages 200 – 300, 181 bookswithin pages 100 – 200, 150 books within 300 – 400 pages. Again, the Table shows that 683(68.3%) books belong to pages within 100 to 500.
Table 92: Page-wise distribution of books
Sl. No. No. of pages No. of books
Average price
per book (Rs.)
Average price/ pages of a book
1 Up-to 100 73 41.72 00.83
2 100-200 181 162.10 01.08
3 200-300 230 320.58 01.28
4 300-400 150 458.55 01.31
5 400-500 122 467.95 01.04
6 500-600 82 436.10 00.79
7 600-700 60 502.00 00.77
8 700-800 34 471.83 00.63
9 800-900 28 556.86 00.66
10 900-1000 16 757.19 00.80
11 1000-1100 9 418.93 00.40
12 1100-1200 5 1266.504 01.10
13 1200-1300 3 2566.67 02.05
14 1300-1400 5 607.00 00.50
15 1400 & above 2 1884.70 --

Collection of Vidyasagar University Central Library: A Bibliometric Study 43
ISSN : 0972-8570 VUJLIS, 18-19, 2013-14
It is found from the Table that there is a positive tendency of price of a book as the pages perbook increases. Though in case of range of pages of books within 1300- 1400, the price perbook is significantly low perhaps due to sampling error. Average price per pages of a book hasalso been calculated based on the mid-value of the number of pages of books. The Table alsoshows that except in some cases there is a decreasing tendency of price per page of a book upto a certain range of 700 – 800 pages, while it again increases.
5 Findings and Conclusions
Data collected through systematic sampling are systematically arranged in tables and are alsoanalysed in suitable form. However the major findings of the study are as follows:
i) Collection of books on Bengali Language and Literature in the library is more than any othersubjects. Books on the subjects Computer, Sociology, Economics and Physics are also re-markable but those books are not associated with any individual department. Though bookson the subject Anthropology should not be so separated from those of the subjects on bio-logical sciences still its collection is remarkably poor considering the initiation of the Depart-ment in the university.
ii) Cost of books on social sciences, language and literature class are less as compared to otherclasses and their collection is about half of the collection in the library.
iii) Cost of more than 80% of the books in the library is less than or equal to Rs 500.00 and costof about 98% books in the library are within Rs 2000.00.
iv) Except in certain cases books in the collection are evenly distributed in their year of publica-tion.
v) Considering the type of the library language wise distribution of books is justified becauseabout three- fourth books in the collection are in English language and about 21% books arein mother language.
vi) Ratio of collected books published within India and abroad is about 3: 1 and which is quitesatisfactory.
vii) More than 50% of Indian books are published from Delhi where its share in the state of WestBengal is about 36%.
viii) In question of authorship only 10% of the total collection are goes in favour of editorial andother corporate body publication where 67.3% of the total collection is published by singleauthor.
ix) About 79% books in the library are in first edition and 8.8% books are in second edition.Number of books in other editions are gradually decrease.
x) Except in certain cases the price per book in the collection has increased due to increase in

44 Jana & Maity
VUJLIS, 18-19, 2013-14 ISSN : 0972-8570
the number of pages per book. However, average price per page of a book is decreased dueto increase in the number of pages per book to a certain limit when it is increased again.
References
1 http://vidyasagar.edu.in/opac. Visited on 1st July, 2013.
2 Das, N .G. 2009. Statistical Methods. New Delhi: Tata McGraw Hill. 449p.
3 Jana, Pijush Kanti and Basak, Arup Kumar. Collection Development of Vidyasagar Uni-versity Central Library: 1986 – 2006. Vidyasagar University Journal of Library andInformation Science. 10-14; 2009; 58 – 68.

An analytical study of Biotechnology Open AccessJournals archived in DOAJ
S Banerjee*B Chakraborti**
*Library In-charge, NIELIT, Kolkata** Professor, DLIS, University of Calcutta
AbstractAn analytical study of 57 Biotechnology Open Access Journals is presentedin this article. All these journals are archived in Directory of Open AccessJournals (DOAJ). The analytical study was done based on the parameters likeCountry, Language, Keyword, Archiving year in DOAJ. It was also checkedthat whether there is any publication cost or not for Open Access Journals.
1 Introduction
Information is an essential component for academic environment. One researcher mainly gets theprimary information on his research area from a Journal. The huge cost of printed as well as e-journals force libraries to cut off their number of Journal subscription. So it is difficult for aresearch scholar to access the required information from a journal. Open Access Journals help alot in this regard.
Budapest Open Access initiative (2012) defines the Open Access Journal as ‘free availability onthe public internet, permitting any user to read, download, copy, distribute, print, search or linkto the full text of these articles, crawl them for indexing, pass them as data to software, or usethem for any other lawful purpose, without financial, legal or technical barriers other than thoseinseparable from gaining access to the Internet itself.’ DOAJ (2014) defines open access jour-nals as ‘journals that use a funding model that does not charge readers or their institutions foraccess.’
Open access journals are not only significant sources of information but also help to prevent theduplication of work. These provide universal access to the original ideas and research findings(Bansal & Singh, 2013).
The application of Biotechnological techniques to human affairs makes it the most important of all
46 Banerjee & Chakraborti
VUJLIS, 18-19, 2013-14 ISSN : 0972-8570
recently developed fields of Science. The application is ever expanding because biotech activi-ties are highly vulnerable for commercialization. Biotechnology has affected all the major do-mains of human activity and welfare ranging from agriculture to medicine and environment (Banerjee& Chakraborty, 2013). A lot of research is happening in various divisions of Biotechnology. Thiswork attempts to analyze open access journals on Biotechnology. Lihitkar and Lihitkar’s (2013)article’s framework has been followed partially to make this work.
2 Directory of Open Access Journal (DOAJ)
Directory of Open Access Journal, widely known as DOAJ is an online directory that providesaccess to quality open access, peer-reviewed journals. The aim of the DOAJ is to increase thevisibility and ease of use of open access scientific and scholarly journals, thereby promoting theirincreased usage and impact. The DOAJ aims to be comprehensive and cover all open accessscientific and scholarly journals that use a quality control system to guarantee the content. Inshort, the DOAJ aims to be the one-stop shop for users of open access journals. As on 22nd July2014, 9912 Open Access Journals on different subjects were archived in DOAJ.
3 Objectives of the Work
To assess the country wise contribution of Biotechnology Open Access Journals;
To assess the language wise contribution of Biotechnology Open Access Journals;
To assess keyword distribution of Biotechnology Open Access Journals;
To assess year wise contribution of Biotechnology Open Access Journals; and
To know any publication cost for Biotechnology Open Access Journals.
4 Scope and Methodology
The study is restricted on those journals that are archived in DOAJ only. The directory wasbrowsed to get study related data. Then the homepage of all journals were browsed to get detailinformation. The data was tabulated and analyzed to get the findings. A percentage calculationwas also done in some cases.
5 Analysis and Interpretation
An advanced search was done in DOAJ using the term ‘Biotechnology’ as subject. The resultshows there are 57 Open Access Journals on this subject.
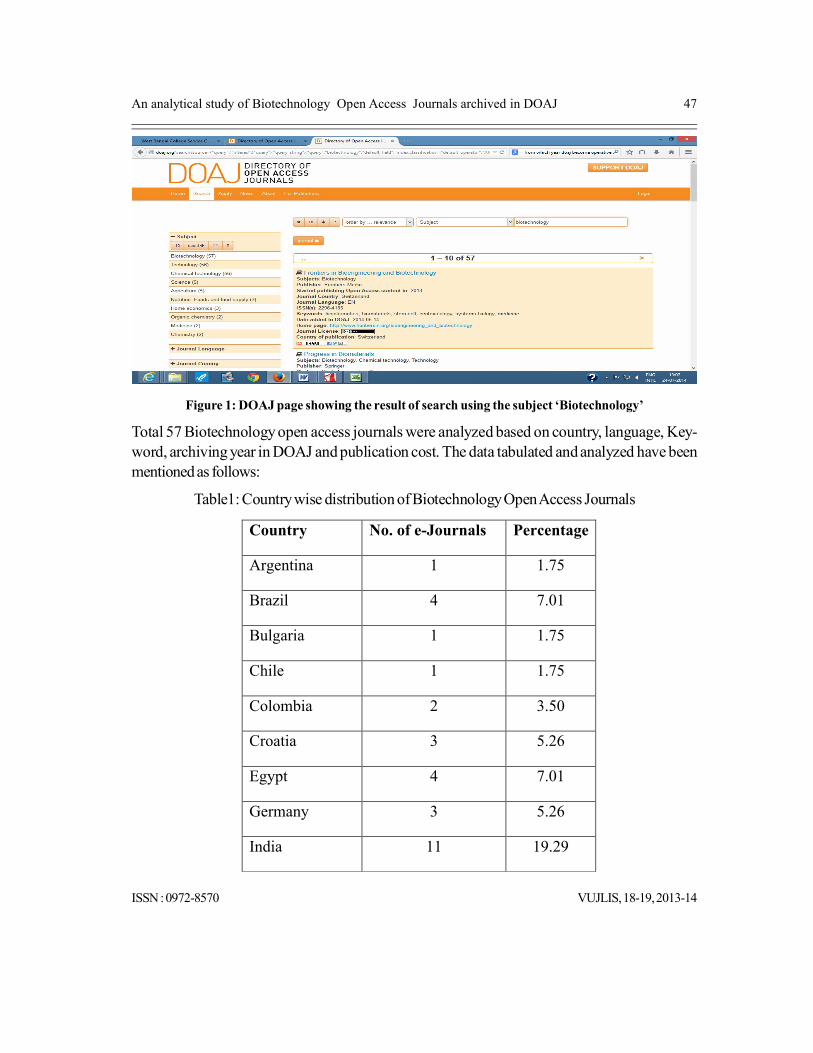
An analytical study of Biotechnology Open Access Journals archived in DOAJ 47
ISSN : 0972-8570 VUJLIS, 18-19, 2013-14
Figure 1: DOAJ page showing the result of search using the subject ‘Biotechnology’
Total 57 Biotechnology open access journals were analyzed based on country, language, Key-word, archiving year in DOAJ and publication cost. The data tabulated and analyzed have beenmentioned as follows:
Table1: Country wise distribution of Biotechnology Open Access Journals
Country No. of e-Journals Percentage
Argentina 1 1.75
Brazil 4 7.01
Bulgaria 1 1.75
Chile 1 1.75
Colombia 2 3.50
Croatia 3 5.26
Egypt 4 7.01
Germany 3 5.26
India 11 19.29
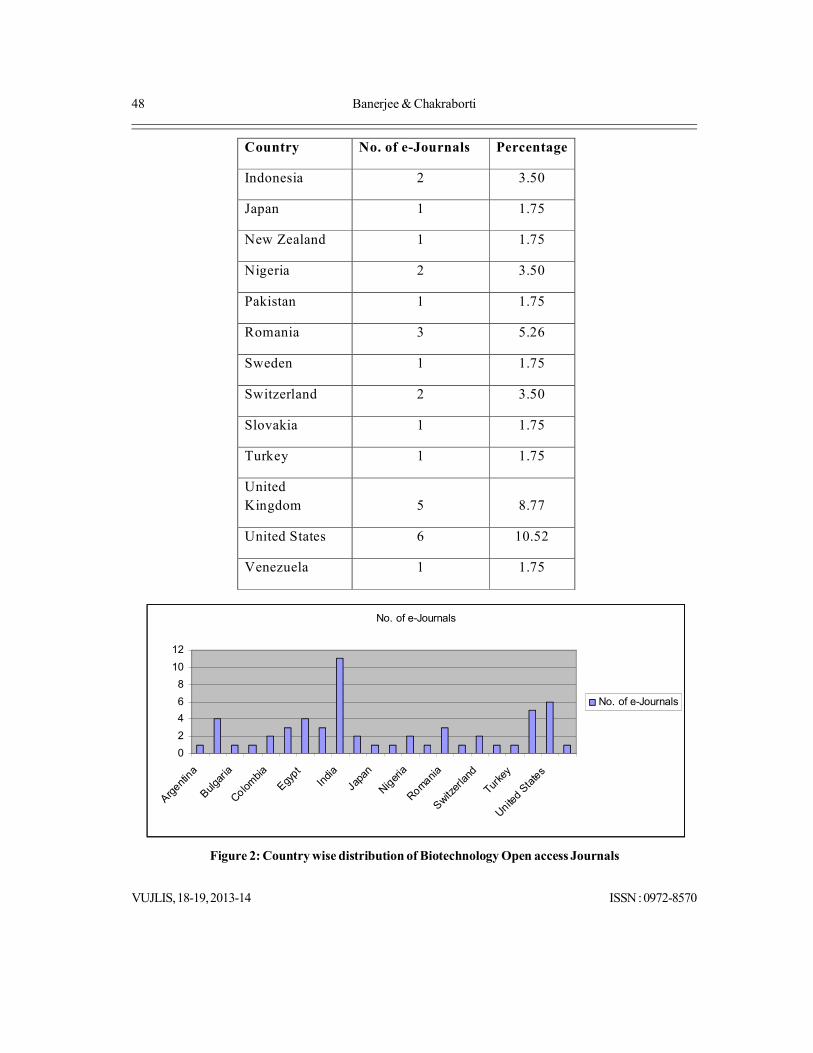
48 Banerjee & Chakraborti
VUJLIS, 18-19, 2013-14 ISSN : 0972-8570
Country No. of e-Journals Percentage
Indonesia 2 3.50
Japan 1 1.75
New Zealand 1 1.75
Nigeria 2 3.50
Pakistan 1 1.75
Romania 3 5.26
Sweden 1 1.75
Switzerland 2 3.50
Slovakia 1 1.75
Turkey 1 1.75
United Kingdom 5 8.77
United States 6 10.52
Venezuela 1 1.75
No. of e-Journals
0
2
4
6
8
10
12
Argenti
na
Bulgar
ia
Colombia
Egypt
India
Japa
n
Niger
ia
Romania
Switzer
land
Turke
y
United S
tate
s
No. of e-Journals
Figure 2: Country wise distribution of Biotechnology Open access Journals

An analytical study of Biotechnology Open Access Journals archived in DOAJ 49
ISSN : 0972-8570 VUJLIS, 18-19, 2013-14
Table 1 and Figure 2 depict the Country wise distribution of Biotechnology Open access Jour-nals. India got the first rank publishing 11 Open Access Journals, followed by USA and UKpublishing 6 and 5 Journals. India holds 19.29% part of total Biotechnology Open Access Jour-nals.
Table 2: Language wise distribution of Biotechnology Open Access Journals
NB. Numbers of total Journals exceed 57 because few Journals published in more than onelanguage.
Figure 3: Language wise distribution of Biotechnology Open Access Journals
Language No of e-Journals Percentage
Chinese 2 3.5
Croatian 2 3.5
English 50 87.71
Indonesian 1 1.75
Spanish 5 8.77
Portuguese 4 7.01
Turkish 1 1.75
0102030405060708090
100
Chine
se
Croat
ian
Englis
h
Indo
nesia
n
Spanis
h
Portu
gese
Turkis
h
No of e-Journals
Percentage

50 Banerjee & Chakraborti
VUJLIS, 18-19, 2013-14 ISSN : 0972-8570
Table 2 and Figure 3 depict the language wise distribution of Biotechnology Open Access Jour-nals. 87.17% journals published in English. Spanish and Portuguese got the second and thirdposition publishing 8.77% and 7.01%.
Table 3: Keyword distribution of Biotechnology Open Access Journals
Keywords No. of Journals
Agricultural Biotechnology 4
Animal Science 2
Biochemistry 10
Bioethics 1
Bioinformatics 5
Biological Science 5
Biomedicine 11
Biotechnology 19
Cancer 1
Environmental Science 6
Food Biotechnology 6
Genetics 10
Industrial Biotechnology 3
Microbiology 1
Nano Biotechnology 3
Plant Science 3
NB. Numbers of total Journals exceed 57 because most of the Journals publish articles relatingmore than one keyword.
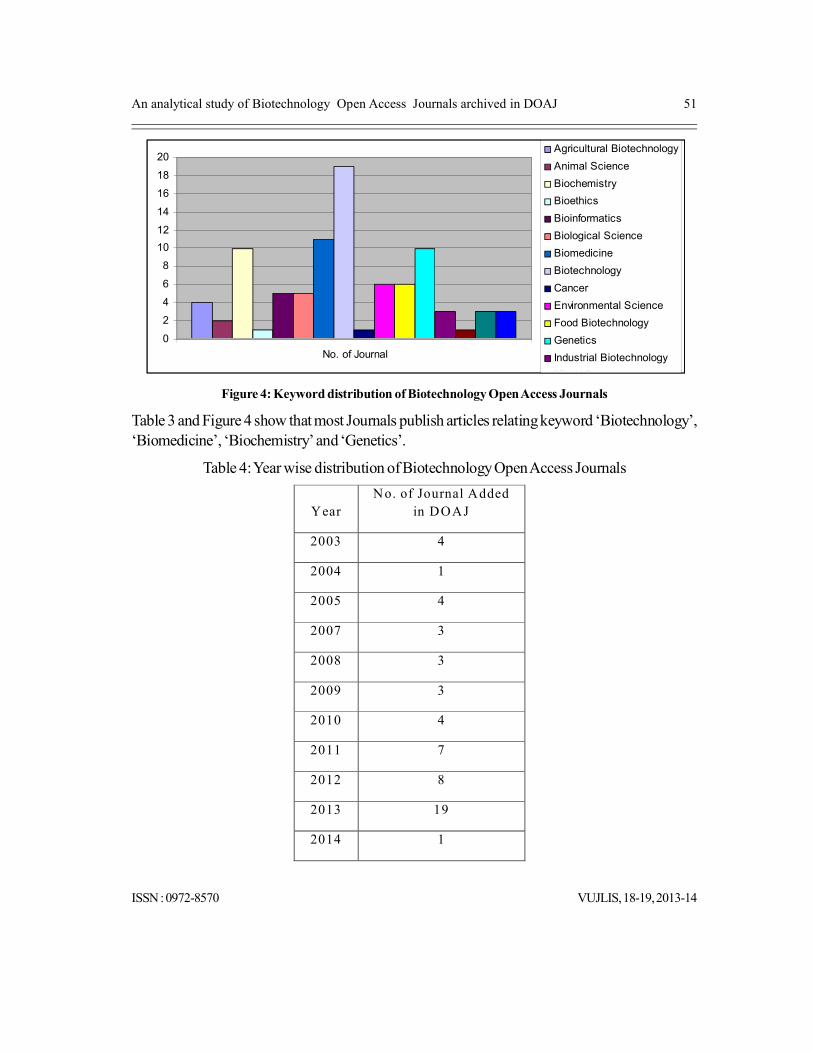
An analytical study of Biotechnology Open Access Journals archived in DOAJ 51
ISSN : 0972-8570 VUJLIS, 18-19, 2013-14
0
2
4
6
8
10
12
14
16
18
20
No. of Journal
Agricultural Biotechnology
Animal Science
Biochemistry
Bioethics
Bioinformatics
Biological Science
Biomedicine
Biotechnology
Cancer
Environmental Science
Food Biotechnology
Genetics
Industrial Biotechnology
Microbilogy
Figure 4: Keyword distribution of Biotechnology Open Access Journals
Table 3 and Figure 4 show that most Journals publish articles relating keyword ‘Biotechnology’,‘Biomedicine’, ‘Biochemistry’ and ‘Genetics’.
Table 4: Year wise distribution of Biotechnology Open Access Journals
YearNo. of Journal Added
in DOAJ
2003 4
2004 1
2005 4
2007 3
2008 3
2009 3
2010 4
2011 7
2012 8
2013 19
2014 1

52 Banerjee & Chakraborti
VUJLIS, 18-19, 2013-14 ISSN : 0972-8570
Table 4 is showing the archiving year of the Journal in DOAJ. It is revealed that the first Biotech-nology Open access Journal was archived in DOAJ in the year 2003. Most of the Journals werearchived in the year 2013.
Table 5: Publication Cost
Figure 5: Publication cost
Table 5 and Figure 5 are depicting that most of the Open Access Journal charged for publishingarticle. 51% Open Access Journals charged publishing cost and 49% are still free.
6 Major Findings
India is the leading country for publishing Open access journals in Biotechnology.
English is the most common communication language for the scientific communication inBiotechnology.
Biotechnology Open Access Journals are publishing articles from different areas of Bio-technology field.
There was a steady growth of publishing Biotechnology Open Access Journals startingfrom 2003.
Most of the Biotechnology Open Access Journals has publication cost.
7 Conclusion
Open Access Journal has changed the information accessibility and utilization. Open Accessscientific and scholarly journal provide greater visibility to author because every scholars areusing open access journals. Biotechnology professionals are also becoming habituated for using
Charge Publication cost No. of journals
Yes 29
No 28
No. of journal
Yes51%
No49%
Yes
No

An analytical study of Biotechnology Open Access Journals archived in DOAJ 53
ISSN : 0972-8570 VUJLIS, 18-19, 2013-14
Open Access Journals. It is suggested that scientist and research scholars should try to publishtheir research findings in open access journals for greater impact factor and citation index.
References
1 Budapest Open Access Initiative (2012). Open Access (accessed on 21.07.2014), http://www.earlham.edu/~peters/fos/boaifaq.htm
2 Directory of Open Access Journals (2014). Definitions (accessed on 21.07.2014), http:// http://doaj.org/faq#definition
3 Bansal, S & Singh, N. (2013). Open Access journals in Animal Sciences: an analytical study of DOAJ.International Journal of Information Dissemination and technology, 3(2), 86-88.
4 Banerjee, S & Chakraborti, B. (2013). Designing a Knowledge Hub on Biotechnology Information forIndia. International Journal of Advanced Information Science and Technology, 20, 57-63.
5 Lihitkar, R & Lihitkar, S R. (2013). Open Access Library and Information Science Journals on DOAJ: ananalytical study. International Journal of Advanced Library and Information Science, 1(1), 33-61.

Globalizing College Libraries Using ICT : A Case Study
Chaudhuri Mafijul Kabir*
*Librarian (Sr Gr), Dinabandhu Andrews College, Kolkata
AbstractMost of the universities and the colleges under the universities are to begoing to change their collection development, services, and otherrequirements to cope with the era of globalization. In this paper, an attempthas been made to discuss about the globalizing the college libraries (academiclibraries) by using ICT (Information Communication Technology).
1 Introduction
In the opinion of Guillen,(2000), globalization is a process leading to greater interdependenceand mutual awareness among economic, political and social units of the world. It is the “acceler-ated compression of contemporary world and the intensification of consciousness of the worldas a singular entity”. Wikipedia defines globalization in “literal sense as simply a means of interna-tional integration , that is a process by which the people of the world are unified into a singlesociety and functioning together”. This process is a combination of economic, technological,socio-cultural and political forces, hence Akanni (2008) asserts that globalization is a broad termwith several dimensions such as economic globalization, globalization of education, globalizationof sports events, globalization of library services, among others. It is obvious from the foregoingthat ICT is a major factor in the actualization of globalization. With the use of ICT, it has becomepossible to access a variety of information and knowledge sources in a manner that would besimple, easy and independent of time, place and subject discipline. ICT revolution is seen as thecentral and driving force for globalization which has widened the imagination and the abilities oflibrary and information professionals to produce, access, adapt and apply information in theirorganization and institutions.

Globalizing College Libraries Using ICT : A Case Study 55
ISSN : 0972-8570 VUJLIS, 18-19, 2013-14
2 Benefits of Globalization
Viewed in the light of globalization which is clearly the shrinking of the world into a seamlessentity, the benefits of globalization to the information procession and hence academic libraries areenormous. There are transformations of traditional libraries to virtual migration of information toelectronic format. These are all responses to pressure being faced by educational research andlearning organizations to acquire, process, manage, discriminate and communicate knowledge inelectronic format using the new information technologies. Physical barriers have been brokendown, libraries and the services they provide now have borderless territories due to the applica-tion of ICT in libraries thus resulting in the benefits articulated several years ago by Alsa andKelechukwu(1998) as follows:
Quick and convenient information exchanges;
Access to experienced and expert individual in thousand fields;
Enhancement of team work across geographical distance;
Access to archives information worldwide;
Transfer of data between machines and provides a great platform to have fun and beentertained;
As a reference tool, the internet provides wealth of up-to-date resources unavailable inbond volume;
The internet gives personal access to specialization and experts in hundreds of disciplines;
It enables you to reach your fellow librarians with messages and documents independentof the constraints of mails, telegraphs or even fax;
One can collect news and facts which can be stored in one’s computer for later use inreference;
Resources in the internet allow libraries to provide better services to their patrons by givingon-line access to information that will be difficult to locate in any other manner;
The internet provides access to bibliographic records of millions of books and the detailsof the holdings of academic and research libraries around the world. Electronic journalsand newsletters are made available on a regular basis;
Librarians can make the selection of books required in their institutions and order themwithout going from one bookshop or publisher to another;
The CDROM in another versatile facility made available in academic libraries through thepresence of information technology.
Omekwu and Echezona (2008), corroborated these benefits as follows:

56 Kabir
VUJLIS, 18-19, 2013-14 ISSN : 0972-8570
Libraries are now situated in cyberspace;
Library services are no longer constrained to time of opening and close hours;
Library users can access services in libraries beyond their own, beyond their country andcontinent ; and
The virtuality of information resources means that millions of users can access one re-source at the same time.
3 Role of College Librarian
The changes generated by the last wave of globalization put the libraries, together with othertypes of organizations and with society as a hole, in front of some challenges, to which they react,to answer in a way or another. Libraries are among the oldest socio-cultural institutions, with animportant role in the evolution of human civilization through the functions they accomplish: custo-dial, educational, aesthetic and informational. They are part of all systems in society and along thecenturies they have in society.
Internet access is one of the greatest technological advancement in Information and Communica-tion Technology (ICT) which has gone a long way to influence the mode of information gathering,storage, retrieval and dissemination in these times. Academic institutions play major roles in themanpower development of any nation since they provide the high as well as middle level man-power needed for the social, economic and political advancement of nation. This is done throughtheir programmes of teaching, learning, research and community services. The central place ofacademic libraries is called into play because it is the duty of these libraries to provide the neces-sary information to the lecturers and students to achieve their teaching learning and researchneeds in the easiest, fastest and most comprehensive way. The current trend in many libraryworldwide in the deployment of ICT facilities in rendering services of various kinds to theirpatrons thereby providing speedy and update information for their use. Furthermore, the global-ization of the entire world in recent times has placed additional demands on academic libraries toconform in order to avoid the risk of obsolescence and irrelevance in the scheme of things.
The futuristic academic libraries in the higher education system must globalize if they want to addvalue to the academic enterprise, concluded the recently held International Conference on Aca-demic Libraries – ICAL 2009. The academic libraries in India and other developing countriesare at least a decade behind their counterparts in the developed countries. The ICAL 2009which was specially called to reposition academic libraries as the next generation libraries, rec-ommended ‘globalizing academic libraries’ in the network environment. The model proposed bythe conference in essence envisages collaboration between libraries at local, state, national, andglobal level on all library dimensions, for instance performing library functions of resource build-ing, cataloguing, and back end operations at consortia level offering online avenues for managing

Globalizing College Libraries Using ICT : A Case Study 57
ISSN : 0972-8570 VUJLIS, 18-19, 2013-14
library functions. This short of new set up would essentially be helping client libraries relievingthem of the hassles and burden of managing local library management systems as well as obviat-ing the need to undertaking capital intensive and time consuming activity of building cataloguingdatabases at local level.
Libraries constitute an important element of the foundation of knowledge economy, said Dr SamPitroda, the chairman of National Knowledge Commission of India in his inaugural address. Thegovernment of India has agreed to set up National Commission on Libraries as recommended byNational Knowledge Commission. The commission would be set as a statutory body to addressacademic library vision for 2020. Given issues pertaining to information and learning needs of thecountry, the manpower requirements of the country in the library sector and how to meet thesame through education and training. The government has also agreed to set up and institution inthe country for advanced educations and training in the library and information science, he saidon the occasion. The futuristic academic libraries must complement each other’s resources ratherthan duplicate them as has been the practice at present, advised Prof. B. L. Mungekar, formerMember of Planning Commission and the patron of the conference.
The highlights of the ICAL 2009 were the futuristic vision of academic libraries – globalizingacademic libraries by 2020, the framework of planning road map for vision implementation, theexhibition of corporate house such as Elsevier, Sage, Informatics and the INFLIBNET fromUGC participated in panel discussion chaired by Prof. B L Mungerkar, on the topic of librarypublisher relationship for globalizing academic libraries.
The ICAL 2009 therefore gave a call for ‘globalizing academic libraries’ in the network environ-ment as the academic library vision for 2020. Given the challenges on how to develop academiclibraries as the next generation libraries and on how to enable them to cope with imminent expan-sion planned in the higher education sector.
The IACL – 2009 call for globalizing academic libraries is very timely and relevant. The global-ized academic libraries is to be seen as another but different library model promises to offerseveral inherent advantages over the library model such as strategic, operational , and economicon the following lines:
Enabling utmost economy and performance in the library operations at the client level;
Enabling libraries to builds common resources at the consortia level as opposed to currentpractice of building resources at the client level in the distributed environment;
Enabling libraries to go in for minimal ICT infrastructure at client level compared to high endrequirements mandated as at present;
Enabling access not only to local resources but also to resources distributed across univer-sity libraries;

58 Kabir
VUJLIS, 18-19, 2013-14 ISSN : 0972-8570
Enabling professional staff sufficient opportunities to develop expertise in core library andinformation science areas and not be bogged down with the requirement to necessary de-velop high end expertise in ICT; and
Enabling libraries to play strategic and educational roles in order to add value to the aca-demic enterprise.
The eleven point roadmap that the ICAL 2009 outlined for globalizing academic libraries is asfollows:
To ascertain the strengths and weakness of libraries under the central and state universitiesin India in the form of a status report;
To identify alternate modes of managing traditional library function in the global academiclibrary mode;
To identify the news dimensions that could be added to academic library services by ex-ploiting common pool of resources;
To identify the strategic and educational roles that libraries and librarians could play to addvalue to academic enterprise and in the knowledge society;
To undertake new initiatives such as building digital resources of indigenous knowledge ofunique character;
To formulate ICT plan for systematic development of futuristic global academic libraries;
To formulate plans for ensuring quality and standards in the functioning and performance offuturistic global academic libraries;
To encourage international collaboration on all library fronts for bringing about qualitativechange in the functioning and performance of futuristic global academic libraries;
To Identify and formulate appropriate policies, programmes, and systems for ICT integra-tion at library client level and consortia level;
To identify the priority areas for talent development and formulating talent developmentplans for the purpose; and
To evolve suitable strategies for management, library advocacy and marketing essentiallywith a view to change the public image of the academic libraries.
According to the report of Higher Education in West Bengal (2010 – 2011) there are 452general colleges in West Bengal under different universities. The following chart shows details:

Globalizing College Libraries Using ICT : A Case Study 59
ISSN : 0972-8570 VUJLIS, 18-19, 2013-14
University General Colleges1.Calcutta University 1292. Burdwan University 933. Vidyasagar University 444. Kalyani University 435. North Bengal University 506. West Bengal State University, Barasat 507. Gour Banga University 248. Sidho Kanho Birsha University 19 Total 452
Most of the above mentioned universities are going to be changed in any form of ICT to copewith globalization era and most of the colleges under these universities are going to be changed inany form of ICT to upgrade their libraries to cope with globalization era.
In the district of 24th Paragonas(South) there are 38 general colleges and 1 Women University(in growing stage). Most of the colleges are accepting the rapid growth of ICT, at least everycolleges has their own website.
4 Dinabandhu Andrews College: On Change in Library in Globalization Era
Dinabandhu Andrews College (Government Sponsored), a premier co-education institutionwas established in the year 1956 by an order of the Government of West Bengal.
The college is named after Rev. C. F. Andrews, a celebrated saint, philanthropist, a trustworthyfriend of the downtrodden and a close confident of Kabiguru Rabindranath Tagore. His greatlove for the people of India and excellent service and sacrifice for the suffering millions of ourmotherland, more especially for emancipation to all constituents of the college - its administra-tion, staff members and students.
The college was basically constituted at the fringe of this semi-urban zone of 24pgs (South)District with an aim to disseminate the scope of higher education to a huge number of children ofthe displaced persons from erstwhile East Pakistan, presently Bangladesh. Moreover, this insti-tution is also providing immense opportunities of higher education to a large number of rural andurban students, a substantial and marginalized section of the society.
The college library was started along with the establishment of the college in order to cater theacademic and research needs of the faculty, students and staff members. Since then the collegelibrary has gone strength to strength to live up to the expectation of its immediate clientele.
The college library comprises Central Library and 15 Separate Seminar Library attached toevery Advanced Departments. Besides these, there are 2 separate Library in the Post Graduate
60 Kabir
VUJLIS, 18-19, 2013-14 ISSN : 0972-8570
(Zoology and Electronics) and also separate Library in the Morning Section in the college.
The college Library has a collection of more than 30,000 books, 22 Indian Journals, somereference books, and Carrier guidance journal of current information, general knowledge andother documents.
The college library procedures, namely cataloguing, serial management, acquisitions, circula-tions, catalogue search both manually and automated and access to examination question papersmanually.
The Central Library has been completed the database of all books , journals and membership byusing CDS / ISIS soft ware according to standards prescribed by the UGC – INFLIBNET andwe are going to shift all the records into SOUL soft ware. We are also providing INTERNETfacilities to our members. Besides these we are going to organizing a Digital Library section verysoon.
Beside the traditional services, Library is offering the following services to users:
Database Searching
CD-ROM searching
INTERNET SEARCHING
On line Public Access Service
N-List searching
References
1 Akanni, S. B (2008). Globalization: challenges and opportunities for Nigerian Libraries. In compendiumof papers presented at the 46th Annual National Conference and AGM of the Nigerian Library Associa-tion, Kaduna, 1-6 June,2008 1-12.
2 Alasa, M and Kelechukwu, I. (1998). Internet and academic library services development in Nigerian.Nigerian Libraries 33(10; 17-28).
3 Globalizing Academic Libraries: vision 2020 – Report on the International Conference of AcademicLibraries 2009, held at University of Delhi, October 5-8,2009
4 Guillen,(2000). Globalization and social problems accessed on 7th April,2008 at caliber.U c p r e s s . n e t /doi/pdf/10.1525/sp.2001.4814.
5 Omekwu, C. O and Echezona, R. I. (2008). Emerging Challenges and opportunities forNigerian Librar-ies in a Global Information syatem.
6 Wikipedia (2008). Globalization@http://en.wikipediaorg/wiki/globalization.

Annals of Library and Information Studies:An Analysis of Citation Pattern
Swati Misra*Bidyarthi Dutta**
*Librarian, Kankeswari High School (H.S.), P.O. Kankabati, Bankura 722 141, W.B.**Asst Professor, Dept. of Library & Information Science, , Vidyasagar University, Midnapore 721 102, W.B.
AbstractThis study based on 2318 citations appended to 106 research articles of theyear 2010-2012 of Annals of Library and Information Studies. The authorshippattern shows that 57.7 percent are single-authored, 27.8 percent double- and10.5 percent triple-authored and the remaining 4.1 percents are jointcontributions of four to seven authors. There are 2061 cited authors andnearly 350 cited journals. It is clear that a majority of documents cited inthese years were published not more than twenty years ago. The Bradford’slaw and Lotka’s law were verified for the cited journals and authorsrespectively. It has been observed that the respective distribution patternsfairly in consonance with these two bibliometric laws.
1 Introduction
A citation is a reference to a published or unpublished source of information. More precisely, acitation is an abbreviated alphanumeric expression embedded in the body of an intellectual workthat denotes an entry in the bibliographic references section of the work for the purpose ofacknowledging the relevance of the works of others to the topic of discussion at the spot wherethe citation appears (Reitz, 2004). Citation counts precisely indicate how frequently researchesare using particular research articles on concerned topic. It can be interpreted as measures of theusage and impact of the cited work. The total number of times each paper has been cited by alljournals could be known from citation counts. Citation upholds intellectual honesty that firmlydiscourages plagiarism. It is the citation analysis that http://en.wikipedia.org/wiki/Citation -cite_note-1 attributes prior or unoriginal work and ideas to the correct sources. It allows thereader communities to determine independently whether the referenced material supports theauthor’s argument in the claimed way and helps the reader to gauge the strength and validity ofthe material the author has used. The functions involved in the process of citation are acknowl-edging or citing the author, year, title and locus of publication (journal, book, or other) of asource used in a published work. This is known as citation analysis. This is also considered as an

62 Misra & Dutta
VUJLIS, 18-19, 2013-14 ISSN : 0972-8570
important part of the subject bibliometrics. Among the measures that have emerged from citationanalysis are the citation counts for:
an individual article (how often it was cited);
an author (total citations, or average citation count per article);
a journal (average citation count for the articles in the journal).
Eugene Garfield has been advocating, since the 1950s, for an index in the field of science andtechnology. He made some experimental studies and in 1961 brought out an experimental Sci-ence Citation Index. Since 1964, Garfield’s institution, the Institute of Scientific Information atPhiladelphia, has been regularly bringing out the Science Citation Index (SCI). Since 1972 aSocial Science Citation Index (SSCI) and in 1980 the Arts and Humanities Citation Index arealso being brought out.
Citation Pattern is the pattern of cited journal and also the pattern of author occurrences inreferences. On the basis of these patterns two important laws are described, i.e. Bradford’s Lawand Lotka’s Law. These are known as fundamental laws of bibliometrics or scientometrics.These laws empirically describe the distribution pattern of journals and authors on any particularsubject domain.
Bradford’s law of scattering of subjects in information sources, first published in 1934, states thatthe documents on a given subject is distributed or scattered according to certain mathematicalfunction so that a growth in papers on a subject requires a growth in the number of journals/information sources. The numbers of the groups of journals to produce nearly equal numbers ofarticles is roughly in proportion to k*(1: n: n2) …, where k is called the Bradford multiplier andn is an integer (1, 2, 3....). Bradford’s distribution has several mathematical implications (Duttaand Sen, 2005).
Lotka’s Law was named after Alfred J Lotka. It describes the frequency of publication by au-thors in any given subject field. It states that the number of authors making n contributions isabout 1/na of those m aking one contribution, w here ‘a’ alw ays nearly equals tw o. M ore plainly,
the num ber of authors publishing a certain num ber of articles is a fixed ratio to the num ber of
authors publishing a single article. Since the num ber of articles published increases, therefore the
num ber of authors producing that m any publications becom es less frequent. It m eans that the
num ber of authors m aking contributions is about 1/n² of those m aking one; and the proportion of
all contributors, that m ake a single contribution, is about 60 percent. This m eans that out of all the
authors in a given field, 60 percent w ill have just one publication, and 15 percent w ill have tw o
publications (1/2² tim es of 60). Seven percent authors w ill have three publications (1/3² tim es of
60), and so on. A ccording to Lotka’s law of scientific productivity or cited author pattern, only
six percent of the authors in a field w ill produce m ore than 10 articles. Lotka’s law, w hen applied

Annals of Library and Information Studies: An Analysis of Citation Pattern 63
ISSN : 0972-8570 VUJLIS, 18-19, 2013-14
to large bodies of literature over a fairly long period of time, can be accurate in general, but notstatistically exact. The general form of Lotka’s law can be expressed as y=c/xn wherey=percentage of authors, x=number of articles published by an author, c=constant and –n=slopeof the log-log plot. The pattern observed for cited authors is also more or less identical. In thisstudy, among 2059 authors, 1598 authors (77.6%) were cited once; 258 authors (12.5%) re-ceived two citations and 95 (4.6%) authors received three citations.
2 Related Works
The investigation of citation pattern analysis has been an integral part of LIS research. A goodnumber of studies have been carried out in different times on the citation analysis in severalcountries of the world. The citation pattern of the Journal of Biosciences was studied by Dasand Sen (2001). The citation patterns of Indian Journal of Chemistry Section A and IndianJournal of Pure and Applied Mathematics were studied by Dutta and Sen (2001). Also thecitation pattern of Indian Journal of Physiology and Allied Sciences was studied by Koleyand Sen (2003). The same for Indian Journal of Plant Physiology was studied by Shokeenand Kaushik (2004) and for Journal of Oilseeds Research was studied by Kumar and Kumar(2004). Das (2013) studied the bibliometric profile of the Journal of Informetrics. Sharif andMahmood (2004) studied the style of citing literature by the economists. The citation analysis ofscholarly communications was studied by Haridasan and Kulshrestha (2007). The use ofbibliometric tool in collection development was discussed by Yeoh and Kaur (2008). Maharana,Majhi and Sethi (2011) carried out citation analysis of top research papers in chemistry withspecific reference to India. The citation analysis of doctoral thesis in botany submitted to KuvempuUniversity was studied by Banateppanvar, Biradar and Kannappanavar (2013). The journal selfcitation and author self citation of Annals of Library and Information studies was carried outby Rattan (2013). The citation patterns of research publications contributed by National Metal-lurgical Laboratory, Jamshedpur was studied by Sahu, Goswami and Chaudhury (2011). Thecitation patterns of Indian science journals were executed by Garg and Kumar (2010). Helama(2012) studied citation patterns in doctoral dissertations. The Use of non-social work journals insocial work research was discussed by Strothmann (2010). The analysis of research perfor-mance in undergraduates receiving face to face versus online library instruction was studied byClark and Chinburg (2010). Sansone, Leung and Wiederman (2012) were carried out drivingcitations and aggressive behaviour. The citation management were executed by Glassman &Sorensen (2012). Cox (2008) studied citation analysis of graduate dental theses references. TheRankings and trends in citation patterns of communication journals were studied by Levine (2010).The citation analysis of three types of Ichthyologic Publications were discussed by MLS (2007).Sinn (2005) studied a local citation analysis of mathematical and statistical dissertations. E-Jour-nals and Citation Patterns were discussed by Parker, Bauer & Sullenger (2003).

64 Misra & Dutta
VUJLIS, 18-19, 2013-14 ISSN : 0972-8570
3 Objectives of the Study
The chief objectives of the present study are to find out:
Authorship pattern of cited references;
Distribution of cited author and verification of Lotka’s law
Distribution of cited journal and verification of Bradford’s law;
Forms of document cited;
Age of cited references;
Percentage of author self citation;
Percentage of journal self citation;
Source or contributing authors;
Potential keywords to find out thrust areas of research
4 Scope
This study covers citation analysis of Annals of Library and Information Studies during theyears 2010 (Vol. 57), 2011 (Vol. 58) and 2012 (Vol. 59). The total number of articles and citedreferences contained by three volumes of this journal is 106 and 2318, which means 21.9 (~22)cited references per article. The number of cited authors and cited journals are 2061 and 350respectively.
In the year 1954, erstwhile INSDOC launched Annals of Library Science as its first publicationand Dr. S R Ranganathan was its first Editor. The journal’s title was expanded to Annals ofLibrary Science and Documentation in 1964 and again renamed in 2001 as Annals of Libraryand Information Studies. Into its 61st volume in 2014, Annals of Library and InformationStudies is the oldest continuing and peer-reviewed Indian LIS journal at the national level.
This journal has been chosen because in India it is leading core journal in LIS perspective.Annals of Library and Information Studies is a quarterly journal in publishing original papers,survey reports, reviews, short communications, and letters pertaining to library science, informa-tion science and computer applications in these fields.
5 Methodology
The cited items have been categorized in sixteen classes or document types, i.e.
1. 1. journal article
2. Book
3. Cyber reference
Annals of Library and Information Studies: An Analysis of Citation Pattern 65
ISSN : 0972-8570 VUJLIS, 18-19, 2013-14
4. Thesis
5. Report
6. Proceedings
7. Conference paper
8. Seminar paper
9. Workshop paper
10. Dissertation
11. Book chapter
12. Encyclopaedia
13. News item
14. Monograph
15. Standard
16. Handbook
Different Components of citation that have been studied here listed below:
For Journal article= author(s), cited journal name with vol. and issue no, country, year.
For Book= author(s), place of publication, year of publication.
For Cyber References= author(s), URL. The references are indicated as “Cyber Yes”, ifaccess time is present and “cyber-No”, if access time is not present.
For Thesis= author(s), place, year
For Report= year, place
For Proceedings= author(s), place, year
For Conference paper= author(s), place, year
For Dissertation= author(s), place, year
For Seminar paper=author(s), place, year
For Workshop paper=author(s), place, year
For Book Chapter= author(s), place, year
For Encyclopaedia=author(s), place, year
For News Item=source-name, author, year
For Monograph=author, year
For Standard= place, year
For Handbook=author(s), place, year

66 Misra & Dutta
VUJLIS, 18-19, 2013-14 ISSN : 0972-8570
The references from each article of each issue of the journal were collected for the period of2010-12, which accounted for 2,318 citations. The data relating to all the references appendedto the articles during the period were collected and analysed.
6 Results & Analysis
6.1 Authorship Pattern
The authorship pattern has been presented in Table 1 and Figure 1 that reveals that the percent-age of single authored citation is highest (57.7%) followed by two authored citations (27.8%) &three authored citations (10.5%). Hence solo research is highest in this subject area compared toteam research. The citation of more than three authors, i.e. the large team research is negligiblysmall here.
Table 1: Authorship pattern
6.2 Verification of Lotka’s Law
The pattern observed for cited authors is more or less identical with Lotka’s distribution. In thisstudy, over the entire period, among 2059 authors, 1598 authors (77.6%) were cited once; 258authors (12.5%) received two citations and 95 (4.6%) authors received three citations. Theseare the percentage values obtained assuming the value of a = 2. The top three cited authors overthe said period are, E Garfield, M Thewall and V.L.Kalyane respectively.
No. of articles contributed by
2012 2011 2010 Total Percentage
single author 234 418 526 1178 57.7%2-author 90 211 266 567 27.8%3-author 36 80 99 215 10.5%4-author 7 17 21 45 2.2%5-author 2 5 14 21 1.0%6-author 2 3 5 0.2%7-author 2 3 7 12 0.6%
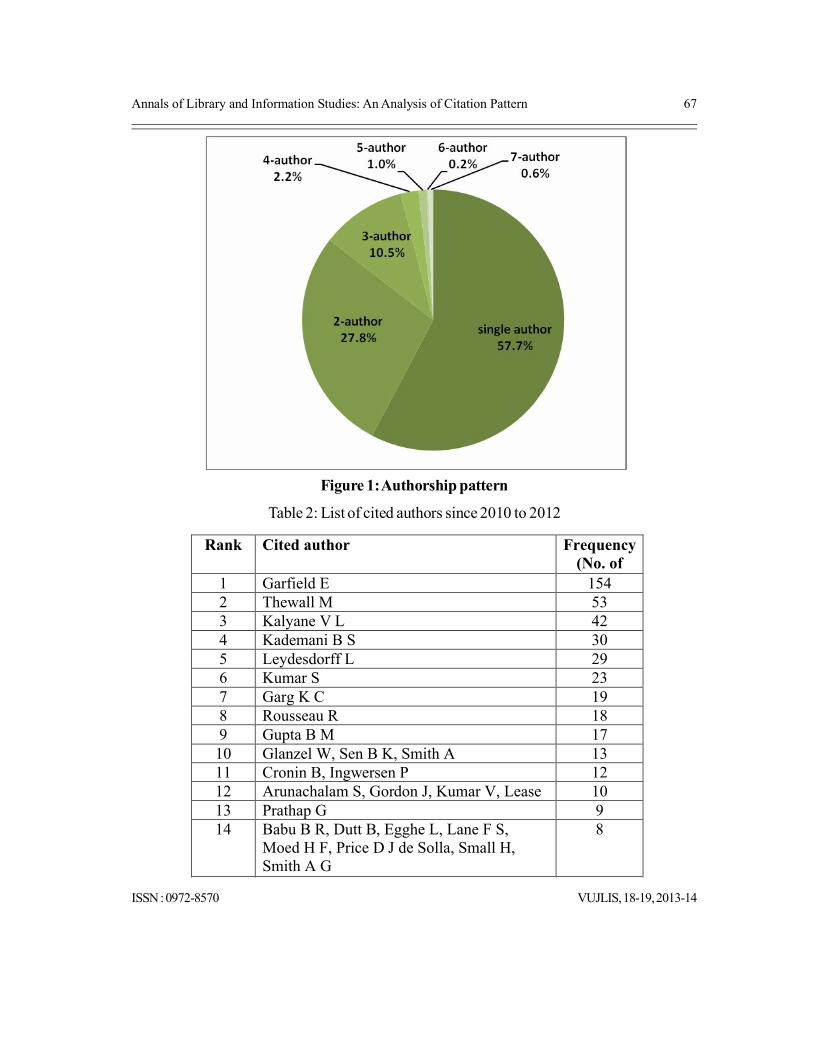
Annals of Library and Information Studies: An Analysis of Citation Pattern 67
ISSN : 0972-8570 VUJLIS, 18-19, 2013-14
Figure 1: Authorship pattern
Table 2: List of cited authors since 2010 to 2012
Rank Cited author Frequency (No. of times 1 Garfield E 154
2 Thewall M 533 Kalyane V L 424 Kademani B S 305 Leydesdorff L 296 Kumar S 237 Garg K C 198 Rousseau R 189 Gupta B M 1710 Glanzel W, Sen B K, Smith A 1311 Cronin B, Ingwersen P 1212 Arunachalam S, Gordon J, Kumar V, Lease 1013 Prathap G 914 Babu B R, Dutt B, Egghe L, Lane F S,
Moed H F, Price D J de Solla, Small H, Smith A G
8
15 Arora J, Bradford S C, Gopalakrishnan S, 7
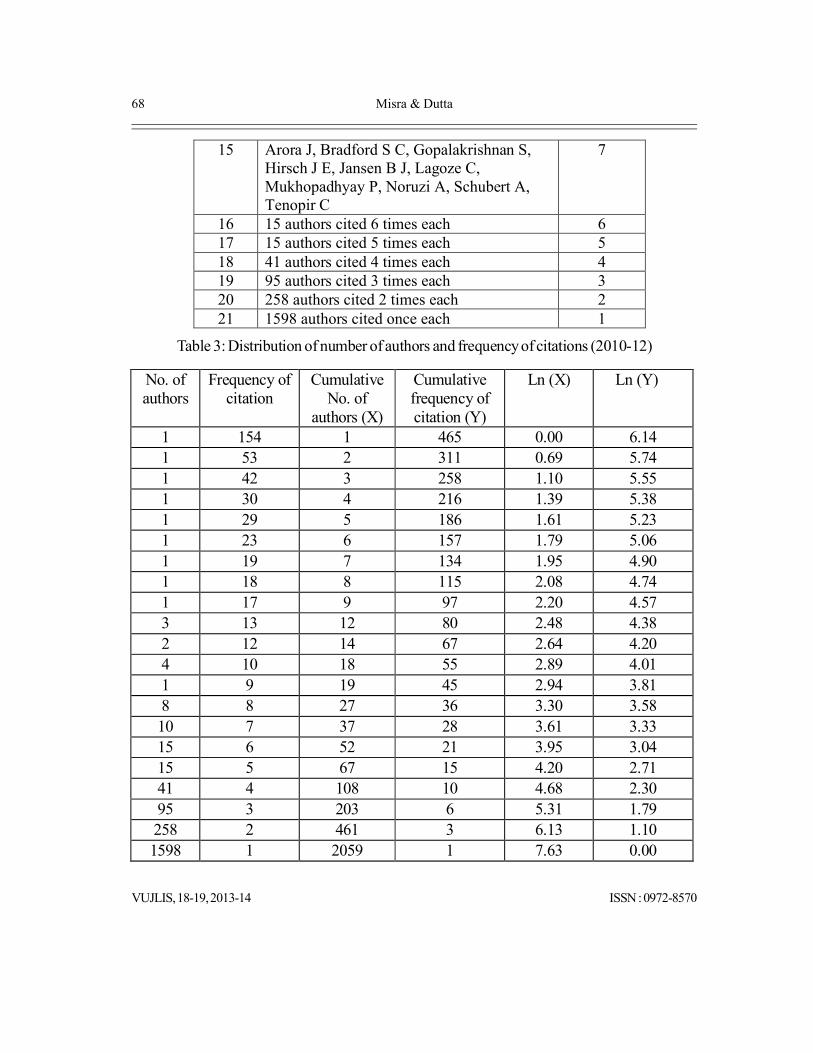
68 Misra & Dutta
VUJLIS, 18-19, 2013-14 ISSN : 0972-8570
15 Arora J, Bradford S C, Gopalakrishnan S, Hirsch J E, Jansen B J, Lagoze C, Mukhopadhyay P, Noruzi A, Schubert A, Tenopir C
7
16 15 authors cited 6 times each 617 15 authors cited 5 times each 518 41 authors cited 4 times each 419 95 authors cited 3 times each 320 258 authors cited 2 times each 221 1598 authors cited once each 1
Table 3: Distribution of number of authors and frequency of citations (2010-12)
No. of authors
Frequency of citation
Cumulative No. of
authors (X)
Cumulative frequency of citation (Y)
Ln (X) Ln (Y)
1 154 1 465 0.00 6.141 53 2 311 0.69 5.741 42 3 258 1.10 5.551 30 4 216 1.39 5.381 29 5 186 1.61 5.231 23 6 157 1.79 5.061 19 7 134 1.95 4.901 18 8 115 2.08 4.741 17 9 97 2.20 4.573 13 12 80 2.48 4.382 12 14 67 2.64 4.204 10 18 55 2.89 4.011 9 19 45 2.94 3.818 8 27 36 3.30 3.5810 7 37 28 3.61 3.3315 6 52 21 3.95 3.0415 5 67 15 4.20 2.7141 4 108 10 4.68 2.3095 3 203 6 5.31 1.79258 2 461 3 6.13 1.101598 1 2059 1 7.63 0.00

Annals of Library and Information Studies: An Analysis of Citation Pattern 69
ISSN : 0972-8570 VUJLIS, 18-19, 2013-14
Figure 2: Ln (X) vs. Ln (Y) plot
The cumulative values of the two variables are presented in Table 3. The Ln (X) vs. Ln (Y) plotin Figure 2 shows central linear portion with slight upward concave curvature at the top andupward convex curvature at the tail of the curve. The central linear portion conforms the conso-nance of cited author pattern to Lotka’s law but with little deviation as signalled by tilts at twoends. The equation depicting Lotka’s distribution may be presented as:
y=c/xn ……………….(1)
Where, c and n are constants for a particular set of data. The values of Lotka’s constants, i.e. ‘c’and ‘n’ for the three years and over the stipulated period (2010-12) are furnished in Table 4.
Table 4: Values of Lotka’s constants over different years
The values of ‘n’ for the years 2010, 2011 and (2010-12) are almost equal, while the same forthe year 2012 somehow varies. The values of ‘c’ are also different over different years. It canthus be inferred that the cited author distribution patterns over the years for this journal are notexactly alike.
6.3 Types of Documents
Literature cited in the journal is published in different types of documents like books, journals,conference proceedings, thesis etc. The information regarding the type was collected from the
0 . 0 0
1 . 0 0
2 . 0 0
3 . 0 0
4 . 0 0
5 . 0 0
6 . 0 0
7 . 0 0
0.0
0
1.1
0
1.6
1
1.9
5
2.2
0
2.6
4
2.9
4
3.6
1
4.2
0
5.3
1
7.6
3
L n ( C u m . n o . o f a u t h o r s ) ( X )
Ln
(C
um
. fr
eq
ue
nc
y)
(Y)
Lotka’s constantsYearc n
2010 1002 1.42011 728 1.52012 528 2.3
2010-12 2059 1.4

70 Misra & Dutta
VUJLIS, 18-19, 2013-14 ISSN : 0972-8570
source data and presented in Table 5 and Figure 3.
Table 5: List of type of document for the stipulated period (2010-12)
The analysis of document type for the entire time span reveals that the percentage of journalarticle citation is highest (54.3%) followed by cyber-yes citations (17.7%), book citations (14.1%)& cyber-no citations (5.8%). Hence journal article is maximum and the total percentage of cyberreferences & book citations (37.6%). The percentage of others type of document are very small(7.9%). The notable feature is that the percentage of cyber-reference is occupying the dominantposition. This indicates that users are mostly concerned about online documents nowadays andthis trend is rapidly increasing day by day. Also, cyber-yes reference always outnumbers cyber-no reference, which means that the authors are aware of access time and the same is given withthe reference. Since cyber references are highly ephemeral in nature, therefore access-time shouldbe mandatory in cyber-reference.
6.4 Citation Age
This study reveals yearwise distribution of citations. The age of citations was calculated by notingthe difference between the year of publication of citing articles and that of cited documents andare presented in Table 6 and Figure 4.
Rank Type of document Frequency with percentage
1 Journal 1258 (54.3%)2 Cyber-Yes 411 (17.7%)3 Book 327 (14.1%)4 Cyber-No 135 (5.8%)5 Proceedings 39 (1.7%)6 Report 34 (1.5%)7 Thesis 33 (1.4%)8 Conference paper 30 (1.3%)9 Seminar paper 21 (0.9%)10 Workshop paper 8 (0.3%)11 Book Chapter,
Dissertation7 (0.3%)
12 Encyclopedia 4 (0.2%)13 Handbook, Monograph,
News Item, Standard1

Annals of Library and Information Studies: An Analysis of Citation Pattern 71
ISSN : 0972-8570 VUJLIS, 18-19, 2013-14
Figure 4: Distribution of citation age over the entire time span (2010-12)
The analysis of overall citation age states that the frequency of one year old citation is highest(138) followed by the frequency of two year old citation is (121). The frequencies of six, fourand five year old citations are (113), (111) & (110) respectively. This result indicates that theauthors mostly use very recent citations.
Journal54.3%
Cyber-Yes17.7%
Book14.1%
Cyber-No5.8%
Proceedings1.7%
Report1.5%
Thesis1.4%
Conference paper1.3%
Seminar paper0.9%
Workshop paper0.3%
Book Chapter0.3%
Dissertation0.3%
Encyclopedia0.2%
Handbook0%
Monograph0%
News Item0%
Standard0%
Figure 3: Distribution of types of documents for the stipulated period
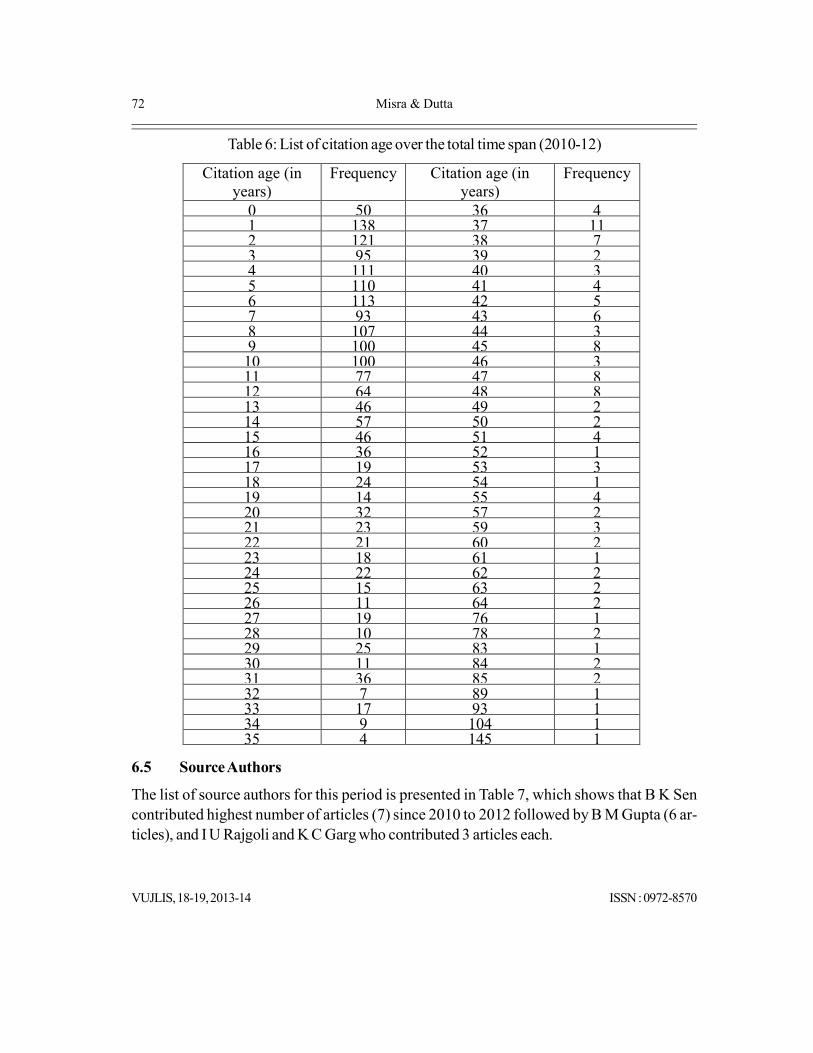
72 Misra & Dutta
VUJLIS, 18-19, 2013-14 ISSN : 0972-8570
Table 6: List of citation age over the total time span (2010-12)
Citation age (in years)
Frequency Citation age (in years)
Frequency
0 50 36 41 138 37 112 121 38 73 95 39 24 111 40 35 110 41 46 113 42 57 93 43 68 107 44 39 100 45 810 100 46 311 77 47 812 64 48 813 46 49 214 57 50 215 46 51 416 36 52 117 19 53 318 24 54 119 14 55 420 32 57 221 23 59 322 21 60 223 18 61 124 22 62 225 15 63 226 11 64 227 19 76 128 10 78 229 25 83 130 11 84 231 36 85 232 7 89 133 17 93 134 9 104 135 4 145 1
6.5 Source Authors
The list of source authors for this period is presented in Table 7, which shows that B K Sencontributed highest number of articles (7) since 2010 to 2012 followed by B M Gupta (6 ar-ticles), and I U Rajgoli and K C Garg who contributed 3 articles each.

Annals of Library and Information Studies: An Analysis of Citation Pattern 73
ISSN : 0972-8570 VUJLIS, 18-19, 2013-14
Table 7: List of source authors
Rank Source authors Frequency (No. of articles contributed)
1 B K Sen 72 B M Gupta 63 I. U Rajgoli, K C Garg Contributed 3 each4 B. Mukherjee, G. Prathap, J. K Pal, J.
K. Sarkhel, M. Haneefa K, P. P. Ray, P. S. Mukhopadhyay, S Kumar
Contributed 2 each
5 160 authors Contributed 1 each
6.6 Cited Journals’ Ranking and Bradford’s Distribution
The ranking of cited journals is done to identify the core journals containing the research litera-ture. It is necessary to know the most productive journals used in references and for furtherstudy of the subject, this information is useful for the librarians as well as research scholars. Theranked cited journals are listed in Table 8 and the corresponding Bradford’s pattern is presentedin Table 8A.
Table 8: List of cited journal nam es since 2010 to 2012
Rank Journal Name Frequency (no. of
times cited)1 Scientometrics 1142 Essays of an Information Scientist 823 Annals of Library and Information Studies 594 Journal of Documentation 495 Journal of the American Society for Information Science and 366 Current Science 357 Journal of Information Science 268 Information Technology and Libraries, Journal of the American
Society for Information Science25
9 Annals of Library Science and Documentation 2010 The Electronic Library 1911 ASLIB Proceedings, SRELS Journal of Information Management 18
12 College & Research Libraries, Science 1713 Information Processing & Management 1514 Library Trends 1415 Library Review 1316 Journal of Academic Librarianship 1217 Libri, Malaysian Journal of Library and Information Science, 11

74 Misra & Dutta
VUJLIS, 18-19, 2013-14 ISSN : 0972-8570
16 Journal of Academic Librarianship 1217 Libri, Malaysian Journal of Library and Information Science,
Nature, Online Information Review11
18 American Documentation, Library Management 919 Bottom Line: Managing Library Finances, Bulletin of the Medical
Library Association, DESIDOC Journal of Library & Information Technology, Indian Journal of Open Learning, Information Studies, Library and Archival Security, Library Hi Tech, New Library World, The International Information & Library Review
8
20 3 journals cited 7 times each 721 5 journals cited 6 times each 622 10 journals cited 5 times each 523 10 journals cited 4 times each 424 22 journals cited 3 times each 325 47 journals cited 2 times each 226 215 journals cited 1 times each 1
Table 9: Analysis of Bradford’s pattern
The average frequency of citation is least in the year 2012 and highest during the entire period.The values of ‘k’ for the years 2011 and 2012 are identical and least for the year 2010. Similarlythe values of ‘n’ for the years 2011 and 2012 are nearly identical and least for the year 2010. Theimportant feature is that the overall value of ‘k’ lies within the range of individual yearly valueswhile the same for ‘n’ crosses the range of individual yearly values. The distribution of citedjournals approximately tallies with Bradford’s pattern.
6.7 Keyword Analysis
In the year of 2010 of Annals of Library and Information Studies keywords are not present.In the year of 2011 few keywords are present. But in the year of 2012 sufficient keywords areavailable. It is clear from the analysis of keywords that the thrust area of research during thisperiod was e-resource consortia. Several articles about the country Nigeria also appeared in thisjournal during the time. Maximum number of keywords occurred only once that is listed in Table10.
S.N
o.
Year No. of cited
journals (J)
Freq. of citations
(C)
Av. freq. of citation
(C/J)
Observed pattern Approximated pattern
Val
ue o
f ‘k
’
Val
ue o
f ‘n
’
1 2010 167 607 3.6 4*(1 : 5.2 : 35.2) 4*[1 : 5 : (6)2] 4 52 2011 168 443 2.6 9*(1 : 3.6 : 14) 9*[1 : 3.6 : (3.6)2] 9 3.63 2012 129 224 1.7 9*(1 : 3.2 : 9) 9*[1 : 3 : (3)2] 9 34 2010- 347 1273 3.7 8*(1 : 5.6 : 36.7) 8*[1 : 6 : (6)2] 8 6

Annals of Library and Information Studies: An Analysis of Citation Pattern 75
ISSN : 0972-8570 VUJLIS, 18-19, 2013-14
Table 10: List of keywords for the year 2012
Keyword FrequencyE-resources 7Consortia 4Nigeria 3Bi-frequent keywords: Academic libraries, Archiving, Bradford's Law, E-journals, Resource SharingMono-frequent keywords: Attitude to computers, Bibliometrics, Bradford Distribution, Bradford's Law of Scattering, Bradford's zones, Citation Measure, Collection development, Collection Security, Computer literacy, Computer skills, Concept Symbols, Content Management, Critical Success Factors, Databases ranking, Defaults, DeLCON, Dementia, Diffusion, Digital Libraries, Digital Preservation, Disease, Doctoral theses, DRDO, Dye-sensitized solar cells, E-journals consortium, Electronic health information, Electronic resources usage, ERMS, Financial and industry databases, Higher education, Impact Factor, INDEST-AICTE Consortium, Indexing & Abstracting Service, Indian Language, Indian S & T journals, Information and communication technology, Information format preferences, Information Management, Information resources, Information seeking behaviour, Information utilisation, Institutional Repository, Koha, Language Search, Letter correspondences, Librarians, Library Security, Library Automation, Library Cooperation, Library staff, Matthew Effect, National Solar Mission, Networking, Non-Silicon, Online Interactivity, Open Source Software, Pakistan, Pricing, Productivity of journals, Psychology, Publication, R & D strategy, Rabindranath Tagore, Research output, Scholarly Electronic Resources, Scientometrics, Scientometrics-India, Silicon, SUCHI, Text Processing, Training, Uganda, Universities, University Libraries, URLs, Usage, Usage Statistics, Use studies, Web 2.0Website Quality, Women in Science
6.8 Self Citation
The analysis of overall author self citation reveals that in 2010 author self citation is highest (79)followed by 2011 author self citations (44) & 2012 author self citation (18). Hence in 2010author self citation is maximum here compare to other. The analysis of overall journal self citationreveals that in 2010 journal self citation is highest (24) followed by 2011 journal self citations(30) & 2012 journal self citation (5). Hence in 2011 journal self citation is maximum here com-pare to 2012.
76 Misra & Dutta
VUJLIS, 18-19, 2013-14 ISSN : 0972-8570
Table 11: Author self citation
Table 12: Journal self citation
6.91 Indian vs. Foreign Citation
The analysis of overall country wise citations reveals that the foreign citation is highest (75%) &Indian citation is low (25%). The Indian authors highly prefer foreign sources of informationcompared to Indian sources.
Table 13: Indian vs. Foreign citation
7 Conclusion
Annals of Library and Information Studies is a leading quarterly journal in library and informa-tion studies. It is core journal in LIS perspective. The results highlight that 75% citations are fromoutside India. Its percentage of self citation is pretty low. The journal has a Web site too to attractinternational attention and it is an open access journal that increases its international visibility. Ofthe cited items, journal article is maximum here compare to others. The percentage of others typeof document are small. Core journals have been identified which shall be useful to scientist andlibraries. The cited journal distribution pattern fairly in consonance with Bradford’s distributionpattern and the cited author distribution pattern more or less tallies with Lotka’s distributionpattern. It is to be noted that the solo research or individual research in this subject is highlydominating compared to team research as clear from the analysis of authorship pattern.
References
1 Banateppanvar K, Biradar B S, and Kannappanavar B U, Citation analysis of doctoral thesis in botanysubmitted to Kuvempu University, India: A Case Study, Collection Building, 32 (1) (2013) 12-20.
Year Frequency (no.of times self cited authors)2010 792011 442012 18
Year Frequency(no. of times self cited journals)2010 242011 302012 5
Country FrequencyIndian citation 353 (25%)Foreign citation 1068 (75%)

Annals of Library and Information Studies: An Analysis of Citation Pattern 77
ISSN : 0972-8570 VUJLIS, 18-19, 2013-14
2 Clark S & Chinburg S, Research performance in undergraduates receiving face to face versus onlinelibrary instruction: A citation analysis, Journal of Library Administration, 50 (5) (2010) 530-42.
3 Cox J E, Citation analysis of graduate dental theses references: Implications for collection development,Collection Management, 33 (3) (2008) 219-34.
4 Das A K and Sen B K, Journal of Biosciences- An analysis of citation pattern, Annals of Library andInformation Studies, 48 (2) (2001) 59-63.
5 Das P K, Journal of Informetrics: a bibliometric profile, DESIDOC Journal of Library and InformationTechnology, 33 (3) (2013) 243-52.
6 Dutta B and Sen B K, Indian Journal of Chemistry Section A- an analysis of citation pattern, Annalsof Library and Information Studies, 48 (3) (2001) 121-27.
7 Dutta B & Sen B K, Indian Journal of Pure and Applied Mathematics: an analysis of citation pattern.IASLIC Bulletin, 46 (4) (2001) 221-226.
8 Dutta B and Sen B K, The scattering of articles over a journal system as observed from the viewpoint ofBose-Einstein statistics. Annals of library and information studies 52 2 (2005): 51-55.
9 Garg K C and Kumar S, An analysis of citation patterns of Indian science journals indexed by SCIE,Annals of Library and Information Studies, 57 (4) (2010) 365-72.
10 Glassman N R & Sorensen K, Citation management, Journal of Electronic Resources in MedicalLibraries, 9 (3) (2012) 223-31.
11 Guha B, Documentation and information services, Techniques and Systems. Calcutta, The WorldPress, (1983).
12 Harisadan S and Kulshrestha V K, Citation analysis of scholarly communication in the Journal Knowl-edge Organization, Library Review, 56 (4) (2007) 299-310.
13 Helama S, A Review of Citation patterns in doctoral dissertations at the Department of Geology,University of Helsinki, Finland, since 1896, Science & Technology Libraries, 31 (2012) 180–89.
14 Koley S and Sen B K, Indian Journal of Physiology and Allied Sciences: an analysis of citation pattern,Annals of Library and Information Studies, 50 (1) (2003) 23-26.
15 Kumar S and Kumar S, Citation analysis of Journal of Oilseeds Research 1993-2004, Annals of Libraryand Information Studies, 55 (1) (2008) 35-44.
16 Levine T R, Rankings and trends in citation patterns of communication journals, CommunicationEducation, 59 (1) (2010) 41-51.
17 Maharana B, Majhi S and Sethi B B, Citation analysis of top research papers in chemistry with Specificreference to India, Library Review, 60 (6) (2011) 501-12.
18 MLS A B A, A citation analysis of three types of Ichthyologic Publications, Collection Management, 31(4) (2007) 53-75.
19 Parker K, Bauer K & Sullenger P, E-Journals and Citation Patterns, The Serials Librarian, 44 (3) (2003)209-13.
20 Rattan, G K, Self-citations in Annals of Library and Information Studies, Library Philosophy andPractice (ejournal), (2013) Paper 924, http://digitalcommons.unl.edu/libphilprac/924

78 Misra & Dutta
VUJLIS, 18-19, 2013-14 ISSN : 0972-8570
21 Reitz, Joan M. Dictionary for library and information science. Libraries Unlimited, (2004).
22 Sahu A K, Goswami N G and Chaudhury B K, Research publications of National Metallurgical Labora-tory during the year 2001-10 – a study on citation patterns, Annalsof Library and Information Stud-ies, 58 (2) (2011) 151-60.
23 Sansone R A , Leung J S & Wiederman M W, Driving citations and aggressive behavior, Traffic InjuryPrevention, 13 (3) (2012) 337-40.
24 Sharif M A and Mahmood K, How Economists cite Literature: Citation Analysis of two core PakistaniEconomic Journals, Collection Building, 23 (4) (2004) 172-76.
25 Shokeen A and Kaushik S K, Indian Journal of Plant Physiology: A Citation Analysis, Annals of Libraryand Information Studies, 51 (3) (2004) 104-07.
26 Singh N K, Sharma J and Kaur N, Citation analysis of Journal of Documentation, Webology, 8 (1),(2011) Article 86. Available at: http://www.webology.org/2011/v8n1/a86.html
27 Sinn R N, A local citation analysis of mathematical and statistical dissertations, Science & TechnologyLibraries, 25 (4) (2005) 25-37.
28 Strothmann M, Use of non-social work journals in social work research: Results of a citation analy-sis, Behavioral & Social Sciences Librarian, 29 (2010) 244-66.
29 Yeoh K H and Kaur K, Subject support in collection development: using the bibliometric tool, Collec-tion Building, 27 (4) (2008) 157-66.

Who Should Be A Librarian?Neuropsychology, Prefrontal Cortex and Aging of LIS entrants
Soumen Mallik*
1 Introduction
Librarianship is a worship to the divine of knowledge. Librarians are latent companions of knowl-edge generators in their journey of novelty. Existence of this noble profession is justified by theexhaustive use of recorded knowledge. It is a peculiar profession in the sense that librarianscannot dictate a research rather they follow its growth and direction. Moreover, the library andinformation science (LIS) professionals have no control over the generation of knowledge al-though they are questioned about the usage of collective knowledge. The analogy of libraryservices with health care services provided by nursing staff in hospitals has been mentioned verycommonly. Interestingly, librarians are always blamed for retrieval of irrelevant information andnobody care to think about the incomplete invocation of actual information required by the users.Since the user needs are dynamic so as the treatment of subjects by the LIS professionals. Suchinherent dilemma of information professional community is expected to expand its horizon. There-fore, the LIS incumbents are required to be psychologically strong for their acquaintance with theprofessional education in librarianship and also for the sustainability of their professional career.
AbstractThe solemnity of Librarianship in the divine of knowledge generation cyclehas ever acknowledged. Librarians are playing the role of priests to theknowledge era albeit unfortunate struggle for status and respect from thesociety. The entrants of the professional training experiences contradictionsin professional expectations and apathetic facilitation by both theorganizations and society. Information professionals are required to bematured human beings to overcome the professional dilemmas andsustainability of their profession career. Neuropsychological maturation hasbeen considered as crucial for the aspirants to become librarianship trainees.The results of the researches on neuropsychology, human brain developmentand educational psychology have been analyzed. This study recommendsthat the incumbents must be at least of 21 years old to become professionaltrainees in librarianship.
*Assistant Professor, Dept of Library and Information Science, Vidyasagar University
80 Mallik
VUJLIS, 18-19, 2013-14 ISSN : 0972-8570
The LIS entrants should be matured human beings to understand the professional intricacies oflibrarianship. The primary traits expected from an information professional are - a holistic attitudeto serve the intellectual thrust of users, diagnosis of information queries of users, reconciliation ofuser's unexpressed knowledge domain, and interest in cross domain intellectual activities. Toperceive these qualities, human beings are required to attain a minimum age to complete theirneuropsychological development. This article analyses the research output on the maturation ofhuman brain regions (neuropsychological development) required for understanding the issues ofprofessional intricacies in librarianship. Finally, this article attempts to suggest the minimum agefor LIS aspirants to initiate their professional training in librarianship.
2 Review of Literature
The application of modern neuroscience data in the design of educational programs has beenadvised since 1970s which was initiated by Epstein (1974a, 1986) and McCall (1988; McCallet al., 1983). The review of literature reveals that both the issues are critical in nature and estab-lishing relationships between brain and mental growth is difficult to interpret. Moreover, mostinvestigators in this area are reevaluating previously published data; there is little hope that manydesirable or critical variables were used in a single research report.
Garry and Garry (1977) evaluated the socio-economic and ideological factors influencing theLIS incumbents for their career choice in librarianship. The study was largely based on datasupplied by the Faculty of library science, University of Toronto, which revealed that the recruit-ment of the majority (more than 50%) of the entrants to the faculty of library science are in the21-24 age categories.
The results of the survey carried out by Issa and Nwalo (2008) highlights that 38.4% of the LISentrants were influenced by previous library work experience. The results concluded that theprofession remains equally popular amongst both the male LIS students (50.3%) and females(49.7%). That 46.9% of them were in the 22-26 age bracket showed that the younger under-graduates constitute the majority.
Singh and Chander (2013) reports about the predominance of female students (60.6%) overmale students (39.4%) in LIS education in India. The results of also exhibits that the huge pro-portion of respondents (88.8%) joined LIS education between the age group of 20-25, fol-lowed by only (10.8%) respondents who enter in the profession at the age of 26-30. Universitieswise analysis also shows that the respondents from all the universities joined this course at youngerage (20-25). The average means of joining to LIS education is 24.5 years.
3 Importance of Aging in LIS Education
Professional activity in librarianship emphasizes identification of knowledge domains, analysis ofinformation contents, determination of right information for right users and overall management of

Who should be A Librarian ? Neuropsychology, Prefrontal Cortex and Aging of LIS entrants 81
ISSN : 0972-8570 VUJLIS, 18-19, 2013-14
information system and centers. Moreover, the LIS incumbents are required to be receptive ofany changes in the process of knowledge generation. The knowledge generation cycle is a dy-namic process as every sphere of knowledge is ever changing. Therefore, the cognitive maturityof LIS incumbents is considered to play a crucial role in professional training of librarianship.
Historically librarianship has been found to be the least rather last career option for majority ofthe LIS entrants. Those half-hearted LIS entrants are being trained to be skilled workforce ininformation activity. They are told that the library is the heart of civilized society, academic insti-tutions etc., ironically they are also learnt that the librarians are striving for due status and respectin their workplace as well as society. The significance of budgeting methodologies in LIS curricu-lum may be lost in the era of lamenting curtail of fund in library resource building almost every-where. The dichotomy in LIS training and professional reality necessitates the psychologicalmaturity amongst the LIS incumbents to achieve the goal of professional education in librarianship.The maturity of LIS aspirants is required for understanding of their professional objectives aswell as the scope of their professional activity in the society and also to cope up with the dynam-ics of knowledge activity.
Maturity may be defined operationally as the attained level of psychological functioning beyondwhich measures of performance no longer increase significantly with age. The term maturityindicates towards the matured human brain which can perform intellectual activities significantlyin cross domain information activities (Wechsler, 1950). As conceptualized by Cauffman andSteinberg (2000), psychosocial maturity is constituted of three factors: (a) responsibility, includ-ing self-reliance, formation of identity and independence; (b) perspective, including the ability totake the point of view of others, and to analyse decisions within a broader context; and (c)temperance, which looks at ability to limit impulsiveness, and the level of evaluation of situationsbefore acting. In a study assessing psychosocial maturity and decision-making in groups of youngpeople of differing ages (school and college students, ranging in age from 12 to 48 years), Cauffmanand Steinberg found that by the age of 21 participants appeared to be more stabilized in theirjudgment, that psychosocial maturity was a better predictor than age of antisocial decision-making, and that the steepest inflection within psychosocial development occurred between theages of 16 and 19 (Bryan-Hancock & Casey, 2010).
The LIS professionals are required to be intrinsically motivated for information activities. Re-searches on career competencies of incumbents exhibit serious doubts about the motivation andthe level of knowledge and skills of students (Boutin et al, 2009, and Billett, 2009). An importantreason for these disappointing results seems to be the fact that most students fail to develop aclear career wish (let alone a career identity) during their time at school (Geurts & Meijers,2009). Lack of intrinsic motivation (Plane, 2009) results in students making rather random ca-reer choices, and this, in turn, prevents in building of successful professional career.
82 Mallik
VUJLIS, 18-19, 2013-14 ISSN : 0972-8570
In Western nations, career guidance in education is primarily based on the trait-and-factor ap-proach (European Commission and OECD, 2004; Sultana, 2004; Irving & Malik, 2005; Watts& Sultana, 2004). In this approach which through the work of Holland (1973, 1985) had a hugeinfluence on the shape and content of career guidance and counselling in education, the concepts'informed choice' and 'decision making' are key. In this model, a good career choice is madewhen the personality and the talents of a potential employee match with the required knowledgeand skills of the job in question. Therefore, counsellors and teachers should provide studentswith reliable information about their talents and with information about the knowledge and skillsthat are needed to carry out particular jobs. The idea here is that students can then make rationalchoices regarding their careers (Kuijpers, Meijers & Gundy, 2011).
The limitations of this model are also evident. One's career path has become more and moreunpredictable, and therefore, it is increasingly difficult to make rational and information-basedcareer choices (Mitchell, Levin & Krumboltz, 1999; Guindon & Hanna, 2002). The idea thatstudents even have the cognitive ability to make rational career choices is also being challenged.Simon (1983) observed that people were not able to make rational decisions because they donot have all the facts, do not have a consistent value system, and, furthermore, do not possesssufficient reasoning skills. Humans have a 'bounded rationality'(when individuals make decisions,their rationality is limited by the information they have, the cognitive limitations of their minds, andthe time available to make the decision) that basically only allows them to engage in 'irrationalbehaviour'(an action or opinion given through inadequate use of reason, emotional distress, orcognitive deficiency) (Tersky & Kahneman, 2000). Youths, in particular, are only capable of ashort-term perspective; they only concentrate on one problem at a time (Coleman, 1989). Neu-rological and neuropsychological research explains this 'bounded rationality' among youths existsbecause their prefrontal cortex (part of the brain responsible for choice-making) only developsfully between age 20 and 30 years (Gladwell, 2006). Therefore, young people when faced withcomplex situations will, generally, jump to conclusions (Stuss & Anderson, 2003; Schwartz,2004).
4 Biology of Human Brain
The National Institute of Neurological Disorders and Stroke provides detailed description aboutthe structure of brain. The brain is the most complex part of the human body. This three-poundorgan is the seat of intelligence, interpreter of the senses, initiator of body movement, and con-troller of behavior. Lying in its bony shell and washed by protective fluid, the brain is the sourceof all the qualities that define our humanity.
The brain is like a committee of experts. The brain processes involved in mental function arecomposed of large anatomical regions that are organized hierarchically into executive, cross-
Who should be A Librarian ? Neuropsychology, Prefrontal Cortex and Aging of LIS entrants 83
ISSN : 0972-8570 VUJLIS, 18-19, 2013-14
modal, perceptual, and imaging functions. All the parts of the brain work together, but each parthas its own special properties. The brain can be divided into three basic units: the forebrain, themidbrain, and the hindbrain.
4.1 Hindbrain - It includes the upper part of the spinal cord, the brain stem, and a wrinkledball of tissue called the cerebellum. The hindbrain controls the body's vital functions such asrespiration and heart rate. The cerebellum coordinates movement and it is involved in learnedrote movements for example performing art or playing games.
4.2 Midbrain - This is the uppermost part of the brainstem which controls some reflexactions and it is the part of the circuit that involved in the control of eye movements and othervoluntary movements.
4.3 Forebrain - The forebrain is the largest and most highly developed part of the humanbrain: it consists primarily of the cerebrum and the structures hidden beneath it. The cerebrum sitsat the topmost part of the brain and it is the source of intellectual activities. It holds memorieswhich allow to plan, enables to imagine and think.
4.4 Cerebral Cortex - The cortex originates from the Latin word for bark and it is thecoating to the surface of the cerebrum. The cerebellum is a vital layer of tissues which coordi-nates and regulates muscular activity. Most of the actual information processing in the brain takesplace in the cerebral cortex. The cerebral cortex is popularly known as "gray matter" (GM). Thecortex is gray because nerves in this area lack the insulation that makes most other parts of thebrain appear to be white. The folds in the brain add to its surface area and therefore increase theamount of gray matter and the quantity of information that can be processed.
The nervous system is the decision and communication center of human body. The central ner-vous system (CNS) is made of the brain and the spinal cord. The peripheral nervous system(PNS) is made of nerves. Together they control every part of living body. Sensory nerves gatherinformation from the environment, send that information to the spinal cord, which then speed themessage to the brain. The brain then makes sense of that message and fires off a response.Motor neurons deliver the instructions from the brain to the rest of the body. The spinal cord ismade of a bundle of nerves running up and down the spine, which resemblances a superhighway,speeding messages to and from the brain at every second.
4.5 The Inner Brain
The structures that lie deep within the brain, hidden from view, are the gatekeepers between thespinal cord and the cerebral hemispheres. These structures determines emotional state of indi-viduals and most importantly they modify human perceptions and responses depending on thatstate, and accordingly allows to initiate necessary movements. Like the lobes in the cerebral

84 Mallik
VUJLIS, 18-19, 2013-14 ISSN : 0972-8570
hemispheres, these structures also visible in pairs i.e., each is duplicated in the opposite half ofthe brain.
4.6 Hypothalamus
This is about the size of a pearl that directs a multitude of important functions. It is also animportant emotional center, controlling the molecules responsible to feel exhilarated, angry, orunhappy.
4.7 Thalamus
The thalamus seats near the hypothalamus and it is a major clearinghouse for information going toand from the spinal cord and the cerebrum.
4.8 Nervous System
The brain and the rest of the nervous system are composed of many different types of cells, butthe primary functional unit is a cell called the neuron. All sensations, movements, thoughts, memo-ries, and feelings are the result of signals that pass through neurons. Neurons consist of threeparts namely- The cell body, Dendrites and axons.
4.8.1 The cell body - contains the nucleus, where most of the molecules that the neuron needsto survive and function are manufactured.
4.8.2 Dendrites - extend out from the cell body like the branches of a tree and receive mes-sages from other nerve cells.
4.8.3 Axons - Signals then pass from the dendrites through the cell body and may travel awayfrom the cell body down an axon to another neuron, a muscle cell, or cells in some other organ.The neuron is usually surrounded by many support cells. Some types of cells wrap around theaxon to form an insulating sheath. This sheath can include a fatty molecule called myelin, whichprovides insulation for the axon and helps nerve signals travel faster and farther. Axons may bevery short, such as those that carry signals from one cell in the cortex to another cell less than ahair's width away. Or axons may be very long, such as those that carry messages from the brainall the way down the spinal cord.
Scientists have learned a great deal about neurons by studying the synapse-the place where asignal passes from the neuron to another cell. When the signal reaches the end of the axon itstimulates the release of tiny sacs. These sacs release chemicals known as neurotransmitters intothe synapse. The neurotransmitters cross the synapse and attach to receptors on the neighboringcell. These receptors can change the properties of the receiving cell. If the receiving cell is also aneuron, the signal can continue the transmission to the next cell.
Who should be A Librarian ? Neuropsychology, Prefrontal Cortex and Aging of LIS entrants 85
ISSN : 0972-8570 VUJLIS, 18-19, 2013-14
4.9 Thinking Process
Each cerebral hemisphere can be divided into sections, or lobes, each of which specializes indifferent functions. The cerebral hemispheres comprises of two frontal lobes are situated behindthe forehead. Both of these two lobes help to plan, imagine and making argument. The frontallobes seems to be acting as short-term storage sites and thereby allowing one idea to be kept inmind while other ideas are considered. In the rearmost portion of each frontal lobe is a motorarea which helps control voluntary movement. A nearby place on the left frontal lobe calledBroca's area which allows thoughts to be transformed into words.
5. Maturation of Human Brain
The advances in imaging techniques revealed a great deal about the development of the livinghuman brain. Researches using magnetic resonance imaging (MRI) to acquire structural imagesacross the lifespan has revealed that the human brain continues to develop for many decades(Shaw et al., 2008). A number of studies have suggested that cerebral and cognitive maturationare intimately correlated. Rates of cerebral maturation have been estimated from cross-sectionalstudies of skull size, the electroencephalogram, cortical thickness, cortical volume, and nerve celldensities (Epstein, 1974a, 1974b, 1980, 1986; Hudspeth, 1985; Hudspeth, & Pribram 1990;Hudspeth & Thatcher, 1987; Thatcher, 1990; Thatcher, Giudice, & Walker, 1987). This diverseset of measurements provides consistent evidence that cerebral maturation proceeds in a discon-tinuous manner, characterized by spurts and plateaus.
The detailed pattern of neuropsychological maturation has been described by Hudspeth, Pribramand Thatcher (Hudspeth 1985; Hudspeth & Pribram, 1990; Hudspeth & Thatcher, 1987). Theiranalysis showed that brain maturation exhibits five cycles (i.e., spurts and plateaus) over the first21 years of postnatal development and that the temporal sequence of maturation in specificregions of the brain is consistent with cognitive development as outlined in the work of Piaget andInhelder (Inhelder & Piaget, 1958; Piaget, 1950, 1971).
Before the advent of MRI, scientists already knew a lot about the brain functioning. When peoplesuffered brain damage or injury to particular parts of the brain, scientists could see what functionswere impaired, and infer that the injured areas governed those functions. For example, peoplewho had strokes in the area of the brain affecting speech lost the ability to speak. Autopsiesshowed when particular parts of the brain matured, the connections were wrapped in whitematter, or myelin.
The structural and functional MRI (sMRI and fMRI respectively) have revolutionized the humanbrain developments. Age-associated region-specific, linear and non-linear changes in white mat-ter tracts (Giedd et al., 1999; Lebel and Beaulieu, 2011; Ostby et al., 2009; Paus et al., 1999)and cortical grey matter (volume, density, and thickness) (Ostby et al., 2009; Paus, 2005; Shaw

86 Mallik
VUJLIS, 18-19, 2013-14 ISSN : 0972-8570
et al., 2008; Tamnes et al., 2010) have been described in structural MRI studies. The results ofthe studies on structural and functional changes in the developing human have been summarizedas follows:
A. The first ever human brain structure is formed in the third week of the gestation (while theembryo is in the mother's womb) (Ladher & Schoenwolf, 2005). At week 4 of gestation, therostral (anterior or ventral) portion of the neural tube forms three vesicles that are destined to bethe forebrain, the midbrain, and the hindbrain (Jessell & Sanes, 2000; Rash and Grove, 2006b;Rhinn et al, 2006; Stern, 2001). The rostral-most prosencephalic (forebrain) vesicle then formstwo vesicles that are destined to become the telencephalon (cerebral cortex) and the diencepha-lon (thalamus, hypothalamus, and other structures).
Maturation patterns over the first decade of life (1-10'/2 years) were synchronized across allbrain regions. Beginning with the stirrings of puberty, maturation in the temporal, central, andfrontal regions of the human brain shows different onsets and offsets of rapid change. The humanbrain maturation during this period was observed in the following brain regions namely parieto-occipital, temporo-temporal, and central regions between 13 and 17 years of age, although thepeaks of maximum change are separated by approximately 1-year intervals. The results of all theresearches excerpts that the postpubertal maturation proceeds from the posterior to the frontalareas of the brain (Hudspeth & Pribram, 1990).
One of the most consistent findings from MRI studies is that there is a steady increase in whitematter volume in several brain regions during childhood and adolescence. An early developmen-tal MRI study revealed differences in the density of white and grey matter between the brains ofa group of children (average age 9 years) and a group of adolescents (average age 14 years;Sowell et al., 1999). The results showed adolescents had a higher volume of white matter and alower volume of grey matter in the frontal cortex and parietal cortex compared with the youngergroup. Increased white matter and decreased grey matter density in the frontal and parietalcortices during adolescence is a finding that has been corroborated by several studies carried outby a number of different research groups with increasingly large numbers of subjects (Barnea-Goraly et al., 2005; Giedd et al., 1996, 1999; Paus et al., 1999; Pfefferbaum et al., 1994; Reisset al., 1996; Sowell et al., 1999). The adolescent brain development is characterized by com-paratively late maturation of the frontal lobes (Park A, Wallis C & Dell K., 2008), althoughenhanced synaptic connectivity is evident during this part of life. The cortical areas of the braincontinue to thicken as neural connections proliferate throughout the childhood which continuestill the adolescence. The gray matter volume in the frontal cortex reaches its peak at approxi-mately 11 years of age in girls and 12 years of age in boys which reflects the dendritic overpro-duction (Lenroot & Giedd, 2006). There are rarely used synaptic connections which are selec-tively pruned (Giedd, 2008) and subsequently makes the brain more efficient by allowing it tochange structurally in response to the demands of the environment (Spear ,2000). Pruning also

Who should be A Librarian ? Neuropsychology, Prefrontal Cortex and Aging of LIS entrants 87
ISSN : 0972-8570 VUJLIS, 18-19, 2013-14
results in increased specialization of brain regions (Casey et al., 1997); however, the loss of graymatter that accompanies pruning may not be apparent in some parts of the brain until youngadulthood (Sowell et al., 1999, Rubia et al., 2000 & Sowell, et al., 2003). In general, loss ofgray matter progresses from the back to the front of the brain with the frontal lobes among thelast to show these structural changes (Sowell, et al., 2001, Giedd,. 2008).
The pioneering developmental MRI study, emanating from the National Institute of Mental Healthpaediatric neuroimaging project, Giedd et al. (1999) performed longitudinal MRI scans on healthyparticipants ranging in age from about four to 22 years. Scans were obtained from each partici-pant at two-year intervals. The results show that the volume of grey matter in the frontal lobeincreased during late childhood and early adolescence with a peak occurring at around 12 years.This was followed by a decline during adolescence. Similarly, parietal-lobe grey matter volumeincreased during childhood to a peak at around 12, followed by decline during adolescence.Grey matter development in the temporal lobes was also non-linear, but the peak was reachedlater at about 17 years. In another longitudinal study by the same group, participants aged be-tween 4 and 21 were scanned every two years for 8 to 10 years (Gogtay et al., 2004). In termsof cortical grey matter density, sensory and motor brain regions matured earliest, followed by theremainder of the cortex, which matured (in terms of grey matter loss) from posterior to anteriorregions. This loss of grey matter occurred last in the superior temporal cortex. A later studyanalysed cortical thickness and investigated the age of at which peak cortical thickness wasreached, and again showed earlier maturation in sensory and motor regions and later maturationin parts of the frontal and temporal lobes (Shaw et al., 2008).
Gray matter is made up of the cell bodies of neurons, the nerve fibers that project from them, andsupport cells. One of the features of the brain's growth in early life is that there is an earlyblooming of synapses (the connections between brain cells or neurons) followed by pruning asthe brain matures. Synapses are the relays over which neurons communicate with each other andare the basis of the working circuitry of the brain. Already more numerous than an adult's at birth,synapses multiply rapidly in the first months of life. In a baby, the brain over-produces brain cells(neurons) and connections between brain cells (synapses) and then starts pruning them backaround the age of three. The process is much like the pruning of a tree. By cutting back weakbranches, others flourish.
Neural connections that survive the pruning process become more adept at transmitting informa-tion through myelination. Myelin, a sheath of fatty cell material wrapped around neuronal axons,acts as "insulation" for neural connections. This allows nerve impulses to travel throughout thebrain more quickly and efficiently and facilitates increased integration of brain activity (AndersonP., 2002). Although myelin cannot be measured directly, it is inferred from volumes of cerebralwhite matter (Paus, 2001). Evidence suggests that, in the prefrontal cortex, this does not occuruntil the early 20s or later (Rubia, 2000, Sowell, 2003).

88 Mallik
VUJLIS, 18-19, 2013-14 ISSN : 0972-8570
5.1 Pre Frontal Cortex (PFC)
Although there is no universally acceptable definition of the PFC, the Merriam Webster Dictio-nary defines it as "the gray matter of the anterior part of the frontal lobe that is highly developedin humans and plays a role in the regulation of complex cognitive, emotional, and behavioralfunctioning". The PFC may be regarded to be the region of the cortex that receives its principalthalamic inputs from the mediodorsal nucleus of the thalamus (Kolb,2006). This cortical region islocated somewhere at the anterior end of the cerebral hemispheres and refers not to a singleregion but to a group of related regions. Pandya and Yeterian (Pandya, 1985) proposed that theexpansion of PFC subareas is correlated directly to the expansion of the sensory areas. Theimplication from this conclusion is that the PFC must have some function in the integration ofsensory information from different modalities, and as more information is processed, the PFCmust have enlarged.
The PFC supports cognitive functions that are necessary to organize behavior in time and incontext, i.e., social behavior. The PFC controls concentration and attention which helps in ex-ecutive function. The most important function of PFC is considered to be the novelty detection(Shimamura , Janowsky & Squire, 1990) and decision making (Shimamura, 1995a; Shimamura,Jurica, Mangels, Gershberg & Knight, 1995b), therefore, the developed and healthy PFC isrequired by an LIS aspirant for a successful professional career. Similar to the role the PFC playsin regulating the interaction with the external world, this region is crucial for attention to andinhibitory control of internal mental representations engaged during working memory, employ-ment of strategies, planning and decision-making (Knight et. al., 1999)
The prefrontal cortex coordinates higher-order cognitive processes and executive functioning.Executive functions are a set of supervisory cognitive skills needed for goal-directed behavior,including planning, response inhibition, working memory, and attention (Anderson , 2001). Theseskills allow an individual to pause long enough to take stock of a situation, assess his or heroptions, plan a course of action, and execute it. Poor executive functioning leads to difficulty withplanning, attention, using feedback, and mental inflexibility (Anderson, 2001), all of which couldundermine judgment and decision making.
6 Recommendation
Considering the age specific selective pruning of synaptic connections, linear and non-lineardevelopment of brain regions this is evident that 20- 21 years of age is the most crucial forneuropsychological maturation. Apart from the completion of pruning and myelination, the pre-frontal cortex also started to be mature by this age. Therefore, this study recommends that theminimum age for LIS entrants should be 21 years.
Who should be A Librarian ? Neuropsychology, Prefrontal Cortex and Aging of LIS entrants 89
ISSN : 0972-8570 VUJLIS, 18-19, 2013-14
7 Conclusion
The foregoing results of human brain researches are indicative of the fact that a teen brain iscapable of reasoning like an adult, but the emotions and impulses makes a difference in decisionmaking (mental task) as the prefrontal cortex is a little immature in teenagers as compared toadults. In terms of sheer intellectual power, the brain of an adolescent is a match for an adult's.The capacity of a person to learn will never be greater than during adolescence. At the sametime, behavioral tests, sometimes combined with functional brain imaging, suggest differences inhow adolescents and adults carry out mental tasks. Adolescents and adults seem to engagedifferent parts of the brain to different extents during tests requiring calculation and impulse con-trol, or in reaction to emotional content. Three basic steps of neuromaturation namely - synapticoverproduction, pruning and myelination has been found to be responsible for improvement ofthe brain's ability to transfer information between different regions efficiently. This informationintegration undergirds the development of skills such as impulse control (Luna et al. 2001).Although young children can demonstrate impulse control skills, with age and neuromaturation(e.g., pruning and myelination) comes the ability to consistently use these skills. (Luna & Sweeney2004).
The training in LIS is more than sheer knowledge of organization of documents or application ofinformation communication technology, beyond which is the attitude to serve selflessly, self-realization as a devotee to the divine of knowledge and an urge for betterment of practice andservices. Here comes the significance of PFC maturation and considering a minimum age of 21years for initiation of LIS education.
References
1. Anderson, V.A., Anderson, P., Northam, E., et al. (2001). Development of executive functions throughlate childhood and adolescence in an Australian sample. Developmental Neuropsychology,20,385-406
2. Anderson, P. (2002). Assessment and development of executive function (EF) during childhood.Neuropsychology, Development, and Cognition. Section C, Child Neuropsychology, 8, 71-82.
3. Arthur, M. B., Khapova, S. N., & Wilderom, C. P. (2005). Career success in a boundaryless career world.Journal of Organizational Behavior, 26(2), 177-202.
4. Bailey, T. R., Hughes, K. L., & Moore, D. T. (2004). Working knowledge. Work-based learning andeducation reform. New York: RoutledgeFarmer.
5. Barnea-Goraly, N., Menon, V., Eckert, M., Tamm, L., Bammer, R., Karchemskiy, A., Dant, C.C., Reiss, A.L.(2005). White matter development during childhood and adolescence: a cross-sectional diffusion ten-sor imaging study. Cerebral Cortex, 15 (12),1848-1854.
6. Belzer, J., & Brown, J. W. (1973). Needs for improvement of professional education in library andinformation science. http://files.eric.ed.gov/fulltext/ED087479.pdf

90 Mallik
VUJLIS, 18-19, 2013-14 ISSN : 0972-8570
7. Billett, S. (2009). Changing work, work practice: Consequences for vocational education. In R. Maclean& D. N. Wilson (Eds.), International handbook of education for the changing world of work. Bridgingacademic and vocational learning (pp. 175–189). New York: Springer.
8. Boutin, F., Chinien, C., Moratis, L., & Van Baalen, P. (2009). Overview: Changing economic environmentand workplace requirements: Implications for reengineering TVET for prosperity. In R. Maclean & D. N.Wilson (Eds.), International handbook of education for the changing world of work. Bridging aca-demic and vocational learning (pp. 81–97). New York: Springer.
9. Bryan-Hancock, C., & Casey, S. (2010). Psychological maturity of at-risk juveniles, young adults andadults: Implications for the justice system. Psychiatry, Psychology and Law, 17(1), 57-69.
10. Casey, B.J., Trainor, R.J., Orendi, J.L., et al. (1997). A developmental functional MRI study of prefrontalactivation during performance of a Go-No-Go task. Journal of Cognitive Neuroscience, 9, 835-47.
11. Coleman, J. C. (1989). The focal theory of adolescence: A psychological perspective. In K. Hurrelmann& U. Engel (Eds.), The social world of adolescents; International perspectives (pp. 43–56). New York/Berlin: De Gruyter.
12. Company, F. J. (2009). Vocational guidance and career counselling in the European Union: Origins andrecent trends. In R. Maclean & D. N. Wilson (Eds.), International handbook of education for thechanging world of work. Bridging academic and vocational learning (pp. 2313–2329). New York:Springer.
13. Epstein, H. T. (1974a). Phrenoblysis: Special brain and mind growth periods. I. Human brain and skulldevelopment. Developmental Psychobiology, 7, 207-216
14. Epstein, H. T. (1974b). Phrenoblysis: Special brain and mind growth periods. 11. Human mental develop-ment. Developmental Psychobiology, 7, 217-224
15. Epstein, H. T. (1980). EEG developmental stages. Developmental Psychobiology, 13, 629-63.
16. Epstein, H. T. (1986). Stages in human development. Developmental Brain Research, 30, 114-119.
17. Geurts, J., & Meijers, F. (2009). Vocational education in The Netherlands: In search of a new identity. InR. Maclean & D. N. Wilson (Eds.), International handbook of education for the changing world ofwork. Bridging academic and vocational learning (pp. 483–499). New York: Springer.
18. Giedd, J.N. (2008). The teen brain: Insights from neuroimaging. Journal of Adolescent Health,42, 335 – 43.
19. Giedd, J.N., Blumenthal, J., Jeffries, N.O., Castellanos, F.X., Liu, H., et al. (1999). Brain developmentduring childhood and adolescence: a longitudinal MRI study. Nature Neuroscience, 2(10), 861-863.
20. Giedd, J.N., Snell, J.W., Lange, N., Rajapakse, J.C., Casey, B.J., et al. (1996). Quantitative magneticresonance imaging of human brain development: ages 4-18. Cerebral Cortex, 6(4), 551-560.
21. Gladwell, M. (2006). Blink: The power of thinking without thinking. New York, NY: Little, Brown &Company.
22. Gogtay, N., Giedd, J.N., Lusk, L., Hayashi, K.M., Greenstein, D., et al. (2004). Dynamic mapping of humancortical development during childhood through early adulthood. Proceedings of the National Acad-emy of Sciences of the United States of America,101(21), 8174-8179.
Who should be A Librarian ? Neuropsychology, Prefrontal Cortex and Aging of LIS entrants 91
ISSN : 0972-8570 VUJLIS, 18-19, 2013-14
23. Guindon, M. H., & Hanna, F. J. (2002). Coincidence, happenstance, serendipity, fate, or the hand of god:Case studies in synchronicity. Career Development Quarterly, 50(3), 195 – 208.
24. Holland, J. L. (1973). Making vocational choices: A theory of careers. Englewood Cliffs, NJ: Prentice-Hall.
25. Holland, J. L. (1985). Making vocational choices: A theory of vocational personalities and workenvironments, 2nd ed. Englewood Cliffs, NJ: Prentice Hall.
26. http://www.merriam-webster.com/dictionary/prefrontal%20cortex
27. http://www.nimh.nih.gov/health/publications/the-teen-brain-still-under-construction/index.shtml dated17.01.2015
28. http://www.ninds.nih.gov/disorders/brain_basics/know_your_brain.htm dated 29.11.2014
29. Hudspeth, W. J. (1985). Developmental neuropsychology: Functional implications of quantitative EEGmaturation [Summary]. Journal of Clinical and Experimental Neuropsychology, 7, 606
30. Hudspeth, W. J., & Pribram, K. H. (1990). Stages of brain and cognitive maturation. Journal ofEducational Psychology,82(4), 881-884
31. Hudspeth, W. J., & Thatcher, R. W. (1987, April) Functional Neuroscience: Neurophysiological Corre-lates of Piagetian Maturation. Symposium conducted at the Western Psychological Association, LongBeach.
32. Inhelder, B., & Piaget, J. (1958). The growth of logical thinking. London: Routledge & Kegan Paul.
33. Irving, B. A. & Malik, B. (Eds.). (2005). Critical reflections on career education and guidance: Promot-ing social justice within a global economy. London & New York: RoutledgeFarmer.
34. Jessell, T.M., Sanes, J.R. (2000). Development. The decade of the developing brain. Current Opinion inNeurobiology, 10, 599–611.
35. Knight, R.T., Staines, W. R., Swick, D., Chao, L. L. (1999). Prefrontal cortex regulates inhibition andexcitation in distributed neural networks. Acta Psychologica, 101,159-178.
36. Kolb B. Do all mammals have a prefrontal cortex? In: J. Kaas (Ed.), Evolution of Nervous Systems: AComprehensive Reference. Vol 3. New York: Elsevier; 2006. pp. 443-450.
37. Kotulak, R. Teens driven to distraction. (March 24, 2006). Chicago Tribune.
38. Kuijpers, M., Meijers, F., Gundy, C. (2011).The relationship between learning environment and careercompetencies of students in vocational education. Journal of Vocational Behavior,78, 21-30.
39. Ladher, R, Schoenwolf, G.C. (2005). Making a neural tube: neural tube induction and neurrulation. In:S.R.Mahendra, M. Jacobson (Eds). Developmental Neurobiology, 4th edn. Kluwer Academic/PlenumPublishing: New York. pp 1-20
40. Lebel, C., Beaulieu, C. (2011). Longitudinal development of human brain wiring continues from child-hood into adulthood. Journal of Neuroscience, 31(30), 10937-10947.
41. Lenroot, R.K., Giedd, J.N. (2006). Brain development in children and adolescents: Insights from anatomi-cal magnetic resonance imaging. Neuroscience & Biobehavioral Reviews,30:718-29
42. Luna, B., Sweeney, J.A. (2004). The emergence of collaborative brain function: FMRI studies of thedevelopment of response inhibition. Annals of the New York Academy of Sciences,1021:296-309.

92 Mallik
VUJLIS, 18-19, 2013-14 ISSN : 0972-8570
43. Luna, B., Thulborn, K.R., Munoz, D.P., et al. (2001). Maturation of widely distributed brain functionsubserves cognitive development. NeuroImage, 13:786-93.
44. Luthmann, A .( 2007). Librarians, professionalism and image: stereotype and reality. Library Review,56(9), 773-780. doi 10.1108/00242530710831202
45. Meijers, F. (2008). Mentoring in Dutch vocational education: an unfulfilled promise. British Journal ofGuidance and Counselling, 36(3), 235?252.
46. Mitchell, K. E., Levin, A. S., & Krumboltz, J. D. (1999). Planned happenstance: Constructing unexpectedcareer opportunities. Journal of Counselling and Development, 77, 115?124.
47. OECD & European Commission (2004). Career guidance: A policy handbook. Paris & Luxembourg:OECD & European Commission Publication.
48. Ostby, Y., Tamnes, C.K., Fjell, A.M., Westlye, L.T., Due-Tonnessen, P., et al. (2009). Heterogeneity insubcortical brain development: a structural magnetic resonance imaging study of brain maturation from8 to 30 years. Journal of Neuroscience, 29(38), 11772-11782.
49. Pandya, D.N., Yeterian, E.H. (1985). Architecture and connections of cortical association areas. In: A.Peters, E. G. Jones (Eds). Cerebral Cortex, 4,3-61. New York: Plenum.
50. Park, A., Wallis, C., Dell, K. (2004, May 10). What makes teens tick. Time Magazine.
51. Paus, T., Collins, D.L., Evans, A.C., et al. (2001). Maturation of white matter in the human brain: A reviewof magnetic resonance studies. Brain Research Bulletin, 54:255-66.
52. Paus, T., (2005). Mapping brain maturation and cognitive development during adolescence. Trends inCognitive Sciences, 9, 60-68.
53. Paus, T., Zijdenbos, A., Worsley, K., Collins, D.L., Blumenthal, J., et al. (1999). Structural maturation ofneural pathways in children and adolescents: in vivo study. Science 283, 1908-1911.
54. Pfefferbaum, A., Mathalon, D.H., Sullivan, E.V., Rawles, J.M., Zipursky, R.B., et al. (1994). A quantitativemagnetic-resonance-imaging study of changes in brain morphology from infancy to late adulthood.Archives of Neurology, 51 (9), 874-887.
55. Piaget, J. (1950). The psychology of intelligence. M. Piercy, & D. E. Berlyne, (Trans.). London: KeganPaul, Trench, & Trubner.
56. Piaget, J. (1971). Biology of knowledge. Chicago, IL: University of Chicago.
57. Plane, K. (2009). Overview: TVET for youth. In R. Maclean & D. N. Wilson (Eds.), Internationalhandbook of education for the changing world of work. Bridging academic and vocational learning(pp. 2197–2211). New York: Springer.
58. Rash, B.G., Grove, E.A. (2006a). Area and layer patterning in the developing cerebral cortex. CurrentOpinion in Neurobiology, 16, 25-34.
59. Reiss, A.L., Abrams, M.T., Singer, H.S., Ross, J.L., Denckla, M.B. (1996). Brain development, gender andIQ in children - a volumetric imaging study. Brain, 119, 1763-1774.
60. Rhinn, M., Picker, A., Brand, M. (2006). Global and local mechanisms of forebrain and midbrainpatterning. Current Opinion in Neurobiology,16, 5-12.
61. Rubia, K., Overmeyer, S., Taylor, E., et al. (2000). Functional frontalisation with age: Mappingneurodevelopmental trajectories with fMRI. Neuroscience & Biobehavioral Reviews, 24,13-9.

Who should be A Librarian ? Neuropsychology, Prefrontal Cortex and Aging of LIS entrants 93
ISSN : 0972-8570 VUJLIS, 18-19, 2013-14
63. Shaw, P., Kabani, N.J., Lerch, J.P., Eckstrand, K., Lenroot, R.et al. (2008). Neurodevelopmentaltrajectories of the human cerebral cortex. Journal of Neuroscience, 28 (14), 3586-3594.
64. Shimamura , A. P., Jurica, P. J., Mangels, J. A., Gershberg, F. B., & Knight, R. T. (1995b). Susceptibility tomemory interference effects following frontal lobe damage findings from tests of paired-associatedlearning. Journal of Cognitive Neuroscience, 7, 144-152.
65. Shimamura, A. P., Janowsky, J. S., & Squire, L. R. (1990). Memory for the temporal order of events inpatients with frontal lobe lesions and amnesic patients. Neuropsychologia, 28(8), 803-813.
66. Shimamura, A.P. (1995a). Memory and the frontal lobe. In M. Gazzaniga, The cognitive neuroscien ces(pp. 803-813). Boston: MIT Press.
67. Simon, H. A. (1983). Reason in human affairs. Oxford: Basil Blackwell.68. Sowell, E.R., Petersen, B.S., Thompson, P.M., et al. (2003). Mapping cortical change across the human
life span. Nature Neuroscience, 6(3), 309-15.69. Sowell, E.R., Thompson, P.M., Holmes, C.J., et al. (1999). In vivo evidence for post-adolescent brain
maturation in frontal and striatal regions. Nature Neuroscience, 2(10), 859-61.70. Sowell, E.R., Thompson, P.M., Tessner, K.D., et al. (2001). Mapping continued brain growth and gray
matter density reduction in dorsal frontal cortex: Inverse relationships during post adolescent brainmaturation. Journal of Neuroscience, 21,8 819-29.
71. Sowell, E. R., Thompson, P. M., Holmes, C. J., Batth, R., Jernigan, T. L., & Toga, A. W. (1999). Localizingage-related changes in brain structure between childhood and adolescence using statistical parametricmapping. Neuroimage, 9(6), 587-597.
72. Spear, L.P. (2000). The adolescent brain and age-related behavioral manifestations. Neuroscience &Biobehavioral Reviews, 24, 417-63.
73. Spinks, S. Adolescent brains are a work in progress - here's why. http://www.pbs.org/wgbh/pages/frontline/shows/teenbrain/work/adolescent.html
74. Stern, C.D. (2001). Initial patterning of the central nervous system: how many organizers? NatureReviews Neuroscienc, 2: 92-98.
75. Stuss, D. T., & Anderson, V. (2003). The frontal lobes and theory of mind: Developmental concepts fromadult focal lesion research. Brain and Cognition, 55, 69?83.
76. Sultana, R. G. (2004). Guidance policies in the learning society: Trends, challenges and responsesacross Europe. Thessaloniki, Greece: Cedefop.
77. Tamnes, C.K., Ostby, Y., Fjell, A.M., Westlye, L.T., Due-Tønnessen, P., et al. (2010). Brain maturation inadolescence and young adulthood: regional agerelated changes in cortical thickness and white mattervolume and microstructure. Cerebral Cortex, 20(3), 534-548.
78. Tau, G. Z., & Peterson, B. S. (2010). Normal development of brain circuits. Neuropsychopharmacology,35(1), 147-168.
79. Tersky, A., & Kahneman, D. (2000). Choices, values, and frames. New York: Cambridge UniversityPress.
80. Thatcher, R. W. (1990, June). Nonlinear dynamics of human cerebral development. Paper presented atthe International Conference on Machinery of the Mind, Havana, Cuba.
81. Thatcher, R. W., Giudice, S., & Walker, R. A. (1987). Human cerebral hemispheres develop at differentrates and ages. Science, 236, 1110-1113.
82. Watts, A. G., & Sultana, R. G. (2004). Career guidance policies in 37 countries: Contrasts and commonthemes. International Journal for Educational and Vocational Guidance, 4, 105–122.
83. Wechsler, D. (1950). Intellectual development and psychological maturity. Child Development,21(1),45 – 50.

Visual Representation of Information and Modern LibrariesAnila Sulochana*
Devika P Madalli** Durga Sankar Rath***
1 Introduction
Information is an inevitable part of our daily life. We seek information in varied ways from mul-tiple sources. The huge amount of information in disparate formats, contents and structure re-quire more time and cognitive power to analyse and access the relevant part. As informationbecomes richer and complex there is a need for alternative ways to organise and representinformation. Information visualisation is one technique to visually represent the information. Thevisual metaphors are capable of representing cognitive relationships.
There are several information organisation and representation systems which have been used bythe conventional libraries. Traditional knowledge organisation system such as classification helpsto achieve a browsing pattern on library shelves. Through catalogue we provide multiple accesspoints to the collection. Classification and cataloguing together give user a multi dimensional viewof the collection. Libraries all over the world have been using different methods such as classifi-
AbstractContemporary libraries are hybrid environment with physical space, objectsand access to a digital resources. Library collections are either owned bylibraries, having conditional accesses; or resources which are freely available.Libraries also dealing with user generated contents through tagging ofresources, community blogs etc. Information communication technology (ICT)has revolutionized library services i.e., card catalogue to OPAC, CAS and SDIinto e-mail based or RSS based services and also online reference services.Visualization techniques are implanted by the libraries for better data analysisand decision making. Libraries needs user interface which is compatible withdifferent personal digital device such as smart phones and also a differentinterface to larger screens such as touch screens etc. This article discussabout the importance of visual representation of data in technology basedlibrary activities and services.
*Associate Professor, DRTC, ISI, Bangalore**Research Assistant, DRTC, ISI, Bangalore*** Professor, Dept of Library and Information Science, Vidyasagr University

Visual Representation of Information and Modern Libraries 95
ISSN : 0972-8570 VUJLIS, 18-19, 2013-14
cation schemes, citation analysis etc. to map the underlying relationships among the informationresources.
Libraries are keen adapt new technologies and we have enough evidences to prove that. Thereis a paradigm shift from card catalogue to OPAC , traditional way of CAS and SDI to e-mailbased or RSS based services and also online reference services. Digital availability of variousresources enhances the shift towards digital libraries and more services based on digital plat-forms. We have innovative technologies that offer access to information and resources. In caseof traditional library the visibility of sources as physical objects play as well as face to faceinteraction with people plays a major role in various library services. Libraries are no more astandalone building with a collection of few books and journals. Libraries are hubs in a knowl-edge network providing access to an enormous collection of information through various ser-vices. The users are equipped with sophisticated tools to seek information. Libraries have toadopt innovative methods to present its collection and services to the users.
2 New Generation Libraries
Libraries are hybrid environment with physical space, physical objects and access to a numberof resources and services which are digital in nature. Libraries have their presence in multiplespaces; it can be a physical library, digital collections through digital library, a representation ofphysical library as library OPACS on the web and also a complete representation on virtualworld. Collection of a library is also disparate in nature; it can have physical collection of differentresources, collection of digital objects etc. Collection and services of the libraries are accessedby different methods. A library collection can be accessed through different services, such asOPAC, search and browse facilities of digital libraries and other online and offline resources. Alibrary needs a user interface which should be compatible with different personal digital devicesuch as smart phones and also a different interface to larger screens such as touch screens etcand also there may be special collections which require more specific interfaces to access. Li-brary collection can include resources which are owned by libraries, resources which library willhave conditional accesses; resources which are free, so the accession levels of each resourcecan vary. Libraries can provide access to various services and collection through different toolssuch as social networking, mobile technologies etc. Users can interact with the library collectionand its services through any of the interfaces either physical or digital. The libraries are alsodealing with user generated contents through tagging of resources, community blogs etc. Librarywill have multiple services such as user oriented services and technical services. Traditional ser-vices such as CAS, SDI reference services etc. have gone though a face over using latest tech-nologies. Technical services include collection management, classification, cataloguing etc.

96 Sulochana, Madalli & Rath
VUJLIS, 18-19, 2013-14 ISSN : 0972-8570
New generation libraries
Multiple spaces Physical and digital spaces
Multiple collections Physical, digital
Multiple access points Different interfaces, accession levels, tools
User interactions Collection, services
User generated contents Discussion forums, tags etc.
Multiple services User oriented, technical
Table1: New generation libraries
Figure 1: Library services and collections
Advanced technologies in all spheres production, dissemination and use of information forcedlibraries also to try innovative technologies. Web 2.0 technologies showed a transformation inthe way library services are delivered to library users. Libraries developed or absorbed differentmethods to have a control on the overflow of information. Technologies related to semantic web,

Visual Representation of Information and Modern Libraries 97
ISSN : 0972-8570 VUJLIS, 18-19, 2013-14
controlled vocabularies, metadata etc. stands for sharing and reusing of information. Collectinginformation is no longer a problem, but managing and extracting the required information fromthat collection is more problematic. Apart from this the data libraries deal in relation to users,services and collection is very huge. Libraries need to opt for better data analysis and visualiza-tion techniques for decision making.
3 Related Works
Power of information visualization in identifying the patterns and to extract insight from largeamount of information is already proved through different applications of it in biological data field(Zhu and Chen, 2005). Libraries are not new to the technologies related information organizationand retrieval for example the browsing pattern given by a classification scheme or the co relationof information sources given by citation analysis etc. Visualization is a promising technology forlibraries to manage large scale of information. It can be applied in different aspects library collec-tion and services.
Nowadays, wide varieties of users access, extract, and display information that is distributed onvarious sources, which differ in type, form and content. Users need to easily understand whatkind of objects are stored in the available sources they have access to, how they can retrieve andorganize them in ways that permit to make rapid decisions on what is relevant and which patternsexist among objects. Users also need to manipulate the retrieved information in order to incorpo-rate it in their specific tasks. In this context, the conventional interfaces, based on the view ofinformation retrieval as an isolated task in which the user formulates a query against a homoge-neous collection to obtain matching documents, are completely out of date. Indeed, this viewdoes not correspond to the reality of users working with networked information systems. Forexample, users are often unable to formulate specific questions, and they realize what they aretrying to ask and how to ask it by browsing the system (Costabile & Semeraro, 1998).The mainadvantage of visual technique is its capability of shifting load from user's cognitive system to theperceptual system. Information visualization is defined as "a process of transforming informationinto a visual form enabling the user to observe information" (Card et.al.,1997).In the informationsystem context, visualizations have a wide range of applications, they can be used for visualizingvarious types of meta-information, as well as queries and retrieved results (Costabile &Semeraro,1998). Majors, Rice (2012) studied the role of user interface in web-scale discovery tools inrelation with purchase of the services. There are several studies on user interfaces of OPAC,digital libraries etc. but none of these studies cover the information visualization as such.
4 Information Visualization and Libraries
There are different areas where information visualization can be applied both in physical librariesas well as in digital libraries. Visualization can be used not only in user interface designing but alsofor data mining , decision making etc. in relation with various administrative aspects of libraries.

98 Sulochana, Madalli & Rath
VUJLIS, 18-19, 2013-14 ISSN : 0972-8570
Multiple aspects of visualization can be used in libraries, such as aesthetic aspects of it for at-tracting users towards the library, data analysis aspects in decision making etc.
4.1 Collection Analysis
Collection evaluation is one of the most important activities libraries involved. Collection analysisis required to evaluate the strength and weakness of the collection, changes needed in the collec-tion, for cost evaluation etc. Visualization is highly useful in collection analysis since it includeslarge volume of data. Data related to users requirements, use of library resources and against thecost of purchasing it etc. Instead putting it in multiple tables and explanation a simple visualizationcan give you a clear picture of data. For example, if a group of libraries wanted to go for regionalconsortia for physical resource sharing, geospatial analysis of libraries against their sharablecollection portion would be helpful. The collection size and diversity can be expressed usingstatistical analysis and proper visualization. Funding, user statistics and collection can be ex-pressed through a temporal analysis and visualization. Citation analysis of collection for cost-effectiveness can be expressed through a network analysis and networked visualization. Topicalanalysis can be used to represent content in relation to the collection, for example to create aclassified profile.
4.2 User Related Data
The user data can be user generated data or data about the users. The data about users such asresource usage pattern, demographic studies etc are highly important in designing various librarypolicies. The user activity data in online or physical library can give insights about library policieson collection development, facilities enhancements, accession policies etc. The user generateddata can be tags, contributions in discussion forums and community blogs etc. These data can bestudied in terms of user satisfaction, user interests etc. User activity data can be used for decisiontaking in relation with library opening timings, access restrictions, introducing new services etc.
4.3 Resource Sharing
Resource sharing is one of the concepts libraries practice over last few decades. It can be asshared cataloging environment or reciprocal lending etc. Another form of resource sharing canbe of library consortiums, collaborative reference services etc. Now resource sharing has nogeographical limitation, one can have access to different services across the world. Since theoptions are more libraries have to take proper decisions regarding that by analyzing 'N' numberof options on the data related to resource used, different kind of resources and their accesslevels, modes of access etc. For example, resources which are freely available on internet can bemade accessible to all library users. Resources which are purchased and have restricted accessshould not be open to all users. And also to monitor the volume of downloads etc. These sortsof data are valuable in relation with library policy making.

Visual Representation of Information and Modern Libraries 99
ISSN : 0972-8570 VUJLIS, 18-19, 2013-14
4.4 Collection Management
Collection management involves development, storage and preservation of collections. We havedifferent modules for collection management such as acquisitions, serial management, archivingetc. All these activities are basic requirement for a better performance of the library. A library willhave physical collections, digital collections, rented ones, owned ones etc. Before procuringresources we need to analyze so many factors such as whether that resource is available in thelibrary collection, or is it freely available on internet etc. In case of serials management the sub-scription dates, availability through another channels, accession policies etc. has to be checked.
4.5 Online Public Access Catalogue
OPAC clearly acts as an entry point to the library collection. The interface of OPAC has to becapable to reveal different collections library provides with multiple access points to that. Infor-mation visualization can be used in the OPAC to enhance the user experience. Traditional hier-archical and key word based interfaces can be supported with advanced visualization so that theuser can get an idea about multiple characteristics of the collection within very less time.
Figure 3: Visual components of OPAC
100 Sulochana, Madalli & Rath
VUJLIS, 18-19, 2013-14 ISSN : 0972-8570
4.6 Digital Libraries
Digital libraries should be considered an entirely independent system. The collection of a digitallibrary contains digital objects. A user gets to interact with the digital library through the searchinterface. So it is highly important to display the collection as well as search results in libraries sothat the user does not have to spend too much time just to find out what is there and how toretrieve it. Another aspect is search results display where the user can analyze the informationand take a proper decision in relation with the information need.
4.7 Search and Retrieval of Information
We have standardized schemes for organizing and retrieving the information. In case of physicallibraries user requirements and priorities decide the location and organization of resources eventhough it is backed by a standard classification scheme. We provide several aids to locate theinformation such as card guides, shelf labels, classification chart, card catalogue chart etc. Allthese things can be combined in to single visualization and the user can explore it multiple ways.
4.8 Dynamic Data Management
Dynamic data of libraries can be the data related to information resource usages or user gener-ated contents etc. For example, the data of article downloads or how many people are accessingdifferent kind of networks, and services etc. There can be user generated data such as theupload by users, the online activities of users etc. These data is important to shape the librarypolicies in relation to the resource usage, access levels etc.
4.9 Library Services
In case of user oriented services such as CAS, SDI etc. instead of sending just mails usefulvisualizations can be provided. For technical staff visualizations are helpful to analyze the userprofiles, resources, user requirements etc. Another example is the user requests for informationor information source. The data related to these requests need to be analyzed to enhance theperformance of libraries. We use social networking platforms for library extension services suchas publicity activities. The aesthetic aspects of visualization can be used to attract the peopletowards the library.
4.10 Administrative Task
Data analysis is prerequisite for any decision making task in administration. The power of visual-ization in data analysis is unquestionable. Putting up an appropriate visualization of data candisplay various aspects of it and can be expressed more effectively to others. For example,instead of showing multiple tables for discussing cost effective analysis of resource sharing , youcan blend data from different sources and display in an effective visualization.
Visual Representation of Information and Modern Libraries 101
ISSN : 0972-8570 VUJLIS, 18-19, 2013-14
5 Conclusion
Today libraries have to process huge volume of information be it a library collection or userrelated data. Not only finding but managing of the large volume of information is also a herculeantask. Information visualization technologies can be used in multiple ways in libraries includinginterfaces, information retrieval, data analysis etc. Visualisation is a novel approach to use oflibrary services as well as in library policy making
References
1 Amar, Robert and Stasko, John. A knowledge task-based framework for design and evaluation ofinformation visualisation. In IEEE symposium on Information Visualisation, Austin, Texas.Washington:IEEE Press, 2004. pp. 143-49.
2 Card S., Eick S. G. and Gershon N. Information visualization. CHI97 Tutorial Notes, Atlanta,GA. 1997.pp. 22-27.
3 Collins, Marks Linn. et.al. Information Visualisation and large-scale repositotires.Library HiTech.Vol.25(3), 2007. pp. 366-378
4 Costabile,Maria Francesca and Semeraro, Giovanni. Information Visualization in the Interaction withIDL. In proceedings of Eighth DEOLS workshop, Stockholm, Sweden, 1998
http://www.ercim.eu/publication/ws-proceedings/DELOS8/costabile.pdf
5 Das Neves, Fernando A and Fox, Edward A. A study of user behaviour in an immersive virtual environ-ment for digital libraries. In proceedings of the fifth ACM International Conference on Digital Libraries,San Antonio, Texas, Washington: ACM Press . 2000. pp. 103-11.
6 Ellis, D. and Vasconcelos, A. Ranganathan and the Net: using facet analysis to search and organize theWorld Wide Web.Aslib Proceedings.Vol. 51 (1), 1999. pp 3-10 .
7 Gelernter, Judith. Information Visualisation (Infoviz) for Digital Library Collections in Digital Libraries.Knowledge Organisation. Vol.34(3). 2007
8 Morse, E. and M. Lewis. Evaluating visualizations:Using a taxonomic guide.International Journal ofhuman-computer studies .Vol.53. 2000.pp. 637-62
9 Ranganathan, S.R . Prolegomina to Library Classification .New York: Asia Publishing House , 1967
10 Pollitt, A. Steven. The Key Role of Classification and Indexing in View-Based Searching. TechnologyReport .University of Huddersfield, UK. 1998
http://citeseerx.ist.psu.edu/viewdoc/download?doi=10.1.1.109.626&rep=rep1&type=pdf
11 Saracevic,Tefko. Evaluation of Digital Libraries:An overview. In Proceedings of DELOS WP7,Workhopon the Evaluation of Digital Libraries, Department of Information Engineering, University of Padua.2004
12 Shneiderman,Ben,Feldman,David,Rose,Anne and Grau, Xavier Ferre. Visualising digital library searchresults with categorical and heirarchical axes. In proceeding of the Fifth ACM International Conferenceon Digital Libraries, San Antonio, Texas, New York: ACM Press. 2000. pp.57-66
13 Zhu, Bin and Chen, Hsinchun. Information visualisation. Annual Review of Information Science andTechnology. Vol.39, 2005, pp. 139-171.