vibratory effects in reinforced portland cement concrete
TRANSCRIPT

VIBRATORY EFFECTS IN REINFORCED
PORTLAND CEMENT CONCRETE PAVEMENT
Fina1 Report For
Project MLR-97-2
May 1997
Project Development Division
#!!la Iowa Department '!..;;; of Transportation
VIBRATORY EFFECTS IN REINFORCED
PORTLAND CEMENT CONCRETE PAVEMENT
Final Report for
MLR-97~2
By Robert F. Steffes
Assistant to the Research Engineer 515-239-1392
FAX: 515-239-1092 Office of Materials
Project Development Division Iowa Department of Transportation
Ames, Iowa 50010
May 1997

TECHNICAL REPORT TITLE PAGE
1. REPORT NO.
MLR-97-2
3. TITLE AND SUBTITLE
Vibratory Effects in Reinforced PCC Pavement
5. AUTHOR (S)
Robert F. Steffes Assistant to the Research Engr.
2. REPORT DATE
May 1997
4. TYPE OF REPORT & PERIOD COVERED
Final report, 2-97 to 4-97
6. PERFORMING ORGANIZATION ADDRESS
Iowa Department of Transportation Materials Department 800 Lincoln Way Ames, Iowa 50010
7. ACKNOWLEDGEMENT OF COOPERATING ORGANIZATIONS
8. ABSTRACT
A double mat of reinforcement steel consisting of No. 5 bars was placed in the longitudinal and transverse directions in a 26' wide, 1011 thick pavement. The bars were placed on 12 11 centers with 211 of cover from the top and bottom surfaces. The special reinforcement is to provide additional strength in the pavement over an area of old coal mine tunnels. Auxiliary and standard paver vibrators were used to consolidate the concrete. There was concern that over-vibration could be occurring in some areas and also that a lack of consolidation may be occurring under the steel bars in some areas.
A core. evaluation study of the pavement was developed. The results. showed that the consolidation and the air contents were satisfactory. Additional paving with reinforcement in the same area should use the same or similar method and amount of vibration as was used in the area evaluated in this study.
9. KEY WORDS
Portland cement concrete Reinforced PCC Special reinforcement Consolidation Auxiliary vibrator
10. NO. OF PAGES
27

TABLE OF CONTENTS
Page
INTRODUCTION . . . . . . . . . . . . . . . . . . . . . . . . . . . . . . . . . . . . . . . . . . . . 1
PROJECT LOCATION . . . . . . . . . . . . . . . . . . . . . . . . . . . . • . . . . . . . . . . . . 1
CORE SAMPLING . . . . . . . . . . . . . . . . . . . . . . . . . . . . . . . . . . . . . . . . . . . 2
OBSERVATIONS . . . . . . . . . • . . . . . . . . . . . . . . . . . . . . . • . . . . . . . . . . . . 2
AIR CONTENT OF HARDENED CONCRETE . . . . . . . . . . . . . . . . . . . . . . . . . . 3
RESULTS . . . . . . . . . . . . . . . . . . . . . . . . . . . . . . . . . . . . . . . . . . . . . . . . . 3
DISCUSSION . . . . . . . . . . . . . . . . . . . . . . . . . . . . . . . . . . . . . . . . . . . . . . 4
RECOMMENDATIONS ........................................ 4
CONCLUSIONS . . . . . . . . . . . . . . . . . . . . . . . . . . . . . . . . . . . . . . . . . . . . . 5
ACKNOWLEDGEMENTS . . . . . . . . . . . . . . . . . . . . . . . . . . . . . . . . . . . . . . 5
APPENDICES . . . . . . . . . . . . . . . . . . . . . . . . . . . . . . . . . . . . . . . . . . . . . . 6
Appendix A - Project Request . . . . . . . . . . . . . . . . . . . . . . . . . . . . . . . . . . 7 Appendix B - MLR-97-2 . . . . . . . . . . . . . . . . . . . . . . . . . . . . . . . . . . . . 10 Appendix C - Project Plan (Partial) . . . . . . . . . . . . . . . . . . . . . . . . . . . . . . 13 Appendix D - Test Method No. Iowa 407-B (Air content of hardened PCC) . . . . . 16 Appendix E - Core Description and High Pressure Air Meter Results . . . . . . . . . 24 Appendix F - Auxiliary Vibrator Use . . . . . . . . . . . . . . . . . . . . . . . . . . . . . 26
DISCLAIMER
The contents of this report reflect the views of the author and do not necessarily reflect the official views of the Iowa Department of Transportation. This report does not constitute any standard, specification or regulation.

INTRODUCTION
This project is a result of a request in February 1997 from the Construction Office to the
Materiiils Office, Research Section, to evaluate the concrete consolidation and air content in
a 563' section of special reinforced concrete pavement. The section contains a double mat of
No. 5 uncoated steel bars placed on 12" centers running in the longitudinal and transverse
directions. This section of pavement passes over an area of old (prior to 1950) coal mine
tunnels (see Appendix A). There was concern about the amount of vibration needed for
proper consolidation of the concrete around the steel bars. Two auxiliary handheld vibrators
were used in addition to the standard paver vibrators for this section of pavement.
An answer was needed, before the start of the 1997 construction season, on the quality of
concrete consolidation and on air content of the 1996 pavement in this area. A Materials
Laboratory Research (MLR) 97-02 was initiated to provide the guidelines for the project (see
Appendix B).
PROJECT WCATION
The project is on relocated IA 163 in Mahaska County, project No. NHS-163-4(11)--19-62,
near the city of Oskaloosa. The initial paving in 1996 was a 563' section in the northbound
lane from Station 384+31 to Station 389+94. Many additional similar sections within this
project are scheduled for construction in 1997 (see Appendix C).
1

CORE SAMPLING
The coring plan had a target to hit the intersection of steel in some cases and to avoid the
steel in other cases. Due to the tight pattern of steel, a 3" core bit was used to avoid steel
and a 4" bit was used when coring the intersection of the longitudinal and transverse steel
bars. A total of 12 cores were taken over the area to be evaluated. A Pachometer steel
locator was used to determine the location of the steel reinforcing bars.
OBSERVATIONS
From visual observations of the cores, the consolidation of the concrete around the steel bars
appeared satisfactory. Only in one case, in Core No. 12, was there evidence of void areas
around the bars. In that case, the lower steel mat was found abnormally low, being only 1"
off of the base instead of the 2" as specified in the plans.
There is a visual appearance of longitudinal ridges on the surface of the pavement which
appear to correspond to the location of the top longitudinal steel bars within the concrete. As
there was no obvious transverse ridges from the top steel, it should be determined whether
the longitudinal ridges are actually ridges in the concrete from steel or they are apparent
ridges made by the uniformly spaced nozzles from the spray bar applying curing compound.
If concrete ridges do exist in this section, these ridges could cause a rough ride or abnormal
noise. The paver used in this section was a smaller paver than the contractor is planning to
use for 1997 paving. For future paving on this project, a "super smoother" would be
2

attached to the paver which is likely to remove surface effects caused by the top steel bars in
the concrete.
AIR CONTENT OF HARDENED CONCRETE
The cores were prepared and tested according to the "Method of Test for Determination of
Air Content of Portland Cement Concrete Cores Using a High Pressure Air Meter," Test
Method No. Iowa 407-B (see Appendix D).
A full length slice was first taken from each core and kept for any future evaluation. The
main part of the core was then cut at half length to give a top half and bottom half for
testing. For the cores which contained steel, a calculation was done to eliminate the effect of
the steel. The results of the tests for hard air content are given in Appendix E.
RESULTS
The visual results of the study indicate that the concrete consolidation using the standard
paver vibrators plus two auxiliary vibrators did a satisfactory job.
The air content test results on the hardened concrete show an average of 5 .4 % air based on
23 tests. The air content was 5. 3 % in the top halves of the cores and 5 .5 % in the bottom
halves (see Appendix E). There was only one core that exhibited significant voids around a
bar and in that case, the steel bar was only l" off of the base making it abnormally difficult
for the concrete to flow under the bar.
3

DISCUSSION
To get the results of this study as quickly as possible to the Iowa DOT and the contractor, a
preliminary presentation was made in draft form at the project preconstruction meeting on
March 27, 1997.
The results given in this report confirm and elaborate on the preliminary results given
previously.
An appendix for Auxiliary Vibrator Use giving a variety of options for vibrator dip
(emersion) time and area covered was prepared and is presented only as a guideline for use
with the auxiliary vibrators (see Appendix F).
RECOMMENDATIONS
Based upon the visuai evaiuation of the cores and on the percent air vaiues found, it is
recommended that a similar or equivalent amount of vibration effort be applied in paving the
remaining special reinforced sections in this paving project.
A proposed guideline is that the auxiliary vibrators be inserted into the concrete such that
each insertion does not go beyond approximately 3 seconds time within the plastic concrete
and that each insertion covers an area of 2' x 2' (see Appendix F).
4

CONCLUSIONS
Placement of reinforcing bars within l" of the base can prevent concrete from flowing
completely under the bar.
Concrete consolidation efforts and methods used in this section gave satisfactory results.
ACKNOWLEDGEMENTS
Appreciation is expressed to the Southeast Iowa Transportation Center for their support of
this study, to the Central Materials Special Investigations for their assistance to obtain cores
and to the Cement & Concrete Section for their support in core analysis. Special thanks goes
to Ed Engle for his many hours of core preparation, testing and data organization and to
Kathy Davis for her secretarial support.
5

APPENDICES
6

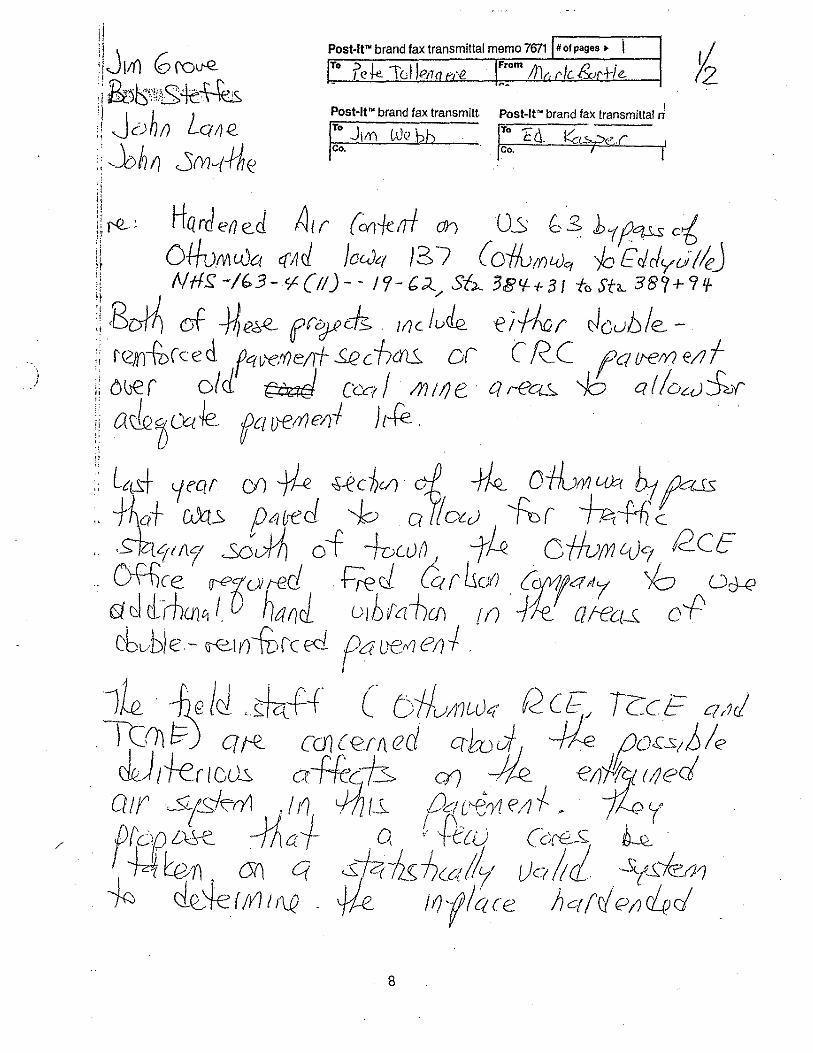
Appendix A Project Request
7
' _)
/
Post-It™ brand fax transmittal memo 7671 #of pages • I To ?e-k \d "'IT ·(! From f1')' l&J tie. - ~-
I Post·lt™ brand fax transmit!. Post-It~ brand fax transmittal n
1::. Jvn ~VQ bb . fc:. t Q_ kCcsper 1,
8

,, I : Z-r-
2
9

Appendix B MLR-97-2
10

' .
DATE: March 5, 1997
PROJECT NO.: MLR-97-2
PROJECT TITLE: Vibratory Effects in Construction of Special Reinforced PCC Pavement
PRINCIPAL INVESTIGATOR: Bob Steff es
OBJECTIVE: The objective of thfs'research is to evaluate the consolidation and air system of a PCC roadway which has
. special reinforcement.
DiscussioN:
The special reinforced pavement is over an area of old underground coal mining activity in Mahaska County on relocated IA 163 south of Oskaloosa. The project No. is NHS-163-4(11)--19-62. The area for testing is from Sta. 384+31,to Sta. 389+94 in the westbound lane.
PURPOSE:
The purpose of the research is to determine if auxiliary vibrators are required to achieve sufficient consolidation of PCC concrete around reinforcing bars. The research will also determine if auxiliary vibration causes an excessive loss of entrained air. The results are needed to determine construction procedures for other similar areas, not yet paved, within this project.
PROCEDURE:
Cores will be taken from locations where: 1) reinforcing bars intersect in the lower mat (2 each, 4 11 diameter); 2) reinforcing bars intersect in the upper mat (2 each, 4" diameter); 3) a 6"x6" square area exists with no reinforcing bars passing through it (8 each, 3 11 diameter).
The cores will be removed from two different sections of the currently constructed project.
CORE ANALYSIS:
Cores will be evaluated by:
1. Visual inspection. 2. High pressure hardened air analysis.
11

REPORTING:
Results of the research will be reported as soon as they are summarized so they can be incorporated into paving procedures for the ongoing construction of this project during the 1997 construction season.
RESPONSIBILITIES:
SEITC - RCE will provide information and authorization for core sampling.
Materials - Research and Special Investigations will select core sites, do coring and perform visual core inspections.
The Cement and Concrete laboratory will perform the high pressure hardened air analysis.
The Materials - Research principal investigator will prepare and present the final report.
RESEARCH PERIOD:
Research work can begin as soon as this MLR is approved. coring can be done in mid-March and laboratory work will follow as soon as possible, thereafter. Priorities will be given to present the final report before the start-up of the 1997 paving on this project.
12

Appendix C Project Plan (Partial)
13

12' , ..
TYPICAL SECTION
MAHASKA co. NHS-163-4(11)--19-62
AREAS REQUIRING REINFORCED P.C.C. PAVEMENT FOR Df:TAJL. SEE SHEET U.08
STATION STATION LANE S.Y. REMARKS
1513+60 1517+50· Rof!'P "'A" Iowa 92 69J tnterch •
213+60 217+50 W8l 1127 21J+60 217+50 (Bl 1127
4513+60 4517+50 Romp ·o· Sowa 92 69J int ere ho •
49+80 54+00 West Access Rd. 1120 Sinote Reinf.
233+50 237+00 W8l 1011 233+50 237+00 (Bl 1011 72+75 77+00 Wesl Access Rd I Ill Sinote Reinf.
5550+00 5558+75 Rome: •A"' Jowo 137 1556 if?!erc:ho!!2!.
34<+00 358+50 WSL .t Romn .. A"' ·4189 ·-.J~e!!_. ___ --~--344+00 358.+SO EBL & Romp •B"' 4189
looer soo· 6551+00 6558+00 Romp "'ff' C-55 1244
inte,chonoe 6560+50 6568+50 Rama "'ff G-55 t422
int ere ho • 365+75 389+25 WBl~ of Romn 6789:
-~~--- f-· 533 365+75 J89+25 £BL & nnrt of Roml'I 6789
*C:- toper 7578"+00 7589+25 Romp "'C: C-55 2000·
interchange 11+25 17+00' Eosl Access Rd. 15Jl Sinole Reinr.
14
o·-
--
-
.
- r-2"<rulAR (TYP)
~2'CLEAA (TVP.) "--.

820
810
800
790
780
770 LT.
U£1J.
RT.
0.4! RT.
.....,, /)ff[
OfTCJ{ ~ ~
~:i=!if!~ ..,...,.n-"? <'-! ""': ~
U> co to to ta CO U> CD co co a:;o; co a; co u; 380
+00 (RT. t0.6
, CfWX
TDIP.
tot:! :;. itiui .,; co iii ;;;
. r l
I
I
>££ SHEC. K¥0) =·~
I
~ ,, OfTCJ{ ~
I ~ :6 .., ., 0
..; ,.; ,.; ;;; ;;; ;;;
385
15
..
, 5• XI • OITCH
6• XI • f)fTCH .., "' ci .,
ST.I.. JltHStJ lT. TrF£ 'JI". INKC £L.tY.z:410.T
I
.
-o. 07.
I • '• LY." 04.2 r ... m. tnJ
\ I
·1 ..
I
' OIK£~
TOE DITC .., ., .., "' . 0
;;; ;;; 390
I f1SCM."""'
,
RES. ENT.
,, V£OIW IX CH
L
ES.
. """
4' ~ 10
NO WCH """"' 6'
I MAHASKA

Appendix D Test Method No. Iowa 407-B
(Air content of hardened PCC)
16

)
Page 1 of 7 Test Method No. Iowa 407-B
December 1991
IOWA DEPARTMENT Of TRANSPORTATION HIGHWAY DIVISION
Office of Materials
METHOD OF TEST FOR OETERM!NATION OF AIR CONTENT OF PORTLAND CEMENT CONCRETE CDRES.USING A HIGH PRESSURE AIR METER
PART l, AIR CONTENT OF CONCRETE ~ORES
Scope
The amount of air in portland cement concrete is a factor that can result in longer life, greater versatility, and better economy. The proper amount of air content will greatly improve the quality, appearance, and placeability of concrete. The air content of cores drilled from pavement, pavement widening, bridges, etc., is determined by a high pressure air meter. In addition, water absorption in paste by volume of the core can also be determined.
A. Apparatus and Materials
1. High pressure air meter (Fig. 1 and 2).
2. Specimen stirrup for lowering the specimen into the compression chamber.
3. Core soaking container.
4. Liquid solution of 20·grams sodium borate, 5 gram sodium chromate, and one gallon water.
5. Oven (300° F.).
6. Sea le (capacity = 7 ,000 grams, accuracy= 0.5 gram),
B. Test Record Forms
l. Data and calculation sheet (Fig. 3).
2. "P .C.C. core strength - air -absorption" coding sheet.
3. Strength and air field book with columns of core number, dry weight, absorbed weight, weight in water, zero reading, and observed dial reading.
C. Test Procedure
:i. Dry th0 core specimen in an oven· at 3DO F. for a period of 72 hours.
2. Cool the specimen at room temperature for a period of approximately 3 hrs.
17
3. Weigh the specimen in air.
4. Soak the specimen in the soaking container for a period of 48 hours.
5. Weigh the specimen in water.
6. Wipe the excess water off the specimen using an absorbent cloth.
7. Weigh the specimen in air (absorbed weight).
8. Using the stirrup, lower the specimen into the compression chamber.
9. Close the elliptical lid tightly, such that one-quarter to one-half inch of liquid remains on the top.
10. Remove the trapped air as follows: with a small head pressure, let the liquid flow into the chamber at the low side valve and out of the chamber at the high side valve. Be sure that all the trapped air is removed by checking for air bubbles in the beaker which is used as a receiver of the liquid from the high side valve.
11. When all the trapped air is out of the compress ion chamber, close both valves tightly.
12. Turn the transmission switch to the (0) down position. The cylinder piston will begin to move downward, the distance of which is indicated by the dial reading. When there is no furt.her visual movement of the dial, note the pressure gauge, and use a correction of 0.05 divisions of the dial for every 100 psi. differential from 5,000 psi. Thus, if the dial reading is 4.81 revolutions and the pressure gauge reads 4,900 psi., the recorded dia·1 reading should be 4.86 revolutions. If the pressure gauge reads 5,060 psi., the recorded reading would be 4.78 revolutions.
13. Loosen the lid screw a half-turn to prevent it from locking up.

Test Method No. Iowa 407-B December 1991
14. Turn the transmi5sion switch to the {U) up position. When the pres5ure has dropped be low 1000 psi., open the high side valve and remove the elliptical lid. Make sure that the dial has returned to the zero position.
15. Remove the specimen from the compression chamber by lifting the stirrup.
lb. Before and after each series of cores that are tested, a dial reading should be recorded with nothing but the stirrup in the compression chamber. This is the zero reading and is recorded for each core in the field book.
0. Calcu·lations
1. Computer Calculating
a. Computer calculating of the resulting air content can be gained by transferring the relevant data from the field book to the coding sheet labeled "P.C.C. Core Strength -Air - Absorption" Form 909. The coding sheet is then sent to the data processing center for computation.
2. Hand Ca-icu·1ating
a. The calculation sheet shown in Fig. 3 can be used to calculate the air content when the computation is carried out by laboratory personnel.
3. Computer Terminal Calculating
a. The Materials Laboratory computer terminal will calculate the air content when the program login {dpctl, dpOl), load {air) is supplied with the requested core data.
E. Reporti_ng the Results
1. The computer print-out and the calculation sheet both present the air content as a percent by volume of the concrete core specimen. The water absorption in paste by volume of a core is determined by the same computer program as air content. All aggregate and mix data should be included on the coding sheet. The water absorption in paste is specified on the print-out.
18
Page 2 of 7
F. Note
The high pressure air meter is similar to an original design by the Illinois Division of Highways (Highway -Research Board Proceedings Vol. 35, "Illinois Develops High Pressure Air Meter for Determining Air Content of Hardened Concrete", pp. 424-435). See also ISHC R-168.
PART II, CALIBRATION
Scope
It is recommended that at least once-a-year the high pressure air meter be calibrated to determine the effects of wear on its performance. These effects are reflected by the two air meters constants which are used in calculating the·air content of concrete specimens. The first constant determined is the solid slope-factor which is a correction for the expansion of the equipment and compressibilities of the liquid. The second constant is the volume of air dis-
. placed by. liquid per dial revolution.
A. Apparatus and Materials
1. High pressure air meter.
2. Liquid solution of 20 grams sodium borate, 5 grams sodium chromate and one gallon water.
3. Two standardized steel volume specimens marked "565 cc" and "1180 cc" a long with a threaded rod used to transport the specimens.
4. Complete set of steel air displacement specimens that include:
a •. Two steel cylinders marked 1150 cc".
b. One steel cylinder marked 11100 cc". ·
c. One cylindrical cup with lid marked "240 cc stee 1 - 250 cc air" ..
B. Test Report Form
1. Data and calculation sheet labeled "Large High Pressure Air Meter Calibration" {Fig. 4).
C. Calibration Procedure
1. Fill the compression chamber with the liquid solution and close the elliptical lid tightly such that one-quarter to one-half inch of liquid remains on the top.

Page 3 of 7
2. Remove the trapped air as de-scribed in item number 10 under the test procedure of Part I, Air Content of Concrete Cores.
3. Close both .valves tightly.
4. Turn the transmission switch to the (D) down position and record the 5000 psi. corrected dial reading.
5. Loosen the lid screw a half-turn.
6. Turn the transmission swith to the (U) up position. When the pressure has dropped below 1000 psi. open the high side valve, remove the elliptical lid, and make sure the dial has returned
. to the zero position.
7. The remainder of the calibration procedure requires that dial readings be recorded for various amounts of steel and air within the compression chamber. These amounts are specified on the data sheet, and can all be gained by using different combinations of the steel specimens and the air measuring cup. Thus, steps 1 through 6 are repeated for the various combinations until the twenty-four corrected dial ... o~rl.;nne ""'"o h.nn.n """'"'"'"""""""'- ''""' t -....u.-.. llt:;t~ U""'V'"' U ........ I <;; ... VI U<WU VII
the data sheet.
o. Calculations and Reporting of Results
l. The calculations are made directly on the data sheet under the format presented. The results (solidslope-factor and cubic centimeters per dial revolution) are recorded on the first page of the high pressure air meter file R-168. A comparison of previous results wi 11 indicate the nature of the air meter wear, and will serve as a basis for any repairs.
PART Ill, AGGREGATE AIR CORRECTION
Scope
Before the air content of a concrete specimen can be computed, a correction for the air within the coarse aggregate must be determined. Since the amount of air within the coarse aggregate is not included in the final results, it is subtracted from the observed air content of the concrete core.
A. Apparatus and Materials
1. High pressure air meter.
19
2.
3.
4.
5.
6.
Test Method No. Iowa 407-B December 1991
Soaking container.
500 cc beaker.
Specimen stirrup for lowering beaker into the compress ion chamber.
Liquid solution of 20 grams sodium borate, 5 grams sodium chromate and one gallon water.
Scale (capacity= 1000 gm., accuracy= 0.2 gm.).
B. Test Record Form
1. Data and calculation sheet labeled "Aggregate Air Correction Using the High Pressure Air Meter" (Fig. 5). .
c. Aggregate Correction Procedure
1. Soak a representative aggregate sample of approximately 1000 grams at room temperature for 48 hours.
2. Wipe the excess water of the aggregate using an absorbent cloth (saturated-surface.drycondition).
3. Weigh a sample having a weight that is equivalent to 100 times the specified gravity in grams.
4. Place the.weighed sample in the 500 cc beaker and lower it (by the stirrup) into the compression chamber. ·
5. Close the elliptiCal lid tightly, such that one-quarter to one-half inch of liquid remains on the top.
6. Remove the entrapped air as described in item number 10 under the test procedure of Part I, Air Content of Concrete Cores.
7. Close both valves tightly.
8. Turn the transmission to the ( D) down position and record the 5000 psi. corrected dia 1 reading.
9. Loosen the lid screw a half-turn.
10. Turn the transmission switch to the {U) up position. When the pressure has dropped to below 1000 psi., open the high side valve, remove the elliptical lid, and make sure the dial has returned to the zero position.

Test Method No. Iowa 407-B December 1991
11. Record a zero reading (stirrup, beaker and water in chamber) for each sainp 1 e.
12. Repeat items 3 through 11 until 3 samples of a given aggregate have been tested and reported.
D. Calculations and Reporting of Results
l. The calculations are made directly on the aggregate correction data sheet (fig. 5). The results (avg. percent air in aggregate and cc air in standard specimen) are recorded in Tab le II, "Aggregate Characteristics", which is a listing of air content, specific gravity, and absorbed weight of all aggregates previously tested. Any additions or corrections to Table II should be made available to the data processing center so that future computer ca lculat ions can be kept up-to-date.
figure 1 High Pressure Air ~~ter
20
figure 2 Close-Up of Dial on High
Pressure Air Meter
Page 4 of 7

'
Page 5 of 7 FIGURE 3
Test Met)1od No. Iowa 407- B December 1991
ENTRAINED AIR DETERMINATION OF CORE SPECIMENS USING THE HIGH PRESSURE AIR METER-DATA AND CALCULATION SHEET
Project No.5 -1/0..5-/6)-50-3 J oate S./zJ/?/
> >
Core. N.'.>. 6 / ?/
Air Meter Characteristics (Most Recent):
County 6ur,//~/e:-•
By ..:s: C!..#A?t~/ 7
Lab. No. 3/ 2 7
Mix 8-.z."
A) Solid Slope Factor, K = ?/. t'/?>Cl 1//
l.
2.
3.
4.
s. 6.
7.
a. 9.
10.
11.
12.
13.
14.
15.
B) Volume of Air Pier Dial Revolution, V = , ;?C:, 88 C) Use Pressure correction of 0.05 Revolutions Per 100 PSI Differential
from 5, 000 PSI.
nee Specimen Refere
Dry Weight of (72 hr. in ov
Specimen, gm. en)
Absorbed Wt. of Specimen, gm. (48 hr. soak )
, gm.
· en, ern3= (2-3)
Weight in Water
Volume of Specllll
zero Dial Readi
Volume Absorbed
Volume Solids + Observed Dial R
Adj. Zero Readin
Net Revolutions
Observed Vol. A
% Vol. Coarse A
VoL Coarse A9g
n9 (Water & Stirrup)
Water = (Z-1)
Air = (4-6)
eadin9
· 9 = [s- CKx7iJ
= (8-9)
ir = (10) (V)
99· (Table I)
• = (4) (12) 100
A99• \ Vol. Air in
Agg. Correction
(Table II) = (13)(14)
100
I
2300
2.1/?8
'.3?~ .
108y Z.j/O
/78 706 41.tP6 Z,tP3 ZtJ3
7~#? 3">1SI '-?7¢,05
CJ, 3
/•/Z 16. Vol. Entrained Air = (11-15) ?.3.75 17. \ Air = (16/4) b.8,6
21
..

~-· IOWA DEPARTMENT OF TRANSPORTATION - MATERIALS LABORATORY
LARGE HIGH PRESSURE AIR METER CALIBRATION OATA AND CALCULATION SHEET
.DATE TE~~;;;J · 78.--87= TESTED av.A eo.z~s.._.
VOLUME OF VOLUME OF ~ DIAL READING SOLID RE'/OLUTlON STEEL IN AIR IN <.:>AT 5000 PSI SLOPE CHANGE TEST SPB:i'lE~ CONTAINER _,S -RE\Ct.Ull0'6 FACTOR. EQUAL TO
CALCULATIONS TO DETERl41NE AIR. DISPLACEMENT PER DIAL hEVOL.UTION
NOTE: D.R..z =DIAL READING AT DIAL .READING N<i 2 ·cue•c -<=ua•c ·- sl5 csEE NOTE 1i CKl STEEL AT
I CE1fllf.1ETER CENTIMET(tto oa:: 0 VOWME . ---····I 0 ° I '.-! .. ?., . OF AIR.
56S a 2 .if,14 1180 I ()H I 3 I ? . ~t I I (Z) 1 745 0 4 .
so , _ ,. '"I"' A B c D E F
mos so? 6 .Al- ,......'l" 1620 50 1 7 . ~ .. t:::-.;18:> so ,, e . ' 390 IQQ f 9 . 1 l
;;J 100 .z.. 10 w I l 100 ~ II ~ ~! 21.35 100 4 12 : . :! \i) '1
040 1so , 13 .. .! ~'I ~ 905 150 1 14 ,' 0,... .. , l:it:v 150 i IS . Z - I I ~·';t-o:: I U I& _ ! r-.._ ~
290 200 , 17 7. . ~ '>-.l ...... Q ass 2 I} 1a 7 70 ;s: ~ v 14 70 200 J 19 7. 46 . ~
; r-zo35-- '- - ?00-· " 20 7. "1 ,, ~I <::i 240 250 J 21 o. 07 " ~ ~ 805 250 2 22 :q. bX ~
1420 1 2 so J-1-2s--1---i(--:-zz ,..5--·-T 250· - # r·2•r-s-~ 4J
NOTES&
z,._t440)CK)
z, • • /& 7 Zc- (390)(Kl
z,. J05 Z3 • (340)(1')
z,. '144 .... Z4.~ l?_90)(K)
A1 • Z1 •OR.a
A1 •J,0.3 Az. z,. OR,2
Az. 4, 4/) A3• Z3•0.R,G
A3-5.'!J
A4 .. i 4 • 0.R"20
81 • A1-0f\.1
s,. /.38 8 2 .. Az- O.R.4
Bz•;? ffJ 83 • A3 - Ul'<4
a3· 1.Jt
c,. ~61 c,.Jb.23 Cz • 'o/52
c2-Jf3lf C3 •.'~a3
C3•JJ, Oj c4 • 2~
4.
'4 •• 1.iJ j--;~=:;:-i----!-_:~:_:~C4 •Jlf, (, Q c.s·z.~s
Cs•J(,. /rif
A4~ 7. lf3 84•A4·Q ..
s4·S 7B z5 .. {240)(K) I As. z5 +_nR24 I a5 • A5 -ot:t4
zs;, 1().2 As·8.:JI Bs·6. Cfo TOTAL-C- •- /77
AVERAGE c .. ':.l "J-. :53
01• Z1+QR.7
D1=J2£ Oz • Z2• illlt I
Oz-/+ 05 03,Z3+0"-t5
o3-h.0£ 04 .. Z4"" CP,9
04· 7,t,/
E1·D1-ll%
E1= /,//./
Ez • Oz -0'\i
Ez-2 Jg E3 - D3- QR0
E3• 4, ;2/
'4' P4-0"5
e4 -.f. 74 os • z5 • C"z:;I · Es - os - a%
Ds·810 E5 ~6.8C/ TOTA'LF·
AVERAGE F' ~
--Fl • 59--E,
F1 •J$.~4 ; •• 100/ ' 7Ez
F z-J<;, Olf
F3 • l~E3
F,.Jj,60 '• .2~ E.1 F4" Jl.f. 86 Fs • 25.9-ts
Fs•:J6 :2 7 rT
....2 -·1 #
I, USE ~ESSURE CORRECTION OF 0..05 REVOLUTIONS FOR EVERY 100 PSI OlF"FERENCE F'ROM 5000 PSI AS READ ON THE PRESSURE-GAUGE.
AVERAGE DISPLACEMENT PER DIAL REVOLUTlON G H l J K l
2 Srn:~RUP SHOULD BE IN AIR METER WHENEVER POSSIBLE BEFORE P.ECOROlNG A OIAL P.EAOING.
RESULTS~
Souo SLOPE FACTOR 0. OOC> 4/2 4-
AVERAGEC ~.j~ .. G1·Z1+0.~ IH1•.G1-_0R.z ,r1 .. ~1 (J1•Z1+n~s IK1··~:J1-QR-1 ,1.., .... --~,
AVERAGEF ,JS. 6 G ., • .J. 5J H1• I J'1 I1 .J~. 051 J1•J, '73 K1• l.j 4 L1 - .37. IK! AVE1'AGEI ~(), 9£ Gz-Zz+D"-10 I Hz·Gz-O."l? IT2-'v~2 1·Jz•Zz+OR9 I Kz-4z-QR., I Lz•'o.9'"2
AVER.AGEL .16. 39 Gz• 4. 8</ Hz- ,1,, 75 Iz.J6.lf.3 Jz • ..7. 1Z- Kz· ..&. 7.3 Lz·J6. 70 TOTALAVE"AGE l./'.3. :'ii ·0:1~--z3.:oR,4 H3•G3-0R2 1;~-,~3 J3•Z3+Q11t3 K3•JrQR., L3· 1~3
"~~~.~v!:::,.•J,f8rJ G3_6J4 H3 .4...?o 1,.J.3~68 J3.G.60 K3.1.f.~/ L,_JJ0C 4 • G4 .. l4"" ~8 H4• G4-0~2 14• 20.91i4 J4 • Z4•UR17 K4 .. J4 - QR.i L4 .. 2S%_4
G4· 78.Z H •• s0g . .,,..Jj~F? J4.g 04 K4.s,cs L4·35".38 65• Z5•UR.zz Hs•G5-URz 15• /H5 Js• Zs-OR21 Ks•J5-~R.1 . Ls• /Ks ..
Cueic CENTIMETERS Pe:R Q1AL REvotuT10N ____ _,.~---I
250,... I · 2so,...
Gs· 8. '18 H5• 6 fl lf x .J6 . .67f Js• t/. I 7 Ks• 6. 7& L •• }6. th TOTAL l • l7'f, l{ '1 ·
.AVERAGE t •. TOTAL L "
AVERAGE t.. ~ --'-1?;.'-~
"" "' '° CD
0\
0 -h .....,
I~
mi (/)
rt
iif rt ::i-g_ :z:
~!:f~~ CD~ 30 O" ;;: CD <» ..., -I'> ..... 0 "'..., <io I
..... ""
Page 7 of 7 Test Method No. Iowa 407-B
· December 1991
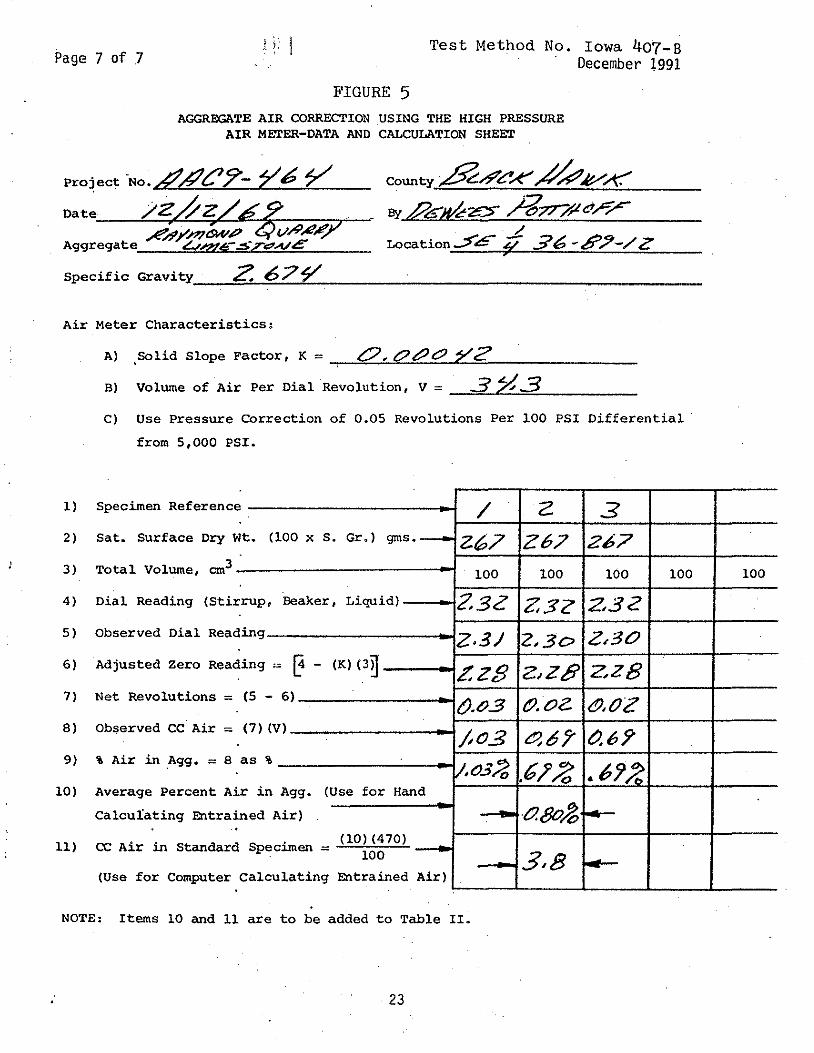
FIGURE 5 AGGREGATE AIR CORRECTION USING THE HIGH PRESSURE
AIR METER-DATA AND CALCULATION SHEET
county ._&.#CA" ~VK &j &Jl/cz=:> /?~<7/""/'""
·/ Location_:s-'E :Y- 36 -.tf',7-/ Z
Specific Gravity __ .::Z==-"':-:6"-'-7--"~---------------------
Air Meter Characteristics:
A) ,Solid Slope Factor, K = O. t??'CJ 'f;/2
B) Volume of Air Per Dial Revolution, V = --=3=-~:lf--,, __ ..3=------C) Use Pressure Correction of 0.05 Revolutions Per 100 PSI Differential
from 5,000 PSI.
l) Specimen Reference
2) Sat. Surface Dry W t. (100 x S. Gr.) gms.-
3) Total Volume, cm3
4) Dial Reading (Stir rup, Beaker, Liquid)
5) Observed Dial Read ing
6) Adjusted zero Read ing ~ ~ - <Kl <3TI
7) Net Revolutions = (5 - 6)
8) Observed CC.Air= (7) (V)
9) % Air in Agg. = 8 as %
'r in Agg. 10) Average Percent Ai
Calcufating Entrain
(Use for Hand
ed Air) . Specimen=
(10) (470) 100
11) cc Air in standard
(Use for Computer calculating Entrained Air)
/ Z.67
100
2.3Z
z,3;
LZ8 ().03
/;03
v.o3~
NOTE: Items 10 and 11 are to be added to Table II.
23
2 .3 267 267
100 100 100
Z3c Z32
2,30 z,30
Z1Z8 ZZ8
t?. oz. &.oz (!'), 6 J' tJ.67'
.6?/o .67~
0.80~ 1-ot-
' 3,8 ~
100

Appendix E Core Description and
High Pressure Air Meter Results
24

MLR-97-2 Vibratory Effects in Construction of Special Reinforced PCC Pavement Mahaska County, NHS-163-4(11)- - 19-62, WBL Station 384+31 to station 3S9+94, Special Reinforcement
Sample Diameter Length Station Distance Core Target %Air Number (inches) (inches) fromE.Edge lB 4 10.75 3S5+20 5'3" Hit top bars intersection 6;7 lT* 4 10.75 385+20 5'3" It *** 2B 3 10.75 3S5+30 5'5" Avoid both mats 6.0 2T 3 10.75 3S5+30 5'5" It 5.4 3B 3 10.50 385+40 61311 It 5.S 3T 3 10.50 3S5+40 6'3" It 5.4 4B 3 10.00 385+50 6'S" " 5.4 4T 3 10.00 3S5+50 6'S" " 5.0 SB 3 10.75 3S5+60 7'1" II 5.3 5T 3 10.75 3S5+60 7'1" It 5.1 6B* 4 10.25 385+70 . 7'10" Hit bottom bars intersection 5.2 6T 4 10.25 385+70 7'10" " 4.S 7B 4 10.00 3S7+20 10'1" Hit top bars intersection 6.3 7T* 4 10.00 3S7+20 10'1" It 5.0 SB 3 10.25 3S7+30 10'11 11 Avoid both mats 6.0 ST 3 10.25 3S7+30 10'11" It 5.7 9B 3 10.75 3S7+40 12'011 II 5.2 9T 3 10.75 3S7+40 12'0" It 6.2 lOB 3 10.50 3S7+50 13'0" " 4.S lOT 3 10.50 3S7+50 13'011 II 5.2 1 lB 3 10.75 3S7+60 13'11" II 4.2 llT 3 10.75 3S7+60 13'11 11 It 4.9 12B** 4 10.50 3S7+70 17'8" Hit bottom bars intersection 5.4 12T 4 10.50 3S7+70 17'S" II 5.4
Average 5.4 * Calculation accounts for steel ** Steel not in core ***Invalid test results
% Air Averages Total for Cores l - 12 5.4 Problem Considerations Total for Top 5.3 l. Improve positioning of steel mat Total for Bottom 5.5 2. No significant change to vibration TotalCoresl-6 5.5 3. To reduce surface mat pattern: Total Cores 7 - 12 5.3 - Use paver super-smoother Total for Top 1 - 6 5.1 - Increase slump Total for Bottom 1 - 6 5.7 - Cause auxiliary vibrators to Total for Top 7 - 12 5.4 systematically touch steel bars Total for Bottom 7 - 12 5.3
25

Appendix F Auxiliary Vibrator Use
26
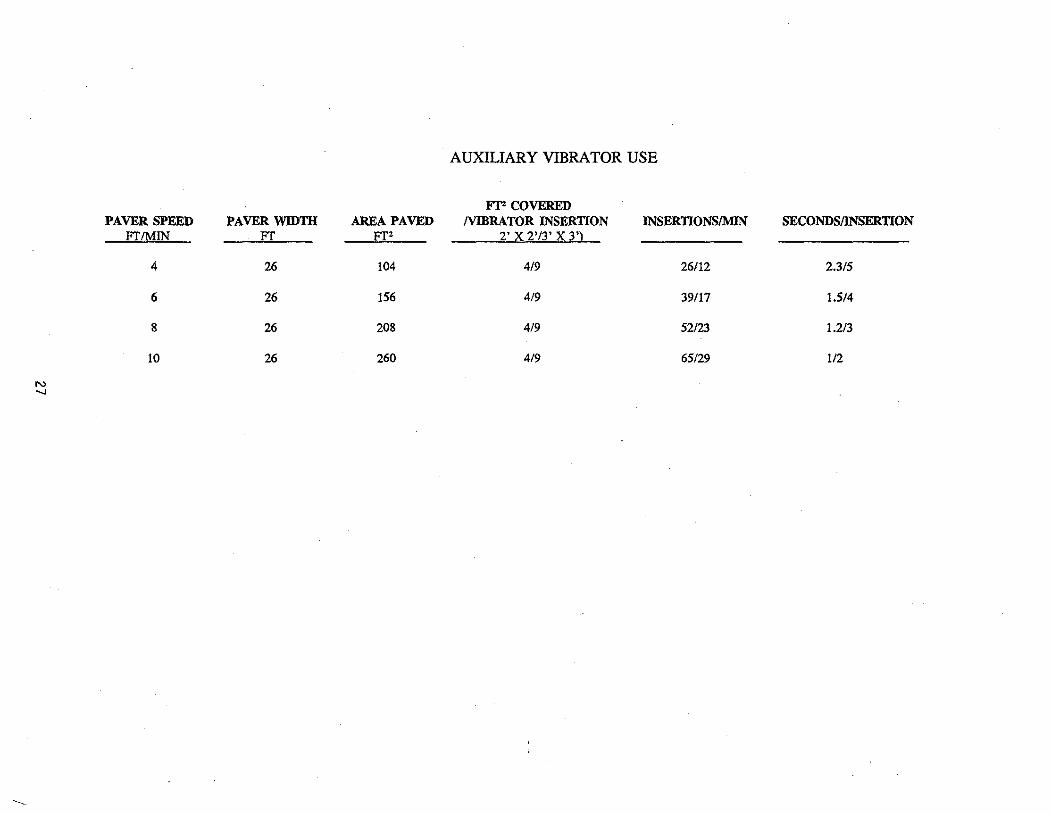
AUXILIARY VIBRATOR USE
Fl" COVERED PAVER SPEED PAVER WIDTH AREA PAVED /VIBRATOR INSERTION INSERTIONS/MIN SECONDSllNSERTION
Ff/MIN Ff FJ'Z 2' x 2'/3' x 3')
4 26 104 4/9 26/12 2.3/5
6 26 156 4/9 39117 1.5/4
8 26 208 4/9 52/23 1.2/3
10 26 260 4/9 65/29 112
N ...,
---