vibrational spectroscopy - s u
TRANSCRIPT

Andreas Barth: Vibrational Spectroscopy
VIBRATIONAL SPECTROSCOPY
LITERATURE
[At] P W Atkins: Molecular Quantum Mechanics, Oxford University Press, Oxford, (1983)
[Ar] J L P Arrondo et al., Prog Biophys Mol Biol 59 (1993) 23-56. Good introduction to FTIR spectroscopy
[B] A Barth, C Zscherp: What vibrations tell us about proteins, Quart Rev Biophys 35 (2002) 369-430
Review on theory and application of IR spectroscopy of proteins
[C] N B Colthup, L H Daly, S E Wiberley, Introduction to infrared and Raman spectroscopy, 2nd edition
(1975), Academic Press, New York Good presentation of theory and discussion of group frequencies
[C1990] N B Colthup, L H Daly, S E Wiberley, Introduction to infrared and Raman spectroscopy, 3rd
edition (1990), Academic Press, New York Good presentation of theory and discussion of group
frequencies
[CS] C R Cantor, P R Schimmel: Biophysical Chemistry, part II, W H Freeman, NY, 1980 physical basis of IR
spectroscopy
[CD] I D Campbell, R A Dwek: Biological Spectroscopy, Benjamin Cummings Publishing company of
proteins
[DBE] P Douglas, HD Burrows, RC Evans, Foundations of Photochemistry: A Background on the Interaction
Between Light and Molecules in Applied Photochemistry, RC Evans (ed.), Springer, 2013
[Ga] H J Galla: Spektroskopische Methoden in der Biochemie, Thieme, Stuttgart, 1988, in German
[Go] E Goormaghtigh et al, Subcell Biochem 23 (1994) 329-450 3 very good reviews on IR spectroscopy of
proteins
[H] P I Haris, TIBS 17 (1992) 328-333 Introduction to secondary structure analysis
[HJH] K E van Holde, W C Johnson, P S Ho: Principles of physical biochemistry, Pearson, Upper Saddle
River, (2006)
[J] M Jackson et al., Biophys Chem 68 (1997) 109-125 medical applications of IR spectroscopy
[KW]P Klán, J Wirz: Chapter 2 in Photochemistry of Organic Compounds. From Concepts to Practice (very
good summary of the basics of spectroscopy, online available for SU
http://onlinelibrary.wiley.com/doi/10.1002/9781444300017.ch2/summary)
[L] D A Long: The Raman Effect: A Unified Treatment of the Theory of Raman Scattering by Molecules, John
Wiley & Sons 2002
[Mä] W Mäntele, TIBS 18 (1993) 197-202. Overview over IR difference spectroscopy
[S] W K Surewicz et al, Biochemistry 32 (1993) 389-394. Discussion of the problems of secondary structure
analysis with IR
[S] F Siebert, Meth of Enzymol, 246 (1995), Overview over biological applications of IR spectroscopy
[Ma] H H Mantsch, J Mol Struct 113 (1984) 201-212 Lipid phase transitions
1

Andreas Barth: Vibrational Spectroscopy
[W] J Weidlein, U Müller, K Dehnicke: Schwingungsspektroskopie: Eine Einführung, Thieme Stuttgart, (1988)
Good presentation of IR spectroscopy, in German
[Z] C Zscherp, A Barth, Biochemistry 40 (2001) 1875-1883 Overview over reaction-induced IR difference
spectroscopy
Videos
https://www.youtube.com/watch?v=46FMOc2msDM&list=PLm9edRZ1r8wVT2KTSwE87g3zmaYuDvhsQ
How to read my handouts
Some of my handouts contain supplementary information. These sections are indicated by small print. They
represent additional information for those who are interested, but are not required for the examination.
Essential knowledge
1. Answer the following questions regarding infrared spectroscopy:
a) What component(s) of the electromagnetic radiation interact(s) with the molecule (electric field,
magnetic field, or both)? (0.5 p)
b) Is the incident radiation absorbed, elastically scattered, or inelastically scattered in the interaction? (0.5
p)
c) Describe the interaction according to the classical view. (2 p)
d) Describe the interaction using the quantum mechanical view of the interaction. Draw a scheme that
shows the potential energy as a function of the distance between two nuclei in the harmonic
approximation, the energy levels relevant for infrared spectroscopy, and relevant transitions. Describe and
explain what you have plotted. (2.5 p)
e) What molecular property determines whether the transition probability is high or low? The property
should be relevant only for infrared spectroscopy, not for spectroscopy in general. (0.5 p)
2. Answer the following questions regarding Raman spectroscopy:
a) What component(s) of the electromagnetic radiation interact(s) with the molecule (electric field,
magnetic field, or both)? (0.5 p)
b) Is the incident radiation absorbed, elastically scattered, or inelastically scattered in the interaction? (0.5
p)
c) Describe the interaction according to the classical view. (2.5 p)
d) Describe the interaction using the quantum mechanical view of the interaction: draw a scheme that
shows the energy levels relevant for Raman spectroscopy and relevant transitions. Describe and explain
what you have plotted. (1 p)
e) Plot a spectrum of the detected radiation and describe what you have plotted. Comment on the relative
intensities of the signals that you plot. (1 p)
2

Andreas Barth: Vibrational Spectroscopy
f) What molecular property determines whether the transition probability is high or low? The property
should be relevant only for Raman spectroscopy, not for spectroscopy in general.(0.5 p)
Examples for general knowledge
1. What transitions are observed in infrared and Raman spectroscopy?
2. What changes when infrared light is absorbed by a molecule, electronic state, equilibrium distance,
vibrational amplitude, vibrational frequency and/or dipole moment at equilibrium distance?
3. What constituent of molecules oscillates in the vibrations relevant for infrared and Raman spectroscopy?
4. Define stretching and bending vibration.
5. Draw a harmonic potential with the energy levels of an harmonic oscillator with correct labeling of the
axes. Indicate the transition that is observed in most cases.
6. Describe the absorption of infrared light according to the classical view.
7. Describe the Raman effect.
8. What is band assignment in infrared spectroscopy?
9. What vibration gives rise to an absorption band that is often used to detect conformational changes?
Which atoms move most in this vibration?
10. Describe the effect of isotope labeling on an infrared spectrum.
11. Name some advantages and disadvantages of infrared spectroscopy
12. Discuss influence of mass and force constant on the vibrational frequency.
13. List information that can be obtained from vibrational spectra.
14. State the selection rules for the absorption of infrared light and for Raman scattering.
15. Describe a Fourier transform spectrometer.
16. Describe secondary structure analysis using the amide I band of proteins.
17. Describe Fourier self-deconvolution.
18. Discuss the principle of reaction-induced infrared difference spectroscopy.
19. Define wavenumber and state its unit.
20. What is the advantage of reaction-induced infrared difference spectroscopy?
21. What is a difference spectrum and what do positive and negative bands in a difference spectrum mean?
22. What kind of information can be deduced from time-resolved infrared difference spectra without any band
assignment?
23. What kind of information can be deduced from time-resolved infrared difference spectra when a certain
band has been assigned to a particular molecular group?
24. What information can be obtained from the spectral position of the C=O band of protonated carboxyl
groups?
25. Name some strategies for band assignment in infrared spectroscopy and give some examples.
3

Andreas Barth: Vibrational Spectroscopy
Examples for functioning knowledge
1. Compare the energy of a typical vibrational transition with thermal energy and decide whether most of the
oscillators are in the ground state or not.
2. Predict changes in frequency due to changes in structure or environment.
3. Predict the relative frequencies of different chemical groups (i.e. group A has higher or lower frequency
than group B) from general knowledge on the influence of mass and force constant on frequency.
4. Predict whether a vibration is a strong infrared absorber or not from your knowledge on the selection rules
for absorption of infrared light.
5. Predict whether a vibration is a strong Raman scatterer or not from your knowledge on the selection rules
for Raman scattering.
6. Draw the spectrum of light that is scattered in a Raman experiment.
7. Discuss problematic aspects of secondary structure analysis using the amide I band.
8. Construct a difference spectrum of a reaction from the absorption spectra before and after the reaction.
9. Interpret certain aspects of an infrared difference spectrum.
10. Suggest an infrared experiment to study a certain aspect of a biomolecule or a biological process.
11. Construct a difference spectrum from given absorption spectra.
12. Attribute positive and negative bands to reactants and products of a reaction.
13. Suggest and describe an experiment that proves whether a certain amino acid gets protonated in the course
of a protein reaction.
14. Draw conclusions from infrared difference spectra using the fingerprint approach.
Introduction
We will consider here two forms of vibrational spectroscopy: infrared spectroscopy and Raman spectroscopy.
The physical process that gives rise to the spectroscopic signal is different for the two techniques but the
information that can be obtained from the spectrum is the same. Therefore we will concentrate mainly on
infrared spectroscopy but keep in mind that Raman spectroscopy provides the same kind of information.
Why Infrared spectroscopy?
An infrared spectrum contains enough
information to deduce the structure of
small molecules from the spectrum. For
biological systems this is no longer
possible because they are too
complicated. However, certain aspects
of structure and interaction can be
4

Andreas Barth: Vibrational Spectroscopy
followed in a time-resolved way. It is
possible to follow the fate of single
amino acids in a large protein during a
protein reaction, for example one can
observe how the environment of this
group changes, or how the protonation
state changes.
Infrared spectroscopy is widely used in
industry as an analytical method for
example in quality control. It can also be
used for more exotic purposes, for example
to track down a driver who failed to stop
after an accident from traces of paint left at
the site of the accident. It is less used in
industry for biological problems. However,
there will be increasing application of IR
spectroscopy due to the high information
content. For example it is possible to
identify bacterial strains from the infrared
spectrum and to classify the relationship of
bacteria. Or it is possible to diagnose
diseased tissue. Here is an example: Shown
are the spectra of healthy (black) and
leukaemic lymphocytes (red). The spectra
are clearly different indicating that diseases
can be diagnosed using IR spectroscopy.
Example for medical applications: Spectrum of healthy(black) and leukaemic (red) lymphozytes (redrawn fromJackson et al. 1997, Biophys. Chem. 68, 109-125, IR-Rev 6,Fig 5). The arrows point to spectral regions that indicate ahigher nucleic acid content in the leukaemic cells. The proteinabsorption near 1650 cm- 1 indicates relative concentrationchanges and/or a different overall structure of the proteins.
5

Andreas Barth: Vibrational Spectroscopy
Advantages - Disadvantages
+ high information content of the spectrum
+ applicable from small soluble to large membrane proteins
+ easy sample preparation for standard measurements
+ often short measuring time
+ high time resolution (μs with moderate effort, ns with pump-probe techniques)
+ not expensive (simple spectrometer for 25 000 Euros)
+ low amount of sample required (10 to 100 μg)
- absorption coefficients smaller than in the visible spectral region. Therefore high protein concentrations
required for some applications
- high water absorbance requires a short optical pathlength and therefore high sample concentrations
- calculation of the absorption spectrum is difficult
History
IR radiation was discovered in 1800 by the astronomer and musician F.W. Herschel (Sir William). In his
experiment sunlight passed a prism and dispersed the spectrum into its spectral components. With a
thermometer he measured the temperature in dependence of the wavelength. Interestingly the maximum of the
temperature curve was outside the visible spectrum, beyond the red part of the spectrum. This was the first
detection of infrared radiation and its name stems of course from the spectral position. The radiation appears
warm and is also called heat radiation, since it is emitted from a body at a given temperature according to
Planck´s radiation law. Herschel discovered already that water absorbs infrared radiation.
1835 the first spectrometer was built
1913 the first commercial spectrometer was built. Recording a spectrum was only interesting for some exotic
scientists, since it required a lot of effort, took several hours and happened at night in dark and temperature-
controlled cellar rooms.
The second world war saw an explosion of applications numbers for spectrometers in use were for example for
the USA 1939 4 industrial spectrometers, 1945 400; for GB 1938 15 und 1947 500. From approx. 1950,
infrared spectroscopy was used also for biological problems (sorry, this is just for me: IR-Allg/a1, IR-Rev 6).
Since the introduction of Fourier transform infrared spectroscopy 30 years ago the numbers of application have
increased dramatically.
6

Andreas Barth: Vibrational Spectroscopy
Energy of IR radiation
You will be familiar with spectroscopy in the visible and ultraviolet spectral range. In this range electronic
transition are observed. The absorption of infrared radiation is the process that comes next at lower energies: the
excitation of vibrational and rotational transitions. The energy required for a transition is approximately a factor
of 10 smaller than for electronic transitions. The spectral region is adjacent to the visible spectral region and
extends from 0.7µm to 1000µm, which is the infrared spectral region. In most cases the region from 2.5 to
25µm is used.
The process coming next at lower energies is the excitation of electronic angular momentum transitions in
electron paramagnetic resonance (EPR or ESR) which needs 1000 to 10000 fold less energy. At even lower
energies NMR transitions are observed. This is summarized below:
UV > Vis > IR > kT > EPR > NMR (with the thermal energy kT)
IR spectroscopists do not use the wavelength in µm to plot their spectra but rather the inverse of the
wavelength, the wavenumber ῦ in cm-1). This quantity has the advantage of being proportional to the energy but
at the same time the wavelength can easily be calculated. The region of 2.5 to 25 µm corresponds to 4000 to
400 cm-1, which corresponds to 1013 to 1014 Hz. In the lecture we will only discuss vibrational transitions, since
there are no rotational transitions observed in solution. However, in the infrared spectral region not only
vibrational transitions can be excited but also low-energetic electronic transition. This is the case for some
semiconductors and this is exploited for infrared detectors. But also in biological systems there are low-energy
electronic transitions. An example is the chlorophyll dimer of some photosynthetic reaction centers.
Vibrations
VIBRATIONAL FREQUENCY OF A 2-ATOMIC OSCILLATOR
The vibrations that give rise to the absorption of infrared radiation are the vibrations of the atoms in a molecule.
As these can be quite complicated, we will start with the most simple case: the vibration of a 2-atomic
oscillator. We will first discuss the vibrational frequency and later the absorption of energy by the oscillator.
The two atoms have masses m1 and m2. The equilibrium distance between the two atoms is denoted by R and we
can think of the molecule as two balls connected by a spring. We denote the force that holds the two atoms
together by F and the deviation of the actual distance from the equilibrium distance by R. In the harmonic
approximation, Hooke's law is valid, which says that the force F is proportional to R, the deviation from the
equilibrium distance. The proportionality constant is the force constant and denoted by k. We obtain for the
force F:
F = -k R
where k is the force constant
7

Andreas Barth: Vibrational Spectroscopy
Solving Newton's equation with this expression for force, we can calculate the the vibrational frequency of
the two-atomic oscillator
= (k /mr)0.5/2
with the reduced mass mr:
(1/mr =1/m1+1/m2)
The stronger the force constant, i.e. the stronger the bond between the atoms, the higher is the frequency. The
smaller the masses, the higher is the frequency.
(The unit for the force constant is N/m with 100 N/m = 1 mdyn/Å)
TYPES OF VIBRATIONS
In a molecule with several atoms different types of vibrations are distinguished: stretching vibrations, bending
vibrations and torsional vibrations. In stretching vibrations (abbreviated ) the length of the bond changes, in
bending vibrations (abbreviated ) the bond angle of a 3-atomic fragment of the molecule (think of scissors) and
in torsional vibrations (often abbreviated ) the dihedral angle of a 4-atomic fragment of the molecule (think of
twisting a rod or an eraser).
Exa
mples for bending vibrations (left hand side, CH2 scissoring vibration) and a torsional vibration (right hand
side, CH2 rocking vibration)
SOME VIBRATIONS OF ACETYL PHOSPHATE
The videos of this lecture illustrate some of the vibrations of a small molecule: acetyl phosphate.
NORMAL MODES
General description
Bond lengths and angles are called internal coordinates of a molecule. Usually, several of them are coupled:
they oscillate together with the same frequency and pass through their equilibrium position at the same time. A
motion like this is called a normal mode of vibration. Approximately, a normal mode vibrates independently
from all other normal modes. Some normal modes are localized on a small part of the molecule, for example on
a C=O bond. They are called group vibrations. Others involve many atoms of a molecule and their frequencies
8

Andreas Barth: Vibrational Spectroscopy
characterize the chemical structure and conformation of the entire molecule like a fingerprint. A system with N
atoms has 3 N degrees of freedom (3 for every atom). 3 degrees of freedom describe translation of the whole
molecule, 3 rotations of the whole molecule and the remaining 3N-6 degrees of freedom are vibrational degrees
of freedom. Linear molecules have 3N-5 vibrational degrees of freedom because the rotation around the
symmetric axis does not count as a rotational degree of freedom because the nuclei do not change their position.
Every vibrational degree of freedom can be described by a normal mode (of vibration). This gives 20 000
normal modes for an average E. coli protein and to nearly 109 normal modes for E. coli DNA.
Normal modes of CO2
I would like to illustrate now some of the above with an examples. We first examine CO2. How many vibrations
do we expect? CO2 is linear, so we expect 3N-5 = 4 vibrational degrees of freedom or normal modes: 2
stretching vibrations and 2 degenerated bending vibrations.
The two stretching vibrations are illustrated below. Both the symmetric and the antisymmetric stretching
vibration are normal modes. Each normal mode consist of two coupled stretching vibrations. In other words,
two internal coordinates, that is the bond lengths of the two C=O bonds, are coupled in each normal mode. In
the symmetric vibration, the two stretching vibrations are in phase. In the antisymmetric vibration, the two
stretching vibrations are 180 degrees out of phase. The two normal modes have different frequencies, that of the
antisymmetric vibration is higher than that of the symmetric vibration. The frequency of a single C=O bond
would be in between these two frequencies.
Stretching vibrations of CO2. Shown are the two extreme positions of the vibrations for the two stretchingvibrations (antisymmetric stretching vibration as and symmetric stretching vibration s) as well as theequilibrium positions of the atoms. When the equilibrium positions are shown, the arrows indicate themovement of the oxygen atoms.
9

Andreas Barth: Vibrational Spectroscopy
Why are the antisymmetric and symmetric stretching vibrations normal modes, but the stretching vibrations of
the individual C=O bonds not? The answer is that normal modes vibrate independently from each other. When
one vibrates, the other is not affected. This is not true for the individual C=O bonds. The are coupled by the
movement of the central carbon atom. When one C=O bond starts to vibrate, the movement of the central
carbon atom will also make the other C=O bond vibrate. Therefore, these vibrations are not independent and are
not normal modes.
Tree trunk
The concept of normal modes is not limited to molecules. Sometime one can observe them in unexpected
locations, for example in a forest. In the videos of this lecture I show some vibrations of a tree trunk that was
disrooted by a storm. The stem was lying on a slope and the end was free to oscillate as indicated in the image.
First I bent the stem downwards and let it oscillate. So
the initial vibration was vertically, it became then
circularly, then horizontally, later again circularly and
so on. Obviously, inducing the vertical vibration
generates other movements as well, in particular the
horizontal vibration. This shows that there is an
interaction between vertical vibration and horizontal
vibration, in other words both are coupled and they are
not independent from each other. Therefore, the
vertical vibration is not a normal mode of vibration for
this stem.
When I bent the stem horizontally a similar sequence of vibrations occurs. When the horizontal vibration is
initiated, other movements are generated with time, in particular the vertical vibration. Therefore, also the
horizontal vibration is not a normal mode of vibration. So what are the normal modes of this stem?
Next I bent the stem upwards and to the side at the same time to induce a diagonal vibration. This vibration
does not change with time and it is therefore not coupled to any other vibration. Therefore the diagonal
vibration is a normal mode of the system. It can be thought to be a superposition of the horizontal vibration and
the vertical vibration. Similarly, the normal modes of molecules are composed of vibrations of several internal
coordinates.
The general motions of such a system of coupled oscillators can be described by a superposition of the normal
modes, even the complicated motions of the tree trunk that were described above.
10

Andreas Barth: Vibrational Spectroscopy
INFLUENCES ON THE VIBRATIONAL FREQUENCY
Absorption regions at the example of a microalga
We will now look into the different factors that influence the vibrational frequency of a normal mode. We will
see later that this frequency corresponds to the frequency of the absorbed infrared light. Therefore, the
vibrational frequency determines where in the spectrum the absorption band of that vibration will be found.
That is the reason why infrared spectroscopy is one of the methods of vibrational spectroscopy. A further
method is Raman spectroscopy. Because Raman spectroscopy detects also vibrations, generally the same
information can be obtained from a Raman spectrum. We will discuss Raman spectroscopy a bit later. But for
now we will continue with the discussion of what influences the vibrational frequency and we use an infrared
spectrum of a dried microalga to illustrate the general principles. The infrared spectrum is plotted against the
quantity wavenumber in units of reciprocal centimeters. I have also indicated the corresponding wavelengths
below the wavenumber scale. The wavelength range of the plotted spectrum spans from just above 2 m to 10
m. Note again, that plotting from high to low wavenumbers is equivalent to plotting the spectrum from short
to long wavelength. The spectral range plotted here belongs to the mid-infrared range which is used in most
bioanalytical studies. In the vertical direction, the quantity absorbance is plotted. This quantity does not have a
unit.
Infrared spectrum of a micro-alga. Spectrum recorded by J. Andersson.
Influence of the masses
As already mentioned, there are two main influences on the vibrational frequency: the force constant and the
masses of the vibrating atoms. Both factors lead to the effect that vibrations of certain molecular groups appear
in defined spectral regions.
We discuss first the effect of the mass. Hydrogen is the atom with the lowest mass and therefore stretching
vibrations involving hydrogen have the highest frequencies and the highest wavenumbers (3700-2800 cm-1).
Stretching vibrations involving two heavier atoms, for example CO, CN, or CC stretching vibrations are found
11

Andreas Barth: Vibrational Spectroscopy
at lower wavenumbers (for single and double bonds below 1800 cm-1). They are also found at lower
wavenumbers outside the spectral range shown here.
The mass effect does not only influence the positions of an absorption band in the spectrum. It is also the basis
for an important interpretation tool, as it is used to assign absorption bands to specific vibrations. First the
infrared spectrum of the sample is recorded. Then, the experiment is repeated with a sample where one has
introduced an isotopic substitution at a specific position. This does not change the force constant but only the
masses. The vibrational frequency shifts and this identifies the absorption band or bands to which the
substituted atoms contribute.
A simple isotopic exchange experiment is the use of deuterium oxide, D2O, instead of ordinary water as a
solvent. This makes acidic groups like NH, OH, and SH groups exchange their proton for a deuteron. As a
consequence, the absorption bands in the infrared spectrum shift and reveal the participation of these groups in
the corresponding vibrations.
A second benefit of using D2O is to shift the strong absorption band of ordinary water at 1640 cm-1 to ~1200
cm-1, since the region around 1640 cm-1 is of special interest for secondary structure analysis of proteins.
Influence of electron density
For stretching vibrations, the force constant depends on the electron density in the vibrating bond. The higher
the electron density, the higher the force constant and the higher the vibrational frequency. For double and triple
bonds the force constant is approximately twice or three times that of a single bond. Therefore double and triple
bonds absorb at higher wavenumbers than single bonds. Single bonds absorb at the lower end of the spectrum
shown above, double bonds near 1600 cm-1 and triple bonds near 2200 cm-1. You do not need to remember these
numbers, but you should remember the general trend. Note also that the vibrational frequency, and thus the
wavenumber, both depend on the square root of the force constant. Therefore the wavenumber of double bonds
is approximately 1.4 times higher than that of single bonds.
The electron density may change due to environmental effects for example when an enzyme “prepares“ the
substrate for the catalytic reaction. These changes are detectable in the infrared spectrum and are important
clues for the understanding of the catalytic mechanism.
Influence of the type of vibration
It is easily imagined that shortening or elongation of a bond meets stronger resistance than a movement
perpendicular to the bond. Therefore the force constant of stretching vibrations is typically a factor of 10 larger
than that of bending vibrations and stretching vibrations have the higher frequency. For example, stretching
vibrations involving hydrogen are found in the 3000 cm-1 range, whereas the corresponding bending vibrations
absorb below 1700 cm-1.
12

Andreas Barth: Vibrational Spectroscopy
Group vibrations
Normal modes are in general composed of the vibrations of several internal coordinates, like bond stretching or
band angle vibrations. However, in many cases, a normal mode involves mainly the vibration of one or of a few
internal coordinates. These vibrations are relatively independent from the rest of the molecule and are called
group vibrations. A good example are C=O double bonds which absorb between 1800 and 1600 cm-1. In
general, the region of group vibrations is found above ~ 1500 cm-1 and involves stretching vibrations of double
bonds and of groups involving hydrogens.
In contrast, below ~1300 cm-1 many vibrations are strongly coupled to other vibrations and the position of an
absorption band strongly depends on a large part of the structure of a molecule. Therefore this region is called
fingerprint region. It is characteristic like a fingerprint for the molecular structure. The fingerprint region is
therefore very important for the determination of structures of small molecules by infrared spectroscopy.
Summary
In summary, the approximate position of an infrared absorption band is determined by the vibrating masses, the
bond strength (single, double, triple), and the type of vibration. For the biological sciences, the effect of the
environment is often the most interesting since it gives clues on the catalytic mechanism of enzymes.
Assignment
After explaining these general properties of vibrations, we will now discuss the main bands in the showninfrared spectrum of a microalga and reveal the vibrations that cause these absorption bands. In other words, wewill assign the observed absorption bands to the vibrations that cause them. Accordingly, this analysis of thespectrum is called band assignment.
As already mentioned, we find the absorption of XH stretching vibrations at the high wavenumber end of themid-infrared spectrum. OH and NH stretching vibrations absorb above 3000 cm-1. They provide information onthe water content of the sample and on the hydrogen bonding strength to these groups. As this spectrum is froma dried sample, the water content is very low. For a sample in aqueous solution, this water band would be thestrongest absorption band of the sample.
At lower wavenumbers - around 2900 cm-1 - a complicated band profile can be seen. This is still in the region ofXH stretching vibrations and can be assigned to CH stretching vibrations. These vibrations are abundant inlipids and therefore the CH stretching bands provide information about the lipid content, the conformationaldisorder of the lipid chains and they can be used to study lipid phase transitions.
Below the CH stretching vibrations, there is a large region in the spectrum with very weak absorption from
biological samples. The next band (~1740 cm-1) is found in the region of CO double bond stretching vibrations
and the first band here stems again from lipids. As for the CH stretching band, this band can be used to study
lipid content, lipid phase transitions, but also the hydrogen bonding to the lipid carbonyl group.
13

Andreas Barth: Vibrational Spectroscopy
The next band in the CO double bond region is very prominent and also very important one for protein analysis.
It is the amide I band of proteins (1700 - 1600 cm-1) which is caused by the so called amide I vibrations of the
polypeptide backbone. Several internal coordinates contribute to this normal mode, but the main contribution is
the CO double bond stretching vibration of each peptide group. This band provides information about protein
content, but also on the secondary structure of proteins and in consequence also on protein aggregation. In the
same region, also the HOH bending vibration of water is absorbing. In the shown spectrum, there is very little
contribution from water absorption because the sample was dried. However, in spectra of proteins in aqueous
solution, the water absorption is usually by far the dominating contribution in this spectral region. This is
unfortunate and restricts the experimental conditions as we will discuss later.
The next band at lower wavenumbers is again a protein band (~1550 cm-1). This band is called amide II band
and stems from the so called amide II vibrations of the protein backbone. This normal mode consists mainly of
the NH bending vibration and the CN stretching vibration of each peptide group. Also this band provides
information about protein content and protein secondary structure. It can also be used to study hydrogen bond
stability.
The next band (~1455 cm-1) is also assigned to bending vibrations, in this case to the bending vibrations of
methyl and methylene groups. This band is little used for analysis. This is also true for the following band
(~1385 cm-1) which can be assigned to another bending vibration of methyl groups.
At lower wavenumbers (~1240 cm-1), the antisymmetric stretching vibration of PO2- groups gives rise to a
prominent band. PO2- groups are found in polynucleotides and in lipids. It is sensitive to the interaction of the
phosphate groups with the environment and depends also on the conformation of DNA.
Finally, the intense and broad band (1200-1000 cm-1) at the lower end of the spectral range shown in this
spectrum stems mainly from CO and CC single bond vibrations found in carbohydrates. These vibrations
couple well because the frequencies of the isolated bonds are similar. Thus they give rise to delocalized normal
modes that extend over a larger part of the molecule. These normal modes depend on the structure of the
molecule and are thus different for different carbohydrates. Therefore the absorption in this spectral range can
be used to study the carbohydrate composition of a sample. Not surprisingly, the carbohydrate band is found in
the fingerprint region of the infrared spectrum where the absorption is characteristic of the molecular structure
as a fingerprint is characteristic of a person.
There is also a contribution to this band from the symmetric stretching vibration of PO2- groups but in the case
shown here, this contribution is minor. Nevertheless this contribution illustrates an important point. In most
regions of the infrared spectrum of complex biological samples, several groups from different molecules
contribute to a particular absorption band. Thus the assignments I have just discussed, are assignments to the
groups and molecules that dominate the absorption in a particular spectral region. This does not exclude that
other groups and other molecules also absorb in that region.
In this section I have given you an overview about the main features in an infrared spectrum of biological
samples. It is not necessary that you learn all these features by heart, but I recommend you to recapitulate how
14

Andreas Barth: Vibrational Spectroscopy
the assignments in this section fit with the general principles that we discussed in the section before.
Information that can be derived from the infrared spectrum
IN GENERAL
Structure and geometry of the vibrating group and the electron density distribution determine the vibrational
frequency. Both are influenced by the environment. Therefore, the following information can be derived from
the infrared spectrum.
CHEMICAL STRUCTURE
The chemical structure of a molecule is the dominating effect that determines the vibrational frequencies via the
strengths of the vibrating bonds and the masses of the vibrating atoms. This effect may seem to be of minor
relevance to biophysicists since the chemical structure of a large biomolecule cannot be deduced from the
vibrational spectrum and will be often inert in biophysical investigations. However this is not always the case
and I will name a few examples for structural changes that occur in protein studies.
Changes to the protonation state of side chains is an important example. Protonation and deprotonation
reactions are often essential steps in a catalytic mechanisms. Here, vibrational spectroscopy seems to be the
method of choice since the protonation state of most side chains is reflected in the spectrum, whereas X-ray
crystallography usually can not detect the protonation state of side chains.
Some examples for protonation and deprotonation reactions are given:
- protonation of Asp and Glu residues accompanies proton pumping by bacteriorhodopsin,
- proton transfer reactions are often coupled to electron transfer reactions,
- protonation is a mechanism for charge compensation when a positive ion is released from negatively charged
protein residues.
The following illustrate how protonation reactions can be detected in the infrared spectrum.
15

Andreas Barth: Vibrational Spectroscopy
A protonated carboxylic acid has a C=O
double bond and a C-OH single bond, which
oscillate with high and low frequency,
respectively. The deprotonated form has two
bonds with intermediate electron density
(between single bond and double bond); the
density in both bonds is the same. This makes
the force constants in the two bonds equal
and because of this the two vibrations couple
as in CO2. Accordingly, there are two bands
for the deprotonated form, one for the
antisymmetric stretching vibration as and
one for the symmetric stretching vibration s.
Because the electron density in the CO bonds of the deprotonated carboxyl group is intermediate between those
of a single and a double bond, the average frequency of its two vibrations is between that of the C=O vibration
and that of the C-OH vibration of the protonated carboxyl group.
Other examples for an alteration of chemical structure are protein modifications like phosphorylation and the
monitoring of the chemical reactions that are catalyzed by enzymes.
REDOX STATE
Redox reactions are the basis of the energy delivering processes photosynthesis and respiration in living
organisms. They affect the electron density distribution of a given molecule. This will modify the force
constants between the atoms and thus will alter its vibrational spectrum. Because of this sensitivity, redox-
active cofactors involved in photosynthesis could be investigated. These studies could assign signals in the
protein spectra to specific functional groups of the cofactors and in consequence statements about their protein
environment.
BOND LENGTHS AND BOND STRENGTH
Vibrational frequencies are correlated with bond length and bond order of the vibrating bonds. These
correlations are valuable for the understanding of the catalytic mechanism of enzymes since they reveal how an
enzyme perturbs the bonds of the catalytically active groups.
A very good correlation is shown in the figure. It correlates a particular phosphate bond length and one
particular phosphate vibration. This particular PO bond length can be determined with an amazing accuracy of
0.2 pm from the vibrational spectrum.
16

Andreas Barth: Vibrational Spectroscopy
Example for a correlation between structure andvibrational spectrum. It is based on densityfunctional theory calculations (done by M. Rudbeck)on models of phosphorylated amino acids. Thecorrelation is between the shortest PO bond ofphosphate groups and the wavenumber of theasymmetric –PO3
2- stretching vibration (P.Pettersson, A. Barth, RCS Advances 2020).
An example where such a correlation was applied to protein studies is pyruvate binding to lactate
dehydrogenase which leads to a downshift of the pyruvate C=O band of 35 cm-1. This large shift corresponds to
a change in bond length of only 0.02 Å or 2 pm (Callender & Deng Annu. Rev. Biophys. Biomol. Struct. 1994)!
Note what small differences in bond length can be measured by vibrational spectroscopy. This "spatial
resolution" is higher than that of other methods and provides insight into the molecular details of the catalytic
mechanism. On the other hand, not all bonds can be predicted with the same accuracy as in the example shown.
BOND ANGLES AND CONFORMATION
Vibrations are often coupled and this coupling depends on details of the molecular geometry. Therefore,
coupling often provides insight into the three-dimensional structure of molecules. A simple example are the two
coupled CO vibrations in the COO- group. Their coupling and thus the frequency of the two stretching modes
(normally observed near 1400 and 1570 cm-1) depends upon the electron density in and the angle between the
two CO bonds. In the hypothetical extreme cases of the angles of 90° and 180°, coupling is zero for 90° but is
strongest for 180°. In addition, coupling is strongest when the two bonds oscillate with the same frequency and
therefore depends on the electron density distribution in the carboxylate group. As a consequence, the
frequencies of the two modes may shift considerably upon cation chelation (Deacon & Phillips 1980; Tackett
1989; Nara et al. 1994) which can be explained by changes of bond lengths and angles (Nara et al. 1996). The
effects depend upon the mode of chelation and have been valuable in studies of several Ca2+ binding proteins
(Nara et al. 1994; Fabian et al. 1996; Mizuguchi et al. 1997a).
A second example are the amide groups of the protein backbone. The Coulomb interactions between them
couple the vibrations of one amide group to the same vibrations of other amide groups. This coupling depends
on the three-dimensional structure of the protein backbone. As discussed in more detail later, this coupling
makes the absorption of the amide groups sensitive to the secondary structure.
17

Andreas Barth: Vibrational Spectroscopy
INFORMATION ON NEIGHBORING GROUPS WITHIN THE MOLECULE VIA MESOMERIC AND
INDUCTIVE EFFECTS
When we study the vibration of a given bond in a molecule, its electron density will be influenced by the
neighboring groups in the molecule and this will have an effect on the vibrational frequency. An example is a
keto group (C=O) with different neighbors.
The C=O bond is polar which can be described by two mesomeric structures (left and middle structure in the
Fig. below). These mesomeric structures are used when a molecule cannot be represented by a valance bond
structure. The mesomeric structures have no physical meaning as such, they are not two structures in
equilibrium, but they represent limiting cases. The real structure is a weighted average of the mesomeric
structures. How much each structure contributes depends upon the substituents. They exert two types of effects:
mesomeric and inductive effects.
The mesomeric effect is due to the delocalization of electrons. According to IUPAC it is "The effect (on
reaction rates, ionization equilibria, etc.) attributed to a substituent due to overlap of its p- or π-orbitals with the
p- or π-orbitals of the rest of the molecular entity. Delocalization is thereby introduced or extended, and
electronic charge may flow to or from the substituent." A group that attracts electrons out of the bond has a -M
effect and is an electron acceptor and a group that can donate electrons into a neighboring bond has a +M effect
and is called electron donor.
The inductive effect is an electrostatic effect caused by differences in electronegativity of the atoms. In IUPAC's
golden book, the inductive effect is defined as "an experimentally observable effect (on rates of reaction, etc.) of
the transmission of charge through a chain of atoms by electrostatic induction." The inductive effect makes
bonds polar (positive and negative partial charges on the atoms) which reduces the electron density in these
bonds. Positive and negative inductive effect are defined with respect to an aliphatic C-H bond. Electronegative
atoms have a -I effect and pull electrons towards them.
Inductive and mesomeric effects make that the C=O bond of keto, ester and amide groups absorbs at different
wavenumbers (see Problems and study questions).
18

Andreas Barth: Vibrational Spectroscopy
Electron withdrawing (-I) substituents stabilize the
mesomeric structure with the C=O double bond,
because they compete with oxygen for the electrons.
This is like a rope contest. If both groups pull with
the same strength, then the middle of the rope
(position of the -electrons of the C=O bond) stays
where it is. The effect is that the C=O bond becomes
stronger.
Electron donating (+I) substituents stabilize the polar
structure C+-O- because they don´t put up resistance
against the electron pull by oxygen. The effect is that
the C=O bond becomes weaker.
[Pixabay]
Substituents with a +M effect also stabilize the polar structure because they donate an electron pair into the C-X
bond which restores the normal number of four bonds around the carbon atom.
HYDROGEN BONDING
The next influence on the vibrational spectrum is
hydrogen bonding. Hydrogen bonds stabilize the
structures of proteins and DNA and are essential for
catalysis. Vibrational spectroscopy is one of the few
methods that directly report on the strength of
hydrogen bonds. As a general rule, hydrogen
bonding lowers the frequency of stretching
vibrations, since it decreases the electron density in
the covalent bonds which lowers the restoring
force. But hydrogen bonding increases the
frequency of bending vibrations since it produces
an additional restoring force. Typically, formation
of a single hydrogen bond leads to a downshift of
the C=O stretching band by 20 cm-1 and the
enthalpy of hydrogen bonding and the distance of
hydrogen bond acceptor and donor can be
quantified using experimental correlations.
Correlation between frequency and O-O distance inOH···O hydrogen bonds (redrawn by C. Baronio fromT Steiner: Angew. Chem. Int. Ed. 2002, 41, 48-76)
19

Andreas Barth: Vibrational Spectroscopy
ELECTRIC FIELDS
Similar to hydrogen bonding, the electric field produced by the environment modifies the electron density
distribution of a given molecule. A strong electric field has been detected for example in the active site of
dehalogenase where it strongly polarizes the product of the catalytic reaction (Carey 1998). For carboxyl groups
in the absence of hydrogen bonding (bands above 1740 cm-1), there is an inverse correlation of the C=O
stretching frequency with the dielectric constant ε (Dioumaev & Braiman 1995).
CONFORMATIONAL FREEDOM
Besides band position and band
intensity, the third spectral
parameter, the band width, is also
useful for a molecular
interpretation. Due to its short
characteristic time scale on the
order of 10-13s, vibrational
spectroscopy provides a snapshot
of the sample conformer
population. As the band position for
a given vibration usually is slightly
different for every conformer,
Inhomogeneous band broadening is
the consequence. Flexible
structures will thus give broader
bands than rigid structures and the
band width is a measure of
conformational freedom. It is
possible to relate band width with
entropy and thus to quantify
entropic effects in catalysis.
Infrared absorption of (for example) a protein vibration. The smallbands are the absorptions of indivudual protein molecules. The largebands are the sum of all individual absorptions. The individual bandpositions differ slightly because each vibrating bond interacts with theprotein environment slightly differently than the others. If the protein israther stiff (left hand side), then the variation in interaction strengthswill be less than for a flexible protein (right hand side). This will lead toa narrower band for the stiff protein.
For molecules that bind to proteins, the restriction of conformational freedom is a natural consequence of
binding. This often reduces the band width by a factor of two. For example, phosphate bands of GTP become
sharper when the nucleotide binds to Ras and ubiquinone is in a more rigid environment when bound to
cytochrome bo3.
20

Andreas Barth: Vibrational Spectroscopy
Vibrational transitions
CLASSICAL VIEW OF THE INTERACTION
The interaction between a vibrating bond and infrared radiation is mediated by the electric field of the
electromagnetic wave. More specific: the interaction is between oscillating partial charges of the vibrating bond
and the electric field. When the vibration and the electric field of the radiation oscillate with the same frequency
and when the electric field is in phase with the velocity of the moving charges, then this velocity will increase
and the vibration absorbs energy from the radiation. A velocity increase means also that the oscillation
amplitude increases. Note however, that the frequency of the oscillation does not change. The effect is
illustrated in the following figure.
The interaction between the oscillating electric field E of an electromagnetic wave and a vibrating bond. Thebond is assumed to be polar and the partial charges of the two atoms are indicated. The electric field vectorindicates the direction of the force exerted on positive charges. v+ is the velocity of the positive partial charge.Left: Electric field E and the vibration oscillate both with the same frequency. As discussed in the mass on aspring chapter in Introduction to Spectroscopy, the driving force (= electric field E in this case) is is phase withthe velocity of the oscillating mass (= atom with partial charge), when absorption occurs. Then the drivingforce increases the maximum velocity of the mass, which increases the oscillation amplitude. When thefrequency of the driving force is the same as that of the mass, the electric field “supports” the vibration at alltimes and increases the amplitude of the vibration.Right: the electric field oscillates faster than the vibrating bond. Now the electric field “supports” the vibrationat some times, but impedes it at other times. Thus there is no net effect over a longer time period.
As we have seen, the interaction between infrared radiation and molecular vibrations depend on the existence of
oscillating partial charges. When there is no partial charge, the electric field has no "handle" to grip the
molecule and there is no interaction. When the partial charges are large, then the interaction is strong and the
absorption is strong.
21

Andreas Barth: Vibrational Spectroscopy
Two partial charges of opposite sign form a dipole, which can be described by a dipole moment. The dipole
moment is just the product of the positive partial charge q and the distance between the partial charges, which is
the bond length L.
= qL
Thus, a prerequisite for the absorption of infrared radiation is an oscillating dipole moment. The absorption
probability (calculated in a quantum mechanical calculation) is proportional to the square of the change of
dipole moment when the oscillator passes through its equilibrium position. This is one of the selection rules for
the absorption of infrared radiation. The larger the partial charges +q and –q, the larger the dipole moment and
the larger the change in dipole moment.
The change in dipole moment with respect to the bond length is independent from the distance and is equal to q:
/L = /L(L0) = q
That is: the larger the oscillating partial charges the stronger the absorption. According to a thumb rule polar
bonds are strong infrared absorbers, apolar bonds weak absorbers or infrared inactive (no absorption). For
example C=O is a strong absorber, C=C absorbs weekly in HFC=CH2, or not at all in H2C=CH2.
We have seen that the interaction between light and oscillation leads to an increase in oscillator amplitude
which means that the maximal potential energy increases and therefore also the total energy of the oscillator. In
the classical world this increase can occur continuously. However, this is not what happens in the real quantum
mechanical world as described below.
ENERGY LEVELS OF THE HARMONIC OSCILLATOR
Comparison of a Morse potential and
the potential energy of a harmonic
oscillator. The potential and the
vibrational energy levels were
calculated for the HCl molecule with
parameters given in Physical
Chemistry by Engel & Reid and in
Introduction to infrared and Raman
spectroscopy by Colthup, Daly, &
Wiberley.
Equilibrium bond length: 1.28 Å
Bond energy from the bottom of the
potential: 446 kJ/mol.
Frequency of vibration: 8.65×10¹³ s-1.
22

Andreas Barth: Vibrational Spectroscopy
The potential energy of a harmonic oscillator is described by a harmonic or parabolic potential where the
potential energy of the oscillator is equal to half of the force constant multiplied with the squared deviation of
the bond length from the equilibrium bond length.
E = ½ k L2.
The harmonic potential is shown as orange line in the figure. The vertical axis is the potential energy, the
horizontal axis the distance between the nuclei, for example for a two-atomic molecule. The plot is based on the
parameters for the HCl molecule.
With this potential, the movement of the oscillator is harmonic, meaning that it can be described by a single
sinus function with a frequency that depends on the width of the potential.
During the vibration, the oscillator moves up and down the parabolic curve and exchanges potential for kinetic
energy and vice versa. In the minimum, the oscillator has no potential energy but maximum kinetic energy. The
total energy remains constant and is equal to the maximum potential energy.
In the classical world the total energy can assume any value, however this is not the case in quantum mechanics
where the energy levels are discrete. The energy levels are shown as orange lines in the figure. The spacing
between the levels is Planck's constant times the vibrational frequency. The spacing to the next levels is the
same no matter which level we are considering.
Another difference from the classical world is the existence of a ground state energy. In classical mechanics, the
oscillator can be right in the minimum of the potential energy curve. It has then no kinetic energy, does not
move, and the distance is the equilibrium distance. In quantum mechanics the energy of the oscillator can never
be lower than half of the energy spacing between the energy levels.
Energy spacing and ground state energy together result in the equation for the energy levels of the harmonic
oscillator shown here, where the counting index n runs from zero over all natural numbers.
E = (n + ½) h
The harmonic potential is an approximation of the Morse potential which describes the potential energy curve
of a covalent bond much better than the harmonic potential. For short bond distances, the Morse potential is
steeper, meaning that the repulsion between the atoms is stronger, whereas it is shallower at longer bond length.
Importantly it levels off and becomes constant for large distances between the atoms because there is no
interaction between the atoms when they are far away.
The Morse potential is shown in blue. It is an example for an anharmonic potential. This means that the
oscillator movement can no longer be described by a simple harmonic movement. Instead it has to be described
by several sinus functions with different frequencies.
The energy levels of the anharmonic oscillator are also shown in the figure. As you can see, these energy levels
are no longer equidistantly spaced. The higher the level, the smaller is the energy difference to the next level.
When compared to the energy levels of the harmonic oscillator, those of the anharmonic oscillator are lower.
23

Andreas Barth: Vibrational Spectroscopy
We return now to the harmonic oscillator because it provides a satisfactory explanation for most features in an
infrared spectrum.
The figure below shows again the potential curve of an harmonic oscillator. The total energy is represented by
the horizontal lines in the figure for several vibrational states, starting from the vibrational ground state n = 0 up
to n = 3.
Energy levels and probability
functions for the harmonic
oscillator. The equilibrium
bond length was 1.3 Å
A classical oscillator moves between the two intersections of the horizontal line for the total energy with the
potential curve. For example, a classical oscillator with a total energy that corresponds to the second energy
level would oscillate between a bond length of a bit more than 1.1 Å to a bit less than 1.5 Å. It cannot move
beyond these limits because then it would move up the potential curve and would need an energy that is larger
than its total energy.
This is different in the quantum world. For the quantum mechanical oscillator the probability of finding the
oscillating bond at a given bond length is shown by the curves on top of the horizontal lines. It can be seen that
the quantum mechanical oscillator has a larger freedom to move than the classical oscillator as the bond length
can be found beyond the limits given by classical mechanics.
In the ground state the probability of the quantum mechanical oscillator is highest around the equilibrium
position. This corresponds to a classical oscillator which is at rest and which therefore can be found only at the
equilibrium position. But the quantum mechanical oscillator is never at rest, i wobbles around the equilibrium
position. This is a consequence of the uncertainty principle which says that one can never exactly determine
24

Andreas Barth: Vibrational Spectroscopy
momentum and position at the same time. Because the quantum mechanical oscillator is never entirely at rest,
the energy of the ground state is higher than the minimum of the potential curve.
For the excited states of the harmonic oscillator, the most probable bond lengths are those close to the turning
points of the vibration. This is true also for the classical oscillator because the movement of the atoms is slowest
around the turning points and thus they spend most time there. In the quantum mechanical description this
property is the more pronounced the higher the quantum number n is.
When the oscillator gets higher energy, the oscillation amplitude gets larger. For example with a total energy
that corresponds to the highest level shown, the minimum bond length is about 1 Å and the maximum bond
length about 1.6 Å. It is important to note that the vibrational frequency is the same for all energy levels. What
changes is the maximum amplitude.
QUANTUM MECHANICAL VIEW OF THE INTERACTION
Fermi's golden rule
The next step is to calculate the probability for a transition between the ground state and the first excited state.
This will give us both selection rules that apply to the absorption of infrared light. We will use Fermi´s golden
rule, which was already mentioned in the lecture Introduction to Spectroscopy. According to this rule, the
probability for the transition from state |Ψ0 to state |Ψ1 is proportional to |Ψ1|V |Ψ02. V is the operator that
describes the perturbation energy. In order to proceed we have to find expressions for the perturbation operator
and to think about |Ψ0 and |Ψ1.
The perturbation operator
The interaction between the electric field of the electromagnetic wave and the charge distribution in the
molecule is approximated by the interaction with the dipole moment of the molecule. In quantum mechanics
this is described by the vector operator = qiri, where qi is the charge of particle i, ri the position (operator) of
this particle, and the sum is over all charged particles — electrons and nuclei in our case. Bold print indicates
operator and the line above the operator indicates that it is a vector operator, i.e. that it has 3 components (x-, y,
and z-component).
Classically, the potential energy of a dipole in an electric field is Epot = – E. By analogy, the interaction energy
operator V(t) for the interaction between a molecule and light is given simply by
V(t) = – E(t)
where V and are operators that describe the molecule that we are interested in and E is the oscillating electric
field vector of the electromagnetic wave. (I found this interaction operator with and without the minus sign. The
minus sign should be correct according to the classical interaction energy. But the sign does not matter for the
further calculation because the electric field is oscillating between negative and positive values.)
25

Andreas Barth: Vibrational Spectroscopy
Transition dipole moment - Introduction
We return now to Fermi´s golden rule, which says that
the probability for the transition from |Ψ0 to |Ψ1 is proportional to |Ψ1|V |Ψ02.
Ψ1|V |Ψ0 is a projection (= scalar product) of vector V |Ψ0 on vector |Ψ1. It analyses how similar these two
vectors are. The projection is zero, if the two vectors are orthogonal, it is maximal if they have the same
direction. If the perturbation V has no influence on |Ψ0 then V |Ψ0 = |Ψ0 and Ψ1|V |Ψ0 = Ψ1|Ψ0 = 0 since
both vectors are eigenvectors of the Hamilton operator and therefore orthogonal to each other. Only if the
perturbation deforms the initial state |Ψ0 so that it somewhat resembles the final state |Ψ1 will Ψ1|V |Ψ0 and
the probability for a transition be different from zero.
When we evaluate Ψ1|V |Ψ0 we can extract the electric field E from the scalar product because it does not act
on the eigenstates of the system (only operators do that) and get
Ψ1|V |Ψ0 = – Ψ1| |Ψ0 E
Which gives for the probability
probability of |Ψ0 |Ψ1 is proportional to |Ψ1| |Ψ0 E 2 cos2
where is the angle between the electric field and Ψ1| |Ψ0. So the probability of a transition between |Ψ0 and
|Ψ1 is proportional to |Ψ1| |Ψ0, the square of the absolute value of Ψ1| |Ψ0. These two fundamental
quantities have been given names: transition dipole moment (or transition dipole) and dipole strength (or
oscillator strength).
Transition dipole moment 10 = Ψ1| |Ψ0 = ∫Ψ Ψ
The unit of 10 is Debye (1D = 3.3 × 10⁻³⁰ Cm). It is the same unit as for the classical dipole moment [KW].
Dipole strength D10 = Ψ1 Ψ0
Dipole strength is proportional to the transition probability and therefore to the integrated absorption coefficient
( d) [KW], the Einstein coefficient A for spontaneous emission, and the Einstein coefficient B for induced
absorption or emission (Introduction to Spectroscopy lecture).
The transition dipole moment in infrared spectroscopy
We proceed with analyzing the transition dipole moment and the next step is to think about the state vectors |Ψ0and |Ψ1. When infrared light is absorbed, only the nuclei change their vibrational state from state n to state m,
the electrons remain in their ground state. When we now use the Born-Oppenheimer approximation we can
write the state vectors |Ψ0 and |Ψ1 as products of the state vectors of the electrons and of the nuclei. |Ψ0 is the
product of the electronic ground state vector | 0 with the nuclear state vector for the vibrational state n | n. |Ψ1 is the product of — again — the electronic ground state vector | 0 with an excited nuclear state vector for
vibrational state m | m.
26

Andreas Barth: Vibrational Spectroscopy
The Born-Oppenheimer approximation is possible because the nuclei are much heavier than the electrons and
therefore move much slower. It assumes that the movement of the nuclei does not depend on the movement of
the electrons, instead the electrons adapt instantaneously to the position of the nuclei. One consequence of the
Born-Oppenheimer approximation is that the vibrational energy levels are calculated without considering the
kinetic energy of the electrons. They correspond therefore to the movement of the nuclei only. This is different
from the classical view, where we have said that the moving masses are the atoms, meaning the nuclei plus
those electrons that faithfully follow the movement of the nuclei. However, the contribution of the electrons to
the vibrational energy will be very small because of their small mass, so when it comes to the question what are
the moving masses in vibrational spectroscopy, you can answer either "the nuclei" or "the atoms" and I will
consider both answers as correct: that the vibrational levels correspond to the movement of he nuclei or that
they correspond to the movements of the atoms.
The transition dipole moment (TDM) for a transition from the vibrational level n to level m within the
electronic ground state 0 can be written as given below using the Born-Oppenheimer approximation that
separates the nuclear wavefunctions n and m from the electronic wavefunction 0 and V = (t)E(t) for the
interaction potential V, where E(t) is the electric field of the electromagnetic wave and (t) the operator of the
dipole moment.
TDM = 0 m | | 0 n.
This is the same transition dipole moment that is relevant for the absorption of UV/vis light. The only
difference is that the electrons are in their ground state also after the transition. Further calculation shows that
this transition dipole moment is zero when it is evaluated at fixed positions of the nuclei. But when we consider
that the dipole moment operator changes when the nuclear positions change, the result is different from zero.
The transition dipole moment can then be factored into two terms that each gives rise to one selection rule: The
right hand term in the expression below represents the selection rule that vibrational transitions only occur to
the next vibrational level n = 1; which is strictly valid only for the harmonic oscillator.
This selection rule limits the number of transitions that are relevant for infrared spectroscopy considerably. In
the mid-infrared spectral range and at room temperature, we have to consider only the transition from the
vibrational ground state to the first excited state because the large majority of oscillators are in the vibrational
ground state before absorption. The reason for this is that the thermal energy is smaller than the energy gap to
the first excited state.
For this transition of a diatomic oscillator from the vibrational ground state to the first excited state the
transition dipole moment is finally
TDM = /R(R0) (h/8π2mrν)0.5,
where /R(R0) is the (expectation value of) the change of dipole moment when the oscillator passes through
the equilibrium positions of the nuclei R0 (for a simple stretching vibration: when the oscillator passes through
27

Andreas Barth: Vibrational Spectroscopy
the equilibrium bond length L0), h is the Planck´s constant, mr the reduced mass of the diatomic oscillator (1/
mr = 1/m1+1/m2) and ν the frequency of oscillation.
The term on the right hand side is calculated only from the nuclear state vectors or wave functions. It is a factor
that depends on the reduced mass of the oscillator and its frequency. It has different values for different
vibrational transitions. In particular, it is zero for n 1. Therefore it is responsible for the selection rule
n = 1, as mentioned above.
The left term has contributions from electrons and nuclei (!!! this is my own conclusion, which is in contrast to
[CS]. According to them, only the electrons contribute to this term, but one cannot calculate the change of
dipole moment without the charges and positions of the nuclei). It is the expectation value for the change of
dipole moment at the equilibrium position R0 and determines the direction of the transition dipole moment. It
gives rise to the selection rule that infrared absorption only takes place when the dipole moment of the molecule
changes with the vibration. The larger the change, the stronger the absorption. Often a large change is correlated
with a large bond polarity, i.e. a large difference in the electronegativities of the bonded atoms. This is the same
conclusion that we obtained with the classical view.
We return for a moment to the selection rule
Δn = ±1
which says that the quantum number n changes only by plus minus 1. These are the so called fundamental
transitions. This selection rule is strictly valid only for the harmonic oscillator. For the anharmonic oscillator,
more transitions are allowed, for example those where n changes by ±2. These are called overtones and produce
usually only weak bands in an infrared spectrum.
The vibrational frequency is different for different vibrations. When the vibrational frequency is different, then
also the energy spacing between the levels is different, as this is proportional to the vibrational frequency. A
transition can now be induced by infrared radiation when the energy of the photon matches the energy gap
between the vibrational levels (Bohr's frequency rule), in other words when
hνphoton = hνvibration.
This is very similar to the classical description where the electric field needed to have the same frequency as the
vibration in order to increase the amplitude of the vibration. Under this condition we can induce a transition
from one level to the next level. Other transitions are not allowed for an harmonic oscillator.
Most of the transitions relevant for infrared spectroscopy are between the vibrational ground state and the first
excited state. Why? The reason is that the distance between the energy levels is larger than the thermal energy,
therefore 99% of all oscillators are in the ground state at room temperature, only 1 % in the first excited state.
28

Andreas Barth: Vibrational Spectroscopy
SELECTION RULE "CHANGE OF DIPOLE MOMENT REQUIRED" AT THE EXAMPLE OF CO2
Vibrations of CO2
One of the selection rules states that the dipole moment has to change during the vibration for absorption to
occur. I would like to illustrate this selection rule at the example of CO2. The figure shows again the normal
modes of CO2 now with arrows representing the dipole moments of the two bonds.
Vibrations of CO2. Shown are the two extreme positions of the vibrations for the two stretching vibrations as
and s, and for one of the bending vibrations. The second bending vibration is the same movement butrotated by 90° around a horizontal axis in the paper plane. The arrows are the vectors of the dipole momentsof individual bonds (not the movements of the atoms!). They add to the total dipole moment.
Oxygen in CO2 has a negative partial charge, C a positive. One can dissect the partial charge on the C atom into
two parts and construct vectors of the dipole moment for the individual bonds (direction from – to +, from O to
C). We assume that the partial charges do not change during the vibration. Then the dipole moment depends
only on the separation between positive and negative partial charge, in other words on the bond length. It is
large, when the bond is elongated and small when the bond is contracted.
The dipole moments of both bonds add up to the total dipole moment. For the equilibrium structure, the total
dipole moment is zero because both bonds have the same length and their dipole moments have the same
magnitude but point in opposite directions.
- In the antisymmetric stretching vibration the dipole moments of the two C=O bonds show in different
directions. When one of them is small, then the other is large and vice versa. Therefore there is a resulting
total dipole moment and the direction of it is different at the two extreme positions. It points to the left in
the top structure and to the right in the bottom structure. When going from the top structure through the
equilibrium structure to the bottom structure, the direction of the dipole moment changes from pointing to
the left to pointing to the right. Therefore there is a change in the total dipole moment with the vibration
and this vibration is infrared active and absorbs at 2349 cm-1. Note that this change of dipole moment
occurs although the molecule has no permanent dipole moment.
29

Andreas Barth: Vibrational Spectroscopy
- In the symmetric stretching vibration the dipole moments of the individual C=O bonds have the same
magnitudes at all times. As they have opposite directions, the resulting total dipole moment is zero at all
times. This vibration is infrared inactive, which means that it does not absorb infrared light.
- In the bending vibration, the magnitude of the dipole moments does not change, but their directions. This
gives a total dipole moment that points downwards in the top structure and one that points upwards in the
bottom structure. Therefore the dipole moment changes with the vibration and the vibration is infrared-
active. It absorbs at 667 cm-1.
Spectrum recording
CLASSICAL DISPERSIVE IR-SPECTROMETER
A dispersive IR spectrometer is similar to a vis spectrometer (vis = visible, for the visible spectral region) with
one important difference: the monochromator is placed between sample and detector to minimize the detection
of the heat radiation from the sample. A further difference is that glass cannot be used because it is not
transparent in the infrared. Therefore mirror optics are usually used.
Dispersive IR-spectrometers are currently used only for special applications.
FOURIER TRANSFORM INFRARED (FTIR) SPECTROMETER
Advantages
Modern infrared spectrometers are usually FTIR spectrometers. The heart of a Fourier transform infrared
spectrometer is the interferometer, like the Michelson interferometer shown here. It has fixed and a movable
mirror. Light from the source is split by the beamsplitter, one part of it is reflected to the fixed mirror, on its
way back passes the beamsplitter and reaches the detector. Another part passes the beamsplitter on its first
encounter, is reflected by the movable mirror and by the beamsplitter before it hits the detector. When the two
beams recombine they interfere with one another and there will be constructive or destructive interference
depending on the length difference of the two paths. The instrument measures the light intensity in dependence
of the position of the movable mirror. This light intensity is the Fourier transform of the spectrum. Another
Fourier transform in the computer transforms the measured data back into a spectrum. So we have two Fourier
transformations: one performed by the interferometer, one by the computer. The main advantage of the Fourier
transform spectrometer is high the light intensity at the detector and in consequence the high signal to noise
ratio. Therefore a spectrum can be recorded in as few as 10 ms.
30

Andreas Barth: Vibrational Spectroscopy
Fourier transform infrared (FTIR) spectrometerFourier's picture: http://www-history.mcs.st-andrews.ac.uk/ PictDisplay/Fourier.html
That the interferometer produces the Fourier transform of the spectrum is best seen, when a monochromatic
source is considered. Depending on the position of the movable mirror we will obtain constructive or
destructive interference at the detector and the detector signal varies in a cosine function with the mirror
position. Now a delta function, describing the monochromatic spectrum and a cosine function are related by the
Fourier transformation because the cosine function contains only one frequency. Another Fourier transformation
generates again the spectrum.
Samples
Typically a 1 μl drop of an 0.1-1 mM protein solution is used. The optical pathlength of the cuvettes is very
small due to the high water absorbance. For 1H2O is is less than 10 m. In heavy water - D2O - the vibrations
are slower than in H2O due to the mass effect and therefore the absorption bands shifted with respect to H2O. In
the spectral range of most interest, the absorption of D2O is therefore weaker than that of H2O and the
pathlength of the cuvettes can be increased by a factor of 5 to 10. This makes it possible to use lower
concentrations, but in turn requires larger volumes.
31

Andreas Barth: Vibrational Spectroscopy
For the cuvettes one cannot use glass windows because glass is not transparent in the infrared spectral range.
Instead one often uses flat Calcium fluoride windows.
Raman Spectroscopy
THE RAMAN EFFECT
Phenomenon
Raman spectroscopy is a second form of vibrational spectroscopy. In Raman spectroscopy light that is
inelastically scattered is detected. This scattering is called Raman scattering and was discovered 1928 by
Raman with help of the bright sun in India. The figure on the left shows a Raman spectrum of a simple
compound. Most of the light that is scattered is elastically scattered: the scattered photons have the same energy
as the incident photons. This is Rayleigh scattering. However, some of the photons have less energy and some
have more energy than the incident photons. This is Raman scattering which gives rise to additional lines in the
spectrum of scattered radiation. If lines are found at smaller energy than the Rayleigh line, they are called
Stokes lines, if they have more energy, they are called anti-Stokes lines. It turns out that the energy difference
between the Rayleigh photons and the Raman photons corresponds to the energy needed for vibrational
transitions of the scattering molecule.
Rayleigh scattering is unlikely (10-4 of the incident radiation) but Raman scattering is
even less likely (10-8 to 10-10 of the incident radiation [Grifiths and Haseth] or 10-4 of
Rayleigh scattering [HJH p460]). This is a disadvantage of Raman spectroscopy because
only a very small fraction of the incident photons generate a Raman signal which limits
the signal to noise ratio.
Chandrasekhara Venkata Ramanhttp://nobelprize.org/nobel_prizes/physics/laureates/1930/raman-bio.html
32

Andreas Barth: Vibrational Spectroscopy
Hypothetical Rayleigh andRaman scattering from asimple compound. Ramanbands (Stokes and anti-Stokes)are shifted with respect to theRayleigh peak. The two peakson each side of the Rayleighpeak are signals of twovibrations with differentfrequencies (ground state tofirst vibrationally excited statefor Stokes lines and firstexcited state to ground state foranti-Stokes lines).
PHYSICAL ORIGIN
Quantum mechanical view
What is the origin of the Raman bands in the spectrum of the scattered photons? This is easy to understand in
the quantum mechanical view which is illustrated in this figure. The figure shows the vibronic states of a
molecule for the electronic ground state and for the first electronically excited state as well as the three
processes Rayleigh scattering, Stokes Raman scattering, and anti-Stokes Raman scattering.
Raman scattering: excitation to a virtual energylevel and emission of a photon.
In all of these processes, an incident photon interacts with the molecule and excites it to a virtual state. The
photon becomes annihilated in this process (this is not a proper absorption process because energy is not
conserved in this step [L p7]). The virtual state is a non-stationary state of the system. It has therefore a very
33

Andreas Barth: Vibrational Spectroscopy
short life time [Engel: Quantum Chemistry & Spectroscopy] (10-11 s [Ga]) and its energy is not well-defined.
When it decays, the scattered photon is created.
The three processes differ in the energy of the scattered photon. In Rayleigh scattering, indicated by the green
arrows, the photon energy of the scattered photon is the same as that of the incident photon. Therefore there is
no net energy transfer between radiation and molecule and the final state of the molecule is the same as the
initial state.
In Stokes Raman scattering, the energy of the scattered photon is less than that of the incident photon. The
energy difference is used to excite the molecule to a higher vibrational state. Only transitions to the next
vibrational level are allowed in Raman spectroscopy. This is the same selection rule that applies for the
absorption of infrared radiation. Therefore, the difference in energy between the incident photon and the
scattered photon matches that of a vibrational transistion hvib. As most of the oscillators are in the vibrational
ground state at room temperature, the most relevant process for Stokes Raman scattering is from the vibrational
ground state to the first excited vibrational state.
In anti-Stokes Raman scattering, the molecule is initially in the first excited vibrational state and after the
scattering process in the vibrational ground state. Therefore, the energy of the scattered photon is higher than
that of the incident photon. Anti-Stokes scattering is unlikely because only a few oscillators are an excited
vibrational state at room temperature which makes the intensity of anti-Stokes lines small.
Resonance Raman effect
Raman scattering is greatly enhanced (factor 100 - 1000) when the
incident light energy is close to the energy of an electronic transition. In
resonance Raman a photon is first absorbed and then emitted. This is
slower than normal Raman scattering but still faster than vibrational
relaxation. Emission is therefore from the same vibrational state that was
reached upon excitation. Typical concentrations are 0.1 mM.
Resonance Raman scattering: excitation to an excited state energylevel and subsequent emission of a photon.
Classical view
Light that is used in Raman spectroscopy is in the ultraviolet, visible or near infrared spectral range. The
frequency of this light inc is too high to interact with the oscillating atoms of a vibrating bond. Instead, the
incident light induces oscillations of the electrons of the molecule. Thinking again in terms of the mass on a
34
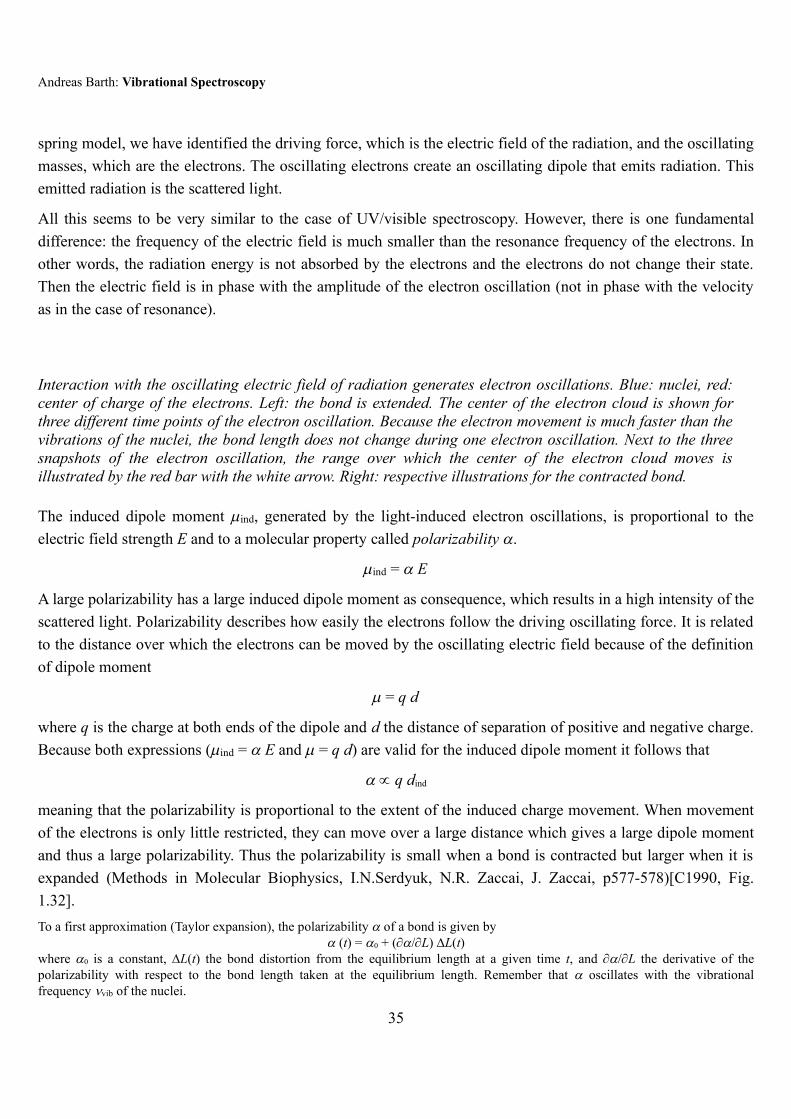
Andreas Barth: Vibrational Spectroscopy
spring model, we have identified the driving force, which is the electric field of the radiation, and the oscillating
masses, which are the electrons. The oscillating electrons create an oscillating dipole that emits radiation. This
emitted radiation is the scattered light.
All this seems to be very similar to the case of UV/visible spectroscopy. However, there is one fundamental
difference: the frequency of the electric field is much smaller than the resonance frequency of the electrons. In
other words, the radiation energy is not absorbed by the electrons and the electrons do not change their state.
Then the electric field is in phase with the amplitude of the electron oscillation (not in phase with the velocity
as in the case of resonance).
Interaction with the oscillating electric field of radiation generates electron oscillations. Blue: nuclei, red:center of charge of the electrons. Left: the bond is extended. The center of the electron cloud is shown forthree different time points of the electron oscillation. Because the electron movement is much faster than thevibrations of the nuclei, the bond length does not change during one electron oscillation. Next to the threesnapshots of the electron oscillation, the range over which the center of the electron cloud moves isillustrated by the red bar with the white arrow. Right: respective illustrations for the contracted bond.
The induced dipole moment ind, generated by the light-induced electron oscillations, is proportional to the
electric field strength E and to a molecular property called polarizability .
ind = E
A large polarizability has a large induced dipole moment as consequence, which results in a high intensity of the
scattered light. Polarizability describes how easily the electrons follow the driving oscillating force. It is related
to the distance over which the electrons can be moved by the oscillating electric field because of the definition
of dipole moment
= q d
where q is the charge at both ends of the dipole and d the distance of separation of positive and negative charge.
Because both expressions (ind = E and = q d) are valid for the induced dipole moment it follows that
q dind
meaning that the polarizability is proportional to the extent of the induced charge movement. When movement
of the electrons is only little restricted, they can move over a large distance which gives a large dipole moment
and thus a large polarizability. Thus the polarizability is small when a bond is contracted but larger when it is
expanded (Methods in Molecular Biophysics, I.N.Serdyuk, N.R. Zaccai, J. Zaccai, p577-578)[C1990, Fig.
1.32].
To a first approximation (Taylor expansion), the polarizability of a bond is given by (t) = 0 + (/L) L(t)
where 0 is a constant, L(t) the bond distortion from the equilibrium length at a given time t, and /L the derivative of thepolarizability with respect to the bond length taken at the equilibrium length. Remember that oscillates with the vibrationalfrequency vib of the nuclei.
35

Andreas Barth: Vibrational Spectroscopy
We return now to the equation ind = E and insert the above expression: ind (t) = 0 E(t) + (/L) L(t) E(t)
This gives two terms. The first one oscillates with the frequency of the incident electric field inc. This term gives rise to Rayleighscattering. The second term gives rise to Raman scattering. It consists of three quantities. The first (/L) is a property of a particularvibration of the considered molecule. It needs to be different from zero in order to observe Raman scattering. If it is large, Ramanscattering is more intense. Thus, Raman scattering occurs only when the polarizability changes during the vibration (/L 0). Aswe will see later, not all vibrations lead to a change in the polarizability. The second term in the above equation has further two time-dependent quantities that oscillate with different frequencies. The bond distortion L oscillates with the vibrational frequency of thenuclei vib, and the electric field E oscillates with the frequency of the incoming radiation inc. This modulates the induced dipolemoment ind with the frequency of the vibration.
Because the polarizability depends on the bond length, the amplitude of the light-induced electron oscillations
depends on the positions of the atoms, which change relatively slowly with the frequency of the nuclear
vibration (with vibrations I mean nuclear vibrations, i.e. normal modes, with oscillation the electron
oscillations). Each vibration modulates the amplitude of the fast (inc) electron oscillations with the low
frequency of the nuclear vibration (vib). Because the electron oscillations generate the scattered light, also the
amplitude of the scattered electromagnetic wave is modulated with the frequency of the nuclear vibration. This
modulation is rather slow compared to the driving force of the oscillating electric field. Such a modulated
oscillation is equivalent to two oscillations with similar but different frequencies meaning that light with two
frequencies is emitted: inc + vib, and inc - vib (inc: frequency of incident light and vib: frequency of
vibration). Therefore we observe Raman scattered radiation with higher and lower frequency (energy) than the
frequency of Rayleigh scattered radiation. The frequency difference between Rayleigh scattered radiation and
each of the Raman scattered waves is equal to the frequency of the nuclear vibrations. In addition, we get
Rayleigh scattering with the same frequency as the incident light because the average polarizability during the
vibration is different from zero.
An analogy to the generation of Raman scattered light is the tuning of a guitar. If the two strings have nearly the
same pitch (frequency) then they are not heard as two tones with different pitch, but rather as one tone the with
slowly modulated loudness (also called beat). Which shows that a slowly modulated oscillation is composed of
two oscillations with slightly different frequencies. (search for beat frequency, for example:
https://www.youtube.com/watch?v=V8W4Djz6jnY)
I will summarize now the selection rules for Raman spectroscopy, which we have already encountered, and
discuss an example. One selection rule is familiar from infrared spectroscopy. It says that the harmonic
oscillator only jumps to the next vibrational level n = 1.
The second selection rule says that the polarizability has to change with the vibration, otherwise there will be no
Raman scattering of this particular vibration. In other words vibrations where the polarizability changes are
Raman active, those where it does not change are Raman inactive. For molecules with a symmetry center the
selection rules of infrared and Raman spectroscopy are complementary, meaning that vibrations that absorb
infrared light (infrared active) do not cause Raman scattering (Raman inactive) and vice versa. Some vibrations
can be both infrared and Raman inactive (Keiter J. Chem. Educ. 1983). Most biomolecules do not have a center
of symmetry and their normal modes of vibrations will be both Raman and infrared active. But their infrared
and Raman spectra are still complementary to some degree: polar bonds are generally strong infrared absorbers
36

Andreas Barth: Vibrational Spectroscopy
and weak Raman scatterers, whereas apolar bonds are weak infrared absorbers and strong Raman scatterers
(http://www.chemvista.org/ramanIR4.html).
Let us consider CO2 as an example:
The symmetric stretching vibration is shown at two different time points on the left. When both bonds are
contracted, the electric field moves the electrons only over a small distance. The induced dipole moments in
both bonds are small and they add to a small total induced dipole moment. In contrast, when both bonds are
extended, the electric field moves the electrons over a large distance and the polarizability is large. Thus the
polarizability changes with the vibration and this vibration is Raman active.
The antisymmetric vibration is shown on the right hand side. At both times, one of the bonds is extended,
giving a large induced dipole moment within this bond, and the other bond is contracted, giving a small induced
dipole moment within this bond. The small and the large induced dipole moment add upp to an intermediate
total induced dipole moment, which is the same for both time points shown and in fact does not change during
the vibration. Therefore, the polarizability of the whole molecule does not change during the vibration and this
vibration is Raman inactive.
So, the symmetric stretching vibration is Raman active, whereas the antisymmetric stretching vibration is
Raman inactive. This is the opposite of what we found for the absorption of infrared light. The symmetric
vibration was infrared inactive and the antisymmetric vibration infrared active because the dipole moment of
the molecule does not change during the symmetric vibration but it does change during the antisymmetric
vibration.
The different dipole moments that are relevant for Raman spectroscopy and infrared spectroscopy may be
confusing and therefore I compare them in the following using the example of a particular time point during the
antisymmetric stretching vibration (see figure below). In Raman spectroscopy, the frequency of the incident
light is so high, that it only affects the electrons. They start to oscillate, which makes also the center of charge of
the electron cloud oscillate. The figure shows the case when the reverse of the incident electric field points to
the right. I have plotted the reverse of the electric field vector because the reverse points in the same direction as
the force exerted on the electrons. When the reverse points to the right, the center of charge in each bond also
moves to the right. This is illustrated by the red circles. It moves more away from the center of the bond when
the bond is elongated than when it is contracted. Therefore, the induced dipole moment is large for the extended
bond and small for the contracted bond. Also for the dipole moment, I have chosen to show the reverse
37

Andreas Barth: Vibrational Spectroscopy
direction because the reverse points to the position of the electrons. So far, there was nothing new in the
argument. The important point comes now: the induced dipole moments are generated by the electric field of
the radiation. Without radiation, there would be no induced dipole moment. The direction of both induced
dipole moments is determined by the direction of the electric field vector. Therefore it is the same in both bonds
and the induced dipole moments of both bonds add up for the total induced dipole moment.
Difference between the dipole moments relevant forRaman spectroscopy and for infrared spectroscopy.See text for further details.
The situation is different for the absorption of infrared light. Here, the relevant dipole moments are the
permanent dipole moments of the bonds which are generated by the partial charges on the atoms. These dipole
moments are present also in the absence of electromagnetic radiation. In the CO2 molecule, the reverse of the
dipole moments of the two bonds always points to the negative charge on the oxygen atoms. Therefore the
direction of the dipole moments relevant for the absorption of infrared light is determined by the chemical
structure of the molecule and not by the direction of the incident electric field, which was the case for Raman
scattering. For CO2, the dipole moments due to the partial charges point in different directions at all times,
whereas the induced dipole moments relevant for Raman scattering point in the same direction. The different
relative orientation of the dipole moments relevant for Raman scattering and for infrared absorption explains
the different behavior of the two stretching vibrations in Raman and in infrared spectroscopy. For the
antisymmetric stretching vibration, the total induced dipole moment does not change during the vibration (the
vibration is Raman inactive), but the total dipole moment does change (the vibration is infrared active).
RAMAN SPECTROMETER
The excitation light and the scattered light are in the ultraviolett, visible or the near infrared spectral region.
Therefore the same optical components can be used as in a UV/vis spectrometer. The light source is a laser, to
generate light of high intensity. Rayleigh scattering is eliminated by a very good optical filter and the spectrum
of the Raman scattered light decomposed in its spectral components either by a double or triple monochromator
or by a Michelson interferometer.
38

Andreas Barth: Vibrational Spectroscopy
Typical concentrations are 0.1 - 1 mM.
Important: what is plotted in a Raman spectrum is the energy difference between Raman scattered light and
Rayleigh scattered light.
Advantages: water is a bad Raman scatterer, measurements in water are therefore easy.
optical components for the visible spectral range can be used
the vibrational spectrum from 4000 to 50 cm-1 is obtained in one go. In an infrared
spectrometer several components have to be exchanged because they absorb in certain spectral
regions.
Disadvantages: scattered intensity is often very low
RAMAN APPLICATIONS
Since Raman spectroscopy is vibrational spectroscopy it gives the same information as infrared spectroscopy.
The differences lie in the vibrations that are detected and in the different experimental requirements and
problems. In the following we will return to the discussion of infrared spectroscopy.
Conclusion
The infrared spectrum of a molecule contains a lot of information. Unfortunately it is quite hard to extract this
information from the spectrum. A number of methods are employed to do this and yield information that is part
of the jigsaw puzzle that builds up our knowledge on proteins. Particular advantages of IR spectroscopy are:
(i) The spectrum encodes a lot of molecular information. In favourable cases, bond lengths and bond geometries
can be determined. IR spectroscopy is one of the few methods to detect hydrogen bonds or the protonation state
of functional groups, in particular in time-resolved experiments.
(ii) Proteins can be investigated that are too large for NMR or too difficult to crystallize for X-ray
crystallography. Membrane proteins can also be investigated. These are difficult to crystallize and usually too
large for NMR.
(iii) The sample preparation for standard measurements is simple.
(iv) The time for recording a spectrum is short (less than a minute).
(v) The time resolution is high, ms with commercial FTIR spectrometers s with moderate effort.
(vi) It gives good value for money.
Disadvantages are:
(i) The absorption coefficients are small which requires high concentrations. Achieving high concentrations is
not always possible because some proteins aggregate. Note however, that the amount of sample is small (several
μg) because the sample volume is small (a few μL).
39

Andreas Barth: Vibrational Spectroscopy
(ii) Water absorbs strongly in a relevant spectral region. This requires short pathlengths of the cuvettes which
make mixing experiments difficult. It also requires high concentrations of the molecule of interest.
(iii) Calculation of the absorption spectrum is difficult for larger molecules like proteins.
40

Andreas Barth: Vibrational Spectroscopy
Problems and Study Questions: Infrared Spectroscopy
1. Estimate the influence of neighboring groups on the C=O band position in the infrared spectrum. Assume
that keto absorption is at 1715 cm-1. Assume also that the C=O bond has 70% double bond character asshown below which gives an electron density of 1.7 electron pairs or 3.4 electrons in the bond. All othernumbers in the solution are based on this number and serve only illustrational purposes.
Assumption : 70% 30%
Predict the relative position for the following compounds in which a carbon atom at position was replaced byanother atom:
First review the influence of the bond strength (= electron density in the bond) on the vibrational frequency.How is frequency related to wavenumber?
a) carbonylclorides (Cl instead of X) where the chlorine atom has mainly a -I effect,
b) esters and acids (Asp and Glu, O as X) where the oxygen exerts a -I effect and a weaker but considerable +Meffect
c) neighboring double bonds exerting a +M effect, and
d) amides (Asn and Glu, peptide group) where the nitrogen exerts a +M effect and a weaker -I effect.
e) The wavenumber 1715 cm-1 given for keto absorption is observed in aqueous solution. Now predict the
wavenumber in a more hydrophobic environment, for example in a binding pocket of a protein.
2. What molecular information can be derived from the infrared spectrum?see text
3. The side chain of the protonated form of aspartic acid has infrared bands at the following wavenumbers
when it is in an apolar environment: 2925, 1750, 1470, and 1270 cm-1. Remember that wavenumber is
proportional to frequency.
41

Andreas Barth: Vibrational Spectroscopy
From general principles that govern infrared spectroscopy, assign them to the following vibrations and
explain your assignment:
bending vibration of the CH2 group
stretching vibration of the CH2 group,
C=O stretching vibration, and
C-O stretching vibration. Principles: higher electron density => higher frequency, smaller mass => higher frequency, stretching vibrations have higher frequency than bending vibrations, frequency orwavenumber increases from C-O stretching, CH bending, C=O stretching, CH stretching
4. Which one of the following vibrations will have the stronger infrared absorption (= higher probability of
absorption = larger absorption index), the CO stretching vibration of a C-OH group or a CH stretching?
Why? C-O more polar => absorbs stronger
5. Oxygen gas O2 does not absorb infrared radiation but O2 bound to some proteins absorbs infrared
radiation. Explain why.
6. Two atomic oscillator: plot the potential energy versus the distance between two atoms for the harmonic
and the anharmonic oscillator. Indicate the quantum mechanical energy levelssee text
7. Infrared and Raman spectroscopy are related spectroscopic techniques. Explain briefly the physical
phenomena on which these methods are based and why they are related. IR is absorption of photons, Raman inelastic scattering, see text for further details. connection between IR and vibrations, description of Raman scattering)
8. What influences the vibrational frequency of a vibrating bond (stretching vibration)?masses, electron density, as determined by structure and environment. This can be further broken down into redox state, coupling to other vibrations and thus geometry, mesomericand inductive effects, hydrogen bonding, electric fields.
9. What methods can be used to measure the secondary structure content? Name only methods that cannot
be used to derive the three-dimensional structure. Compare the prediction quality of the methods.CD and IR spectroscopy, IR better with beta, CD better with alpha
10. What are the problems with secondary structure determination with these methods?side chain absorption, no unique spectrum for a given structure, band assignment, overlap, extra points for minor problems
11. The absorption of which group is used for secondary structure determination with infrared spectroscopy
and in which spectral region does it absorb?peptide group 1650 cm-1, mid-infrared
12. What is the physical reason for the sensitivity of the infrared spectrum to secondary structure?coupling of vibrations
13. Protein A has its maximum amide I absorption at 1635 cm-1, protein B at 1655 cm-1. What can you
conclude from the spectrum regarding the secondary structure.A consists predominantly of beta sheet, B of alpha helices or irregular structure.
14. A protein has its amide I maximum at 1655 cm-1. This gives two possibilities for the dominant secondary
structure. Which are these and how can one distinguish between them?Alpha helix and random coil (irregular structure). If the protein is a random coil then the amide I band will be broad and featureless. If it is predominantly alpha helical, then thespectrum should be composed of several component bands. They can either be seen directly in the spectrum as shoulders, or can be revealed by band narrowing techniques likeFourier selfdeconvolution. If the protein is predominantly random coil or of irregular structure the maximum should shift in 2H2O to 1645 cm-1, if it is predominantly alpha helical itwill not shift, or much less.
15. A protein shows its amide I absorption maximum at 1635 cm-1. Upon heating the protein solution from
20°C to 80°C, the maximum shifts to 1655 cm-1 and the band is now broad. What has happened?Beta sheet protein denatures at high temperature giving a broad random coil spectrum
16. Which mathematical procedures can be used for bandnarrowing?second or forth derivative and Fourier selfdeconvolution.
17. Explain how Fourier selfdeconvolution works.
42

Andreas Barth: Vibrational Spectroscopy
see text.
18. Nuclei oscillate. Thus the distance between nuclei oscillates. At what distance(s) is it most likely to find
the nuclei?Vibrational ground state: equilibrium distance, vibrationally excited states: close to the turning point of the vibration.
19. Only discrete energy levels are allowed for the harmonic oscillator according to quantum mechanics.
What changes when the system goes from one level to another: vibrational frequency, amplitude of
oscillation or both?only amplitude of oscillation, i.e maximum bond length becomes larger with increasing energy and the minimum bond length smaller.
20. Why are most transitions in infrared spectroscopy from the vibrational ground state to the first
vibrationally excited state?Two reasons: (i) thermal energy is small compared to the spacing of the energy levels, thus 99% of all oscillators are in the ground state. (ii) because of the selection rule n = ±1.
21. What types of vibrations exist?stretching, bending and torsional vibrations
22. What vibration of a CH2 group has the higher frequency: CH stretching or CH2 bending?stretching, see text
23. Explain why some of the vibrations of CO2 are infrared active and some not.see text
24. How many vibrations (normal modes) do you expect for the water molecule.3n-6 = 3 (n number of atoms)
25. How many vibrations (normal modes) do you expect for a typical protein of 8000 atoms?approx. 24000
26. Explain a Fourier transform infrared spectrometer.see text
27. A compound exhibits a strong Raman line at 1000 cm-1. At what wavelength is it observed in a Raman
spectrometer with a laser emitting at 800 nm and in one with a laser at 400 nm?1000 cm-1 is considerably larger than the thermal energy. Thus predominantly the Stokes line will be observed. The energy of the Stokes line is the energy of the incident photonminus the energy required for the vibrational transition. Since wavenumber is proportional to energy I will convert all wavelengths first to wavenumber and then back to wavelength.Converting the 1000 cm-1 into wavelength and then adding that to the wavelength of the laser is wrong because wavelength is not proportional to energy. Thus 800 nm correspond to12500 cm-1, 400 nm to 25000 cm-1. The Raman line will be thus observed at 11500 and 24000 cm-1 in the two spectrometers, corresponding to 869.6 nm and 416.7 nm.
28. You study a light receptor with reaction-induced infrared difference spectroscopy. Upon illumination, the
receptor undergoes a transition from its resting state (state A) to a metastable intermediate state (state B)
and you record a difference spectrum of this reaction (absorption in state B minus absorption in state A).
You are interested in the signals of two amino acids: Asp 46 and Glu 67. In both states A and B, Asp 46 of
the receptor is on the surface exposed to water not involved in interactions with other protein residues.
Glu 67 is buried in the protein and exhibits a strong hydrogen bond to the C=O oxygen in state A but is
not hydrogen bonded in state B. Describe and explain the contribution of these two residues to the
difference spectrum.Asp 46 does not contribute. The C=O band of Glu 67 shifts upwards in going from state A to the state B, for example from 1710 cm -1 to 1750 cm-1. Thus there will be a negative bandat 1710 cm-1 and a positive at 1750 cm-1.
43

Andreas Barth: Vibrational Spectroscopy
29. You study a light receptor with reaction-induced infrared difference spectroscopy. Upon illumination the
receptor undergoes a transition from its resting state to a metastable intermediate state and you record a
difference spectrum of this reaction (absorption of intermediate minus absorption of resting state). The
difference spectra of the wildtype receptor and of two mutants are shown. They are identical with the
exception of the regions around 1740
and 1710 cm-1. Interpret the spectra.
Full line: wild type spectrum, dottet
line: spectrum of the mutant Asp 78
to Asn (differing from the wild-type
spectrum around 1740 cm-1), dashed
line: spectrum of the mutant Glu 107
to Gln ( differing from the wild-type
spectrum around 1710 cm-1).
Asp 78 is protonated in the resting and the intermediate state.The hydrogen bonding strength changes in the reaction beingweaker in the intermediate state (positive band). Glu 107 givesrise to the band at 1710 cm-1. The simplest explanation is aprotonation of Glu 107 in the reaction. A third Asp or Glu residuecontributes that has not been identified.
30. Bacteriorhodopsin is a light-driven proton pump.
The protein contains a chromophore - retinal -
that is shown on the right. It absorbs light,
changes configuration (look up difference
between configuration and conformation) around
C12=C14 and adopts thereafter the 13 cis form
shown in the figure. This form deprotonates
during the photocycle and reprotonates later. The
infrared absorption bands of the deprotonated form are much less intense than those of the protonated
form. Explain why.Because in the protonated form the molecule is charged at one end, the bonds are therefore more polar than in the unprotonated form. This gives a larger change of dipole momentduring the vibration for the protonated form and therefore a stronger infrared absorption.
31. You investigate the phosphate group of a phosphoenzyme with infrared spectroscopy. In order to detect
the phosphate bands in the spectrum you conduct an experiment which leads to 16O to 18O isotope
exchange at the phosphate group. What shift in wavenumber do you expect for a 16O phosphate band at
1130 cm-1 upon isotopic exchange? Assume that you can approximate the corresponding phosphate
vibration by a two atomic oscillator. The atomic mass of phosphate is 31 Da.The reduced mass of the P-16O oscillator is 10.55 Da, that of the P-18O oscillator 11.39 Da. The square root of the ratio of the reduced masses gives the ratio of the vibrationalfrequencies which is 0.9624. Since wavenumber is proportional to frequency the resulting P-18O wavenumber is 0.9624 × 1130 cm-1 = 1087 cm-1. Thus you expect a downshift of 43cm-1.
32. Find evidence or examples in the text for statements (ii) and (iv) in the conclusions.
44