vibrational frequencies and tuning of the african mbiramitran.web.unc.edu/files/2012/09/p011.pdf ·...
TRANSCRIPT

Vibrational frequencies and tuning of the African mbira
L.E. McNeila)
Department of Physics and Astronomy
Univ. of North Carolina at Chapel Hill, Chapel Hill, North Carolina 27599-3255
S. Mitran
Department of Mathematics
Univ. of North Carolina at Chapel Hill, Chapel Hill, North Carolina 27599-3250
Date submitted:
Running title: Vibrational frequencies of the mbira
a) Electronic mail: [email protected]

ABSTRACT
The acoustic spectrum of the mbira, a musical instrument from Africa that produces
sound by the vibration of cantilevered metal rods, has been measured. It is found that the
most prominent overtones present in the spectrum have frequencies that are
approximately 5 and 14 times the lowest frequency. A finite-element model of the
vibration of the key that takes into account the acoustic radiation efficiency of the various
normal modes reveals that the far-field power spectrum is dominated by higher-frequency
modes involving predominately transverse motion of the key. Lower-frequency modes
involving longitudinal motion do not radiate efficiently, and therefore contribute little to
the sound produced. The high frequencies of the dominant overtones relative to the
fundamental make it unlikely that the tunings of the mbira that are used by expert
musicians are determined by matching the fundamental frequencies of the upper keys
with the overtones of the lower keys.
PACS number: 43.75+a
2

I. INTRODUCTION
The mbira is a musical instrument found in multiple forms in many countries across
the continent of Africa, especially in Zimbabwe, the Democratic Republic of the Congo,
Mozambique, and Angola.1 One form, known as the mbira dzavadzimu (“mbira of the
ancestors”) is particularly characteristic of the melodic music of the Shona people of
Zimbabwe, Mozambique and Zambia. The keys are put into vibration by stroking the
free end with the thumb or forefinger, and each one produces a distinct musical pitch.
The sound is sometimes amplified by placing the mbira inside a hollow shell such as a
gourd that serves as a resonating chamber. The music played on the mbira is typically
polyphonic, so that multiple keys are sounded simultaneously or alternately in sequence.
Like all melodic instruments with multiple vibrating parts, the pitches produced by
the individual keys are related to one another in an organized way that is referred to as
the tuning of the instrument. Throughout Africa many mbira tunings are used, which are
related to melody and chord patterns prevalent within the local culture and also reflect the
artistry of individual master players. It is reasonable to ask, however, whether those
tunings are related to the musical acoustics of the instrument itself.
Because more than one mode of vibration is excited when the key is stroked, the
sound produced by the vibration of the key will contain multiple frequencies. The lowest
of these frequencies, which determines the pitch experienced by the listener, is called the
fundamental. The higher frequencies, which together determine the overall
characteristics of the musical sound, are referred to as overtones. We set out to examine
the frequencies of vibration of the keys of the mbira and to explore their possible
relationship to the tuning of the instrument.
3

II. EXPERIMENT AND CALCULATION
A. The mbira
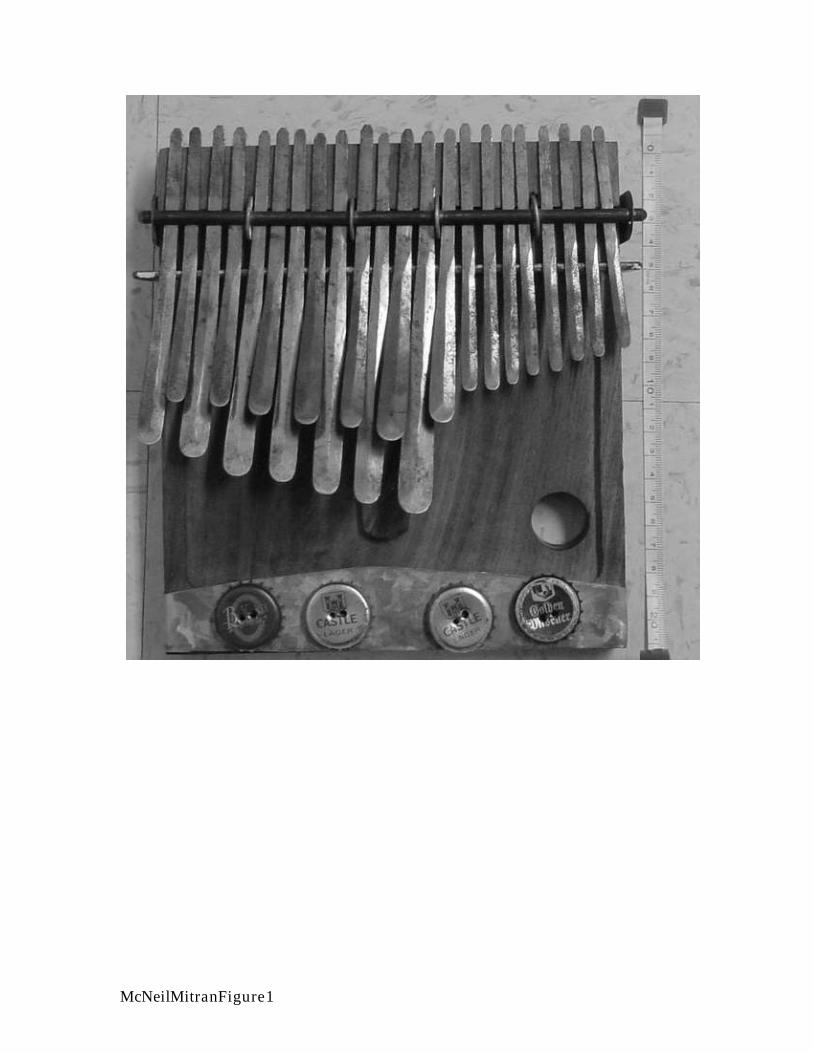
The instrument used for these measurements is shown in Fig. 1. It was made by
Josephat Mandaza in Chitungwiza, Zimbabwe in 2002 and was provided to us by Dr.
Louise Meintjes of the Duke University Department of Music. The body of the
instrument is made of a single piece of solid wood approximately 18.5 x 21.7 cm and 2.5
cm thick. A 2.5-cm diameter hole in the body near one end provides a convenient finger-
hold. The 22 vibrating rods or keys range in length from 9.5 to 17.5 cm. They are
clamped at one end and cantilevered from a bridge made of a metal strip embedded in the
wood body, such that the freely-vibrating length ranges from 3.5 to 10.5 cm. They are
arranged in three groups: nine on the right-hand side of the instrument (designated R1-
R9), six upper keys on the left-hand side (designated L1-L6) and seven lower keys on the
left-hand side (designated B1-B7). The flattened tongue-like shapes of the freely-
vibrating portion of the keys are approximately 0.5 to 0.8 cm wide at the bridge and 0.5
to 1.5 cm wide at the widest point (near the free end). The cross-section of each key is
pentagonal, being approximately 0.09 cm thick at the edges and 0.15 cm thick in the
center. The keys curve upward from the bridge (presumably to make them easier to play)
such that the free end is raised above the bridge by about 10% of the key’s length. The
material of which the keys are made is unknown, but from their appearance and stiffness
and the presence of a small amount of rust on them they can be presumed to be some sort
of mild steel.
At the opposite end of the instrument body from the bridge, a metal strip is nailed
across the width of the wood. Four metal beer-bottle caps are attached to the strip with
4

wire such that they are free to rattle against the metal when the instrument is played.
Traditionally, shells were used for this function2, but in more recent times bottle caps
have become a convenient substitute. The resulting buzzing sound is considered to be an
important characteristic of the instrument in its indigenous use in music-making, but it
does not affect the pitches produced by the keys and for the purpose of the experiments
described here it was undesirable. For that reason, before making the measurements we
damped the vibration of the bottle caps by stuffing them with wool fleece. The vibrations
of keys other than the one being measured were similarly damped.
B. Acoustic measurements
We made the acoustic measurements in a sound isolation chamber in the UNC-CH
Department of Linguistics. We made sound recordings with a Shure KSM44 microphone
using the omnidirectional pickup pattern and 80 Hz high-pass filter. The microphone
preamplifier was a Mackie 1202-VLZ PRO mixer. We used the channel's insert-send as
the signal output to minimize contributed noise and distortion. We used an Echo Digital
Audio Indigo IO for the analog-to-digital signal conversion. The conversion parameters
were 24-bit quantization and 22050-Hz sample rate, and we stored the samples on a hard
drive using Adobe Audition 1.5 software. We used the same software to perform the
Fourier analysis of the audio samples. An initial baseline measurement to evaluate the
environmental noise recorded that all frequencies from 100 Hz to the Nyquist frequency
were at least 102 dB below full scale. We held the mbira close to the microphone with
one hand and one key was set into vibration by pressing it with a finger on the other hand
and allowing the finger to slide off the end of the key. Recording continued until no
5

further vibration of the body of the mbira could be perceived with the hand holding the
instrument, approximately 10 seconds. (This was a longer time than the sound was
audible.)
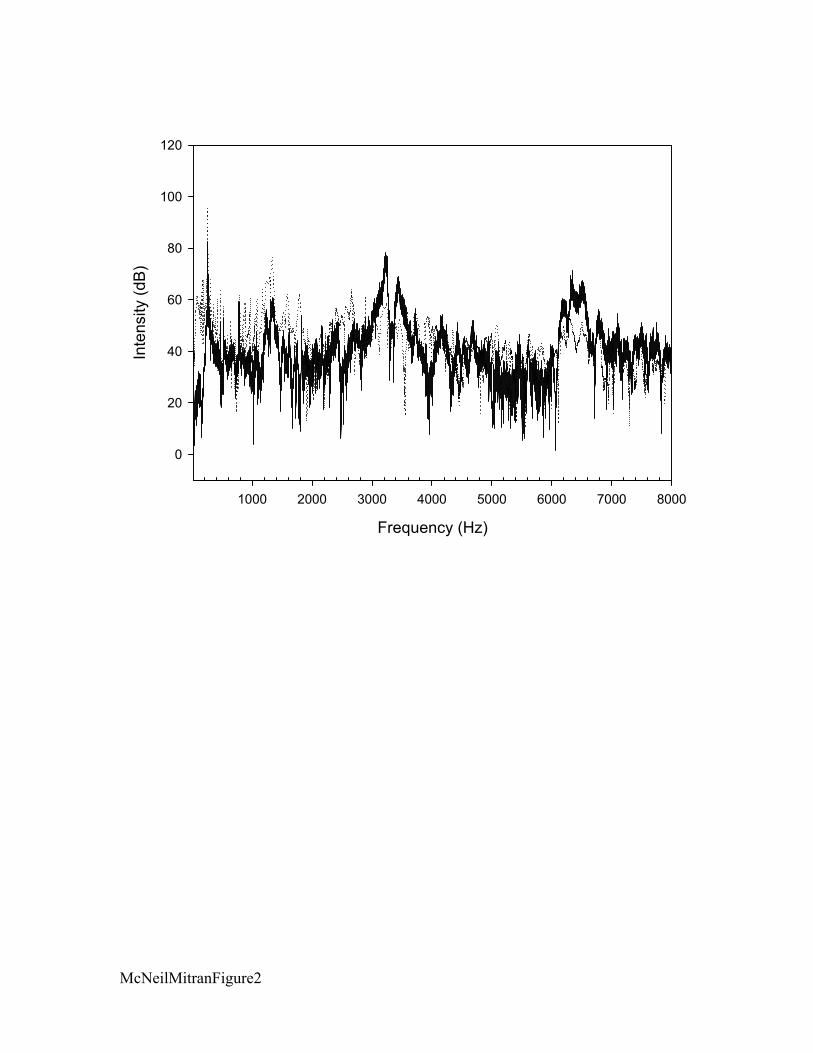
An example of the power spectrum resulting from the Fourier transform of the audio
signal is shown in Fig. 2. The spectrum contains a strong, relatively sharp peak 50 – 80
dB above background at the fundamental frequency of the key’s vibration. This mode of
vibration is responsible for the pitch the key sounds, and ranges from 117 to 948 Hz
(approximately B 2 to B 5 in the American system of pitch notation). A second peak,
typically 30-50 dB above background, appears at the frequency of the next higher mode
of vibration. In most of the spectra a third (and sometimes a fourth) peak is also
distinguishable from the background level. The frequencies recorded for each key are
given in Table I. Also shown in the figure (dotted line) is the spectrum recorded from
that key with all of the keys undamped, as they would be when the instrument is played.
As can be seen, the damping has little if any effect on the spectrum except at the higher
frequencies, where the sound is less intense.
C. Frequency calculations
We have computed the vibration frequencies of some of the mbira keys using two
finite element methods. In the first method, a mbira key is treated as a one-dimensional
body and discretized using curved beam (more concisely, arch) elements as described
below. Arch elements were introduced after an initial study showed poor behavior of a
model constructed using standard, straight beam elements. In the second method, a key is
modeled as a three-dimensional body using standard brick elements (the C3D6 element
6

of the Calculix finite element program was used). Two methods were used to provide a
check against one another and to resolve a number of interesting questions that arise in
comparisons of experimental and computational results.
The behavior of straight elastic beams is well understood and accurately described by
the classical Euler-Bernoulli and Timoshenko beam theories. Curved beams exhibit more
complicated behavior because of the nonlinear coupling between bending, twist, shear
and extension. Due to their importance in structural engineering, there have been many
studies on the behavior of curved beams (e.g. Ref. 3). An important question is whether
the scale disparity between beam length and thickness can be used to separate the three-
dimensional elasticity problem into a one-dimensional problem along the beam length
and a two-dimensional problem in the beam cross section. The two dimensional problem
can typically be easily approximated, and the overall complexity is reduced to solving a
one-dimensional problem instead of the full three-dimensional elasticity problem. That
such a splitting is possible has been established by Berdichevsky4. The problem of
determining a specific splitting procedure is still a research subject. Specific
characteristics of the problem, including amount of deformation, curvature, nature of
applied forces, come into play, and some splittings are able to capture the above effects
while others fail (see Ref. 5). Even though one-dimensional curved beam theories exhibit
these deficiencies, the overall economy in computational effort makes them attractive.
There are a number of formulations for curved finite elements The basic steps in the
construction of the finite element model are: (1) define an approximation function for the
displacements as a function of longitudinal position; (2) construct the elemental stiffness
and mass matrices using a variational formulation; (3) assemble the elemental matrices to
7

form a global eigenproblem; (4) solve the eigenproblem for a specific set of boundary
conditions. Steps (2)-(4) are standard procedures which can be found in a number of
finite element texts, e.g. Bathe6. The main feature which distinguishes one arch finite
element formulation from another is how displacements are approximated along the beam
length. A specific formulation has been introduced to study this problem.
We use a local Frenet triad to describe the local deformations in the finite
element cross section, with the coordinates denoting the tangential, normal and binormal
direction, respectively. (See Fig. 3 for the definition of the coordinates.) We assume that
the finite element is small enough to consider the radius of curvature
),,( bnt
R constant over the
element’s length; hence the longitudinal position can also be specified by the angle
. We assume that plane cross sections remain plane during deformation. We
consider the beam element to undergo three types of deformation: (a) a tangential
deformation ; (b) a normal deformation ; (c) a cross-section rotation . All these
deformations are defined at the element mean fiber, i.e. the line along the thickness of the
element that does not change in length during deformation. In general, there exists some
series expansion of the displacement in terms of the
Rt /
u nu u
u angle, )(uu . We desire for
this expansion to have as few terms as possible while still providing sufficient accuracy.
The distinguishing feature of the finite element approximation used here is the use of a
mixed, Taylor-trigonometric expansion to approximate the displacements. The tangential
deformation is approximated as:
sincossincos 54321 aaaaau . (1)
8

If we neglect shear deformations (relative slipping of adjacent finite element cross
sections) the expansions for ( , ) can be written using the coefficients from the
expansion for ,
nu u
u
654321 )sin(cos)cos(sincossin aaaaaCaun ,
65411
cos2
sin2
aR
aR
aR
aR
Cu , (2)
where ,2/1 ARIC b A is the cross-sectional area, and is the moment of inertia
around the binormal axis. Note that twisting of the cross-section is not taken into account
in this model. Normal stresses are assumed to vary linearly across the cross-section. The
resultant forces from a cross-section can be related to the displacements through
bI
2
2 2
t
bt
b tb t
dFF
ddu MEA
F uR d R
EI d uM u
R d
. (4)
Once the longitudinal displacement functions and the forces in the cross section have
been established, standard finite element procedures lead to the formation of an
eigenproblem
(8).2 KuMu
In the above is the pulsation, M the mass matrix, K the stiffness matrix and u the
vector of displacements. In order to completely define the problem boundary conditions
must be imposed. Given the construction of the mbira, the vertical displacements at the
point where the keys are clamped are set as null. The displacements in the other two
directions are impeded by frictional contact between the key and the sound board or
9

upper clamping bar. In the computations carried out here, these displacements were also
set as null. The behavior at the fret is more difficult to capture simply. Displacements
along the vertical orientation (perpendicular to the soundboard) are impeded only in one
direction (downwards). Lateral and longitudinal displacements are impeded due to
friction between the key and the fret but not necessarily nullified. We consider the effect
of a number of boundary conditions at the fret below. Solving the eigenproblem gives the
vibration frequencies and associated vibration modes .2/i ir
D. Acoustic radiation from a vibrating mbira key
The sound produced by a struck mbira key is a superposition of the vibration modes
from the finite element computation above. Not all modes are excited by the initial
striking of the key and some modes are more efficient sources of acoustic radiation than
others. Furthermore the soundboard is also excited by a vibrating key and radiates
acoustic waves. All these effects have to be taken into account in order to compare a
measured acoustic power spectrum with the results from a computational simulation.
1. Key playing
We adopt a simple model of how a key is played. We assume that a key is deformed
from its equilibrium position by a force acting normal to the key mean fiber and then
instantaneously released. The initial shape is determined by solving the problem0u
fKu0 (9)
where is a vector of forces applied at each node within the finite element model. For
the model of key playing considered here all components are null except those
corresponding to the end node of a key.
f
10
2. Vibration mode amplitudes
The initial shape is decomposed on the vibration modes0u NrrrR ...21 by
solving the linear system
(10) N
jijji Nia
10 .,...,2,1,urrr
The amplitudes specify the degree of initial excitation of each vibration mode. ja
3. Acoustic efficiency
Mbira keys are curved arches with significant coupling between extensional, twisting,
and bending vibration modes. Only weak acoustic radiation is expected from an
extensional or twisting mode, due to the small key surface area that sets the surrounding
air into motion. The keys radiate directly and also set the sound board into motion. The
surface area of the sound board is much larger than that of the keys and, conceivably,
extensional modes could radiate efficiently by exciting the soundboard. However, the
coupling of a key to the soundboard is accomplished by ensuring vertical contact at 3
points: the edge of the soundboard, the clamp pressing on the top of a key and the fret
pressing against the bottom of a key. The contact in the other directions is through
friction forces that result from the vertical clamping forces. Longitudinal vibrations of a
key produce forces which act against the frictional contact and are not expected to
produce significant excitation of the sound board. We therefore concentrate on the
relative acoustic efficiency of sound radiation from the key motion itself, understanding
that the intensity of acoustic waves emitted by bending modes of a key are amplified by
the sound board while those associated with extensional or twisting modes are not.
The acoustic field produced by a key is the solution of the equation
11

2 2 0tt c , (11)
along with boundary conditions given by the key motion. In (11) is the acoustic
velocity potential and c is the sound speed. Rather than solve this complicated problem
in a domain with a moving boundary, we carry out a simple estimate. We assume that
only the normal displacement associated with a vibration mode makes a significant
contribution to the overall acoustic field. Assuming the vibration amplitudes to be small,
the above problem is replaced by with the source term defined
only on the mbira key, and
2 2tt tc A y y ty y
A a scaling factor which plays no role here and shall be taken
as unity. Here y is the displacement of the key normal to the mean fiber, and the source
term arises from integrating the kinematic condition y tyv which states that the
acoustic velocity equals the key velocity for positions on the key (for an extended
discussion of how this equation is obtained see7,8). We further assume the key to be
infinitely thin. The solution to the above equation can be expressed as the convolution
0 0( , ) ( , ) ( ) ( )
L
tx t G x e t y y d d (12)
with being the unit vector tangent to the key mean fiber and e
)4/()(),( xctxtxG the fundamental solution for the wave equation. The
acoustic intensity is given by with the acoustic overpressure and the
acoustic velocity. In terms of the velocity potential we have:
puI p u
yI t /~ . Use of the
Dirac-delta allows the time integral to be evaluated and we are led to the far-field
estimate
2 2
0( ) ~ ( , ) ~ ( ) ( ) ( )
L n nI y d a r r , (13)
12
stating that the far acoustic field is proportional to the eigenmode frequency and the
squared normal-to-mean-fiber amplitude.
The estimate (13) allows us to predict the acoustic power spectrum obtained by
playing a key. When a key is played a beam eigenmode is excited with amplitude ( )a
obtained by solving (10). For each eigenmode we compute the integral (13) and thereby
obtain a prediction of the acoustic wave intensity produced by that eigenmode. Note that
modes for which the transverse motion 2 ( , )y is small will contribute less to the
overall acoustic spectrum even if their initial excitation by stroking the key ( )a is
comparable to that of other modes.
As mentioned, for a curved beam bending and extensional modes are coupled. In
order to classify which modes behave more like bending modes (i.e. transverse motion is
predominant) and which behave more like extensional modes (i.e. longitudinal motion is
predominant) we introduce a criterion. Let z denote the deformation in the local
direction of the mean fiber, and introduce the quantity
2
0( ) ~ ( , )
LJ z d . (14)
We define modes for which ( ) ( ) / ( ) 1I J as ‘transverse’ while those for which
( ) 1 shall be referred to as ‘longitudinal’.
III. RESULTS
A. Measured frequencies
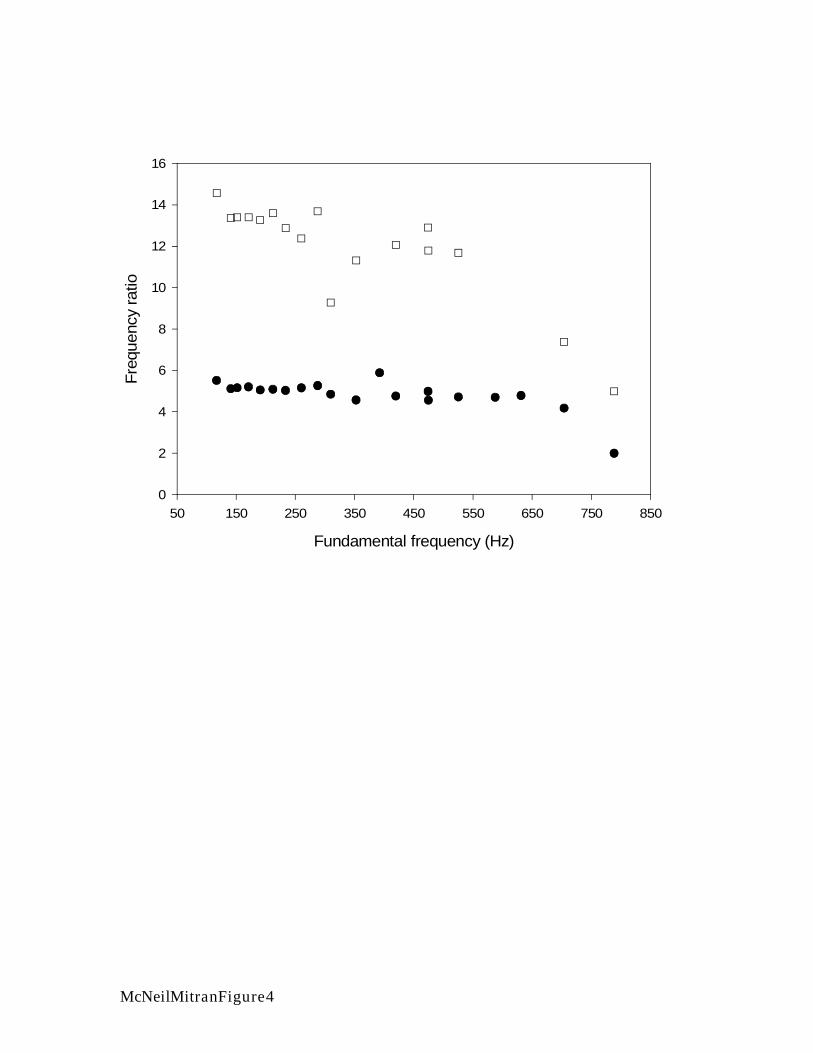
Fig. 4 shows the ratio of the frequencies of the second and third peaks in the spectrum
(hereafter referred to as the first and second overtone) recorded for each key to the
13
fundamental frequency produced by the key, plotted vs. the fundamental frequency.
With the exception of the shortest key, the ratio of the frequency of the first overtone to
that of the fundamental is approximately 5, ranging from 4.2 to 5.8. The second overtone
is more variable, but for the longest keys (those with the lowest fundamental
frequencies), its frequency is approximately 13.6 times the fundamental frequency. This
suggests that the modes of vibration of the keys are all very similar.
B. Calculated frequencies
The exact material properties of the key were not known and could not be measured
without damage to the instrument; hence we used the fundamental frequency to calibrate
the Young’s modulus (E) and density ( ) of the material of which the key was made. Use
of standard values for soft steel (E = 200 GPa, = 7800 kg/m3) led to a relative error of
~10% in prediction of the fundamental frequency among the keys for which the
computation was carried out (B1, B7, R9). Given this calibration against the fundamental
frequency, the main prediction of the model is the frequency of the overtones as well as
the overall shape of the far-field acoustic spectrum. We used a smoothing spline
procedure to adjust the geometric data for the keys to avoid propagating small
measurement errors into the numerical procedure for computing the eigenmodes and
frequencies.
The eigenmodes for key B7 computed using the three-dimensional model are shown
in Fig. 5. The three-dimensional computations served as a check on the one-dimensional
model and also to investigate fret boundary conditions. The computations are however
quite expensive. In order to obtain convergence in the first 6 eigenmodes to within 1 Hz
approximately 240,000 brick elements were required. Carrying out the decomposition of
14

the initial deflection onto an eigenmode basis was not feasible. The effect of fret
boundary conditions is shown in Table II. When vertical displacements are set to null the
key oscillates as a shorter length beam with a consequent increase in frequency (compare
Mode 1, free displacement and 0yu case). Blocking further degrees of freedom
changes the overtone frequencies.
Frequencies obtained from the one-dimensional arch element computation of the B7
key are shown in Fig. 6. Given the much simpler computational effort many more
eigenmodes were computed, sufficient to accurately represent the power spectrum
associated with the initial deformation imposed by stroking a key. Some of the modes are
spurious however and result from the simplifying assumptions of the one-dimensional
model. In particular modes 1, 2 from the one-dimensional computation arise due to the
rapid tapering of a key towards the end. This leads to large cross-section rotations in the
finite element model. The deformation for these spurious modes corresponds to bending
of the tapered key tip attached to the much stiffer main part of the key. The possibility
that spurious modes appear in regions where the simplifying assumptions of one-
dimensional beam theory break down is unavoidable. In particular, results should be
scrutinized in region of rapid variations in geometry. Spurious modes can also arise from
shear locking behavior (details on origin and elimination of spurious modes can be found
in Ref. 9). Fortunately, the spurious modes have relatively small transverse
displacements and contribute little to the acoustic power spectrum evaluated by (13) even
though their vibration power spectrum is significant (pressing on the end of a key
imposes a large initial amplitude on these modes). Hence in this work no additional
modification of the finite element method was made to eliminate spurious modes.
15

IV. DISCUSSION
A. Overtone frequencies
The vibrational frequencies of a simple cantilever can be calculated by standard
techniques10. The well-known result for a straight beam of uniform cross-section that is
clamped at one end is that the frequencies of the first and second overtones are 6.4 and
17.5 times the fundamental frequency. However, the mbira keys are neither uniform in
cross-section nor straight. There is significant coupling between bending, twisting and
compressional deformation.
A typical result from the computation of the B7 key is presented in Fig. 6. The
vibration power spectrum shows the initial amplitude of each eigenmode imposed by
stroking the key as obtained from solving system (10). The far-field acoustic power
spectrum shows the results of evaluating integral ( )I from (13) to obtain the radiated
sound intensity. Bars show the predictions of the one-dimensional model, arrows show
the frequencies obtained from the three-dimensional model. The strongly-excited, one-
dimensional, modes 1 and 2 are spurious modes, arising from breakdown of one-
dimensional simplifying hypotheses as mentioned above. The most efficient acoustic
radiator (highest ( )I ) among the low frequency modes is mode 4 which corresponds to
bending of the entire key. We calibrated the observed fundamental frequency to mode 4
to account for the unknown material properties, thus obtaining a value of GPa
for the elasticity modulus. We then observed that the next most efficient acoustic
radiator is mode 21 at a frequency of 4.9 times that of the fundamental; the associated
computed frequency f=1313 Hz is within 2% of the measured first overtone of 1341 Hz
205E
16

(Table I). Other vibration modes which are significant sound radiators are modes 11, 31
and 40. All of these show up as peaks within the measured acoustical spectrum (Fig.
6(c)), thereby confirming the overall accuracy of the numerical procedure.
From a modeling point of view it is interesting to compare the three-dimensional and
one-dimensional approaches. The three-dimensional approach allows for accurate
predictions of the low order modes, but at such a computational cost that obtaining a
complete eigenbasis to compute the vibration power spectrum and the far-field acoustic
power spectrum becomes prohibitive. Furthermore contact boundary conditions at the fret
introduce an additional unknown which must be explored through (expensive) numerical
experimentation. The one-dimensional model sometimes predicts spurious modes, but
furnishes a sufficiently accurate description of key vibrations for a correct evaluation of
the far-field acoustic spectrum.
A simulation of the effect of the soundboard was also carried out. Forces from
transverse modes and from longitudinal modes were applied on a rectangular slab of
anisotropic, three-dimensional brick elements in the Calculix program. The transverse
forces were applied through a dashpot element to model the frictional contact. As
expected the soundboard received negligible energy from longitudinal modes by
comparison to transverse modes. This is a direct consequence of the coupling between the
vibrating elements and the soundboard. Hence in practice the relative attenuation of the
longitudinal modes with respect to the transverse modes is even more pronounced than
that computed here.
17

B. Tuning
The mbira is in essence a keyboard instrument (and it is sometimes called a “thumb
piano” by Westerners), and therefore must have a well-defined relationship among the
pitches (i.e. fundamental frequencies) of the different keys. The pitch of an individual
key can be adjusted by shifting it relative to the bridge so that the vibrating length of the
key is increased (to lower the pitch) or decreased (to raise the pitch). Since in its
indigenous use the tuning of each key is done “by ear” (or by comparison to another such
instrument) rather than by reference to an absolute standard of pitch, it is reasonable to
expect that the fundamental frequencies to which the higher-pitched keys are tuned will
bear some relationship to the overtone frequencies of the lower-pitched keys, so that
when played together the overtones of the different keys will coincide to produce a
harmonious sound.
Simple stretched strings have overtone frequencies that are in pure whole-number
ratios to the fundamental frequency, and so tuning successive strings such that their
fundamental frequencies are 2, 3, 4, 5, etc. times the fundamental frequency of the lowest
string allows the frequencies of the overtones of the strings to overlap to produce a
harmonious sound. This tuning produces musical intervals between the pitches produced
by successive strings of an octave, a perfect fifth, a perfect fourth, and a pure major third.
This type of tuning is known as just intonation, and was widely practiced in Western
Europe in the 16th and early 17th century. It has been largely replaced by the modern
system of equal temperament in which the frequency ratios for successive pitches
(semitones) are fixed at 12 2 , which allows a keyboard instrument to play in different
musical key signatures without retuning.
18

Instruments such as the mbira that produce their sound by the vibration not of simple
strings but of cantilevered rods have ratios of their overtone frequencies that are different
from those of strings. It is therefore reasonable to expect that the tuning of such
instruments would differ from just intonation, and this is indeed what has been observed
by ethnomusicologists. In a 1932 study Hugh Tracey observed11 that in some cases
mbira players tuned some keys using an overtone in preference to the fundamental to
produce the desired effect. Tracey also noted12 that the accepted tuning of the instrument
varied by region, with each local group of musicians agreeing upon a “correct” local
manner of tuning. In 1978 Paul Berliner made a detailed study of the tunings used by
Shona mbira players in Zimbabwe1. The intervals between the pitches of the mbira keys
in five tunings that he observed are displayed in columns 3-7 in Table III (labeled by the
names of the musicians from whom he recorded them), and the intervals expected for just
intonation are included in column 2 for comparison. As expected, these tunings all differ
from the just intonation that would be produced in tuning simple stretched strings “by
ear”.
A sixth tuning included in the table is that specified by Kevin Volans, a South African
composer of classical music in the Western European tradition. In his composition White
Man Sleeps for two harpsichords, viola da gamba and percussion he specifies13 that the
instruments are to be tuned as listed in column 8 of the table, which he labels “a tuning
system derived from Shona Mbira music.”14 As can be seen from the table, it deviates
from the tunings recorded by Berliner from Shona musicians no more than they deviate
from one another.
19

The tuning of the mbira studied in this work is also presented in Table III. While the
measurement procedure described above allows confidence in the accuracy of the
frequencies listed there, their relationship to a “proper” tuning is less certain. It is
possible that the tuning of this instrument may have changed since it left the hands of its
musician-maker, and thus that the tuning recorded here may not accurately represent the
tuning it was intended to have. However, the fact that the keys are quite firmly fixed in
place so that increasing or reducing the vibrating length requires considerable force
(applied with a hammer to one end of the key) suggests that the tuning has probably not
changed significantly since it was last adjusted. Inspection of Table III reveals that the
intervals between almost all the keys of the mbira studied here are very similar to those
used by Volans and by the musicians recorded by Berliner.
The question that originally stimulated this study was this: Is the tuning of the mbira
determined by the overtones of the vibrations of its keys? From the evidence here
presented, it would appear that the answer is “no.” Because the first overtone is
approximately five times the frequency of the fundamental (corresponding to a musical
interval of approximately two octaves plus a major third), the overtones of only the
lowest few keys overlap with the fundamental frequencies of any of the upper keys, and
the matching of overtone frequencies with fundamentals is not particularly good. The
large frequency differences involved presumably make the matching of the frequencies
sufficiently difficult to hear that they do not strongly influence the tuning. The lower
intensity of the overtones compared to the fundamental may also make their use in tuning
impractical. For the mbira the first overtone is typically 20-30 dB lower in intensity than
the fundamental. In stringed instruments or Western European keyboard instruments the
20
first and second overtones can often be comparable in intensity to (or even louder than)
the fundamental.15 However, Berliner2 describes how master mbira maker John Kunaka
deliberately constructed the lowest key (B1) on his mbira to have “two voices,” i.e. the
fundamental and the first overtone, with the overtone sounding two octaves plus either a
fifth or a third above the fundamental. Kunaka stated that this overtone “helped the
music,” but that the overtones of the other keys did not and were ignored. Andrew
Tracey16 noted that in some mbiras the fundamentals of the lower-pitched keys are almost
inaudible, and the maker has tuned them so that the prominent overtone, rather than the
fundamental, gives the desired note. In other cases the fundamental is used, but the
overtone is wildly discordant, giving the instrument a “tinkling, metallic effect.” He
experimented with methods of tuning the overtone to a pitch two octaves above the
fundamental by removing material from the key at appropriate locations. He was
successful in doing so, but remarked that he had encountered only one instrument by an
African maker in which this had been done.
V. CONCLUSION
We have measured the acoustic spectrum of the keys of an African mbira. We find
that the most prominent overtones present in the spectrum have frequencies that are
approximately 5 and 14 times the lowest frequency. A finite-element model of the
vibration of the key that takes into account the acoustic radiation efficiency of the various
normal modes reveals that the far-field power spectrum is dominated by modes involving
predominately transverse motion of the key. A procedure to quantify the acoustic
radiation produced by each normal mode has compared favorably to experimental results.
21

The finding that the most prominent overtones in the sound spectrum have very high
frequencies relative to the fundamental makes it unlikely that the tunings of the mbira
that are used by expert musicians are determined by matching the fundamental
frequencies of the upper keys with the overtones of the lower keys.
22

ACKNOWLEDGEMENTS
One of the authors (LEM) would like to thank Brent Wissick of the UNC-CH Dept. of
Music for introducing her to White Man Sleeps, and for sparking the original question
that this work attempts to answer. We would also like to thank Louise Meintjes of the
Duke Univ. Dept. of Music for lending us the mbira upon which the experiments were
performed, and Paul Berliner of the same department as well as mbira master Cosmas
Magaya for providing helpful information about the musical context of the mbira. Fred
Brown of the UNC-CH Dept. of Physics and Astronomy provided valuable assistance
and equipment for the recording and data processing, Phillip Thompson of the same
department provided the dimensional data, and Elliott Moreton of the UNC-CH Dept. of
Linguistics graciously allowed us to use the sound chamber. We are grateful to all three.
23

REFERENCES
1Paul F. Berliner, The Soul of Mbira (Univ. of California Press, Berkeley, CA 1978)
2Paul Berliner, “John Kunaka, Mbira Maker,” African Arts 14(1), 61 (1980).
3D. H. Hodges, “A Mixed Variational Formulation Based on Exact Intrinsic Equations
for Dynamics of Moving Beams”, International J. of Solids and Structures, 26(11);1253-
1273, 1990.
4V. L. Berdichevsky. “On the Energy of an Elastic Rod”, J. Applied Math. And Mech.
(PMM), 45:518-529, 1982.
5V. L. Berdichevsky, S. S. Kvashnina, “On the Theory of Curvilinear Timoshenko-type
rods”, Prikl. Mathem. Mekhan. 47(6):809-817, 9183.
6K. J. Bathe, Finite Element Procedures, MIT, 2006.
7J. E. Ffowcs Williams and D. L. Hawkings, Sound Generation by Turbulence and
Surfaces in Arbitrary Motion, Phil. Trans. Roy. Soc. A264:321-342, 1969.
8S. Arendt, D. C. Fritts, “Acoustic Radiation by Ocean Surface Waves”, J. Fluid Mech.
415:1-21. 2000.
9R. H. MacNeal, Finite Elements: Their Design and Performance, Marcel Dekker, 1993
10See for example N.H. Fletcher and T.D. Rossing, The Physics of Musical Instruments
(Springer-Verlag, New York 1991), section 2.15.
11Hugh Tracey, “The Mbira Class of African Instruments in Rhodesia (1932),” African
Music: Journal of the African Music Society 4(3), 78 (1969).
12Hugh Tracey, “Measuring African Scales,” African Music: Journal of the African
Music Society 4(3), 73 (1969).
13Kevin Volans, White Man Sleeps (Chester Music Ltd., London, 1990)
24

14Composer’s statement, <http://kevinvolans.com/kv_arti_whit.shtml> (last viewed 1
June 2007)
15Examples of such spectra can be found in Ref. 10.
16Andrew Tracey, “The Tuning of Mbira Reeds,” African Music: Journal of the African
Music Society 4(3), 96 (1969).
25

TABLES
TABLE I: Frequencies recorded for the keys of the mbira.
Key Fundamental (Hz) Overtone 1 (Hz) Overtone 2 (Hz) B1 117 646 1705B2 141 722 1883B3 152 784 2033B4 171 890 2290B5 191 965 2530B6 212 1080 2882B7 260 1341 3220L1 234 1176 3005L2 353 1613 3990L3 310 1502 2874L4 392 2310L5 420 2000 5060L6 475 2167 5597R1 288 1515 3940R2 474 2365 6116R3 525 2480 6137R4 587 2764R5 631 3022R6 704 2944 5200R7 788 1576 3941R8 852R9 948
26

TABLE II: Effect of boundary conditions at fret upon frequencies calculated using the
three-dimensional finite element model. Displacements , ,x y zu u u correspond to
directions along key length, perpendicular to key and vertical, perpendicular to key and
horizontal
Fret Boundary Condition Mode A Mode B Mode C Mode D Mode E
Free displacements 171 728 830 2256 2348
0yu 256 749 1441 2771 3970
0 0,x yu u 261 1465 1607 2797 4010
0 0, ,x y zu u u 0 261 1465 1848 2848 4010
27

TABLE III: Mbira tuning intervals in cents (an interval of one cent corresponds to 1/100
of an equal-tempered semitone, or a frequency ratio whose logarithm equals
2.5086 x 10⁻⁴). Column 1 labels the mbira keys, in order of increasing fundamental
frequency. Column 2 (“Just”) represents the intervals between the pitches sounded by
adjacent keys for tuning in just intonation (see text). Columns 3-7 are tunings used by
Zimbabwean musicians recorded by Paul Berliner1, and column 8 is a tuning used by
composer Kevin Volans10. Column 9 contains the intervals between the pitches of
adjacent keys of the mbira measured in this work.
28

Key Just Gondo Mude Mujuru Kunaka Bandambira Volans mbiraB1
386 323 174 126 455 355 360 323B2
112 157 115 117 92 199 154 130B3
204 164 286 156 210 96 171 204B4
182 186 37 314 178 179 175 192B5
112 151 158 105 154 153 100 181B6
204 198 206 171 140 171L1
204 151 170 241 171 182B7
182 187 180 136 189 177R1
112 180 180 126 154 127L3
204 191 211 263 209 118 171 225L2
182 137 170 181 175 181L4
112 164 139 97 164 169 100 119L5
204 182 128 264 161 193 140 213L6
0 15 0 4R2
204 179 231 190 196 185 171 177R3
182 218 180 156 181 204 189 193R4
112 136 118 143 129 204 154 125R5
204 182 214 219 170 163 171 190R6
182 151 172 151 201 158 175 195R7
112 161 173 128 173 137 100 135R8
204 192 260 240 98 251 140 185R9
29

FIGURE CAPTIONS
Fig. 1: Photo of the mbira used in the measurements.
Fig. 2: Power spectrum of audio signal from key B7 (fundamental frequency 260 Hz),
background subtracted (solid line); and the same spectrum recorded with all of the keys
free to vibrate (dotted line).
Fig. 3: Diagram showing finite element coordinate system and deformations.
Fig. 4: Ratio of overtone frequencies to fundamental frequency. Solid symbols: first
overtone. Open symbols: second overtone.
Fig. 5: (A) Three-dimensional finite element discretization. (B-E) Eigenmodes
corresponding to 7 lowest frequencies. At the fret the vertical displacements were set to
null, the other were left free. Modes B,C,F,H are predominantly bending modes. Modes
E,G are predominantly twisting modes. Mode D is similar to mode B but with
pronounced extensional component.
Fig. 6: Results of one-dimensional finite element analysis for the B7 key. Initial
deformation produced by a force acting normal to the mean fiber at the end of the key.
(a) Vibration power spectrum showing the principal transverse modes (solid bars) 4, 11,
22, 32 as well as a wide variety of longitudinal modes (open bars). (c) Far-field acoustic
power spectrum predicted by the finite element analysis (bars) compared with the
experimentally measured spectrum (line). Arrows A,B,C indicate frequencies obtained
from the three-dimensional model.
30
McNeilMitranFigure1
Frequency (Hz)
1000 2000 3000 4000 5000 6000 7000 8000
Inte
nsity
(dB)
0
20
40
60
80
100
120
McNeilMitranFigure2

McNeilMitranFigure3
Fundamental frequency (Hz)
50 150 250 350 450 550 650 750 850
Fre
quen
cy r
atio
0
2
4
6
8
10
12
14
16
McNeilMitranFigure4

