vibration-based health monitoring of damaged bevel...
TRANSCRIPT

MSC Software Confidential MSC Software Confidential
Vibration-based Health Monitoring of
Damaged Bevel Gears Using ADAMS 2012 Regional User Conference
Presented by Brian Fang, Xi Wu
May 7, 2013

MSC Software Confidential
• Detection of problems with gears is important for maintenance
• Methods for non-destructive detecting cracks in gear systems
have generally fallen short of the required performance
• A simple pair of gears involves sophisticated mathematics and it
cannot accurately simulate the gear train’s practical dynamic
behavior
• In 2008, MSC developed ADAMS software to realistically simulate
the dynamics behavior of gears
Background
2

MSC Software Confidential
• Acoustic and vibrational sensors used to detect
issues.
• Past Approaches:
– Time-Frequency
– Wavelet Transform
Past Methods
3

MSC Software Confidential
• The housing of gears tends to vibrate strongly at the gear mesh
frequency
• 𝐺𝑀𝐹 = 𝑁𝑝Ω𝑝 = 𝑁𝐺Ω𝐺
– 𝑁𝑝 and 𝑁𝐺 number of teeth on the pinion and gear respectively
– Ω𝑝 andΩ𝐺 angular velocity of the pinion and gear respectively
Gear Mesh Frequencies (GMF)
4

MSC Software Confidential
• A quick algorithm recently developed to assess the health of a
gear system using just FFT
𝑆𝐸𝑅 = 𝑠𝑖𝑑𝑒𝑏𝑎𝑛𝑑 𝑎𝑚𝑝𝑙𝑖𝑡𝑢𝑑𝑒𝑖6𝑖=1
𝑐𝑒𝑛𝑡𝑒𝑟 𝑚𝑒𝑠ℎ 𝑓𝑟𝑒𝑞𝑢𝑒𝑛𝑐𝑦 𝑎𝑚𝑝𝑙𝑖𝑡𝑢𝑑𝑒
• Note that actual fluctuations can be quite complex in actual
damaged gear system.
• Magnitude of sideband peaks is compared to that of the center
frequency peak.
• Large ratios are indicative of damage system while ratios of
around 1 or less are indicative of healthy systems
Sideband Energy Ratio
5

MSC Software Confidential
• The center frequency is the gear mesh frequency and we expect
the strong responses at those frequencies.
• The SER will be large for damaged systems.
• The location of accelerometers will play role in collecting
consistent data.
Hypotheses
6

MSC Software Confidential
Experiment
• The gear system was run at 5
frequencies
– Motor Shaft Speed: 10hz,
15hz, 20hz, 25hz, and 30hz
• An oscilloscope was used to
calculate the input shaft
speed
• In previous experiments
bearing and gears were
intentionally damaged.
7

MSC Software Confidential
Experiment (continued)
• Four PCB accelerometers
were used
• Accelerometers 1, 3 and 4
were placed along the shafts
• Accelerometer 2 was placed
above the gears
• Dactron® acquisition system
was used recorded output
from accelerometers and
plotted FFT
8

MSC Software Confidential
Experimental Results
• FFT of the data
collected from
accelerometer
2 at an input
shaft speed of
15Hz
9
0
0.01
0.02
0.03
0.04
0.05
0.06
0.07
0 90 180 270 360 450 540 630
Acc
ele
rati
on
(m
/s^
2)
Frequency (Hz)
15Hz Accelerometer 2
ORBP
GMF 2*GMF 3*GMF

MSC Software Confidential
Experimental Results (continued)
• FFT of the data
collected from
accelerometer
2 at an input
shaft speed of
30Hz
10
0
0.01
0.02
0.03
0.04
0.05
0.06
0.07
0.08
0 180 360 540 720 900 1080 1260 1440 1620
Acc
ele
rati
on
(m
/s^
2)
Frequency (hz)
30Hz Accelerometer 2
GMF 3*GMF
2*GMF
ORBP

MSC Software Confidential
• SER to be 2.975 to 3.269 with 99% Confidence*
• Consistency depended on location of sensor. The most consistent
Experimentally Determined SER
11
Locations Speed
10 Hz 15 Hz 20 Hz 25 Hz 30 Hz
Accelerometer 1 3.058 3.849 3.172 3.583 2.98
Accelerometer 2 3.059 3.5003 2.444 3.07 2.428
Accelerometer 3 3.556 3.886 1.602 3.378 3.323
Accelerometer 4 3.261 4.31 1.648 4.403 2.691

MSC Software Confidential
• Two systems
– Perfect gear system
– Damaged Gear system
ADAMS Simulation
12

MSC Software Confidential
Parameters Value
Stiffness K 1.8 x 10⁵ N-mm
Force Exponent e 2.2
Damping c .27 N-s/mm
Penetration dc 1 x 10⁻³ mm
Young's Modulus E 2.07 x 10¹¹ Pa
Poisson's Ratio ν 0.29
Density ρ 7801 kg/m3
ADAMS Simulation Parameters
Parameters Value
Backlash B 0.05 mm
Module m 3 mm/tooth
Pressure Angle Φ 20 deg
Face Width F 10mm
Pinion Zp 13 Teeth
Gear Zg 26 Teeth
13

MSC Software Confidential
• Constant angular velocity on pinion
• Resistance torque of 10N-mm added to Gear
• Revolute joints at the center of the gears
Simulation Constraints
14
MSC Software Confidential
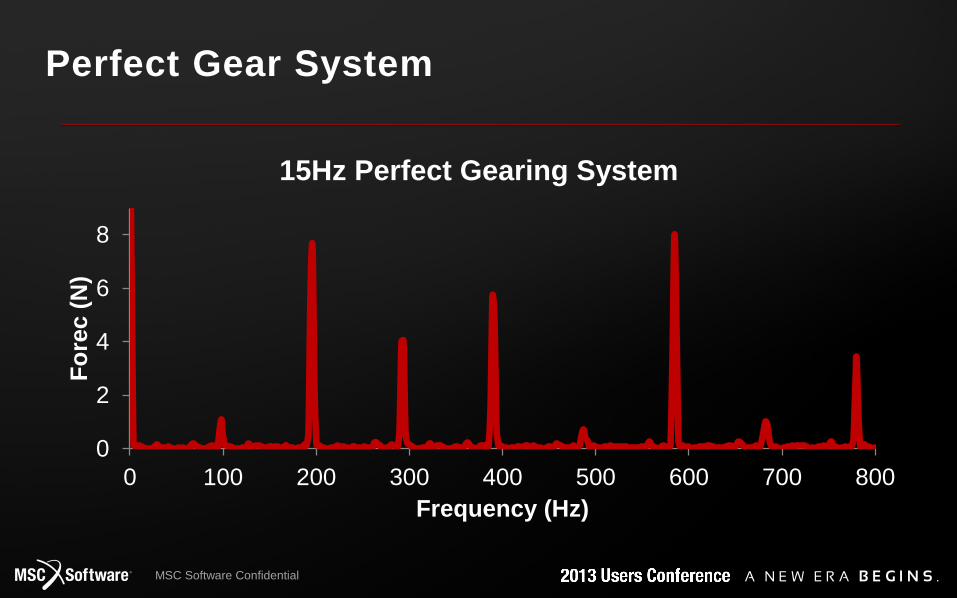
Perfect Gear System
0
2
4
6
8
0 100 200 300 400 500 600 700 800
Fo
rec (
N)
Frequency (Hz)
15Hz Perfect Gearing System

MSC Software Confidential
Perfect Gear System
0
1
2
3
4
5
0 500 1000 1500
Fo
rce (
N)
Frequency (Hz)
30Hz Perfect Gearing System

MSC Software Confidential
Damaged Gear System
-1
1
3
5
7
9
0 100 200 300 400 500 600 700 800
Fo
rce (
N)
Frequency (Hz)
15hz Damaged Gearing System

MSC Software Confidential
Damaged Gear System
0
1
2
3
4
5
0 200 400 600 800 1000 1200 1400 1600
Fo
rce (
N)
Frequency (Hz)
30Hz Damaged Gearing System

MSC Software Confidential
Simulation Determined SER
• For Undamaged system, the mean was 0.970
• For Damaged system, the mean was 2.55
SER Indicator
Speed
10 Hz 15 Hz 20 Hz 25 Hz 30 Hz
SER for a perfect
gearing system 0.99 0.68 1.07 1.07 1.04
SER for a damaged
gearing system 2.95 3.71 1.62 1.81 2.66
MSC Software Confidential
Conclusion
• ADAMS Simulation does vary quite a bit, but it is able to follow
the pattern and theory of SER
• SER relatively simple way to detect problems and their severity;
more difficult to predict exact issue

MSC Software Confidential
Further Study
• Do experiment with a healthy gear system
• Make a more complex gear system model by :
– Adding in bearings in ADAMS
– Using vibration package
– Include friction
– Include housing

MSC Software Confidential 22