vibration handbook · ©prÜftechnik ag vibration handbook 3 table of contents table of contents 1....
TRANSCRIPT

©PRÜFTECHNIK AG Vibration Handbook 1
Vibration HandbookFundamentals – Transducers – Measurement methods

Foreword
Maintenance plays an increasingly important economic role inmodern industry, as managers realize that the key to retaininglong-term investment capital value lies in regular service andinspection. In addition, conscientious maintenance practiceshelp avoid unplanned machine stoppage and the resulting pro-duction downtime while improving production quality andplant safety.
The German DIN Standard 31 051 defines maintenance as ‘allmeasures for retention and re-creation of the specification con-dition as well as for determining and evaluating the actual con-dition of technical aspects of a system.’ Vibration measurementis one of the primary measurement methods for determiningactual machine condition and allows a comprehensive evalua-tion through the potential of Fourier transformation.
PRÜFTECHNIK has a long history of putting innovative techno-logical ideas into industrial maintenance practice - with thepractical advantage for the user always foremost in mind. Thisguiding principle was first confirmed by OPTALIGN, theworld's first laser shaft alignment system.
This handbook is intended to provide you, the user, with a sol-id basis of vibration knowledge and a useful reference for put-ting this knowledge into practice. We wish you much enjoy-ment and success in doing so.
PRÜFTECHNIK AG
Vibration HandbookOrder number VIB 9.433G©PRÜFTECHNIK AGAll rights reserved.

©PRÜFTECHNIK AG Vibration Handbook 3
Table of contents
Table of contents
1. Introduction to vibration measurement ..................... 31.1 Periodic vibration in the time domain ........................ 41.1.1 Composite vibrations ................................................... 61.1.2 Vibration parameters ................................................... 71.1.3 Conversion factors ....................................................... 91.2 Periodic vibration in the frequency domain ............. 101.2.1 Fourier transformation .............................................. 101.2.2 Frequency analysis ..................................................... 111.3 Rigidity, mass, damping ............................................ 131.4 Summary ..................................................................... 16
2. Vibration transducers for differentmeasurement problems.............................................. 17
2.1 Piezo transducers ....................................................... 172.2 Induction transducers (velocity probes) .................. 192.3 Eddy current transducers (proximity probes) .......... 202.4 Transducer mounting ................................................. 21
3. Evaluating machine conditionthrough vibration analysis ......................................... 25
3.1 Vibration severity according to ISO 2372 ................ 253.1.1 Definition .................................................................... 263.1.2 Classification .............................................................. 273.2 Frequency analysis ..................................................... 293.2.1 Fundamentals ............................................................. 293.2.2 Terminology ............................................................... 303.2.3 Spectra of standard vibration forms ......................... 373.2.4 Notes on successful vibration analysis ..................... 393.3 Vibration causes and
their characteristic frequencies ................................. 403.4 Case histories of machine damage ............................ 413.4.1 Radial compressor coupling damage ........................ 413.4.2 Chiller misalignment .................................................. 433.4.3 Summary ..................................................................... 44
4. Index ........................................................................... 45
5. Bibliography ............................................................... 47


©PRÜFTECHNIK AG Vibration Handbook 3
Introduction to vibration measurement
1. Introduction to vibration measurement
Vibration can occur in a multitude of forms. Whether they bedesirable (in the form of a tone emitted by a tuning fork) orundesirable (such as the noise and vibration of a jackhammeror the characteristic jolt made by a refrigerator starting up),vibrations are a part of everyday life.
In industrial environments, the study of vibrations and theircauses and remedies is very important to ensure the smoothoperation and long operating life of critical production aggre-gates. Mechanical vibration serves as an excellent indicator ofmachine condition, because it includes the influences of dy-namic loading, foundation behavior and all external influenc-es. Most rotating equipment vibration occurs due to rotor im-balance or insufficient shaft alignment.The following pages offer a brief introduction to appropriatetheoretical fundamentals, which aid in understanding the sub-sequent discussion of measurement processes and analysis.This introduction has purposely been kept simple for the nov-ice to the field of vibration measurement; the bibliography listssources for more in-depth study of these topics.
Examples of vibration
R FP TÜ
R
V 8. 5 /IB 51 M5
ECH

4 ©PRÜFTECHNIK AG Vibration Handbook
Introduction to vibration measurement
1.1 Periodic vibration in the time domain
Vibration is generally considered to be the movement of a massor a body about its position at rest. Periodic vibration occurswhen the vibration repeats itself at regular intervals of time(e.g. tuning fork).
Fig. 1 Periodic vibration
The time length of a single vibration cycle is known as the vi-bration period T. The reciprocal 1/T is known as the vibrationfrequency and is expressed in cycles per second, or Hertz (Hz).The following sine function describes the undamped periodicvibration shown above:
x(t) = x • sin (ωt + φ);x(t): Displacement, instantaneous vibration valuex: Amplitude, maximum instantaneous valueω: Angular frequency; ω = 2•π/T = 2•π•fφ: Phase angle, initial position of the oscillation at
t =0.The equation indicates the displacement - the vibration - as afunction of time.
f = 1/T
X
T
t
x(t) = x • sin (ωωωωωt + φφφφφ)

©PRÜFTECHNIK AG Vibration Handbook 5
Introduction to vibration measurement
The fundamental physical source of this vibration and of therecorded signal could be thought of, for example, as follows:
The vibration velocity v is the change in displacement x over aperiod of time. Its waveform is shifted by 90° from the positionof the displacement, i.e. velocity reaches its minimum (v=0)when amplitude is greatest. The velocity attains its maximumwhen the system oscillates through its zero level:
v(t) = x•ω•cos (ωt + φ);The vibration acceleration a is the change in velocity over time.From a mathematical point of view, it is the second derivativeof displacement with respect to time. The acceleration wave-form is shifted by 90° from the corresponding velocity wave(and therefore by 180° from the displacement curve). Thismeans that acceleration reaches its maximum when displace-ment is at its minimum; both pass the zero point at the sametime.
a(t) = -x•ω2•sin (ωt + φ);The displacement amplitude alone may be considered as fol-lows:Vibration displacement x in mmVibration velocity v = x•ω in mm/sVibration acceleration a = x•ω2 in mm/s2
At mid-range frequencies, vibration is normally measured interms of velocity; high frequencies call for acceleration mea-
Fig. 2 Mass on spring pendulum

6 ©PRÜFTECHNIK AG Vibration Handbook
Introduction to vibration measurement
surement. These deliver the best possible dynamic perfor-mance.
1.1.1 Composite vibrationsWhen several periodic vibrations occur simultaneously, a com-
posite vibration results which is also periodic. This type of com-plex vibration is quite normal for practically all machinery.
When vibrations overlap, the time domain depiction (with am-
X
T
t
t
t
X
X
f 2
f + 2 f
fS1
S2
S1+ S2
Fig. 3 Superimposed sine waves

©PRÜFTECHNIK AG Vibration Handbook 7
Introduction to vibration measurement
plitude plotted along the time axis) cannot show individualwave components of the composite signal.
1.1.2 Vibration parameters
Fig. 4 Parameters of a sine wave
Amplitude, frequency and phase angle determine the exactshape of a sine wave.
The vibration frequency is important information for machinediagnosis, because certain causes of vibration - for example,rotor imbalance - occur at fixed multiples of the speed (fre-quency) at which massive components rotate.The phase angle φ describes the starting position of the oscillat-ing point at time t = 0. This phase angle and the phase differ-ence between two measurement locations is extremely impor-tant for balancing and vibration diagnosis.
T
t
x
t = 0
x ^
φφφφφ
x(t) = x • cos (ωωωωωt + φφφφφ);
f = 1/T
x̂
^

8 ©PRÜFTECHNIK AG Vibration Handbook
Introduction to vibration measurement
Fig. 5 Parameters of vibration strength measurement
Standard vibration parametersStandard vibration parametersStandard vibration parametersStandard vibration parametersStandard vibration parameters
Peak-to-peak valuePeak-to-peak valuePeak-to-peak valuePeak-to-peak valuePeak-to-peak value:::::Difference between the largest and smallest vibration value,abbreviated as xpp
Peak valuePeak valuePeak valuePeak valuePeak value:::::Maximum vibration (also known as amplitude), abbreviated asxm.
Median value:Median value:Median value:Median value:Median value:Quantifies the vibration strength over time:
Definition: xMed = x dt;
For a sine wave: xMed = xm
Effective value:Effective value:Effective value:Effective value:Effective value:Quantifies the energy of vibration over time (also known as:RMS = root-mean-square).
Definition: xeff = x2 dt
For a sine wave: xeff = xm
t
S
t = 0
x
xeff
xm
xm
xMed xpp
t = 0
t
The peak-to-peak value of a vibration is preferable when themaximum displacement is of interest, e.g. for problems relatedto machine component loading or internal separation distanc-es.The peak value is best for examination of short-lived phenom-ena or transient signals.The effective value (RMS) shows most clearly the energy con-tent of the vibration.
1T
2π
1T
1
2
©PRÜFTECHNIK AG Vibration Handbook 9
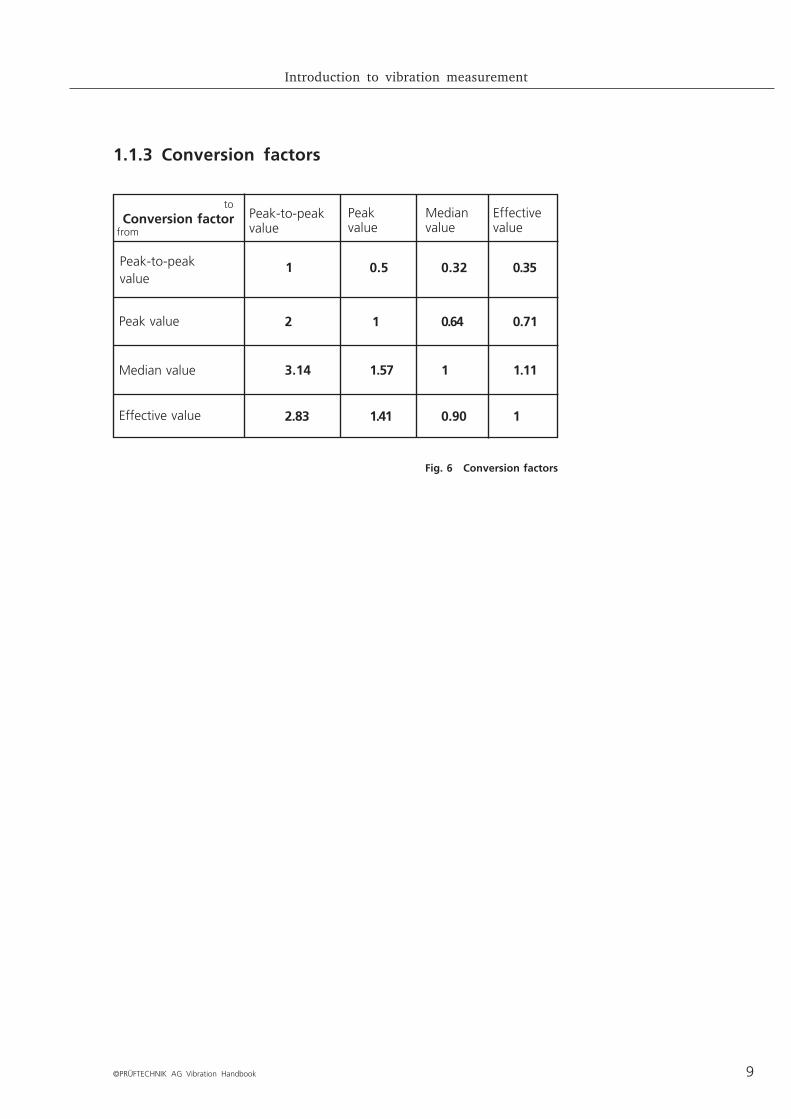
1.1.3 Conversion factors
toConversion factor
Peak-to-peakvalue
Peak value
Median value
Effective value
1
1
0.5
2
0.32 0.35
0.710.64
2.83 1.41 0.90
1
1
3.14 1.57 1.11
from
Fig. 6 Conversion factors
Introduction to vibration measurement
Peak-to-peakvalue
Peakvalue
Medianvalue
Effectivevalue

10 ©PRÜFTECHNIK AG Vibration Handbook
1.2 Periodic vibration in the frequency domainAs mentioned earlier, when the vibration signal is composed ofseveral waves occurring simultaneously, the time signal alonedoes not show much information regarding its individual com-ponents. The frequency diagram obtained from the same timesignal, however, is generally much more useful because itclearly shows the individual vibrations (frequency compo-nents) which make up the complex signal.
1.2.1 Fourier transformationThe French mathematician Jean Baptiste Fourier devised amethod for breaking down any waveform into a series of sinewave components, and conversely.In other words, everyday machine vibrations can be analyzedto determine which frequencies account for what portion ofthe overall measured vibration. Fourier's formulae supply themathematical basis for transforming the time signal into thefrequency spectrum.
Introduction to vibration measurement
Fig. 7 Vibration in time and frequency domains
Time
Amplitude Frequency
©PRÜFTECHNIK AG Vibration Handbook 11
Introduction to vibration measurement
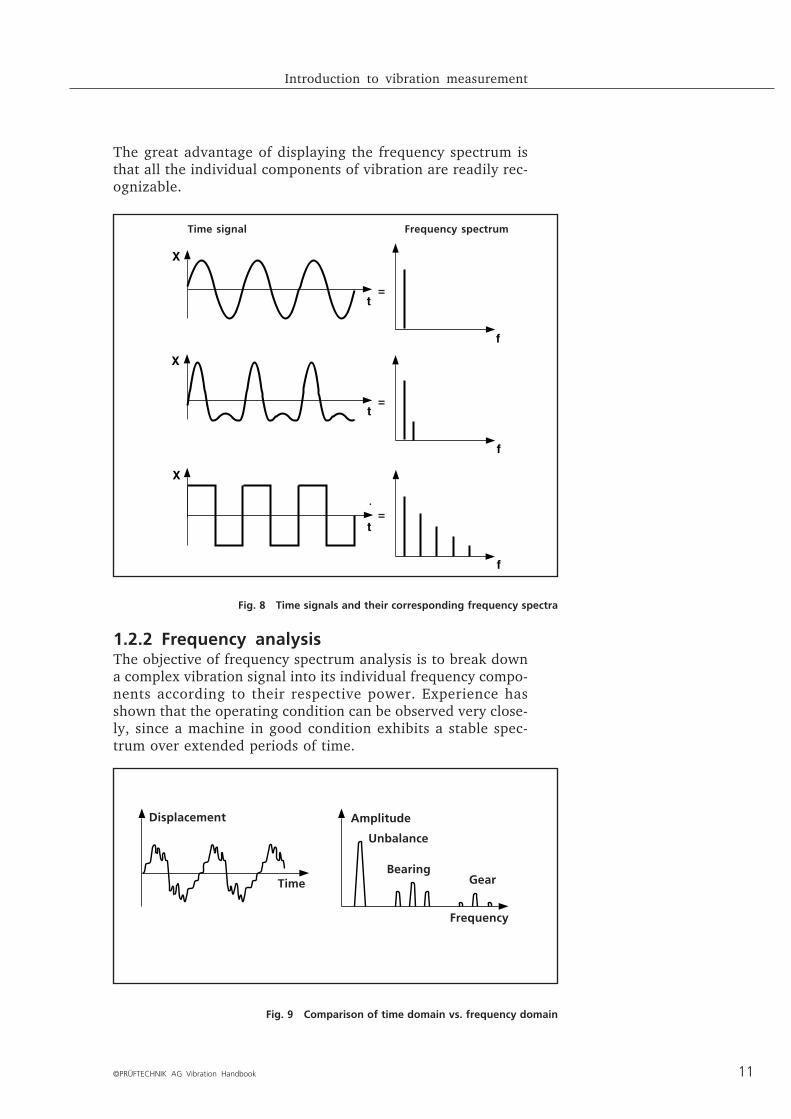
The great advantage of displaying the frequency spectrum isthat all the individual components of vibration are readily rec-ognizable.
Fig. 8 Time signals and their corresponding frequency spectra
X
X
t
t
t
X
f
f
f
1.2.2 Frequency analysisThe objective of frequency spectrum analysis is to break downa complex vibration signal into its individual frequency compo-nents according to their respective power. Experience hasshown that the operating condition can be observed very close-ly, since a machine in good condition exhibits a stable spec-trum over extended periods of time.
Displacement Amplitude
Frequency
Unbalance
BearingGearTime
Fig. 9 Comparison of time domain vs. frequency domain
=
=
=
Time signal Frequency spectrum

12 ©PRÜFTECHNIK AG Vibration Handbook
Reliable machine diagnosis is possible when the individualpeak frequencies in the vibration spectrum can be traced backto their corresponding machine parts.
Introduction to vibration measurement
Fig. 10 Machine vibrations
When measuring vibration, you should also consider that thesignal measured on the outer surface of the machine housingmay not coincide with the original 'inner' signal. The reason forthis lies in the transmission path.Example:If the inner ring of a bearing is damaged, the vibration must betransmitted from the inner ring via the rolling elements. thenthe signal is transferred from the outer ring outward via thebearing race and corresponding load-bearing housing portionto the measurement location. Here is where the vibrationtransducer converts the vibration into a measurable quantity -e.g. voltage. Factors such as mass or rigidity of machine partsand the damping caused by individual parts - and, of course, atcomponent interfaces - can affect the output signal. This meansthat two identical machines mounted on different foundationsunder otherwise identical conditions can emit different vibra-tion signals. These conditions must be considered when evalu-ating measurements.
Unbalance
Transmiss iongears
Anti-friction bearing

©PRÜFTECHNIK AG Vibration Handbook 13
Introduction to vibration measurement
1.3 Rigidity, mass and damping
A turbocompressor, for example, contains a vast number of thecomponents and interfaces just mentioned. Each of these com-ponents can in turn be seen as a separate vibration system untoitself. Detailed information on these components (mass-springsystems) and their vibration behavior is extremely beneficialtoward accurate machine vibration analysis - and nearly cru-cial to explaining and understanding phenomena such as reso-nance. Machines possess three qualities which determine theirvibration behavior - that is, their reaction to excitation forces-Rigidity ("K" in kg/m),Mass ("m" in kg),Damping ("c" in kg•s/m).
Fig. 11 Mass-spring system
Rigidity is a measure of force needed to bend or to stretch astructure by a certain amount (spring constant). Damping is ameasure of the force that works to counteract this.The relationship can be simplified as follows:Excitation force = Rigidity ‘force’ + Mass ‘force’ +
Damping ‘force’
In other words: equilibrium always exists between the excita-tion force and the reaction forces (rigidity, mass and damp-ing).
c
m
K
F

14 ©PRÜFTECHNIK AG Vibration Handbook
Introduction to vibration measurement
If any one of the reaction forces is increased, then the vibrationamplitude changes accordingly. The value of vibration ampli-tude is generally dependent on the total influence of the threereaction forces. In practice, however, these do not combine in alinear fashion.Example: Mass (weight) force is proportional to acceleration.Rigidity, in turn, is proportional to displacement. As a result,these two reaction forces tend to counteract each other, sincetheir phases differ by 180° (just like those of displacement andacceleration.)The third factor, damping, is proportional to vibration velocity,and its phase is 90° away from those of mass and rigidity.The vibration frequency must also be considered relative tothese opposing forces. While the rigidity remains constant overthe entire frequency range, the mass forces increase propor-tionally to the square of the frequency. At a certain frequency,the mass and rigidity forces are in equilibrium and effectivelycancel each other due to their 180° phase difference. The onlyresistant force remaining is that of damping, and as a result,the entire system vibrates at considerably higher amplitude.
Fig. 12 Resonance behavior
Frequency
Displacement
high damping
low damping
This point is known as the resonance frequency. Here the am-plitude can be held low with appropriately high damping.
©PRÜFTECHNIK AG Vibration Handbook 15
Introduction to vibration measurement
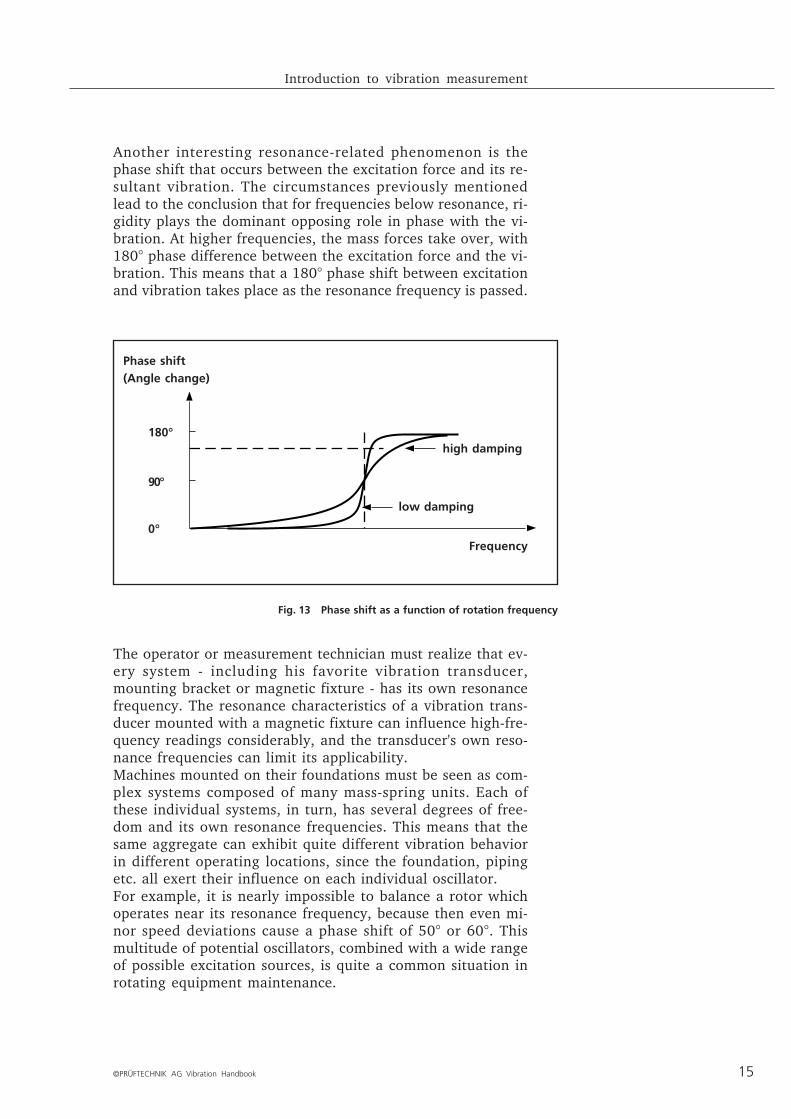
Another interesting resonance-related phenomenon is thephase shift that occurs between the excitation force and its re-sultant vibration. The circumstances previously mentionedlead to the conclusion that for frequencies below resonance, ri-gidity plays the dominant opposing role in phase with the vi-bration. At higher frequencies, the mass forces take over, with180° phase difference between the excitation force and the vi-bration. This means that a 180° phase shift between excitationand vibration takes place as the resonance frequency is passed.
Fig. 13 Phase shift as a function of rotation frequency
0°
Phase shift(Angle change)
90°
180°
0°
180°
90°
Frequency
low damping
high damping
The operator or measurement technician must realize that ev-ery system - including his favorite vibration transducer,mounting bracket or magnetic fixture - has its own resonancefrequency. The resonance characteristics of a vibration trans-ducer mounted with a magnetic fixture can influence high-fre-quency readings considerably, and the transducer's own reso-nance frequencies can limit its applicability.Machines mounted on their foundations must be seen as com-plex systems composed of many mass-spring units. Each ofthese individual systems, in turn, has several degrees of free-dom and its own resonance frequencies. This means that thesame aggregate can exhibit quite different vibration behaviorin different operating locations, since the foundation, pipingetc. all exert their influence on each individual oscillator.For example, it is nearly impossible to balance a rotor whichoperates near its resonance frequency, because then even mi-nor speed deviations cause a phase shift of 50° or 60°. Thismultitude of potential oscillators, combined with a wide rangeof possible excitation sources, is quite a common situation inrotating equipment maintenance.

16 ©PRÜFTECHNIK AG Vibration Handbook
Introduction to vibration measurement
1.4 Summary
Before vibration readings are taken, the rotation frequencyand the frequency range of expected vibration should be ascer-tained. Any variable load characteristics such as pressure, flowrate, temperature etc. (all of which lead to different results)must be considered as well.A general evaluation of the vibration level can be made bycomparing the measured level with accepted standards for thesame machine type. ISO Standard 2372 defines these limits forthe measured RMS velocity veff . This value describes only thetotal vibration severity without regarding the actual cause ofvibration at the individual characteristic frequencies.Frequency analysis is the only method of examining a definedsource of vibration: with detailed knowledge of the machinedesign, the individual frequency components of the measuredspectrum can be traced to their respective sources, the offend-ing machine parts. This procedure is especially suitable forcondition-based monitoring of machines, allowing the mainte-nance specialist to intervene when necessary.Displacement transducers deliver the best results at frequen-cies below approx. 10 Hz due to the limited dynamics of vibra-tion velocity and acceleration within this range.Accelerometers are recommended for comprehensive exami-nation over a wide frequency range, including high-frequencyvibrations above 1000 Hz (e.g. gears).

©PRÜFTECHNIK AG Vibration Handbook 17
Introduction to vibration measurement

Vibration transducers for various measurement problems
©PRÜFTECHNIK AG Vibration Handbook 17
2. Vibration transducersfor various measurement problems
Vibration transducers transform mechanical movements intocorresponding electrical signals. Each type of transducer hasits own advantages and disadvantages depending upon thearea of application. The first step toward successful analysis istherefore selection of the appropriate transducer. This sectionexplains the three most important types of vibration transduc-ers and the application areas in which each delivers the mostaccurate and repeatable measurements possible.
2.1 Piezoelectric transducer(Accelerometer)
Piezoelectric transducers can be used to measure nearly all me-chanical vibrations that occur in maintenance applications, be-cause they provide accurate measurements over a very widefrequency range. Their resonance frequencies lie above theworking measurement range, and their design is especiallyrugged, yet precise. Since they contain no freely-moving parts,these transducers are virtually invulnerable to wear and tear;their long-term stability is excellent. Moreover, they are simpleto mount.Principle of operation:When a piezoelectric crystal is placed under a mechanical load,the crystal deforms and emits a voltage directly proportional tothe degree of loading. This phenomenon is used with Newton'slaw that 'force equals mass times acceleration'; the transducer'soscillating seismic mass is known exactly, so the force can bemeasured in terms of the electrical signal emitted by the piezo-electric crystal.
Fig. 14 Tandem-Piezo® transducer

18 ©PRÜFTECHNIK AG Vibration Handbook
Vibration transducers for various measurement problems
This electrical signal at the transducer output is directly pro-portional to the acceleration (or force effect) over a very widefrequency range.
Fig. 15 Accelerometer frequency characteristic
1 Hz 10 Hz 10 kHz 100
20 dB
10 dB
0 dB
-10 dB
The lower frequency boundary is dependent upon the noisegenerated by the cable and the preamplifier. The upper bound-ary depends upon the resonant frequency of the transducer.The range of frequencies to be measured must lie below thisresonance frequency. As a rule of thumb, the highest measure-ment frequency must not exceed 1/3 the resonance frequency,or else distortion may skew the measurement.Accelerometers typically exhibit low sensitivity and low outputlevels. This is why a preamplifier often must be used to obtaina usable signal. The Tandem-Piezo® probe shown contains abuilt-in 'line-drive' stage just for this purpose. Another advan-tage: no additional amplification is necessary to conduct themeasurement signal without distortion, even over long dis-tances.Accelerometers can easily be used to measure vibration over afrequency range of 10 Hz to 10 kHz, which is sufficient for thevast majority of rotating equipment.

Vibration transducers for various measurement problems
©PRÜFTECHNIK AG Vibration Handbook 19
2.2 Induction transducers(velocity probes)
Induction transducers have a very low resonance frequencyand are used to measure vibration frequencies above that level.Operating principle:There are two main types of velocity probes: with the first, thesensor's permanent magnet is joined via its housing directly tothe object to be measured. The magnet delivers a strong, per-manent magnetic field and vibrates with the measured object.The coil is suspended so that it can oscillate freely in relativemovement about the magnet. The voltage induced in the coil isdirectly proportional to the actual vibration velocity. (With thesecond type of probe, the coil remains mounted stationary onthe machine housing and the magnet oscillates freely about it.)
Permanent magnet
Coil
Spring
Frame
Fig. 16 Induction probe
The usable frequency range of this transducer type is approx.10 Hz to 2000 Hz. The output signal level is very high, i.e. nofurther amplification is necessary. However, velocity transduc-ers are sensitive to magnetic field influences and susceptible towear over time, i.e. the mechanical components (such assprings and suspensions) succumb to fatigue. Transducer sizeand sensitivity to lateral forces and temperature changes canalso become problematic in practical use.

20 ©PRÜFTECHNIK AG Vibration Handbook
Vibration transducers for various measurement problems
2.3 Proximity probes (Displacement probe)
Large turbines, centrifugal pumps or certain compressors areembedded in heavy, massive machine housings and fixed bear-ings (often sleeve bearings). Their housings are often so rigidthat measurable vibration levels are quite low on the surface,but the shaft can still vibrate severely within the bearing. Inthat case, the shaft vibration may be measured using perma-nently-installed induction transducers commonly known asproximity probes.Operating principle:This measurement method takes advantage of the eddy cur-rents that flow in an electrically conductive object due to theelectromagnetic field created when AC current is passedthrough a coil wrapped around the object. The input signalpassed through the core is changed in direct proportion to thedistance (proximity) between the probe tip (coil) and the ob-ject to be measured (the shaft, as shown below). This carriersignal modulation can be measured as an AC signal proportion-al to the peak-to-peak vibration level.
Fig. 17 Proximity probe installation
The usable frequency range extends from 0 Hz to approx. 200to 300 Hz. Probe installation can often be difficult. The cablelength must be matched to the probe by the manufacturer andcannot be varied without recalibration prior to measurement.Proximity probes are used primarily to measure shaft vibrationof turbomachinery.

Vibration transducers for various measurement problems
©PRÜFTECHNIK AG Vibration Handbook 21
2.4 Transducer mountingThe frequency characteristics and dynamic range of vibrationtransducers can be influenced by the type and method ofmounting. Poor connection leads to excessive damping and torestriction of the frequency range. Moreover, transducer cablesshould be taped to the machine for safety reasons.Observe the following points to achieve optimum measure-ment results.
Threaded attachment:Threaded attachment:Threaded attachment:Threaded attachment:Threaded attachment:Threaded attachment affords the sturdiest mounting and thehighest accuracy: this method should be used to mount trans-ducers whenever practicable. Recommended tolerances ac-cording to ISO Standard 1101 are shown below.
Fig. 18 Tolerances for threaded attachment
0,02 A 10 - 32 UNFM3, M4, M5oder M8
0,01A
Absolutes Minimum 4mm
1,60,25
M5, M8 X(M5)min= 6 mm
X(M8)min= 9 mm
Xmin
ProcedureProcedureProcedureProcedureProcedure:- Prepare the mounting surface according to the ISO specifica-tion mentioned above. The mounting surface should be flat(within 1/100 mm / 0.4 mil tolerance) and perfectly clean.- Clean the mounting surface of the transducer.- Drill the pilot hole and tap the appropriate thread (M5 orM8). Be sure to drill the pilot hole deep enough so that theentire transducer stud can be screwed into the hole.- Screw the transducer into place and ensure that it is seatedproperly. A bit of silicone grease on the mounting surfaces ofthe machine and the transducer will help improve the contactbetween them.

22 ©PRÜFTECHNIK AG Vibration Handbook
Vibration transducers for various measurement problems
Fig. 19 Adhesive bonding onto mounting base
Epoxy
Transducer
Mounting base
Pilothole bitM5 or M8
Pilot hole diameterD M5: 4.2 mmD M8: 6.6 mm
End facing tool
Adhesive mounting:Adhesive mounting:Adhesive mounting:Adhesive mounting:Adhesive mounting:Another excellent method for joining the transducer to themeasurement object is adhesive bonding.
ProcedureProcedureProcedureProcedureProcedure:- Prepare the surface of the measurement object according toISO Standard 1101: face the indentation for the mountingbase. The facing tool should have a diameter of at least 20 mm(13/16") so that the 17 mm (11/16") mounting base fits easilyonto the finished surface.- Bond the mounting base to the prepared surface. Make surethat both surfaces are clean and de-greased. A 2-componentepoxy adhesive (such as the Double Bubble brand availableunder order number VIB 8.474) should be used for best results.- Allow the adhesive to set, then screw the transducer firmlyinto place. Be sure not to apply too much torque to the bondingsurface.
Hand-held (contact) probes:Hand-held (contact) probes:Hand-held (contact) probes:Hand-held (contact) probes:Hand-held (contact) probes:If the transducer tip is pressed onto the measurement location,then the rigidity of the contact point and the mass of the trans-ducer create so-called contact resonance, which of course cor-rupts measurement accuracy. This is why hand-held probesshould be avoided for measurement of vibration frequencies inexcess of 1000 Hz. Above this level, directional sensitivity mayadversely affect measurement reproducibility.

Vibration transducers for various measurement problems
©PRÜFTECHNIK AG Vibration Handbook 23
Magnetic mounts:Magnetic mounts:Magnetic mounts:Magnetic mounts:Magnetic mounts:Permanent magnets offer quick and simple mounting. Advan-tage: the measurement location may be easily moved. Disad-vantage: the measurement frequency range is reduced (to ap-prox. 2000 Hz max.), and the method is limited to ferromag-netic objects. The contact surface should be finished and clean.
M5, M8thread
Cleansurface
Finishedsurface
Finishedsurface
R FP TÜ
R
V 8. 5 /IB 51 M5
ECH
VIB
8
.510
PT
B N
o. E
x-81
/212
5
Ser
ial N
o.
R FP TÜ
R
V 8. 5 /IB 51 M2
ECHR FP TÜ
R
V 8. 5 /IB 51 M2
ECH
Fig. 20 Transducer mounting
adhesivequick mount
magneticmount
hand-heldprobe tip
threadedstud
Overview:Overview:Overview:Overview:Overview:After the correct selection of vibration transducer type, themounting method is of crucial importance to obtaining usefulmeasurements. Prüftechnik transducers offer the followingmounting possibilities:
VIB 8.512 withVIB 8.512 withVIB 8.510 withVIB 8.515 with

24 ©PRÜFTECHNIK AG Vibration Handbook
Vibration transducers for various measurement problems
Mounting effectsMounting effectsMounting effectsMounting effectsMounting effectsThe figure below makes clear the rapid decline of resonancefrequency with decreasing mounting rigidity.
Threadedattachment
Magneticmounting
Contactprobe
Measurement locations:Measurement locations:Measurement locations:Measurement locations:Measurement locations:The choice of measurement location depends, of course, on thedirection in which the strongest vibrations are expected to oc-cur based upon experience. As a rule, at least one transducer ismounted radially at each bearing location, with one additionaltransducer per aggregate mounted axially. When anti-frictionbearings are to be monitored for wear, a transducer is mountedas close as possible to the bearing. A single measurement pointusually suffices for electric motors or fans with rotating unbal-ance; large turbines, on the other hand, should certainly bemeasured in all three directions (axially, and radially in verti-cal and horizontal).The rigidity of the bearings (or transmission path from the or-igin of vibration to the measurement location) is critical aswell. The transducer should always be mounted at the mostrigid location possible: housing covers etc. are not suitable formounting.
Transducer mass influence:Transducer mass influence:Transducer mass influence:Transducer mass influence:Transducer mass influence:Through its own mass, the transducer places an additionalload on the object to be measured and alters its vibration be-havior. This effect is negligible as long as the transducer massdoes not exceed 10% of that of the vibrating mass.
Fig. 21 Influence of mounting on resonance behavior
approx. 1500 Hz

Vibration measurement for the evaluation of machine condition
©PRÜFTECHNIK AG Vibration Handbook 25
3. Evaluating machine conditionthrough vibration analysis
All rotating machines exhibit a characteristic vibration behav-ior caused by forces which change over time. In the majorityof cases, unbalance and shaft misalignment account for theseforces, which place the machine under additional load andthus lead to a reduction in operating life.The goal of condition-based maintenance is to detect thesedamaging forces before they make repair necessary. This re-quires an accurate representation of machine condition at alltimes. Here is where condition monitoring plays a central role.However, real-life machine condition cannot be categorizedmerely in terms of ‘good’ and ‘bad’; the gradations betweenthese two extremes are many and varied. The maintenancetechnician should be able to reasonably estimate the probabil-ity of failure, for this is the first step toward planning and car-rying out timely maintenance and repair work. The productionfacility operator must rely on the data provided by the propermeasurements in order to decide when maintenance is neces-sary and when production can continue without risk.The various methods of vibration measurement provide reli-able orientation and important machine condition informa-tion. Vibration severity measurements according to acceptedstandards (such as ISO 2372) and frequency analysis allowachievement of the goals outlined above with a high degree ofaccuracy.
3.1 Vibration severity according to ISO 2372
If no other information is available on the vibration behavior ofa particular machine, then the machine condition may be eval-uated with the help of accepted industry standards and recom-mendations.In 1974, the International Organization for Standardization is-sued its ISO Standard 2372 (‘Mechanical vibration of machineswith operating speeds from 10 to 200 rev/s - Basis for specify-ing evaluation standards’), which specifies maximum accept-able vibration severity according to machine type and size.Experience has shown that when these values are exceeded forlonger periods of time, machine damage (especially bearingdamage) must be expected.Although this ISO standard was one of the very first to appearin industry, it has gained wide recognition and acceptance. Asa result, numerous other organizations have devised similarstandards based upon this specification.

26 ©PRÜFTECHNIK AG Vibration Handbook
Vibration measurement for the evaluation of machine condition
3.1.1 DefinitionISO 2372 defines vibration strength of a machine as the great-est effective value of vibration velocity occurring at functional-ly important locations within a frequency range of 10 Hz to1000 Hz. This effective value is the quadratic mean of vibra-tion velocity.This value is then compared with tolerances established for sixdifferent classes of machines defined as follows:
Class I: Small machines and individual parts of engines andmachines, integrally connected with the completemachine in its normal operating condition. (Electricproduction motors of up to 15 kW are typical examplesof machines in this category.)
Class II: Medium-sized machines, (typically electric motors withoutput of 15 kW to 75 kW) without special founda-tions, rigidly mounted engines or machines (up to300 kW) on special foundations.
Class III: Large prime movers and other large machines withrotating masses mounted on rigid and heavy founda-tions which are relatively stiff in the direction ofvibration measurement.
Class IV: Large prime movers and other large machines withrotating masses mounted on foundations which arerelatively soft in the direction of vibration measure-ment (for example turbo-generator sets, especiallythose with lightweight substructures).
Class V: Machines and mechanical drive systems with unbal-anceable inertia efforts (due to reciprocating parts),mounted on foundations which are relatively stiff inthe direction of vibration measurement.
Class VI: Machines and mechanical drive systems with unbal-anceable inertia effects (due to reciprocating parts),mounted on foundations which are relatively soft in thedirection of vibration measurements; machines withrotating slack-coupled masses such as beater shafts ingrinding mills; machines, like centrifugal machines,with varying unbalances capable of operating as self-contained units without connecting components; vi-brating screens, dynamic fatigue-testing machines andvibration exciters used in processing plants.
Class V and VI describe special machines which are difficult tocategorize. For example, a centrifuge must be able to yield tohigh dynamic forces. This makes it difficult to specify a partic-ular vibration severity tolerance.The tolerance table is therefore limited to the more commonly-encountered equipment of classes I through IV.

Vibration measurement for the evaluation of machine condition
©PRÜFTECHNIK AG Vibration Handbook 27
3.1.2 Classification
Class IVClass IIIClass IIClass I
45
28
18
11
7
4.5
2.8
1.8
1.1
0.7
0.45
0.28
Vib
ration
velocity
v(m
m/s)
rms
unacceptable
good
unsatisfactory
satisfactory
Fig. 22 Vibration severity classification according to ISO 2372
It is entirely possible that in some cases, the categories shownabove may need correction to accommodate practical experi-ence previously gained with a particular machine. For exam-ple, fan blades usually become encrusted with deposits of dustand grease over time. Eventually, these deposits become sothick that the centrifugal force that occurs during operationcauses them to fly off, leading to severe unbalance which takesits toll on the fan shaft, bearings and the entire aggregate. Ifdamage is to be avoided, then the vibration severity tolerancefor this machine should be lowered from 7.1 mm/s to, say, 4.5mm/s.

28 ©PRÜFTECHNIK AG Vibration Handbook
Vibration measurement for the evaluation of machine condition

Vibration measurement for the evaluation of machine condition
©PRÜFTECHNIK AG Vibration Handbook 29
3.2 Frequency analysis
Frequency analysis offers considerably more detailed informa-tion on the condition of an aggregate. In contrast to the evalu-ation of vibration severity provided by ISO 2372, the vibrationsignal is filtered and its individual frequency components areevaluated. The main advantage of spectrum analysis lies in itsability to detect deterioration of specific machine elementslong before failure - even allowing enough advance warning toprocure the necessary spare parts in time. Modern measure-ment instruments apply the FFT (Fast Fourier Transformation)method; some (such as the hand-held VIBROSPECT®) use se-lective filtering to sweep through the frequency spectrum.
3.2.1 FundamentalsWhen a machine operates smoothly, its vibration spectrum re-mains stable. When a part becomes worn or broken, changesappear in the spectrum which can be traced back to periodicevents in gears, bearings etc. (such as unbalance, meshing ofgear teeth or passing of fan or impeller blades). As mentionedin Section 1.2, the individual spectrum peaks can be matchedto their respective vibration sources, permitting an exact diag-nosis of machine disturbances.
Fig. 23 Vibration spectrum peaks matched to their sources
The signature spectrum (baseline spectrum), a measurementtaken when the machine is in good operating condition, is nor-mally dominated by the rotation frequency of the machine.Variations in rotation speed change the spectrum accordingly,making a cursory comparison with the original condition diffi-cult at best.

30 ©PRÜFTECHNIK AG Vibration Handbook
Vibration measurement for the evaluation of machine condition
3.2.2 TerminologyA number of specialized terms are used to describe phenomenarelated to FFT analysis. The operator should become familiarwith the terms explained below in order to better understanddigital FFT analyzers and their use.
Aliasing (anti-aliasing filter):Aliasing (anti-aliasing filter):Aliasing (anti-aliasing filter):Aliasing (anti-aliasing filter):Aliasing (anti-aliasing filter):Alias effects occur when the signal sampling rate is too low.
Fig. 24 Alias effect
This low sampling rate does not give sufficient resolution ofthe frequency spectrum for accurate interpretation. The cor-rect solution is to raise the sampling frequency to at least twicethe highest frequency present in the signal to be measured. Inpractice, however, since it is often difficult to tell whether themeasurement signal at hand contains high frequencies, a low-pass (anti-aliasing) filter is used to suppress signal compo-nents above this sampling frequency.
'Alias' vibration
actual vibration
t
x (t)
Measurement sampling points
Vibration measurement for the evaluation of machine condition
©PRÜFTECHNIK AG Vibration Handbook 31
VV
25
2
30
ff1
25 30
2ff1
f f
Resolution:Resolution:Resolution:Resolution:Resolution:The maximum number of lines into which an FFT analyzer candivide a spectrum is known as resolution. The frequency sepa-ration between the lines is then calculated from the frequencyrange and the resolution.Example:
Resolution: 400 linesFrequency range: 1000-10.000 HzSeparation betweenfrequency lines: 22.5 Hz
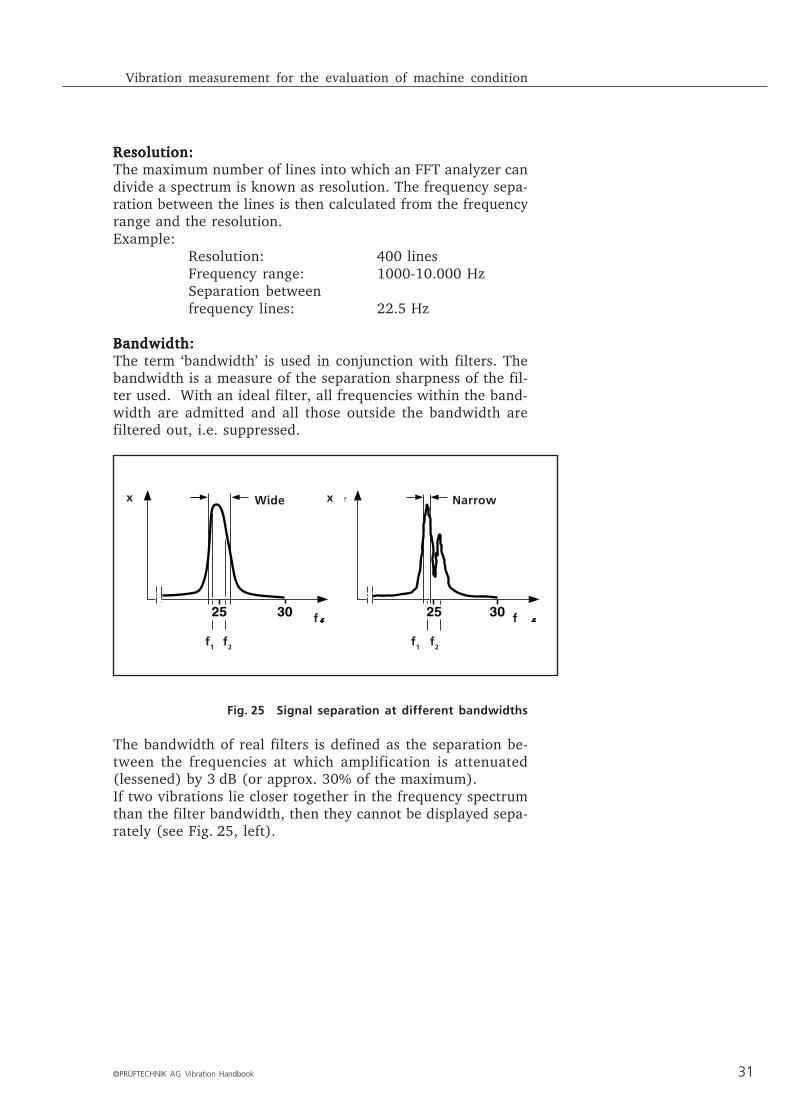
Bandwidth:Bandwidth:Bandwidth:Bandwidth:Bandwidth:The term ‘bandwidth’ is used in conjunction with filters. Thebandwidth is a measure of the separation sharpness of the fil-ter used. With an ideal filter, all frequencies within the band-width are admitted and all those outside the bandwidth arefiltered out, i.e. suppressed.
x x
ff
Fig. 25 Signal separation at different bandwidths
The bandwidth of real filters is defined as the separation be-tween the frequencies at which amplification is attenuated(lessened) by 3 dB (or approx. 30% of the maximum).If two vibrations lie closer together in the frequency spectrumthan the filter bandwidth, then they cannot be displayed sepa-rately (see Fig. 25, left).
f1 f2 f2f1
Wide Narrow

32 ©PRÜFTECHNIK AG Vibration Handbook
Vibration measurement for the evaluation of machine condition
Dynamic range:Dynamic range:Dynamic range:Dynamic range:Dynamic range:(see also ‘logarithm’)This value describes the ability of an FFT analyzer to displaystrong and weak signals simultaneously. A large dynamicrange is especially important when weak vibration componentsoccur along with stronger ones such as unbalance. In that case,logarithmic scaling of the display allows clear recognition ofthe weak signals.
Fig. 26 Dynamic range: linear vs. logarithmic
The dynamic range is defined as the ratio between the greatestand smallest signal amplitudes which can still be displayed atthe same time. The 12-bit A/D converters used in modern FFTanalyzers give them a dynamic range of 70 dB.
logarithmic
linear
Vibration measurement for the evaluation of machine condition
©PRÜFTECHNIK AG Vibration Handbook 33
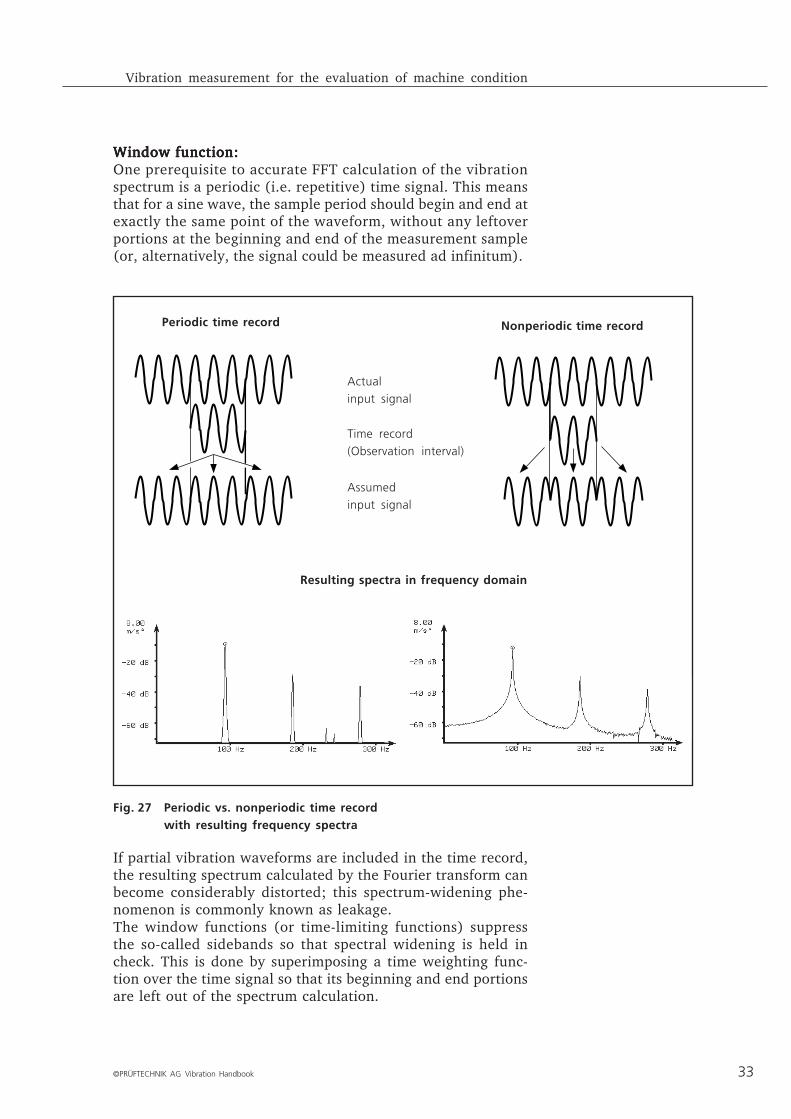
Window function:Window function:Window function:Window function:Window function:One prerequisite to accurate FFT calculation of the vibrationspectrum is a periodic (i.e. repetitive) time signal. This meansthat for a sine wave, the sample period should begin and end atexactly the same point of the waveform, without any leftoverportions at the beginning and end of the measurement sample(or, alternatively, the signal could be measured ad infinitum).
Fig. 27 Periodic vs. nonperiodic time recordwith resulting frequency spectra
If partial vibration waveforms are included in the time record,the resulting spectrum calculated by the Fourier transform canbecome considerably distorted; this spectrum-widening phe-nomenon is commonly known as leakage.The window functions (or time-limiting functions) suppressthe so-called sidebands so that spectral widening is held incheck. This is done by superimposing a time weighting func-tion over the time signal so that its beginning and end portionsare left out of the spectrum calculation.
Actual
input signal
Time record
(Observation interval)
Assumed
input signal
Resulting spectra in frequency domain
Periodic time record Nonperiodic time record

34 ©PRÜFTECHNIK AG Vibration Handbook
Vibration measurement for the evaluation of machine condition
Types of windows:Types of windows:Types of windows:Types of windows:Types of windows:
Rectangular window:Rectangular window:Rectangular window:Rectangular window:Rectangular window: The rectangular window is in principlenot a window at all: it admits all portions of the time signalwith the same weighting. This makes it ideal for measuringsignals whose beginning and ending value is zero (such asshock signals, pulses and noise signals). This window gives thehighest amplitude accuracy (provided the beginning and endof the signal are not cut off).
Hanning window:Hanning window:Hanning window:Hanning window:Hanning window: This window gives the highest frequency res-olution at the expense of amplitude accuracy, which may bereduced by as much as 15%. The Hanning window is one ofthe standard window functions.
Flat top window:Flat top window:Flat top window:Flat top window:Flat top window: The flat top window gives a less accuratefrequency depiction than that of the Hanning window, but itsamplitude accuracy is much higher (only 1% error). This makesthe flat top window the most suitable for measuring continuousvibration signals when amplitude must be closely examined.
SpectrumWindow function
Rectangular
- -
Hanning
Flat top
10%
Damping of
secondary peaks
Fig. 28 Window functions
58% 18.4 dB
0.3 dB
Damping of
highest peak
Vibration measurement for the evaluation of machine condition
©PRÜFTECHNIK AG Vibration Handbook 35
Frequency resolution capability:Frequency resolution capability:Frequency resolution capability:Frequency resolution capability:Frequency resolution capability:The resolution capability in the frequency domain is deter-mined primarily by the number of intervals (i.e. the number offilters) and the section enlargement (zoom) capability.
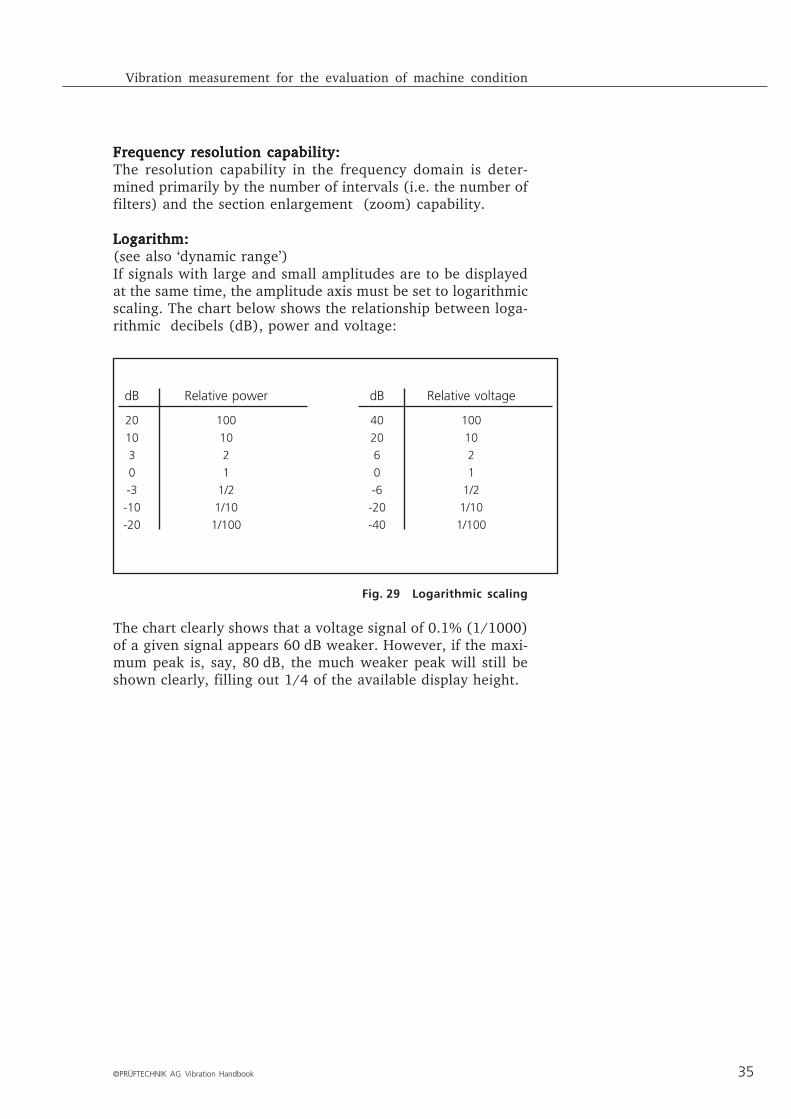
Logarithm:Logarithm:Logarithm:Logarithm:Logarithm:(see also ‘dynamic range’)If signals with large and small amplitudes are to be displayedat the same time, the amplitude axis must be set to logarithmicscaling. The chart below shows the relationship between loga-rithmic decibels (dB), power and voltage:
dB Relative power dB Relative voltage
20 100 40 100
10 10 20 10
3 2 6 2
0 1 0 1
-3 1/2 -6 1/2
-10 1/10 -20 1/10
-20 1/100 -40 1/100
Fig. 29 Logarithmic scaling
The chart clearly shows that a voltage signal of 0.1% (1/1000)of a given signal appears 60 dB weaker. However, if the maxi-mum peak is, say, 80 dB, the much weaker peak will still beshown clearly, filling out 1/4 of the available display height.

36 ©PRÜFTECHNIK AG Vibration Handbook
Vibration measurement for the evaluation of machine condition
Averaging:Averaging:Averaging:Averaging:Averaging:Real mechanical vibration signals are often accompanied bylarge amounts of noise, e.g. from adjacent equipment. Thequality of these measurements can be improved by using aver-aging functions; in particular, time averaging reduces the ef-fects of background noise considerably when a trigger is usedto measure in the time domain. Another alternative known asthe peak-hold mode can be used to retain in the display thehighest levels in either time or frequency domain over a speci-fied number of measurements.
Trigger:Trigger:Trigger:Trigger:Trigger:A timing mechanism for starting the measurement. Three dif-ferent alternatives are generally available: no trigger, internaltrigger (based upon the input signal level) and external trig-ger. The last two may also be set to begin measurement as themeasurement signal rises above the desired level or as it fallsbelow it.
Waterfall diagram:Waterfall diagram:Waterfall diagram:Waterfall diagram:Waterfall diagram:When machine phenomena related to operating speed are tobe examined, it may be helpful to take several measurementsat different speeds and then to observe all the spectra in thesame display. This type of display is also useful for studyingresonance behavior since the resonance frequency peak re-mains unchanged even when the machine speed varies.
Resonance
Fig. 30 VIBROSPECT FFT waterfall diagram
Zoom functionZoom functionZoom functionZoom functionZoom functionImprovement of frequency resolution either by raising thesampling rate or reducing the measurement bandwidth.

Vibration measurement for the evaluation of machine condition
©PRÜFTECHNIK AG Vibration Handbook 37
3.2.3 Standard vibration spectra
The following signal waveforms appear quite often in practice:
Sine wave:Sine wave:Sine wave:Sine wave:Sine wave:The spectrum of a classic sine wave consists of one single line.
Square waveSquare waveSquare waveSquare waveSquare wave:::::This vibration form can occur, for example, when a bearingcover becomes loose. The vibration consists of an infinitenumber of harmonics (multiples of the rotation frequency).
Fig. 32 Square wave
Time
Frequency1 3 5 7
TT T TT
Amplitude
Fig. 31 Sine wave
Amplitude
Time
f=1/T FrequencyT

38 ©PRÜFTECHNIK AG Vibration Handbook
Vibration measurement for the evaluation of machine condition
Pulse train:Pulse train:Pulse train:Pulse train:Pulse train:This vibration form occurs, for example, when bearings orgears are damaged.
Fig. 33 Pulse train
Amplitude-modulated sine waveAmplitude-modulated sine waveAmplitude-modulated sine waveAmplitude-modulated sine waveAmplitude-modulated sine waveIf machine vibrations (for example, from unbalance) are mod-ulated, the corresponding vibration spectrum peak is sur-rounded by sidebands spaced evenly about the carrier frequen-cy.
Fig. 34 Amplitude-modulated sine wave
FrequencyTime
Amplitude
ΔΔΔΔΔT 1/ΔΔΔΔΔT
Time
Amplitude
Frequency

Vibration measurement for the evaluation of machine condition
©PRÜFTECHNIK AG Vibration Handbook 39
Vibration decayVibration decayVibration decayVibration decayVibration decay:::::Vibrations which decay gradually over time exhibit continuousspectra, because their individual spectrum lines lie very closeto one another.
Fig. 35 Vibration decay
Amplitude
Time
Frequency
3.2.4 Notes for successful frequency analysisThe following points should be observed when using a fre-quency analyzer to obtain good results:- For machines with anti-friction bearings, set the lower end of
the measurement frequency range to the rotation frequency(or to one-half that amount for machines with sleeve bear-ings). The upper limit should be the third harmonic of max-imum tooth meshing/blade passing/anti-friction bearingfrequency.
- When setting the measurement bandwidth, pay attention tothe space between component rotation frequencies or side-bands from tooth meshing frequencies, to sufficient separa-tion of signal components and interference at the power sup-ply frequency.
- Use averaged signals: 5 to 10 measurements for RPM-relatedstudies and many more for anti-friction bearings.
- The trigger should be deactivated when turbo machines orelectric motors are measured. Transient signals (shocks,pulses, decay) should be measured using internal triggering.
- Make sure the correct window function is activated.
40 ©PRÜFTECHNIK AG Vibration Handbook
Vibration measurement for the evaluation of machine condition
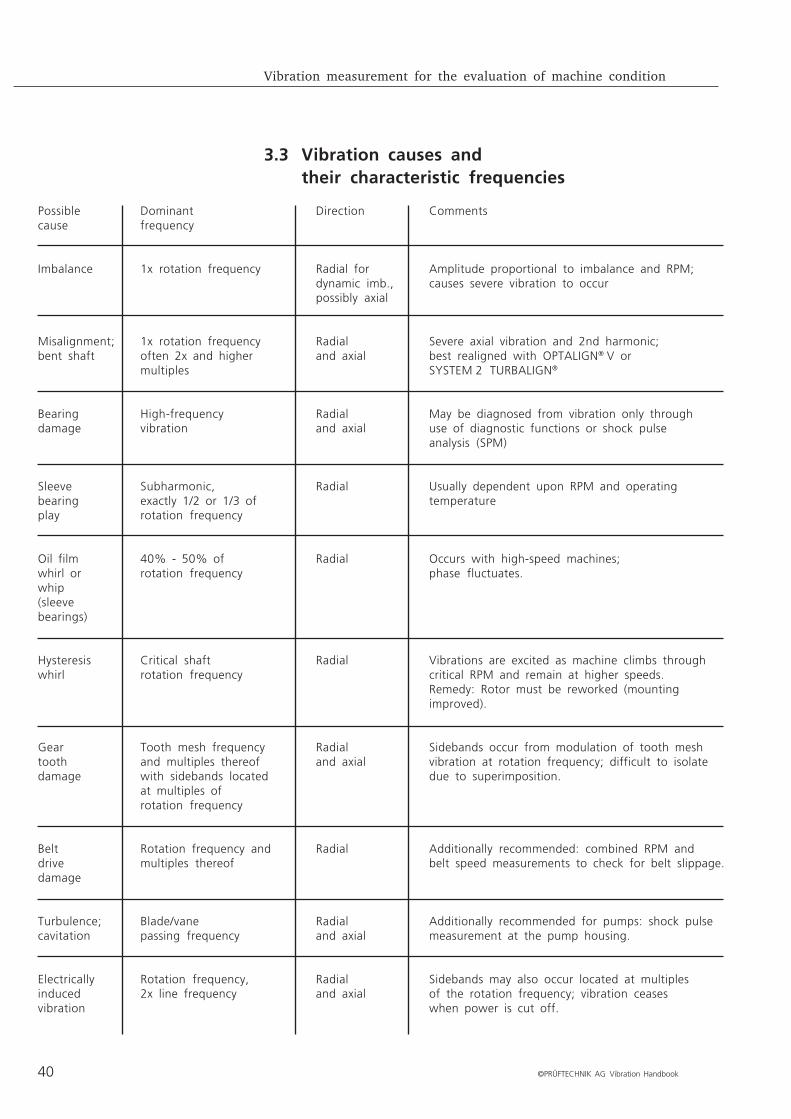
3.3 Vibration causes andtheir characteristic frequencies
Possiblecause
Imbalance
Misalignment;bent shaft
Bearingdamage
Sleevebearingplay
Oil filmwhirl orwhip(sleevebearings)
Hysteresiswhirl
Geartoothdamage
Beltdrivedamage
Turbulence;cavitation
Electricallyinducedvibration
Dominantfrequency
1x rotation frequency
1x rotation frequencyoften 2x and highermultiples
High-frequencyvibration
Subharmonic,exactly 1/2 or 1/3 ofrotation frequency
40% - 50% ofrotation frequency
Critical shaftrotation frequency
Tooth mesh frequencyand multiples thereofwith sidebands locatedat multiples ofrotation frequency
Rotation frequency andmultiples thereof
Blade/vanepassing frequency
Rotation frequency,2x line frequency
Comments
Amplitude proportional to imbalance and RPM;causes severe vibration to occur
Severe axial vibration and 2nd harmonic;best realigned with OPTALIGN® V orSYSTEM 2 TURBALIGN®
May be diagnosed from vibration only throughuse of diagnostic functions or shock pulseanalysis (SPM)
Usually dependent upon RPM and operatingtemperature
Occurs with high-speed machines;phase fluctuates.
Vibrations are excited as machine climbs throughcritical RPM and remain at higher speeds.Remedy: Rotor must be reworked (mountingimproved).
Sidebands occur from modulation of tooth meshvibration at rotation frequency; difficult to isolatedue to superimposition.
Additionally recommended: combined RPM andbelt speed measurements to check for belt slippage.
Additionally recommended for pumps: shock pulsemeasurement at the pump housing.
Sidebands may also occur located at multiplesof the rotation frequency; vibration ceaseswhen power is cut off.
Direction
Radial fordynamic imb.,possibly axial
Radialand axial
Radialand axial
Radial
Radial
Radial
Radialand axial
Radial
Radialand axial
Radialand axial

Vibration measurement for machine condition evaluation
©PRÜFTECHNIK AG Vibration Handbook 41
3.4 Case histories of machine damage
In order to ascertain the exact cause of vibration spectrumpeaks, the configuration of the machine to be examined mustbe known in detail: RPM, bearing type and geometry, couplingdesign, load angle, number of rolling elements, pitch diame-ter, tooth mesh frequency, resonance frequency, number ofteeth or blades etc. must be known exactly. These data allowcalculation of the individual frequencies which are characteris-tic of the corresponding individual machine elements. Thesefrequencies and their multiples are then compiled into a list ofpotential 'trouble' frequencies. Consider for example a com-pressor coupled to a reduction gear: important machine di-mensions include the RPM of the drive shaft (which deter-mines the main component of vibration), the coupling typeand the tooth mesh frequency of the gear.Additional control measurements are often necessary due tothe vast number of possible influences which can occur simul-taneously. This also limits the discussion of case histories tospecific examples, which should not be construed to be gener-ally valid: the same machine can exhibit completely differentvibration spectra depending upon its foundation. Evaluation isgreatly facilitated when orderly records of previous measure-ments and maintenance work are available. Reliable conditiondiagnosis is impossible without a complete machine history(trend record).
3.4.1 Radial compressor coupling damageTechnical data1) AEG motor
Power: 1550 kWDrive shaft RPM: 24.7 Hz (1484 RPM)
2) Flender SEG 280 gearboxTooth mesh frequency: 2338 Hz(sidebands possible from both couplings)
3) Schiele radial compressorCompressor shaft RPM: 86.4 Hz (5184 RPM)
4) Flender Ruppex claw coupling5) Flender Zappex gear coupling
4
1
Fig. 36 Radial compressor aggregate
5
23

42 ©PRÜFTECHNIK AG Vibration Handbook
Vibration measurement for machine condition evaluation
Fig. 37 Turbocompressor vibration spectrum
Measurement location: gear shaft (compressor side), nearbearingDiscussion:Over the course of several machine measurements, the vibra-tion peak at 2326 Hz (the gear tooth mesh frequency) climbedmarkedly, At the same time, sidebands appeared 86.6 Hz oneither side; their amplitudes remained nearly constant. Thefrequency peak at the tooth mesh frequency combined withsidebands can point toward two possible causes:1) Early gear damageHowever, this tooth mesh frequency could not be measured onthe low-speed gear shaft, so the probability of gear damage islow.2) Gear coupling damageThe sidebands occurring at intervals of 86.6 Hz indicate modu-lation of the tooth mesh frequency, or carrier frequency, by theshaft (and coupling) rotation frequency. This is clearly due tothe gear coupling. Disassembly of the coupling showed thatgross axial misalignment had prevented correct centering ofthe coupling shell, so that the teeth could not mesh properly.The resulting increase in local stress concentration led to geartooth damage.

Vibration measurement for machine condition evaluation
©PRÜFTECHNIK AG Vibration Handbook 43
3.4.2 Chiller misalignmentTechnical data:1) Motor drive power 900 kW2) Linde compressor
Compressor screw divided into 4 portionsRotation frequency 50 Hz (2950 RPM)
Fig. 38 Chiller aggregate
2
Measurement location: Motor (1), axial and radial, near bear-ing.Despite installation and alignment by specialists, the machinehad always exhibited high vibration - even though the pre-scribed alignment targets had been fulfilled. At four times the
1
Vertical1st measurement
Horizontal1st measurement
Fig. 39 Chiller vibration spectrum

44 ©PRÜFTECHNIK AG Vibration Handbook
Vibration measurement for machine condition evaluation
Fig. 40 Control measurement, vibration spectra
1st axial measurement
2nd axial measurement
The first axial measurement shows extremely high vibration ofup to 10 mm/s.
rotation frequency, vibration in vertical direction was nearly7 mm/s.Discussion:The cause of high axial vibration is not immediately clear,since the motor has no axial bearings. The measured frequencyis equal to the compressor emission frequency, since the com-pressor screw is divided into 4 portions. Comparative measure-ment on the compressor itself, however, showed only lowervibration levels than those of the motor bearing.Following a check of manufacturer-specified thermal growthvalues with the PERMALIGN® laser-optic coordinate measure-ment system, it could be shown that the motor should be repo-sitioned to stand 1 mm higher and 0.2 mm to one side. Sincethe vertical value seemed surprisingly high, it was decided toset vertical offset to a conservative value of 0.7 mm. Vibrationresults were checked with a follow-up measurement:The improvement in amplitude at 4 times the rotation frequen-cy is clearly visible (2nd measurement). This confirms that thedirection of adjustment was correct; the full amount of 1 mmindicated by PERMALIGN® is to be implemented at the earliestavailable opportunity.
3.4.3 SummaryFrequency analysis is a very exact ‘tool’ for achieving the goalsof condition-based machine maintenance. When sufficient de-tails of the machine design are known, the spectrum allows anexact diagnosis of the vibration source.

©PRÜFTECHNIK AG Vibration Handbook 45
4. Index
A
Acceleration 14, 18Accelerometer 16, 17Aliasing 30Amplitude 7Amplitude-modulated sine wave 38Anti-aliasing filter 30Averaging 36Axial vibration 44
B
Background noise 36Bandwidth 31Baseline spectrum 29Bearing 29
geometry 41Blade passing frequency 29Bonding 22
C
Carrier frequency 38, 42Characteristics 7Classification 27Comparative measurement 25Compressor screw 44Contact probe 22, 23Continuous spectrum 39Conversion factors 9Coupling 41
D
Damping 13, 14, 21Decay response 39Degrees of freedom 15Diagnosis 29Displacement probes 16, 20Displacement 4, 14Dynamic range 32
E
Eddy current probe 20Effective value 8, 26
F
Fast Fourier Transformation 29Fault diagnosis 12FFT analyzer 30, 32FFT method 29Filter 30, 31, 35
Flat top window 34Foundation 3, 26Fourier transformation 10, 29, 33Frequency 7, 14
analysis 11, 29characteristic 52components 10lists 41peak 41range 16, 19, 20, 21, 31resolution 35separation 31spectrum 11
G
Gears 29, 42
H
Hand-held probe 22Hanning window 34Harmonics 37
I
ISO 2372 25
L
Leakage 33Line drive 18, 51Load angle 41Logarithmic scaling 32, 35Logarithm 35Lowpass filter 30
M
Magnet 23Mass 13Measurement location 24Modulation 42Mounting 21
O
Output signal 18
P
Peak hold 36Peak value 8, 36Peak-to-peak value 8Peak-to-peak vibration 20Periodic vibration 4PERMALIGN® 44
Index
46 ©PRÜFTECHNIK AG Vibration Handbook
Index
U
Unbalance 32, 38masses 29
V
Velocity probe 19Vibration
acceleration 5amplitude 14components 10, 11, 32displacement 4level 16peak 42period 4severity 26source 29spectrum 29transducer 51velocity 5, 14, 16
W
Waterfall diagram 36
Z
Zoom 36
Phase 7Phase shift 14, 15Pitch diameter 41Preamplification 18Proximity probe 20Pulse train 38Quick mount 23
R
Rectangular window 34Resonance 13, 18, 36Resonance frequency 14, 15, 41Rigidity 13, 14, 20Rotation frequency 7, 16, 37Rotor 15RPM 29, 41
S
Sample frequency 30Sensitivity 18Separation 31Sidebands 38, 42Sine
function 4signal 10, 33wave 8, 37
Spectra 37Spectral
function 10lines 39widening 33
Square wave 37Superimposed vibrations 6
T
Tandem-Piezo®
accelerometer 18Temperature sensitivity 19Threaded attachment 23Threaded connection 21Time
averaging 36domain 6limiting function 33record 33
Tooth mesh frequency 41, 42Transducer mass 24Trigger 36

©PRÜFTECHNIK AG Vibration Handbook 47
5. Bibliography
ISO 2373: Mechanical vibration of machines with operatingspeeds from 10 to 200 rev/s - Basis for specifying evaluationstandards. International Organization for Standardization,1974
VDI 2056: Beurteilungsmaßstäbe für mechanische Schwingun-gen von Maschinen. Beuth-Vertrieb GmbH, Berlin 30
DIN 45 665: Messung und Beurteilung der Schwingstärke vonelektrischen Maschinen. Beuth-Vertrieb GmbH, Berlin 30
A. G. Godse: Implement machinery predictive maintenance.Hydrocarbon Processing, September 1991
Hewlett Packard: Wartung von Maschinenanlagen unter An-wendung der Schwingungsanalyse. Seminar handbook 1989
Hewlett Packard: Grundlagen der dynamischen Signalanalyse.Application Note 243, 1989
Nikat Associates: Machinery Vibration Course. Seminar hand-book 1989
K. H. Hansen: Erläuterungen zur Frequenzanalyse. Seminarhandbook 1989
J. Kolerus: Zustandsüberwachung von Maschinen. Kontakt &Studium, Band 187, Expert Verlag, 1986
M. Eisenberger: Die zustandsorientierte Instandhaltung,Schwingungsüberwachung, Maschinendiagnose. Seminar in-structions, October 1991
Th. Knuth: Schadenfrüherkennung durch Schwingungsanaly-sen. Seminar TA Esslingen, "Aufstellen und Ausrichten von Ma-schinen", 1992
Bibliography

48 ©PRÜFTECHNIK AG Vibration Handbook
Productive maintenance technology
Printed in Germany 80.9433.06.08.enVIBROTIP®, VIBSCANNER®, VIBXPERT®, VIBCODE®, VIBREX®, VIBROWEB®,VIBNODE®, VIBRONET® and OMNITREND® are registered trademarks ofPRÜFTECHNIK Dieter Busch AG. The information contained in this leafletis subject to alteration without further notice due to the PRÜFTECHNIKpolicy of continuous product development. PRÜFTECHNIK products arethe subject of patents granted or pending throughout the world.© Copyright 1992 by PRÜFTECHNIK AG.
PRÜFTECHNIK
Condition Monitoring
Oskar-Messter-Str. 19-21
85737 Ismaning, Germany
Tel: +49 89 99616-0
Fax: +49 89 99616-300
eMail: [email protected]
www.pruftechnik.com
A member of the PRUFTECHNIK group