via alpha decay of
TRANSCRIPT

390 H. W. PEELLE AND F. C. MAIENSCHEIN
on the I'hysics and Chemistry of Fission, Salzburg,Austria, 2965 (International Atomic Energy Agency,Vienna, Austria, 1965), p. 385.
56W. John, F. .W. Guy, and J. J. Wesolowski, Univer-sity of California Lawrence Radiation Laboratory ReportNo. UCRL-72501, also Phys. Rev. C ~2 1451 (1970).
~ L. E. Glendenin and H. C. Griffin, Phys. Letters ~15
153 (1965).5 R. S. Hager and E. C. Seltzer, Nucl. Data A4, 1 (1968).5~C. D. Coryell, Ann. Rev. Nucl. Sci. ~2 304 (1953).6 J. Terrell, Phys. Rev. 108, 783 (1957). The photon
energy release derivable from the method of this paperis given explicitly. in Bef. 21.
6 A. W. Cameron, Can. J. Phys. ~35 1021 (1957).62P. A. Seeger, Nucl. Phys. 25, 1 {1961).I. Dostrovsky, Z. Fraenkel, and G. Friedlander, Phys.
Bev. 116, 683 (1959).64J. R. Grover and T. D. Thomas, in American Chemi-
cal Society Symposium on Recent Advances in NuclearScience and Engineering Education, March 1966, Pitts-burgh, Pennsylvania (unpublished); also J. R. Grover,private communication. This work gave additional re-sults from the effort reported in Ref. 23.
6 For example, Seeger (Ref. 62) reported that hismass formula gives a 0.75-MeV standard deviation withthe input odd-A masses, and his paper shows a system-atic -1-MeV error near mass 100. Initial fission frag-ments are away from the valley of P-ray stability, solacking a published assessment of extrapolation un-certainties, one might expect systematic errors &1 MeV/fragment in estimated initial excitation energy.
PHYSICAL R E VIEW C VOLUME 3, NUMBER 1 1971
Energy Levels in Cf ' via Alpha Decay of Fm255~
I. Ahmad, F. T. Porter, M. S. Freedman, R. F. Barnes, R. K. Sjoblom, F. Wagner, Jr., J. Milsted,and P. R. Fields
Chemistry Division, Argonne National Laboratory, Argonne, Illinois 60439(Received 18 August 1970)
The y-singles and conversion-electron spectra of Fm were measured with a Ge(Li) diodeand the Argonne double toroidal P-ray spectrometer, respectively. In the y-ray spectra, in
addition to the transitions expected from previously known decay schemes, p rays of energies63.8, 131.0, 204.1, and 264.1 keV were observed. Two new n groups, @368 {6;765 MeV) and~ 433 (6.701 MeV), were identified in coincidence with 131.0- and 204.1-keV y rays. A two-parameter y-y coincidence experiment showed that the 204.1- and 131.0-keV transitions popu-late the T and 2 members of the favored band. Conversion-electron studies and o.'-vs-y in-tensity comparisons demonstrate their &1 character. The half-life of the 370.4-keV level wasmeasured by a delayed at.'-p coincidence method and found to be 1:3+0.1 @sec. On the basis ofthese observations and the n intensities to these levels, the 370.4- and 434.2-keV levels havebeen assigned to the
2 (725)) and &-(734&) Nilsson states, respectively. A three-parameter
0.'~-time coincidence experiment indicates that the & intensity to the 105.73-keV (I= 2, K =z)level is less than 1%, implying that its 18% population comes primarily via a 0.57-keV trans-ition from the 106.30-keV, I= &, g =
27 level. The + transition probabilities to various bandsare in agreement with the values expected from o.'-decay systematics and theoretical calcu-lations. The K-, L-, M-, and N-sunshell atomic electron binding energies in Cf (Z=98),obtained experimentally by least-squares adjustment from the conversion-line data, show
significant deviations below recent (Bearden and Burr) tabulated values.
I. INTRODUCTION
The decay scheme of Fm"'was first investigatedby Asaro, Bjf(rnholm, and Perlman (ABP).' The
ground state and the level at 106 keV in Cf2" weregiven the ¹ilsson-state' assignments of 2+(6200)and &+(6130), respectively. These assignmentsare based on the observed rotational level spac-ings, intensity patterns, and the multipolarities ofprominent interband transitions. y-n and electron-s. coincidence measurements showed the existenceof another level at 546 keV (n intensity=0. 05'%%uo)
which decays via a 426-keV level to the 106-keV
state. The 426- and 546-keV levels were given thetentative assignments of @o(615$) and '-'-(725y),respectively. Later work by Ahmad3 showed thatthe a spectrum measured in coincidence with yrays is very complex, and the above assignmentsof the 426- and 546-keV levels are not correct.From his coincidence measurements, he was ableto identify two new rotational bands with band-headenergies at 178 and 550 keV, and assigned them tothe —,'+(6224) and —,'+(622k) neutron states, respec-tively. A decay scheme representing a compositeof the results obtained by ABP and Ahmad' isshown in Fig. 1. A recent study~ of the electron

ZNZaGV LEVELS IN Cr'" V&A. DZCAV OF Fm'55
F 255
(el'~) —,'
—,'+
{Xn,AX) K I~II +2+
Energy (keV)
656
+72
240
(622 &) —,'-', +l66
5.7xlI5 set,
~+5
2
(6201) a a+
80,5E2
FIG. 1. Energy-level diagram of Cf 5 proposed in Hefs. 1 and 2. The energies and assignments of states fora+ and $+ bands are taken from Bef. 1 and the energies and assignments of states for the 2+ and 2+ bands are takenfrom Ref. 2.

392 AHMAD e E a l.
capture decay of Es' ' confirms the assignmentof the 178-keV state.
Because of its high specific activity, Fm"5 is avery suitable source for the investigation of weak-ly populated states in Cf'". From the ¹ilsson dia-gram' and the known states" in Cf'~' and Cf'",several single-particle states are expected to lie-400 keV above the ground state of Cf 5~. Recentlya large amount of Fm'55 has become available fromthe United States Atomic Energy Commission, andhence a detailed investigation of levels in Cf'" wasundertaken. The use of a high-resolution Ge(Li)diode, a high-resolution P-ray spectrometer, and
a multiparameter analyzer enabled us to identifynew single-particle states and confirm the assign-ments of previously known levels.
II. SOURCE PREPARATION
Approximately 20 y, g of Es containing -0.05%Es'6~ (t&, = 39.8 day) was obtained from Oak RidgeNational Laboratory as a part of the heavy-elementproduction program. The P -decay daughter,Fm2'5 (t~, = 20.1 h), was chemically isolated sev-eral times and used for the present investigation.The Fm was first separated from Es and otheractinides by adsorption on a cation-exchange resincolumn, followed by elution with ammonium o.-hydroxy isobutyrate. The Fm was then purified
from fission products by an extraction chromato-graphic procedure. The sample was once againpurified with a cation-exchange resin column7 toremove any Es left over from the initial separa-tion. For y-ray spectroscopy the sample wasspread on a thin glass plate with tetraethylene gly-col and evaporated to dryness. The sources for aspectroscopy and e- spectroscopy were preparedby vacuum volatilization of the purified Fm ontothin Al foils.
III. EXPERIMENTAL DATA
A. 0. Spectroscopy
The n-particle spectra of Fm'" were measuredwith a 6-mm-diam Au-Si surface-barrier detector.Figure 2 shows an n spectrum measured at a lowgeometry (-0.2% of 4~). The energies of the ngroups were measured with respect to that of Es2~
eo group which was taken as 6.632 MeV. ~
A two-parameter y-n coincidence experiment,which is discussed in more detail in Sec. III D,was performed to identify weak a groups. The nparticles were detected with the same 6-mm-diamdetector and the y rays were detected with a 25-cms Ge(Li) diode. Two of the n spectra measuredin coincidence (2m= 2 p, sec) with selected y raysare shown in Fig. 3. It should be noted that the
l05 (—7.023 MeV
106
IO4
V)
Z0O
'48
IO2
~Wy ~ ~ ~ o%
~ +OS ~~ ~ ~» ~
IO200
I
240l
280 320 360CHANNEL NUMBER (a-particle energy)
400 440
FIG. 2. Fm25~ n-singles spectrum measured vrith a 6-mm-diam semiconductor detector at a source-to-detector geom-etry of 0.2%%uo of 4m.. The n peaks are denoted by the excited-state energy measured from e spectroscopy alone, andthese may differ slightly from the best values obtained from y-ray and e spectroscopy.

VyA DECAY opF FIGELS IN CfENERGY LEV
6.
393
IOO
545
'5eiO
2I4I
taJXZZ0a'UJa.cn O. i
440CJ
o — (b)O
OO
10:
545I
59)I
520
433
~BI
Random peak
i06I
~ 0 ~ Qt VQI ~ ~
440O.l-- ~ M W
600CHANNEL NUMBER ( a- particle energy
coincidenceFm255 0.'spectrumm measure xn
s were detected2m=2 p, sec) with y rays.
25-c 3G (Idb h f
cted vrit ara san
0. s ctru t d(b) p
hi hd photons from zgscattere pt 0.1events are plotted at
OI Mev) are the only'th th 204. -
&3~ 6roups in coincidence migop
V y ray. .
' softhThe intensities oobtained by
-0.031 o .rays were ooincidence w1th y
fo th ff' ' of
Thdhi d
Mf t btintensities, an
iven in Tab estigatio sthe present inves i
endent eofrom the spin-indep
8. -Ray Spectroscopy
s s ectra of Fm~~ mere mea-'Ge(L1) d t to . Fi-
ensure mid tha4- anda
sent the y-sing es4 d5 pLi) diode. For
o ' 4 the source con a'bown in Fig.I ced-2 cm away r
s 0dwasp ace a rd /min of Fm1S m
For the spectrum shown in F1g.the detector. For0 dis/min of Fmth source conta1'ned -5x1
2 Al absorbethe s
xt to a1-g cmccCf
d as placed nexFig. 5 labeledhe eaks in i
n-p
a sum peakd ot ts and on
ntsThp
rays and KP' and0keV two y r andof e p
S III D) The pe) ere identify'
periment (see Sec.
F~2~~ 0. groups.TABLE I. Fm
n -particle energy(MeV)
Excited-stateenergy( eV)
Intensity(%)
Hindrancefactor
7.127+ 0.0047.102 + 0.0047.080 + 0.0047.023+ 0.0036.965+ 0.0086.953+ 0.0046.917+ 0.0046.893+ 0.0086.873+ 0.0046.816+ 0.0046.807 + 0.0036.765 + 0.0046.713+ 0.0046.701+ 0.0046.591+ 0.0046.546 + 0.0046.487 + 0.004
02548
106165177214238258316825368421433545591651
0.08 + 0.010.11+0.010.47 + 0.0493.3+ 0.3
5.2+ 0.1(2.0+ O.4) x 10-~
(2.O+ O.4) x 1O-2
0.61+0.04(1.0+ 0.2) x 10-2-2x 10-'
0.11+0.01(1.8+ 0.4) x 10-'~2x10(3.6+ 0.7) x 10(1.8+0.3)x10 2
(1.3+ O.3) x 1O-'
(3.0+0.7) x10 3
3,8x 102.2 x 103
4.2 x 10²
1.212.52.9 x 103
2.ox 103532.6 x 103
7.4 x 10³
1.2x 1p'4.9x lp'2.6 x 101.3x 10
78661.5x 102
AHMAD et al.
is also complex and consists of 332.0-, 330.0-,and 328.0-keV y rays. The 330.0- and 332.0-keVy rays have also been observed in an e-y coinci-dence experiment. The small peaks with questionmarks indicate that we are not certain that theyare Fma" y rays.
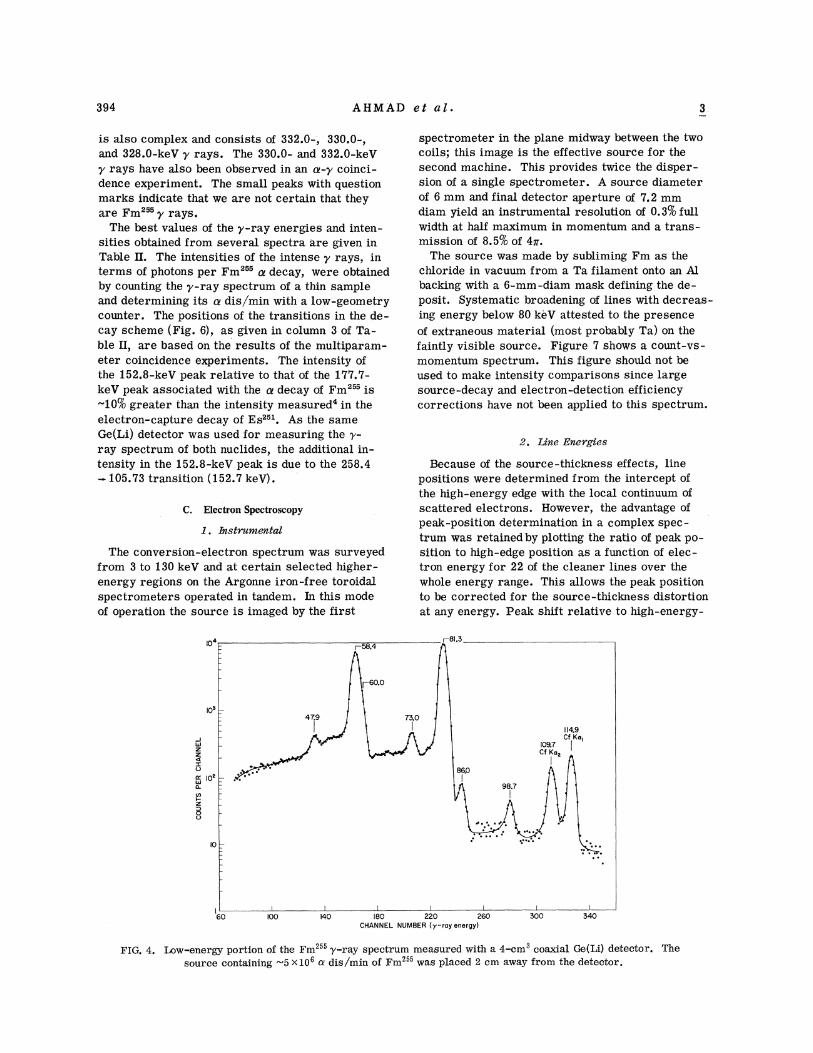
The best values of the y-ray energies and inten-sities obtained from several spectra are given inTable II. The intensities of the intense "y 1ays, lnterms of photons per Fm"5 ~ decay, were obtainedby counting the y-ray spectrum of a thin sampleand determining its n dis/min with a low-geometrycounter. The positions of the transitions in the de-cay scheme (Fig. 6), as given in column 3 of Ta-ble II, are based on the results of the multiparam-eter coincidence experiments. The intensity ofthe 152.8-keV peak relative to that of the 177.7-keV peak associated with the e decay of Fm2" is-10% greater than the intensity measured~ in theelectron-capture decay of Es"'. As the sameGe(Li) detector was used for measuring the p-ray spectrum of both nuclides, the additional in-tensity in the 152.8-keV peak is due to the 258.4-105.73 transition (153.7 keV).
C. Electron Spectroscopy
1. ISStfVLSl88tgl
The conversion-electron spectrum was surveyedfrom 3 to 130 keV and at certain selected higher-energy regions on the Argonne iron-free toroidalspectrometers operated in tandem. In this modeof operation the source is imaged by the first
spectrometer in the plane midway between the twocoils; this image is the effective source for thesecond machine. This provides twice the disper-sion of a single spectrometer. A source diameterof 6 mm and final detector aperture of 7,2 mmdiam yield an instrumental resolution of 0.3% fullwidth at half maximum in momentum and a trans-mission of S.5% of 4x
The source w'as made by subliming Fm as thechloride in vacuum from a Ta filament onto an Albacking with a 6-mm-diam mask defining the de-posit. Systematic broadening of lines with decreas-ing energy below 80 keV attested to the presenceof extraneous material (most probably Ta) on thefaintly visible source. Figure 7 shows a count-vs-momentum spectrum. This figure should not beused to make intensity comparisons since largesource-decay and electron-detection efficiencycorrections have not been applied to this spectrum.
2. L& l8 E88t'gros
Because of the source-thickness effects, linepositions were determined from the intercept ofthe high-energy edge with the local continuum ofscattered electrons. However, the advantage ofpeak-position determination in a complex spec-trum was retainedby plotting the ratio of peak po-sltloQ to high-edge posltlon as a functloQ of elec-tron energy for 22 of the cleaner lines over thewhole energy range. This allows the peak positionto be corrected for the source-thickness distortionat any energy. Peak shift relative to high-energy-
I04
Io'—
4JzzrOft-'IO'—G.(fJ
zDOO
I I4.9Cf Ko,
109.7Cf K
IOO l40i
I80 220 260CHANNEL NUMBER (y -ray energyj
MO 340
FIG. 4. Low-energy portion of the Fm ' y-ray spectrum measured with a 4-cm~ coaxial Ge(Ii) detector, Thesource containing -5 X10⁸ & dis/min of Fm2~5 was placed 2 cm away from the detector.

ENERGY LEVELS IN Cf'" VIA DECAY OF Fm'"
edge intercept, due to source thickness, was neg-ligible at 100 keV, amounted to -1x10 3 (momen-tum) at 40 keV, and -1x10 ' (momentum) at 5keV. Uncertainties in line positions were assignedtaking into account statistical. quality, unfolding,and source-effect corrections. Spectrometer cal-ibration error (5 parts in 10') was small com-pared to other uncertainties.
P. Binding Energies
Tabulated atomic-electron binding energies "3in the daughter caljtfornium available did not yieldconsistent energies for a given transition whenadded to the various conversion lines from thattransition. In order to arrive at better values forthese binding energies, both the binding and trans-ition energies were treated as parameters in aweighted least-squares computer -adjustment pro-cedure. Thirty-seven of the better lines from ninetransitions'~ generated equations of the form
where E, is the conversion-line energy, BE& isthe appropriate binding energy to yield transitionenergy y~, and 5& is a residual. Three additionalequations of the form y&+y„-y =5& were included;these express the crossover-sum relationships inthe decay scheme (24.8+ 23.0 —47.8; 23.0+58.5—81.5; 60+ 73 —133).
The function
s = Q w;(5, )'!
was then minimized' with respect to the 19 vari-able parameters (8 y-ray energies and 10 bindingenergies). Weights au& =o& ' were obtained fromthe assigned uncertainties in the conversion-lineenergies (E,+o, ) in the case of the 3V line-gener-ated equations, whereas the weights assigned tothe three crossover-sum equations were derivedfrom uncertainties in the transition energies as-signed on the basis of the o, of the various con-
1~7rll49 ls1,0
Icf Kg 204.1
10» =
Cf K x-roy-Kx-ray sum peaks2m.6
Ke@K~Kant Kg)
,2l0.6
hJ~I0 =zKO
I80 22
o~ M2.0
500
378.4I
590.7I
380
423.8I
437.8I
4859I
540
~10 ~ ~ ~~ ~
~e ~ 0~ ~ ~
4oI
720I
760I
800I I I
840 880 920CHANNEL NUMBER (&-ray energy)
I
1000 1040I
080 1120
FIG. 5. High-energy portion of the Pm~55 y-ray spectrum measured with a 4-cm coaxial Ge(Li) detector. Thesource ( 5 &10~ e dis/min) was placed next to a 1-g/cm2 Al absorber abutting the detector.

AHNAD ef al ~
TABLE II. Fm~~5 y rays.
Energy(tv)
Intensityt'photons j(102 FI~55 n decays) j Tx'RQSltloQ
47.9 ~ 0.1
58.4 + 0.1
60.0 + 0.163.8+ 0.573.0 + 0.1
81.3+ O.l86.0 + 0.1
98.7 + 0.2
109.7+ 0.1114.9+ O.l129.3+0.2131.0 + 0.2132.9 + 0.2133.4 + 0.2149.2 ~ O.2
152.8+ 0.2
159.0 + 0.2163.8 + 0.2172.9 + 0.2177,7 + 0.2184.8+ 0.2186.8+ 0.3204.1+0.2210.6 + 0.3213.5 + 0.4233.6 + 0.8264.1+ 0.2268.0+ 0.5271.0 + 0.3285.7 + 0.3828.0 + 0.5330.0 + 0.5
332.0 + 0.4
366.4+ 0.2378.4 + 0.2390.7 + 0.5410.0+ 0.5428.8 + 0.2437.8+ 0.2443.5 + 0.5483.9 + 0.8496.2 ~ 0.4502.7+ 0.5519.5+ 0.5
548.5 + 0.5
(1.9 +0.2)xlo '
0.78 + 0.06
0.12+0.016(8 ~ 3) x 1O-'
(2.9 +0.2)x 10
1.08+ Q.07
(6.6 +O.6) x 1O-3
(2.9 +0.2)xlo '
(1.95+ 0.14)x 10-2
(2.8 +0.2)xlo ~
(1.1 ~0.15)xlo '(2.8 ~0.3) x lo(8.5 +O.9) x 10 '(4.1 ~0.7)xlo '(6.5 +0.6)x10 '
1.9xlo 3
1.QxlQ 3
1.9xlQ 3
(2.1 + 0.2) x 10-
+0.4) x lQ
(2.0 y0.2)x 1Q
(8.o +0.3)& lo '(4.8 +0.4) x 10(8.O +O.8)x 1O '(1.0 +0.2) xlO(2.4 +0.2) x 10-'(3.Q a 0.4) x 10-lx 10-'
(2.6 +0.5) x lO-'(1.O +O.l)xlo '(1.8 +0.4) x 10(3.2 ~0.4)»o-'(3.9 +0.4)xlQ ~
(2.8 +0.4)x10 '(4.4 + 0.8) x 10 '
(3.3 + 0.4) x 10
(5.0 +0.5)xlo '(2.8 +0.3)x10-'(4.0 +G.8) x 10 4
(1.2 +0.4)xlo 4
(6.0 +Q.6)x 1Q
(1.35~0.14) x 10 '-5x 10-'
(3.9 +Q.4)xlo '(1.7 +0.4)xlo 4
4xlQ ~
(1.5 +0.4) x 10
(2.4 +0.6)xlo '
47.88 0105.78 47.83
+106.80 47,83166.31—106.304S4.2 370.4239.33 166.31105.73 24.82
+1O6.8O- 24.82325.3 239.38146.5 47.83
+424.1 325.3Cf Eo~Cf Xo(Cf Kg'370.4 289.33239.83- 106,30Cf Qaz295.7 146.5177.7 24.82
+258.4 105.73325.3 166.31211.6 47.83819.4 146.5177.7 0424.1 239.38211.6 24.82870.4 166.31258.4- 47.83319.4 105.73258.4 24.82370.4 106.30434.2 166.81590.2 819.4544.1—258.4434.2 1G6.30649.1 319.4544.1—211.6
+590.2- 258.4544.1 177.759Q.2 211.6649.1-258.4649.1 239.38590.2 166.31544.1-106.80590.2 146.5590.2 106.30544.1-47.83649.1 146.5544.1 24.82544.1 0
+590.2- 47.83
version lines of the particular transition in ques-tion.
The binding energies thus derived (Table III, col-umn 2) are significantly different from the Beardenand Burr" tabulated values for the Z (from L„L„
and Kn x rays), L„L„L„andM, shells. In
Table IH, column 4 @re present our own graphicalextrapolations" (from 2 =92, 93, 95, and fromexperimental data of Hollander et al. '~ at g = 97)
for g = 98 which are generally higher than our de-

39'7LEVELS
i jv'ved values but si
I
e l.i erent only fy or 24.8- a,nd 47.8-. -keV trans' iio ih h ab
ave i . + 0 1) x 10'icate atic error which
' t;r-i t t
ioo u e e inte
c ated usiensities and th
ing the ab-
) oi
ompared with th core i a va
ransitions. Thisrage abont 20%%uc larger
l o t b
rgy lines.pensating the
. Intensities
Relative conver '
fromversion-line a
ereight measu
e o tained
-d d tan en-
bt ' dfrgy tail was clear.
ines where the
Other correct'of the bare clea
ions weree made for the ' 'y
i ation detector "ments covered u
fo d frand for spec-
t i t ot-201un less statist' al
intensity pa tyofa a
A of the absolute '
a ar inc
u e ' 'y measurement
mparison of thnsls
e sum of the
ZNERG N Cf 26& V~» ECA ~o» m
(Nn AZ)K I
255(6I3 t)-2'-2'+
Energy(keV) a Intea ntensity
Q003 o/
37).27l.
(6
734t) 9 9'2 2
424268.0
I.3~s23I.O EI4.I E
0—0—
g0.036%$34.2
0.02 %
63.828.0
KO.0I8%
264. 1
gO. I I o/o
g0.6I %
y+I
I
(622 j))$+ 5.2%
%6.58.48 M I—8I.48 E2
p 0.47 %
O.I1%
8%
93.3Vo
Fro. 6. Fm'" ~N1 s s ownint t h
ructed on
m ers.
o the rethe basis f ththe band head e
t on ae asymptotic

AHMAD et at.
In view of this discrepancy we quote in Table Dr'
the intensity of e lines compared with the sum ofthe e intensities of the 24.8- and 47.8-keV trans-itions as 100%. At each level the total out feed(@+e ) minus total in feed (@+e ) must equal then feed to that level. For example, at the 106.30-and 105.73-keV levels the (e +y) intensity balancepredicts (98+20)%, whereas the a spectroscopygives 93% of the n decay to these levels. Simi-larly at all other levels the relatively crude e in-tensity data yield no disagreement with the a spec-troscopy intensities. The multipolarltles of the
transitions, as given in the last column of TableDI', are deduced from subshell ratios. In general,the subshell ratios are subject to less uncertaintythan the absolute conversion coefficients. Only an
upper limit for the intensities of the 131.0- and
204.1-keg K and I. lines was obtained which isconsistent only with their being E1 transitions.
Attempts were also made to unfold the compli-cated L, auger spectrum in the region between 8and 16 keV. About 25 lines are evident with vary-ing degrees of certainty. In Fig. 7 we have indi-cated some assignments which are more certain.
I
I 05I
I IO I25V
Iko |75v
l85 240 245
I I I I
6.7 7.5 7,6 7.7 7.8I
(JQJ
—2.0(p ~
—I .5 (u"
I I ~7.9 8.0
OJCh tA—60o
IA NA D
cu ~I—40
—PQ BJ~o ~ o~
l ~f (0~ C3 cocZ
Al OJ Al cu AJOJ j to
j Z.'
I
~o
8.3 8.4 8.5 8,6 IG. I l0.2 I03 l0.4 I 2.l l2.2 I 23 l2 4I I I
60n 80 keV
—I.Q yoop
~ —600
~ -400
iDIAg) iCO
I I I
5.0 5.6
)
I I
5.8
X—IIO
I I I I I
6.0 6,2 6.4
. 20-5K
N
25 30 35kev
fa
'=Iit.'--
CO
40
-l000
—800
—600OAJ
—400
3.2 3.4 3.65 keV
4.0I 0 keV
0tD
O-3m
4.4 4.6 4.8I
I -AUGERS I 5 keVO
M
I
l,5 l.7 l.9 2. I 2.3 2.5POTENTIOMETER SETTING (Electron Momentum)
27 29
FIG. 7. A count-vs-momentum plot showing the electron lines associated with the e decay of Fm~55. No decay orefficiency corrections have been applied to the plot and ae such it ehouM not be used as a measure of relative inten-sities. Parentheeee indicate where only an upper limit of intensity has been obtained. The region between 6.7 and 7.4potentiometer unite wae featureless and is not shown here.
ENERGY LEVELS IN Cf ~5~ VIA DECAY OF Fma55
TABLE III. Atomic-electron binding energies incalifornium (Z = 98).
Binding energy {keV)Bearden and Our graphical
Shell Present work Burr extrapolation b
KLgL)L3MgM)M~
N)N)N3
0(02, s
184.8 + 0.1 ~
25.996+ 0.01325.098+ 0.01319.881+ 0.0136.787 + 0.0106.816+0.0125.089 + 0.0151.799 + 0.0151.609 + 0.0201.288 + 0.015
0.299 + 0.020
185.96026.11025.25019.9306.7546.8595.1091.7991.6161.2790.419
134.92 +0.06026.005+ 0.02525.115+ 0.02519.985+ 0.0806.778 + 0.0806.345+ 0.0455.115+ 0.0451.817+ 0.085
0.409+ 0.035
~J. A. Bearden and A. F. Burr (Ref. 12}citing self-consistent field calculations of D. Liberman et al. , Phys.Rev. 137, 27 {1965).
"Not including present derived values but relying on theexperimental data of Hollander et al. (see Ref. 17) atZ =97.
From E x-ray energies measured with a Ge(Li) de-tector (Table II) and L2 3 binding energies shown in thistable.
D. Two-Parameter Coincidence Measurements
n-y Coincidences
An n-y coincidence experiment using a two-parameter analyzer was performed in order tocorrelate the y transitions with specific 0. groups.
5. Mlltipolarities of High-Energy Transitions
To measure the multipolarities of higher-energytransitions, an z-e- coincidence experiment wascarried out. A cooled Si(Li) detector coupled witha low-noise preamplifier was used to detect theelectrons; the u particles, after passing throughthe source backing (200-p, g/cm' Al), were detec-ted with a 2-cm' semiconductor detector. The of
detector and e detector were placed at an angle of180'with respect to each other and had geome-tries of 10 and 2%, respectively. The resolvingtime (2r) of the coincidence circuit was 300 nsec.In an e- spectrum measured in coincidence withall a particles below 6.90 MeV, only K lines ofthe 332-, 366-, and 378-keV transitions were iden-tified. The E conversion coefficients of thesetransitions were found to be 1.1+0.3, 0.9+0.3,and 0.8+ 0.3, respectively. These values are ingood agreement with the theoretical values" forM1 transitions (1.1, 0.83, and 0.76, respectively}.Other electron lines were too weak to be observed.
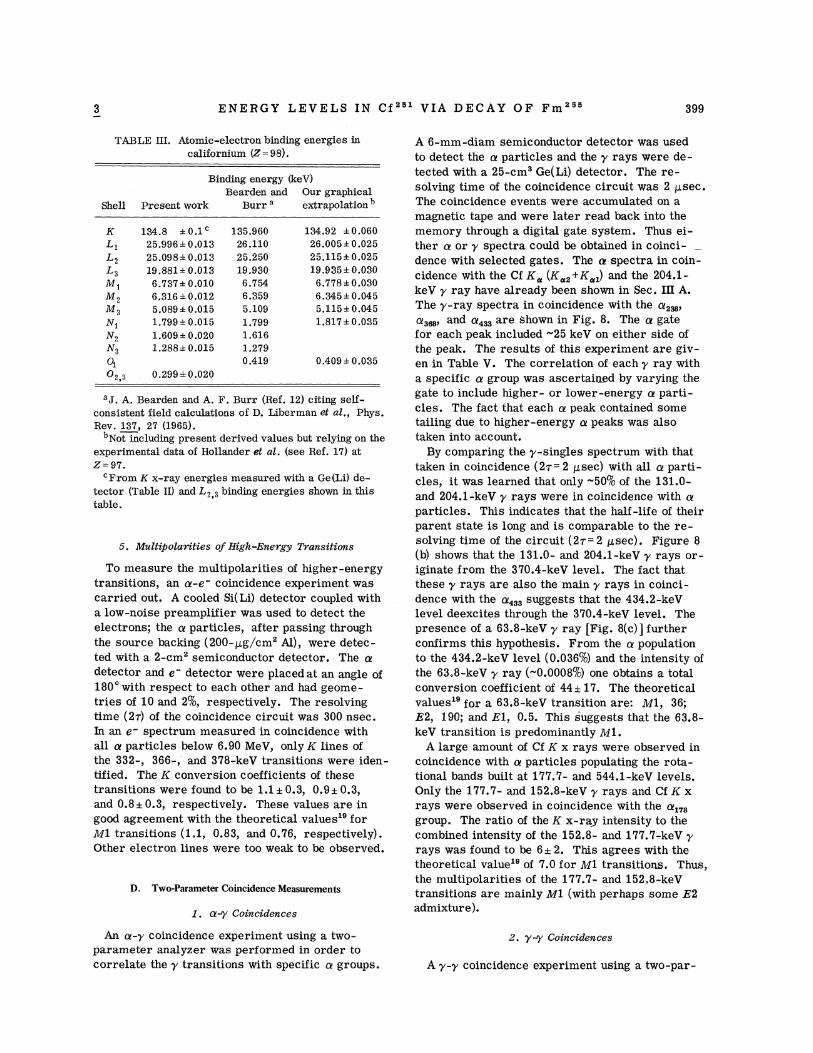
A 6-mm-diam semiconductor detector was usedto detect the n particles and the y rays were de-tected with. a 25-cm' Ge(Li) detector. The re-solving time of the coincidence circuit was 2 p.sec.The coincidence events were accumulated on amagnetic tape and were later read back into thememory through a digital gate system. Thus ei-ther z or y spectra could be obtained in coinci-dence with selected gates. The a spectra in coin-cidence with the Cf K (Z-, +K-,) and the 204.1-keV y ray have already been shown in Sec. III A.The y-ray spectra in coincidence with the n,~,Q3QQ and a4» are shown in Fig. 8. The n gatefor each peak included -25 keV on either side ofthe peak. The results of this experiment are giv-en in Table V. The correlation of each y ray witha specific e group was ascertained by varying thegate to include higher- or lower-energy n parti-cles. The fact that each o. peak contained sometailing due to higher-energy z peaks was alsotaken into account.
By comparing the y-singles spectrum with thattaken in coincidence (27=2 p, sec) with all n parti-cles, it was learned that only -50% of the 131.0-and 204.1-keV y rays were in coincidence with nparticles. This indicates that the half-life of theirparent state is long and is comparable to the re-solving time of the circuit (2m=2 ~ec). Figure 8(b) shows that the 131.0- and 204.1-keV y rays or-iginate from the 370.4-keV level. The fact thatthese y rays are also the main y rays in coinci-dence with the z~» suggests that the 434.2-keVlevel deexcites through the 370.4-keV level. Thepresence of a 63.8-keV y ray [Fig. 8(c)] furtherconfirms this hypothesis. From the n populationto the 434.2-keV level (0.036'%%uo) and the intensity ofthe 63.8-keV y ray (-0.0008%%uo} one obtains a totalconversion coefficient of 44+ 17. The theoreticalvalues' for a 63.8-keV transition are: M1, 36;E2, 190; and E1, 0.5. This suggests that the 63.8-keV transition is predominantly M1.
A large amount of Cf E x rays were observed incoincidence with o. particles populating the rota-tional bands built at 177.7- and 544.1-keV levels.Only the 177.V- and 152.8-keV y rays and Cf K xrays were observed in coincidence with the +$78group. The ratio of the K x-ray intensity to thecombined intensity of the 152.8- and 177.7'-keV yrays was found to be 6+ 2. This agrees with thetheoretical value'9 of V.O for M1 transitions. Thus,the multipolarities of the 1V7.7- and 152.8-keVtransitions are mainly Ml (with perhaps some E2admixture).
Z. y-y Coincidences
A y-y coincidence experiment using a two-par-
AHMAD et
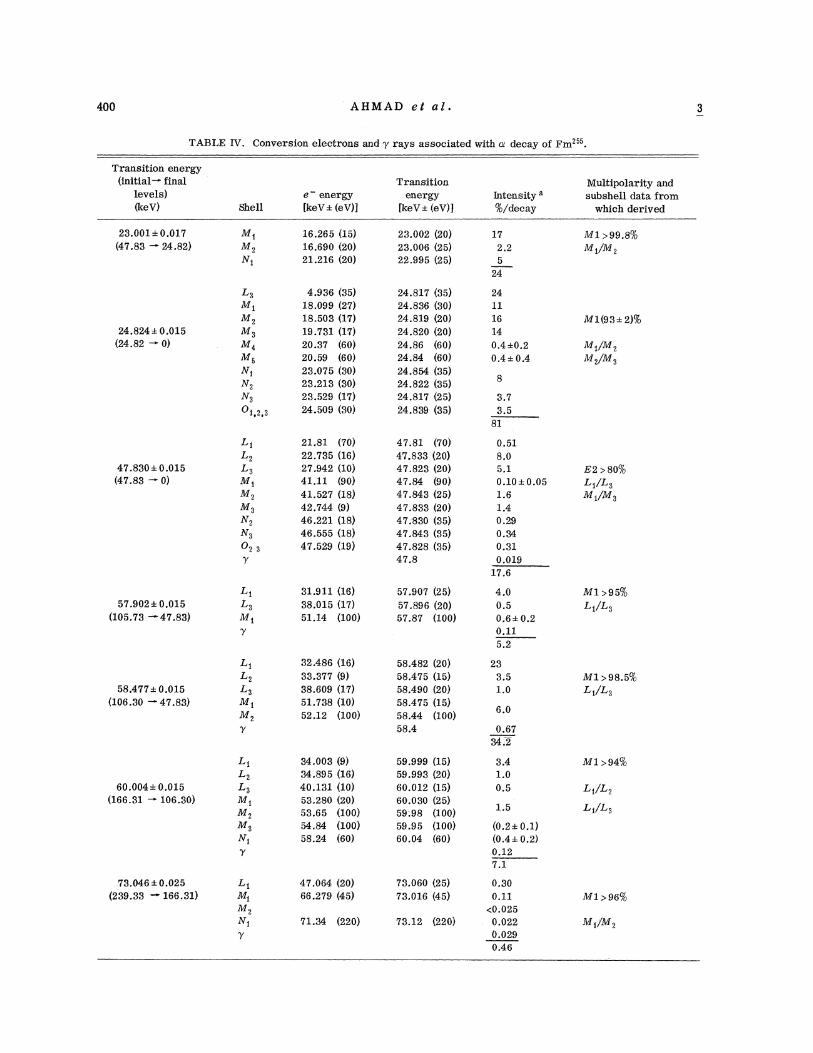
TABLE IV. Conversion electrons and y rays associated with e decay of Fm
Transition energy{initial final
levels)(keV)
Transitionenergy
I' ev+ (eV}]Intensityjg/decay
MUltipolarity andsubshell data from
wIlich der ived
23.001+0.017(4V.83 —24.82)
le.265 {15)le.e9o (2o)21.216 (2o)
2s.oo2 (2o)2s.ooe (25)22.995 {25)
24.824 + 0.015(24.82 —o)
47.830 + 0.015(4v.ss —o)
57.902 + 0.015(1O5.VS -4V.8S)
58.477+ 0.015(loe.so —4v.ss)
60.004 + 0.015(166.S1 —lO6.SO)
L3M)M~M3M4M)Ng
N2
N~
LgI2LsM)M2M3N2
N~
o~37
LgL3Mg'Y
LgL2L3Mg
M27
LgL2L3Mg
M~
MsNg'Y
4.936 (s5)18.099 (27)18.5os (lv)19.vsl (lv)2o.sv (eo)2O.59 {6O)2s.ov5 (so)2s.213 (so)23.529 (1V)24.5o9 (so)
21.81 (VO)
22.vs5 (le)27.942 (lo)41.11 (90)41.527 (18)42.v44 (9)46.221 (18)4e.555 (18)4V.529 (19)
s1.911 (16)ss.o15 (lv)51.14 (100)
32.486 (16)ss.svv (9)38.609 (17)51.738 (10)
{loo)
34.003 (9)34.895 (16)40.131 (10)53.2so {2o)5s.65 Q.oo)54.84 (1OO)
58.24 (60)
4v.oe4 {2o)66.2v9 (45)
(22O)
24.817 (35)24.8se (so)24.819 (20)24.82O (2O)
24.8e (eo){eo)
24.854 (s5)24.822 (S5)24.81V (25)24.8S9 (S5)
4v 81 (vo)47.833 (20)47.823 (20)47.84 (9O)4V.843 (25)47.833 (20)4V;8SO (S5)4v.84s {s5)4v.828 (s5)47.8
5v.9ov (25)5v.896 (20)5v.sv O.oo)
58.482 (2O)
58.475 (15)58.490 (2O)
58.4V5 (15)58.44 (100)58.4
59.999 0.5)59.993 (20)6O.O12 {15)60.030 (25)59;98 Ooo)59.95 (100)eo.o4 {eo)
vs.oeo (25)vs.ole (45)
24ll16
0.4+0.20.4 + 0.4
s.v
3.581
0.518.05.10.10+0.051.6] 40.29o.340.310.019
17.6
4.00.50.6+ 0.2O.ll5.2
6.0
0.6734.2
1.00.5
(o.2~ o.l)(0.4 + 0.2}0.12V.l0.300.11
&0.0250.0220.0290.46
Mg/M 2
M2/M~
E2 &80%L g/L3M, /M,
L,/L,
L,/L,
Ml &96%
M,/M,

ENERGY LEVELS IN Cf 25' VIA DECAY OF Fme 401
TABLE IV (Continued)
Transition energy(initial final
levels)(keV)
80.920 + 0.045(105.73 24.82)
81.477 + 0.020(106.30 24.82)
130.10 +0.26(1VV.V -4V.8S)
131.0 + 0.2(370.4 239.33)
132.03 +0.13(237.7 —lo5.vs)
133.01 +0.050(2se.ss —lo6.so)
204.1(370.4 166.31)
264.1(370.4 106.30)
Shell
L)L~L3M)M~
Ng
N
O~ 3'Y
LgL2
MgM)M3N2
N3
o2, 3
Lg
L23
L2L37
L~L3M~
7ELi,2,or 3
7
EL~,2,0r 3'y
e- energy0 eV+ (eV)]
55.8S6 (6O)
61.060 (60)74.66 (110)v5.8s (2so)
56.395 (20)61.599 (20)
V5.1S6 (25)V6.SV6 (25)ve.8v (vo)80.28 (120)81.19 (VO)
104.10 (260)
106.90 (130)112.17 (130)
lov.es (5o)113.O5 (5O)126.70 (140)
Transitionenergy
tkeV ~ (eV)]
8o.e34 (6o)80.941 (60)80.98 (110)80.92 (230)
81.493 (25)81.480 (25)
81.452 (30)81.465 (30)81.48 (70)81.56 (120)81.49 (70)
iso. lo (26o)
lsl. l (2oo)
1S2.OO (1SO)132.05 (130)
133.02 (50)ls2.9s (5o)lss.ol (140)
204.1 (200)
264.1 (200)
Intensity ~
%/decay
(o.2+ o.l)4.53.6(1.9)1.1
(0.9)
(o.2)0.27
12.5
(1.1)2013(0.3)5.83.9
(3.6)
0.80.81
49.3
0.0036 + 0.0012&0.0012
&0.00140.028
0.00470.0026 + 0.00090.0021
0.01760.00910.0067 + 0.00200.0064
&0.01&0.004&0.024
&0.006&0.0060.001
Multipolarity andsubshell data from
which derived
E2(M 1 &20Vo)
L2/L3
(M1 & 20%)L2/LS
ElL~ and L2 conver-sion coefficients&0.05
ElL1 and L2 con ersaon coefficients&0.17
~Conversion-electron intensities are uncertain to +20% unless specifically indicated. y-intensity errors not givenhere (see Table II). Values in parentheses indicate lines masked by strong lines. In these cases intensity partition isbased on theoretical expectation. Intensities of unresolved y rays are obtained by partitioning the total y-ray intensityin accordance with the observed electron intensity.
ameter analyzer was performed with a view toobtaining the mode of deexcitation of the high-en-ergy y rays. The y rays were detected with 4-and 25-cm~ Ge(Li) diodes. The resolving time ofthe coincidence unit was 2p, sec. The results ob-tained from this experiment are given in Table VI.
The y-ray gate included only the symmetric partof the photopeak (gate width= 6 keV). The resultsvery clearly established that the 204.1-keV trans-ition goes to the 166.31-keV level and 131.0-keVtransition deexcites to the 239.3-keV level. Alsothe presence of large amounts of Cf K x rays in
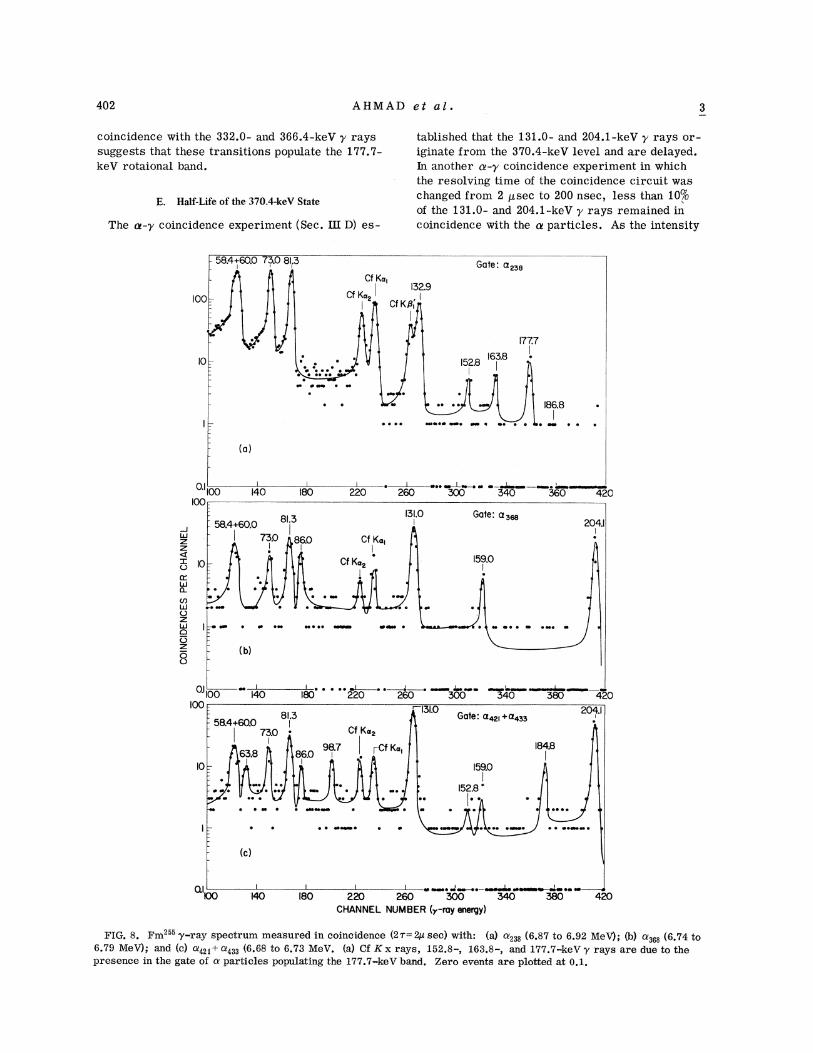
402 AHMAD et al ~
coinci ence wi'd ce with the 332.0- and 366.4-keV y rays177.7-suggests that these transitions populate the 1
keV rotaional band.
E. Half-Life of the 370.4-keV State
The e-y coincidence experiment ~Sec.~Sec. IH D. es-
tablished that the 131.0- and 204.1-keV y lays or-iginate from eth 370.4-keV level and are delayed.jn another Q-y colncldence experiment ln which
~ ~th solving time of the coincidence circuit waschanged from 2 p, sec to 200 nsec, less than 0
of the 131.0- and 204.1-keV y rays remained incoincidence wl'th the e particles. As the intensity
- 58.4+60.0
ioo-
7&.0 8I,B
Cf KoI
!Cf KoqI529, I
Gate: a2~8
IO=
e o e ~
I86.8 ~
~e ~ e ae e o s e ~ e e e
(a)
1
OIIOO I40loo
58.4+60.0
43 0=LLIQ ~
l80
8I.5
86.0!
I
I
Cf KoIIe
ISI.OI
l59.0I
e
i ~ I
220 260 XC 540
204.l!
MQJ e.e we
QJ llew ~ w ewClC3
(b)C)C3
ee ~ ~ e
IO—63.8
IOO
- 58.4+60.0 8I3
l80 220I ——:Qeeeo o o ~
260
Gate:3
Cf Kaq.
(ssoI I
o~
I59.0
l52.8 '
l84.8
F40 585 420204.l
~42I +~455
o w ~ ~ oweo p oe ~
~ o eeeoeo o oewew e
(c)
I40 l80—::::oo:::~%0 o 0%I w eeweo oe= =o—=::oo:::
220 260 XQ 540 J80CHANNEL NUMBER (y-ray energy)
420
sured in coincidence (2~= 2p sec) vrith: (a) &238 {6.87 to 6.92 M b e (6.74 to
-"-"..:..."--.-'-,1:.:-"presence in the gate of e particles populating the 177.7- e an .

ENERGY LEVELS IN Cf 25' VIA DECAY OF Fm''6 403
TABLE V. Results of two-parameter y-y coincidence experiment.
y raysb(kev)
+ 106
A 146
166
~ 214
~238~ SS9
~ 295
A 316
~sr&
~&68~ 4~1+0' 4SS
~ &45
+ 591
~651
47.9, 58.4, and 81.898.758.4, 60.0, and 81.3Cf E x rays, 152.8, and 177.7Cf E x rays, 163.8, and 186.858.4, 60.0, 73.0, 81.8, and 132.9Cf E x rays, 152.8, and 210.6149.2Cf E x rays58.4, 60.0, 73.0, 81.3, 86.0, and 159.058.4, 60.0, 73.0, 81.8, 131.0, 204.1, and 264.158 4 ~ 60 Os 63 8 73 0~ 81 8~ 98 7~ 131 0 j 184 8j 204 1j and 264 1Cf K s rays, 152.8, 177.7, 382.0, 866.4, and 437.8Cf E x rays, 163.8, 177.7, 382.0, and 378.4Cf E x rays and 390.7
Each gate included n particles 25 keV on either side of the peak mentioned.The y-ray energies in column 2 are those obtained from y-singles spectra. The coincidences indicated by under-
lined y rays are particularly critical in the construction of the decay scheme.
of the +3~ group is only half of that of the a~»group, the reduction in y-ray intensities indicatesthat the 370.4-keV level is delayed.
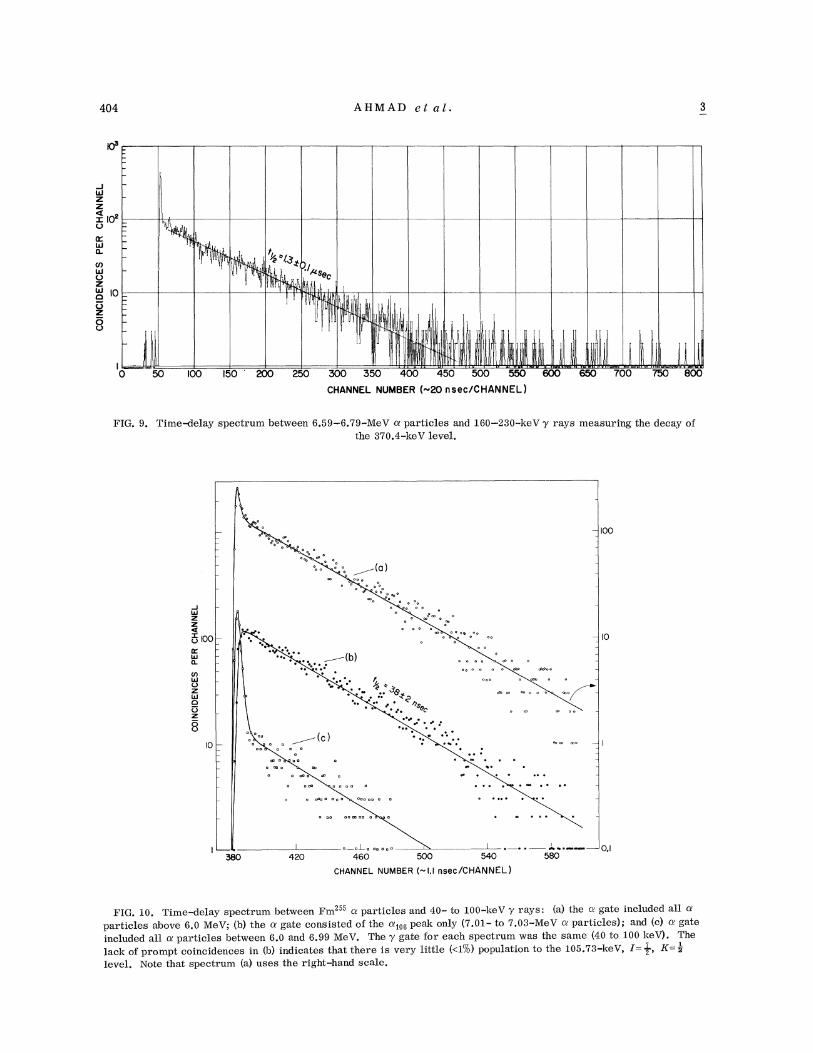
The half-life of the 370.4-keV level was mea-sured with a time-to-amplitude converter (TAC).The o. particles were detected with a 2-cm semi-conductor detector and the y rays were detectedwith a 3-in. x2-in. NaI(T1) detector. Timing sin-gle-channel analyzers were used to select n parti-cles between 6.59 and 6.79 MeV and y rays be-tween 160 and 230 keV. The e pulses and y-raypulses from the single-channel analyzers wereused as start and stop signals for the TAC. A timespectrum collected over a period of 20 h is shown
in Fig. O'. The half-life of the 370.4-keV level wasdetermined from a least-squares-fit analysis andfound to be 1.3+ 0.1p,sec.
F. Three-Parameter to.-y-Time) Coincidences
It was shown in Ref. 1 that the time spectrumbetween Fm" a particles and 40- to 100-keV yrays had a half-life of 37+ 2 nsec and had noprompt events. This demonstrates that the 105.73-keV level (I= vv, K= -,') receives a negligible o. pop-ulation. The present experiment was designed toget some limit for the n intensity to the 105.73-keV level. The procedure was the same as thatused by ABP' except that we used a three-parame-ter analyzer and thus obtained the time spectra be-tween various e and y-ray gates simultaneously.The n particles were detected with a 6-mm-diamsemiconductor detector and the photons were de-tected with a 2-in. x2-in. NaI(T1) crystal mountedon an RCA 8575 photomultiplier tube. Fast timing
TABLE VI. Results of two-parameter y-y coincidence experiment.
y -ray gate~0 eV)
y raysb(keV)
58.4+ 60.073.081.3Cf K~
131.0+ 132.9204.1832.0366.8
58.4, 60.0, 73.0, 81.3, 131.0, and 204.158.4., 60.0, 81.3, 86.0, .and 131.060.0, 73.0, 131.0, 132.9, and 20$.1Cf E x rays, 152.8, 163.8, 177.7, 330.0, 382.0, 366.4, 378.4, and 890.758.4, 60.0, 73.0, and 81.358.4, 60.0, and 81.3Cf E x raysCf Ex rays
Each gate included only the symmetric part of the photopeak and had a width of 6 keV.The y-ray energies are those measured from y-singles spectra. The coincidences indicated by underlined y rays
are particularly critical in the construction of the decay scheme.
404 AHMAD e t a l.
LLIxw 10O
MLLJDX~o 10
OxO
I.0
I
50 100 150 200 250
'I
Ill & i iil liilili i I ilir li. „ II iii
XC 550 400 450 500 550 600 650 700CHANNEL NUMBER (-20 n sec/CHANNEL)
FIG. 9. Time-delay spectrum between 6.59-6.79-MeV e particles and 160-230-keV y rays measuring the decay ofthe 370.4-keV level.
0o
0 o0g o o
0 0 00 0
0 0000 CP
000 0
0 ~(a)0
—100
LLI
KX~ol00LLLLI
~ 4
44~ ~ ~~ ~
~ 4 ~~ ~4
OO 00 o
0
00
00
o0 0
c0 000 00 0 0
0 0 0 00 oo0 00 OO 0
00
000
0oo op oo
o0
o o o o cCCp dh9o o
—IO
(hLLJoLLIOoz0o
IO—~ ~
~ ~~ 4
~ 44 ~4
~ ~ 44 44
cp& co oo o o
0
I—' ~
420I ~ ~ ~
460 500 500
CHANNEL NUMBER (- I. I nsec/CHANNEL)
I
~44 a 4 eosaseo —0, I
580
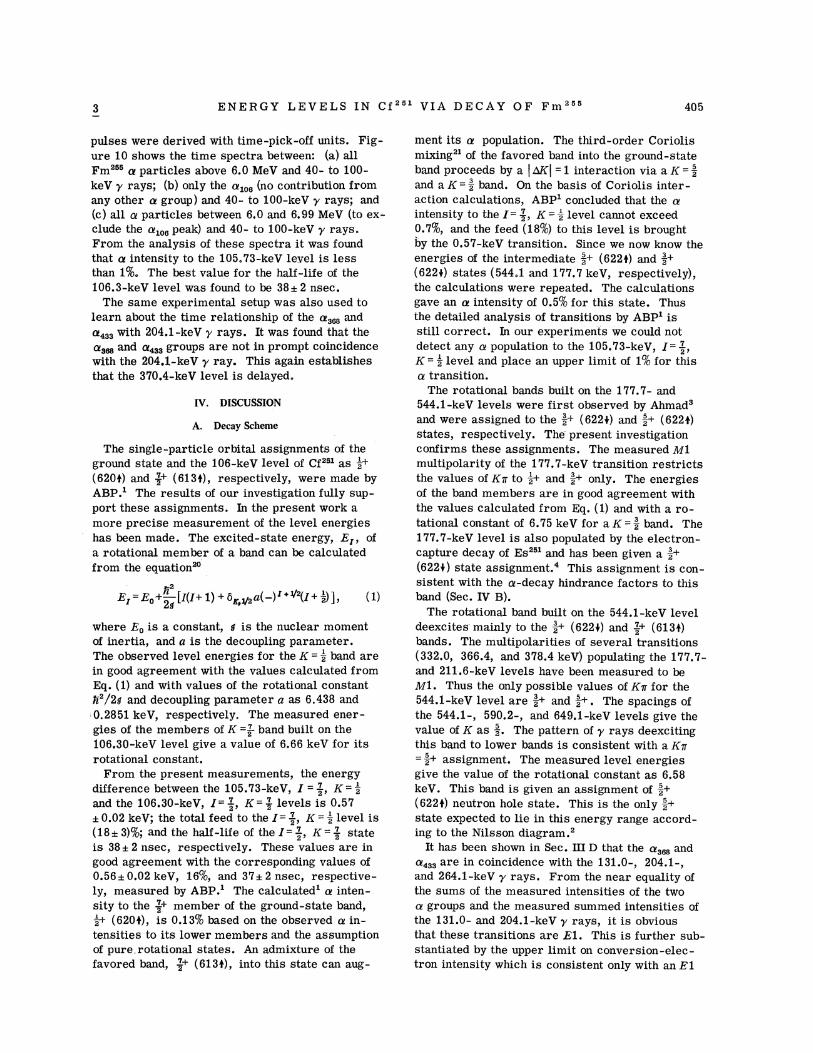
FIG. 10. Time-delay spectrum between Fm255 e particles and 40- to 100-keV y rays: (a) the a gate included all o.'
particles above 6.0 MeV; (b) the e gate consisted of the o.'&O6 peak only (7.01- to 7.03-MeV & particles); and (c) e gate
included all e particles between 6.0 and 6.99 MeV. The y gate for each spectrum was the same (40 to 100 keV). The1
lack of prompt coincidences in (b) indicates that there is very little (&1%) population to the 105.73-keV, I= 2, K= 2
level. Note that spectrum (a) uses the right-hand scale.
ENERGY LEVELS IN Cf VIA DECAY OF Fm 405
pulses were derived with time-pick-off units. Fig-ure 10 shows the time spectra between: (a) allFm"5 a particles above 6.0 MeV and 40- to 100-keV y rays; (b) only the e~«(no contribution fromany other a group) and 40- to 100-keV y rays; and
(c) all n particles between 6.0 and 6.99 MeV (to ex-clude the o.~«peak) and 40- to 100-keV y rays.From the analysis of these spectra it was foundthat o. intensity to the 105.73-keV level is lessthan 1%. The best value for the half-life of the106.3-keV level was found to be 38+ 2 nsec,
The same experimental setup was also used tolearn about the time relationship of the as~ and
n4ss with 204.1-keV y rays. It was found that the
z3~ and a~~ groups are not in prompt coincidencewith the 204.1-keV y ray. This again establishesthat the 370.4-keV level is delayed.
IV. DISCUSSION
A. Decay Scheme
The single-particle orbital assignments of theground state and the 106-keV level of Cf25~ as ~~
(6204) and &+ (6134), respectively, were made byABP.~ The results of our investigation fully sup-port these assignments. In the present work amore precise measurement of the level energieshas been made. The excited-state energy, EI, ofa rotational member of a band can be calculatedfrom the equation'0
where E, is a constant, g is the nuclear momentof inertia, and a is the decoupling parameter.The observed level energies for the K = —,
' band arein good agreement with the values calculated fromEq. (1) and with values of the rotational constant8'/2e and decoupling parameter a as 6.438 and
0.2S51 keV, respectively. The measured ener-gies of the members of K =2 band built on the106.30-keV level give a value of 6.66 keV for itsrotational constant.
From the present measurements, the energydifference between the 105.73-keV, I = -„K= —,
Rnd the 106.30-keV, I= ~, K = ~7 levels is 0.57+0.02 keV; the total feed to the I=-„K=—,
' level is(18+3)%; and the half-life of the I= ~, X= ~2stateis 38+ 2 Qsec, respectively. These values are ingood agreement with the corresponding values of0.56+0.02 keV, 16%, and 3'I+2 nsec, respective-ly, measured by ABP.' The calculated' a inten-sity to the ~~+ member of the ground-state band,—;+ (6204), is 0.13% based on the observed a in-tensities to its lower members and the assumptionof pure, rotationRl stRtes An admixture of thefavored band, -',+ (6134), into this state can aug-
ment its e population. The third-order Coriolismixing2' of the favored band into the ground-stateband proceeds by a
~bK~ =1 interaction via a K =-',
and a K =& band. On the basis of Coriolis inter-
action calculations, ABP' concluded that the aintensity to the I= &~, K =
2 level cannot exceed0.7%, and the feed (18%) to this level is broughtby the 0.57-keV transition. Since we now know theenergies of the intermediate —', + (6224) and —',+(6224) states (544.1 and 177.7 keV, respectively),the calculations were repeated. The calculationsgave an n intensity of 0.5% for this state. Thusthe detailed analysis of transitions by ABP' isstill correct. In our experiments we could notdetect any a population to the 105.73-keV, I= 7,K = —,
' level and place an upper limit of 1% for thisz transition.
The rotational bands built on the 177.7- and544.1-keV levels were first observe4 by Ahmadsand were assigned to the ~+ (6224) and 2+ (6220)states, respectively. The present investigationconfirms these assignments. The measured M1multipolarity of the 177.7-keV transition restrictsthe values of Kg to ~2 and 2+ only. The energiesof the band members are in good agreement withthe values calculated from Eq. (1) and with a ro-tational constant of 6.75 keV for a K= —', band. The177.7-keV level is also populated by the electron-capture decay of Esas and has been given a &+
(6220) state assignment. ~ This assignment is con-sistent with the e-decay hindrance factors to thisband (Sec. IV B).
The rotational band built on the 544.1-keV leveldeexcites mainly to the ~+ (6220) and 7+ (6130)bands. The multipolarities of several transitions(332.0, 366.4, and 378.4 keV) populating the 177.V-and 211.6-keV levels have been measured to beM1. Thus the only possible values of Kg for the544.1-keV level are 2+ and —,'+. The spacings ofthe 544.1-, 590.2-, and 649.1-keV levels give thevalue of K as 3. The pattern of y rays deexcitingthis band to lower bands is consistent with a Kg= —',+ assignment. The measured level energiesgive the value of the rotational constant as 6.58keV. This band is given an assignment of —,'+(6224) neutron hole state. This is the only ~+state expected to lie in this energy range accord-ing to the ¹ilsson diagram. '
It has been shown in Sec. DI D that the as~ Rnd
n4» are in coincidence with the 131.0-, 204.1-,Rnd 264.1-keV y rays. From the near equality ofthe sums of the measured intensities of the twon groups and the measured summed intensities ofthe 131.0- and 204.1-keV y rays, it is obviousthat these transitions are E1. This is further sub-stantlRted by the upper limit oQ conversloQ-elec-tron intensity which is consistent only with Rn E1

406 AHMAD
multipolarity for these two y rays. It has beenestablished from the e-y coincidence experimentthat the origin of the 131.0- and 204.1-keV trans-itions is the 370.4-keV level. The y-y coincidencemeasurements show that the 131.0- and 204.1-keVtransitions populate the 239.33- and 166.31-keVlevels, respectively. These observations suggestthat the only values of Kg possible for the 370.4-keV state are —,—and ~~-. The half -lif e of the370.4-keV level is too long (1.3psec) for anyknown K allowed El transition in the deformedregion. 22 Hence, this state is given an assign-ment of ~-,'- (7254) orbital. It should be pointedout that this is the first time this Nilsson statehas been observed in any nucleus.
The 434.2-keV level deexcites mainly to the370.4-keV state. The multipolarity of this trans-ition has been deduced from the intensity of the63.&-keV y ray and the total n feed to the 434.2-keV level. The M1 multipolarity of the 63.8-keVtransition thus obtained indicates that the 434.2-keV level is a negative-parity state, and spin val-ues allowed for this state are —,', '-,', and ~3. Aswill be shown in the next section, this state can-not be the rotational member of the band built onthe 370.4-keV level. Hence, the 434.2-keV statebelongs to a new band. The y rays connecting thisstate to the 7+ (6130) band (268.0- and 328.0-keV
y rays} have also been observed. The fact that theintensities of the 268.0- and 328.0-keV transitionscompared with that of the 63.8-keV transition arelow is not surprising since most E1 transitions inthe actinide region are found to be retarded. '3
The 434.2-keV level is given an assignment of 9-(7340) mainly because it is expected to be nearthis excitation energy. The assignment is con-sistent with the observed e-decay hindrance fac-tor.
B. o. Transition Probabilities
The relative z transition probabilities to themembers of a rotational band are functions of therespective vector-addition coefficients and can becalculated semiempirically. '4 As shown in Ref.1, the observed a intensities to the members ofthe ground-state band and to the members of thefavored band are in good agreement with the inten-sities calculated from equations in Bef. 24. The
relative a abundances to the members of the mem-bers of the —,'+ (6224) and —,'+ (6224) bands have al-so been found to agree3 with the calculated values.
The e transition probabilities have also beencalculated from ¹ilsson wave functions:by Poggen-burg, Mang, and Basmussen. 2' The calculated in-tensities have been found to be in reasonable agree-ment with the experimental values when normal-ized for the factored e transition. The hindx ancefactors (which are reciprocal of the reduced o.transition probabilities} for the '3' and @ mem-bers of the '-,'- (7254) band have been calculated tobe 2.2&&10 and 2.6x10, respectively. The ob-served hindrance factors of 490 and 130 for the
@3~ and @~33 transitions, respectively, clearlydemonstrate that the 370.4- and 434.2-keV levelsdo not belong to 'the same band. It should be point-ed out that a fairly strong Coriolis interaction isexpected between the '~~- (7254) and f—(7344)bands. The somewhat larger intensity (490 com-pared with Poggenburg's value of 2.2x10 ) of the
a3~ group can be attributed to this admixture.In Sec. IV A, the 434.2-keV level was given an
assignment of 9 —(7344) state. No calculationshave been carried out for the e population to thisstate by Poggenburg. '5 However, it has been knownfrom e-decay systematics'&' that txansitions forstates involving no change in the intrinsic spin Pare about an order of magnitude less hinderedthan those involving a change in the sign of P.Thus the hindrance factor of 130 seems consistentwith the assignment of ~9 —(7340) to the 434.2-keVlevel.
It should be noted that hindrance factors to themembers of the 2+ (6224) band are &1000, where-as the hindrance factors to the members of the —,'+(6224) band are between 66 and 150. These u-de-cay hindrance factors are consistent with the as-signment of —,'+ (6224) ¹ilsson state to the 177.7-keV level and ~+ (6224) ¹iisson state to the 644.1-keV level.
ACKNOWLEDGMENTS
The authors would like to thank H. Diamond andF. J. Lynch for theix' help in the analysis of timespectra and A. M. Friedman and B.B. Chasmanfor helpful discussions.
)Based on vwrk performed under the auspices of theU. S. Atomic Energy Commission.
~F. Asaro, S. Bjgfrnholm, and I. Perlman, Phys. Bev.133, B291 (1964).
28. G. Nilsson, Kgl. Danske Videnskab. Selskab, Mat, -Fys. Medd. 29 No. 16 (1955).
3I. Ahmad, Lmvrence Radiation Laboratory Report No.UCRL-16888, 1966 (unpublished).
4I. Ahmad, B. K. Sjoblom, B. F. Barnes, E. P.Hormitz, and P. B. Fields, Nucl. Phys. A140, 141 (1970).
5I. Ahmad, A, M. Friedman, B. F. Barnes, B. K.Sjoblom, J. Milsted, and P. B. Fields, Phys. Bev. 164,

ENERGY LEVELS IN Cf VIA DECAY OF Fm 407
1537 (1967).6F. Asaro and I. Perlman, Phys. Bev. 158, 1073 (1967).~G. B. Choppin, B. G. Harvey, and S. G. Thompson,
J. Inorg. Nucl. Chem. 2 66 (1956).SB. J. Sochacka and S. Siekierski, J. Chromatog. ~16
376 (1964).J. Milsted, private communication.J. Milsted, N. Hansen, and A. H. Jaffey, private
communication.~M. A. Preston, Phys. Bev. ~71 865 (1947).
~2J. A. Bearden and A. F. Burr, Rev. Mod. Phys.39, 125 (1967).
C. M. Lederer, J. M. Hollander, and I. Perlman,Table of Isotopes (John Wiley @ Sons, Inc. , New York,1967), Appendix III.
Transitions (sheOs): 23.0 keV (M~M2Ã&); 24.8 keV(L3MfM2M)N(N2N 3}; 47.8'keV (L2L3M2MSN2N302
~ 3} 57.9keV (L&L3}; 58.5 keV (L&L~LSMq}; 50.0 keV (LfL~2L3Mf};73.0 keV (L(Mg); 81.5 keV (I2L,3M2Mp)02 3); 183.0 keV(L2L).
~5W. C. Davidon, Argonne National Laboratory ReportNo. ANL-5990, 1966 (unpublished).
~~We have similarly derived binding energies from L,
M, and N shells at Z= 95. Another publication will dis-cuss the problem « transplatonium atomic bindingenergies more thoroughly.
~VJ. M. Hollander, M. D. Holtz, T. Novakov, and R. L.Graham, Arkiv Fysik 28, 375 (1965).
~8F. T. Porter, M. S. Freedman, F. Wagner, Jr., andI. S. Sherman, Nucl. Instr. Methods 39, 35 (1966).
~9B. S. Hager and E. C. Seltzer, Nucl. Data ~A4 1 (1968).20A. Bohr and B. R. Mottelson, Kgl. Danske Videnskab.
Selskab, Mat. -Fys. Medd. 27, No. 16 (1953).2~A. K. Kerman, Kgl. Danske Videnskab. Selskab, Mat. -
Fys. Medd. 30 No. 15 (1955).C. F. Perdrisat, Bev. Mod. Phys. 38, 41 (1966).
23F. Asaro, F. S. Stephens, J. M. Hollander, andI. Perlman, Phys. Bev. 117, 492 (1960).
24A. Bohr, P. O. Froman, and B. R. Mottelson, Kgl.Danske Videnskab. Selskab, Mat, -Fys. Medd. ~29 No. 10(1955); P. O. Froman, Kgl. Danske Videnskab. Selskab,Mat. -Fys. Skrifter ~1 No. 3 (1957).
5J. K. Poggenburg, H. J. Mang, and J. O. Basmussen,Phys. Rev. 181, 1697 (1969); J. K. Poggenburg, Law-rence Radiation Laboratory Report No. UCRL-16187,1965 (unpublished).