vg213 sustainable cropping systems in brassicas (pest ... › app › data › technical-insights...
TRANSCRIPT

VG213 Sustainable cropping systems in brassicas (pest management)
Sue Heisswolf Queensland Department of Primary Industries

VG213
This report is published by the Horticulture Australia Ltd to pass on information concerning horticultural research and development undertaken for the vegetable industry.
The research contained in this report was funded by Horticulture Australia Ltd with the financial support of the vegetable industry and the Queensland Fruit and Vegetable Growers.
All expressions of opinion are not to be regarded as expressing the opinion of Horticulture Australia Ltd or any authority of the Australian Government.
The Corporation and the Australian Government accept no responsibility for any of the opinions or the accuracy of the information contained in this report and readers should rely upon their own enquiries in making decisions concerning their own interests.
Cover price: $22.00 (GST Inclusive) ISBN 1 86423 297 8
Published and distributed by: Horticultural Australia Ltd Level 1 50 Carrington Street Sydney NSW 2000 Telephone: (02) 8295 2300 Fax: (02) 8295 2399 E-Mail: [email protected]
©Copyright 1996
Horticulture Australia Limited

Sustainable Cropping Systems in Brassicas (pest management)
S. Hessswolf, J.R, Hargreaves, L. Cooper and P i . Deuter Department of Primary Industries Queensland
Final report for HRDC project VG213
July 1996
Queensland Fruit fk Vegetable
Growers 1
f i #
HORTICULTURAL RESEARCH 5
DEVELOPMENT CORPORATION Fte Sesflaic.'i A "n ~i( ;he
DPI DEPARTMENT OF PRIMARY tNDUSTRIES
Contents Page No.
Industry summary 1 Technical summary 2 Recommendations 4 Acknowledgements 6
Technical report 7 Introduction 7
Literature review 8 Materials and methods 11
Demonstration plantings at the Gatton Research Station 11 Unsprayed plantings at the Gatton Research Station 13 On-farm trial work 14 Extension activities 15
Results 19 Demonstration plantings at the Gatton Research Station 19
Cauliflower 19 Cabbage 23
Unsprayed plantings at the Gatton Research Station 29 On-farm trial work 37
Broccoli 37 Cauliflower 46 Cabbage 54
Extension activities 63 Discussion and recommendations 66
Current IPM systems in brassica vegetable crops 66 Natural enemies and their impact on pest levels 68
Pest and parasitoid levels in the unsprayed plantings 68 Comments on pest and parasitoid levels at GRS and on farms 69
Monitoring and threshold levels 72 Monitoring techniques 75 Interpretation of threshold levels 77 Monitoring guidelines for southern Queensland 78
Resistance management and insecticide selection 80 Extension and implementation issues 82
Barriers to implementation 84
References 87
Appendices 92

1
Industry Summary
Insecticide resistance in the diamondback moth (cabbage moth) has led to spray failures and crop ploughouts in most states of Australia. Results from this project reduce reliance on conventional insecticides by offering some alternative methods for managing pests in broccoli, cabbage and cauliflower crops. Trial work included: • a series of demonstration plantings at the Gatton Research Station, Queensland • testing of methods on commercial properties • unsprayed plantings at the Gatton Research Station to investigate pests levels and activity
of caterpillar parasites (parasitoids) in the absence of insecticides A range of extension activities were organised in conjunction with this trial work.
Results from unsprayed plantings • Work showed that unsprayed brassica crops were under almost constant challenge from a
suite of caterpillar pests throughout the year. Although the composition of pests varied, with certain species being more abundant at different times of the year, rarely were brasssica crops free of caterpillars.
• Cabbage cluster caterpillar and cabbage centre grub were shown to be particularly abundant and little influenced by parasitoids. Moreover, they were generally abundant at the start of the brassica season in the Lockyer Valley, at a time when crops were most vulnerable to their damage.
• Diamondback moth (cabbage moth) and cabbage white butterfly were more influenced by parasitoids, but these were not capable of reducing pests below damaging levels.
Components of an integrated pest management system (IPM) • A summer break in production is now an established practice in the Lockyer Valley and
helps to reduce carryover of pests from one season to the next. Where a summer production break is not feasible eg. the Granite Belt region, siting blocks of plantings on different parts of the farm or on different farms can help to break the pest cycle.
• Improved crop hygiene can reduce the risk of pest outbreaks. Crop residues should be incorporated immediately after harvest and crops where diamondback moth is out of control should be destroyed.
• The biological insecticide Bt (presently sold as DiPel Forte®, MVP®, Biobit®, Delfin®) should be used for managing low levels of pest outbreaks. This product is specific for controlling caterpillar pests such as diamondback moth, cabbage white butterfly and cabbage cluster caterpillar but is safe to natural enemies such as parasitoids.
• Monitoring crops for pests will assist in making spray decisions and improves spray timing and insecticide selection. A pocket booklet to assist growers with identification of pests and natural enemies will be available by the end of 1996. This booklet includes action threshold levels and hints on developing a monitoring procedure.
• Strategic insecticide sprays and judicious use of conventional insecticides reduce resistance pressure on insecticides and should increase the long term usefulness of these products for dealing with serious pest outbreaks.
• Application equipment and technique should be checked regularly as spray failures are often associated with poor crop coverage.
More detail on the IPM system in brassica crops can be obtained from the DPI at Gatton. Please specify your area of interest when requesting information.
Fax: (074) 62 3349 Mail: PO Box 245, GATTON QLD 4343

2
Technical summary
Insecticide resistance in the diamondback moth (DBM) has been recorded in most states of Australia, with resistance problems contributing to spray failures and crop ploughouts in Queensland. Results from the project reduce reliance on conventional insecticides by offering alternative methods for managing pests in broccoli, cabbage and cauliflower crops. Trial work included: • a series of demonstration plantings at the Gatton Research Station • testing of methods on commercial properties • unsprayed plantings at the Gatton Research Station to investigate pests levels and activity
of parasitoids in the absence of insecticides A range of extension activities were organised in conjunction with this trial work.
Current IPM system in Brassicas
Most growers in Southern Queensland use some form of IPM system although the number of techniques incorporated varies from farm to farm.
Production breaks and crop hygiene A summer production break was developed in an earlier project but continued to be promoted as part of this HRDC project. It is now a well established practice in the Lockyer Valley. Crop hygiene practices such as destroying crop residues immediately after harvest, keeping headlands free of weeds and avoiding double cropping are less entrenched practices. Destroying crops where DBM is unmanageable was also advocated within the IPM system.
Monitoring and action threshold levels A procedure for monitoring brassica crops was developed and guidelines for making spray decisions will be made available to growers in a pocket booklet for identifying pests and natural enemies. On-farm trial work showed that action thresholds documented by consultants are more conservative than those frequently used on farms.
Thresholds are influenced by a number of factors including a grower's attitude to risk. Inadequate sample size at low pest densities, ie. at action threshold levels; is a problem in interpreting monitoring results. Time costs often prevent crop scouts from increasing the sample size and spray decisions are usually made in an atmosphere of uncertainty. However, monitoring is particularly useful for improving selection and timing of insecticide applications once a spray decision has been made.
Critical crop growth stages include buttoning of broccoli, curd formation of cauliflower and the seedling stage of all brassica vegetable crops. For cabbage, a critical crop stage was not as clear cut although head closure and early head fill appear to be a particularly vulnerable.
Resistance management and insecticide selection Results from the HRDC project v/0021/rl (Hargreaves 1996), were incorporated in a technical leaflet "Checklist for managing cabbage moth (DBM)". This leaflet was used at extension activities associated with this project and included information on spray application and

3
insecticide selection. Final results from the project will be used to update and expand the checklist.
Collections of pests and parasitoids from unsprayed plantings
Diamondback moth, Plutella xylostella, and cabbage white butterfly, Pieris rapae In contrast to studies in NSW and Victoria, neither diamondback moth nor cabbage white butterfly were the dominant pests at Gatton. This lack of dominance accords with unpublished data from Ormiston, 100 km to the east of Gatton.
The importance oiDiadegma semiclausum in influencing diamondback moth numbers; and Cotesia glomerata to influence cabbage white butterfly accords with other workers. However, the absence of Cotesia plutellidae from collections is curious in view of its earlier release in this state and its presence in southern collections. By contrast, Apanteles ippeus was present at Gatton, but not in some southern collections.
Cabbage cluster caterpillar, Crocidolomia pavonana, and cabbage centre grub, Hellula hydralis No parasitoids were recovered from cabbage centre grub larvae. Moreover few parasitoids were collected from cabbage cluster caterpillar larvae, in spite of cabbage cluster caterpillar being the dominant species in the caterpillar complex. This lack of control accords with overseas experiences, implying little potential for biocontrol from parasitic wasps.
Cluster caterpillar, Spodoptera litura, and heliothis, Helicoverpa spp. The sporadic incidence of these pests resulted in low numbers collected. In view of the range of parasitoids recorded for these species in other crops, the low incidence of parasitism shown at Gatton may be an underestimation.
Implementation issues
Development and implementation of IPM was an important component of the project. A range of techniques were used including action learning and adult education principles to structure on-farm field days. The project contributed to the following outcomes: • Bt use has continued to increase steadily with the chemical industry actively pursuing the
vegetable market • A production break is well established over summer in the Lockyer Valley • An increasing number of growers employ a crop scout • Many growers are aware of the potential usefulness of natural enemies and can recognise
Diadegma in the field. • Grower cooperators are keen to continue on farm trial work. Their efforts will be
supported under the auspices of a project "Improving IPM in brassica vegetable crops in China and Queensland", funded by the Australian Centre for International Agricultural Research (ACIAR) from July 1995 to June 1998.

4
Recommendations
Extension/adoption by industry
Encourage use of on-farm trial work as a development and extension tool as IPM techniques such as monitoring and action thresholds require extensive testing under commercial conditions. Rigour of on-farm trial work could be improved by facilitating the concept of control plots amongst the farming community.
Action learning and adult education principles should be incorporated in development and implementation work to encourage industry participation, ownership of problems and solutions and to empower farmers to develop skills, knowledge and aspirations which are of value to the farming enterprise.
Lobby industry to integrate new conventional insecticides within the IPM system rather than as a replacement for IPM. Availability of pesticides with high efficacy against pests, particularly DBM, will assist in overcoming a major barrier to implementation of IPM, ie. the reduction of insecticide use in an atmosphere of uncertainty.
Directions for future research and development
Action thresholds should be considered as guidelines only as they appear more useful as a concept (ie. low levels of pests are acceptable in a crop) than a fixed technique for making spray decisions. The dilemma of sample size vs cost considerations should be addressed by investigating tools which will improve monitoring accuracy at low pest densities eg. pheromone/sticky traps and the use of climatic data to predict pest outbreaks.
More information is needed to improve insecticide selection within the IPM system viz. which insecticides are most suitable for a particular circumstance; resistance levels in DBM and heliothis; the toxicity effects of insecticides on natural enemies; and a greater understanding of pest, parasitoid and predator biology with respect to timing of insecticide applications.
Egg parasitoids were not monitored during this study. Data on natural background parasitism of eggs would be useful, especially in view of the commercial availability of Trichogramma nr brassicae for innundative release.
With the process of developing insecticides for brassica areas in Australia, attention should be given to the control of all of the caterpillar species in the pest complex, not only the more cosmopolitan diamondback moth and cabbage white butterfly.
The importance of cabbage centre grub and cabbage cluster caterpillar in early season crops needs to be acknowledged, particularly in view of the lack of parasitism reported in this study. The damage potential of cabbage centre grub on commercial properties requires further elucidation and alternative control methods which are non disruptive to natural enemies (particularly those that impact on DBM populations), should be investigated.

5
The effect of temperature on the intrinsic rate of natural increase of Cotesia plutellidae and Apanteles ippeus may explain the regional displacement of these two parasitoids. Queensland researchers should continue to liaise with their southern colleagues by exchanging information and expertise on parasitoids.
The smaller sample size of diamondback moth and cabbage white butterfly is a constraint to interpreting parasitism levels compared to southern collections. In future work such as the ACIAR project, this limitation could be overcome by taking extra samples when pest populations are high.
Spray application and crop targeting issues require further investigation. Little specific work has been undertaken on brassica vegetable crops in Queensland, but our work suggests that poor application is often a serious contributing factor to spray failures.
A project funded by ACIAR will address a number of these issues including spray application and targeting, toxicity of insecticides to natural enemies, studies of selected pests and their natural enemies, pheromone/sticky traps work and on-farm development and implementation work.
Financial/commercial benefits
The Queensland brassica vegetable industry is worth in excess of $25M per annum at the wholesale market. Cabbage and cauliflower have been grown for a number of years; but broccoli production has markedly expanded over the past 15 years, with an increasing percentage of the crop destined for the export markets of South East and North East Asia. Potential pest costs to the industry have been estimated at $3.5M (Deuter pers comm). Efficient pest management systems which minimise the use of conventional insecticides are particularly important for protecting our export markets.
The structure of the project, with its focus on extension and trial work under commercial situations, has facilitated the evaluation and adoption of project outcomes by industry. Techniques which have been largely incorporated into brassica production systems in Queensland include a production break, use of the biological insecticide Bt, pest scouting and strategic use of insecticides within a resistance management framework. There is also an increased awareness of the importance of good spray application in avoiding spray failures. The role of natural enemies in suppressing pest populations is also appreciated by an increasing proportion of the industry. These techniques have reduced input of conventional insecticides.
Growers that use IPM concepts tend to reduce spraying frequency earlier in the season, tend to substitute Bt for conventional insecticides at low pest pressures, aim to not spray for extended periods in winter and selectively spray at risk plantings. This reduces the overall input of conventional insecticides in the short term, although patterns will vary from season to season, depending on pest pressures. In the long term, IPM extends the periods when nil or few insecticides are applied and this encourages greater biodiversity in the farm's ecosystem.

6
Acknowledgments
This project would not have been possible without the generous assistance of a number of local brassica vegetable growers who allowed us to monitor and sample their crops. We are particularly indebted to Kevin Niemeyer, Merv Hodges, Gary and Cathy Harm, Don Jull and Trevor Niebling for their time, support and patience with trial work on their farms.
Thank you also to two local crop scouts, Julian Winch and Justin Kelly (Plant Pro, Toowoomba) for their diligence and support. We are also grateful to Dave Schofield (farm manager) and his staff for maintaining the demonstration plantings at the Gatton Research Station (GRS) for us.
Thank you to Dawn Morrison (Scientific Assistant, GRS) for her very competent technical assistance, Bronwyn Houlding (EPM scientist, CRC for Tropical Pest Management UQ) for her technical critique of the draft document, Peter Hughes (Senior Agronomist, DPI - Centre for Pesticide Application and Safety, Gatton College) and Craig Henderson (Senior Horticulturist, Gatton Research Station) for their contribution to farm field days, and Dr Marlene Elson-Harris (Taxonomist, DPI Indooroopilly) for assistance with parasitoid identification.
The financial support by the Queensland Department of Primary Industries (QDPI), the Queensland Fruit and Vegetable Growers (QFVG) and the Horticultural Research and Development Corporation (HRDC) is gratefully acknowledged.

7
TECHNICAL REPORT
Introduction
The Queensland brassica vegetable industry is centred in the southern part of the state and comprises broccoli, cabbage, cauliflower, brussels sprouts and Chinese cabbage. The Lockyer Valley and Eastern Darling Downs provide the majority of the autumn/winter crop with summer production mostly restricted to the Southern Highland area around Stanthorpe. Smaller areas of crop are grown in the coastal areas of Redland Bay, Gympie and Bundaberg.
Pieris rapae (L.)(CWB) and Plutella xylostella (L.)(DBM) have long been regarded as the major pests of cultivated brassicas in Queensland. While this may have been true for the traditional winter croppings of cabbages up to the late 1960's, changes in culinary tastes and availability of improved cultivars has led to a year round demand for brassica vegetables. As a result, the traditional winter growing season has been extended into the warmer months (Heisswolf and Deuter 1992).
With this extended production season has come a change in composition of the suite of caterpillar pests attacking brassicas. A range of parasitoids have been recorded for DBM (Yarrow 1970) and CWB (Hassan 1976) in Queensland but their control is generally insufficient to contain pests below damaging levels. Little information is available on the incidence of parasitoids in the other pest species which may often occur in concert with DBM and CWB.
Year round production also appears to have played a critical role in the development of insecticide resistance in DBM. Field resistance to diazinon was noted in 1977 (Hargreaves and Cooper 1978) and pyrethroid resistance was documented by Wilcox (1986 unpublished). Widespread spray failures and crop ploughouts in 1985/86 led to the development of a resistance management strategy, the three valley strategy (3 V Strategy), which was launched in August 1988 (Deuter 1989).
A resistance monitoring program was also initiated by the Department of Primary Industries in 1988. DBM populations from three discrete growing areas (Lockyer Valley, Redlands, Granite Belt) in Queensland were tested for resistance to several insecticides between 1988 and 1992. These studies showed that a number of insecticides were no longer effective against DBM (Hargreaves 1996). This DBM control crisis laid the foundations for Integrated Pest Management (IPM) in brassicas and made the search for alternatives to conventional insecticide sprays an industry priority.
Brassica vegetable production is well suited to IPM for several reasons. Resistance problems in DBM made the chief management tool, application of conventional insecticides, largely ineffective in some seasons. Major brassica diseases in Queensland are bacterial ie. chemical control measures are of limited use with preventative and cultural methods important techniques for disease management. These techniques may complement EPM systems for insects.

8
Lastly, the most important pests of the crop are a suite of lepidopterous species including: • Plutella xylostella - diamondback moth (DBM), cabbage moth • Crocidolomia pavonana - cabbage cluster caterpillar (CCC) • Hellula hydralis - cabbage centre grub (CG) • Helicoverpa spp. - heliothis (also known as tomato grub or corn earworm) • Spodoptera litura. - cluster caterpillar (CC) • Pieris rapae- cabbage white butterfly (CWB) Bacillus thuringiensis (Bt), a biological insecticide specific to lepidopterous insects, can be used to replace or complement conventional insecticides in many instances.
Aphids such as Brevicoryne brassicae and Myzus persicae can be troublesome particularly in seedlings and in brussels sprouts crops. Strategic use of pirimicarb, an insecticide that is relatively safe to natural enemies, combined with naturally occurring predators and parasites of aphids generally give sufficient control over this pest.
This HRDC project aimed to reduce dependence on conventional insecticides by further developing IPM strategies in brassica vegetable crops. It's objectives were: • to refine IPM techniques • to validate and modify action threshold levels currently used in broccoli, cauliflower and
cabbage crops • to document the importance of local parasitioids in reducing pest populations • to provide opportunities for growers and industry to assess the practicality of incorporating
IPM techniques into their farming systems • to publish results in grower oriented extension material, project reports and at appropriate
scientific forums An important aspect of the project included the promotion of IPM concepts to industry and encouraging implementation of IPM strategies through a comprehensive extension program.
Sue Heisswolf, Extension Horticulturist DPI Gatton coordinated demonstration plantings at GRS, on farm trial work and extension activities with assistance from Peter Deuter. John Hargreaves, Senior Entomologist DPI Redlands, with assistance from Larry Cooper, was responsible for the pest and parasitoid work in unsprayed plantings at Gatton Research Station (GRS).
Literature review
DBM is a cosmopolitan pest. Conference proceedings (Talekar 1992) of the most recent Diamondback moth workshop organised by the Asian Vegetable Research and Development Centre (AVRDC) gives a comprehensive review of current research and development in managing this pest. A brief summary of Australian work directly relevant to IPM in brassica vegetables follows.
Insecticide resistance The insecticide resistance management strategy launched in southern Queensland in 1988 involved rotation of insecticide groups by exclusion (Deuter 1989). It was widely publicised,

9
had widespread industry support and achieved an initial implementation rate of 70% (Heisswolfl992).
While the strategy was no longer in use by 1990, management techniques which evolved from the strategy laid the foundations for an IPM system in brassica vegetable crops in southern Queensland (Heisswolf 1992). The most significant of these practices is a production break over summer in the Lockyer Valley, but improved insecticide application techniques, use of Bt, and pest monitoring are also important components of the system (Heisswolf 1992).
Resistance monitoring In Queensland, insecticide resistance levels in DBM have been monitored extensively by the Department of Primary Industries (QDPI) since 1988 (Hargreaves 1996). The University of Queensland, Gatton College has also been recording resistance levels for several years (Hassan pers. comm.). In the southern Australian states, insecticide control failures were recorded in South Australia (1991), New South Wales (1993), Victoria (1993), Tasmania (1995) and Western Australia (1995) and resistance to synthetic pyrethroids has been detected in populations of DBM in all states (Endersby pers. comm.).
Topical application was the technique chosen for the insecticide resistance studies in Queensland. Techniques and results are discussed in the HRDC final project report V/0021/R1 (Hargreaves 1996). Results from this study have been incorporated in the current IPM system and reference to this work will be made in the discussion section of the report.
Monitoring and action threshold levels A number of researchers have investigated the use of action threshold levels. In Australia these include Baker (1984), Heisswolf and Deuter (1991) and Endersby et al. (1992). A more detailed review of a selected range of action thresholds is outlined in the discussion section of this report.
Biological control Hamilton (1979) and Endersby and Morgan (1991) give accounts of parasites and diseases of brassica pests in Australia. Yarrow (1970) and Hassan (1976) give some information on parasitoids in Queensland.
Investigations on the seasonal abundance of pests and their parasitoids are continuing in Victoria (Endersby pers. comm.), New South Wales (Rajakulendran, pers. comm.), South Australia (Keller pers. comm.) and Queensland (as part of an ACIAR project). The South Australian group at the University of Adelaide, Waite campus, is also investigating innundative release of the DBM parasitoid Cotesiaplutellae.
Use ofBt Comprehensive summaries of Bt use in Australia have been prepared by Teakle (1991) and Rajakulendran (1993). Studies on Bt use in brassica crops were conducted by Heisswolf and Deuter (1991) and Endersby et al. (1992). Bt has become an important component of IPM in brassicas in southern Queensland (Heisswolf 1993) and its use has also increased substantially in Victoria over the last year or two (Endersby pers. comm.).

10
At present, only Bacillus thuringiensis var. kurstaki (Btk) is available to Australian vegetable growers. Bacillus thuringiensis var. aizawai (Bta), a strain of Bt used for resistance management in South East Asia, should become available in Queensland in the next year or two.
Intercropping The usefulness of companion planting has been investigated in the Lockyer Valley by Heisswolf and Deuter (1991), at Frankston by Endersby (pers. comm.) and at Hawkesbury by Hunold and Haigh (1990 unpublished) but so far these trials have given inconclusive results.

11
Materials and methods
The basis of the project was: • a series of demonstration plantings at the Gatton Research Station (GRS), Lawes, South
East Queensland, • plantings of unsprayed brassica crops at GRS, • and a series trials at local grower properties. The season for brassica vegetable production in the Lockyer Valley is from February to October and we were able to complete four seasons of trial work. Our schedule was:
Year GRS plantings On farm monitoring GRS unsprayed plots 1992 cauliflower broccoli Continuous plantings 1993 cabbage cauliflower from September 1992 1994 - cabbage and broccoli to October 1995 1995 - cabbage, cauliflower, broccoli
Due to the vagaries of doing on farm trial work, we were unable to always achieve our ideal. For instance, broccoli work from 1992 is incomplete due to difficulties with our crop scout and a change in crops (due to drought or economics) forced us to change farms several times. These difficulties were offset by the commitment of grower cooperators to achieving real progress in developing IPM systems.
Collections of pests and parasitoids were made from unsprayed plantings at Gatton Research Station. Data from this plot shows changes in pest populations and the incidence of parasitism in a natural population. These unsprayed plantings also served as a quasi-control plot for the other work.
Demonstration plantings at the Gatton Research Station
These plantings provided preliminary observations on pest dynamics, action thresholds, critical crop growth stages and shelterbelts. They were also used for extension purposes. Three plantings of cauliflower were made in 1992 and three plantings of cabbage in 1993. Preliminary work on broccoli was completed in 1990/91 at GRS, funded by QDPI.
In each planting, three treatments were evaluated:
Treatment Al: Applications of Bt or a synthetic insecticide according on monitoring results
Treatment A2: Applications of Bt according to monitoring results with conventional insecticides used only to prevent crop failure
Treatment B: Applications of conventional insecticides according to monitoring results
Each treatment consisted of 9 double rows on raised beds, each 20m in length (270m2 of crop). In Treatments Al and A2, the outer double rows were planted to a shelterbelt. In Treatment B these rows were planted with additional crop to form guard rows. Taking into consideration

12
guard rows at either end of treatments, each treatment provided about 310 plants for sampling and assessment. Details of block layout are included in Figure 1 in Appendix 1.
Shelterbelts These were to act as a shelter and food source for wasp parasitoids and other natural enemies of brassica pests. Intercropping cabbage with barley (Hordeum vulgare), oats (Avena sativa) and dill (Anethum graveolens) was reported as potentially useful by Talekar et al. (1986). Canola (Brassica napus) was included to provide a food source for Hymenomptera species (Dunmall 1989 unpublished).
Work with broccoli interplanted with rapeseed and dill at GRS in 1990/91 had given some encouraging results (Heisswolf and Deuter 1991). In these earlier trials, shelterbelt plants were transplanted two to three weeks prior to planting of broccoli to ensure that flowering of the shelterbelt commenced early in the crops life. This system proved cumbersome and unlikely to be of practical value to a commercial grower. Dill also did not seem to be of value in the system.
In the 1992 cauliflower trials, a mixture of barley and rapeseed was direct seeded three to four weeks prior to transplanting the crop. Problems with establishment of canola and barley were encountered and benefits of using the shelterbelt were inconclusive. In the 1993 cabbage trials, a mixture of cereals - barley, oats, triticale (XTriticosecale)&nd wheat (Triticum aestivum) was sown three to four weeks prior to planting the crop. This mixture was to act as a short term wind break. Barley and oats had been mentioned by French and White (cited Talekar et al. 1986) as a barrier to DBM movement, but a less windy crop canopy might also provide a more suitable environment for natural enemies. Triticale and wheat were included to ensure a good crop stand of shelterbelt at all three planting times. A summary of planting dates and results is given in Table 1 in Appendix 1.
Monitoring Ten plants were monitored for pests in each treatment twice per week. Plants were chosen at random and the whole plant was inspected. Details of pest species, abundance and life stage (egg; small, medium and large larva; and pupa) were recorded.
Observations on DBM adult activity, evidence of pest damage and activity of natural enemies were also noted. In the seedling stage, hearts of the two plants adjacent to the sample plant in the row were inspected for signs of CG activity. A total of 30 plants per treatment was therefore monitored up to 3 weeks post transplant. This system is used by local crop scouts in autumn when CG is active.
Action threshold levels Action threshold levels were discussed at the beginning of each season and sprays were to be applied strategically using these thresholds as a guide. Thresholds were based on those provided by local crop scouts.

13
Threshold levels for cauliflower and cabbage DBM 5 to 10 eggs/10 plants
2 to 4 small larvae/10 plants CG 1 larva or damage ] in all plants CCC & CC 1 egg raft ] inspected CWB & Heliothis add to DBM counts
At critical crop growth stages, the lower threshold was to be used. These critical crop growth stages were: • seedling (up to 3 weeks post transplants) • head closure and early head fill of cabbage (cupping of inner leaves and start of head
formation - about 5 to 7 weeks post transplant depending on season) • start of curd formation in cauliflower (time from transplanting to buttoning varies with
variety and season) We also decided to take more risks in Treatment A2 (Bt treatment) by using the higher threshold numbers as growers who have substantially reduced pesticide use tend to tolerate higher pest levels in crops.
Selection of insecticides General principles for deciding on an insecticide were as follows: • Treatment Al - Bt at the threshold level, with a conventional insecticide used for pest
counts substantially above action thresholds or high incidence of CG or aphids. • Treatment A2 - Bt except for serious pest outbreaks which threatened crop failure -
endosulfan (particularly against CG) then pyrethroids or organophosphates to save the crop.
• Treatment B - rotation of insecticides groups according to recommendations for resistance management and pest levels
Assessment at harvest At maturity, 10% of each planting was harvested, weighed and assessed for marketability, degree of insect damage, and presence of insects. For this inspection, heads were stripped of wrapper leaves and cut in half to look for pests at leaf bases (cabbage) and in florets (cauliflower).
Unsprayed plantings at the Gatton Research Station
Sixteen successive broccoli crops were grown at GRS between September 1992 and October 1995. Each planting comprised 600 plants of commercial cultivars (cultivars varied with each season, but were primarily "Pacific" for winter and "Bonanza" for summer). Seedlings were grown initially in soilless mixtures in Speedling® trays at the Redland Research Station (RRS), and later transplanted into a prepared area at GRS.
Spacings were 0.3 m between plants within the row, the ten rows of the planting each being 1 m apart. The plants were fertilised as per commercial practice, but no insecticides, fungicides or herbicides were applied.

14
Ten plants were cut randomly at ground level each fortnight and collected into several large cotton bags. The individual plants were then examined for the presence of caterpillars of all species as well as the pupae of CWB and DBM Last instar caterpillars and the pupae of CWB and DBM were grown through in a laboratory incubator, (ambient - 27°C), to determine parasite emergence.
Meteorological data were collected from a recording station which immediately adjoined the area used for the unsprayed plantings.
On farm trial work
Our aim was to monitor and assess two plantings of a commercial brassica vegetable crop on three different properties each year; broccoli in 1992, cauliflower in 1993 and cabbage in 1994. In each year, we endeavoured to work on three farms where the owners generally approached pest management in one of three ways:
High risk Pests are largely managed with strategic applications of Btk according to pest levels - farmer willing to take high risks
Medium risk: Pests are managed with strategic applications of Btk or synthetic insecticides depending on pest level - farmer willing to take some risk
Low risk Pests are usually managed with synthetic insecticides either as a scheduled spray or strategically depending on pest level - farmer unlikely to tolerate any pests in the crop
Each farm was to reflect one of the treatments we had previously investigated at GRS. To select farms for the different treatments, we approached growers that we thought would be willing to cooperate, spoke to them at length about how they managed their pests, their willingness to take a risk, and the pesticides they had used to manage pests in the last year or two. The description of risk used for individual farms was a subjective judgement and in several instances we had to revise a farm's classification once work had started.
In response to comments made by growers and crop scouts, we increased the number of plantings monitored each season per farm in 1994 and 1995. This gave a more realistic representation of monitoring trends over the season for the different farms.
In an attempt to reduce variability to some degree, our ideal was to stay on the same three farms or at least the same localities throughout the three seasons, but this was not possible. We were also unable to obtain complete results in each of the three categories of pest management in every year for the following reasons: • difficulties with our crop scout in 1992 - monitoring data for broccoli not reliable • changes in crops grown on farms due to economics (broccoli) or drought (broccoli,
cabbage and cauliflower) • changes in farming practice eg. difficulty finding a farmer not using Bt in 1993 and 1994;
increased use of crop monitoring, tendency towards greater tolerance of pests. These are of course, indicators that IPM strategies were increasingly adopted by local growers.

15
Difficulties in finding farms to fit our trial plans were offset by the commitment of grower cooperators to the project and the positive feedback on extension activities organised in conjunction with on farm trial work. While providing useful data on action thresholds, monitoring techniques and pesticide selection the strength of on-farm trial work lies in its impact as an extension tool. This will be discussed in more detail later.
A total of 53 commercial brassica plantings were monitored during our four seasons of trial work. Of these, seven were not assessed at harvest, two were abandoned due to pest outbreaks, and for another six plantings monitoring data is not reliable. A summary of trial work is provided in Table 1.
Table 1: Trial work on commercial brassica plantings in the Lockyer Valley from February 1992 to October 1995.
Year Crop Treatment No. of plantings
Data obtained
1992 Broccoli Farm A - high risk Farm B - medium risk Farm C - medium risk
2 2 2
Harvest Harvest Harvest
1993 Cauliflower Farm D - high risk Farm C - medium risk Farm E - low risk Farm E2 - low risk
2 2 1 1
Monitoring & harvest Monitoring & harvest Monitoring & harvest Monitoring & harvest
1994 Cabbage
Broccoli
Farm F - medium risk Farm G - low risk Farm H - low risk Farm H2 - low risk Farm I - medium risk
4 4 1 1 5
Monitoring & harvest Monitoring & harvest Abandoned due to pests Monitoring & harvest Monitoring & harvest
1995 Cabbage
Broccoli Cauliflower
Farm F - medium risk Farm G - medium risk Farm J - high risk Farm F - medium risk
5 7 7 5
Monitoring & harvest Monitoring & harvest Monitoring & harvest Monitoring & harvest
Monitoring Crop scouts were employed to monitor on farm trials for several reasons: • Involvement of scouts in the project would ensure that information generated would be
more quickly disseminated to industry • We would have direct access to their expertise particularly from a practical, commercial
viewpoint • By becoming a client, we could assist new crop scouts in becoming established Except for the first year of broccoli work, this approach worked well and two crop scouts are currently working in the area. Over the four years, we had to employ three different scouts, two scouts taking up alternative work. The owner of Farm G also decided to monitor his own crops in 1995. These factors, regrettably, further added variability to the on farm trial work.
In general, plantings were monitored twice per week. At each monitoring event, ten plants were chosen at random and inspected for insects. Pest species and life stage (egg; small,

16
medium and large larva; pupa) were recorded. Observations on adult DBM or CWB, and activity of natural enemies, particularly wasps and spiders, were also made. In the seedling stage during autumn, extra plants were inspected for signs of CG activity.
Action threshold levels Earlier work on broccoli and results from the cauliflower and cabbage trials at GRS indicated that pest pressures experienced at the research station were not representative of pest pressures in commercial brassica plantings. Pest counts were generally much higher at GRS than what was reported for commercial plantings, and monitoring data was of only limited use in drawing up action threshold guidelines for testing on farm.
In the GRS demonstration trials, even though we incorporated guard rows, a large percentage of the plot was affected by "edge effects". The edges of commercial plantings often have a higher infestation of pests than the remainder of the planting.
The following guidelines were developed for on-farm use. The lower range was to be considered at critical crop growth stages (seedlings, buttoning of broccoli and cauliflower, head closure for cabbage), the higher range at other growth stages. Note that values are based on counts per 10 plant.
High risk treatment Cauliflower and broccoli cabbage
4 small larvae 2 to 4 small larvae 10 eggs 5 to 10 eggs
Use Bt only unless: cutworms are active, use chlorpyrifos; CG damage exceeds 5% crop infestation, use organophosphate aphid infestation in seedlings, use pirimicarb outbreaks of Heliothis, CCC & CC, use endosulfan
Medium risk treatment Cauliflower and broccoli cabbage
2 to 4 small larvae 1 to 3 small larvae 5 to 10 eggs 5 to 10 eggs
Bt as the base program unless: cutworms are active, use chlorpyrifos; CG is active, use organophosphate aphid infestation in seedlings, use pirimicarb outbreaks of Heliothis, CCC & CC, use methomyl or endosulfan outbreaks of DBM, use pyrethroid/Btk mixture or clean up spray of mevinphos
Low risk treatment Cauliflower and broccoli cabbage
1 to 2 small larvae 1 to 2 small larva 5 eggs 2 to 5 eggs
Use Bt and/or pyrethroids and organophosphates at threshold widi: methomyl or endosulfan for Heliothis, CWB, CCC & CC mevinphos as a clean up spray, chlorpyrifos as a preventative spray for cutworms in autumn organophosphate for CG or aphids

17
Assessment at harvest At maturity, a random sample of heads was taken and assessed for marketability, level of insect damage and presence of insects. Table 2 summarises method of assessment and number of heads sampled. Heads were cut in lots often (or five in 1995) to obtain a representative sample of the planting. From the results we had obtained in 1992 to 1994, it became apparent that a smaller sample would be adequate for marketability assessments and we halved the sample size in 1995.
Table 2: Description of methods used to assess on farm plantings of brasssica vegetables.
Crop Assessment No. heads sampled Broccoli Heads taped on table (DBM larvae will drop out),
underside inspected then cut in half to look for pests in florets
1992 - 100 1994-100 1995-50
Cauliflower Wrapper leaves striped and inspected, heads inspected then cut in half and pulled apart to look for pests in florets
1993-50 1994-50 1995-25
Cabbage Outer and wrapper leaves removed and inspected, head cut in half to look for pests and internal and basal damage
1995-50 1995-25
Extension activities
EPM concepts and progress with trial work were promoted to industry and peers through a range of extension methods. These included: • a series of farm walks at the GRS demonstration plantings • field days at grower cooperators' properties • displays at horticultural field days • grower evenings/workshops • written material including technical articles, advisory notes, newspaper articles and
conference papers • radio and TV • participation at problem specification workshops
We endeavoured to make activities interesting, innovative and informative by supplying hands on material such as insect specimen, microscopes and technical notes and including demonstrations of spray equipment, monitoring, and pest identification at field days.
For two field days on growers' properties in 1994 and 1995, we used the principles of adult education and action learning for structuring activities. This involved a planning phase with grower cooperators and crop scouts to decide on field day content and format and active participation by all members of the planning team in conducting the field day.

18
Literature on adult education (Brookfield 1986, Fell 1988, Knowles 1990, Tennant 1991) describes adult learners as active participants in the learning process. Learning is stimulated by building on experience, creating an open atmosphere, allowing time for reflection and discussion and building individual or group confidence. The classroom approach should be avoided and farmers should be encouraged to help plan and participate in the educational experience. Adult education programs should serve specific needs of the participants and empower participants to find solutions to problems (Fell 1988).
Action learning is based on the learning cycle described by Kolb (1984) and involves four phases: planning an activity, experiencing the activity, reflecting on the experience and drawing conclusions from the experience. Application of these concepts to training activities is well described by Mumfprd (1993) who argues that action learning cycles can help structure training sessions to cater for the four different learning styles: pragmatist, activist, reflector and theorist.

19
Results
Demonstration plantings at Gatton Research Station
Cauliflower
DBM levels through the 1992 season are shown in Figure 1. An exceptionally high egg lay of DBM occurred in April, three to four weeks after transplanting, in the first planting of all three treatments (Figure la). These were of similar magnitude in each treatment ranging from an average of 50 to 70 eggs/plant, with Treatment Al showing the lowest, Treatment B the highest and Treatment A2 high egg counts over the shortest period. A secondary peak in DBM egg counts followed about one month later with most eggs found in Planting 2, three to four weeks after transplanting. Twice as many eggs were found in Planting 2 of Treatment B than Planting 2 of Treatments Al or A2.
For the first DBM outbreak, frequent sprays reduced small larval counts substantially in all treatments (Figure lb). Percentage of eggs developing through to the small larva stage (generally second and third instars) were 28% in Treatment Al; 18% in Treatment A2; and 11% in Treatment B. The second smaller egg lay in early May was followed by a smaller larval count in mid May.
With strategic applications of insecticides, the percentage of eggs developing into the small larvae were 28% in Treatment B, but little reduction occurred in both Treatments Al and A2. Until the end of May, small larval counts were generally well above the threshold level of 0.2-0.4/plant. Small larval counts during the first DBM outbreak were over 40 times higher than the threshold. In the second DBM outbreak, small larval counts were over 10 times higher than the threshold.
No clear trends emerge from large larvae and pupae counts after the first DBM outbreak in April, however more small larvae survived in Treatment B (Figure lc) after the second outbreak in Planting 2 and near harvest in Planting 3 than in the other two treatments.
Other pests CG was found in Treatments Al and A2 four weeks after transplanting (early April) in planting 1 but was unlikely to cause extensive damage as the critical seedling growth stage had been passed. In the second planting, only treatment Al showed a low level of CG three weeks post transplant (early May). No CG was found in the first two plantings of treatment B but several larvae were found in mid June in planting 3, four weeks post transplant.
In the first planting, CCC, Heliothis and CWB eggs were found but compared to the DBM threat, these counts were insignificant and, with frequent spraying, did not develop further. With the reduction in insecticide input after the DBM outbreaks, diversity of pest species increased in all treatments particularly in Planting 2. Little diversity was found in Treatment B after late May but in the other treatments, CC (Treatment A2) and CCC (Treatment Al) activity continued until early July.

20
Treatment A1
• Treatment A2
- Treatment B
:= 2 K Monitoring dates
Figure 1: Average number of DBM, Plutella xylostella, found in cauliflower demonstration plantings at the Gatton Research Station in 1992. (a) egg counts per plant (b) small larvae counts per plant and (c) large larvae and pupal counts per plant. Note - Treatment A1 = Bt+conventional insecticides; Treatment A2 = Bt; Treatment B = conventional insecticides.

21
Higher CWB activity occurred in Planting 2 of Treatments Al and A2 than Treatment B but by late June egg counts occasionally exceeded 1/plant in Planting 3 of all treatments. Strategic sprays gave good control of this pest.
Harvest assessment All treatments had reasonable harvest results, with the exception of the first plantings of Treatments Al and A2 and the third planting in Treatment B. Overall results are summarised in Table 3. Insecticide costs quoted are in 1993 prices. Insecticide costs give an indication of differences between plantings and treatments with regard to insecticide selection; with synthetic pyrethroids and endosulfan being the cheapest; carbamates and Bt products of medium cost; and organophosphates ranging from medium to high in price.
Table 3: Summary of harvest assessments for cauliflower demonstration plantings at the Gatton Research Station in 1992.
Planting Harvest Assessment Insecticides
Date No. Date Clean heads
Insect Rating
Av. head weight
Comments No. sprays
Approx. cost/ha
Treatment A1 - Bt and conventional insecticides 12 Mar
1 9-12 Jun 83% Low 1.9kg Some slight damage
14 $710
14 Apr
2 9-20 Jul 95% Very low 2.1kg Clean 7 $290
15 May
3 6-14 Aug 80% Low-medium
2.2kg Quite clean 4 $145
Treatment A2 - Bt 12 Mar
1 9-12 Jun 94% Very low 1.8kg Odd head with damage
12 $545
14 Apr
2 9-20 Jul 92% Very low 2.2kg Quite clean 5 $236
15 May
3 6-14 Aug 93% Very low 2.2kg Quite clean 3 $160
Treatment B - conventional insecticides 12 Mar
1 9-12 Jun 95% Very low 1.7kg Quite clean 15 $650
14 Apr
2 9-20 Jul 87% Low 2.0kg Quite clean 6 $280
15 May
3 11-17 Aug 38% Very high
1.8kg Poor crop 5 $185
Clean heads - includes heads with slight damage but excludes heads with some damage or pests Insect rating - Very high High Medium Low Very low No. insects over0.8/head 0.4-0.8/head 0.2-0.4/head 0.1-0.2/head less than 0.1/head
In the first planting of Treatments Al and A2, frequent sprays were applied against DBM but also against CG and CCC. In the second half of crop development, sprays were restricted to

22
Bt in both treatments and this appeared to give adequate control of pests as evidenced by the low pest incidence of harvested product. Crop losses were chiefly due to bacterial head rot, possibly aggravated by earlier insect damage. In Treatment Al, damage to wrapper leaves also accounted for the lower percentage of clean heads harvested, while in Treatment A2, some head damage reduced numbers of clean heads harvested. Improved targeting of sprays around buttoning of cauliflower (3-4 weeks pre harvest) may have reduced these losses.
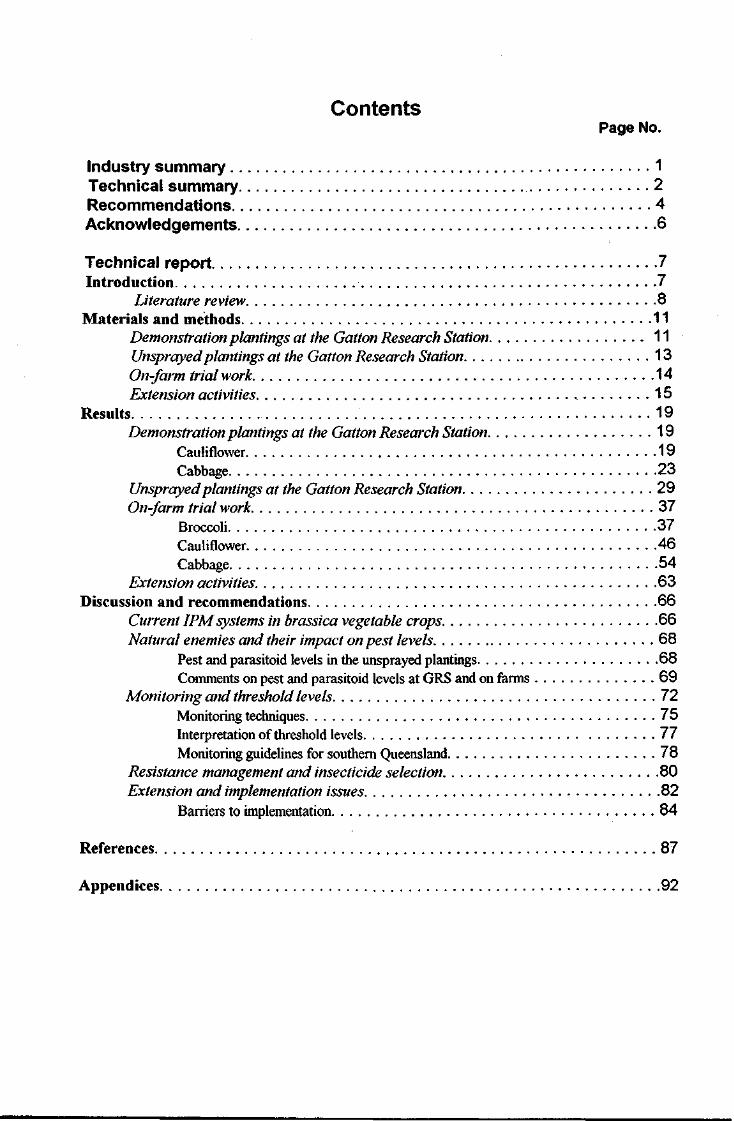
Heads from Treatment B in Planting 3 were largely unmarketable due to pest infestation. DBM pupae and larvae were found in florets in over 80% of heads. Monitoring in the latter half of the crop had not shown high levels of DBM eggs but small larval counts reached the threshold level (0.4/plant) twice in the three weeks prior to harvest (Figure 2). Large larvae and pupae counts also steadily increased during this period suggesting poor spray selection and timing.
In this planting, methomyl was applied for Heliothis and CWB egg counts three weeks prior to harvest. This product is relatively inactive against DBM (Hargreaves 1996) and a different choice of insecticide to deal with DBM may have produced a cleaner product. Sprays of esfenvalerate and mevinphos a week before harvest did not clean up DBM as by then it was too late to target larvae which had migrated into cauliflower curds (Figure 2).
I 1 CWB eggs
mm Heliothis eggs
U S ! DBM eggs
^M CWB small larvae
• • DBM small larvae
Monitoring dates
Figure 2: Planting 3 Treatment B (conventional insecticides) cauliflower demonstration planting at the Gatton Research Station in 1992; showing average number of DBM {Plutella xylostella), CWB (Pieris rapae) and heliothis (Helicoverpa spp.). Note - egg values are additive.
Pesticides applied Figure 4 shows the proportion of different insecticide groups used in the three treatments in 1992 for cauliflower and 1993 for cabbage. For cauliflower, the majority of sprays were

23
applied in the first two months of the season to combat DBM outbreaks but also CG and CCC. In Treatment B, mixtures were often applied in Planting 1. For Treatment Al, we largely relied on Bt to control pest outbreaks, choosing a conventional insecticide to deal with specific pests such as CG and CCC.
Incidence of natural enemies Observations on natural enemies were made during monitoring and these give a trend through the season. An often low density, and sporadic occurrence of natural enemies prevents us from making more than general statements on trends.
Figure 5 shows the average number of natural enemies recorded for the three treatments. The most common natural enemies were predatory or parasitic wasps and spiders. Hover fly eggs were also often recorded in number but no hover fly larvae were observed. In Treatment A2 (Bt only), the highest number of beneficials were recorded and compare favourably with observations made while monitoring the unsprayed broccoli plantings. Conventional insecticide sprays depressed activity of natural enemies in Treatment Al, but even Treatment B showed some spider and wasp activity, including early in the season when Planting 1 was frequently sprayed. We also noticed Green vegetable bugs (Nezara viridula) in Treatments Al and A2, but none were found in Treatment B. Detailed records of parasitised aphids were not kept
Cabbage
The first serious outbreak of DBM occurred much later than in the previous season, with DBM eggs not found in high numbers until mid April (In the first planting of Treatment Al a small outbreak occurred earlier in mid March). In Planting 1, DBM egg counts in April were around 1 egg/plant with the highest in Treatment Al at 2 eggs/plant, but the majority of eggs during this outbreak were found in Planting 2 which were six weeks younger than Planting 1.
Egg counts during this outbreak ranged from 7-12/plant with Treatment A2 showing the lowest counts, Treatment B the highest. All treatments suffered a secondary peak in egg lay a week to 10 days later (Figure 3a). For the remainder of the season, DBM eggs were found consistently with peaks up to 2/plant occurring occasionally in Treatments Al and A2. In Planting 2, a third high egg lay occurred in Treatment B in late June with an egg count of 14/plant.
In the third planting, egg counts remained quite high in all treatments with occasional peaks ranging from 3-7 eggs/plant (Figure 3a). No clear trends emerge in this planting. In general, Treatment B had higher egg pressure throughout the season.
Strategic insecticide applications appeared to reduce small larval counts to acceptable levels (less than the threshold of 0.4/plant) until mid April when Treatment A2 reached a larval count of 1.2 smalls/plant 11 days before harvest. Treatment Al tended to have the lowest counts with Treatment A2 tending to show higher counts than the other two treatments (Figure 3 b).

Monitoring dates Figured Average number of DBM, Plutella xylostella, found in cabbage demonstration plantings at the Gatton Research Station in 1992. (a) egg counts per plant (b) small larvae counts per plant and (c) large larvae and pupal counts per plant. Note - Treatment A1 = Bt+conventional insecticides; Treatment A2 = Bt; Treatment B = conventional insecticides.

25
Early in the season, Treatments Al and B gave similar large larvae and pupae counts, with Treatment A2 recording the lowest numbers (Figure 3c). From late May onwards, Treatment B gave the highest counts, Al the lowest, although this pattern became less distinct towards the end of the season. Treatment B tended to give the highest large larva and pupa counts overall.
Other pests CG was active in all three treatments for much of the season. Until May, counts were generally well above 0.1/plant. An unseasonable outbreak occurred in early August in Planting 3 of all treatments. Treatment A2 suffered the most consistent CG activity.
CCC egg masses were frequently found in all plantings and treatments. This pest was active until late April in treatment B and to early June in treatments Al and A2. The pest was again active from early spring onward in treatment Al and A2, but was not found in treatment B until late September.
Incidence of CC was much lower with eggs found in Treatments Al and A2 in the second half of March. No CC eggs were found in Treatment B. Some early Heliothis activity occurred in 1993 prior to the DBM outbreak in mid April. Low levels of CWB were also recorded in autumn and spring.
Harvest assessment Although DBM pressure was much lower and pesticide input was somewhat higher (particularly for Treatment A2) than in the previous year, all treatments produced a large percentage of unmarketable heads. Losses were chiefly through CG damage in seedlings and contamination by DBM. Table 4 summarises harvest results.
In the first planting, losses to CG constituted 20% in Treatment Al, 18% in Treatment A2 and 11% in Treatment B. DBM damage and contamination, and in the case of Treatment B, Heliothis damage, further reduced marketable head numbers. In Planting 2, about 10% of heads were infected with sclerotinia in Treatments Al and A2. All three treatments gave unsatisfactory results with high levels of DBM found in harvested product. In Planting 3, only Treatment Al produced reasonable heads although a high level of DBM and CCC occurred in harvested product. Treatments A2 and B both produced poor heads with high levels of DBM contamination.
For all three plantings, Treatment A2 produced the smallest heads. We suspected loss of vigour caused by an aphid infestation of seedlings to be the explanation but only in Planting 2 and 3 did Treatment A2 have consistently higher aphid counts than the two other treatments. In Planting 1, this trend was not obvious although it produced the smallest heads for the season.
Insecticides applied Figure 4 illustrates pesticide use patterns for the three treatments. In Treatment A2 organochlorines (endosulfan) and carbamates (methomyl) were applied specifically against CG and CCC in the seedling stage to prevent crop failure.

26
Table 4: Summary of harvest assessments for cabbage demonstration plantings at the Gatton Research Station in 1993.
Planting Harvest Assessment Insecticides
Date No. Date Clean heads
Insect Rating
Av. head weight
Comments No. sprays
Approx. cost/ha
Treatment A1 - Bt and conventional insecticides 15 Feb
1 30 Apr 25% Very high
2.8kg Poor - 42% not marketable
10 $320
29 Apr
2 30 Jul 43% High 2.6kg Little damage but 31% unmarketable
10 $430
15 Jul
3 21 Sep 32% High 3.2kg Reasonable with 7% unmarketable
10 $300
Treatment A2 - Bt 15 Feb
1 30 Apr 21% Med-high
1.5kg Very poor with 70% not harvested
9 $280
29 Apr
2 30 Jul 10% Very high
1.9kg Damage - with 40% unmarketable
15 $490
15 Jul
3 21 Sep 7% Very high
2.8kg Unmarketable block 10 $370
Treatment B • conventional insecticides 15 Feb
1 30 Apr 57% Med-high
2.4kg Poor with 36% crop not harvested
10 $390
29 Apr
2 30 Jul 14% Very high
2.9kg Damage at base - 40% unmarketable
13 $425
15 Jul
3 21 Sep 25% Very high
3.6kg Just marketable with damage at base
11 $395
Clean heads • includes heads with slight damage but excludes heads with some damage or pests Insect rating - Very high High Medium Low Very low No. insects over0.8/head 0.4-0.8/head 0.2-0.4/head 0.1-0.2/head less than 0.1/head
Incidence of natural enemies As in the cauliflower plantings in 1992, the main beneficials found were spiders, predatory and parasitic wasps, and hover fly eggs. Average counts however were much higher in cabbage in 1993 than in cauliflower in 1992 for comparative treatments in the two years (Figure 5).
In cabbage, Treatment A2 gave the highest overall counts, but wasp and spiders numbers are only marginally lower in Treatments Al and B (Figure 5). Spider and wasp averages in these two treatments compare favourably with Treatment A2 for cauliflower in 1992, although pesticide use patterns were not substantially different in treatments between the two years and cabbage was sprayed more frequently than cauliflower (Figure 4). Monitoring observations of two plantings of the unsprayed plot at GRS are included for comparison.

i Organochlorines
Em Carbamates
D Pyrethroids
• Organophosphates
• Bt
Treatment B Treatment A1 Treatment A2
< Cabbage 1993
Treatment B Treatment A1
Cauliflower 1992 • Treatment A2
Treatments
Figure 4: Insecticide use patterns in the different treatments of the cauliflower and cabbage demonstration plantings at the Gatton Research Station in 1992 and 1993.
200.0
O)
« Q.
150.0
o 100.0
a> O)
a>
3 50.0
^ Predatory bugs
W Lacewing
m Ladybeetle
D Hoverfly eggs
• Wasps
• Spiders
Treatment B Treatment A1 Treatment A2 Unsprayed Treatment B Treatment A1 Treatment A2
•4— Cabbage 1993 Broccoli 1993 Cauliflower 1992 — •
Treatments
Figure 5: Comparison of average numbers of natural enemies found in the cauliflower and cabbage demonstration plantings at the Gatton Research Station in 1992 and 1993.

28
Why are higher numbers of natural enemies found in cabbage than cauliflower? It may be a seasonal effect with 1993 cabbage providing a more abundant food source (a higher number of pests survived spraying). The architecture of cabbage may also provide more protected sites for natural enemies (and pests) than cauliflower. The poor level of control achieved over pests in 1993 when compared to 1992 (when pest pressure was much higher) tends to suggest that spray targeting is inadequate in cabbage and may be the best explanation for the higher survival of natural enemies in frequently sprayed plots.
Shelterbelts At farm walks, shelterbelts created interest amongst industry and several growers tried using this concept in their crop. One farmer transplanted dill with his broccoli crop for one season and several farmers planted broccoli among cauliflower and let it go to flower.
Our observations showed that natural enemies such as hover flies, various hymenoptera and ladybeetles did colonise shelterbelts to some extent. Brassica pests, particularly CG and CCC were also frequently observed in high numbers on canola in the first two plantings in 1992. High numbers of these pests were also noted in crop rows immediately adjacent to shelterbelts and petals from canola flowers contaminated crop plants in these rows.
Pest incidence, contamination of crop by canola petals and lack of obvious benefit were the reasons we abandoned canola as a shelterbelt plant in 1992. Observations made when using the cereal mix in the 1993 shelterbelts also did not convince us that shelterbelts were worth pursuing in on-farm trial work. Apart from further complicating on-farm trial work, we did not want to risk nurturing a potentially damaging mouse population on local farms.

29
Unsprayed plantings at Gatton Research Station
Plutella xylostella DBM was abundant each year during the spring and also in autumn (Figure 6). In 1993, the autumn population reached a maximum of 3.4 larvae/plant in April and populations uncharacteristically continued into winter with population peaks of 3.4 larvae/plant in June and 4 larvae/plant in July.
Population highs of 2.8 larvae/plant were recorded in September 1993 but declined until April 1994 when a maximum of 13.4 larvae/plant was recorded. Populations again declined during the winter to reach highs of 3.8 larvae/plant in November and 4.4 larvae/plant in April 1994.
4
1992-93
o 13.4
1993-94
o 4.4
1994-95
o O N D J F M A M J J A S
Months of Year
Figure 6: Number of larvae of Plutella xylostella collected from unsprayed plots of broccoli at the Gatton Research Station.
DBM was parasitised by Diadegma semiclansum (Hellen), Diadegma rapi (Cameron), (Hymenoptera : Tchneumeodiae); Apantales ippeus Nixon (Hymenoptera : Braconidae); Ceraphronfijiensis Ferr. (Hymenoptera : Ceraphronidae); Oomyzus sp. (Hymenoptera : Eulopidae); Brachymeriaphya (Walk.), Brachymeria sp. (Hymenoptera : Chalcididae).
Ujw
J I i \ I . I __] I L

30
Table 5: Parasitism of Plutella xylostella, Gatton Research Station
Oct Nov Dec Jan Feb Mar Apr May 1992-1993 No. pupae 24 5 12 32 30 - 47 22 % parasitism (1) 58 80 17 0 10 - 36 27 % parasitism (2) 0 0 0 0 0 - 0 0 % parasitism (3) 0 0 0 0 0 - 0 0 % parasitism (4) 0 0 0 0 0 - 2 0 total parasitism (%) 58 80 17 0 10 - 38 27
1993-1994 No. pupae 22 14 11 54 42 40 49 158 % parasitism (1) 9 43 9 6 2 48 63 79 %parasitism (2) 9 0 18 4 0 % parasitism (3) 0 0 9 0 2 0 0 0 % parasitism (4) 0 0 9 0 0 0 3 0 total parasitism (%) 18 43 45 10 4 48 66 79
1994-1995 No. pupae 1 37 27 17 81 66 185 188 % parasitism (1) 0 46 67 6 10 0 16 19 % parasitism (2) 0 0 0 6 6 2 51 33 % parasitism (3) 100 0 0 0 0 0 1 1 % parasitism (4) 0 3 0 0 0 0 29 10 total parasitism (%) 100 49 67 12 16 2 68 53
1995 No. pupae 23 % parasitism (1) 35 % parasitism (2) 0 % parasitism (3) 0 % parasitism (4) 0 total parasitism (%) 39 (1) by Diadegmct semiclausum (3) by Diadromis collar is

31
The dominant parasitoid was Diadegma semiclausum with parasitism ranging from 10-79% (average 31.6%)(Table 5). D. rapi was bred from 4 pupae only, one each in March and May 1994 and two in April 1995. Apanteles ippeus was bred out sporadically, averaging 7.8% parasitism. Diadromus collaris was bred only from 9 pupae (average 0.6%). The tiny Ceraphon fijiensis and Oomyzus sp. together averaged 3.1%. Brachymeria phya (Walk.) and a Brachymeria sp. averaged 0.5% and 0.1% respectively, an as yet unidentified Ichneumonid was bred from 4 pupae only (0.3%).
Pieris rapae Spring larvae populations reached a maximum in late spring of 1993 and midsummer in 1992, 94 when numbers reached 1.4, 4.2, and 1.5 larvae/plant (Figure 7). Populations were generally lower each year during the hotter and wetter months of summer and also during the colder, drier winter months of June, July and August. Autumn populations peaked in 1994 and 1995 at 5.9 and 1.9 larvae/plant.
4.2
1992-93
o 5.6
1993-94
o 1.9
1994-95
0 N D J F M A M J J A S
Months of the Year
Figure 7: Number of larvae of Pieris rapae collected from unsprayed plots of broccoli at the Gatton Research Station.

o VO TJ
o VO
P _„, t-n "-I 03 c* in ^ w en fD
J. I — •
55" 3
? 5 P vo
VO VO
T3
os en
P VO
VO
5̂ 2 n p w >-! 03 £< en ^ 03 »—•• CD
VO VO
to
VO VO ft)
(D
o>
0 0 to to —* -J i i
C M C s
o o e
• i e
(TQ
O O
C/3 «
to O
O to H o
TJ D)
3 (A (A
3 o —* (D*
8-a 0)
CD
5T o>
o o 5T o>*
<Q
6" 3 CD
a 3" o 0)
o 3 7) (D Crt CD 0)
3
^ 4
o
tO tO
1>J O
o oo
vo
o\ •— oo vo
ON tO OO N>
oo
o\
O <->i
- 4
o to
to >->
O VO
O en
O •—
o ~
o
a ft o
s
re ar
63 "1
•1
o - J 4^ o to 65 CO *-* 0) o' 3

33
The larvae were parasitised by Cotesia glomerata (L.)(Table 6), while the pupae yielded Pteromelus puparium L. (Table 7), Paradrino laevicula Mesnil (Diptera : Tachinidae) and Brachymeria regina Girault (Hymenoptera : Chalcidae)
Parasitism by C. glomerata ranged from 13-80% on a monthly basis and averaged 31%. However, it must be pointed out that a lower number of individuals were collected for this species than for the other pest species. P. puparium was only of sporadic importance being bred from 65% of pupae collected in May-June 1994 and 14% in May-June 1995.
P. laevicula was bred from only 1 pupae in May 1994, and 2 pupae in June 1994, 2 pupae in December 1994 and 1 pupae in March 1995. B. regina was bred from 1 pupae only in December 1994.
Table 7: Parasitism of Pieris rapae pupae by Pteromelus puparium, Gatton Research Station
No. pupae collected No. infected by P. puparium
% parasitised
1992-93
1993-94
1994-95
14
13
26
11
9
4
79%
69%
15%
Totals 53 24 45%
Crocidolomia pavonana Populations of CCC were abundant from late spring until early winter (Figure 8). Summer populations reached maxima of 115.6 larvae/plant in December 1992, 194 in January 1993, 91.1 in February 1993 but declined in June, 1993. Populations again peaked in November 1993 at 121.8 larvae/plant, staying high until June 1994. Populations rose again in December 1994 to a high of 31.9 larvae/plant in April 1995 before declining in June 1995 (Table 8).
Three Ichneumonid species were bred from the collected larvae. Dr Ian Newman identified a representative sample to genus, but species determination will be done by the British Museum (samples have been dispatched). Temelucha sp., Campoplex sp. and Bohayella sp were bred out from pupae. Parasitism was very low for all three ichneumonids. The total only averaged 3.8% with Bohayella (1.8%) the most abundant, Temelucha less so (1.2%) and Campoplex the least (0.8%).
Except for 1992-93, when populations of parasitoids appeared low the parasitoid incidence mirrored pest abundance.

LO tO '.—"
a - <T cr * < v< *< b3 O ^ o o (̂ m
pop hayel
3
mpop
hayel m
pop hayel 8 !c" *~- •^, O TO
CO ** "O co co
V
£L T3 * a *T3
T3 5 r< ^ p m P t l P S E-l CO CO CO < j
P 5-" ?v s." p S3. £ • 55 • £ • n
«• 3 3 3 3 c B c
NO NO
I — C-M
v p yO vO v P >y> _ 0s- o x o N o^ •£-> vri
OO OO
~-J ~o o o oo
T3 *t3 T 3 *T3
3 fij S S P P P P 0 0 W C/J CO
H^* . *"*•] *"*•! *-*"*
oo oo* oo" oo"
3 3 B 3 Q 3 S 3
O ' ^ y NO — 4^
P NO « NO
S.O v ^ SjO v.© *~?> ••—*
O^ 0s* O^ O^ p~* \^Q
T3 T3 *T3 ^3 • ^ e> s> g g sr ^ P P P P ^ • CO CO CO CO
P P
s o N P ^ • — < ^ ° N ^ NO
y NO —. t o
»•*" <-+' •-*' £+" fi? **o CO CO CO CO v " N D
3 3 3 3
l _ . CO_ CO_
3 3
• a ' n
P P CO CO
*-»•" r-t-* co' co'
3 3
P ND
c o ; K > ; • - •
NO - J t O
LO t O O O NO •—' L/l ON
to OO
* - i—' O O LO
* . o 4^
LO o o LO 983
4^ 4^
NO o oo t—* 0 0 L/>
4^ to to
LO u> o o LO
o
• I I I I
t o o o o o -o
' 1 1 1 • o o o o NO
i i 1 1 1
1.2
|— O to
o to L/l 0.9
0.6 0.3
o
303 o o o to 4*
O NO
oo 0 0 O o
248 y\ -(^ p o NO p o p L / I NO
O NO
NO NO Lo '•o ON Lo Lo
to o to 4*. o LO o O N
226 o o o LO
o oo t o L/> NO t o
LO P—> L/l p NO ON L / I t O
NO t O ON J-»
t O H - . £ . U ) o 4 ^ NO O N
NO Lo ON
t o I — »
4^ O JO >—» O Lo NO 4 i . O
J-1 O ^ - O <-fi Lo Lo
to o
o o o o -o
o o o o oo
o o o o o
o o o o o
u> o o o o ^
I I I
I I I I I
-o 4i- t o i—> p -t^ tO Lo Lo ON ^
4 ^ OO t O i—> 4a. 4^.
NO U l >—» OO ~ J
ON o o o o 5° & • & < *
4 ^ 4 ^
o n
1 o
p 3
cr
p
•a 1
p
c s
c
c ere
H o I
ft) o; R> CO
TJ 0)
2 w 55' 3 o
o 3 Q
8-' 3 0)'
T3 0)
cS
0)
a>
0) _(D
o o 3 73 CD (A (D 0)
a w ST
o" 3
OJ
* .

35
Hellula hydralis CG occurred each year in midsummer and populations continued through until late autumn. Although population maxima of 11.1 (April 1993), 15.3 (February 1994) and 22.4 larvae/plant (February 1995) were reached, it must be appreciated that this species has the greatest damage potential of all the pest species by virtue of its burrowing habit. Low caterpillar numbers can cause plant death, especially in the early stages of plant growth. Table 9 shows that no parasitoids emerged from the pupae that had been bred through.
Table 9: Parasitism of Hellula hydralis pupae, Gatton Research Station
Jan Feb Mar Apr May June Jul Totals
1993
No. pupae - - - - - 12 - 12
% parasitism - - - - - 0 - 0
1994
No. pupae - 151 63 27 54 88 - 383
% parasitism - 0 0 0 0 0 - 0
1995
No. pupae - 195 129 359 139 153 - 975
% parasitism - 0 0 0 0 0 - 0 - 0 0 0 0 0 -
1370
Spodoptera litura F. and Helicoverpa armigera (Hubner) Both species of Noctuids occurred irregularly on the brassicas, with CC being the more abundant (Figure 8). They were generally autumn pests. For CC, highs of 4.2, 4.6 and 2.9 larvae/plant were recorded in March 1993, May 1994 and May 1995 respectively. Heliothis reached highs of 2.2 and 2.0 larvae/plant in April 1993 and May 1994 respectively.
Microplitis sp. (Hymenoptera : Braconidae) was the only parasitoid recorded. Eight (four, three and one emergence on January 1993, February 1993 and May 1995) emerged from S. litura and three (in April 1994) from//, armigera.

36
P. xylostella
P. rapae
C.pavonana
S. litura
H. hydralis
Helicoverpa spp
S O N D J F M A M J J A S O N D J F M A M J J A S O N D J F M A M J J A S O
- Growing season 1992 1993 1994 1995
Figure 8: Number of larvae per plant collected from unsprayed plots at the Gatton Research Station, September 1992 to October 1995.

37
On farm trial work
Broccoli
Farms A, B and C -1992
Monitoring data for 1992 broccoli is incomplete as we had difficulties obtaining data from our crop scout until the end of the season. We therefore decided to disregard monitoring results. Two plantings on each farm were assessed for pests at harvest.
Farm A was considered high risk. The farmer had decided two or three years ago to stop spraying at the onset of cooler weather in early winter and strategic applications of conventional insecticides at the start and end of the season were used to control pests. He did not use Bt. In the 1992 autumn planting, only one spray of esfenvalerate was applied against CCC two weeks prior to harvesting. In this planting, we sampled 100 heads from 16 unsprayed rows which the farmer had left for us, as well as cutting 25 heads from the remainder of the block where esfenvalerate had been applied.
All heads from the sprayed portion of the planting were clean. In the sample from the unsprayed portion, three heads were considered unmarketable due to insect contamination, 82% of heads were clean and 18% of heads showed a high level of insects. No parasitioids were recorded but some spider activity was noted. The strategic pyrethroid spray had given excellent results by preventing a 3% crop loss through insect contamination. On an average broccoli market ($12/icepack at market), this represents $100/ha profit as well as guarding his reputation as a quality broccoli grower.
In the second planting, no sprays were applied until three weeks prior to harvest (mid August). Some CWB activity was noted at harvest but heads were clean with very low levels of insect contamination.
Farm B was considered medium risk, with the farmer having little tolerance for pests in the crop but selecting insecticides according to pest pressure and pest species. In the first planting, two sprays of Bt, one organophosphate spray and one spray of pirimicarb were applied (Week 6 to 8 post transplant). In the second planting, a spray of Bt was applied after Week 6 post transplant. Both plantings produced clean heads with very low insect contamination (DBM).
Farm C was also categorised as medium risk although the farmer preferred to use Bt for low level pest outbreaks. In the first planting, three applications of Bt were made in Weeks 2 to 6. A spray of pirimicarb was also applied (against aphids). In the second planting, two sprays of Bt were applied between Week 8 and 10. While heads were of excellent quality, the level of insects (chiefly DBM) found in heads was slightly higher than for Farm B. Diadegma were seen in abundance while harvesting Planting 2 in late August.

38
Unsprayed broccoli plantings at GRS We harvested heads from the unsprayed plantings in early winter and late winter to coincide with harvest assessments of on farm trials. Product harvested from these plantings contrasts quite sharply with the on farm results, particularly the unsprayed section from Planting 1 at Farm A (82% clean heads). From the corresponding planting at GRS, only 69% of heads harvested were clean with a higher level of pests found in the remaining heads. The second unsprayed planting harvested was unmarketable due to CWB contamination.
Farm I - 1994
This farm was considered medium risk. The farmer preferred strategic applications of Bt for low pest levels but was not adverse to using conventional insecticides if pest pressure increased. He had employed a crop scout periodically over the last five or six years to assist with spray decision making.
Our crop scout monitored five plantings (about a third of the season's crop) and all plantings monitored were assessed at harvest.
Pest Abundance
DBM eggs were first found in low levels in early April with subsequent peaks in early May and mid June (Figure...). Small larvae were found at varying levels throughout the season with two peaks in May, low levels in June, with levels increasing again in July and August (Figure 9).
3.0
JS Q.
d c 2 0)
3
2.0
1.0
0.0 I
h I Eggs
-Q— Large larvae+pupae
—•— Small larvae
h I Eggs
-Q— Large larvae+pupae
—•— Small larvae
DQOCHfa^pMjOCf^^r^f T \ i i i i'-r5H>r¥%Qotfto5a^?#%T--i TaTM i I p^of totKXXH
5- 5" in •«- co ;= s s CM 0> CO CO O 52 8
g) O, O) D> O. g. g. < < < < < <n a> T- CO lO CN <7> lO CM
Monitoring dates
Figure 9: Average number of DBM (Plutella xylostella) eggs, larvae and pupae found durinq monitoring of Farm I broccoli in 1994.

39
Small larvae were observed before eggs in three of the plantings. No eggs were found in Plantings 1 and 5, although small larvae were found in both these plantings. Higher levels of large larvae and pupae occurred twice; the first from late April to late May, the second in late July to early August (Figure 9). DBM was the most troublesome pest with pupae found in every planting at harvest.
An outbreak of Heliothis occurred in April with a peak in egg counts from 5 to 11 April. Some small Heliothis larvae were found throughout April (Figure 10) but most of these did not develop into large larvae. Only low levels of Heliothis were found at harvest in Plantings 1 to 4. In planting 5, a low level of Heliothis eggs was found in late winter and although no larvae were found during monitoring, small larvae were found at harvest in mid September (the crop had not been sprayed for 6 weeks).
CD 3
CD Z3
CD 3
CD 05 =3 s- 8-
< < < < < W w " " • " *
CO in Rl 8 lO CN S " o> g JO g
Monitoring dates
Figure 10: Average number of heliothis (Helicoverpa spp.) eggs and small larvae found during monitoring of Farm I broccoli in 1994.
A range of other pests were found in autumn with CG being potentially troublesome in the first two plantings (early March to late April). CCC (mid March and mid April) arid CC (mid April and early May) were also found in these two plantings. CWB eggs were found in low levels until late May but few small larvae were seen in the field.
Natural enemies
DBM pupa parasitised by Diadegma were found at harvest in planting 1 (20% early May), planting 3 (9 % mid July), planting 4 (50% late August) and planting 5 (60% mid Sept). . Many Diadegma adults were seen flying in the crop by early September. No Diadegma were found in planting 2 at harvest in early June. This planting had been sprayed most frequently

40
with conventional insecticides. Incidence of spiders was sporadic, with this predator noted in 34% of checks.
Insecticides applied
In all but the last planting, a clean up spray was applied one to two weeks before harvest but some insects were still found in heads at harvest (Table 10). A knockdown spray was not specifically targeted at the buttoning growth stage. Around buttoning, Bt was selected in planting 1, 2 and 3 and no spray was applied in planting 5. This may explain the presence of insects in heads at harvest. In Planting 4, knockdown sprays (deltamethrin) were applied at buttoning and this planting produced the cleanest heads (Table...).
3.0-,
i
I-o.o
tZZD CWB eggs -i tZZD CWB eggs -i • i -i-m Heliothis eggs
GZH DBM eggs
" " " Bl
1
Bt+deltamethrin
~i " • • i DBM small larvae
—•— DBM large larvae+pupae " " " Bl
1
Bt+deltamethrin
~i " Bt+methidathion
• Bt+esfenvalerate
• • i DBM small larvae
—•— DBM large larvae+pupae " " " Bl
1
Bt+deltamethrin
~i " Bt+methidathion
• Bt+esfenvalerate
Bt+methidathion
1 Bt+deltamethrin
IK 1 1 I BUTT
1 Bt+esfenvalerate
1 _
1 1 I BUTT ONING *
B • ;:;:iii-::i:!;'=A ^ _ Some
W i'V i - i P f * ! -
DBM adults
\W\ I V I ^ n» i • i • i • i • i •
8 S3 8 - r - •<*- CO T - l p CO • * - • « — - r - CM F>1 CM
Monitoring dates
CO i - t o CO C N
Figure 11: Monitoring results for Planting 4 Farm I broccoli in 1994, showing average number of DBM (Plutella xylostella), CWB (Pieris rapae) and heliothis (Helicoverpa spp.). Note - egg values are additive.
Action thresholds appeared to range from 0.4 to 0.6 small DBM larvae/plant. Although these numbers are not a strong trend several early sprays were applied for pests other than DBM. Other factors which influenced spray decision making included pest activity in adjacent plantings, level of large DBM larvae found and growth stage (seedling or preharvest). Choice of insecticide varied with plant age, pest level, larval size and pest spectrum. Different sprays were sometimes applied to adjacent plantings on the same day.
Broccoli seedlings also appear to have some tolerance to CG attack. In Planting 1, CG were found at potentially damaging levels (ie. 0.1/plant) in the critical seedling stage. We recommended spraying, but the farmer decided not to apply a knockdown spray until four

41
weeks after transplanting when the critical growth stage had been passed and CG activity had decreased. A similar delay in spraying against CG occurred in Planting 2. No obvious plant losses were noted during harvest and a specific assessment for CG damage was not made.
Harvest assessment
Results are summarised in Table 10. While crops looked clean before harvest, closer inspection showed DBM pupae in product harvested from all five plantings. In the first two plantings medium levels of insects were found. Subsequent plantings gave better results with low levels of insects and higher percentages of clean heads. Planting 4 gave the best result (a knockdown insecticide was applied at buttoning) and Planting 2 the worst (highest pest counts).
Except for Planting 5 (three sprays), insecticide input can be described as above average, particularly when compared to broccoli from Farm A, B and C in 1992. In the absence of monitoring data, it is difficult to comment on differences in pest pressure between the two years. Data from collections taken from the unsprayed plantings at GRS give lower, but more consistent levels of DBM in 1993 when compared to collections in the 1994 and 1995 seasons.
Table 10: Summary of harvest assessments for broccoli plantings at Farm 1,1994
Planting Harvest Assessment Insecticides
Date No. Date Clean heads
Insect Rating
Average head weight
Comments Number of sprays
Approx. cost
Late Feb
1 3 May 65% Medium 180g Looked clean at harvest
6 $180
Early Mar
2 8 Jun 69% Medium 361 g Looked clean at harvest
9 $310
Late Apr
3 19 Jul 73% Low 325g Quite clean 7 $295
Mid Jun
4 31 Aug 93% Very low 345g Very clean crop 8 $425
Mid Jul
5 21 Sep 75% Low 295g Fairly clean, assessed late
3 $150
Clean heads - includes heads with slight damage but excludes heads with some damage or pests Insect rating - Very high High Medium Low Very low No. insects over0.8/head 0.4-0.8/head 0.2-0.4/head 0.1-0.2/head less than 0.1/head
Farm J -1995
This grower had some tolerance to pests in the crop and frequently chose not to spray when our crop scout recommended action. We categorised this farm as high risk. The grower had not previously employed a crop scout and also did not use Bt, preferring to rely on strategic applications of conventional insecticides. Seven plantings were monitored (over half of the

42
season's crop) and all but the last planting were assessed at harvest. Planting 7 was abandoned because hot weather had seriously affected head quality.
Pest abundance
DBM egg pressure was quite consistent throughout the season but larval activity decreased over winter (Figure 12). A high percentage of eggs developed through to the large larvae/pupal stage in late autumn and early spring, but insect infestation in harvested crops was generally low. DBM eggs were found one or two checks prior to finding first larvae in all but the first planting where both eggs and larvae were found at the first check.
I OJ
S > <
2 S Monitoring dates
Figure 12: Average number of DBM (Plutella xylostella) eggs, larvae and pupae found during monitoring of Farm J broccoli in 1995.
A variety of other pests were found during the warmer months including CWB. Heliothis (Figure 13), CG, CCC and CC were found in autumn and late winter/spring but these were easily managed with strategic insecticide applications.
Natural enemies
A range of natural enemies were active in the crop. Spiders were often found during scouting (73% of checks). Commonly 1 or 2 spiders were found, sometimes 3 or 4, with a maximum of 5 spiders found once in Planting 4 (not sprayed). This range represents a mean of 0.1 to 0.5 spiders/plant for three quarters of monitoring events.
Parasitised DBM pupae were recorded for most plantings but Diadegma adults were first seen in numbers in mid June followed by a second peak in wasp activity in September. Other

43
natural enemies included lacewings, aphid parasitoids, and Apcmteles glomerata parasitising CWB larvae. The level of natural enemies found on this farm are compared with other on-farm trial work in Figure 25 and illustrates the diversity of natural enemies on Farm J.
3.0
c a
d c 2 > <
2.0
Eggs
Large larvae
Small larvae
Monitoring dates
Figure 13: Average number of heliothis (Helicoverpa spp.) eggs and larvae found during monitoring of Farm J broccoli in 1995.
Spray applications
The grower tended not to follow our recommendations, spraying less frequently and choosing different insecticides than those recommended. Bt was not used throughout the season. Sprays applied gave good suppression of all pests except DBM with some follow up checks showing a poor spray result. A percentage of DBM larvae developed through to the pupal stage (Figure...) but this did not translate into insects in harvested product.
Action threshold levels Sprays were applied when DBM small larvae ranged from 0.5 to 1.5/plant (mean count). Spray decisions were influenced by a number of other factors: • plant growth stage particularly buttoning (and seedling to a lesser extent) • activity and spray decisions in other plantings • previous egg and larval counts including large and pupal counts • time of season (early, mid or late) and weather conditions (warm or cold) • previous spray decisions • other pests found • activity of natural enemies

44
* Table 11 attempts to summarise information on which spray decisions were made. In general, a spray was not applied until a mean count of 1 small DBM larvae/plant had been recorded in at least one of the plantings within the last two checks. There were two exceptions to this rule, both occurring at buttoning of the crop. In Planting 3, a spray was applied at 0.5/plant when activity in other plantings and large larval counts where low. In Planting 6 (Figure 14), a spray was applied at 0.5 small larvae/plant, however this followed several checks showing DBM small, large and pupa activity. Temperatures were also increasing by this time.
There were a number of occasions when a spray was not applied when DBM small larvae counts reached or exceeded our suggested threshold level of 0.4/plant. Outside the critical growth stage (buttoning) the grower tolerated small DBM larvae counts ranging from 0.5 to 0.8/plant.
Table 11: Summary of pest activity which resulted in a spray decision for Farm J broccoli in 1995.
PI. No.
Max. DBM eggs
Spray date
DBM small larvae mean count
DBM large larvae+pupae mean count
Other pests? Natural enemies?
Growth stage
Influenced by other plantings? PI = Planting
1 1.1/plant 9 May 12 May
0.7/plant 0.5/plant 0.6/plant
Hellula Buttoning Late buttoning
PI 2(1.2/plant) PI 2(1.5/plant)
2 2.4/plant
3.4/plant
9 May 12 May
7 June
1.2/plant 1.5/plant
1.2/plant
0.8/plant 1/plant
1/plant
Centre grub
Diadegma
Late seeding
Late buttoning 3 2/plant
0.6/plant
7 June
27 June
1.4/plant
0.8/plant
0.9/plant
0.3/plant
Hellula Late seedling
Buttoning PI 4 (0.2/plant)
4 1.5/plant Not sprayed
Max. 0.3/plant (late buttoning)
Max 9.5/plant (prebuttoning)
Spiders Low DBM activity at buttoning
PI 5 counts also low
5 3.4/plant Not sprayed
Max 0.5/plant (buttoning)
Max 0.7/plant (buttoning)
Diadegma preharves t
DBM activity at buttoning inconsistent
6 0.8/plant 8 Sept 22 Sept 2 Oct
1 /plant 0.5/plant 0.2/plant
1/plant 1.2/plant 0.4/plant
CWB pre-buttoning late buttoning pre harvest PI 7 (1/plant)
7 3/plant 2 Oct 1/plantthen 0.7/plant
0.5/plant late seedling

45
- « * - G O ' r - m c o c N i r > a ) - « - c o c N j m a >
Monitoring dates
Figure 14: Monitoring results for Planting 6 Farm J broccoli in 1995, showing average number of DBM (Plutella xylostella), CWB (Pieris rapae) and heliothis (Helicoverpa spp.)- Note - egg values are additive.
Table 12: Summary of harvest assessments for Farm J broccoli, 1995.
Planting Harvest Assessment Insecticides
Date No. Date Clean heads
Insect rating
Average head weight
Comments Number of sprays
Approx. cost/ha
Late Mar
1 6 Jun 90% Low 250g Quite clean 2 $108
Mid Apr
2 3 Jul 90% Very low
290g A few heads with damage
3 $145
Early May
3 25 Jul 96% Very low
290g Very clean 2 $130
2 Jun 4 25 Aug 100% None found
300g Very clean, some frost damage
None applied
10 Jul 5 25 Sep 94% Very low
360g Poor quality due to heat stress
None applied
29 Jul 6 10 Oct 98% Very low
240g Poor quality due to heat stress
4 $200
5 Sep 7 Planting abandoned no DBM, some Helio
because of poor quality (heat). Last check this and cabbage, white butterfly
2 $100
Clean heads - includes heads with slight damage but excludes heads with some damage or pests Insect rating - Very high High Medium Low Very low No. insects over0.8/head 0.4-0.8/head 0.2-0.4/head 0.1-0.2/head less than 0.1/head

46
CG was active in the first three plantings (April to early June) and had the potential to cause significant damage to seedlings in the first two plantings. Sprays were not applied against this pest at these critical growth stages. While no specific information on CG damage was collected, plant losses were not noticeable during harvest. This echoes the observations made the previous year on Farm I, when sprays against CG where not applied according to our recommendations but few plant losses were noted at harvest.
CWB reached potentially damaging levels in planting 6, when both egg and small counts exceeded 1/plant. The ease with which this pest can be controlled with a strategic application of conventional insecticide is well illustrated by the monitoring counts in Figure 14.
Harvest assessment.
Results summarised in Table 12 confirm that the pest management approach used by the grower worked very well. For a low input of strategically targeted insecticides (chiefly around buttoning), over 94% of clean heads were harvested in all but the last planting.
Cauliflower
Farms D, C, E and E2 - 1993
In 1993, we employed a new crop scout to monitor on-farm plantings. Monitoring data is complete and all plantings were assessed at harvest. We were also able to compare three different types of pest management - high risk, medium risk and low risk. The low risk work was completed at two different farms (Farms E and E2) as the grower at the first farm ran out of water halfway through the season.
Figure 15 illustrates the relative DBM pressures on the different farms. Counts in Planting 1 were quite low on all three farms, but counts for Planting 2 varied, with Farm C giving the lowest counts and Farm E2 the highest.
Insecticide use patterns and their influence on natural enemies
Sprays were applied at buttoning in all plantings monitored, but on Farm D, Bt was used while on the other farms a knockdown was selected. Insecticide input on Farms E and E2 was much higher than for the other two farms (Figure 16) although Farm E experienced only low pest pressure.
The level of natural enemies found on Farms D, C and E do not differ greatly (Figure 17) although insecticide input on Farms D and C had been much lower (Figure 16). Average spider numbers for Farm E2 were one third that of Farm E, although a similar pesticide regime had been used and food (high pest level) was more abundant on Farm E2.

Monitoring dates
Figure 15: Average number of DBM, Plutella xylostella, found in cauliflower plantings at Farms D, C, E and E2 in 1993. (a) egg counts per plant (b) small larvae counts per plant and (c) large larvae and pupal counts per plant.

48
Farm D was classified as high risk. The grower had decided to restrict use of conventional pesticides as he was "sick of spraying chemicals that don't work". He had not previously used Bt, although this product is now part of his pest management strategy (the farm was accredited as organic in late 1995). In the 1993 season, the four chief pests were (in order of importance) DBM, CG, Heliothis and CCC.
20.0
O)
•Jj 15.0 c Q. "55 >. 2 g. 10.0 d c a> oi ra a> 5.0 <
0.0
_...
ES Organochlorines
OD Carbamates
• Pyrethroids
• Organophosphates
• Bt
1 _...
ES Organochlorines
OD Carbamates
• Pyrethroids
• Organophosphates
• Bt
_...
ES Organochlorines
OD Carbamates
• Pyrethroids
• Organophosphates
• Bt
_...
ES Organochlorines
OD Carbamates
• Pyrethroids
• Organophosphates
• Bt
_...
ES Organochlorines
OD Carbamates
• Pyrethroids
• Organophosphates
• Bt
^̂ ^̂ H
i 1 1 1 • i 1 1 1
Farm D Farm E2
Figure 1 in 1993.
15.0
Farm C Farm E
Farms (treatments)
6: Comparison of insecticide use patterns in cauliflower plantings of Farms D, C, E and E2
Farm D Farm C Farm E Farm E2
Farms (treatments)
Figure 17: Comparison of average numbers of natural enemies found in cauliflower plantings of Farms D, C, E and E2 in 1993.

49
Apart from two organophosphate sprays against CG in the seedling stage of Planting 1, only Bt was used. The farmer often did not follow our recommendations allowing pests to frequently exceed our threshold level. In Planting 2, no sprays were applied against CG in the seedling stage. DBM small larvae counts often exceeded 0.4/plant but only four Bt sprays were applied, three of these during and just after buttoning (Figure 18). A Bt spray was also applied at buttoning in Planting 1.
ii o c 0) O)
5 > <
TO -. CZDCWBeggs CZDCWBeggs
1 ' l Heliothis eggs
r̂ -̂ M DBM eggs
20 • - - - - - -Bt
— - - 4 - - — Centre grub
M B DBM small larvae
—•— DBM large larvae+pupae - - - - - -Bt
— - - 4 - - — Centre grub
M B DBM small larvae
—•— DBM large larvae+pupae - - - - - -Bt
— - - 4 - - — Centre grub E 3t Bt Bt
1 I 1 1 0
BUTTONING
Centre grub • /
1W1 l 0 0 - 1 1 ™ l — ^ f * f B : i
| | |«^;::-pl|\ i ^ 1 " T " T * Y ^ I M-i 1
t a , _ CO
Monitoring dates
Figure 18: Monitoring results for Planting 2 cauliflower at Farm D in 1993, showing average number of DBM (Plutella xylostella), CWB (Pieris rapae) and heliothis (Helicoverpa spp.). Note - egg values are additive.
Heads harvested from both plantings were of reasonable quality (Table 13). Some loss or downgrading occurred due to insect damage or contamination but pest level found at assessment was only medium. CG caused between 2 and 3 % of crop loss and there was no marked difference between Planting 1 (knockdown in the seedling stage) and Planting 2 (unsprayed in the seedling stage).
Farm C was again classified as medium risk. As in the 1992 broccoli work, the farmer preferred Bt for low level DBM outbreaks but choose to switch to conventional insecticides if there was any doubt. In Planting 1, DBM counts were low (0.2 small larvae/plant or less), with Heliothis and CG being potentially more damaging. In Planting 2, DBM was the chief pest found. Pests were controlled with strategic sprays of either Bt, a conventional pesticide or a mixture of both. The grower paid particular attention to the buttoning growth stage and appeared to spray on a threshold of 0.3-0.4 small larvae/plant.

50
At harvest, heads were very clean with a high percentage of clean heads and low level of pests (Table 13). Heliothis was the main pest found in product from Planting 1; DBM pupae was the main insect found in product from Planting 2.
Farm E and E2 These two farms had similar pest management strategies, tending to use conventional insecticide mixtures and Bt. Both growers had a low tolerance to pests (about 0.1 small larvae/plant). On Farm E2, spray application was often considered a low priority in relation to other activities on the farm. Both farms are classified as low risk.
On Farm E (the autumn planting), frequent sprays produced a clean crop with low pest levels in harvested product (mostly DBM). On Farm E2 (the winter planting), an early outbreak of DBM with egg counts exceeding 5/plant and small larval counts up to 3.5/plant three weeks later caused problems with pest management. Blocked nozzles and a lapse of 10 days before respraying around the time of this outbreak probably contributed to the poor harvest result. Continuing DBM pressure and poorly timed sprays produced heads with a high level of DBM (Table 13).
Table 13: Summary of harvest assessments for cauliflower plantings at Farms D, C, E and E2 in 1993.
Planting Harvest Assessment Insecticides
Date No. Date Clean heads
Insect rating
Average head weight
Comments Number of sprays
Approx. cost/ha
Farm D - high risk, conventional insecticides and Bt 24 Feb
1 10 May 50% Mediu m
1.3kg Reasonable 6 $236
Late Apr
2 29 July 65% Mediu m
1.3kg Quite good crop 4 $140
Farm C - medium risk, Bt sprays preferred 4 Mar 1 10 May 75% Low 1.1kg Very clean crop 4 $225
late Apr
2 21 July 82% Low 1.5kg Very clean crop 7 $365
Farm E • low risk, conventional insecticides and Bt 3 Mar 1 27 May 75% Low 1.5kg Clean crop 11 $625
Farm E2 • low risk, conventional insecticides and Bt late Apr
2 22 July 74% High 1.6kg Crop looked reasonable
11 $620
Clean heads - includes heads with slight damage but excludes heads with some damage or pests Insect rating - Very high High Medium Low Very low No. insects over0.8/head 0.4-0.8/head 0.2-0.4/head 0.1-0.2/head less than 0.1/head

51
Farm F - 1995
We had worked with this grower the previous year, when we monitored four of his cabbage plantings. He was very happy with this work and wanted to keep spraying to a minimum. He preferred to use Bt as it was least disruptive to natural enemies. As in the previous year, we classified this farm as medium risk.
Five plantings (about half the crop) were monitored in 1995, but only the last three plantings were assessed at harvest. We again had to change our crop scout and misunderstandings caused us to miss harvest assessment of the first two plantings for both cauliflower and cabbage on this farm in 1995.
Pest abundance
An early outbreak of Heliothis to some extent masked the emerging DBM problem which remained the chief pest for most of the season. Heliothis egg counts up to 5/plant in March and the ensuing small larval counts (Figure 19) led to frequent spray applications in the first two plantings.
5.0i
„ s oi a, <o jo £
Monitoring dates
§> s 1 §> §> < < < < * - N R
Figure 19: Average number of heliothis (Helicoverpa spp.) eggs and small larvae found during monitoring of Farm F cauliflower in 1995.
By early April, as Heliothis counts decreased, DBM numbers increased. Peaks in DBM egg counts occurred in mid April and mid May (1/plant) with late season outbreaks occurring in mid July and early August (Figure 20). Small larvae were found consistently, with numbers only decreasing for about a month in mid winter. Large larva and pupae were found in the crop for most of the season, with peaks occurring in April to May and at the end of the season

52
in August. These counts correlate quite well with egg lays (Figure 20) and combined with moth activity observed in the field show that DBM completed several lifecycles in crops on this farm.
Other pests were found during autumn including CG, CC, aphids and CWB but relative to Heliothis and DBM these did not constitute a problem.
Monitoring dates
Figure 20: Average number of DBM (Plutella xylostella) eggs, larvae and pupae found during monitoring of Farm F cauliflower in 1995.
Natural enemies
Low levels of spiders (Figure 25) were found sporadically during monitoring, but no consistent patterns with regard to insecticide input were found. Considering the high pesticide input (Figure 26), it is surprising that any spiders survived. Only one parasitised DBM pupae (Diadegma) was found at harvest (Planting 3 in early August - pest pressure had been less intense and fewer sprays had been applied).
Spray applications
The first three sprays were applied against CG. Then a combination of methomyl, endosulfan, esfenvalerate and Bt were used to combat high Heliothis pressure early in the season. Methomyl and endosulfan appeared to be more effective (Figure 21) than the pyrethroid and Bt sprays. Once DBM counts increased, Bt and pyrethroids were the favoured insecticides with an organophosphate not used until Planting 5. In this planting, two applications of methidathion were made at early buttoning since Bt and esfenvalerate had given poor results.
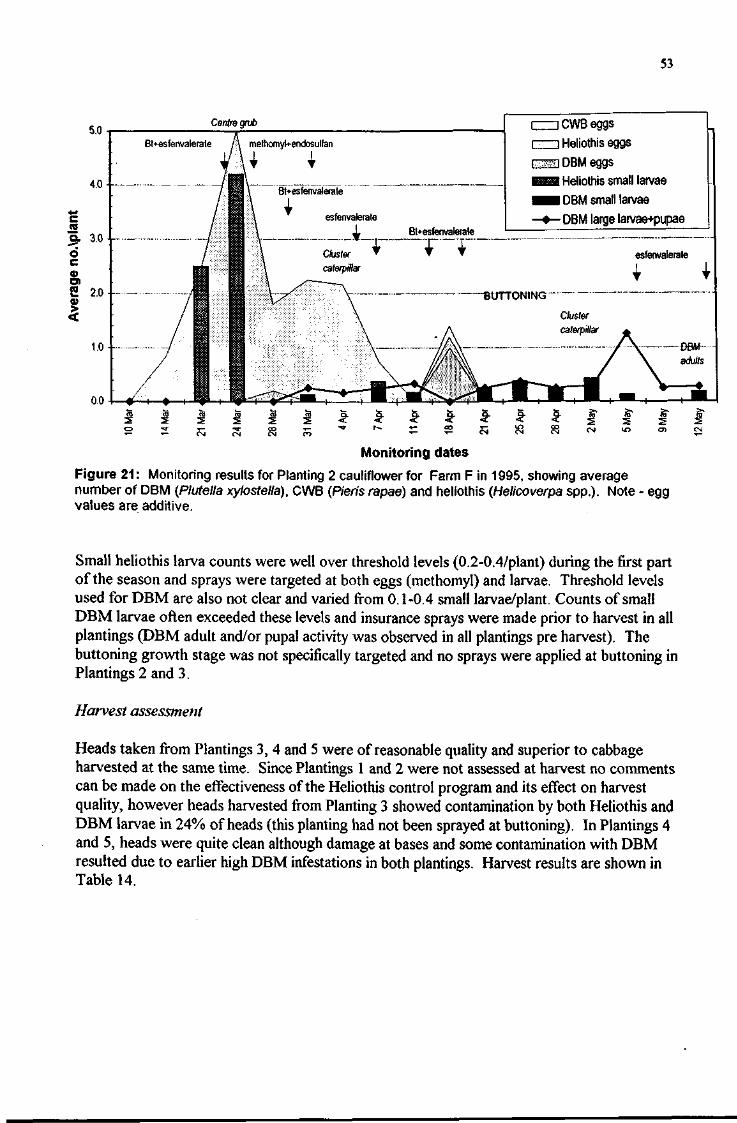
53
5.0
4.0
Q. 3.0
s 2 2.0
<
Centre grub 1 | CWB eyys F~-n Heliothis eggs Bt+esfenvalerate j \ methomyl+endosulfan
1 | CWB eyys F~-n Heliothis eggs
• • TV ; rani DBM eggs
- — - - -• / t H ! \ Bt+esfenvalerate
/ ffl \ esfenvalerate
I \ • • * r | | | \ Cluster •
m i Heliothis small larvae
• • DBM small larvae - — - - -•
/ t H ! \ Bt+esfenvalerate
/ ffl \ esfenvalerate
I \ • • * r | | | \ Cluster •
m i Heliothis small larvae
• • DBM small larvae / t H ! \ Bt+esfenvalerate
/ ffl \ esfenvalerate
I \ • • * r | | | \ Cluster •
Bt+esfenvalerate —•— DBM large larvae+pupae
/ t H ! \ Bt+esfenvalerate
/ ffl \ esfenvalerate
I \ • • * r | | | \ Cluster •
Bt+esfenvalerate
/ t H ! \ Bt+esfenvalerate
/ ffl \ esfenvalerate
I \ • • * r | | | \ Cluster •
~'T T esfenvalerate
yfi§|
| | | \ caterpillar 1 4 yfi§|
| | | \ caterpillar
-BUTTONING
/ H Cluster
/••• H -A caterpillar £
/ \ nnjw
/ 1 / \ adults
TO CO CO
2 2 2 o -<r T -- • - • « - C N 24
Mar
<
28 M
ar <
31 M
ar
4 A
pr
7 A
pr
1- 5- 1-^ 2 c5 25
Apr
28 A
pr
2 M
ay
5 M
ay
9 M
ay
12 M
ay
1.0
00
Monitoring dates
Figure 21: Monitoring results for Planting 2 cauliflower for Farm F in 1995, showing average number of DBM (Plutella xylostella), CWB (Pieris rapae) and heliothis (Helicoverpa spp.). Note - egg values are additive.
Small heliothis larva counts were well over threshold levels (0.2-0.4/plant) during the first part of the season and sprays were targeted at both eggs (methomyl) and larvae. Threshold levels used for DBM are also not clear and varied from 0.1-0.4 small larvae/plant. Counts of small DBM larvae often exceeded these levels and insurance sprays were made prior to harvest in all plantings (DBM adult and/or pupal activity was observed in all plantings pre harvest). The buttoning growth stage was not specifically targeted and no sprays were applied at buttoning in Plantings 2 and 3.
Harvest assessment
Heads taken from Plantings 3, 4 and 5 were of reasonable quality and superior to cabbage harvested at the same time. Since Plantings 1 and 2 were not assessed at harvest no comments can be made on the effectiveness of the Heliothis control program and its effect on harvest quality, however heads harvested from Planting 3 showed contamination by both Heliothis and DBM larvae in 24% of heads (this planting had not been sprayed at buttoning). In Plantings 4 and 5, heads were quite clean although damage at bases and some contamination with DBM resulted due to earlier high DBM infestations in both plantings. Harvest results are shown in Table 14.

54
Table 14: Summary of harvest assessments for cauliflower plantings at Farm F in 1995.
Planting Harvest Assessment Insecticides
Date No. Date Clean heads
Insect Rating
Average head weight
Comments Number of sprays
Approx. cost/ha
7 Feb 1 Not assessed - 14 $535 22 Feb 2 Not assessed - 9 $288 3 Apr 3 21 Jun 72% High 1.5kg Little leaf
damage 12 $360
2 May 4 1 Aug 88% Low 2.5kg Much leaf damage
16 $620
Early June
5 4 Sep 76% Medium 2.2kg Some leaf damage
12 $420
Clean heads - includes heads with slight damage but excludes heads with some damage or pests Insect rating - Very high High Medium Low Very low No. insects over0.8/head 0.4-0.8/head 0.2-0.4/head 0.1-0.2/head less than 0.1/head
Cabbage
Farms F &G- 1994
Both farms were classified as medium risk at the start of the season, but after several weeks monitoring, the owner of Farm F initiated a higher risk strategy of increased pest tolerance, less frequent spraying and a preference for Bt. This is in contrast with Farm G, where the owner was less willing to tolerate pests and had difficulty in controlling DBM early in the season. This led to frequent spray applications and even lower tolerance of pests in the crop.
Pest abundance
Figure 22 illustrates DBM and Heliothis egg pressure on the two properties. On both farms, DBM eggs were found before Heliothis eggs. Peaks in DBM egg counts were of similar magnitude on the two farms early in the season, but high counts occurred about 10 days earlier on Farm F than Farm G. Both farms experienced smaller outbreaks later in the season. On Farm G, these subsequent egg lays occurred in June/July, on Farm F about one month later in July/August.
Figures 23 and 24 illustrate the differences in DBM larval and pupal counts between the two farms. Overall, a slightly higher number of DBM eggs developed into larvae and pupae on Farm F early in the season but with the onset of cooler weather, DBM counts decreased and remained low for the remainder of the season.
On Farm G this did not occur, with the farmer experiencing problems for most of the season. DBM counts did not decrease during winter, and egg peaks in June are clearly reflected in larval and pupal counts in June and July (Figure 24).
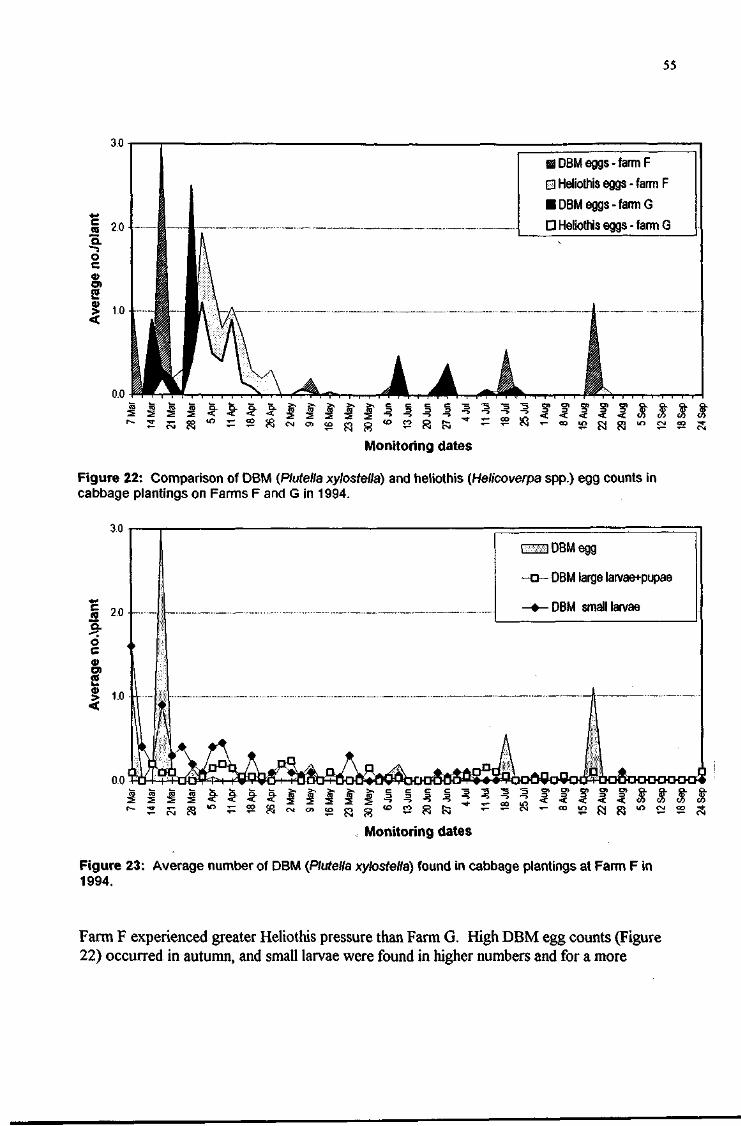
55
I DBM eggs-farm F
m Heliothis eggs - farm F
• DBM eggs - farm G
• Heliothis eggs - farm G
• » - e S ! ' r - C O * n C N C ? ? l O C N C O ' 5 j -
Monitoring dates
Figure 22: Comparison of DBM (Plutella xylostella) and heliothis (Helicoverpa spp.) egg counts in cabbage plantings on Farms F and G in 1994.
30
c (0
o c 0) O)
2 o
2.0
111 DBM egg
- o - DBM large larvae+pupae
-•—DBM small larvae
- * S « » » f j g _ _ _ _ _ a > 8 " 8 "
< < < < < ( 0 » » C O
Monitoring dates
Figure 23: Average number of DBM (Plutella xylostella) found in cabbage plantings at Farm F in 1994.
Farm F experienced greater Heliothis pressure than Farm G. High DBM egg counts (Figure 22) occurred in autumn, and small larvae were found in higher numbers and for a more

56
extended period than on Farm G. By May, Heliothis numbers had declined to very low levels on both farms.
3.0
HE3 DBM eggs
-a- DBM large larvae+pupae
-•— DBM small larvae
i - ( N N
Monitoring dates
Figure 24: Average number of DBM (Plutella xylostella) found in cabbage plantings at Farm G in 1994.
A low level of other pests occurred on both farms. CWB was found in low numbers on Farm G until mid May. CWB eggs and small larvae were found on Farm F in autumn and continued to be recorded sporadically for the remainder of the season. CC was found in early May on Farm F. Only one incidence of CG occurred in plantings monitored. This pest was found in the seedling stage of Planting 2 of Farm G.
Natural enemies On Farm F, the chief natural enemies noted during monitoring were spiders, but Diadegma also helped to suppress pests. In Planting 3, all DBM pupae found at harvest were parasitised, in Planting 4, 65% of pupae were parasitised at harvest. In this planting spiders were found in abundance during harvest, with 20% of heads containing spiders after overnight cool storage.
While spider levels were much lower at Farm G (Figure 25) due to frequent spraying (Figure...), Diadegma were found towards the end of the season. In Planting 4, 10% of DBM pupae were parasitised (over 100 pupae were found in the harvested sample) and some lacewing eggs, spiders and ladybeetles were also noted at harvest assessment. The crop was assessed late and had not been sprayed for 4 weeks prior to assessment.
Spray applications
On Farm F, strategic applications of Bt or esfenvalerate were used (Figure 26). In autumn, these two pesticides were applied as a mixture on three occasions. After mid May, only Bt was used. In the first two plantings, high risk threshold levels (0.2 to 0.4 small larvae/plant)

57
were frequently exceeded while in Plantings 3 and 4, spray applications were often made in response to 0.1 small larvae/plant. Insurance sprays were made several weeks before harvest in all plantings.
20.0
15.0 O)
c CO "5.
! <
^ Predatory bugs
rj Lacewings
m Ladybeeties
• Hover fly eggs
B Wasps
• Spiders
Farm J (broc.95) Farm F (cauli 95) Farm F (cabb.95) Farm F (cabb.94) Farm G (cabb,94) Farm I (broc.94)
Figure 26: Comparison of average numbers of natural enemies found during monitoring on Farms J, I, F and G in 1994 and 1995. Note - for Farm G cabbage, natural enemies were not recorded in 1995 (plantings were monitored by the grower).
30.0
c
a 200 "w >» S a w d c S, io.o 2 a> >
<
0.0
H Organochlorines
IB Carbamates
• Pyrethroids
m Organophosphates
• Bt
_• I Farm J
(broc.95)
FarmF
(cauli.95) Farm F
(cabb.95)
FarmF
(cabb.94)
FarmG
(cabb.94)
FarmG
(cabb.95)
Farm I
(broc.94)
Treatments
Figure 26: Comparison of insecticide use patterns for Farms J, I, F and G in 1994 and 19y5.

58
On Farm G, a range of insecticides was used, with frequency of sprays being almost twice that of Farm F. The growers tolerance to pests was very low (less than 0.1/plant), probably as a result of low confidence in insecticides as the season progressed. A comparison of insecticides used on these two farms is shown in Figure 26.
Insecticides were often applied as a mixture and on a number of occasions sprays gave poor results. For example in Planting 4, a high insecticide input appeared to give little suppression of DBM with a high percentage of eggs developing through to the large larvae or pupal stage. This was thought to be due to either resistance or poor spray coverage. After some work with the grower on application early in 1995, he suggested that incorrect boom height was probably a part explanation of the pest control problems experienced in 1994.
Harvest assessment
Except for the first planting, a greater number of clean heads were recorded for Farm F. Actual insects found in sample heads were somewhat similar, with both farms showing insect contamination in autumn and spring harvested plantings (Table 15).
Table 15: Summary of harvest assessments for cabbage plantings at Farms F and G in 1994.
Planting Harvest Assessment Insecticides
Date No. Date Clean heads
Insect Rating
Average head weight
Comments Number of sprays
Approx. cost/ha
Farm F - medium risk, Bt and conventional insecticides Early Mar
1 6 May 34% High 2.3kg Little damage 12 $405
Late Mar 2 22Jun 98% Very low 3.8kg Very clean 12 $380 Late Apr 3 23 Aug 86% Low 4.4kg Very clean 8 $260
Late May
4 28 Sep 42% High 3.4kg Heads appeared clean
8 $260
Farm G - low risk, conventional insecticides and Bt Mid Feb 1 27 May 52% Medium 3.6kg Some outer leaf
damage 11 $740
Mid Mar 2 15 Jun 82% Low 3.5kg Very clean 10 $585 Mid Apr 3 9 Sep 52% Medium 4.1kg Quite clean 14 $760 Late May
4 12 Oct 16% Very high
4.1kg Heads appeared clean
14 $745
Clean heads - includes heads with slight damage but excludes heads with some damage or pests Insect rating - Very high High Medium Low Very low No. insects over0.8/head 0.4-0.8/head 0.2-0.4/head 0.1-0.2/head less than 0.1/head

59
On Farm F, Diadegma and other natural enemies such as spiders appeared to have helped suppress pests in the later part of the season. All plantings produced heads of excellent quality and the farmer was keen to continue the pest management program in 1995.
On Farm G, a much higher input of insecticides had produced heads of lesser quality from a pest management point of view. Only Planting 2 produced clean heads with little insect damage. In Planting 3, one cabbage variety appeared cleaner than another although pest incidence was the same for both.
Farms H & H2
Both these farms were considered low risk, with the owners tending to have a low tolerance to pests and Bt sprays not seen as reliable. On Farm H, we started monitoring two plantings, but these were abandoned after four weeks when continued insecticide applications failed to control DBM. The crop had been established with poor quality transplants (too old), was obviously stressed (lack of water due to drought) and failed to grow well.
Two plantings were monitored on Farm H2. The grower tended not to follow our recommendations preferring to spray more frequently. Insecticides used to control pests DBM included endosulfan, deltamethrin, methomyl and methidathion. The farmer usually applied mixtures choosing insecticides from two different chemical groups. DBM was the chief pest in both plantings with large larvae and pupae counts above 0.4/plant prior to harvest.
At harvest, heads from both plantings were contaminated with DBM pupae. The sample from planting 1 (mid August harvest) had a high level of pests with 60% of heads clean. Planting 2 (red cabbage) was harvested in late September and had a very high level of pests with only 6% clean heads. The crop had been stressed through lack of water and weed competition. An unexplained high number of DBM pupae (4/plant) were recorded on outer leaves a week prior to harvest. DBM monitoring counts had not been high since head closure and excessive DBM damage was not noted on leaves. Did DBM larvae migrate from weed hosts?
Farms F&G-1995
In 1995, pest problems on the two farms were reversed. Unlike the previous year, Farm F experienced difficulties in managing DBM and Heliothis. This was largely due to the higher pest pressure on Farm F (Figure 27) but several other factors may have contributed to the problem. These include an increased acreage of brassicas in the locality (possibly leading to more consistent pest pressure), a busier farm due to increased plantings and a change in market. A new crop scout monitored cabbages on Farm F while the owner of Farm G decided to do his own monitoring.
Pest abundance
A consistently high Heliothis egg lay in March was the main concern at Farm F at the start of the season. The resulting small larval counts were high (Figure 28) and low levels of large

60
larvae were found (up to 0.2/plant) despite several Bt and pyrethroid applications. Larval counts decreased sharply after the first methomyl/endosulfan application in late March.
r-~ -«3- co
CIS O) CO Cl> Q . —> —y 3 3 3 3 OT
^ 2 < < < < C/3 N w ' ^ ? !5 ""
Monitoring dates
Figure 27: Comparison of DBM (Plutella xylostella) egg counts found during monitoring of cabbage plantings at Farms F and Gin 1995.
5.0
4.0 - - -
5- 3.0
s 2 2.0
1.0
0.0 (
I M Eggs
—o— Small larvae
I M Eggs
—o— Small larvae
(B in ro OT to
r»- - * co • s . 5 - i P - . § - J > . i ' S > £ > £ > § § § § O* O) O i O) CD O.
3 3 3 3 3 S> < < • < < < CO
-~ °° £ £i S ™ Monitoring dates
Figure 28: Average number of heliothis (Helicoverpa spp.) egg and small larvae found durina monitonng of cabbage plantings at Farms F in 1995.

61
As with cauliflower plantings on this farm, heliothis pressure to some extent masked the emerging DBM problem. DBM counts are illustrated in Figure 29. The first outbreak occurred in mid April and DBM eggs continued to be the found for the remainder of the season with another major outbreak occurring in early August in Planting 4. Larvae and pupae were also found consistently, but do not correlate as well with egg lays as they did for cauliflower.
5.0
3 Eggs
- Large larvae+pupae
- Small larvae
cM CM CD CD CO C?
3 3 g> §> §> g> §>
l ? = C > 4 ' - O O U ^ C N C n C M
Monitoring dates
Figure 29: Average number of DBM (Plutella xylostella) egg, larvae and pupae found during monitoring of cabbage plantings at Farms F in 1995.
3.0
2 o.
O)
2 > <
2.0
1.0
Eggs
• -Pupae
A— Medium larvae
•— Small larvae
-&-&-<* M^l ro TO oj TO
2 2 S 5 £ 8 £ a 8 Monitoring dates
CD to co ~ S 8 8 8 8-
Figure 30: Average number of DBM (Plutella xylostella) egg, larvae and pupae found during monitoring of cabbage plantings at Farms G in 1995.
62
CG, CCC, CC and CWB were also found sporadically in the crop but were insignificant when compared to the Heliothis and DBM problem.
On Farm G, records of Heliothis were not kept for the first month of monitoring (March), but it is unlikely that a major outbreak of Heliothis would have gone unnoticed by the farmer. Figure... shows that significant numbers of DBM eggs were found about a month earlier than on Farm F, however on Farm G, egg counts steadily decreased. Larval counts followed a similar pattern (Figure 30) and DBM activity had almost ceased by the beginning of June. Heliothis, CG and CC were occasionally recorded.
Natural enemies
Natural enemies were not recorded on Farm G, although the farmer mentioned Diadegma activity in the crop on two occasions. Only one parasitised DBM pupae (Diadegma) was found during harvest assessments (the last planting in mid September).
On Farm F, some natural enemies were found during monitoring despite the frequent spraying (Table 25). Only one parasitised DBM pupae (Diadegma) was found at harvest (Planting 3 in early July). Diversity and incidence of natural enemies were higher in Farm F cabbage when compared to the cauliflower planting grown alongside, even though cauliflower was sprayed less frequently. Spider numbers were similar in cabbage and cauliflower.
Spray applications
On Farm F, strategic sprays were used to manage DBM and CG for the first four weeks in planting 1, but as a result of the Heliothis outbreak in March and the consistent DBM pressure from mid April onward, sprays were applied frequently for much of the season. In the last planting, pest pressure had decreased sufficiently for the farmer to revert back to strategic spraying, illustrating his commitment to minimising pesticide use whenever possible. It is difficult to specify an action threshold for this farm as pest levels often exceeded 1/plant.
On Farm G, the farmer appeared to have a higher tolerance to pests than in the previous season and threshold levels for small larvae tended to be 0.3/plant. Sprays were applied strategically and insecticides were selected depending on pest species, pest counts and crop growth stage. Bt was often applied as a tank mix with esfenvalerate and only used by itself in the head fill stage and when pest levels were low.
Harvest assessment
On both farms, two autumn plantings were not assessed. This includes the two first plantings on Farm F which had suffered high Heliothis pressure in March. In the later plantings, a medium number of pests were found at harvest (Table 16) and damage at the base of heads further detracted from their appearance. Planting 4 gave the highest number of clean heads (72%). This planting had suffered the highest levels of DBM and had the highest insecticide input.

63
Table 16: Summary of harvest assessments for cabbage plantings on Farm F and G in 1995.
Planting Harvest Assessment Insecticides
Date No. Date Clean heads
Insect Rating
Average head weight
Comments Number of sprays
Approx. cost/ha
Farm F - medium risk, Bt and conventional insecticides 9 Feb 1 Not assessed - 21 $825 6 Mar 2 Not assessed - 17 $685 3 Apr 3 3 Jul 36% Medium 3.3kg High base
damage 15 $520
2 May 4 28 Aug 72% Medium 4.4kg Some base damage
22 $970
24 May 5 4 Sep 44% Medium 3.9 kg High base damage
13 $530
Farm G - medium risk, conventional insecticides and Bt Late Feb 1 Not assessed - 11 $620 Early Mar
2 21 May 36% Low 2.2 & 3.9kg
Assessed late Some damage
12 $655
Early Mar
3 Not assessed - 10 $590
Mid Mar 4 10 Jul 84% Very low 4.4kg Clean crop 10 $575 Early Apr
5 9 Aug 96% Very low 2.1kg (after harvest)
Very clean 8 $365
Mid Apr 6 9 Aug 100% None found
3.8kg Very clean 6 $310
Late Apr 7 12 Sep 84% Low 4.9kg Clean crop 6 $300
Clean heads - includes heads with slight damage but excludes heads with some damage or pests Insect rating - Very high High Medium Low Very low No. insects over0.8/head 0.4-0.8/head 0.2-0.4/head 0.1-0.2/head less than 0.1/head
With the exception of the autumn harvested crop (Planting 2), heads from Farm G were of consistently high quality with little pests or damage found in samples. Planting 2 was sampled about a week after harvesting had been completed (two weeks after the last spray had been applied).
Extension activities
A range of extension activities were conducted as part of this project and selected articles and papers are included in Appendix 2.
Publicity Over 15 newspaper articles were published to promote the project, IPM in brassica vegetable crops, the value of a production break and the usefulness of natural enemies in managing pests, particularly Diadegma semiclausum. The project also led to a radio interview with ABC Toowoomba in October 1992 and a news story on Channel 7 Brisbane in November 1992.

64
Technical notes Two articles were published in the Queensland Fruit and Vegetable News; "IPM in broccoli" (December 1992) and "Selecting an insecticide" (March 1993). A "Checklist for managing Cabbage moth (DBM)" was developed in 1993 and 1000 copies have been distributed to industry at various extension activities.
Farm walks Two farmwalks were held at GRS to give growers an opportunity to evaluate results from the demonstration plantings; cauliflower in August 1992 and cabbage in October 1993. We also contributed to a farmwalk organised by DPI staff on the Granite Belt in May 1994 by presenting information on monitoring and natural enemies and taking a lead role in a training session on pest and natural enemy identification in a block of broccoli at the Applethorpe Research Station.
Grower evenings We organised two information evenings for brassica growers in October 1992 at Gatton and Stanthorpe. As well as presenting information on EPM in brassicas and results from unsprayed plantings at GRS, colour photos, a microscope and specimens of pests and natural enemies were made available to growers at these workshops. A crop scout and chemical company representative gave overviews of monitoring and use of Bt.
Expo 12 and 13, Horticultural Field days at Gatton College Sue Heisswolf contributed a display promoting the project in both years under the DPI banner. In 1992, shelterbelts were featured by growing a range of flowering ornamentals and weeds for visitors. In 1994, a poster display was supported by plots of cabbage, cauliflower and broccoli, a microscope and samples of pests and natural enemies.
Conferences and industry workshops Papers and/or posters were presented at three conferences to promote project results and highlight implementation issues for IPM (Deuter et al. 1992; Heisswolf 1993a; Heisswolf 1993b). Team members have also participated at several Problem Specification Workshops for pest management in brassica crops (RIRDC Workshop on DBM resistance, Melbourne June 1994 - Hargreaves and Heisswolf; ACIAR workshop, Brisbane March 1995 - Heisswolf, Hargreaves and Deuter; ACIAR workshop, Hangzhou China May 1995 - Heisswolf).
Field days on local farms Two half day field days were held to promote IPM, and to demonstrate and discuss specific aspects of pest management. These field days were organised by the farmer cooperators, crop scouts and extension staff. In 1994, we visited Farms F and G to discuss results for the season, monitoring of crops and the importance of natural enemies. In 1995, we visited Farm G and demonstrated the importance of spray targeting by using fluorescent dye to illustrate plant coverage. This session was organised by Peter Hughes, DPI Extension Agronomist (Centre for Pesticide Application and Safety, Gatton College). The owner of Farm G also discussed his monitoring program for the season.

65
Both these field days were structured using adult education and action learning principles. Sue Heisswolf used the first field day in 1994 for a learning project (Heisswolf 1995) for the Certificate of Extension , Rural Extension Centre (REC), Gatton College. Grower cooperators and participants reacted very favourably to this style of extension activity and the second field day in 1995 was structured along similar lines. The discussion session at the end of the day (reflection and decision phases of the action learning cycle) was seen as particularly useful on both occasions.
Impact of these extension activities Reaction to most of the extension work was positive and there is circumstantial evidence to show that these activities did have an impact on pest management practices. • Bt use has increased steadily since 1990 in Queensland and chemical companies are actively
pursuing the brassica vegetable market for their Bt products • A production break over summer is well established in the Lockyer Valley • Two crop scouts have been operating in the Lockyer Valley since 1994 (only one crop
scout was operating in the area before 1994) and an increasing percentage of growers employ a scout to monitor crops
• Many growers know about or can recognise Diadegma in the crop and there is a greater appreciation of the role of natural enemies in suppressing pest populations
Grower cooperators are also keen to continue trial work on their farm and we will support their efforts under the auspices of an ACIAR project "Improving IPM in brassica vegetable crops in China and Queensland" funded from July 1995 to June 1998. Baseline data for evaluating the ACIAR project will be collected in 1996 and this will provide more detailed evidence of the impact of the HRDC project.

66
Discussion and recommendations
Current IPM systems in brassica vegetable crops
Most growers in Southern Queensland use some form of IPM system to manage brassica pests although the level of complexity of the system varies from farm to farm. Techniques fall into two categories; preventative methods such as production breaks, crop rotation and crop hygiene, or operational techniques which are used once the crop is in the ground. These methods include crop monitoring, insecticide rotation, use of Bt and awareness of natural enemies. Figure 31 illustrates the techniques that can be incorporated in an IPM system for brassicas.
Trap cropping Shelterbelts
Break in production -cropping alternatives -economics
Grow healthy plants -avoid plant stress -check transplants
Pheromones Sticky traps
Crop monitoring -action thresholds -selection and timing of sprays -insect identification
Tolerant varieties
Protect natural enemies -predators and parasites -use 'soft cchemicals
Irrigation
Crop rotation and hygiene -destroy old brassica crops -separate blocks of plantings -avoid double cropping
New pesticides
Strategic use of insecticides -conventional and biological -resistance management -correct application
Innundative release Predators¶sites
Figure 31 : Integrated Pest Management in Brassica Vegetable Crops. Those techniques which are currently used by the industry are shown in the squares; those techniques which may be of value in the future are shown without borders (adapted from Heisswolf 1993).
Production breaks and crop hygiene
These practices were developed as part of the resistance management strategy in the late 1980's and are now well established in the Lockyer Valley. Peer pressure has ensured that brassica production over summer is seen as a negative action by the industry. Production

67
breaks are a cornerstone of pest management systems and were promoted at extension activities for the project.
In the southern highland areas, a production break is more difficult to implement for marketing reasons (summer is the main production period) but a spatial separation of crops seems to fulfill a similar role in that region. A production break can also be achieved by siting blocks of weekly plantings in different parts of a farm (or on another farm). DBM resistance work by Hargreaves (1996) supported the benefits of a break in production, particularly over summer.
Crop hygiene practices such as destroying harvested crop immediately, destroying plantings where pests are out of control, keeping headlands free of weeds and avoiding double cropping of brassicas, are less entrenched in the farming community. Some growers are mulching crop prior to ploughing in to allow residues to decompose more rapidly. There are indications that peer pressure by these growers will help to make crop hygiene an established technique in the future.
Resistant/tolerant varieties
Sutton and Wright (1994) are evaluating the experimental lines with the glossy leaf traits for the seed company Yates. Cultivars with some resistance have been identified but these are not yet acceptable to the market. Observations by local growers suggest that some varieties are less prone to damage by DBM. We suspect that this may be due to better spray coverage as a result of different architectural characteristics of certain varieties. Several growers have shown interest in investigating varietal differences further and we will support their efforts through the ACIAR project.
Shelterbelts
We were unable to demonstrate any obvious benefits of planting shelterbelts in the trial work at GRS. However, the concept of shelterbelts to encourage natural enemy activity, and the use of trap crops or repellent plants in the cropping system should not be abandoned. Srinivasan and Moorthy (1991) found Indian mustard (Brassica juncea) to be an effective trap crop for CCC and DBM in India. Matthews-Gehringer and Lachowski (1993) evaluated over 160 plant species in habitat management trials for natural enemies and found plants from the Umbelliferae and Compositae families and to a lesser extent Labiatae and Polygonaceae to be most promising.
Growers should be encouraged to retain natural stands of bushland on their farms to preserve habitats for natural enemies. Farmers and industry should also consider the requirements of natural enemies when designing windbreaks or tree plantings on their farms.

68
Natural enemies and their impact on pest levels
Pest andparasitoid levels in the unsprayedplantings at GRS
CCC was the most abundant pest in these plantings and persisted through the summer when populations of DBM and CWB declined. Although CG populations had a shorter season, they were abundant at the start of the season, when crops would be at their most vulnerable stage of development.
CC and Heliothis populations were smaller compared to the other pest species. Except for newly hearting cabbage (when larvae may feed on apical plant parts under the protection of enfolding leaves), the damage potential of these numbers was slight.
Plutella xylostella Yamada and Kawasaki (1983) showed that DBM populations declined at 30°C. Sivapragasam and Heong (1984) showed that eggs; Harcourt (1963) showed that early instar larvae; and Nakahara et al. (1986), Talekar et al. (1986), Tabashnik and Mau (1989) showed that adults could be adversely affected by rainfall. This may account for the decline of populations during the summer in this study.
The parasites Diadegma semiclausum, D. rapi, Apantelles ippeus and Diadromus collaris did not appear to regulate populations below damaging levels. Yarrow (1970) also found insufficient parasitoid control of DBM in a neighbouring brassica growing area. Further south at Richmond, NSW, Hamilton (1979) showed that parasitoids gave insufficient year round control.
This study is similar in its pest spectrum to those recorded by Yarrow (1970) and Hamilton (1979) save that fewer Diadromus collaris were recorded. Also, no Cotesiaplutellidae (Kurdj) specimens were bred out. Wilson (1960) records its release in Queensland and NSW as well as other Australian states. C. plutellidae has been recovered in Victoria (Endersby 1992 unpublished) and Tasmania (Waterhouse and Norris 1987). It is an important parasite in the USSR and Finland.
As with Yarrow (1970) and Hamilton (1979), Apanteles ippeus was recorded in this study, but it has not been recorded in Victoria (Endersby 1992, unpublished) or Tasmania (Waterhouse and Norris 1987). This study would lend support to the statement of Futton and Walker (1992) that A. ippeus' biological control potential may have been overlooked.
Pieris rapae The abiotic factors of temperature (Muggeridge 1942) and rainfall (Harcourt 1966) may have influenced the summer population decline of CWB in this study.
The larval parasitoid Cotesia glomerata was the major parasitoid influence. Pteromalus purparium, Paradrino laevicula and Brachymeria regina exerted little influence. Hassan (1976) found C. glomerata to be a major parasitoid in 1973-74 at Gatton and Brisbane. He also recorded higher levels of parasitism by P. purparium, P. laevicula and B. regina.

69
Hamilton (1979) also found P. purparium to be much less abundant than C. glomerata. Using a larger sample of individuals, he also concluded that parasitoids were not fully capable of reducing CWB populations below damaging levels.
Crocidolomia pavonana Sudarwohadi and Setiawati (1992) reported a negative correlation between rainfall and CCC populations at Segunung, Indonesia. This does not accord with the present study where populations of CCC were high during the wetter months. However comparison of the Gatton wet months (Figure32) with Segunung shows Gatton's wet to be dry by Segunung standards.
Although three ichneumonids were bred from collected larvae, the overall parasitism remained very low. In addition, the genera collected represent individuals with a more general, rather than specific host range.
Othman (1982) also recorded low parasitism of the ichneumonid Inareolata argentipilosa (averaged 1.6%) parasitising Indonesian CCC. Singh and Rawat (1980) recorded only 3-8% parasitism form the Braconid Apanteles obliquae in India.
This study adds to the data pool for CCC parasitism and adds further confirmation of the comment of Waterhouse and Norris (1987) that CCC is a pest throughout its climatic range and that the prospects for biocontrol of this pest are poor.
Hellula hydralis The discrete incidence of CG populations at Gatton in the hotter, wet months would suggest that lower temperatures, rather than rainfall may be more detrimental to this species. Holdaway (1944) in Hawaii and Sachan and Gangwar (1980) in India infer such a temperature influence in a related species Hellula undalis.
No parasitoids were bred out from the collected larvae at Gatton. This accords with similar barren collections made by Latheef and Irwin (1983) and Ru and Workman (1979) of Hellula rogatalis in Virginia. Waterhouse and Norris (1989) list no recorded natural enemies for CG. At this point in time, there appears to be no potential for biocontrol of this species.
Comments on pest and parasitoid levels at GRS and on farms
In autumn 1993, CG was very active in demonstration plantings at GRS and some activity was also recorded on farms, however the unsprayed plantings at GRS showed the lowest counts over the three seasons. In 1994 and 1995, CG activity on farms was lower than in 1993 but in the unsprayed planting, higher and more consistent levels of CG were recorded in 1994 and 1995 than in 1993.
Generally, similar trends in DBM activity were recorded in 1993 and 1995 on farms and in the unsprayed plantings. In 1994, activity on farms was fairly consistent but not exceptionally high. An early spring outbreak was also noted on farms. In the unsprayed plantings however,

70
Month of Year
I Rainfall (mm) • Rainfall (Mon. Av. 95yr) -Te: ip (Mon. Av. 6
Figure 32: Weather data for the Gatton Research Station

71
the highest DBM levels were recorded in 1994 with DBM activity from late summer to early winter but little activity in early spring.
Alternative crop hosts appear to influence heliothis levels in a locality. Two farms and the unsprayed plantings at GRS experienced low levels of heliothis in autumn 1995 but on a third farm, exceptionally high levels of heliothis were recorded (Farm F). This farmer had had problems with heliothis control in a late summer crop of sweet corn.
In 1994, Diadegma activity was recorded for most of the season on Farm I (strategic sprays including Bt), particularly in May and late August and September. Data from the unsprayed plantings also shows fairly consistent Diadegma semiclausum activity in 1994 with high DBM parasitism recorded,in autumn and mid Spring. In 1995, winter/spring activity was similar on Farm J (low insecticide input), the unsprayed plantings at GRS and Diadegma were also noted on Farm G (reduced pesticide input) during that time.
Pest levels, particularly Heliothis, appear to be influenced by locality effects as well as insecticide use patterns. Pest counts on farms with reduced conventional insecticide input confirm the importance of CG as an autumn pest. DBM is of occasional importance on these farms and Diadegma appears to play an important role in controlling this pest, particularly in the latter part of the season.
Only limited data on generalist predator activity was collected in the demonstration plantings at GRS and during monitoring of on farm trials. Predators did appear to be more abundant on farms where conventional insecticide use was reduced with cabbage giving higher mean counts per planting than cauliflower or broccoli. Data collected did not give clear trends between sprays of conventional insecticides and subsequent decrease in predator numbers, as sampling for predator incidence and density was inadequate. While spiders were noted more frequently on minimally sprayed farms, spider activity in frequently sprayed cabbage crops was also higher than expected.
Riechert and Bishop (1990) investigated the importance of generalist predators in suppressing pests in a mixed vegetable garden test system and found that spiders accounted for 98% of predation events. In a separate experiment, spiders were added to bagged broccoli plants which had previously been infested with Murgantia histrionica and CWB. Pest damage of plants without spiders averaged 93.3% while damage of plants with spiders averaged only 31.8%. This suggests that spiders can play an important role in reducing pest populations in IPM systems.
Hall (pers. comm.) from Crop Tech Research in Bundaberg believes spiders to be important components of IPM systems in tomatoes and advocates the use of selective top spraying of tomato plants to control heliothis without disrupting spider activity in the lower half of the crop canopy. A greater understanding of the role of generalist predators, particularly spiders, in vegetable cropping systems is needed.

72
Monitoring and threshold levels
Monitoring for pests involves two components. Firstly a crop scout needs to use a system of checking plants in a field - a technique for monitoring pests - and secondly, the scout needs to interpret the data collected so that a recommendation can be made - often represented by a threshold level. The sampling technique and the interpretation of data gathered are interdependent.
A range of sampling techniques and threshold levels have been developed in brassicas. The approach taken has varied, but generally falls into either of two categories. • Detailed replicated trial work focusing on damage/yield relationships which are then
simplified to produce action thresholds for field validation. • Drawing up of a best bet system from available information and testing and finetuning this
system in commercial crops
Statistical research derived monitoring techniques and threshold levels
Baker (1994), South Australia Thresholds were derived from damage experiments and quality considerations which are linked to crop growth stages in cabbage. The heart and four inner wrapper leaves only were checked to reduce monitoring time and 1st and 2nd instars were not counted because they are difficult to find in the field because of their small size. If one or more plants in 10 plants checked reached the threshold level, insecticide treatment is recommended.
Growth stage Critical number of 3rd and 4th instar larvae Seedling (0-20 DAT)* Zero larva tolerated (larva may destroy the apical bud) Early growth (21-35 DAT) One plant in 10 with 5 larvae (5.1-10.0 cm heart) One plant in 10 with 3 larvae (10.1-15.0 cm heart) Zero larva tolerated (quality consideration at harvest)
Nancy Endersby (pers. comm.), Victoria After extensive trial work, a monitoring protocol for cabbage was developed which will be tested in commercial crops. The technique is based on scanning the entire block, varying the number of plants inspected according to growth stage, selecting plants for inspection using a table of random numbers. Thresholds are for combined counts of DBM and CWB larvae. Fields are inspected weekly and thresholds are based on mean count/plant.
Growth stage Threshold/plant No. plants Precision Seedling to 5.0cm head 1.5 45 0.15 5.1cm to 10 cm head 0.9 40 0.20 10.1cm head to harvest 0.3 65 0.25
* Days after transplanting

73
Chen and Su (1986), Taiwan Laboratory and field studies, including effect of leaf damage to yield, were used to establish optimal control thresholds. A system to convert other caterpillar species into DBM equivalents was also established.
Cauliflower strategy: Up to 21 DAT keep DBM units at a minimum 21 to 49 DAT Spray when DBM units reach 1/plant to prevent loss of curd
weight After 49 DAT Spray when DBM units reach 10/plant (to protect curd from
contamination by pest)
Winter cabbage strategy: To 10 leaf stage 1 DBM unit/plant To harvest 2 DBM units/plant
Optimal sample size information based on mean density was also developed. These data were derived from field counts and illustrate the patchiness of DBM larval distribution at low densities. For example to obtain a precision of 80% at a larval density of 0.5/plant (which corresponds to the range of our commercial threshold levels), a sample size of 361 plants is recommended. For a commercial crop scout, this sample size is unrealistic. A more practical sample size of 40 plants was given for a larval density of 20 larvae/plant. This level of pest infestation would be considered a crop failure in a crop of Lockyer Valley cabbage.
Trialing best bet monitoring systems on commercial properties
Beck et al (1992) Auckland NZ Commercial plantings of cabbage were used to evaluate a scouting method based on percentage of plants infested. Each field was divided into four quadrants and scouting involved sampling 25 plants at random from a transect in each quadrant (ie. monitoring of 100 plants). Whole plant examinations were made until the heading stage (10 cm heart) after which only the head and four wrapper leaves were inspected. Fields were sampled on a weekly or biweekly basis. Plants were considered infested when any of the following were found: • any instars of DBM, • large (third to 5th instar) CWB or Heliothis larva • any fresh feeding damage and/or frass An action threshold of 15% of plants infested was used. When infestations ranged from 12-14% a repeat sample was made three or four days later. A threshold level for aphids was used in some fields. This consisted of 10% plants infested where an infestation was the presence of an aphid colony). The method decreased insecticide applications from 25-100%) and yields were acceptable to producers.
Biever et al (1994), USA Texas In 1971, field studies based on feeding trials were conducted to establish Economic Injury Levels for cabbage. These were then extensively tested in commercial cabbage crops from 1980 to 1982. Insect populations were monitored weekly by a crop scout. Twenty plants
74
were inspected (whole plant) regardless of field size by walking a diagonal X transect and selecting plants at more or less regular intervals. A recommendation on when to spray was made based on the scout's observations. Application of sprays were often restricted to certain fields or parts of fields. Scouting reduced pesticide applications by about half, and participating growers were very supportive of the program.
Treatment guidelines for CWB, DBM and cabbage looper were developed to assist scouts and growers conducting field monitoring programs. These were based on 20 whole plant observations.
No. larvae/plant Transplants After ei ight-leaf stage
Size of larvae Transplants
Head and inner wrapper leaves
Outer leaves
Large (>7mm) Medium (3-7mm) Small (3mm)
0.3 1.0 2.0
0.1 0.1
1.0 3.0 6.0
Local crops scouts, Lockyer Valley, Queensland 1991-92 Scouts are self employed and independent of any chemical company or reseller group. Plants are chosen at random, crops are generally monitored twice per week, 5 to 10 plants/block are inspected (0.5 to 1/ha of crop). The number of plants monitored in a planting are adjusted according to pest pressure and crop growth stage. Two or three weekly plantings are often treated as a single planting (a block). The entire block may not be monitored each time because of time vs block size restrictions with one half of the block monitored at one check, the other half of the block at the next check. Scouts report that with experience "hot spots" on a farm become apparent and these get extra attention. These threshold levels served as the basis of our thresholds in 1992 and 1993. Note that they are given as number of pests/10 plants.
Crop Scout A (cabbage and cauliflower) DBM 2-3 larva/10 plants
5-10 eggs/10 plants CCC & CC 1 egg raft/plant Aphids 2-3/plant CG 1 larva or damage (in any seedlings inspected) Heliothis, CWB, loopers: as for DBM
Crop Scout B (export broccoli) DBM prebutton post button
2eggs+/plant 5 eggs/plant or 1 egg/plant + hatching larvae or 1-2 larvae/plant or 0.5 larvae/plant
Other lepidoptera larva tolerate up to 5 eggs/plant and up to 3 larvae/plant Clean up soil insects before seeding or transplanting Control aphids prior to harvesting

75
On farm trial work for this project 1992 to 1995
Threshold levels used over the four seasons on the different farms varied, particularly when high pest pressures or spray failures complicated pest management.
For small DBM larvae Broccoli Farm 11994 0.4-0.6/plant but not clear cut
Farm J 1995 0.5-1.5/plant but tolerance to 1/plant appeared to be common Cauliflower Farm D 1993 0.4/plant
Farm C 1993 0.3-0.4/plant FarmE&E2 0.1/plant Farm F 1995 0.1 -0.4/plant but not clear cut
Cabbage Farm F 1994 0.1-0.3/plant, in 1995 counts were often above 1/plant Farm G 1994 0.1/plant, in 1995 0.2-0.3/plant
For heliothis Generally seen as less of a threat than DBM, particularly in broccoli and cauliflower, but similar thresholds to DBM were used.
ForCWB Seen as easy to control and eggs were often left to hatch before taking action. Tolerance levels on most farms were around 1 small larvae or more/plant.
ForCG The damage potential of this pest is far from clear particularly for broccoli. CG caused substantial damage in the demonstration planting of cabbage at GRS in 1993, when larvae counts often exceeded 0.1/plant. In cauliflower at Farm D in 1993, counts reached 0.1/plant several times but loss at harvest was less than expected. For broccoli, tolerance levels appear to be even greater, with Farm I tolerating counts up to 0.2/plant on two occasions without spraying or substantial crop loss.
For CCC and CC Sprays were often not specifically applied for these pests although presence of egg masses contributed to spray decisions for other pests and influenced insecticide selection and/or spray timing.
Monitoring techniques
Several different methods of monitoring crops are available: • Whole plants may be inspected, inspection may be restricted to specific parts of the plant
eg. head and four wrapper leaves, or a combination of these two types of inspection can be used depending on crop growth stage.
• Plants are monitored either twice weekly, once per week or fortnightly. • Plants should be sampled randomly but the method of selection and the walk pattern over
the field varies, the prime aim being to achieve as representative a sample as possible.

76
The precision dilemma Sample size also varies. It is clear that sampling precision is a critical aspect of monitoring as without a representative sample how can an action threshold be implemented confidently? According to the precision levels given by Endersby (pers. comm.) and Chen and Su (1986), adequate sampling is unlikely to occur in most commercial situations. Cost vs accuracy considerations are very real issues to crop scouts.
The patchiness of DBM larvae in the field (Chen and Su 1986) in relation to pest density directly determines the sample size required to make an accurate assessment. Cost appears to prohibits crop scouts from monitoring an adequate number of plants which achieves some degree of statistical accuracy when pests are at low densities ie. densities at which an action threshold level plays a part in decision making. The usefulness of crop monitoring may therefore appear quite bleak, however several other factors should be taken into consideration.
In the literature quoted, little mention has been made of the effect of sequential monitoring events on precision. For instance, in 1994, one grower (Farm G) was inspecting up to 70 plants on his farm twice a week during the height of the season. This translates to 140 plants/week or 280 plants/fortnight; a sample size approaching that recommended by Chen and Su (1986) for low density pest incidence.
Beck et al. (1992) recommends resampling several days after the threshold level is almost reached in the previous monitoring event. This concept is used routinely by crop scouts, with previous'crop counts often influencing recommendations for spray decisions, pesticide selection and timing. In an at risk block, more plants are also often checked by the scout. In our trial work at GRS and on farm, DBM larvae were sometimes found before the first eggs were seen. Obviously the sampling technique used was not thorough enough to pick up early egg lays (eggs are more difficult to find in the field than small larvae because of their size).
These factors explain the use of insurance sprays, particularly at critical crop growth stages or a week or so before harvest, when insecticides are applied at low pest densities in a block or on a farm. Often the crop scout or grower has seen or heard of DBM activity in other blocks or on other farms in the locality.
Additional data is needed to increase confidence in sampling and interpretation of monitoring results. These could include: • Pheromone traps - for DBM this monitoring method has given conflicting results but there
is some evidence that it could be used as a supporting piece of information to warn of early infestations at low pest density (Hargreaves pers. comm.)
• Sticky traps - to detect the presence of female DBM adults in the crop • Use of temperature/humidity information to aid forecasting of possible DBM activity • Varying sample size according to crop growth stage and season.
1. Endersby (pers. comm.) recommends increased sample size in the later part of a cabbage crop. We suggest that increased sampling at critical crop growth stages may be more appropriate ie the seedling stage (when a larger number of plants are easily inspected without greatly increasing monitoring costs); head closure in cabbage when pests outbreaks are difficult to target, buttoning in broccoli and early head development

77
in cauliflower when pests are likely to migrate into heads (making them very difficult to target). In autumn, this technique is already in use for monitoring CG.
2. In the southern Queensland situation, increasing sample size early and late in the season when a range of other potentially destructive pest are active should also be considered. Higher temperatures in autumn and spring, speed up pest development and particularly for DBM, this increases the risk of NOT detecting a pest outbreak early and reduces the options available for managing such an outbreak.
• Destructive sampling to detect pests in heads and growing points. This method is increasingly used by crop scouts but was not investigated in this project.
Pest combinations While DBM is the most troublesome pest, other lepidopterous species need to be taken into consideration. Researchers have attempted to deal with this complexity by either using the same threshold for DBM and CWB (Endersby pers. comm., Biever et al. 1994) or converting other lepidopterous pest counts into DBM units (Chen and Su 1986). Beck et al. (1992) differentiates between DBM and CWB through larval size - any instars of DBM are considered an infestation, whereas only third to fifth instar CWB are counted (perhaps a reflection of ease of control rather than damage relationships).
In southern Queensland, the situation is further complicated by the seasonal abundance of several other pests. While DBM remains the most problematic, our unsprayed plantings show that without pesticide selection pressure, the primary pests in autumn are often CG and CCC. The other lepidopteran species (DBM, Heliothis, CC and CWB,) can cause extensive damage sporadically but are often well regulated by natural enemies with Diadegma semiclaitsum of particular value to DBM management.
Strategic insecticide applications and greater utilisation of Bt augment these biological control mechanisms. Our experiences on "high risk" farms (Farms A, D and J) strengthen these results, although it may take several years of reduced conventional insecticide use before a more diverse ecology is established on a farm. Any monitoring guidelines which seek to reduce pesticide inputs must take the relative damage potential of this range of pest species into account if it is to be of practical use in the field.
Interpretation of threshold levels
As discussed earlier, monitoring technique is intrinsically linked to threshold levels and their interpretation. This is evident in the wide variation in action thresholds given in the literature. For example, comparing mean recommendations for DBM at the early hearting stage of cabbage gives the following levels:
Baker SA 0.3 larva/plant to 2.1 larvae/plant checking 10 plants Endersby Victoria 0.9 larva/plant checking 40 plants Chen and Su Taiwan 2.0 larvae/plant checking approx. 150 plants Beck New Zealand 1.5 larva or damage/plant checking lOOplants Biever U.S.A 1.0 larva/plant to 6.0 larvae/plant checking 20 plants Crop Scout A Lockyer 0.2 to 0.3 larva/plant checking 10 plants

78
Where sampling size is low, the threshold level is not given as an absolute mean, but as a range. Biever et al. (1994) also varies the threshold depending on where on the plant the larvae are found. Baker (1984) uses number of plants infested at different crop growth stages. For his threshold at early hearting, the worst scenario threshold can be calculated to a mean of 2.1 larvae/plant ie. nine plants with two larvae each plus one plant which reaches the threshold of 3 larvae/plant. Lockyer Valley crop scouts quote very low threshold ranges.
Where sampling size is high, an absolute, less conservative threshold is given. The sample size provides more confidence in accuracy - there is less risk in being wrong! Yanan Yu et al. (1994) deal in some depth with uncertainty in pest control thresholds. The crop in question is soybean, but comments on sampling error and its impact on threshold levels are as applicable to brassica crops. The researchers state that by allowing for sampling error, the optimal action threshold used in commercial situations tends to be conservative as the consequences of over rather than underestimating the actual population could be substantial crop losses.
From the data we have collected over the past four years in commercial crops, it is clear that the threshold levels crop scouts are willing to document are very conservative. Most scouts and farmers have experienced pest outbreaks which appear to develop from very low or apparently non existent pest levels. Combined with occasional spray failures and inability to control DBM with frequent, successive applications of insecticides, crop scouts and growers are understandably risk adverse when dealing with DBM.
It's a catch 22 situation. Low tolerance to DBM ensures more frequent than necessary applications of insecticides and this in turn exacerbates resistance problems. If scouts and farmers could be reasonably confident of controlling pest outbreaks when they occur, they would also be more likely to take some risk with higher action threshold levels.
Monitoring guidelines for southern Queensland
The following guidelines are based on our experiences in monitoring commercial crops in the Lockyer Valley over four seasons, practical advice from local crop scouts and information gleaned from the literature. These monitoring guidelines represent a best bet system which needs to be adapted to individual farms.
The aim of monitoring is to obtain a representative picture of pest activity in the crop and block shape will influence walking patterns when monitoring. It may not be practical to check all parts of a crop at each monitoring event but the aim should be to cover all parts of the crop every week. For example, in long narrow plantings, check half the planting at the first monitoring event, the other half of the planting the next monitoring event.
A farm also often has "hot spots" which tend to show earlier and higher pest infestations. These could be used as early warnings and need extra attention. Pest eggs are also useful for picking up a potential outbreak but egg counts are unreliable for DBM, since these tiny eggs can be difficult to find. Keeping records of monitoring results, recommendations and control actions taken assists in improving pest management strategies and helps to refine threshold levels for the farm.

79
• Inspect 10 plants/block twice per week. Early and late in the season when there are only one or two plantings in the ground ensure that at least 30 plants are checked.
• Choose plants at random but take note of any other evidence of pest activity while walking through the crop (frass, damage including leaf mining by small DBM larvae).
• If time allows, inspect more plants in the seedling stage and at critical growth stages, particularly in warmer weather. This is especially important when there is some pest activity on the farm (or neighbouring farms) but little or no evidence of pests in a block
• In cooler weather, weekly monitoring may be sufficient as pests will not be developing very quickly.
• Destructively sample some plants, particularly at critical crop growth stages or when pest activity is suspected
Critical crop growth stages Seedling stage
to 3 weeks after transplanting (up to 4 weeks after seeding in direct seeded crops) Cabbage
head closure to early head fill (6 to 9 weeks after transplanting depending on variety and season) - the critical growth stage for cabbage is not as pronounced as buttoning in broccoli and cauliflower
Cauliflower two or three weeks around buttoning (8 to 10 weeks post transplant depending on variety and season)
Broccoli two weeks around buttoning (8 to 10 weeks post transplant depending on variety and season)
Action threshold levels The concept of a threshold level is of more use than actual threshold numbers which need to be very flexible to allow for a range of mitigating circumstances. Monitoring is of greater value as a tool for selecting insecticides and improving the timing of pesticide applications and for checking spray results. The following threshold levels are a GUIDE only. These guidelines are less conservative than those commonly quoted by crop scouts. They represent averages used by growers with some tolerance to risk and will be influenced by the following factors: • farmers willingness to take a risk • plant growth stage • pest activity and spray decisions in other plantings • previous egg and larval counts (and pupal) • time of season and weather conditions • previous spray decisions • pest spectrum • activity of natural enemies • effectiveness of insecticides on the farm (resistance and application factors) • market - destination and price

80
Pest Broccoli Cauliflower Cabbage DBM and Heliothis 4-6 smalls/10 plant 2-4 small/10 plants 1-3 smalls/10 plants Centre grub 1 larva/20 seedlings CCC and CC 1-2 egg masses/10 plants (wait for eggs to hatch) CWB 10 small larvae/10 plants (wait to see how many survive) Aphids 3 - 4 aphids found in most small seedlings checked
The lower range should be used at critical crop growth stages. Tolerance levels for export broccoli are lower particularly from buttoning onwards (use the cabbage threshold) and destructive sampling of heads should be used. To further minimise insecticide use, selectively spray plantings or blocks rather than spraying all crop on a farm.
The role of Research Stations in developing threshold levels We found pest pressure in the demonstration trials at GRS to have little relationship with the pest pressure experienced on farms. Demonstration plantings were useful for gaining experience in managing pests and growing the crop, but pest counts were of little value in developing threshold levels for on farm use because pest levels were so much higher at GRS. Two factors could account for this difference: • Edge effects - even a relatively large trial planting has a high proportion of edges • Plant stress caused by frequent handling of plants during monitoring resulting in plant
damage, water stress due to logistics of irrigating a range of small trials at research stations; compaction of soil due to frequent walking over a relatively small area while monitoring.
In the case of EPM, results from trial plantings at a Research Station should be treated with caution and tested extensively in commercial plantings.
Resistance management and insecticide selection
As a result of the resistance management strategy work in the late 1980's, growers have a good understanding of resistance and generally rotate insecticides according to pesticide group. This understanding has also facilitated the introduction of the biological insecticide Bt into the system and new insecticides should be incorporated within the insecticide group framework as they become available.
Results from the resistance monitoring work by Hargreaves (1996) were incorporated in the technical note "Checklist for managing cabbage moth", developed in 1993 as part of this project. More recent resistance work and results from on farm trial work will be used to update the checklist. The following recommendations should be considered when using insecticides within an IPM system:
Organochlorines (specifically endosulfan) • ineffective against DBM (Hargreaves 1996) • some value for CG control, an alternative to Bt for Heliothis, CCC and CC control as it is
generally considered soft on natural enemies • the softer option for managing Green vegetable bug, aphids and other sucking insects

81
1996) and they are of value as salvage sprays. Mevinphos is often used as a clean up spray Carbamates • methomyl is ineffective against DBM (Hargreaves 1996) and may aggravate DBM
problems by increasing fecundity of female moths (Nemoto 1993) - also highly toxic against natural enemies
• use methomyl only against heliothis eggs when difficulties with control occur as a result of high pressure
• effective against CG but not the preferred option • pirimicarb is the preferred option for aphid control as it is soft on natural enemies
Synthetic pyrethroids • avoid use because of toxicity to natural enemies • resistance problems in heliothis in the Lockyer Valley (Forrester pers. comm.) • resistance in DBM - documented for permethrin, fenvalerate and deltamethrin (Hargreaves
1996) • beta-cyfluthrin and fluvalinate may be of some value are these products have not been used
intensively in brassicas • pyrethroids are often mixed with Bt - usefulness of Bt/conventional insecticide mixtures
needs further investigation - avoid mixtures when possible
Organophosphates • diazinon - ineffective against DBM (Hargreaves and Cooper 1978) • prothiofos - high resistance levels in early 1990's (Hargreaves 1996) but not used
extensively for several years. It is of value in CG management and reported as less toxic to natural enemies than most other conventional insecticides
• methamidofos - some resistance problems in DBM (Hargreaves 1996) and has given erratic field results. Of value in seedling crops against CG and aphids because of its systemic properties.
• methidathion and mevinphos - DBM appears less resistant to these products (Hargreaves
prior to harvest but can give erratic results (possibly an application problem as high water volumes are needed for fumigant action) - use both products sparingly and be aware of their high toxicity for humans and natural enemies
• A NSW Agriculture leaflet (James 1993) separates organophosphates into three groups for resistance management purposes: Group 1 - mevinphos, Group 2 - prothiofos, methamidophos, Group 3 - acephate, methidathion, diazinon, chlorpyrifos.
Btk • Use as the preferred option against DBM, CWB, CCC and CC - does not harm natural
enemies • Of some use against heliothis (registered against this pest in other crops eg. cotton,
tomato) • Less effective against CG than other conventional insecticides (Hargreaves pers. comm.)
but this needs further investigation • promote importance of spray coverage and timing • integrate Bta into insecticide rotation strategy when it becomes available
82
New products/insecticide groups Integrate into IPM system as they become available and lobby industry to position these products on the market place as a risk reduction tool within the IPM system rather than as a replacement for EPM
Farmers' wisdom This advice is based on rules of thumb used by brassica growers and consultants in the Lockyer Valley. There is some evidence in project results to support the following suggestions: • Switch to strategic Bt sprays as soon as possible at the start of the season • Grow healthy plants - check that you are not stressing plants through lack of water or
fertiliser, compaction or poor transplanting • Today's pesticides are less residual - target the most susceptible stage of the pest to get the
best spray results - small larvae are the easiest to kill • Check application equipment and method of application when spray results are less than
expected - don't assume your application technique is excellent • Apply methamidofos early in the morning when the pores of the plant are open - this
systemic product may be taken up more easily (many other insecticides are best applied late in the day)
• Check transplants for pests before planting out and contact the seedling supplier for information on pesticides used in the nursery - use this information to adjust your pest management system
• Hire a crop scout or learn to identify and monitor the crop yourself
Extension and implementation issues
Two types of extension approach were used in the project: • The broad brush approach which uses farmwalks, demonstration plantings, grower
evenings and publicity to create awareness and interest in IPM and IPM techniques. This approach was used primarily during 1992 and 1993 with the demonstration plantings at GRS
• An intensive development and implementation phase which targeted a small group of growers during 1994 and 1995. This approach used action learning and adult education principles to encourage participation and ownership of on-farm trial work. Grower co-operators, consultants and extension staff were the main beneficiaries of this work although there were flow on effects as a result of on-farm field days and better quality extension material.
This change in extension approach was not planned but evolved as the project progressed.
On-farm trial work is seen as more valid by growers than trials at a research station. A farmer commented at the end of 1993, "I'm waiting until you work with cabbage", illustrating the farmer's reluctance to see our IPM system as useful until we had tackled the most difficult crop - cabbage. The large differences in pest pressure in the demonstration plantings at GRS compared to pest counts on farms suggest that we were dealing with two quite different production systems. The farmer's decision to wait until our ideas had been trialed under commercial conditions was therefore very reasonable.

83
On farm trial work gave practical results, encouraged farmer participation and is well suited for implementation work, however it does have some substantial drawbacks. Increased variability, lack of control over the system and the absence of control plots makes it difficult to draw conclusions with confidence. In only one instance, could we compare results with an adjacent control planting (Farm A, broccoli 1992), and results from this farm illustrated the importance of adequate control plots. The unsprayed plantings at GRS were useful as general check plots, but inadequate for assessing more specific developments on different farms.
It is usually difficult to convince farmers of the usefulness of leaving part of a field untreated. If a new management practice appears useful, why risk not treating the whole farm? Nevertheless, the concept of using controls on farms should be encouraged and methods for making this practice acceptable to growers should be explored.
While technology is part of IPM (eg. Bt use, application) implementing EPM is more than technology transfer (Heisswolf 1993b). IPM is a concept which requires commitment to integrate into an already complex farming system. Implementation of the concept requires a change in attitude with pesticides seen as the last rather than first option for managing pests. This is difficult to achieve when short term pressures such as pest resistance, market requirements and poor vegetable prices make it difficult for a farmer to take a long term approach to pest management which usually involves some risk taking with little immediate financial returns.
There is some evidence that action learning and adult education can assist in changing attitudes and aspirations by encouraging participation and ownership of problems and their solutions. After the intensive involvement with grower co-operators during on farm trial work in 1994 and 1995, one farmer continues to give us access to the monitoring data he pays for and states that "he is in this for the long term", another farmer has monitored his brassica crops successfully for two years, and a third volunteered to part pay for scouting costs.
Two of the farms experienced pest control difficulties while we were working with the crop but both growers remain committed to developing IPM further. They are also more proactive in their approach to managing pests and are looking to do trial work on plant stress, varietal differences and pheromone trapping on their farms. A comment made by one grower after a workshop well illustrates the value of participative trial work; "This is the first time researchers have listened to me "
Implementation work based on action learning and adult education is very rewarding but also time consuming. In this project, little publicity work was undertaken in 1994 and 1995, as resources were fully committed to the on farm work. There was a diffusion effect from the on farm field days but this was limited. How can the process be strengthened to reach a wider audience?
IPM only deals with one aspect within a farming system. While scientists are often able to focus their attention on a specific area, the farmer's attention may be engaged by other issues eg. prices, other crops, floods, drought. It would be useful to explore ways in which a specific

84
area of research and development such as IPM could be placed within the context of the whole farm system. This type of approach may highlight implementation difficulties not obviously related to the technology or practice in question. Extension work using adult education and action learning principles could achieve this by empowering farmers to become more confident, more proactive and more competent at solving problems. Skills developed can then be applied to other areas of managing the farm.
Barriers to implementation
Workers with brassica crops in Massachusetts (Leslie and Cuperus 1993 pi02) found that their greatest success in implementing IPM was with growers with whom they worked with on a weekly basis ie. growers with whom they had established credibility. Another researcher found that the driving force to IPM adoption was economics with environmental protection being of secondary importance (Leslie and Cuperus 1993 pi47).
A survey conducted by Wearing (1988) confirms these statements and provides useful insights on implementing IPM. He interviewed researchers and extensionists (including consultants) in Europe, USA, Australia and New Zealand to determine obstacles to implementation (note that producers were not included in the survey), and identified the following major barriers to IPM implementation:
Technical Lack of simple monitoring tools/action thresholds were seen as a major obstacle by extension workers but seen as less important by researchers and he suggests that this may reflect problems with the practical application of these tools
Financial The farmers perception of the risk of not spraying was seen as the major obstacle but lack of funding for extension ie the need to offer greater rewards for high calibre personnel (public and private) was also important. Wearing found that cooperative programs with farmers sharing costs and losses were an excellent method for overcoming these widespread obstacles.
Educational Lack of education of IPM developers about the perceptions of farmers appeared to be a much greater barrier to implementation than poor educational standards of farmers or lack of information and educational programs.
Organisational Lack of scouting services and extension entomologists were seen as the greatest organisational barrier. Problems with coordination and cooperation of personnel and between disciplines both at a local and regional level as well as lack of financing and planning for implementation at the outset of a program were also a severe shortcoming.
Social/marketing The competitive advantage of pesticides to other pest management techniques and the farmers satisfaction with pesticides in the absence of control failures makes implementation of IPM

85
difficult. The risks associated with overuse of pesticides - resistance, environmental, social -are hidden or longterm issues and lack of a crisis with chemical control was a widespread obstacle (in South East Queensland, insecticide resistance in DBM in the late 1980's provided the crisis). Wearing argues that pesticides fit the perceived needs of farmers very well and are marketed in that light. An IPM program must fit farmers needs and be marketed and adapted to suit local conditions.
This project was able to partly overcome some of these obstacles (social, educational) but difficulties in fitting IPM to farmers needs remain, particularly from a technical and financial viewpoint. Two interrelated aspects of IPM would encourage wider adoption of IPM concepts and techniques on local brassica farms. The first of these revolves around the risk that is associated with reducing conventional insecticide use in an atmosphere of uncertainty. The second aspect is improved understanding of pest dynamics to develop methods for avoiding/reducing pest outbreaks on farms.
Tools to minimise risks associated with implementation of IPM Pesticides that work when needed. It is very difficult for a farmer to tolerate some pests in the crop when there is no certainty that a strategic spray will overcome an outbreak which may develop from this low pest population. Any factors which will improve the reliability of insecticides will encourage greater risk taking by farmers. For example: • Improved spray application for Bt and conventional insecticides - even small improvements
in targeting pests will improve effectiveness of insecticides • Resistance monitoring - guidelines on the resistance status of commonly used insecticides
will improve insecticide selection and help avoid spray failures • Integration of new insecticides into the system - over the next year or two, several new
insecticides will be released onto the market. Reports indicate that these pesticides will be highly effective against DBM and could prove very useful to IPM. Marketing by their companies will largely determine if farmers will tend to return to scheduled spraying (until these insecticides too show resistance problems) or if these insecticides are used to give farmers confidence in implementing IPM
More reliable monitoring techniques and action threshold levels As discussed in detail earlier, cost vs sample size places crop scouts and farmers in somewhat of a dilemma. Any tools which improve the accuracy of monitoring, improves decision making and selection and timing of insecticides will encourage a reduction in insecticide input. For example: • Pheromone/sticky traps to augment monitoring data • Climatic data to assist with forecasting or estimating of pest development
Methods for avoiding/reducing pest pressure in crops A summer production break in the Lockyer Valley appears to have been successful in reducing pest pressure. Other methods which should be explored include: • Forecasting of potential pest outbreaks using traps or climatic data. On a seasonal basis,
this information could be used to encourage farmers to delay planting or shorten the production season to avoid critical periods in some seasons. Forecasting could also be

86
useful on a short term basis by providing industry with information on impending pest problems eg. an early warning system for CG or heliothis activity.
A greater range of alternative control methods for CG, CCC and Heliothis outbreaks early in the season would be useful. These may reduce early selection pressure for DBM by reducing high insecticide input in autumn and so protect natural enemies which help suppress DBM populations.

87
References
Baker, G.J (1984). Damage assessment studies and the derivation of action thresholds for larvae of the cabbage moth, Plutella xylostella (L.) on cabbages. Pest Control: Proceedings of the 4th Australian Applied Entomological Research Conference, Adelaide, 24-28 September 1994: 175-180.
Beck, N.G.; Herman, T.J.B, and Cameron, P.J. (1992). Scouting for Lepidopteran pests in commercial cabbage fields. Proc. 45th N.Z. Plant Protection Conf. 1992: 31-34.
Biever, K.D.; Hostetter, D.L., and Kern, J.R. (1994) Evolution and Implementation of a Biological Control-IPM system for Crucifers: 24-Year Case History. American Entomologist. Summer 1994: 103-108.
Brookfield, S.D. (1986). Understanding and Facilitating Adult Learning. (Jossey-Bass Publishers: San Francisco).
Chen, C.N. and Su, W.Y (1986). Ecology and control thresholds of the Diamondback moth on Crucifers in Taiwan, in Talekar N.S. and Griggs, TC. (eds.) in Diamondback moth management Proceedings of First International Workshop (AVRDC: Tainan, Taiwan).
Deuter, P.L. (1989). The development of an insecticide resistance strategy for the Lockyer Valley. Acta Horticulturae. 247:267-272
Deuter, P.L.; Frank, B.R.C.; Brough, E. and Heisswolf, S. (1992). Sustainable vegetable production systems - an action learning approach. Proceedings of the World Congress on Action Learning. Brisbane 14-17 July 1992.
Dunmall, T.A. (1989). The use of an annual hedge as a potential source of parasites and predators controlling cabbage moth {Plutella xylostelld) in combination with biological control agents such as Bacillus thuringiensis. (Final Year thesis, B.App.Sc.(RT), Gatton College UQ: Lawes, Queensland).
Endersby, N.M. and Morgan, W.C. (1991). Alternatives to synthetic chemical insecticides for use in crucifer crops. Biological Agriculture and Horticulture. 8:33-52.
Endersby, N.M.; Morgan, W.C; Stevenson, B.C. and Waters, C.T. (1992). Alternatives to regular insecticide applications for control of lepidopterous pests of Brassica oleracea var. capitata Biological Agriculture and Horticulture. 8:189-203.
Fell, R. (1988). The Adult Education approach to agricultural extension. Extension and Communication Skills Workshop Manual. QDPI Brisbane.
Futton, M. and Walker, A. (1992). Hymenopterous parasitoids associated with diamondback moth : the taxonomic dilemma in Talekar, N.S. (ed.) Proceedings of the Second International

88
Workshop, Taiwan 10-14 December 1990. Asian Vegetable Research and Development Centre.
Hamilton, T.J. (1979). Seasonal abundance ofPieris rapae (L.), Plutella xylostella (L.) and their diseases and parasites. Gen. App. Ent. 11:59-66.
Harcourt, D.G. (1963). Major mortality factors in the population dynamics of the diamondback moth Plutella maculipennis (Ant.). Memoirs of the Entomological Society of Canada. 32:55-66.
Harcourt, D.G. (1966). Major factors in survival of the immature stages ofPieris rapae (L.). Can. Ent. 98:653-662.
Hargreaves, JR. and Cooper, (1978). Stand back cabbage moth. Queensland Fruit and Vegetable News. 49:131-132.
Hargreaves, J.R. (1996). Insecticide resistance and insecticide management strategies for three vegetable pests in south east Queensland. Horticultural Research and Development Corporation, Project report reference v/0021/rl.
Hassan, S.T. (1976). Parasites of Pieris rapae L. in south-Eastern Queensland. QldJ. Agricult. Anim. Sci. 33:73-76.
Heisswolf, S. and Deuter, P.L. (1991). Sustainable production systems in broccoli. Proceedings of the 1st National AuSHS Conference "Clean and Green in the 90 's". Sydney, 30Sept-3Oct 1991: 177-182.
Heisswolf, S. and Deuter, P.L. (1992). Growing broccoli in Queensland. (Department of Primary Industries: Brisbane, Queensland).
Heisswolf, S. (1992). Evaluation of a management strategy for reducing insecticide resistance in cabbage moth, Plutella xylostella. Proceedings of the 1992 Horticulture Extension Conference, Yeppoon, 6-10 April 1992: 162-166.
Heisswolf, S. (1993). Extending the concept of integrated pest management in brassica vegetable crops. Proceedings of the QDPI Extension Conference "Gearing up for the Future". Rockhampton, Australia, 2-4 February 1993: 159-162.
Heisswolf, S. (1993). Integrated extension for integrated pest management - a case study in brassica vegetable crops. Proceedings of the Australia Pacific Extension Conference, Surfers Paradise, Queensland Australia. October 12-14, 1995 Vol 2: 458-461.
Heisswolf, S. (1995). Learning to use action learning cycles in Courts, J.; Fell, R. and Woods, E. Rural Extension Centre Learning Projects Volume 1, UQ Gatton College, June 1995.

89
Holdaway, F.G. (1944). Insects of vegetable crops in Hawaii today. Proceedings of the Hawaiian Entomological Society. 12:59-80.
Hunold, A. and Haigh, R. (1990). Companion planting dill and broccoli as a means of pest control. (Project report, Horticulture, University of Western Sydney, November 1990).
James, L. (1993). A strategy for a better kill of cabbage moth grubs. Technical note, NSW Agriculture, Windsor, November 1993.
Knowles, M.S. (1990,). The Adult Learner: A Neglected Species. (Gulf Publishing Company: Houston).
Kolb, D. (1984). Experimental Learning-Experience as the Source of Learning and Development. (Prentice Hall: New Jersey, USA).
Latheef, M.A. and Irwin, R.D. (1983). Seasonal abundance and parasitism of lepidopterous larvae on Brassica greens in Virginia. Journal of the Georgia Entomological Society. 18:164-168.
Leslie, A.R. and Cuperus, G.W. (1993). Successful Implementation of Integrated Pest Management for Agricultural Crops. (Lewis Publishers: Boca Raton, Florida USA).
Mathews-Gehringer, D. and Lachowski, E. (1993). Habitat Reservoirs: 'Home Sweet Home' for Beneficial Insects. International Ag-Sieve. Vol IV(2):4&5.
Muggeridge, J. (1942). The white butterfly {Pieris rapae L.). N.Z. Jl. SCI. Technol. 24:107-129.
Mumford, A. (1993). Putting learning styles to work: an integrated approach. Journal of European Industrial Training. 17(10):3-9.
Nakahara, L.M.; McHugh, J.J.; Otsuka, C.K.; Funasaki, G.Y and Po-Yung, L. (1986). Integrated control of diamondback moth and other insect pests using an overhead sprinkler system, and insecticide and biological control agents, on a watercress farm in Hawaii in Talekar N.S. and Griggs, TC. (eds.) in Diamondback moth management Proceedings of First International Workshop (AVRDC: Tainan, Taiwan).
Nemoto, H. (1993). Mechanism of resurgence of the diamondback moth, Plutella xylostella (L.)(Lepidoptera: Yponomeutidae). Japan Agricultural Research Quarterly. 27(l):27-32.
Othman, N. (1982). Biology of Crocidolomia binotalis Zell. (Lepidoptera: Pyralidae) and its parasites from Cipanans area (West Java). Seames Regional Centre for Tropical biology, Bogar, Indonesia.

90
Rajakulendran, V. (1993). Use of Bacillus thuringiensis on vegetable crops in Australia Proceedings of the second Canberra Bacillus thuringiensis Conference, Canberra, Australia, 21-23 Sept 1993.
Riechert, S.E. and Bishop, L. (1990). Prey control by an assemblage of generalist predators: spiders in garden test systems. Ecology. 71(4): 1441 -1450.
Ru, N. and Workman, R.B. (1979). Seasonal abundance and parasites of the imported cabbageworm, diamondback moth and cabbage webworm in north east Florida. The Florida Entomologist. 62:68-69.
Sachan, J.N. and Gangwar, S.K. (1980). Vertical distribution of important pests of cole crops in Meghalaya as influenced by the environmental factors. Indian Journal of Entomology. 42:414-421.
Singh, O.P. and Rawat, R.R. (1980). Natural enemies of cabbage webworm, Crocidolomia binotalis Zell. at Jabalpur (Madhya Pradesh). Indian Journal of Entomology. 42:324-326.
Sivapragasam, A. and Heong, K.L. (1984). The effects of temperature on adult survival, oviposition and the intrinsic rate of increase of Plutella xyhstella (L.). Mardi Research Bulletin 3:341-347.
Srinivasan, K. and Krishna Moorthy, P.N. (1991). Indian mustard as a trap crop for management of major lepidopterous pests on cabbage. Tropical Pest Management. 37(1):26-32.
Sudarwhohadi, S. and Setiawati, W. (1992). Biology and control of Crocidolomia binotalis in Indonesia in Talekar, N.S. (pd.). Proceedings of the Second International Workshop, Taiwan 10-14 December 1990. Asian Vegetable Research and Development Centre.
Sutton, B.G. and Wright, R.R. (1994). Improving resistance of brassica vegetable crops to attack by caterpillars. RIRDC National Workshop Proceedings - Managing insecticide resistance in diamondback moth. Melbourne 15-16 June 1994.
Tabashnik, B.E. and Mau, R.F.L. (1988). Suppression of diamondback moth Plutella xylostella by overhead irrigation. Journal of Economic Entomology. 79:189-191.
Talekar, N.S., Lee, S.T. and Huang, S.W. (1986). Intercropping and modification of irrigation method for the control of diamondback moth in Diamondback moth management Proceedings of First International Workshop (AVRDC: Tainan, Taiwan).
Talekar N.S. (ed.)(1992). Diamondback moth and other crucifer pests. Proceedings of the Second International Workshop, Taiwan 10-14 December 1990. Asian Vegetable Research and Development Centre, Taiwan.

91
Teakle, R.E. (1991). Present use of, and problems with, Bacillus thuringiensis in Australia Proceedings of the Workshop on Bacillus thuringiensis. Ed. Milner, R. J. and Chandler, C , CSIRO, Canberra, 24-26 Sept 1991.
Tennant, M. (1991). Establishing an'Adult" Teaching-Learning Relationship. Australian Journal of Adult and Community Education. 31(l):287-292.
Yamada, H. and Kawasaki, K. (1983). The effect of temperature and humidity on the development, fecundity and multiplication of the diamondback moth Plutella xylostella. Japanese Journal of Applied Entomology and Zoology. 27:17-21.
Yanan Yu; Gold, H.J.; Wilkerson, G.G. and Stinner, R.E. (1994). Uncertainty in pest control thresholds: application to chemical control of corn earworm on soybean. Agricultural Systems. 44:19-33.
Waterhouse, D.F. and Norris, K.R. (1987). Biological Control: Pacific Prospects. Inkata Press, Melbourne.
Waterhouse, D.F. and Norris, K.R. (1989). Biological Control: Pacific Prospects -Supplement 1. ACIAR monograph No. 12.
Wearing, C.H. (1988). Evaluating the EPM implementation process. Ann. Rev. Entomol. 33:17-38.
Wilcox, P.R. (1986). Resistance of cabbage moth (DBM xylostella L.) to pyrethroids in the Lockyer Valley. (Graduate Diploma Study Project, University of Queensland, Gatton College).
Wilson, F. (1960). A review of the biological controls of insects and weeds in Australia and Australian New Guinea. Commonwealth Institute of Biological Control, Ottawa, Canada, Technical Communication No. 1.
Yarrow, W.H.T. (1970). Parasites of Plutella xylostella (L.) in south eastern Queensland. Japanese Journal of Applied Entomology and Zoology. 27:17-21.

92
Appendix 1 Gatton Research Station Demonstration Trials
Table 1: Details of shelterbelt planting dates and composition for treatments A1 and A2
Planting No.
Shelterbelt Crop Comments
Sowing date
Species composition
Transplant date
Harvest date
1992 cauliflower 1 6 Feb Bariey
and canola 12 Mar 9-22 Jun large percentage of canola dieback a
month after sowing, barley severely infected with rust which reduced crop stand
2 11 Mar
Bariey and canola
14 Apr 9-20 Jul Good stand of canola and barley although some rust on barley
3 mid Apr
Bariey and canola
15 May 6-17 Aug Good stand of canola and barley, no rust on barley
1993 cabbage 1 27 Jan Barley
oats triticale wheat
15 Feb 30 May Good crop stand for all plantings but mice were frequently seen in? shelterbelts.? 2 Late Mar
Barley oats triticale wheat
29 Apr 30 Jul
Good crop stand for all plantings but mice were frequently seen in? shelterbelts.?
3 Early Jun
Barley oats triticale wheat
15 July 21 Sep
Good crop stand for all plantings but mice were frequently seen in? shelterbelts.?
20m
20m
_13.5
ki.5-> f2n
I5m
fo"
15m
]:„,
AoL- B e c^'ly
Douple ro vs of cauli! lowers .ioVijige.ori beds
Guam
A I - St- plus •s4*.+Mk<-c,
Gu.
-o
5?
5 i J if)
North
4 13.5 -n >
; ' ;G; | •Ju;M;
a : '# Guarc
G u 20
; ' ;G; | •Ju;M;
. C*.t
)oubh rows on be
of cai is
liflow «/ G u
m I5m
a r
f
;;<J;K
\'
h-s, -<wH>e. •ice- < \Ay d
>, f
;;<J;K
It! Guarc
d
Figure 1: Demonstration plantings block layout

93
Appendix 2 Selected Extension Material

LIFTOUT —TECHNICAL FEATURE
Integrated pest management in broccoli By Sue Helsswolf and Peter Deuter, DPI Gatton.
Insecticide resistance in the cabbage moth has been a problem for Lockyer Valley broccoli growers since the late 1980's.
The 3-V strategy was developed in 1988 to help slow resistance development. Growers were asked to rotate insecticides from different chemical groups by excluding one group of chemicals each month.
This strategy helped to slow resistance build up by promoting changes in the, use of insecticides. A break in broccoli production over summer, improved spray application and monitoring of pests are also important and are the cornerstones of Integrated Pest Management in broccoli.
Many Lockyer Valley broccoli growers are also using the biological insecticide Bacillus thuringiensis (Bt - sold under the tradenames Dipel, Thuricide, Biobit and Novosol) to control caterpillars.
Integrated Pest Management (IPM) aims to combine a number of different pest control practices so that the risk of pest outbreaks is reduced.
Why use IPM? IPM aims to reduce reliance on conven
tional insecticides by including other methods of managing pests. This approach to pest management reduces insecticide use, can reduce costs and is more likely to give effective control of pest outbreaks.
Practices which are important for IPM in broccoli are shown in the diagram right.
Production break In areas with warm to hot summers, no
broccoli production over summer is Important for breaking the cabbage moth breeding cycle.
Crop rotation and hyaiene
Risk of pest outbreaks is reduced by avoiding double cropping, planting into well prepared soil and destroying brassica crops as soon as they are harvested.
Separating blocks of broccoli plantings can slow movement of pests from old into young crops.
Monitoring of pests Knowing what pests exist and how many
are active in the crop will help you decide
Cabbage centre grub burrows into the growing point of seedlings. Note the webbina and osil particles in the heart of this plant.
Monday, 21 December 1992
whether to spray, which insecticide to use and when it is best applied.
Insecticides Both convent ional insect ic ides (eg.
Pyrethroids. Organophosphates) and biological insecticides (eg. Bt) are used when damaging numbers of pests are present in the crop.
Beneficals Most insect pests have a range of natural
enemies which will help reduce pest numbers. Predators such as ladybirds and QUEENSLAND FRUIT & VEGETABLE NEWS
spiders feed on small pests. Some wasps parasitise caterpillars, often in large numbers. Insect pests also suffer from diseases caused by bacteria, fungi and viruses.
To protect these beneficials avoid using broad spectrum insecticides whenever possible. For example, Bt is active against caterpillar pests but safe to beneficals.
How to monitor pests Crop monitoring involves counting the
(Continued page 12)
Page 11

LIFTOUT — TECHNICAL FEATURE!
f-
Diadegma wasp
Page 12
'. *'
searching broccofi for cabbage moth caterpillars
QUEENSLAND FRUIT & VEGETABLE NEWS
(From page 11) number of pests on plants selected at
random In a field of broccoli. This will provide a picture of what is happening in your crop.
As a general guide, 10 plants should be inspected per planting or In a block of plantings if plantings are small (less than an acre each). Sometimes more plants will need to be looked at to obtain a picture of pest actfvily, sometimes less.
What to look for • If moths or butterflies are active, eggs
are probably being laid.
• Egg present - indication of a potential problem.
• Pinholes and leafmlning - caterpillars are hatching and feeding.
• Small caterpillars - susceptible to Insecticides
• Large caterpillars and pupa - too late for insecticides.
Are beneficials active? Are there many aphids or other minor pests present? What about diseases and weeds?
Insecticides are applied only when the action threshold levels are reached.
The action threshold is the level of pest numbers likely to cause economic yield losses
Action threshold levels for broccoli
How many pests are too many? Use the following numbers as a starting point for making a spray decision.
Monitoring 10 plants per field, two times per week.
Cabbage moth: 5 eggs in 10 plants and/or 2 to 4 small caterpillars.
Centre grub: 1 plant with caterpillar or damage (watch for webbing and soil In the centre of seedlings).
Cluster caterpillar: 1 egg raft or colony of newly hatched caterpillars.
Cabbage white butterfly and heliothls caterpillars: Add to cabbage moth counts.
What influences action threshold levels?
Action thresholds are a guide only. They need to be flexible so that the following factors can be taken into consideration when making a spray decision.
• Weather - temperature, rain, wind? In warm weather pest numbers build up
more rapidly.
• Crop growth stage - seedling, buttoning, near harvest?
• Reduce the action threshold In seedlings and when plants are forming heads.
• Where on the plant were Insects found?
• If hearts are dean, an odd caterpillar on older leaves may not be a problem.
Monday, 21 December 1992
Beneficials - are they active?Th« reduce pest numbers
Other cultural operat»oi fungicides, harvesting most important ? Mtirket - pric**, domestic
rnqal
poft?
Making a spray decisio All thuse Uiclon, need to be conside
before deciding: — If spraying is necessary — which insecticide to use if a spray
required — when to apply this insecticide
Deciding which insecticide to use
Which pest is the main problem? Is there another pest that could be
potential risk? What pesticide was last used? Fr
which pesticide group? Which Is the most specific insecticide
this pest problem? Will ft affect ben cials?
Asking these questions will help y select the most suitable insecticide fo particular pest problem!
A follow up article looking at how to sel an insecticide for a particular pest proble will appear In Queensland Fruit Vegetable News in the New Year.
Cabbage moth eggs can be laid singly long. (The steel pin gives an idea of size
Monday, 21 December 1992

vv •
*SJS
;r|l
* \
AUSTRALIA PACIFIC EXTENSION CONFERENCE Surfers Paradise Queensland Australia October 12-14 1990 Under rhe auspices of the
Standing Committee on Agriculture and Resource Management
i*3 '
Conference and Workshop Series QC93012
VOLUME 2
^sa**
Compiled by:
Jeff Courts Peter Van Beek Bruce Frank Gus Hamilton Charlie Nolan
INTEGRATED EXTENSION FOR INTEGRATED PEST MANAGEMENT - A CASE STUDY IN BRASSICA VEGETABLE CROPS
S. HEISSWOLF Extension Horticulturist Queensland Department of Primary Industries Gatton, Queensland 4343 Australia
SUMMARY
The technology transfer model of extension is increasingly seen as a simplistic view of how extension achieves change in rural communities. This paper explores an expanded model of extension by discussing how this model may apply to extending the concept and components of an Integrated Pest Management System for brassica vegetables. In this model, technology transfer is seen as only one aspect of extension with problem solving, education and human development becoming more important as the complexity of the situation increases. This model of extension gives some insights into how and why Lockyer Valley producers are changing their attitude to pest management ie. starting to take on board the concept of IPM.
KEYWORDS
Integrated Pest Management; Brassica vegetables
INTRODUCTION
Pest Management has been a key production issue for the brassica vegetable industry in the Lockyer Valley in Queensland since identification of insecticide resistance in the Cabbage moth, Plutella xylostella, in 1985 (Wilcox, unpublished data). Table 1 outlines the sequence of events and activities designed to address the pest management issue.
Table 1. Events and activities associated with pest management of brassica vegetable crops in the Lockyer Valley since 1986.
1986/87 CRISIS POINT - crop failures and plough outs Resistance monitoring initiated
1988 RESISTANCE MANAGEMENT STRATEGY put in place - rotation of insecticide groups by exclusion
Industry and grower involvement through public meetings, local publicity, insect ID workshops
1988-90 STRATEGY LED TO - break in production - improved spray application - insect monitoring
Economics Technology Consultants
1990 EVALUATION OF STRATEGY - high initial adoption rate had dropped substantially - increased awareness of responsible insecticide use
Series of individual interviews
1990/91 SUSTAINABLE BROCCOLI PRODUCTION PROJECT - use of biological insecticides (Bt), action threshold levels, insect monitoring and shelterbelts
Demonstration plantings, farm walks
1992- BRASSICA PEST MANAGEMENT PROJECT -focus on IPM (including reduction of insecticide use, Bt use, beneficiats, action thresholds, monitoring)
Demonstration plantings, farm walks, grower meetings, onfarm trial work

BACILLUS THURINGIENSIS AND INTEGRATED PEST MANAGEMENT
Two key elements underpin brassica production as an ideal candidate for IPM. Major brassica diseases in Queensland are bacterial ie. chemical control measures are not very effective; and Bacillus thuringiensis kurstaki (Btk), a biological insecticide, is specific to the the Lepidoptera group of insects. Key pests of brassicas in Queensland fall into this category allowing Btk to replace most traditional synthetic insecticide sprays.
Btk has been available in Australia for about 15 years but usage has been vey low until two years ago (Teakle, 1991). Until the crisis point in the late 1980's, when cabbage moth resistance emerged as a major problem for the industry, there was no need to change to what were then seen as less "efficient" methods of pest control.
Many producers were receptive to an alternative approach to pest management for the following reasons:
the resistance problem had no quick fix solution producers had a greater understanding of insecticides increasing environmental/saftey concerns of the community (of which growers are a part) Producers, industry and institutions were moving in a similar direction
Resistance had changed a relatively simple proceedure (applying an insecticide on a regular basis) to a more complex management issue (with environmental and community overtones).
The Sustainable Broccoli Production Project in 1990/91 not only showed that reduced reliance on conventional insecticides was possible but presented Btk as a component of IPM systems. Producers were asked to embrace a concept rather than new technology only, although interest was often stimulated by technology based components, eg. shelterbelts, Btk application and rates, action threshold levels.
IPM AND THE EXPANDED EXTENSION MODEL
Bloome (1991) defines four paradigms of extension, which although different are compatible:
Technology transfer - results from research are rapidly disseminated to rural producers by extension agents
Problem solving - needs of clients are identified and extension finds information that assists people in solving their problem
Education - extension promotes information sharing and aims to empower people to solve their own problems
Human development - extension aims to empower people to make their own decisions, to develop a person's independence and encourage people to govern themselves.
The relationship between these four models is well illustrated in diagrammatic form by Van Beek and Coutts (1992) who link these models according to the complexity of situations and degree of technical know how or people orientated skills required. In Figure 1 this view of the expanded model of extension is used to determine where different components of IPM might fit and how these may be interrelated.
The location of some of these components is somewhat arbitrary as more than one type of extension process is likely to be working at the one time. For example, an action threshold level based purely on pest numbers and a complementary spray recommendation fit well into the technology tranfer/problem solving area but in reality are only the starting point for making a spray decision.
Proceedings of the Australia-Pacific Extension Conference, Gold Coast Australia 1993 4 5 9

Other variables such as weather conditions, crop growth stage, market requirements, activity of beneficials etc must be considered so that the producer can confidently make a decision based on risk assessment of Jhis. particular crop on this particular farm.
This scenario illustrates only one component of IPM - to spray or not to spray - as a complex decision making process, most of which would be difficult to quantify or analyse. To make this decision competently, the farmer needs to not only have a good understanding of the technology involved eg. spray application, action thresholds; but an appreciation of IPM as system which is influenced by many different and often poorly understood factors. Extension must work with farmers to develop tools which aid decision making (education) and to empower farmers to look for management solutions which will work on their properties (human development).
HUMAN DEVELOPMENT
Increasing complexity of situations
Figure 1 A diagrammatic representation of the expanded model of extension. All four facets of this model play a role in extending the components and concept of IPM to brassica producers.
CONCLUSION
Industry and grower involvement in developing solutions has been a critical aspect of extension activities since the resistance problems first surfaced as a major problem in the late 1980's. As brassica growers continue to change their attitude to pest management, greater emphasis must be placed on the education and human development models of extension if the momentum of IPM is to be maintained.
460 Proceedings of the Australia-Pacific Extension Conference, Gold Coast Australia 1993

REFERENCES
Bloome, P. (1991). Seminar Address to QDPI extension staff. October 1991, Brisbane.
Teakle, R.E. (1991). Present use of, and problems with, Bacillus thuringiensis in Australia. Proceedings of the workshop on Bacillus thuringiensis. Ed. Milner, R.J., and Chandler, C. CSIRO, Canberra, 24-26 September 1991.
Van Beek, P. and Coutts, J. (1992). Extension in a knowledge systems framework. Circles - newsletter of the QDPI systems study group. March 1992.
Wilcox, P.R. (1986). Resistance of Cabbage moth (Plutella xylostella L.) to Pyrethroids in the Lockyer Valley. (Graduate Diploma Study Project, Queensland Agricultural College, Gatton).
Proceedings of the Australia-Pacific Extension Conference, Gold Coast Australia 1993

'•"in.'un.'i.i DfFAITMINT OP
puMwrwDusim
EXTENSION CENTRE G A T T O N Q U E E N S L A N D
"Working with
, Wural people to
build a better-
future"
' ; V
'. *" sm
THE UNIVERSITY OF QUEENSLAND
LEARNING PROJECTS Volume 1 June 1995
t •'' S / •
i: >\i •\ i

LEARNING TO USE ACTION LEARNING CYCLES OR Making pest management in cabbage more interesting?
SUE HEISSWOLF Department of Primary Industries PO Box 245, Gatton Qld 4343
INTRODUCTION
Take one Adult Education Course, some cabbage trials on local farms, two enthusiastic cabbage growers, a switched on pest consultant and an extension officer who's bored with the usual field day format, use an Action Learning format to plan and participate in a cabbage field day .... and anything may happen.
My primaty objective in planning and participating in the field day was to:
• learn how to use action learning cycles;
but also to:
• increase my (and the other participants) understanding of IPM concepts; • facilitate a different type of field day; and • gain some insights into adult learning - theory and practice.
BACKGROUND
Insecticide Resistance in Cabbage moth (Plutella xylostella), a key pest of cabbage, cauliflower and broccoli crops, has changed pest management from a relatively simple procedure (spray every 7 to 10 days) into an often complex decision making process. Insecticides may not work, pest outbreaks can occur on a regional scale or may only occur on one or two farms in a locality, what works on one farm may not work on another....
Under the banner of Integrated Pest Management (IPM), we first trial different pest management options at the Gatton Research Station, then test drive these ideas on local farms by monitoring pests and making recommendations. While we've held a number of farm walks at the Gatton Research Station, this was our first field day on REAL FARMS, and we wanted to make the most of the opportunity.
METHOD Some sketchy ideas on what might happen!
By the end of the first residential part of the training course, I had an action plan on what I wanted to achieve in this learning assignment (see objectives outlined above). In addition, I intended to actively encourage the two farmer co-operators and the crop consultant to participate in the planning and conducting of the field day.
Action learning - experiential learning - learning through experience
Different authors (Kolb & Pedler et al. in McGill and Beaty 1992; FeU 1988) have used different
2 REC Learning Projects, Volume 1

terms to describe the four stages of the action learning cycle. My understanding and interpretation of this cycle is illustrated in figure 1.
Implementing
acttanfchange
PUNNING
Tktaktag Understanding Generalisation
WHAT DID I LEARN FROM THE ACTIVITY?
Expcrtaec Action
Experience
ACTIVITY
REFLECTING
Figure 1. Action learning cycle according to Fell (1988), Kolb (1984), Pedler et al. (1986), and MY INTERPRETATION of the four different stages of this cycle.
Using this action learning cycle as a guide, my initial action plan for the learning project consisted of a spiral of the four stages of action learning, illustrated in figure 2.
The field day itself was going to move from lecture style presentations at the first farm through to a facilitated discussion at the second farm, perhaps closing with an analysis of pest management costs relative to overall production costs. Costs were to be generated from farmers during a group session.
This approach would take into consideration the theories of the Staged Self-directed Learning model (SSDL) proposed by Grow (1991) moving from Stage 1 & 2 learning - Teacher (me) as authority or motivator of dependant or interested learners - to Stage 3 learning - Teacher as facilitator of a group of involved learners.
REC Learning Projects, Volume 1 3

Develop action plan
PLAN
Finalise field day format Collate data & graphs
WHAT DID I LEARN? ACT
Draft report
Interpret data & graphs with farmer cooperators
& consultant
ACT
WHAT DID I LEARN?
Review field day
using focus group
REFLECT
Figure 2. Action plan for preparing and participating in a field day for cabbage growers (as part of an adult learning project)
RESULTS and DISCUSSION What actually happened and why!
Planning the field day
The planning phase of the field day involved two visits to each farmer co-operator (the consultant came with me for the first visit). It also involved several phone calls between the farmers, the consultant and myself. Early in discussion with the first farmer during the first visit, it became apparent that he had his own ideas on what his peers (other cabbage growers) would find useful and how these ideas could be presented. Some of these ideas coincided with my own, others didn't. This was also the case with the second farmer.
Both farmers were also more interested in process (how the field day should run) than content (what was to be discussed). Perhaps this was because the main 'learnings' from the season's work had already crystallised for each farmer. By the end of the second visit we had decided on the following:
4 REC Learning Projects, Volume 1

• half day field day with date set;
• attendance to be by invitation only, participants expected to RSVP;
• travel to farms by minibus, pitstop for afternoon tea at a local hotel;
• field notes for participants to focus on farmer co-operators main 'learnings' and these to be presented in the farmer's own words as answers to questions. Simplify data and results where possible eg. use line rather than bar graphs. Both farmers stressed that we should use layman's terms for field notes and during discussion;
• limit lecture style presentation to minimum (need to outline season's work only so participants had some idea on what was involved); and
• walk through cabbage field before lecture and allow plenty of time for discussion.
The field day
While preparation for the field day had been extensive, we had only a general agenda for the field day which related to where and when. The main 'learnings' of the farmer cooperators were to be used as topics for discussion. I was to provide background of the season's work at the first farm using a whiteboard (infield) before proceeding to the discussion phase. At the second farm, we planned to conclude discussions with costs of pest management (farmer cooperator to lead discussion, I to record on whiteboard).
Some comments on what actually happened
• By the time we arrived at the first farm, the half hour trip on the minibus had broken the ice and discussions were well underway. After inspecting cabbage in the field, participants were asked to assemble around the whiteboard so we could outline our pest management program for the season. We had some difficulty in holding their attention as growers obviously had many questions to the grower cooperator and were already in discussion mode.
• At the second farm, discussion of pest management costs proceeded without use of the whiteboard as I felt this teaching aid would have disturbed the mood of the discussion. Talk about costs led (probably inevitably) to discussion of marketing and prices and the importance of clean crops, i.e. the importance of pest management to overall farm management and profitability - the big picture.
• At the end of the day, growers politely declined to participate in a further short meeting to discuss the outcomes of the field day (I was hoping to use the focus group format), but suggested we evaluate the field day immediately. I did this with about half the farmer participants at the close of the field day.
How does all this fit into the action learning cycle?
I had some difficulty in deciding which stages in the planning and participation of the field day fit where on my initial action learning plan (figure 2). After much deliberation, it became apparent that this initial model may not be the best explanation of the sequence of events. It is probably more accurate to describe this learning assignment in two main but interrelated action learning cycles; a
REC Learning Projects. Volume 1 5

planning cycle (figure 3) which represents the planning stage in the second cycle (figure 4) which centres on the field day activity.
The preparation stage
As indicated in figure 3, the main activity of this cycle was the initial visit to the farmer cooperators with the consultant. The other contacts, i.e. phone calls and second farm visit, revolved around checking back to other members of the 'planning' team to finalise details.
Involve cooperators Requires time commitment r Be flexible
What did I learn from the activity?
Planning
Discuss field day with farmers & consultants
Activity
Think about and check back about process & content
Reflecting
Figure 3. Using action learning to design a field day
The activity stage
As shown in figure 4, the main activity of this cycle was the field day, with the format and content changed quite dramatically from my original action plan as a result of using a participatory approach.
The field day activity was reviewed:
• with eight participants immediately after the field day (not planned); and
• several days later with two participants (the consultant and a colleague who had participated in the field day) using the ORID discussion method (Observe, Reflect, Interpret, Decide).
This intensive reflection phase was critical to getting the most out of this learning project and to deciding which tools and ideas may be of particular value in my future work as an extension officer.
6 REC Learning Projects, Volume 1
PUnnlng
Preparing trie the field day
Be flexible Good preparation is crucial Group makeup is important Tap into farmer experience
Plan the evaluation Mefce it a soaal occasion
Reflect on actMies
Whatdidl lejmfrom thetctivity
Review field day with participants
Reflecting
Figure 4. Using action learning to plan and participate in a field day.
Theory and practice Reflecting on the field day by reading papers on adult education
In much of the literature on adult education, adult learners are seen as active participants in the learning process (Salmon 1981). Many authors also describe adults as self directed learners (Grow 1991; Tennant 1991; Brookfield 1986; Tough 1978). Tough (1978) found that 80% of adult learning is initiated, planned, directed and carried out by the learner him/herself - an important aspect of adult learning must therefore be that it is voluntary.
Grow (1991), while stating that adults are self-directed, argues for a staged approach to 'teaching' this self-direction. He suggests that students move from dependant learner (SI) through to interested (S2) then involved (S3) to finally achieve self directed learning (S4). Teacher/Student mismatch occurs when the learner's stage is not matched with an appropriate teaching style (Tl - authoritarian, T2 - motivating, T3 - facilitative, T4 - consultative).
Although his SSDL model first gave me the idea to use a progressively more facilitative teaching system at the field day, upon reflection I have some difficulty with this modeL Firstly, participants at the field day showed some resistance to the lecture style presentation at the first farm but freely participated in the facilitated discussions. Secondly, Grow's observations appear to be based on college students, Le. young adults only recently out of the classroom system. So how would his theories relate to farmers and crop consultants (mature adults with a wealth of experience) ?
Perhaps participants did not respond well to the lecture style of presentation because the lecture was not well prepared (not dynamic enough in the T2 style), perhaps the material presented could be just as easily covered by discussion rather than lecture (T3 style), perhaps I had removed myself from the position of expert - the farmer co-operator now being seen as the expert (and the ideal candidate for the presentation?).
REC Learning Projects, Volume 1 7

Grow himself admits in his paper that progress of a student or class (or group?) will rarely be linear j and details another version of his SSDL model which places the S3 style at the centre with SI, S2j and S4 methods used depending on the subject matter (context?) and group makeup (cognitive styles? in relation to different contexts?). The teacher serves primarily as a group facilitator. To me,] this appears to be a more realistic model. '
My explanation, rather than Grow's theory of mismatch, is that participants did not see the material' presented as of great importance when placed against the opportunity to discuss the pest problems' with their peers and the farmer expert. If the presentation had been on another subject, for instance a specific, technical topic such as spray adjuvants, the response may have been different. Which brings' me to my main disagreement with Grow's SSDL theory and its suitability for adult learning. Since1
adults are self directed learners with experience:
'Adults who are learners in one context (or moment) may become teachers in another' (Tennant, 1991). ,
So perhaps it is not the mismatch between teacher and learner style but the underlying assumption that the 'teacher'may make about the adult learner, i.e. whether or not the teacher sees the learner as, a fellow adult with a wealth of valuable experience from which the teacher may learn. So is thi^ relationship between teacher and adult learner important?
Tennant (1991) discusses three dimensions of adult learning: the political (how power is distributed, between teacher and learner); the philosophical (how this relationship serves the purpose and aims ot the educational activity, and the psychological (the attitudes, expectations and actions of teachers and learners towards each other). These dimensions are interrelated and seem to revolve around different aspects of the relationship between the teacher and learner. Using the field day (from planning to reflection) to further explore these dimensions:
• The political dimension - power did not reside in one or two teachers. The grower cooperator was seen as the expert on his farm, with other members of the planning team (the other growet cooperator, the consultant and myself) having expert knowledge in relationship to this season'' trial work and other participants having knowledge to contribute in relation to pest management on other farms.
For instance, both the consultant and I felt we could not revert back into the expert mode by strongly disagreeing on some technical comments made by a participant (wrong in our view' without endangering our creditability as participants. While we voiced our disagreement, we also did not have enough 'expert' knowledge of the topic to justify strong disagreement.
Other potential 'experts' within the group (extension officer, pest consultant, entomologist. grower representative) were also not introduced as experts, i.e. labelled as experts in the group.
• This change in power dynamics influenced the philosophical dimension - the relationships betweer teachers and learners provided an atmosphere of equality where everyone's comments on the complex issue of pest management were valid - most (not all) participants took an active part anc contributed their experiences to help improve understanding of pest management.
• Tennant believes that the emotional (psychological) dimension is as least as important ; consideration as the political or philosophical dimensions - feedback from farmers indicates thai
8 REC Learning Projects. Volume 1

they felt positive about the field day because it was a learning experience with a great deal of social interaction - a feel good activity.
If the power distribution is such that the relationship between teachers and learners suits the aims of the educational activity, will the psychological dimension also suit the learning experience?
At the field day, the educational aim was to gain more insight into a complex situation, IPM, where there are few simple, right or wrong answers and no real 'experts' on all aspects of IPM. (Almost?) equally sharing power amongst participants created relationships which suited the purpose of the field day and produced attitudes, expectations and actions amongst participants which also suited the learning experience. This is illustrated by the openness of the two farmer cooperators and the lively, involved, sometimes conflicting discussions that took place during the afternoon. For a largely technical issue with definitive answers this type of learning experience may not be suitable.
Some thought should also be given to those participants who took a less active part in the field day discussions. The work by Shorn (1976) on the relationship between cognitive style and experiential learning appears useful here. He suggests that basic psychological preferences of participants will influence the group climate and how individuals within that group perceive the learning experience. The psychological preferences of the individual will also have a bearing on how the leader is perceived. These variables are shown in figure 5 in relation to the field day.
According to Shorn's study, Feeling/Perceiving types are more likely to learn in a group setting with a facilitative leader and open, support group climate; while Thinking/Judging types are most likely to prefer knowledge to be presented in a logical and impersonal fashion within an atmosphere of intellectual clarity? Can I conclude that participants at the field day were largely the Feeling/Perceiving type with those who did not participate freely more likely be Thinking/Judging types? Surely the dynamics of a group are much more complex and cannot be broken into their components without losing the essence of the group which makes it dynamic.
Figure 5. Interpretation of a field day using a model of the process of experiential learning proposed by Shorn (1976)
REC Learning Projects. Volume 1 9

As Shortt concludes in his paper, some possible confounding variables in the study were not accounted for. While he mentions age, he does not mention the sex of the participants and how thjj may have influenced the group's perception of the leader (a male) and the learning experience. Is i t ! coincidence that the group with a predominance of Feeling/Perceiving types was also predominantly female and an average of three years younger than the group with a predominance of mak participants? I can easily imagine that a change in group composition or group leader for the tu£ groups in Shortt's study or at the field day would have some effect on the learning experience.
As with complex biological systems such as crop/pest interactions, complex human systems such £ experiential learning groups are difficult to study. Can the complexity of relationships within a biological system ever be fully understood? Can the relationships and interactions betwed| individuals with different world views be analysed? Can the outcomes from these interactions m controlled or predicted? As Shortt himself states, his study provides some pointers for effective practice, not recipes for success. I
CONCLUSIONS What were the main learnings (for me) from this learning project? •
Action learning cycles can provide a framework for participatory planning and conduct of field days. While time and flexibility are essential ingredients, the team effort results in a rewarding learnifl experience especially for the chief participants (in this case the two farmer cooperators, t™ consultant and myself). For me, the formalised reflection and decision making stages of the learnijM cycle were critical to the learning experience. •
The feedback from farmers and from the ORID discussion showed that the activity had be|j experienced in a positive way. But what changes will farmers make on their farm as a result of tnj experience? I may see some changes on these farms in the next year, but how much of this change can be attributed to my work on IPM, let alone this field day? •
Perhaps Russel and Ison (1991) capture this thought more clearly: •
'The experience of the conversation is a unique creation and we have no certainty whatsoever as to what the outcome might be' I
and the most I can hope for is that discussions at the field day had a positive rather than negative effect on the IPM issue? I
This learning project has reinforced (clarified) a concept which for me is the crux of what aduj education is about - that other adults be they farmers, consultants, scientists etc. are my fellcB learners.
'Once the farmer is seen as (wo)man the scientist, a person actively engaged in I constructing his world model of the farm environment, the total thrust of agricultural extension changes' (Salmon, 1981). a
REFERENCES
Brookfield, S.D. 1986, Understanding and Facilitating Adult Learning, Jossey-Bass Publishe San Francisco.
I I
*" REC Learning Projects, Volume I

Fsfl, R- 1988, The Adult Education Approach to Agricultural Extension and Communication Skills Workshop Manual, QDPI Internal Publication.
Grow, G.O. 1991, 'Teaching Learners to be Self-Directed', Adult Education Quarterly, 41(3): 125-* 49.
McGill I. and Beaty, L. 1992, Action Learning - A practitioner's guide, Kogan Page, London, pp. 26-27.
Russel, D.B. and Ison, R.I. 1991, 'The Research-Development Relationship in Rangelands: An opportunity for Contextual Science', Plenary Paper for Fourth International Rangelands congress, Monpellier, France, 22-26 April, 1991.
Salmon, P. 1981, Personal Psychology of Change in Management, School of Agriculture and Forestry Monographs, University of Melbourne, pp.28-47.
Shortt, G.B. 1976, 'A case study of the Relationship between Cognitive Style and Experiential Learning in Hospitality Management Education', The University of Ulster at Magee, Northern Ireland, U.K.
Tennant, M. 1991, 'Establishing an 'Adult' Teaching-Learning Relationship', Australian Journal of Adult and Community Education, 31(1): 287-92.
Tough, A.M. 1978, 'Major Learning Efforts: Recent Research and Future Directions in Adult Education', XXXVIII (4).
REC Learning Projects, Volume 1 11