vfd for chilled water system
TRANSCRIPT

Copyright 2009 Retrofit Originality Incorporated. Not for reproduction or distribution without written permission from ROI www.roi-engineering.com
International Energy Agency Energy Conservation in Buildings and Community Systems (ECBCS) Programme
Annex 46, U.S. Army Installations Management Command (IMCOM), US Department of Energy, Ft. Lee
and The PERTAN Group
Presented by Scot M. Duncan, P.E.
Vice PresidentRetrofit Originality Incorporated
21382 Countryside DriveLake Forest, CA 92630
949 370 8582www.roi-engineering.com
September 19, 20, 2009
Fort Lee, VA
Copyright 2009 Retrofit Originality Incorporated. Not for reproduction or distribution without written permission from ROI www.roi-engineering.com
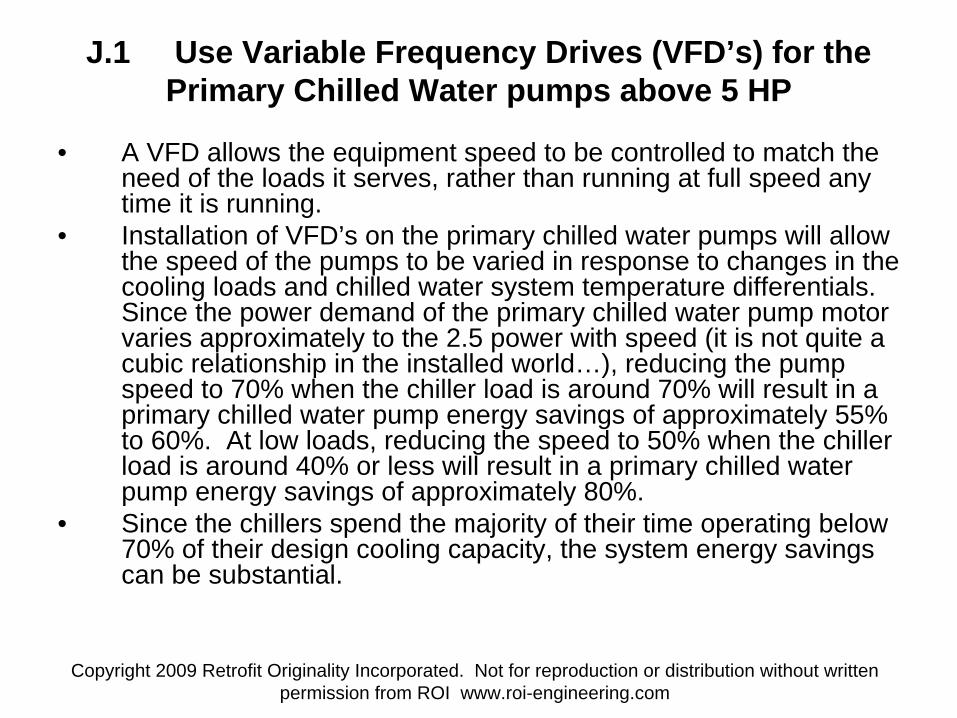
J.1 Use Variable Frequency Drives (VFD’s) for the Primary Chilled Water pumps above 5 HP
• A VFD allows the equipment speed to be controlled to match the need of the loads it serves, rather than running at full speed any time it is running.
• Installation of VFD’s on the primary chilled water pumps will allow the speed of the pumps to be varied in response to changes in the cooling loads and chilled water system temperature differentials. Since the power demand of the primary chilled water pump motor varies approximately to the 2.5 power with speed (it is not quite a cubic relationship in the installed world…), reducing the pump speed to 70% when the chiller load is around 70% will result in a primary chilled water pump energy savings of approximately 55% to 60%. At low loads, reducing the speed to 50% when the chiller load is around 40% or less will result in a primary chilled water pump energy savings of approximately 80%.
• Since the chillers spend the majority of their time operating below 70% of their design cooling capacity, the system energy savings can be substantial.

Copyright 2009 Retrofit Originality Incorporated. Not for reproduction or distribution without written permission from ROI www.roi-engineering.com
Primary Pump VFD Energy CurvePrimary Pump Energy Use - Variable Speed
vs. Constant Speed
0
20
40
60
80
100
1 2 3 4 5 6 7 8 9 10
Speed %/10
Pow
er D
raw %
Constant SpeedTheoretical CurveProbable Curve

Copyright 2009 Retrofit Originality Incorporated. Not for reproduction or distribution without written permission from ROI www.roi-engineering.com
J.2 Use Variable Frequency Drives (VFD’s) for the Condenser Water Pumps
• A VFD allows the equipment speed to be controlled to match the need of the loads it serves, rather than running at full speed any time it is running.
• Installation of VFD’s on the condenser water pumps will allow the speed of the pumps to be varied in response to changes in the cooling loads. Since the power demand of the condenser water pump motor varies approximately to the second power with speed, (due to the fixed minimum lift conditions of an atmospheric cooling tower, the savings does not correspond to a cubic relationship) reducing the speed to 70% when the chiller load is around 70% will result in a condenser water pump energy savings of approximately 50%. At low loads, reducing the speed to 50% when the chiller load is around 50% or less will result in a condenser water pump energy savings of approximately 75%. We typically do not recommend taking the condenser water pump speed down below approximately 50%, as the savings are minimal below that level, and we need to pay attention to the minimum allowable flow rate over the cooling towers, which is typically in the 50% of design flow range.
Copyright 2009 Retrofit Originality Incorporated. Not for reproduction or distribution without written permission from ROI www.roi-engineering.com
CDWP VFD Energy Savings• The pump energy savings ratio for the condenser water
pump is slightly different than it is for the primary chilled water pumps, as the condenser water pumps have a fixed minimum lift required to move water up over the top of the cooling towers, and there is no static regain for water falling through a cooling tower as there is with primary chilled water pumps operating in a closed loop.
• Since the chillers spend the majority of their time operating below 70% of their design cooling capacity, the system energy savings can be substantial.
Copyright 2009 Retrofit Originality Incorporated. Not for reproduction or distribution without written permission from ROI www.roi-engineering.com
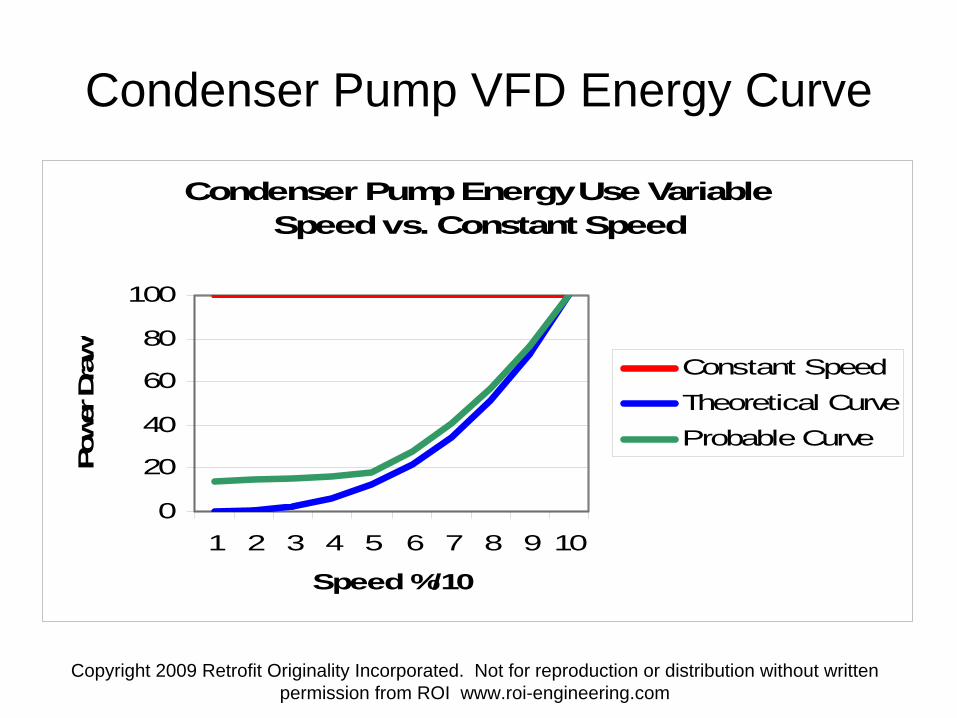
Condenser Pump VFD Energy Curve
Condenser Pump Energy Use Variable Speed vs. Constant Speed
0
20
40
60
80
100
1 2 3 4 5 6 7 8 9 10
Speed %/10
Pow
er D
raw %
Constant SpeedTheoretical CurveProbable Curve
Copyright 2009 Retrofit Originality Incorporated. Not for reproduction or distribution without written permission from ROI www.roi-engineering.com
J.3 Cooling Load Based Optimization
• Most Mechanical Engineers have never operated an HVAC system, and were never properly trained in the art and science of energy conservation and building controls.
• Most control system designers are not versed in energy conservation design strategies.
• Most operating engineers don’t have PhD’s, and don’t want HVAC and control systems that require a PhD to understand.

Copyright 2009 Retrofit Originality Incorporated. Not for reproduction or distribution without written permission from ROI www.roi-engineering.com
Overview• Merely having great equipment and a
fantastic system design does not guarantee that a system will be energy efficient.
• Typical “energy efficient” control strategies leave a substantial amount of savings on the table.
• Control system strategies that cannot be easily understood by the operating staff will quickly be disabled, and the system will revert to manual operation, and savings will be lost.

Copyright 2009 Retrofit Originality Incorporated. Not for reproduction or distribution without written permission from ROI www.roi-engineering.com
Summary• Poor control strategies can
waste more energy than great equipment can save.
• The controls must adapt to changing end use loads and conditions and allow the operating staff the ability to tune the system to meet the needs of the various connected loads.

Copyright 2009 Retrofit Originality Incorporated. Not for reproduction or distribution without written permission from ROI www.roi-engineering.com
Sample VSE/LOBOS Design and Control Logic Results
6/30/07 Peak OSA Temperature =
103°F red line
Average TOTAL chiller plant efficiency = Less than 0.50 kW/ton yellow line
Chiller, Approx 0.35 kW/ton, blue line
Cooling Tower, Approx 0.08 kW/ton, white line
Chilled Water pump, Approx 0.04 kW/ton, pink line
Condenser water pump, Approx 0.03 kW/ton, green line

Copyright 2009 Retrofit Originality Incorporated. Not for reproduction or distribution without written permission from ROI www.roi-engineering.com
AHU Summary100 degrees outside
52.7 °F CHW supply temperature
Max 54.5°F supply air temp. on all AHU’s
.
At 100°F outside, we have a 1.8 degree approach temperature between the CHWS temp and the supply air temp leaving the coils. This allows very high CHW temperatures and thus very high system efficiencies. This compares to typical designs that use coils that provide a 10°F to 13°F approach temperature.

Copyright 2009 Retrofit Originality Incorporated. Not for reproduction or distribution without written permission from ROI www.roi-engineering.com
Chiller Plant SnapshotChiller @ 0.32 kW/tonTotal chiller plant @ 0.45 kW/ton, including pumps, chillers and CTF’s100°F OSA

Copyright 2009 Retrofit Originality Incorporated. Not for reproduction or distribution without written permission from ROI www.roi-engineering.com
Complete day performance: tons and kW/ton 6-13-07
Blue = total plant (0.39 to 0.51 kW/ton), including all pumps, CH’s and CT’sYellow = load in tons (380 to 530 tons)

Copyright 2009 Retrofit Originality Incorporated. Not for reproduction or distribution without written permission from ROI www.roi-engineering.com
Control to the Loads
• The system must respond to the needs of the loads, be it a single floor in the winter, or the entire facility in the heat of the summer.
• If the loads are not being properly cared for and met, the system is not doing its job.
• As soon as occupant complaints start coming in, the system will go to manual operation, if it is not easy for the Engineering Staff to tune and adjust it.

Copyright 2009 Retrofit Originality Incorporated. Not for reproduction or distribution without written permission from ROI www.roi-engineering.com
The Basics Don’t Change• To save substantial energy with any system, you
have to incorporate central plant and airside optimization software.
• Central Plant Optimization routines must look at the site loads – without knowing AHU load information, you cannot maximize energy savings, or respond to load changes properly.
• AHU Optimization routines are required to minimize energy use and promote occupant comfort!
• The System Must be Operator Friendly – If the person that designed it cannot explain it in an understandable manner to the people that operate the facility, it is too complex.

Copyright 2009 Retrofit Originality Incorporated. Not for reproduction or distribution without written permission from ROI www.roi-engineering.com
Load Based Optimization on AHU – 56°F at 0.49 INWC @ 10th
Floor [email protected] kW/T & Total HVAC sys @ 0.64 kW/TPenthouse fan system serves all 10 floors with 0.49” static pressure. Old setpoint was 4”+
75% load on plant
Copyright 2009 Retrofit Originality Incorporated. Not for reproduction or distribution without written permission from ROI www.roi-engineering.com
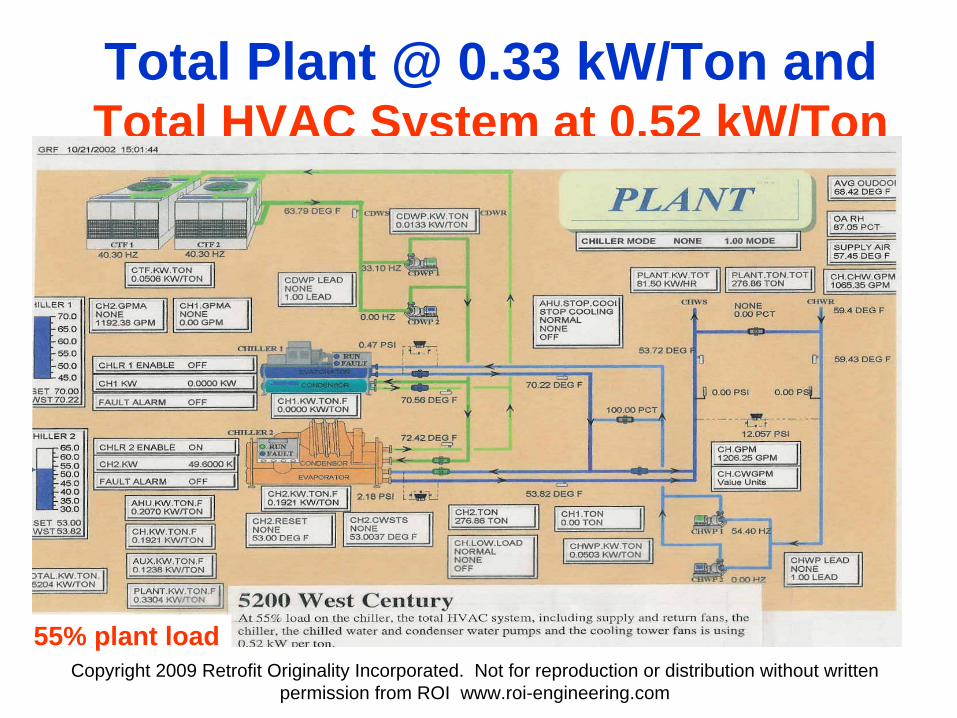
Total Plant @ 0.33 kW/Ton and Total HVAC System at 0.52 kW/Ton
55% plant load
Copyright 2009 Retrofit Originality Incorporated. Not for reproduction or distribution without written permission from ROI www.roi-engineering.com
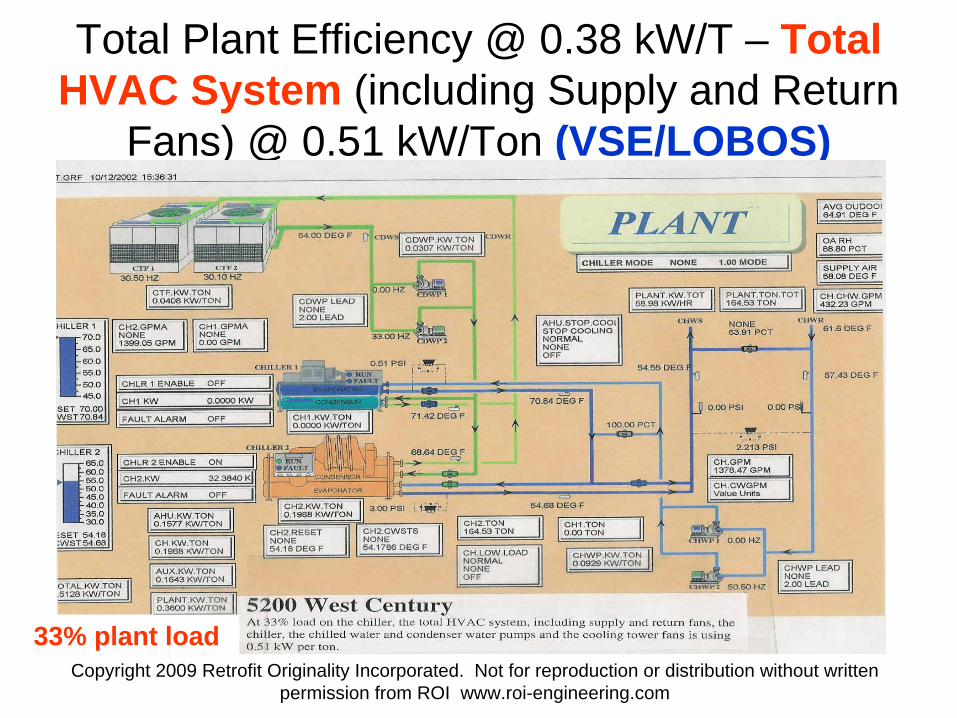
Total Plant Efficiency @ 0.38 kW/T – Total HVAC System (including Supply and Return
Fans) @ 0.51 kW/Ton (VSE/LOBOS)
33% plant load
Copyright 2009 Retrofit Originality Incorporated. Not for reproduction or distribution without written permission from ROI www.roi-engineering.com
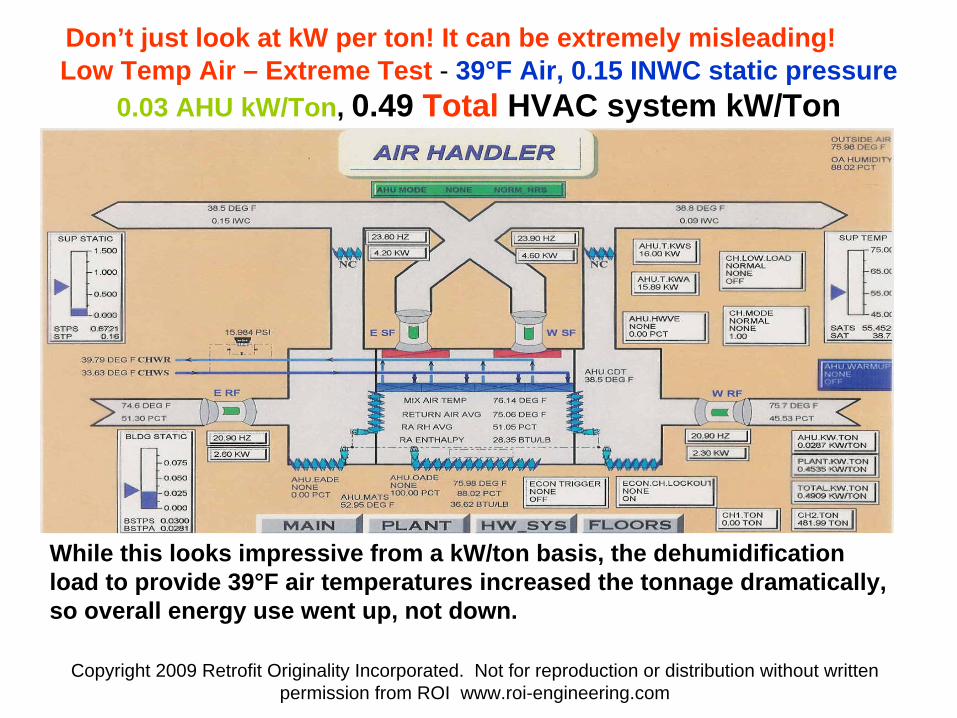
Low Temp Air – Extreme Test - 39°F Air, 0.15 INWC static pressure 0.03 AHU kW/Ton, 0.49 Total HVAC system kW/Ton
While this looks impressive from a kW/ton basis, the dehumidification load to provide 39°F air temperatures increased the tonnage dramatically, so overall energy use went up, not down.
Don’t just look at kW per ton! It can be extremely misleading!
Copyright 2009 Retrofit Originality Incorporated. Not for reproduction or distribution without written permission from ROI www.roi-engineering.com
J.3 Cooling Load Based Optimization, cont.
• Cooling load based optimization strategies should be incorporated into the control routines for the CHWS temperature set-point, the chilled water differential pressure setpoint and the condenser water temperature setpoint (for water cooled equipment) to reduce chiller and pumping system energy waste, while improving the control system response at the cooling loads. The load based optimization strategies should also incorporate chiller staging routines that take best advantage of the installed equipment. Self tuning loops should be incorporated that will adjust the system to accommodate continuous changes in the load and weather.

Copyright 2009 Retrofit Originality Incorporated. Not for reproduction or distribution without written permission from ROI www.roi-engineering.com
Load Based Optimization System (LOBOS)
• One such system which incorporates these concepts is the Load Based Optimization System (LOBOS), which takes data from the air handling units that are controlled from the same DDC control system as the chiller plant, and uses this data to raise the chilled water supply temperature as high as possible, to save chiller energy, while lowering the chilled water system differential pressure as low as possible, to save pumping system energy.

Copyright 2009 Retrofit Originality Incorporated. Not for reproduction or distribution without written permission from ROI www.roi-engineering.com
Load Based Optimization System (LOBOS)
• These resets are accomplished while still maintaining the required supply air temperatures at the air handling units – feedback from the cooling loads is required for best system performance.
• The system also resets the condenser water supply temperature setpoint to reduce chiller energy by lowering the condensing pressure of the refrigerant, without wasting cooling tower fan energy.
Copyright 2009 Retrofit Originality Incorporated. Not for reproduction or distribution without written permission from ROI www.roi-engineering.com
Load Based Optimization System (LOBOS)
• Increasing the chilled water supply temperature (within reason, comfort and humidity control limitations) can reduce energy consumption on constant speed centrifugal chillers by up to 20%, and by up to 40% or more on variable speed centrifugal chillers.
• Reducing the chilled water system differential pressure (within reason, comfort and humidity control limitations) can reduce energy consumption on variable speed chilled water pumping systems by up to 50% at light loads.

Copyright 2009 Retrofit Originality Incorporated. Not for reproduction or distribution without written permission from ROI www.roi-engineering.com
Load Based Optimization System (LOBOS)
• Differential pressure is what forces cold water from the chiller plant through the chilled water distribution piping system to the air conditioning systems to provide cooling to the end use loads. A system does not need the same differential pressure when it is 70°F and dry outside as it does when it is 90°F and raining outside.
Copyright 2009 Retrofit Originality Incorporated. Not for reproduction or distribution without written permission from ROI www.roi-engineering.com
Load Based Optimization System (LOBOS)
• A reset strategy based on the needs of the end use loads can reduce pump energy by 40% or more, depending upon the diversity of the loads.
• Efficiency and load based reset strategies should be incorporated into the control routines for the cooling towers. Reducing the condenser water supply temperature (within reason and equipment limitations) can reduce energy consumption on constant speed centrifugal chillers by up to 30%, and by up to 60% or more on variable speed centrifugal chillers.

Copyright 2009 Retrofit Originality Incorporated. Not for reproduction or distribution without written permission from ROI www.roi-engineering.com
Load Based Optimization System (LOBOS)
• An additional benefit associated with resetting the chilled water supply temperature and differential pressure is that cooling coil control valve response and thus system temperature control are much better when these strategies are incorporated.
Copyright 2009 Retrofit Originality Incorporated. Not for reproduction or distribution without written permission from ROI www.roi-engineering.com
Load Based Optimization System (LOBOS)
• When cooling loads are light but the differential pressure setpoint is at 40 PSID, and the CHW supply temperature is at 42°F, most of the cooling coil control valves will be operating at or near shutoff. Valves operating near shut off provide very imprecise temperature control, resulting in large swings in the leaving air temperature from the air handling units, and over- and under-dehumidification. If the CHW supply temperature is increased and the differential pressure is decreased, the valves will open up and operate closer to mid-stroke or even further open, where their control can be very accurate.
• This is shown in the following trend of supply air temperature vs. supply air temperature setpoint
Copyright 2009 Retrofit Originality Incorporated. Not for reproduction or distribution without written permission from ROI www.roi-engineering.com
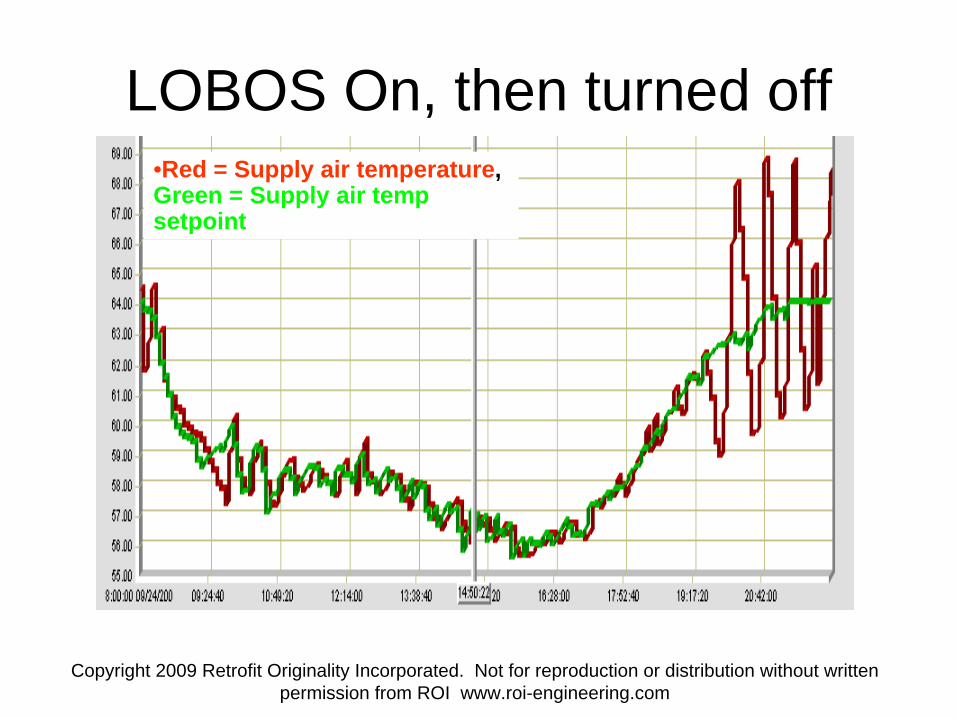
LOBOS On, then turned off•Red = Supply air temperature, Green = Supply air temp setpoint

Copyright 2009 Retrofit Originality Incorporated. Not for reproduction or distribution without written permission from ROI www.roi-engineering.com
Notes for previous page• During the day, the CHWS temperature setpoint and
differential pressure setpoint are reset based on the loads. At approximately 19:00, the system is operated in a fixed temperature and DP setpoint mode. It can be seen that the supply air temperature control stays within approximately 0.5°F until 19:00, when the swings exceed 5°F, due to the CHW control valve at the AHU being near shut off.
• Optimized chiller equipment staging can reduce the energy consumption penalty imposed by running too much constant speed equipment by over 50%.
Copyright 2009 Retrofit Originality Incorporated. Not for reproduction or distribution without written permission from ROI www.roi-engineering.com
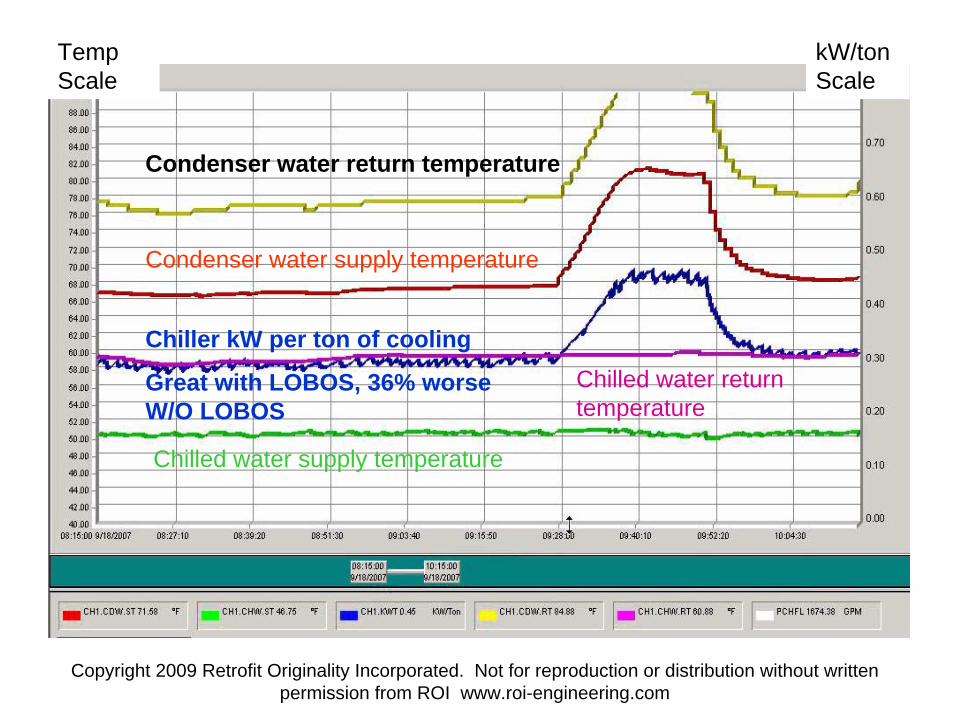
Temp Scale
kW/ton Scale
Condenser water return temperature
Condenser water supply temperature
Chiller kW per ton of cooling
Great with LOBOS, 36% worse W/O LOBOS
Chilled water supply temperature
Chilled water return temperature

Copyright 2009 Retrofit Originality Incorporated. Not for reproduction or distribution without written permission from ROI www.roi-engineering.com
Discussion of Previous Page• This test was run to see what effects changing
the condenser water temperature setpoint would have on VFD chiller system efficiency.
• The red line is the condenser water temperature with a system using the Load Based Optimization System (LOBOS) control system, which determines the most efficient operating points for the HVAC system based on the actual cooling loads of the facility.
• The blue line is the chiller efficiency in kW per ton.
• The green line is the chilled water supply temperature.
Copyright 2009 Retrofit Originality Incorporated. Not for reproduction or distribution without written permission from ROI www.roi-engineering.com
Discussion, continued• The first test, shown in the preceding page,
shows that the chiller energy efficiency is running at approximately 0.33 kW per ton, prior to the start of the test.
• This is excellent efficiency, as most chillers installed today operate between 0.60 and 1.5 kW per ton of cooling.
• With LOBOS, the condenser water temperature is running at approximately 68°F, while the chilled water temperature is running at approximately 50°F.

Copyright 2009 Retrofit Originality Incorporated. Not for reproduction or distribution without written permission from ROI www.roi-engineering.com
Discussion, continued• We manually raised the condenser water
setpoint to 80°F from the automatically controlled setpoint of 68°F to determine what effect a “normal” operating strategy would have on chiller system performance.
• Many facilities routinely operate their condenser water systems at between 80°F and 85°F, which are the typical “design” points for chillers when they leave the chiller factory.

Copyright 2009 Retrofit Originality Incorporated. Not for reproduction or distribution without written permission from ROI www.roi-engineering.com
Discussion, continued• As can be seen, the chiller efficiency was made
dramatically worse, increasing from 0.33 kW per ton to 0.45 kW per ton, using 36% more energy to deliver the same amount of cooling. The chiller energy increased from 332 kW to 452 kW, an increase of 120 kW. There was a savings in cooling tower energy of approximately 40 kW by letting the temperature rise, but the net effect on the system was an increase of 80 kW, or approximately 21% more energy to provide the same level of cooling.
• When the condenser water temperature was released back to LOBOS operating controls, the efficiency was returned to the previously obtained levels.

Copyright 2009 Retrofit Originality Incorporated. Not for reproduction or distribution without written permission from ROI www.roi-engineering.com
Discussion, continued
• This also shows that a facility can be designed with excellent cooling equipment, but if it is operated and controlled in a “normal” manner, the efficiency can suffer in a rather dramatic fashion compared to the potential efficiency.
• Remember – “Bad Controls Can Waste More Energy Than Good Equipment Can Save.”
Copyright 2009 Retrofit Originality Incorporated. Not for reproduction or distribution without written permission from ROI www.roi-engineering.com
Control Strategy
• Make it understandable.• Make it consistent/repeatable from plant to
plant.• Make it tunable by the Operator (within
limits)• Make it self tuning.

Copyright 2009 Retrofit Originality Incorporated. Not for reproduction or distribution without written permission from ROI www.roi-engineering.com
J4. LOBOS Control Screens - PlantChiller Plant Tuning Graphic - Simple – Four adjustments - how fast the Differential Pressure and Chilled water supply temperature are
adjusted when the loads are increasing and decreasing.

Copyright 2009 Retrofit Originality Incorporated. Not for reproduction or distribution without written permission from ROI www.roi-engineering.com
J4. LOBOS Control Screens - AHUAHU Tuning Graphic - Simple – Six adjustments – Setpoints for fan speed and return air temperature setpoint, and how fast the static
pressure and supply air temperature setpoints are adjusted when the loads are increasing and decreasing.

Copyright 2009 Retrofit Originality Incorporated. Not for reproduction or distribution without written permission from ROI www.roi-engineering.com
J4. LOBOS Control Screens - AHU
AHU Setup Screen
This screen lets you set the level of importance for each AHU – a lab unit gets greater weight than a less critical unit, the further out units get more weight than the close in units, and big AHU’s get more weight than smaller AHU’s.
Copyright 2009 Retrofit Originality Incorporated. Not for reproduction or distribution without written permission from ROI www.roi-engineering.com
J4. LOBOS Control Screens• Control system consistency from HVAC system to
HVAC system should be a long term goal.• If every tank, rifle or HUMVEE operated differently
from the last one, how effective do you think our soldiers would be?
• HVAC systems are the same – the human interface and behind the scenes control logic should all have the same look and feel, and the controls strategies should be the same:– When the cooling loads are high, provide higher pressures
and colder water and air to meet the loads.– When the cooling loads are low, provide lower pressures
and warmer water and air to save energy.

Copyright 2009 Retrofit Originality Incorporated. Not for reproduction or distribution without written permission from ROI www.roi-engineering.com
J.5 Use High Efficiency Dehumidification Strategy.
• When air handling units are being replaced, or where there is a need for dry, non-saturated supply air, the installation of High Efficiency Dehumidification Systems, in either Dedicated Outdoor Air System (DOAS) or Variable Air Volume (VAV) design iterations should be utilized.
• Although the airside of the HVAC systems is not a direct chiller plant energy efficiency project, the design and operation of the airside has a substantial impact on the performance of the chiller plant. The chiller plant is operated to respond to the needs of the end uses, (the air handlers serving the occupied spaces) so if the end use air handlers are inefficient at transferring heat due to their design or small cooling coils, colder water and higher flow rates of chilled water will be required. This can create a very inefficient cooling system, and can contribute directly to the “Low Delta T Syndrome”.
Copyright 2009 Retrofit Originality Incorporated. Not for reproduction or distribution without written permission from ROI www.roi-engineering.com
J.5 Use High Efficiency Dehumidification Strategy.
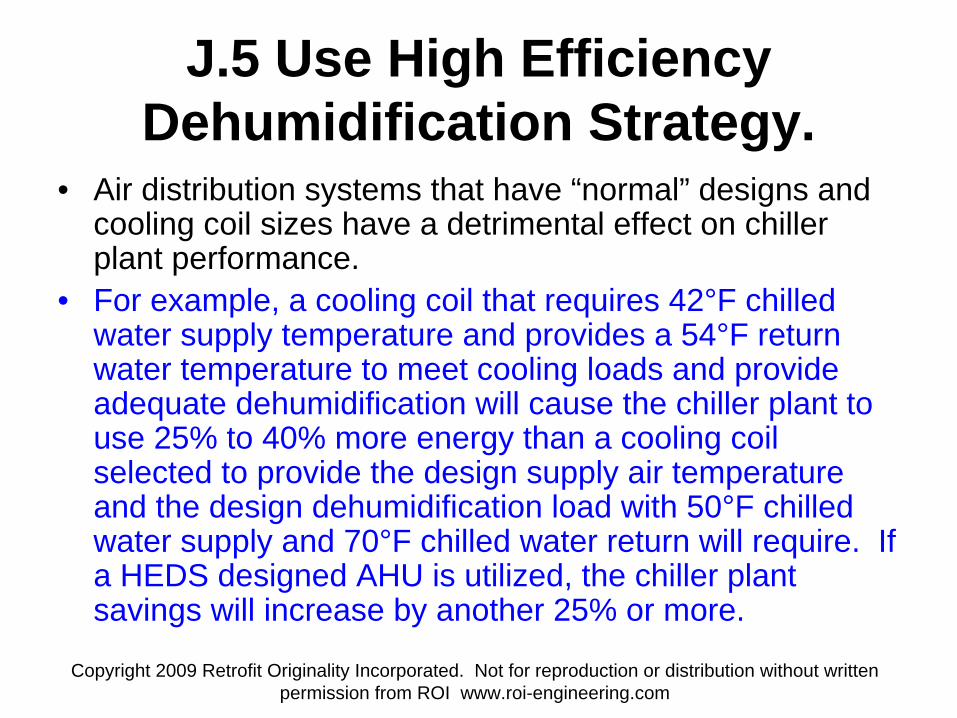
• Air distribution systems that have “normal” designs and cooling coil sizes have a detrimental effect on chiller plant performance.
• For example, a cooling coil that requires 42°F chilled water supply temperature and provides a 54°F return water temperature to meet cooling loads and provide adequate dehumidification will cause the chiller plant to use 25% to 40% more energy than a cooling coil selected to provide the design supply air temperature and the design dehumidification load with 50°F chilled water supply and 70°F chilled water return will require. If a HEDS designed AHU is utilized, the chiller plant savings will increase by another 25% or more.

Copyright 2009 Retrofit Originality Incorporated. Not for reproduction or distribution without written permission from ROI www.roi-engineering.com
J.5 Use High Efficiency Dehumidification Strategy.
• When design dehumidification loads exist, there is typically the need for some form of reheat energy to temper the air entering the spaces. Reheat energy typically comes from a new source of energy, typically a boiler plant connected to steam or hot water sourced re heat coils, or electric strip reheat coils.
• Cold, saturated air entering a humid space can cause condensation to form on surfaces that it comes in contact with, creating wet spots and all of the problems that go along with water on surfaces in occupied areas, so some form of re-heat or a method to decrease the relative humidity of the air entering the space is required.
• For a system such as a DOAS design, or a VAV system serving a barracks facility, the design day chiller plant and boiler plant energy savings associated with a HEDS system can be in excess of 50% when compared to a typical design.

Copyright 2009 Retrofit Originality Incorporated. Not for reproduction or distribution without written permission from ROI www.roi-engineering.com
D.2.2.8 Inefficient Dehumidification Systems (Inefficiency)
• Supplying nearly saturated 55 °F air into a humid space results in condensation in the spaces, which can lead to mold and mildew problems. Electric or hot water reheat systems are sometimes employed to decrease the RH of the supply air to the spaces to reduce the potential for condensation, but these systems are typically turned off in the field to reduce energy use.
• Inefficient air dehumidification results in significant repair and maintenance costs. The cost of mold remediation outweighs the total first cost of the HVAC system by an order of magnitude over the life of the HVAC system.
• Changing dehumidification/reheat system design strategy can reduce energy consumption and cooling and reheat loads, improve IAQ, and reduce the potential for mold growth in occupied spaces. These factors will reduce the level, frequency, and expense of remediation that seems to occur on a regular basis.

Copyright 2009 Retrofit Originality Incorporated. Not for reproduction or distribution without written permission from ROI www.roi-engineering.com
D.2.2.8 Inefficient Dehumidification Systems (Inefficiency)
cont…• Air supply systems that must provide both cooling
and dehumidification are typically designed in a way that wastes chiller and boiler plant energy.
• Using “standard” AHU design strategies that dehumidify the air and then reheat it to reduce RH can waste 50% or more of the chiller plant and boiler plant energy when compared to using AHU designs based on high-efficiency dehumidification systems (HEDS) design strategies for dedicated outside air systems (DOAS) or variable air volume (VAV) systems combined with a separate heating and cooling system

Copyright 2009 Retrofit Originality Incorporated. Not for reproduction or distribution without written permission from ROI www.roi-engineering.com
Moisture Control• In order to reduce the potential for
biological issues, the building envelope and HVAC system must be designed in concert to properly control moisture.
• Relative Humidity in the facility must be maintained within acceptable boundaries to promote occupant comfort and health, while reducing the potential for biological issues.

Copyright 2009 Retrofit Originality Incorporated. Not for reproduction or distribution without written permission from ROI www.roi-engineering.com
Dehumidification/Reheat Systems
• Many areas in the continental United States only have dehumidification problems in the summer.
• Other, more far flung locations require continual dehumidification and reheat to maintain comfort conditions and reduce biological issues.

Copyright 2009 Retrofit Originality Incorporated. Not for reproduction or distribution without written permission from ROI www.roi-engineering.com
Dehumidification Systems Problems
• Billions of dollars in damage occurs each year due to biological growth caused by high Relative Humidity in facilities.
• This is preventable, and can be energy efficient at the same time!

Copyright 2009 Retrofit Originality Incorporated. Not for reproduction or distribution without written permission from ROI www.roi-engineering.com
Dehumidification Systems Problems
• To reduce relative humidity in the spaces, the air must be dried out, typically by cooling it to 45°F to 55°F, then re-heating it to around 65°F typically by using electrical or hot water re-heat sources.– In this manner, very cold, 100% saturated
supply air does not enter the spaces.– If cold, saturated air enters a humid room,
biological issues will likely follow.

Copyright 2009 Retrofit Originality Incorporated. Not for reproduction or distribution without written permission from ROI www.roi-engineering.com
Dehumidification Systems Problems
• High RH can be caused by the desire to save energy by reducing the dehumidification (cooling) and re-heat load on the system.– If you cool the air less, you save chiller energy,
but you increase the RH in the space.– If you dry the air out by cooling it to the correct
level, but then do not re-heat the air (to save heating energy), the cold saturated air will encourage condensation everywhere it touches.

Copyright 2009 Retrofit Originality Incorporated. Not for reproduction or distribution without written permission from ROI www.roi-engineering.com
Dehumidification Systems Problems
• At one site that we visited, biological growth issues created the need to completely re-build one of the living facilities. The new HVAC system uses chilled water for dehumidification and electric strip heaters (at 1.0 kW per room!) for reheat to lower the relative humidity of the spaces.
• While the design of the system will work, the annual energy consumption of this one 250 room facility will increase by approximately 1,500,000 kWh per year. – The strip reheat coils will soon be disconnected to try
and comply with energy conservation goals, and the biological problems will return, creating a massive waste of funds, but coming out of a different, less obvious budget.

Copyright 2009 Retrofit Originality Incorporated. Not for reproduction or distribution without written permission from ROI www.roi-engineering.com
High Efficiency Dehumidification Systems (HEDS)
• We’ve developed a high efficiency dehumidification system that can reduce energy consumption by 52% (high loads) to 72% (low loads), while improving chiller plant and boiler plant efficiency.
• Combining VSE design strategies with Load Based Optimization Controls, (LOBOS) and HEDS can reduce facility energy consumption, while reducing the RH to reduce the potential for biological damage to occur.

Copyright 2009 Retrofit Originality Incorporated. Not for reproduction or distribution without written permission from ROI www.roi-engineering.com
High Efficiency Dehumidification Systems (HEDS)
High Efficiency Dehumidification System
Supply air temperature is 10°F above the dewpoint temperature.
For DOAS-HEDS, the supply air temperature can be 20°F above the dewpoint temperature.
Copyright 2009 Retrofit Originality Incorporated. Not for reproduction or distribution without written permission from ROI www.roi-engineering.com
High Efficiency Dehumidification Systems (HEDS)
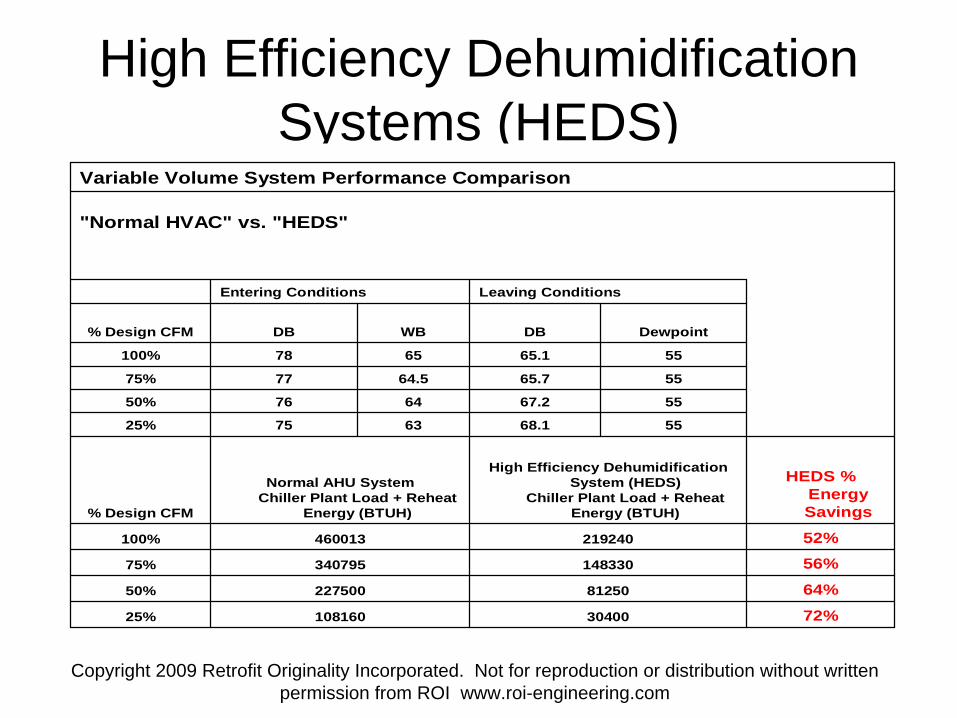
72%3040010816025%
64%8125022750050%
56%14833034079575%
52%219240460013100%
HEDS % Energy Savings
High Efficiency Dehumidification System (HEDS)
Chiller Plant Load + Reheat Energy (BTUH)
Normal AHU System Chiller Plant Load + Reheat
Energy (BTUH)% Design CFM
5568.1637525%
5567.2647650%
5565.764.57775%
5565.16578100%
DewpointDBWBDB% Design CFM
Leaving ConditionsEntering Conditions
"Normal HVAC" vs. "HEDS"
Variable Volume System Performance Comparison
Copyright 2009 Retrofit Originality Incorporated. Not for reproduction or distribution without written permission from ROI www.roi-engineering.com
High Efficiency Dehumidification Systems (HEDS)
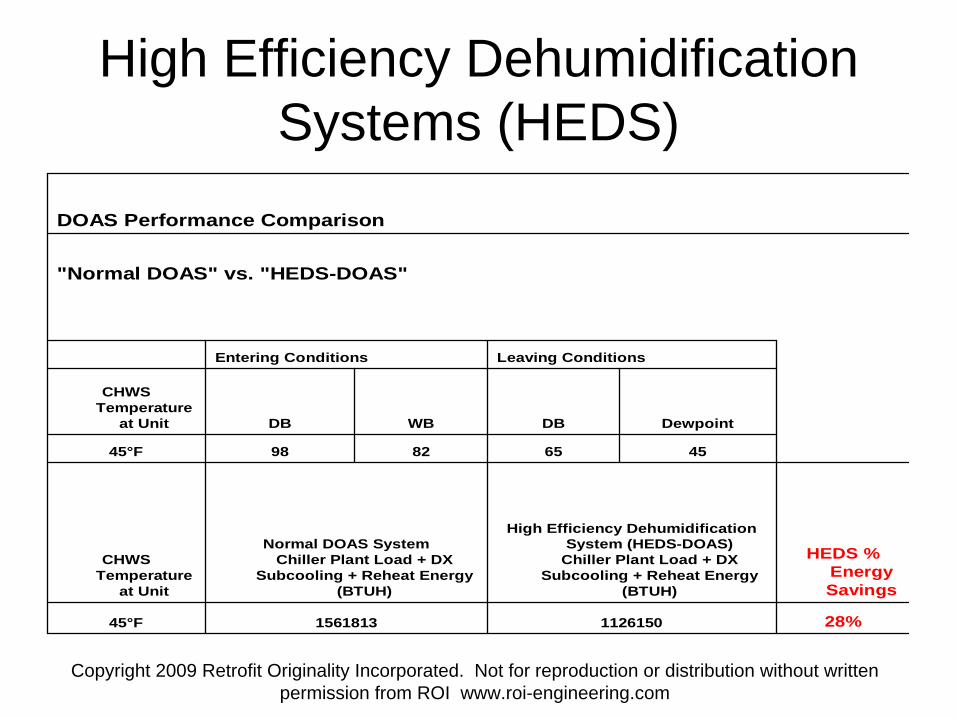
28%1126150156181345°F
HEDS % Energy Savings
High Efficiency Dehumidification System (HEDS-DOAS)
Chiller Plant Load + DX Subcooling + Reheat Energy
(BTUH)
Normal DOAS System Chiller Plant Load + DX
Subcooling + Reheat Energy (BTUH)
CHWS Temperature
at Unit
4565829845°F
DewpointDBWBDB
CHWS Temperature
at Unit
Leaving ConditionsEntering Conditions
"Normal DOAS" vs. "HEDS-DOAS"
DOAS Performance Comparison

Copyright 2009 Retrofit Originality Incorporated. Not for reproduction or distribution without written permission from ROI www.roi-engineering.com
High Efficiency Dehumidification Systems (HEDS)
High Efficiency Dehumidification SystemEnergy Savings vs. Design Airflow @ 100% reheat to
65F/68F – Typical for DOAS, Barracks, labs, manufacturing, underfloor air distribution systems, etc.
High Efficiency Dehumidification System Energy Savings @ 100% Reheat to 65F/68F
0%
10%
20%
30%
40%
50%
60%
70%
80%
90%
100%
1 2 3 4
Percent of Design Airflow Percent of Cooling and Re-heat Energy Saved

Copyright 2009 Retrofit Originality Incorporated. Not for reproduction or distribution without written permission from ROI www.roi-engineering.com
High Efficiency Dehumidification Systems (HEDS)
High Efficiency Dehumidification SystemEnergy Savings vs. Design Airflow @ 25% reheat to
65F/68F – Typical for facilities that need minimal reheat.
High Efficiency Dehumidification System Energy Savings @ 25% Reheat to 65F/68F
0%
10%
20%
30%
40%
50%60%
70%
80%
90%
100%
1 2 3 4
Percent of Design Airflow Percentage of Cooling and Reheat Energy Saved

Copyright 2009 Retrofit Originality Incorporated. Not for reproduction or distribution without written permission from ROI www.roi-engineering.com
J.6 Install A Continuous Commissioning, Monitoring and Verification System to Maintain Savings
Persistence of the Chiller Plant and HVAC Systems
• Essentially, this consists of installing:– accurate temperature sensors on the inlet and outlet of each chiller and heat
recovery unit evaporator and condenser, – an accurate low range differential pressure transducer across the evaporator of
each chiller and heat recovery chiller and using the differential pressure to calculate the flow rate through the chiller,
– a kW transducer on each chiller, – kW transducers on each pump and cooling tower fan and air distribution fan, or, if
they are powered by Variable Frequency Drives, obtain the kW from the VFD over an RS 485 or other network connection.
– Air handlers that are equipped with economizers must also be equipped with return air and mixed air temperature sensors, and accurate supply air temperature sensors.
– If there is budget available, large AHU’s should have DP transducers installed across the coils, and inlet and outlet water temperature sensors so that tonnage at the AHU’s can be calculated as well.
• Software would then be implemented to calculate the efficiency of each piece of equipment, and then trends and alarms would be set up so that there would be a historical database of equipment and system performance. The alarms would be triggered when the system or equipment started operating outside the boundaries set during system startup.
Copyright 2009 Retrofit Originality Incorporated. Not for reproduction or distribution without written permission from ROI www.roi-engineering.com
J.7 Install Water Source Heat Pumps (WSHP’s) To Augment the Capacity of the Hot Water Boiler, and To Reduce the Cooling Load
on the Existing Chiller Systems When Heat Is Required.
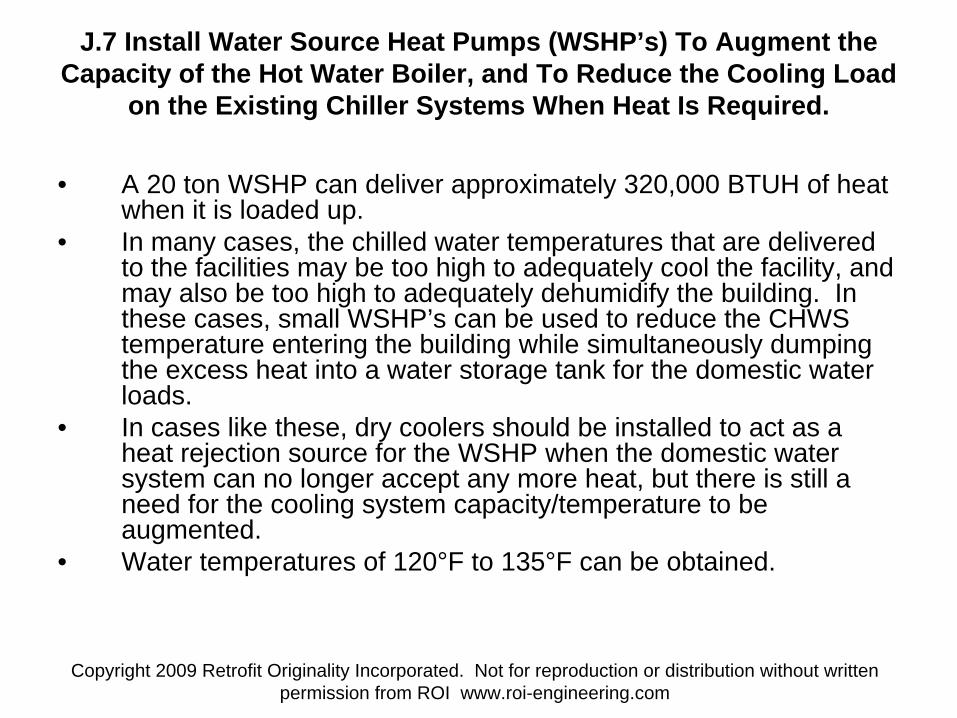
• A 20 ton WSHP can deliver approximately 320,000 BTUH of heat when it is loaded up.
• In many cases, the chilled water temperatures that are delivered to the facilities may be too high to adequately cool the facility, and may also be too high to adequately dehumidify the building. In these cases, small WSHP’s can be used to reduce the CHWS temperature entering the building while simultaneously dumping the excess heat into a water storage tank for the domestic water loads.
• In cases like these, dry coolers should be installed to act as a heat rejection source for the WSHP when the domestic water system can no longer accept any more heat, but there is still a need for the cooling system capacity/temperature to be augmented.
• Water temperatures of 120°F to 135°F can be obtained.

Copyright 2009 Retrofit Originality Incorporated. Not for reproduction or distribution without written permission from ROI www.roi-engineering.com
J.8 Develop an HVAC and Control System Design Criteria for New and Retrofit Projects.
• Weather Correct Standard Designs for the various areas of the country should be developed for Barracks, DFAC’s, Offices etc.
• Regional differences must be accounted for in the envelope and HVAC designs.
• I Really, Really, Really want to help make this happen!

Copyright 2009 Retrofit Originality Incorporated. Not for reproduction or distribution without written permission from ROI www.roi-engineering.com
J.8 Develop an HVAC and Control System Design Criteria for New and Retrofit Projects.
The “design-build” method seems to be delivering systems and designs that may provide an inexpensive first cost, but have higher than necessary lifecycle costs.
• Since we are still living with WWII era facilities, it is safe to say that lifecycle costs should be an important consideration.
Copyright 2009 Retrofit Originality Incorporated. Not for reproduction or distribution without written permission from ROI www.roi-engineering.com
J.8 Develop an HVAC and Control System Design Criteria for New and Retrofit Projects.
• A design standard for each different climate type should be developed with substantial input from the operating staff, and from Subject Matter Experts familiar with dehumidification and control system design and function in the field.
• Once implemented, the savings associated with standardized system designs and installations will result in millions of dollars per year in avoided energy, maintenance and biological remediation costs.

Copyright 2009 Retrofit Originality Incorporated. Not for reproduction or distribution without written permission from ROI www.roi-engineering.com
J.8 Develop an HVAC and Control System Design Criteria for New and Retrofit Projects.
• A design standard will also lessen the costs to perform system design and engineering reviews, as standardized designs will be able to be utilized by the local design engineering firms.
• This will have the added benefit of educating these firms for work in the private sector, allowing their clients to reduce the lifecycle costs of their facilities, and helping America to reduce energy waste and remain competitive with other nations.

Copyright 2009 Retrofit Originality Incorporated. Not for reproduction or distribution without written permission from ROI www.roi-engineering.com
J.9 AHU and Their Cooling Coils Retrofit Strategies
• Undersized cooling coils are a huge contributor to energy waste. If the cooling coils are undersized, as most of them are, fan energy is wasted, chiller energy is wasted, chilled water pump energy is wasted, condenser water pump energy is wasted and cooling tower fan energy is wasted.
• Additionally, undersized cooling coils can be a leading contributor to biological growth due to inadequate humidity control.

Copyright 2009 Retrofit Originality Incorporated. Not for reproduction or distribution without written permission from ROI www.roi-engineering.com
J.9 AHU and Their Cooling Coils Retrofit Strategies, cont
• 8.1. The AHU should be configured in a blow thru configuration, rather than a draw thru configuration. The fans should be upstream of the cooling coils, blowing through them.
• 8.2. Provide cooling coils that meet the desired leaving air temperatures with 50°f entering chilled water temperature and as close to 70°f leaving chilled water temperature as possible.
• 8.3. The maximum cooling coil face velocity should be 350 feet per minute for blow through and 300 feet per minute for draw through systems.
• 8.4. The desired fans are direct drive plug fans.• 8.5. The cooling coils should be 8 rows deep.• 8.6. The cooling coils should have 12 fins per inch.• 8.7. The maximum leaving air temperature should be 55°F.
Copyright 2009 Retrofit Originality Incorporated. Not for reproduction or distribution without written permission from ROI www.roi-engineering.com
J.9 AHU and Their Cooling Coils Retrofit Strategies, cont
• 8.8 The minimum fin thickness is 0.008"• 8.9. The minimum tube wall thickness is 0.028"• 8.10. The minimum tube diameter is 5/8"• 8.11. The coils shall be equipped with individually
replaceable return bends of no less than 0.035" thickness
• 8.12. Hairpin return bends are not acceptable.• 8.13. Provide stainless steel coil casings and
intermediate tube supports• 8.14. The maximum height between drain pans
should be 24". Provide coils that have drain pans that completely pass through the cooling coil finned surface area.

Copyright 2009 Retrofit Originality Incorporated. Not for reproduction or distribution without written permission from ROI www.roi-engineering.com
J.9 AHU and Their Cooling Coils Retrofit Strategies, cont
• 8.15. The coil air pressure drop should be less than 0.8" wc.
• 8.16 The coil water pressure drop should be less than 15'.
• 8.17 Provide low pressure drop (2 PSID maximum) automatic control valves for the cooling coil duty. Desired valves are pressure independent characterized port ball valves - Belimo or equivalent, designed for outdoor duty. Provide with a sun/rain shield for the actuators.
• 8.18 Insulation system should be vapor tight and aluminum skinned.
Copyright 2009 Retrofit Originality Incorporated. Not for reproduction or distribution without written permission from ROI www.roi-engineering.com
Summary
A recent, Peer Reviewed report in the ASHRAE Journal found that cooling coil face velocities in the 250 to 350 feet per minute range offer the best lifecycle cost, in contrast with the old school practice of sizing cooling coils at 500 to 550 feet per minute face velocity.
We have been recommending low face velocity coils for years and have found it to be true.

Copyright 2009 Retrofit Originality Incorporated. Not for reproduction or distribution without written permission from ROI www.roi-engineering.com
Poor Cooling Coil Selections• The typical “Low Delta T”
syndrome was evident at each facility we visited.– The Low Delta T syndrome has been
explained in detail in numerous other publications, but suffice it to say that it leads to the waste of huge amounts of pumping and chiller energy, and the core cause of the Low DT Syndrome is cooling coils that are too small.

Copyright 2009 Retrofit Originality Incorporated. Not for reproduction or distribution without written permission from ROI www.roi-engineering.com
Poor Cooling Coil Selections
• Most facilities were running 40°F to 42°F chilled water temperatures to provide adequate dehumidification. – One set of plants was running 38°F water for
dehumidification.• Small cooling coils require excessive CHW
flow rates and very low CHW temperatures to try to meet their loads.
• High air velocities across the coils led to water carry-off into the AHU and ductwork

Copyright 2009 Retrofit Originality Incorporated. Not for reproduction or distribution without written permission from ROI www.roi-engineering.com
Poor Cooling Coil Selections• Selecting cooling coils to provide 55°F
supply air temperature in a blow-thru fan application, with 50°F chilled water supply and 65°F to 70°F chilled water return temperatures will cure many ills, and promote efficient system operation.– 8 row, 12 fin per inch coils with a 300 to 350 feet per
minute face velocity will typically meet these needs, while reducing water carry off from the coils and the biological remediation issues that result from water carry-off.

Copyright 2009 Retrofit Originality Incorporated. Not for reproduction or distribution without written permission from ROI www.roi-engineering.com
Poor Cooling Coil Selections
• The use of 50°F CHWS temperatures and a 15°F to 20°F temperature differential allows the chillers to be piped in series.
• The combination of using a 50°F CHWS temperature and a 15°F to 20°F TD will improve the peak day system efficiency by 25% to 30%, and the annual efficiency by an equal or greater amount.

Copyright 2009 Retrofit Originality Incorporated. Not for reproduction or distribution without written permission from ROI www.roi-engineering.com
Importance of Coil Selection and Fan Orientation
• 8 row 12 fin per inch 300 to 350 FPM cooling coils are desired for peak system efficiency in most cases.
• Blow through coil design to increase CHW system TD and reduce peak loads due to reduction in over-dehumidification.
• Blow thru coils can increase CHW system TD by 34% to 65%+ and decrease peak day cooling loads by 5% or more.
Copyright 2009 Retrofit Originality Incorporated. Not for reproduction or distribution without written permission from ROI www.roi-engineering.com
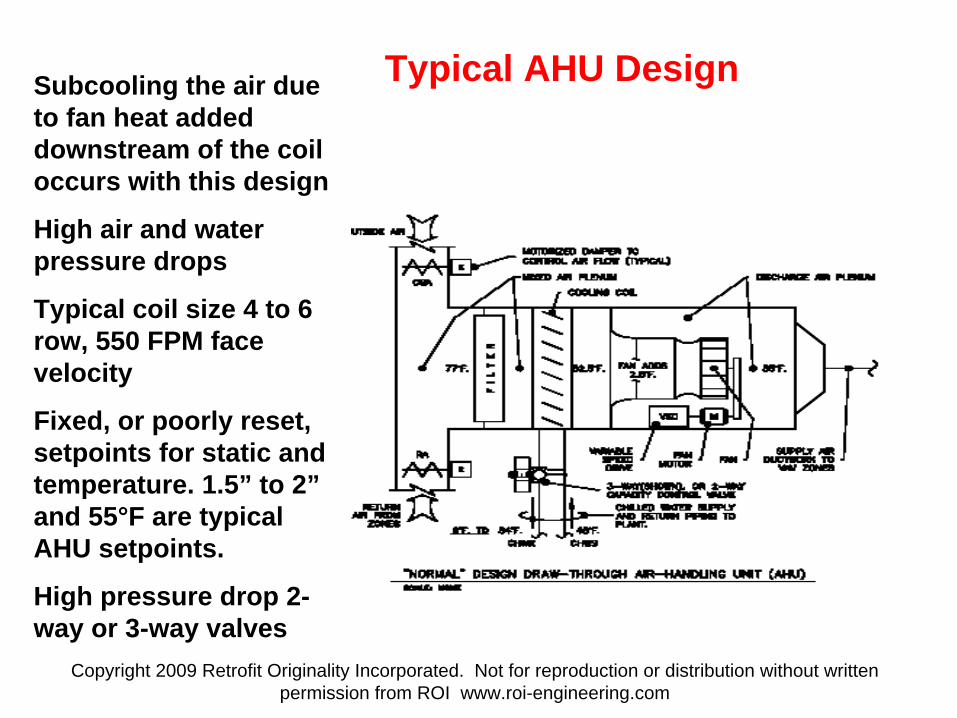
Subcooling the air due to fan heat added downstream of the coil occurs with this design
High air and water pressure drops
Typical coil size 4 to 6 row, 550 FPM face velocity
Fixed, or poorly reset, setpoints for static and temperature. 1.5” to 2” and 55°F are typical AHU setpoints.
High pressure drop 2- way or 3-way valves
Typical AHU Design

Copyright 2009 Retrofit Originality Incorporated. Not for reproduction or distribution without written permission from ROI www.roi-engineering.com
No subcooling of air due to fan heat added upstream of the coil
CHW TD increased by over 165% (24° vs. 9°)
Desired Coil Size 8 row, 350 FPM face velocityLow air and water DP’s
Static and temperature setpoints continually reset based on the loads (LOBOS)Low pressure drop 2-way valves
Allows chillers in series and substantial pumping savings
Belt drive shown, we prefer direct drive fans
Optimized AHU Design

Copyright 2009 Retrofit Originality Incorporated. Not for reproduction or distribution without written permission from ROI www.roi-engineering.com
Strategy to Increase Chilled Water System Temperature differential
• Many facilities are plagued by low chilled water system temperature differentials.
• This is commonly referred to as the “Low Delta T Syndrome”
• This hurts energy performance, whether or not the system has TES installed.
• If the system is equipped with properly selected two- way throttling type cooling coil control valves, and the chilled water supply temperature and differential pressure are properly controlled, the most likely culprit for low system temperature differentials is undersized or “worn-out” cooling coils.
Copyright 2009 Retrofit Originality Incorporated. Not for reproduction or distribution without written permission from ROI www.roi-engineering.com
Cooling Coil Performance Comparisons
• The following pages compare blow thru and draw thru cooling coil selections.
• “Normal” design coils are compared to coils that reduce air and water pressure drop, increase chilled water system temperature differentials and reduce AHHU, chiller and pumping system energy consumption.

Copyright 2009 Retrofit Originality Incorporated. Not for reproduction or distribution without written permission from ROI www.roi-engineering.com
Draw Thru 6 R 550 FPM Coil vs. Blow Thru 8 R 350 FPM Coil

Copyright 2009 Retrofit Originality Incorporated. Not for reproduction or distribution without written permission from ROI www.roi-engineering.com
6R 550 FPM Draw thru vs Blow thru and 8R 550 FPM Draw thru vs Blow thru

Copyright 2009 Retrofit Originality Incorporated. Not for reproduction or distribution without written permission from ROI www.roi-engineering.com
6R 350 FPM Draw thru vs Blow thru and 8R 350 FPM Draw thru vs Blow thru

Copyright 2009 Retrofit Originality Incorporated. Not for reproduction or distribution without written permission from ROI www.roi-engineering.com
Draw Thru 6 R 550 FPM vs. Blow Thru 8 R 350 FPM for 100% OSA system

Copyright 2009 Retrofit Originality Incorporated. Not for reproduction or distribution without written permission from ROI www.roi-engineering.com
TES Optimized Cooling Coil 32 Degree TD – 200% of Typical TES System Designs –
Doubles the Capacity of Most Installed TES Systems

Copyright 2009 Retrofit Originality Incorporated. Not for reproduction or distribution without written permission from ROI www.roi-engineering.com
30 Degree + TD’s are Possible!
• We have many systems that operate with 26°F to 32°F chilled water system temperature differentials.
• It can be done, and it is not that big of a deal to make it happen.
• Big coils allow lots of leeway for energy conservation, and also allow loads to change without having to spend $$$ to upgrade the HVAC system.
Copyright 2009 Retrofit Originality Incorporated. Not for reproduction or distribution without written permission from ROI www.roi-engineering.com
Summary• To reduce energy consumption, you need to
improve heat transfer efficiency:– Utilize large face area cooling and heating/reheat
coils to maximize system temperature differentials and minimize air and water pressure losses.
– Large cooling coils reduce air pressure drops and allow the use of high chilled water supply temperatures, while still dehumidifying, raising chiller system efficiency.
– Large face area heating and/or reheat coils reduce air pressure drops and allow the use of low hot water supply temperatures. This can allow the effective use of low quality reclaimed heat, and/or highly efficient condensing boilers.
Copyright 2009 Retrofit Originality Incorporated. Not for reproduction or distribution without written permission from ROI www.roi-engineering.com
Use the Right Equipment
• A variable speed chiller used for heat recovery would be OK, if heat recovery mode was only enabled when there was a large need for heat, rather than continuously.
• Raising the head pressure for heat recovery duty on a VFD chiller wastes substantial energy.
• A small dedicated HR chiller or Water-Sourced Heat Pump and a HW storage tank is a better solution for heat recovery, in most cases.

Copyright 2009 Retrofit Originality Incorporated. Not for reproduction or distribution without written permission from ROI www.roi-engineering.com
Summary
• Energy Conservation = water conservation.– If a cooling system is water cooled, saving
energy will reduce the amount of heat that has to be rejected by evaporating water, so water savings will result.
• It may be possible to capture and re- use condensed moisture off of the cooling coils.

Copyright 2009 Retrofit Originality Incorporated. Not for reproduction or distribution without written permission from ROI www.roi-engineering.com
Put the VFD on the Biggest Chiller!• VFD chiller performance is related to refrigerant lift
and relative load.• Refrigerant lift is related to chilled and condenser water
temperatures and refrigerant approach temperatures.• Refrigerant approach temperatures are related to relative load
and heat transfer surface area.• Relative load and heat transfer surface area are related to the
size of the chiller. – The bigger the chiller, the lower the relative load will be and the
greater the heat transfer surface area will be.• The lower the relative load and the greater the heat transfer
surface area, the closer the approach temperatures can be. • The closer the approach temperatures can be, the lower the lift
can be.• The lower the lift, the more efficient the chiller can be (within
limits).

Copyright 2009 Retrofit Originality Incorporated. Not for reproduction or distribution without written permission from ROI www.roi-engineering.com
Fully Loaded VFD chiller @ 0.35 kW/Ton – VFD Chiller Efficiency is more related to lift than to load

Copyright 2009 Retrofit Originality Incorporated. Not for reproduction or distribution without written permission from ROI www.roi-engineering.com
2040 Main Street (VSE/LOBOS lite)
Put the VFD on the biggest Chiller you have!750 ton VFD chiller at 6.3% load (47 tons) – total plant efficiency = 0.42 kW/ton.
250 ton CS chiller at 20% load (49 tons) – total plant efficiency = 1.62 kW/ton.

Copyright 2009 Retrofit Originality Incorporated. Not for reproduction or distribution without written permission from ROI www.roi-engineering.com
WAKE UP! Time to go to the next presentation!• Thank you for giving me the
opportunity to help you help our troops, and help our Country. It is an honor to work with you.
• Scot M. Duncan, P.E.