veterans farm management service vocational divison of the minnesota department of education asked...
TRANSCRIPT

1951 ANNUAL REPORT
VETERANS
FARM MANAGEMENT SERVICE
NORTHERN MINNESOTA
------ 0 ----- shy
UNIVERSITY OF MINNESOTA
Department of Agriculture
and
Vocational Division
MINNESOTA DEPARTMENT OF EDUCATION
Cooperating
------ 0-----shy
Report No 201
Division of Agricultural Economics
University Farm
St Paul I Minnesota
August 1952
700 - 852
6Frazee
LittlA Fork
Pinp Riv~
Cromwel Carlton
LEGEND I Southeast dairy lIvesock 2 South cenfrol dairq 3Southwest IIvesfock and
cash qraln Lt_~iIiIIDlSjt 118
Alplf8nd ia 4West central cosh qro
IJI1d ivesockIongrrair 5pounda5t central dairy
6NorthweJt dail livesfOck and Glover seed
1Red River Valley small qnrinJ poftdoes and lives tock bull
8Norfhern cut ov~r dairtj pofatoes and clowr seed
9Twin Cities suburban truck ~dQir9 Qnd fruit
8
Fig 1 TyPe-of-Farming Ar~a in Minnesota and Location of Schools Submi tUng Farm Record forth tl Report
REPOm OJ THE FARM MANAG~ SERVICE FCB VmERANS TAKING ON-THE-FABM TI4INING IN NORlHERN MINNESOTA 1951
TR Nodland BW Swanson and GA Pond
INDEX Page
Introduction bull bull bull bull bull bull bull bull bull bull bull bull bull bull bull bull bull bull bull bull bull bull bull bull bull bull bull bull bull 1 Jarm Inventories bull bull bull bull bull bull bull bull bull bull bull bull bull bull bull bull bull bull bull bull bull bullbullbullbullbullbull 2 Ja~ Earnings bull bull bull bull bull bull bull bull bull bull bull bull bull bull bull bull bull bull bull bull bull bull bull 2 Household and Personal Expenses and Receipts bull bull bull bull bull bull bull bull bull bull bull bull bull 6 Family Living From the Farm bull bull bull bull bull bull bull bull bull bull bull bull bull bull bull bull bull bull bull 6 Net Worth bull bull bull bull bull bull bull bull bull bull bull bull bull bull bull bull bull bull bull bull bull bull bull bullbullbullbull 7 Returns to Capital and Family Labor bull bull bull bull bull bull bull bull bull bullbullbullbullbullbullbull 10 Management Factors and Their Relation to Earningebullbullbullbullbullbullbullbullbullbullbull 10 Cumulative Effect of Excelling in a Number of Management Factors bullbullbull 12 Explanation of Work Units bullbullbullbullbullbullbullbullbullbullbullbullbullbullbullbullbullbullbullbullbullbull Measures of Farm Organization and Management Efficieneybullbullbullbullbullbullbullbull i~ Thermometer Chart bullbullbullbullbullbull bullbullbullbull bullbull bullbullbullbullbullbullbullbullbullbullbullbullbull 15 Distribution of Acres in Farm bull bull bull bull bull bull bull bull bullbull bull bull bull bull bull bull bull bull bull bull 16 Crop Yields Per Acre bull bull bull bull bull bull bull bullbull bull bullbullbullbullbullbullbullbullbullbullbull bullbullbull 17 Power and Machinery Expenses bull bull bull bull bull bull bull bull bull bull bull bull bull bull bull bull bull bullbullbull 17 Amount of Livestock bull bull bull bull bull bullbull bull bull bullbullbullbullbullbullbullbullbullbullbull bull bullbull bull 18 Total Feed Costs and Returns from Livestock Enterprises bull bull bull bull bull bullbull 18 Dairy and Dual Purpose Cattle bull bull bull bull bull bull bull bull bull bull bull bull bull bull bull bull bull bull bull bull 19 Chickens bull bull bull bull bull bull bull bull bull bull bull bull bull bull bull bull bull bull bull bull bull bull bull bull bull bull bull 22 Hogs bull bull bull bull bull bull bull bull bull bull bull bull bull bull bull bull bull bull bull bull bull bull bull bull bull bull bull bull bull bull bull bull bull Sheep bull bull bull bull bull bull bull bull bull bull bull bull bull bull bullbull bull bull bull bull bull bull bull bull bull bull ~~ Summary of Farm Inventories by Years 1947 - 1951 bull bull bull bull bull bull bull bull bull bullbull 24 Summary of Farm Earnings by Years 1947 ~ 1951 bull bull bull bull bull bull bull bull bull bull bull bull 25 Summary of Acres and Crop Yields per Farm by Years 1947 - 1951 bullbullbullbull 26 Summary of Miscellaneous Items by Years 1947 - 1951bullbullbullbullbullbullbullbullbullbull 27
INTBODUCTIOli
In the fall of 1946 the Vocational Divison of the Minnesota Department of Education asked the University of Minnesota to set upa farm management service for veterans taking onthe-farm training in the public sehools throughshyout the state The service was initiated on January 1 1947 The cooperating agencies are the Division of Agricultural Economics University of Minnesota and the Vocational Division Minnesota Department of Education representing the public schools
The purpose of the project as far as the schools are concerned is (1) to give assistance to the instructors inthe mechanics of keeping farm records and (2) to aid in the analysis of the farm business through the use of records as a basis for vocational guidance Schools with an on-the-farm training program can enroll their students in the farm management service The enrollment is on a voluntary basis insofar as the number of schools participating and the numbers of veterans enrolled in the service are concerned
The analysis of the records and the preparation of the reports are handled by the Division of Agricultural Economics under the direction of GA Pond and TR Bodland The State Department of Education was represented by GR Cochran At the end of tlie year B lI Stanton RM Dennistoun and BG Bouthe of the Division of Agricultural Economics aided in closing the records
- 2shy
This report deals with the veterans enrolled by twenty schools located in northern Minnesota (Type-of-Farming Areas 5 6 and 8)1 The map on the inside front cover shows the location of the schools The folloWing tabulation shows by schools the number of farm records submitted in 1951
TYpe-of-Farmin~ Area 5 TyPe-of-Farming Area 6 ~e-o f-Farming Area 8 Cambridge 6 Alexandria 9 Akeley 4 Cromwell 3Foley 5 Frazee 3 Bagley 6 Little Fork 2 Little Falls 11 Long Prairie 5 Baudette 3 McGregor 1 Princeton 4 Perham 6 Brainerd 4 Pequot Lakes gStaples 10 Carlton 3 Pine Biver
Williams 1tTotal Total Total33 39
The subsequent pages in this report show the data for 95 farms Three farms were omitted from all the averages in the tables because the records did not inshyclude a full year or they were otherwise too incomplete for a full analysis
The records kept by the enrollees included farm inventories at the beginning and at the end of the year cash farm receipts and expenses feed consumed by the various classes of livestock family living received from the farm liabilities and assets other than the farm capital and household and personal cash expenses and receipts
Only reco rds from actual farm operato rs are included in this repo rt All types of tenure arrangements from full owners to partnerships in which the operator fUrnishes little or no capital are represented
The capital investment per farm varied from $3136 to $45872 The average investment for all farms included in this report and for the one-fifth high and the one-fifth low in operators labor earnings is shown in Table 1
Landlords or partners supplied some capital in 47 out of the 95 cases inshycluded in this report The landlords investment has been included in Table 1 in order to show the total amount used per farm
FAm( EARllIllGS
Operators labor earnings is a measure of relative financial success of a farmer as compared with other farmers and represents the returns above all farm expenses and a charge for the use of farm capital For purposes of comparison the earnings are presented on a full-owner basis
There are two methods of computing operators labor earnings Table 2 shows the earnings statement on a cash basis and Table 3 shows the earnings on an entershyprise or accrual basis The principal difference in the two statements is in the method of handling the net increase or decrease in the value of farm capital In the cash statement the net increase or decrease in farm capital is e~tered as one item In the enterprise statement the net change in the inventory has been included in each enterprise in order to compute-total returns and net increases- or total penses and net decreases by enterprises
- 3shy
Table 1 Summary of Farm Inventories 1951
Your farm Average of 95 farms Items Jan 1 Dec 31 Jan 1 Dec 31 Size of farm (acres) Size of bUsiness (w~rk units)bullbull
Dairy and dual purpose cows Other dairy amp dual purpose cattle Beef cattle Rogs Sheep Poultry Productive livestock (total) Horses Crop seed and feed Power mach (farm share) Crop amp general mach (farm share) Livestock equipment amp supplies Machbull $I equipment (total) Misc Buildings fences etc Land
Total farm capital
bull 1383 596 74
200 32 gO
2365 52
1353 13132
13139 204
2475 2
3844 3726
13317
$ 1642 1337 137 264 45 72
29~I 1061 15513 1164
247 2969
2 3864 3726
14660
19 most profitable 19 least profitable farms farms
Items Jan 1 Dec 31 Jan 1 Dec 31 Size of farm (acres Size of business (work units)bullbull
1136 316
Dairy amp dual purpose cows qther dairy amp dual purpose cattle Beef cattle
$ 1727 730
113
$ 2135 1302
136
$ 1245 594
$ 1600 674 10
Rogs Sheep Poultry Productive livestock (total) Rorses Crop seedand feed Powermach (farm share) Crop amp general mach Livestock equipment amp supplies Mach amp equipment (total) Misc
220 4
119 28113
64 1151 17139 1123
271 31133
345 9
109 39136
613 1331 113135 1460
291 3636
127
~ 2047
53 571
1258 759 156
2173-
134 56 41
2515 313
61313 1530
1369 177
2576
Buildings Land
fences etc 5057 5677
4916 5677
3480 2346
3503 2346
Total farm capital 17950 19614 10670 11666
bull Jor the purpose of comparison all the data shown in this report With the exshyception of Tables 6 and 7 are presented on a full-owner basis The assets expenses and receipts of the landlord were included in the records from rented farms bull
bullbullSee page 13 for an explanation of work units
-4shy
Table 2 Summary of Farm Earnings (Oash Statement) 1951 Average 19 most 19 least
Your of 95 profitable profitable Items farm farms farms farms FABM REOEIPTS
Dairy and dual-purpo se cows $ 466 $ 202$ 3~2 Dairy products 2269 1546 17~ Other dairy amp dual-purpose cattle 3 494 394 Beef cattle 56 16 Hogs 647 1044 285 Sheep and wool 37 3 50 Poultry (including turkeys) 125 Eggs 343 4~~ l~~ Horses 12 5 10 Oorn 63 174 shySmall grain 252 601 23 Other crops 200 383 90 Machinery amp equip sold 167 191 147 Agricultural adjustment p~ents 29 26 21 Income from work off the farm 159 168 68 Miscellaneous 14 -rL (1) Total farm sales 4595middot ~ 3053 (2) Increase in farm capital 1~43 1664 996 (3) Family living from the farm 68
85 0 ~(4) Total farm receipts (1)+(2)+(3) bIiOb ~ 29
FARM EXPENSES Dairy and dual-purpose cows bought $___ $ 242 $ 224 $ 327 Other dairy and dual-pur cattle bot___ 98 179 62 Beef cattle bought 22 1 shyHogs bought 52 106 26 Sheep bought 3 2 7 Poultry bought (including turkays) 41 58 21
8 14Horses bought MisC livestock expense 47 63 34
174Misc crop expenses 219 278 Feed bought 676 792 487middot
236 162Custom work hired ~2140 642Mecho power macho(farm share)(new) 535
Mech power mach (farm share) (upkp) ___ 107 114 123 Mech power (f share)(gasoil etc) ___ 459 353 Orop and general mach (new) 12~ 597 2~ Orop and general mach (upkeep) 65 95 Livestock equipment (new) 77 55 50 Livestock equipment (upkeep) 17 22 16
221 69Buildings and fencing (new) l~a66 73Buildings and fencing (upkeep) 60 37Hired labor 53
176 255 110Taxes 46 41General farm and insurance
3glig ~ -32213(5) Total farm purchases(6) Decrease in farm capital shy(7) Interest on farm capital 699 9~9 5513 (g) Unpaid family labor 351 3 5 473
612(9) Board furnished hired labor (10) Total farm expo (sum of (5) to (9)__ 4910 56f~ ~ (ll Opero labor earnings (4) - (10) 1496 2S81 1~
- 5 shy
Table 3 Summamp of Jara Barn1llga (lnte1pr1se Stat_ent) 1951shyAveragemiddot 19 most 19 least
Yotp 0195 prOfitable profitable 11$em8 farm farms farms farms RETlJRNS AND BET IN~lDU6BES Dairy and dualp rposecowe $ 2077 $ 2714 $ 1736
other dairy amp dual pur cattle 896 1463 725 Beef cattle 90 42
Hogs 719 11413 327 Sheep 47 7 64 Poultry 464 235 J1sectAll productive livestock 4293 5909 3030
-Crops se~dtand feed -259 122 -512 Agricultural conservation p~ent8 26 21 Income from labor off the farm l~~ 84 42 Mi scetlaneous 117 140 127
(1) Total returns amp net increases 4284 6281 2708
EXPENSES AND Nm DECBEASES Horses $ 32 $ 31 $ 32 Tractor 330 386 307 Truck 89 129 137 Auto (farm share) 220 195 195 Gas engine and elect exp (f share) 54 59 60 lii red power 101 ~ ~ Total power 826 9 5 800
Crop and general machinery 241 304 198 Livestock equipment 48 54 40 Buildings fencing and tiling 213 213 197 Misc productive livestock exp 47 63 Labor 490 580 5~~ Real estate taxes 206 78l~iPersonal property tax 49 32 Insurance 26 18 25 General farm 22 29 16 Interest on farm capital 699 939 558
~2) Total ezp amp net decreases 27138 3400 2544 3) Oper labor earnings (1) - (2) 1496 21381 164
-Cash receipts and expenses are adjusted for ch~ges in inventory for each enterprise and for each item of expense in order to show total receipts and net increases and total expenses and net decreases The operator1s labor earnings are th6 same as those on page 4
- 6 shy
FAMILY LIVING FBOM THlil FABM
The family liVing from the- farm is the estimated value of the farm produce used in the house and shelter furnished the fanner and his family by the fam It is a part of the income of the farm and a part of the expenses of operating the household even though cash transactions are not involved The omission of the farm produce used in the home results in an incomplete record of both farm income and personal expense
The value of the family living as shown in Table 4 amounts to 7 per cent of the total farm receipts on these farms The values assigned are a conservashytive market price on the farm If these products had been purchased~ the amount paid out would have been considerably higher
The rental value of the dwelling is calculated by taking 10 per cent of the average inventory value of the dwelling
Table 4 Family L1v From the Farm 1951 Average Average
Your of 95 Your of 95 ~I~t~em~s~______________~f~arm~~__~f~a~rm~s __~f~a=rm~____f~arm~~s~ Adul t equiv - family _ 25
- others 2
Whole milk Skim milk Cream Farm made but t er Beef Hogs Poultry Eggs Potatoes Vegetables amp fruits Farm fuel Rental value of house Total
695 qts 70 qts 91 pts 3 lbs
200 lbs 260 lbs 78 lbs 70 doZ 9 bu
8 cds
ROUSEaOLD AND PERSONAL EXPENSES AND RECEIPTS
Household and personal accounts are important if the family is to man88e its financial affairs wisely The household and personal expenses and receipts are presented in Table 5 These farmers spent an average of $123 per month for family living in addition to the food fuel and housing furnished by the farm
---
--
- 7 shy
Table 5 Household and Personal Ixpenses and Receipts for Those Farmers Who Kpt Complete Accounts of Thele Items 1951
15 most 15 least Average prafit- profit shy
Your of 77 able able ~I~t~ee~8______________~__~_____________~=f~a~rm=-____~f~a=rm~s____~f~a~rm~s ____~~~_farms Number of persons in family Number of adult equivalents in family Number of other adult equivalents
EXPENSES Food and meals bought $ Operating and supplies Clothing and clothing materials Pereonal care personal spending Jurni shings and equipment
Education recreation and development MediCal care and health insurance Church welfare gifts
Personal share of auto expense Household share of elec ampI gas eng expo ___
HH amp per shr of new auto amp motors bot__ Total cash living expense
State and federal income tax Insurance
Total household and pers cash exp
Joodfurnishedby the farm Juel furnished by the farm House rental
Total cash expenses and perquisites
Purchase of stocksbonds~d other invest
BECEIPTS Sale of investments Income from outside investments Veterans compensation Misc income
34 25
2
36 25 2
26 21 5
$ 516 142 147 76
138 56
135 71 75 34 88
1478
$ 529 211 181
84 130 54
155 103 66 40
Ib~~
$ 416 86 71 41
145 25
126 48 71 31
116 1176
4 42
1524
1 --Esect1718
1 ---2g 1229
283 41
l22002
263 23
ill 2195
202 22
-ill 1572
7 23
16 18
1112 52
11~~ 57
83 9
992 29
Hired help or others boarded
Nm WORTH
A net worth statement includes a listing of all the assets and liabilities as of a given date The difference between the farmer1s total assets and his liabilities is his net worth A net worth statement for owners part-owners and renters is presented in Table 6 Both the farm and personal assets and liabilities are included
The difference between the operator1s net worth at the beginning and at the end of the year shows the gain in net worth It represents the financial progress that has been made during the year
-8shy
Table 6 Net Worth Statement for Those Farmers Who ICept a Complete Record of All Assets and LiAbilities 1951 Operators SharAcent
Your farm 9 owners Jan 1 Dec 31 Jan 1 Dec 31
Total acres in farm Owned Rented
Total farm capital Accounts Receivable
Stocks and bonds Life insurance Outside real estate Other outside investments
Total outside investments Cash on hand and in bank Other household amp personal assets
Total cash household amp personal assets ___ TOTAL ASSETS
Federal Land Bank No rtgage Other mortgages on land operated Crop loans Other Chattel Mortgages Notes pqable Accounts pqable
TOTAL LIABILITIES Farmer1s net worth Gain in net wo rth
Total acres in farm Owned Partners share or rent ed
Total farm capital Accounts receivable
Stocks and bonds Life insurance Other outside investments
Total outside investments Cash on hand and in bank Other household and personal assets
Total cash household amp personal assets TOTAL ASSmS
Federal Land Bank Mortgage Other mortgages on land operated Crop loans Other Chattel mortgages Notes pqable Accounts payable
TOTAL LIABILITIES Farmers net worth
Gain in net worth
152 152
$11310 59 39
118 6
13 176 129
1238 1367
12912 50
2599 23
609 632 181
4094 8818
$12429 29 46
112 25 20
203 166
1368 1534
14195 50
2515 20
600 700 114
3999 10196 +1378
21 ~art owners 19 rentersmiddot Jan 1 Dec 31 Jan 1 Dec 31
215 129
86 $10008
13 6
34 1
41 102 943
1045 11107
2216
833 475 286
3810 7297
$11380
2 57 1
60 120
1087 1207
12647 105
2279 67
741411 327
3930 8717
+1420
217
217 $6232
203 48 17
268 118 937
1055 7555
1087 642 147
1876 5679
$7397 13
125 55 18
198 174
1108 1282 8890
867 560 135
1562 7328
+1649
bull Six rented for cash five cash and crop share and five livestock and crop share and three crop share
- -
- 9shy
of Farm Earni s Tenure erators Share Your 21 part- 19 farm owners owners renters
FABM RECEIPTS Dairy and dual purpose cows $285 $ $ 406~2Dairy products 1556 1 2 1751 Other dairy and dual purpose cattle 417 3682~~Beef cat t1e 6 54 Hogs 575 429 956 Sheep and wool 37 35 42 Poultry (including turkeys) 55 329 73 Eggs 327 244 330 Horses 12 15 5 Corn 38 49 12 Small grain 181 301=i 129 Other crops 149 16( 65 Machinery amp equipment sold 176 125 170 Agricultural adjustment p~ments 32 27 17 Income from work off the farm 157 236 103 Misc 11 26 (1) Total farm sales Ifcii4 3963 ~ (2) Increase in farm capital 1119 11651~72 (~) Family living from the farm 10 461 ( ) Total farm rec (1)+(2)+(3) ~ 6120511 5745
FABM EXPENSES Dairy and dual purpose cows bot $ 246 $ 278 $ 230 Other dairy amp dual pur cattle bot 68 107 152 Beef cattle bot (including feeders) 12 3Hogs bot 34 72 80 SheeP bot (including feeders) 2 2 7 Poultry bot (including turkers) 62 2235 Horses bot 9 12 6 Misc livestock expenses 50 4437 Misc crop expenses 206 236 186 Feed bot 648 621 660 Custom work hired 197 216 261 Mech power mach (farm share)(new) 470 58050~Mech power mach (farm share)(upkp) 13 102 137 Mech power (farm share)(gas oil etc) 336 408 394 Crop and general mach (new) 326 32944dCrop and general mach (upkeep) 54 79 Livestock equipment (new) 102 63 66 Livestock equipment (upkeep) 16 225 Land buildings amp fencing (new) 231 79 24 Buildings and fencing (upkp) 75 52 44 Hired labor 53 38 70 Texes (real estate amp pers property) 129 124 General farm and insurance 58 33 a~ Cash rent 25 280 Interest paid 122 ~ (5) Total farm purchaseR 3640 3euro~g 3828 (6) Decrease in farm capital (7) Interest on farm capital 471 408 283 (8) Unpaid family labor 177 144 311 ( 9) Board fumi shed hiTad labor 8 8
(10) Total farm expo (Sum of (5) to (9) li2sectb 1+21+8 44~~ (11) Operators labor earn(4) - (10) 1315 1497 1668 (12) Bet cap amp family lab(7)+(S)+(11) 1963 2049 2262
- 10 shy
RETURNS TO OAPITALAED FAMILY LABOR
The return to capital and family labor represents the amount available to the operator for living expenses payment on indebtedness and savings The landlordl s expenses and receipts are not included
The average return to capital and family labor for 49 owners 21 part-owners and 19 renters is shown in Table 7 The statements include only the veterans share of the earnings in each case ~he earnings as shown in Table 7are on an actual basis as compared to the fUll-owner basis in Tables 2 and 3
MAIUGEMENT FACTORS AND THEIR RELATION TO EABNINGS
Every studyen of farm earnings shows a wide variation in earnings among farshymers in a given year The average labor earnings of those farmers ranking in the upper 20 per cent of the range according to earnings was $2881 and of those in the lower 20 per cent Was $164 This is a range of $2717 between the average earnings of these two groups Some of the causes for these differences in earnshyings such as weather may be beyond the control of the individual farmer Other factors are wi thin his control The more important management factors affecting earnings and their relationships with earnings are presented in the following tables (frse factors vary from year to year in their relative influence on earnings
Crop Yields The measure of crop yields used is the crop yield index It is a comparison of the yield per acre of all crops on a given farm with the avershyage yields for all farms in e~h of the three type-of-farming areas included in the studyen High crop yields make their maximum contribution to earnings if they are the result of good crop selection the use of adapted varieties skill and t~meliness in performing the operations
Table 8 ~elation of Crop Yields to FarmEarnings Index of crop Yields No of Average operatorls Range Average farms labor earnings ~elow 77 65 20 $1319 77 - 109 94 37 1596 lJ 0 and above 131 22 1762 bull Thp records from 16 farms with less than 20 per
cent of the work units on crops were omitted from this table
Choice of Crops Over a period of years certain crops have a definite advantage over others The crops are claSSified on page 16 as A ~ C or D crops on the basis of their average net retums per acre The relation of choice of crops to earnings is shown in Table 9
Table 9 Relation of Choice of Crops to Farm Earnings Percent of tillable land No Average
in high return crops of operatorl s ige Average farms labo r earnings ~elow 240 138 17 $ 1016 240 - 499 351 59 1563 500 and above 603 19 1716
(l)See Pond GA IWhy Farm Earnings Vary Minn Agri Expt Sta ~ul 386 June 1945shy
- 11 shy
Re~urn from Livestock This is a measure of feeding efficiency All ofmiddotthese farmers maintain dairy cattle In addition to the dairy herd some farmers maintain a few hogs chickens and sheep_ Most of the crops raised and some additional purchased feed are fed to livestock Since feed is the major item of cash in livestock production improveshyments in feeding efficiency results in a higher earnings
Table 10 Relation of Returns From Productive Livestock to Farm Earnings Index of returns for $100 feed No Average consumed bZ Eroductive livestock of operators AAge Aver~e farms labor earniags Below 83 73 18 $1238 83 - 119 99 60 153120 and above 136 II 163 The index is weighted by the number of animal units of each class of livestock
Amount of Livestock This factor measures the importance of livestock in the farm business It is the amount of livestock units per 100 acres in the farm other than land in timber roads waste and farmstead Livestock are important in this area where hay and pasture are the predominant crops They provide employment throughout the year and aid in maintaining or buildshying up the fertility of the land
Table 11 Relation of Amount of Livestock to Farm Earnings Livestock units per 10 Average
100 acres of operators Range Average farms labor earnings
The records from 4 farms with more than 45 per cent of the work units on work off the farm were omitted from the table
Size of Business Productive man work units are a measure of size of business The relationship of size of business to farm earnings is Shown in ~lable12 Average farm earnings t end to increase with an increase in size of business if size is accompanied by good management For farmers operating their farms at a loss the larger the volume of business the larger will be the loss Normally a large business has an advantage over a small bUsiness because they utilize more efficiently and to better advantage available labor power machinery equipment and buildings
Table 12 Relation of Size of Business to Farm Earniags Work units No of Average operatorfs
Averag e farms labor earniags Below 170 137 170 - 325 245 325 and above 399
Work Acconwlishtc Per Worker_ The work accomplished per worker is determined by dividing the total man work units by the number of wcrkers on the farm during they-ear An increase in the productive work accomplished
- 12 shy
per worker reduced the labor charge per unit of business Planning of the farm work and economical use of labor-saVing machinery help to increase the output of work per worker
Table 13 Relation of Work Accomplished Per Worker to Farm Earnines Work units per worker Bo of Average operators Range Average farms labor earnings Below 145 122 18 $ 8~9 145 - 255 198 59 1508 255 amp above 307 18 2101
Control Over EePenseso The depreCiation and cash cost of upkeep for power machinery equipment and buildings per unit of work is used as a measshyure of the efficiency of their use on a farm Some farmers lack power machinery and buildings for satisfactory operation In case of others an excessive investment in these items may coneti tute an important factor limiting earnings
Table 14 Relation of penses to Farm Earnings Expenses per wo rk unit No of Average operators Range Average farmS labo r earnings $6110 amp abCve $819 19 $ 863 $400 - 649 51( 57 1595 Below $400 342 19 1831
CU~IVlll EFllilCT OF EXCELLING IN A NUMBER OF MANAGDfENT FACTORS
The relation of several management factors to operators labor earnings has been shown in the preceding section Because of the large number of inter-relationships between these factors on earnings is shown in Figure 2 Insofar as these factors are within the farmers control he m~ be well paid for his efforts to improve his efficiency as measured by them
No of factors
in which No Average Operators Labor Earnings farmers of
excelled farms $600 $1200 $1800 $2400
0 or 1 11 $ 787
2 24 1168
3 18 1253
4 18 1817
5 18 1877
6 6 2728
Fig 2 Average operators labor earnings on farms grouped according to number of management factors in which the farmer was above average
- middot13
The arrlq in Figure 2 suggests that it mlq be well worth while for each cooperator to study carefully his ranking on pages 14 and 15 and learn his standing in respect to each of the seven factors as indicators of elements of strength and weakness in his farm business
EXPLANBION OF WORlC UNITS
The total work units for any one farm is a measure of the size of that farm business A work unit as used in this report is the average accomplishshyment of a farm worker in a ten hour dq working on crops and productive liveshystock at average effic5ency or ten bours of work off the farm for pay The number of WI)rk units for each class of livestock and each acre of crop are presented in Table 15
Table 15 Number of Work Units for Each Class of Livestock and Each Acre of Crop
10 of No of Item work units Item work units Dairy and dual pur cows 140 per cow Small grain 7 per acre Other dairy amp dUe pur cattle 4-0 per an unit Co~ husked 11 per acre ~eef breeding herd 50 per an unitmiddot Corn bogged 7 per acre Feeder cattle 35 per 100 lbs Corn shredded 22 per acre Sheep - farm flock 18 per an unit- Corn silage 17 per acre Bogs 3 per 100 lbs Corn fodder 10 per acre Turkeys 7 per 100 lbs Alfalfa hq 9 per acre Hens 220 per 100 hens Soybean hq 14 per acre Soybeans for grain 7 per acre Other hay crops 6 per acre
bull An animal unit represents one dairy cow or bull 2 head of other dairy cattle 1 beef cows or bull 1 feeder steer or heifer 3 13 other beef cattle 7 sheep 14 lambs 2i hogs 5 pigs 50 hens or 1100 pounds ofturk61s produced
- 14shy
Table 16 Measures of Farm Organization and Management Ifficienclt 1951 19 most 19 least
Average profit- profit-Measures used in chart Your of 95 able able on page 15 farm farms farms farms
Operato r I s labo r earnings $- $1496
(l) Crop yields 100
(2) ~ of tillable land in high ret cropsbullbull
(3) Ret for $100 feed to prod livestoc~middot 100
(4) Prod livestock units per 100 acresbullbullbullbull
(5) size of business - work units
(6) Work units per worker
(7) Pow mach equip amp bldg expo per work unit
$2881
105
425
105
156
316
243
$164
90
365
97
163
206
158
$648
Items related to aome of the aboTe measures
(2) ~ of tillable land in high ret crops Type-of-farming area 5 301 362 Type-of-farming area 6 408 458 Type-of-farming area 8 36bull8 53 0
(3) Index of return for $100 feed from Dairr cattle (See pages 20 and 21) 100 107 91 Beef cattle (See pages 20 and 21) 100 Beef cattle - breeding herd 100 Hogs (See page 23) 100 92 132
Sheep - farm flock (See page 24) 100 Chickens (See page 22) 100 100 84
(4) Number of animal units 227 159
100 51(5) Work units on crops 75 Work units on productive livestock 168 204 149
12 6Other work units 15
(6) Number of family workers 12 12 1Number of hired workers
12 13 1middot3Total number of workers
$301 $430(7) Power expense per work unit $- $3middot39 100 101Crop machinery expense per work unit middot97
Livestock equip expense per work unit 19 18 19 68 98Bldgs amp fencing expo per work unit 81
~iven as a percentage of the avelagebullbullCrops are marked in Table 17 as (A) (B) (C) and (D) All of acres in (A) crops one half of acres in (B) crops and one fourth of acres in (C) crops
are used in calculating per cent of tillable land in high return cropsAn index weighted by the animal units of livestockbull
bullbullbullbullAcres in timber not pastured roads waste and farmstead were not included
- 15 shyThermometer Ohart
Using your figures from page 14 locate your standing with respect to the various measures of farm organization and management efficiency The averages for the 95 farms included in this summary are located between the dotted lines across the center of this page
Oper Return Pro LS Work Pow mach labor High from pro- units units eqamp bldgs earn- Orop return ductive per Work per exp per ings yields
bull bull
7ur-shy
6L101-----I
bull36bull bull bull
32bull
28
crops livestock 100 A units
420
7 6
4
worker work unit
335
320
305
290
275
260
245
230 5 bull bull
215 bull bull
200
185
170
155
140
125
110
- 16 shy
Table 11 Distribution of Acres in Farm 1251 Crop ratings for Average of farms type-of-farming in type-of-farmi~
Crop areamiddot Your area 5 6 8 farm 62 8Flax C e e 6 6 52Barley D e C 4 3middot2 ~8Oats C C C 247 292 1 0
Wheat D C D 4 1638Rye C D D 42 7 2Misc D D D - hl --lTotal small grain shy303 390 251
Garden and seed potatoes Potatoes Corn silage Corn grain Corn fodder Soybeans for grain
Total cultivated crops
A B C C D D
A e C C D D
A e C D D D
1 91
138 20 ~ 255
1 68
lld 22 ~ 213
2
1 32 2middot3
2 -
bO Alfalfa hay Alfalfa seed Red or alsike clover hay Red or alsike clover seed Mixed legumes amp non-legumes Timo tbyen ando r brome hay Wild hay on tillable land Annual hay and misc
Total tillable land in hay
A B s B C D D D
A e e s C D D D
A s e e C D D D
78
28 2
2middot310 25
--2plusmn 17 0
197 10 34
6 18 16 17 -4 299
114
52 31 71 34 14middotmiddot
L9 33middot5
Legumes and mixtures Other tillable pasture
Total tillable land in pasture
bullbull D
bullbull D
bullbull D
9
H5
8 14 22
middot946 55
Tillable land not cropped Total tillable land
D D D -bl 79middot3 ~9 2
-hl 752
Wild hay (non-tillable) Non-tillable pasture Timbet(not pastured) Roads and waste Farmstead Total acres in farm
13middot7 378 12middot3 70 34
153middot5
110 514 152 110 42
1950
40 459 ~72 5
~181shy
Per cent land tillable Per cent tillable land in high ret crops
511 301
49J 408
414 36bull8
bull Ae Ct and D refer to ranking used in calculating per cent of tillable land in high return crops see page 10
Alfalfa pasture was rated as an A crop and other legumes and mixtures for passhyturea C crop
17
Table 18 Orop Yields Per Acre 1951 Average of farms -groving
Your each crop in tyPampoOffarming area Orop farm 5 6 8 Flax bu Barley bu Oats bu Wheat bu
Buckwheat bu 107 qe bu 13middot7 -Potatoes bu 65 64 Oorn silage tons 54 57 48
Corn grain bu 357 359 357 Oorn fodder tons 21 32 Alfalfa hav tons 17 19 17 Red or alsike clover hay tons 11 13 12
Red or alsike clover seed lbs 120 Other leg amp leg mix for hay tons 16 16 12 Brome or timothy hay tons 12 10 9 Wild hay on tillable land tons 7 12 10
Annualmiddot hayentons 3 10 Wild h~ on non~tillable land tons 5 5 7
raquo
POWER AND MACHINERY EXPENSJI
Power and machinelj expense per crop acre is an indication of the economy with which capital is invested in these items The crop acreS per farm ranged from 14 to 210 with an average of 84 (Table 19) The expenses are high on the farms with a small acreage In some cases low expenses for labor might be offset by high power and equipment costs The farmer is interested in operating at the lowest cost for power machinelj and labor combined
Your farm
mos profitable
farms 1106 $408 306
Table 1 Power and Machine 9 least
profitable Items farms Orop acres per farm Tractor and horse exp per crop acre Crop amp gen mach expo per crop acre
The feed cost for horses is a part of the cost of pover on those farms mainshytaining horses Theannual feed co stper horse is shown in Table 20 Fifty farmers did not maintain horses
- 18shy
Table 20 Feed Costs for Horses 1951 Average
Your of 45 Items farm farms Feed per horse lbsz
Grain 129 Hay 3010 Fodder and stover 207
Feed co st per ho rsel Grain $ 329 Boughage 1544 Pasture 679
Total feed cost 2552
Number of work horses 20 Number of colts 8
AKOUln OF LIVESTOCK
Nearly all the farmers maintained some dairy cattle The average number of dairy COWs per farm was approXimately nine head (Table 21) Sity-three per cent of the farmers kept some hogs and forty-five percent kept a few hens
Table 21 Amount of Livestoc
Your Average of 95
19 most profitable
19 least profi table
farm farms farms farms Number of milk cows 87 102 85 Number of other dairy cattle 95 12middot3 92 Number of beef cattle Number of sheep llumber of hens
10 21 66
middot3 middot3 82
2middot3 31
Number of litters of pigs raised Pounds of hogs produced
41 3567
52 5886
22 1493
Number of horses 10 12 12
Two lambs under six months of age considered as one head
TOTAL FEED COSTS AND BmURNS FBOM YOUR LIVESTOCK ENTERPBISlilS
The total return over feed costs for each class of livestock is shown in Table 22 This differs from the return over feed shown in the enterprise statement in that it is the total for each class of livestock instead of a reshyturn per head IIper uni til or per 100 pounds These data indicate the relashytive importance of different classes of livestock as a source of income and as a market for feed The total return is the same as the returns and net inshycreases shown on page 5 The value of milk consumed by calves is included in the total returns from dairy or dual purpose COlfS and in the total feed cost for other dairy or dual purpose cattle The value of milk consumed by calves is not included in either the total returns or the feed cost of alJ dairy or all dual purpose cattle The return over feed is not a net return
- 19 shy
but rather the amount available from the gross income after pqing the feed bill to cover the outl~ for hired labor power equipment taxes insurance interest and veterinary bills and to provide a return fo r the use of family labo r and capital
Table 22 Total Feed Costs and Returns From Your Livestock lBnterprises 1951 Beef
Da1a gr ilual Rul0le cattle breeding Feeder Oows Other ul herd cattle
Total returns
Total feed cost
Total return over feed
Farm flock Hogs of sheep TurkeyS Chickens
Total returns
Total feed costs
Total return over feed
Feed is the largest single item of cost for all classes of livestock However the proportion of the total cost represented by feed varies considershyably between classes of livestock Feed makes up approximately 45 per cent of the total costs of maintaining dairy cattle and poultry 50 per cent in the case of a farm flock of sheep and 75 to 90 per cent for hogs feeder cattle and feeder lambs Consequently it is necessary to secure a relatively higher return over feed from dairy cattle and poultry than from the other livestock enterprises in order to be able to cover all the costs other than feed
DAIRY AND DUampL PURPOSE CAfTLm
The quantity of feed consumed value of feeds and returns from dairy cattle are presented in Tables 2324 and 25 Eighty-nine herds were classified as dairy cattle and 3 herds were classified as dual purpose cattle The return over feed cost per cow varied from $-1537 to $2923~ among the 92 herds covered by this stud7 Some of thf important facto~s that affected the return over feed were
1 Rate of production (pounds butterfat per cow) 2 Price received for butterfat 3 Feeding efficiency (pounds TDN fed per pound butterfat ~roduced)4 Qpa1ity of ration (percentage of protein in TDN) 5 Economy of ration (feed cot per pound Qutterfat)
The herds which ranked Inw in these factors had low returns over feed As indicated in Figure 3 the 12 herds which ranked below the average of the whole group in all of tlse factors showed a return over feed of $81 per cow On the other hand the 7 herds which ranked above the average of the whole group in five factors had a return over feed per cow of $225
- 20shy
Table 23 Factors of Cost and Returns from Dair and Dual Purpose Cows 1951 18 farms 18 farms
Average highest in lowest in Your of 92 butterfat butterfat
Items farm herds per cow per cow
Pounds of butterfat per cow Per cent of butterfat in milk Price rec per lb ]F sOld(cents)
As cream (cents) Other (cents)
Feed per cow lb Corn Small grain Commercial feeds
Legume hB1 Other hB1 Fodder and stover
Total concentrates Total hay and fodder Silage
Total digestible nutrients TDN per lb ]FTDN that is protein
Feed cost per cow Concentrates Roughages Pasture
TOTAL FEED COSTS
Value of produce per COWl Dairy product sales Dairy produce used in home Milk to livestock Net increase in value of cows
TOTAL VALUE PRODUCED
RETlJWS ABOVE FEED COST PER COW
RETURNS FOR $100 or FEED
Feed cost per lb ]F (cents)
Numb ar 0 f cows
252 3middot8
851 780 955
276 605 497
3778 2108 565
1378 6451 3991
4891 194 13middot9
$3856 5172
661 9689
$ $19504 1298 2216 ~]~I
$--$~
$ $13746
$ $ 257
384
9middot0
333 176 3middot8 40
891 806 78~ 776 96 952
336 42 896 242 674 337
4629 2970 1661 2909
625 1246
1906 621 6915 7125 4275 1740
5540 4282 166 243 146 12middot5
$ 5427 $ 1842 59~5 48middot33 6 1 ki12003 73middot
$26803 $12amiddot 69 1078 1 62 2634 1841 13 o cent4
$1 321
$19846 $ 8975
$ 276 $ 252
$318 bull 9 ~
360 417
8middot9 8middot3
Not including nutrients received from pasture All dairy cows which have at some time in the past freshened are included in
the dairy herd and affect the average number of cows used in computing t~is table There is some variatlon in the number of months of dry period per cow however this variation is small for the majority of farms
- 21 shy
Table 24 Feed Costs and Returns from Other Dairy and DIla1 Purpose Cattle 1951 18 herds 17 herds
Average highest in lowest in Your of 91 butterfaT butterfat
Items farm herds per cow per cow Feeds per head 1bs
Concentrates Hay and fo dder Silage Skim milk Whole milk
Feed cost per head Concentrates Roughages Milk Pasture
TOTAL FEED COS TS PER HEAD
Net inc in val ueof other dairy cattle
RETURNS ABOVE FEED COST PER HEAD
RETURNS FOR $100 OF FEED
Number of head of other dairy cattle
221 2048 1093 1089
324
$____ $ 698 1566 1544 283
$__ $ 4091
___ $10297
__ $ 6206
__ $ 284
9middot9
312 2142 1088
994 543
187 2515
498 1110
320
$ 896 1668 2072
268
$ 5middot57 1646 15middot53
292
$ 4904 $ 4048
$10761 $ 9687
$ 5887 $ 56 39
$ 264 $ 270
9middot3 91
-One record which included only a small number of veal calves was omitted from the averages
Table 25 Feed Costs and Returns from All Dairy and Dual pugpose Cattle 19~1 1 herds IS erds
Average highest in lowest in
Items leeds per animal unit 1bs1
Concentrates Hay and fo dder Silage
Feed cost per animal unit Concentrates Roughages Pasture
TOTAL FDD COST
Value of produce per animal unit Dairy products
Your of 92 farm herds
1045 5523 3301
__ $ 2984 __ 4387
~ $__ $ 79=96
$___ $14043 Net increase in val of dairy cattle 6920
TOTAL VALUE $ $20963
RErURliS ABOVE FEED PER ANIMAL UNIT $ $12967
BmURNS PER $100 OF FEED $__ $ 276
Animal units of dairy cattle 141
butterfat per cow
butterfat per cow
1458 5895 3500
539 6~3 1 5
$ 4158 4965
600 $ 9723
$ 1605 4245 614~
$ 6492
$18662 ~819
$2 481
$ 9167 6326 $16093
$16758 $ 9601
$ 282 $ 275
13middot7 128
- 22 shy
No of factors
in which farmers
o
1
2
3
4
5
12
11
7
$100 $150 $200
Average Return Over Feed Per Cow No of
$ 81
100
120
152
177
225
lig 3 Average Return over FeedOost per Dairy Oow Grouped According to Number of Selected Factors in which Farmers Excelled
------ shy Table 26 Feed OostQ and Returnsect trom Ch~Cker ~951 1 farms 14 farms
Average highest in lowest in Your of 43 returns returns
Items farm farme above feed above feed Feed per hen 1bs
Grain Commercial fee~s
Total concentrates Skim milk and buttermilk
TOTAL FEED OOST PlilRHEN
Value of produce per hen Eggs sold and used in house $_~_ Net increase in value of chickens __
TOTAL VALUE PBODUCED $___
RETUBNS ABOVE FEED OOST PER RJilN $___
RETURNS FOR $10001 FEED $----shyPrice rec d per doz eggs sold (cents)--___ Eggs laid per hen
Ave no of hens on fam durin~ the ye~_ of hens that are pulletsof death loss of hens
Numbers of chicks started Straight run
Pullets Cockerels
Pounds of poultry produced
75 7-6 85 ~ --21131 129 ~
117 9
$44 $402 $457
$585 $6 7~ $486
~~$6ja $7 7 $531
$2~10 365 $ 74
$159 $204 $120
426 441 410 165 187 143
l 4 143 137 ~g 66 64 14 13 16
24 50 113 137 105 17 g
1+13 544 2~5
-23 -
Table 27 7eed Costa and Returns from Hogs 1951
Items Your farm
Average of 60
farms
15 farms highest in returns above foed
15 farms lowest in returns
above feed
Feed per cwt hogs produced 1bs Corn 208 111 281 Small grain 248 210 291 Commercial feeds ~ 81 -1Z Total concentratea 514 402 609 Skim milk and buttermilk 333 202 499
Feed cost per cwt hogs producedt Concentrates $1251 $1068 $1479shySkim milk and buttermilk 155 76 245 Pasture bull IS 1J 11Q
TOTAL FEED COSTS $ 1421 1157 1740
Bet increase in val per cwt hogs prod $ $2087 $2535 $1836
RETUlUiS AB0Vll FEED COST PD CW HOGS PROD $ 666 $1378 $ 96
RETURIS FOR $100 or FEED $ $ 157 $ 232 $ 107
Ave weight per hog sold 1ba $ 148 $ 87 182Price received per cwt hogs sold $ $2325 $2687 2177
Bo of spring litters raised 42 54 39 Bo of fall litters raised ~2 21JJ1 Total no of litt~rs raised 64 89 60
Bo of pigs born per litter 86 91 81 No of pigs weaned per litter 71 77 62
Pounds of hogs produced 5459 4521 6176
- 24shy
Table 28
Items
Feed Costs and Returns from a Farm Flock of Sheep 1951 Your Average of farm 7 farms
Feeds per head lbs Concentrates Legllllle haY Other hay FoddEr and stOVer Silage
leed cost per head Concentrates Roughages Pasture
TOTAL nED COSfS
Value of produce per head Wool Net increase in value of sheep
TOfAL VALUE PRODUCED
REromTS ABOVE FIlED COS PER BEAD RETURNS FOR $100 or FlED Price per cwt of lambs sold Price per lb wool sold (cts) Pounds of wool per sheep sheared
Number of ewes kept for lambing lamb crop death loss Pounds of sheep produced
No of head of sheep
61 551 157
137
$ 154 5)7 Lll
$ $ 808
$ $ 507 1843
$ 2350
$ 1542 $ $ 333 $
$3101 1025middot
68
18 123 52
1999 276
Two lambs under six months of age considered as one head Lambs which die during month of birth are not included
Table 29 Summary of Farm Inventories bZ Years
Number of farms 124Z
141 L~
204 12i2
188 1252
111 125L
95
Dairy and dual purpose cows Other dairy amp dual purpose cattle ]eef cattle (inc feeders) Hogs Sheep Pou1try Productive livestock (total)
$1078 451
57 181 17 96
1880
$1101 511
30 199 58 87
1986
$1176 540
72 185
36 76
2085
$1256 583
87 174
24 100
2224
$1513 716 106 232 38 76
2681
Horses 82 77 67 59 46 Orop seed amp feed Power mach (farm share) Orop ampgeneral mach (farm share) Livestock equipment amp supplies Mach amp equipment (total) Miscellaneous Buildings fences etc Land
fotal farm capital
977 917 673 219
1806 2
3638 lsectQ2
12194
1045 1022 741 193
1956 1
3332 riM
11783
1054 1253
821 212
2286 1
3208 l12i
12265
831 1209
811 203
2223
3452 2960
11749
957 1470 1026
226 2722
2 3854 ~
13988
- 25 shy
Table 30
Dairy and dual-purpose cows Dairy produch Other dairy amp dual-purpose cattle Beef cattle
$282 1546
260 45
$335 1798
357 33
$263 1471
316 55
$328 1439
427 83
$352 1745 394
56 Hogs She ep and wool PoultrY
428 19 71
436 60 97
500 39 43
515 27
109
647 37
125 Jlggs Horses
388 14
328 15
267 12
324 8
343 12
Small grain Other crops Machinery amp equip sold Agrieu1tural adjustment payments Income from work off the farm
501 221 119
26 78
326 218 174 33 65
270 248 211
29 108
138 131 183
21 77
252 263 167
29 159
Miscellaneous 14 12 40 22 14 (l) Total farm sales 4012 (2) Increase in farm capital 1067 (3) Jamily living from the farm 42J (4) Total farm receipts (1) (2) (3) 5532
JABM EXPENSES
4290 936 441
5667
3872 781 41Z
5070
3832 831 421
5114
4595 1343
468 6406
Dai ry and dual purpose cows bought $175 $205 $166 $165 $242 Other dairY and dual pur cattle bot 57 100 79 91 98 Beef cattle bought Hogs bought
8 60
10 49
24 51
28 39
22 52
Sheep bought 14 6 11 11 3 Poultry bought 50 43 37 44 41 Horses bought Misc livestock expense
16 41
21 43
7 41
5 44
8 47
Misco crop expenses Jeed bought
195 549
206 533
187 385
155 604
219 678
Custom work hired 164 191 205 170 236 Mech power mach (farm share) (new) 507 477 568 536 535 Mech power mach (farm share) (upkp) 151 152 111 106 107 Mech power (f share) (gas oil etc )31 56 376 350 390 Crop and general mach (new) 269 333 360 330 447 Crop and gene ral mach (upkeep) 71 75 63 56 65 Livestock eqUipment (new) LivestoCk eqUipment (upkeep) J3ui1dings and fencing (new) Buildings and fencing (upkeep)
73 13
221 94
66 14
243 93
76 15
256 81
83 13
325 61
77 17
221 66
Hired labor 102 100 81 84 53 Taxes 121 134 159 163 176 General farm and insurance (5) ota1 farm purchases
iQ 3304
4~ 3493
J2 3378
4Z 3510
48 3848
(6) Decrease in farm capital (7) Interest on farm capital 610 589 613 587 699 (8) Unpaid family labor I 381 360 329 221 351 (9) Board furnished hired labor 22 JJ 24 28 12
(10) (11)
Total farm expo (sum of 5 to 9) Oper labor earnings (4) - (10)
4324 1208
4475 1192
4344 726
4346 76C
4910 1496
- 26shy
Table Jl Summa~ of Acres and Orge Y1elds Per larm bl Years 1947 1948 1949 1950 191
ACRES PER ABM lax Barley
42 30
35 16
50 14
8 17
24 27
Oats 183 206 192 197 220 Wheat 37 24 28 23 20 Other emall grains 1middot9 11 22 1middot9 21
Total emall grains 311 292 306 264 312
Corn 154 164 164 138 161 Other cultivated crope
Total cultivated crops 6
160 4
168 12
171 I~
14 4
165
Alfalfa for haT or seed 59 66 104 105 135 Olover for hay or seed 22 26 31 32 58 Other hay and seederops
Total tillable land in hay 1212 258
12 251
bullbullbull4 249
12l 260
8middot5 278
Total tillable land in pasture Tillable land not cropped
33 1J
33 20
39 22
84 lmiddotJ
4
otal tillable land 775 764 87 766 85f
Wild hay (non-tillable) Non-tillable pasture
80 468
90 497
8 3 51
91 549
90 455
Timber roads waste and farmstead Jl2 289 ~ ~ ~ ~ Total land in farm 1635 1640 1860 1863 178
CROP YIELDS PER ACU lax bu 85 110 78 5 89 Barley bu 211 263 265 19 180 Oats bu 315 329 315 230 388 Wheat bu 147 156 113 126 139
Potatoes bu 873 948 755 775 647 Oorn for grain bu Corn for silage tone Corn fodder tois
281 50 21
429 fJ7 27
421 72 26
181 40 20
358 54 27
Alfalfa hay tons Red or alsike clover hay tonI Brome or timotb7 hay tons Wild hay on non-tillable land tonI
18 15 16 11
19 15
12 10
18 12 11 13
1 12 9 9
18 12 10 10
- 27 shy
rab1e 32 Summary of Miscellaneous Items by Years 19~1 19~3 19~9 1950 1951
MEASURES OJ FABM OBGANIZArION AND MANAGlIKEIT EFFICIENCYhigh return crops 27middot3 270 327 309 363 AU livestock per 100 Abullbull 13-3 131 136 131 152 No of work units 233 234 293 242 253 Work units per worker 201 136 21521~ 22~Expenses per work uni $ 439 $ 45 $ 4middot3 $ 522 $ 542
AMOtJlr OJ LIVESrOOlt No of milk cows 90 3middot3 36 373~No of other dairy cattle 37 37 9middot3 9 95 No head 0 f sheep 17 45 25 19 21 No of hens 35 72 60 32 66 Lbs hogs produced 2093 2343 3132 2651 3567 No litters of hogs raised 15 17 26 30 41 No of horses 17 15 1middot3 1middot3 10
PBODUCrION PER UNIr OF LIVlSrOClt Lbs BF per dairy cow 213 236 253 256 252 Pigs weaned per litter 67 74 7middot3 67 71 No eggs laid per hen 133 133 142 152 165 Lbs wool per sheep sheared 69 67 65 7middot1 63 f lamb crop 93 109 104 37 123
PRI CE RECEIVED PER Lb BF sold (cts) 371 976 734 73middot7 351 Cwt hogs sold $ 2550 $ 25middota5 $ 2071 $ 2115 $ 2325 Cwt lambs sold 2050 22 1 2254 2606 31 bull01 Lb wool sold (cts) 484 432 59middot3 1025~4Doz eggs Bold (ctB~) 9 415 399 31bull0 426
lll1rumf ABOVE FEED COSr PER Dairy cow $10235 $14161 $10031 $ 9456 $13746 Cwt hogs produced 337 774 644 363 666 Head 0 f sheep 335 7middot85 767 603 1542 Hen 76 140 131 63 210
FEED COSr PER Dairy cow $ 9439 $10313 $ 93~5 $11233 $ 9639 Cwt hogs produced 1677 1513 10 6 12middot33 1421 Head of sheep ~10 555 572 329 303 Hen 40 3middot35 ~43 344 424 Horse 3550 33bull03 3 05 4112 25middot52
bull rhe animal unit equivalents were changed in 1951
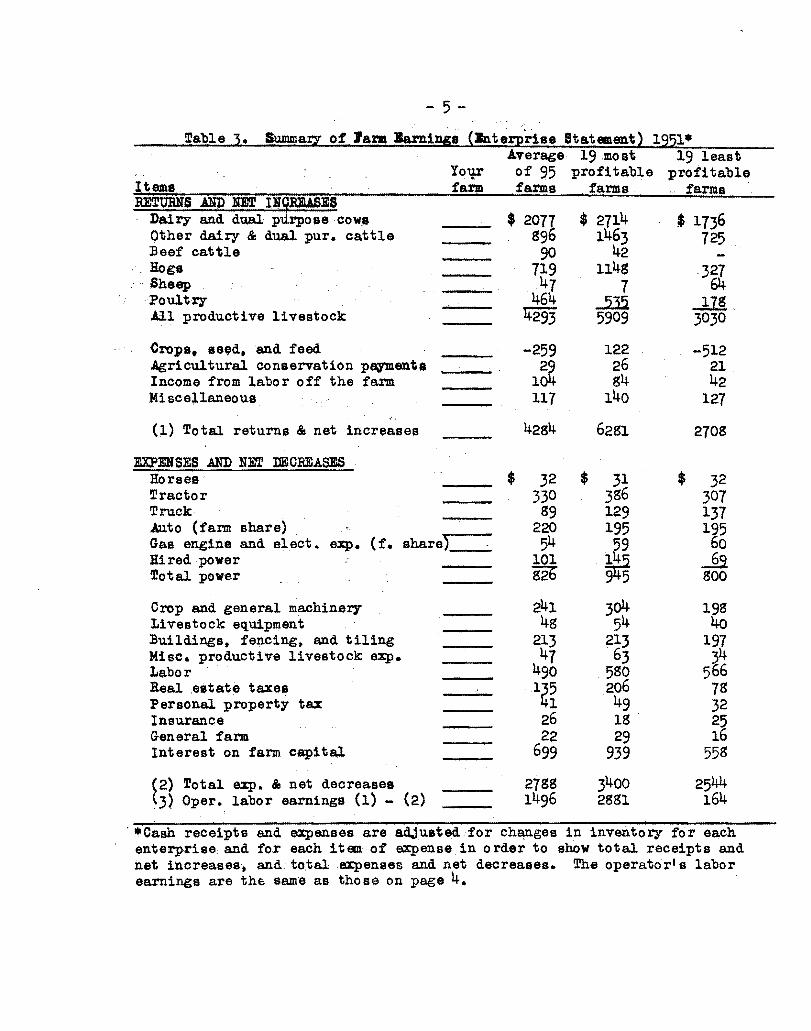
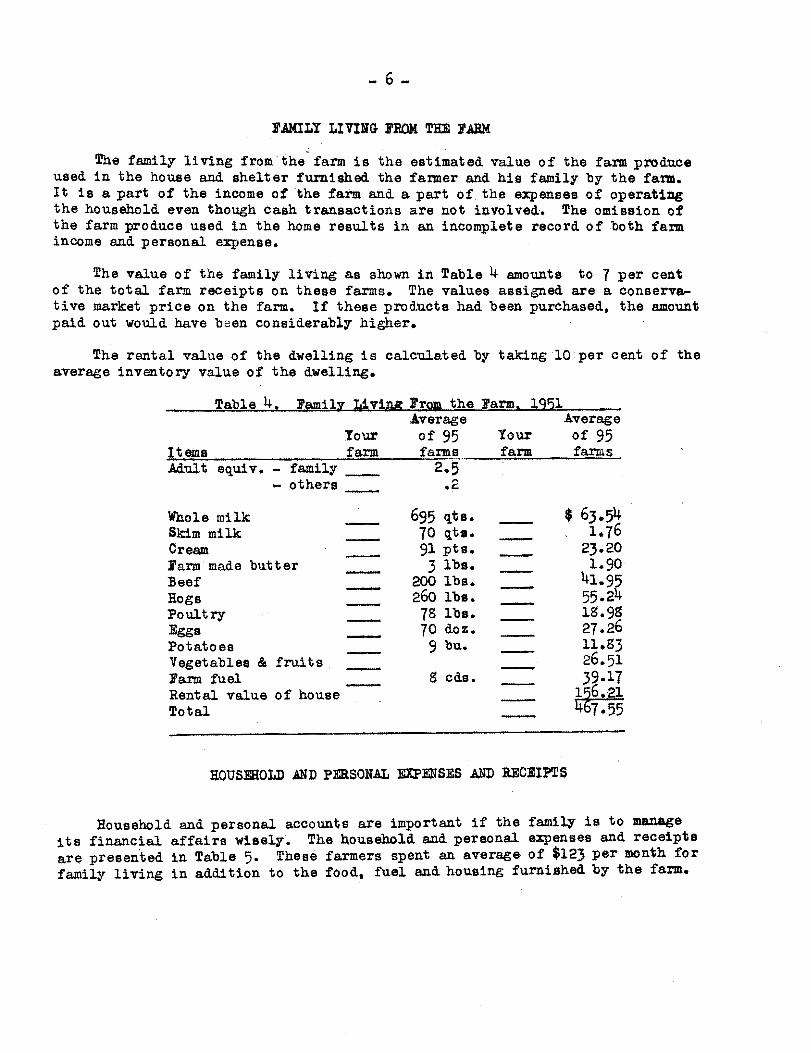
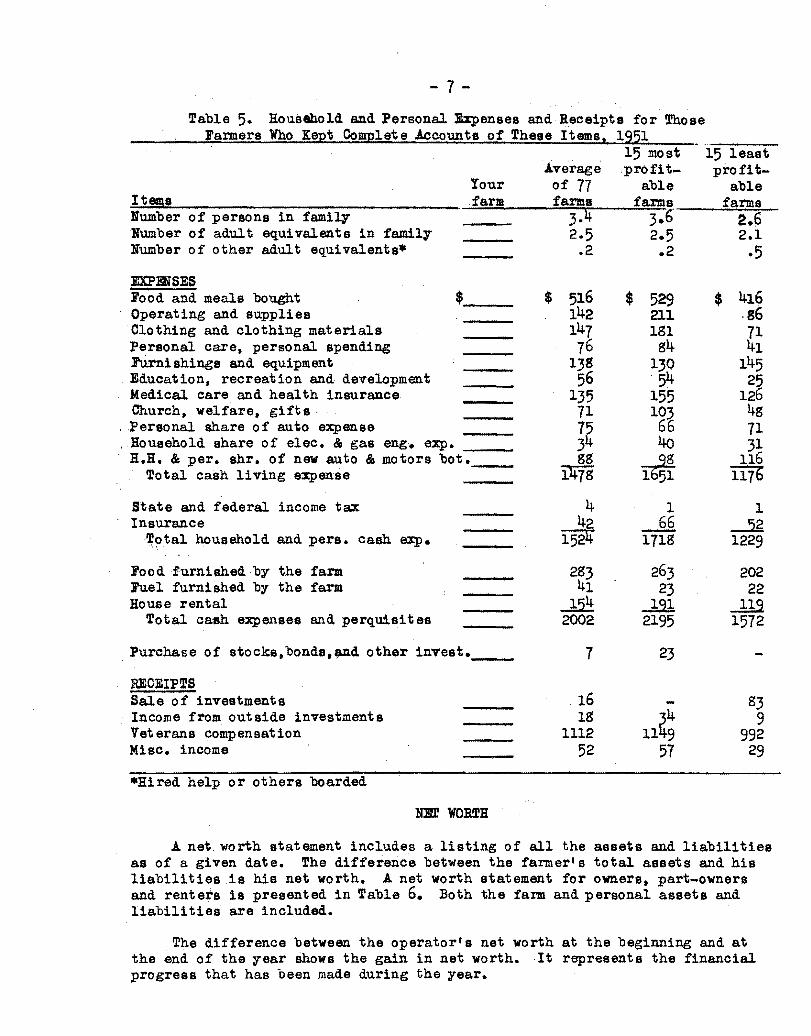
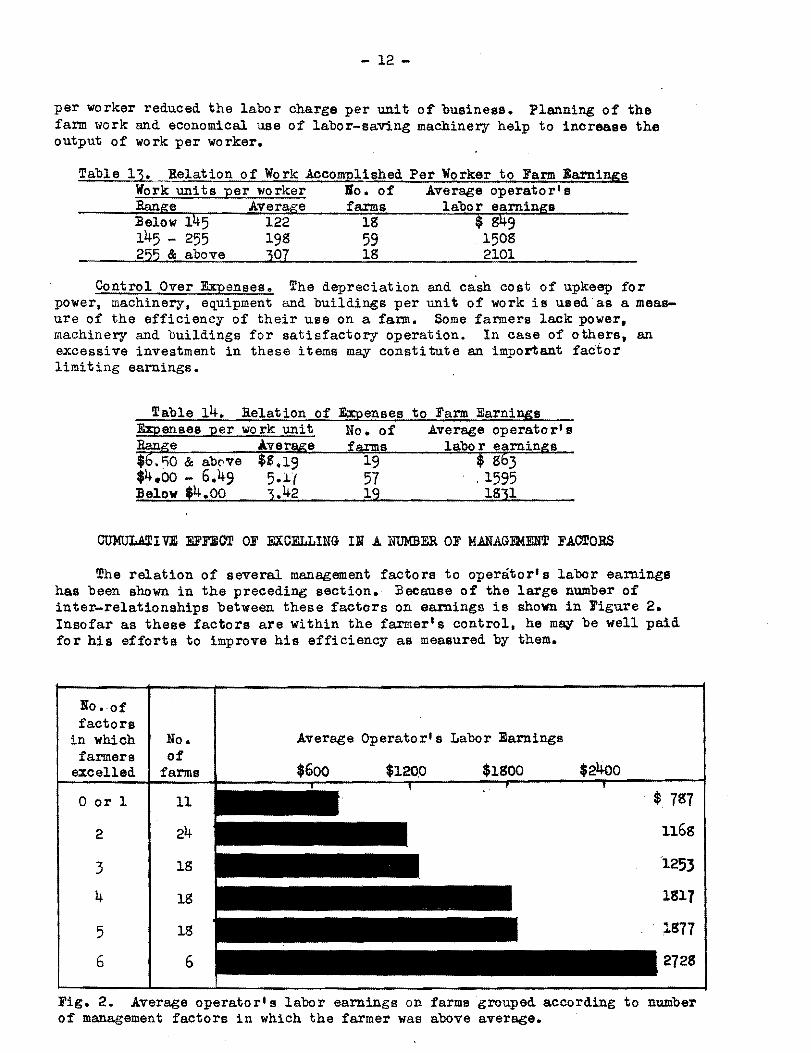
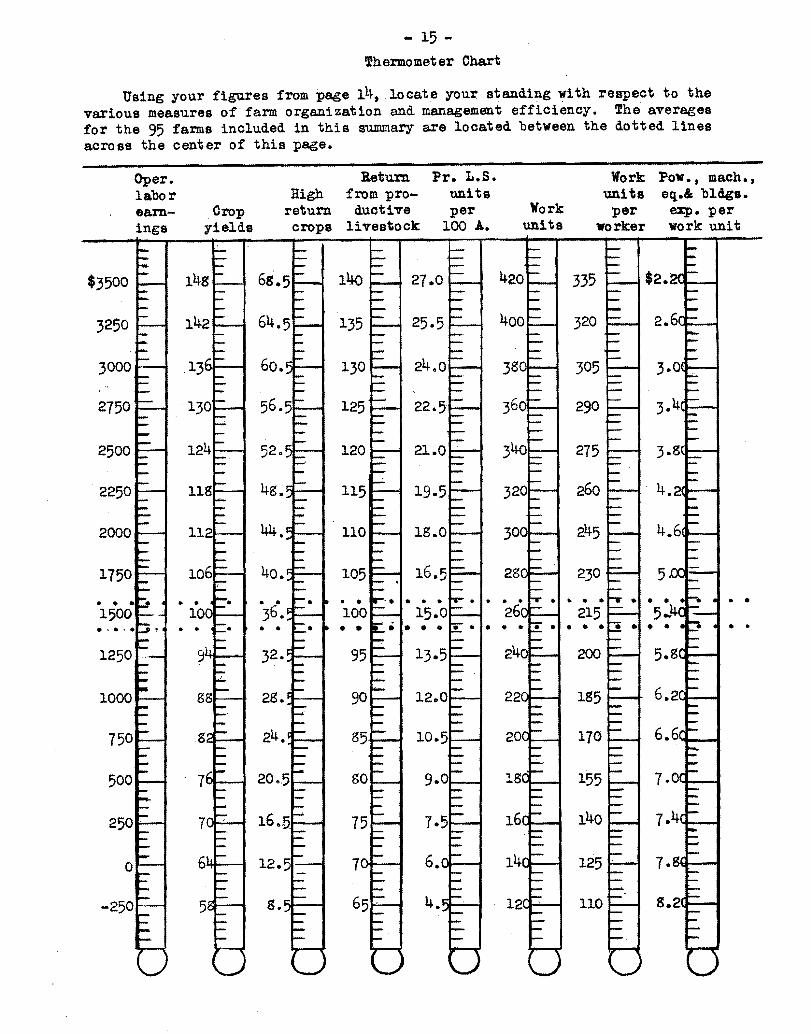
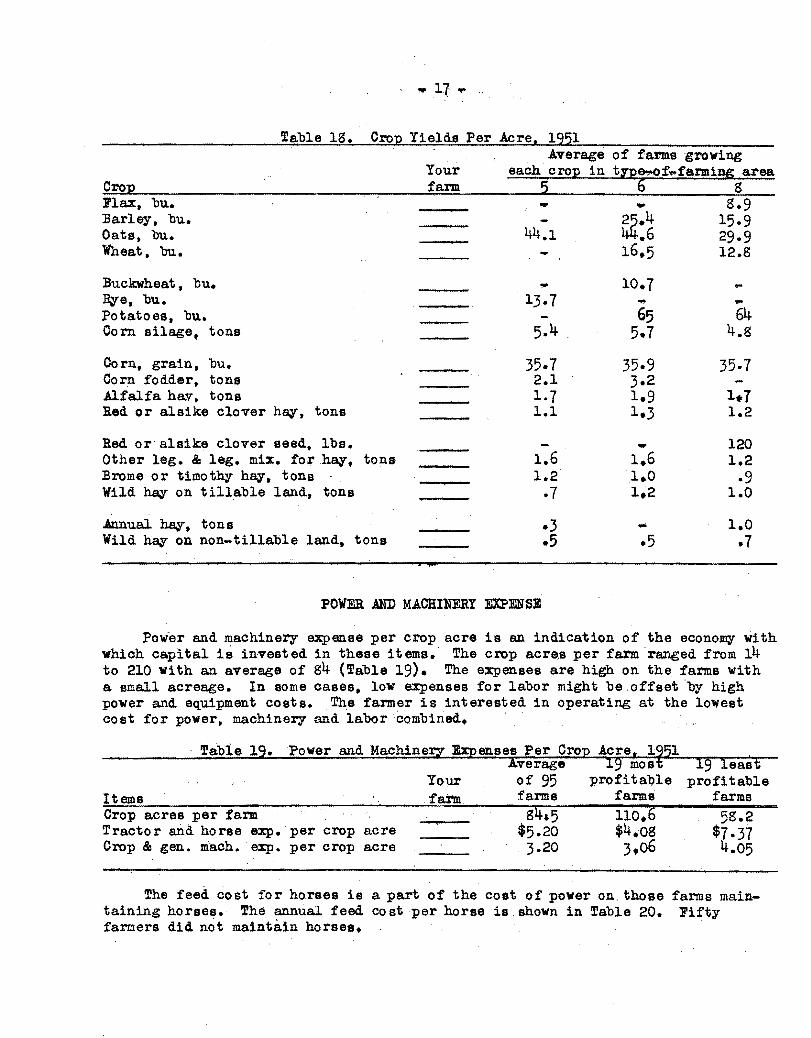
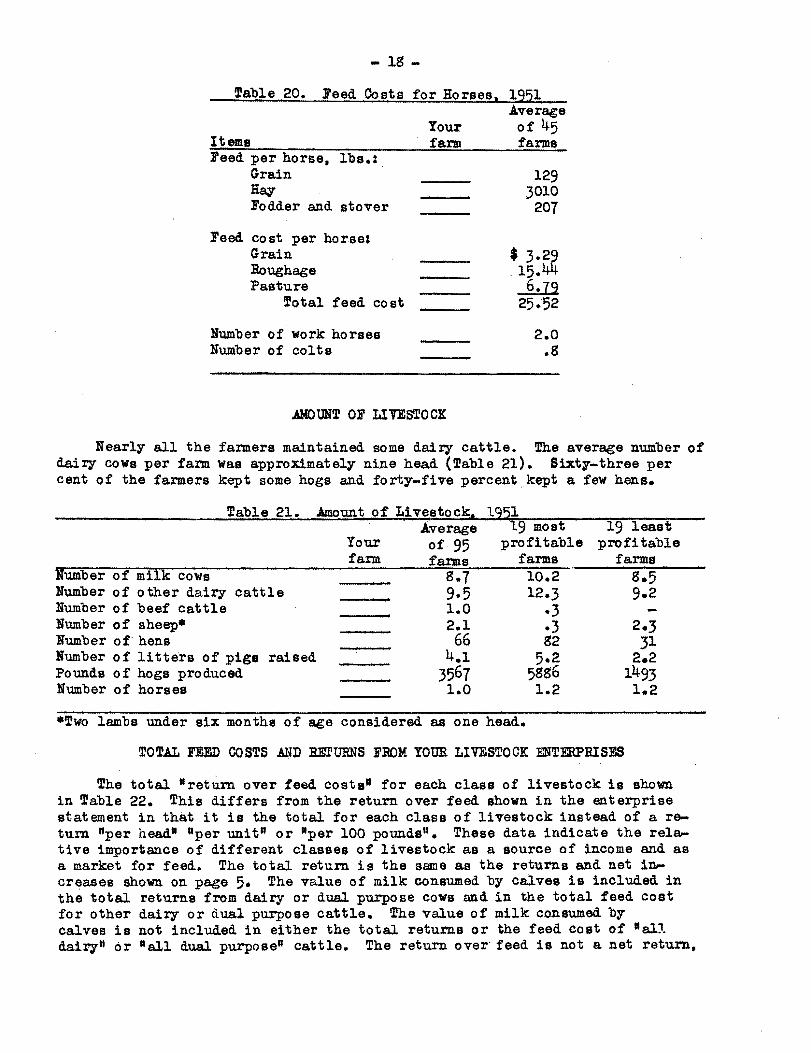
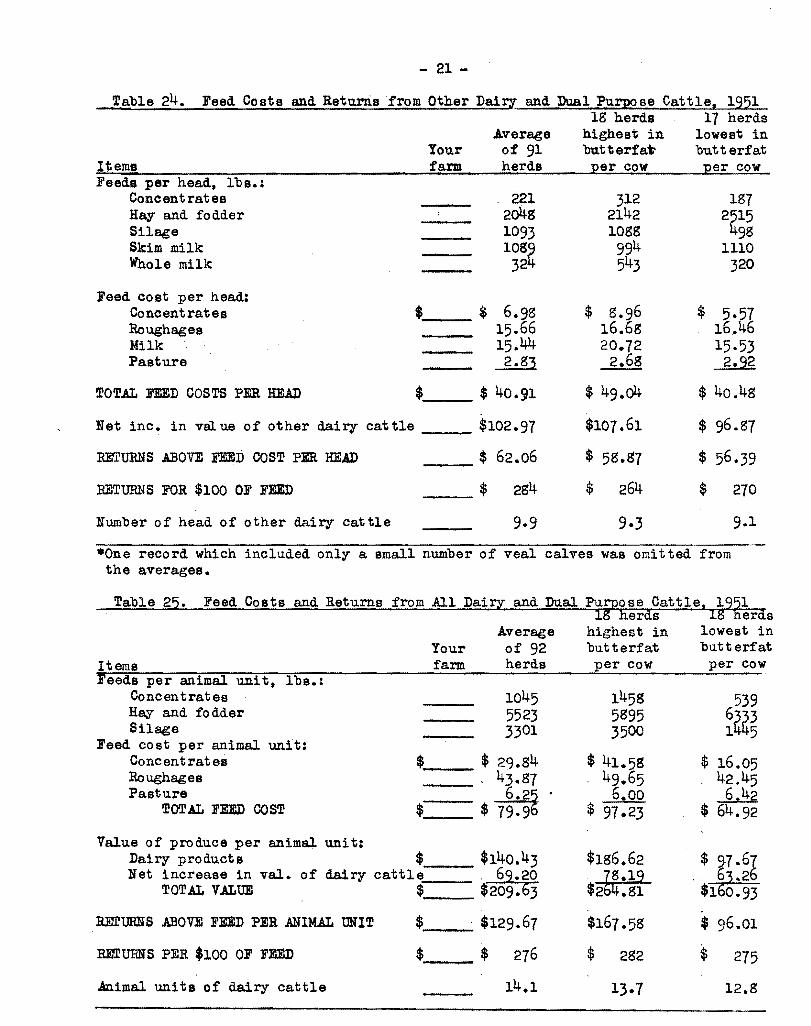
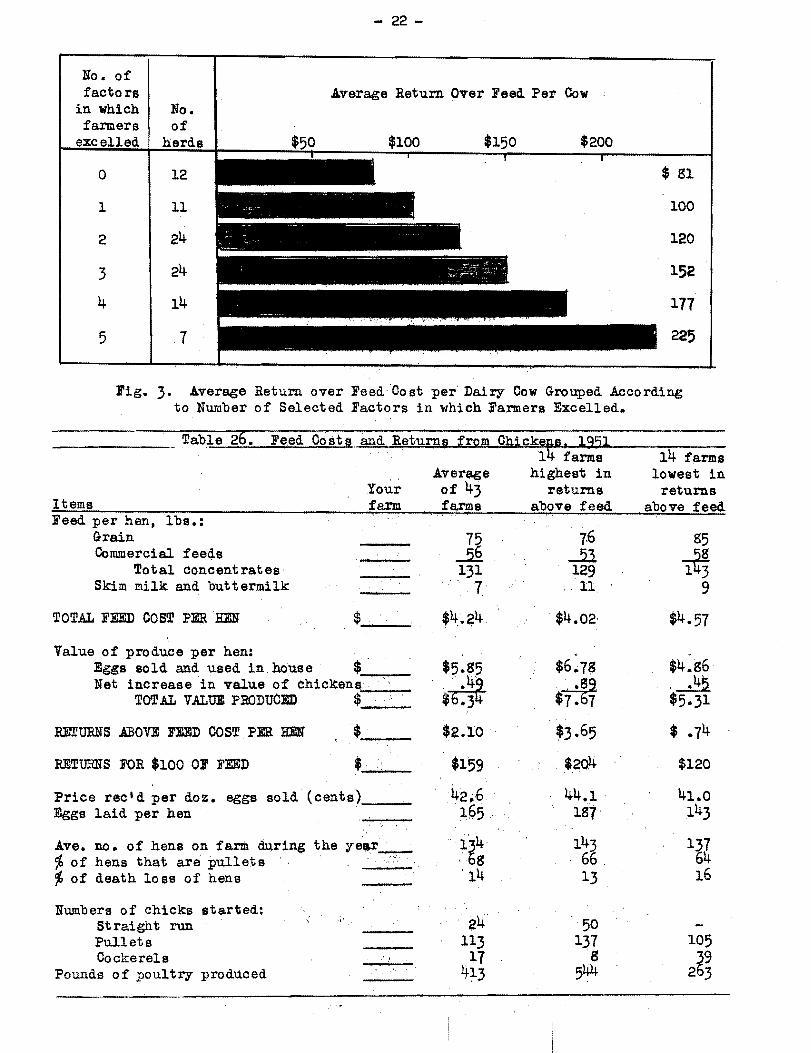
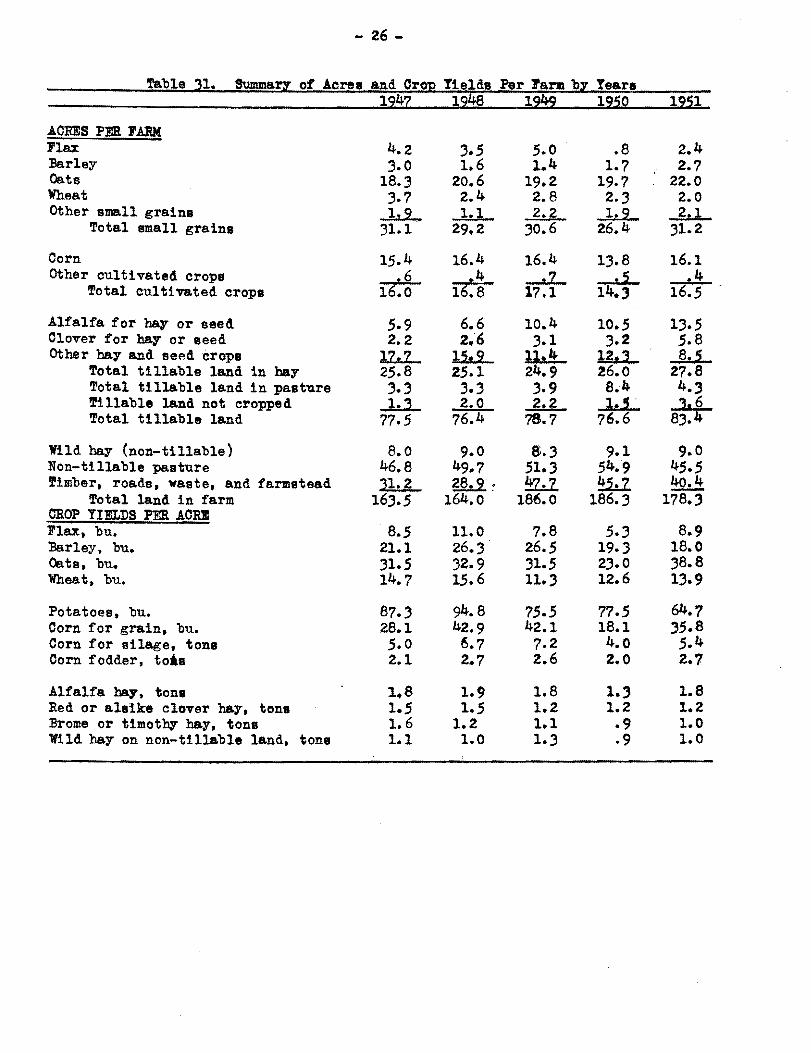